


Abstract
This study aimed to develop and validate a reliable instrument for assessing middle school students’ water literacy and to evaluate their water literacy levels across Türkiye. Given the increasing pressure on global and national freshwater resources, understanding middle school students’ water literacy is essential for developing evidence-based educational policies that promote sustainable water use. This study employed an Exploratory Sequential Mixed Methods design. First, a Water Literacy Scale was developed and validated following established instrument-development procedures. The validated scale was subsequently administered to 4252 middle school students from seven regions of Türkiye. Findings revealed that female students scored significantly higher than males in Water Awareness, Behavior Toward Water Issues, and Attitude Toward Water. Grade-level analyses indicated that younger students demonstrated stronger behavioral engagement, whereas older students showed higher cognitive understanding, revealing a gap between knowledge and action. Significant regional differences were observed across all dimensions of water literacy. Overall, the findings suggest that gender, grade level, and regional context influence water literacy and highlight the importance of context-sensitive and sustainability-oriented educational interventions.
1. Introduction
Water is a fundamental element for sustaining life and a vital component of natural systems that supports ecological balance, industrial development, and human well-being. Although water covers nearly 71% of the Earth’s surface, only about 0.5% of global water reserves are accessible as fresh water, while the remaining 99% exists in oceans, glaciers, soil moisture, or atmospheric vapor [1]. Fresh water is unevenly distributed across the world due to variations in geography, climate, and hydrological processes. According to recent global estimates [2], Asia has 36% of the world’s freshwater supply followed by South America (25%), North America (15%), Africa (11%), Europe (8%), and Australia and Oceania (5%). Although Asia has the largest number of global freshwater resources, it is still considered highly water-stressed due to the its large population and rapid population growth. Globally, freshwater consumption has increased by approximately 1% per year in recent decades because of population growth, economic development, and shifting consumption patterns. Moreover, climate change will account for about 20% of the increase in global water scarcity [2]. United Nations Educational, Scientific, and Cultural Organization [3] reported that nearly half of the global population experiences severe water shortages for at least part of the year and predicts that global water demand will rise by 20–30% by 2050. Recent national data indicate that Türkiye has an annual usable water potential of 112 billion m3, of which 61.70 billion m3 is currently used across different sectors. Agriculture remains the largest water-consuming sector, accounting for approximately 79% of total water withdrawals, while domestic and industrial uses together represent about 21% [4]. These figures indicate that increasing population growth, urbanization, and industrial development continue to intensify pressure on Türkiye’s limited water resources, highlighting the strategic importance of improving water literacy among young learners and promoting sustainable water use among future generations. However, despite this distribution, regions with the largest freshwater reserves increasingly face water shortages due to rapid population growth, industrialization, and urban expansion.
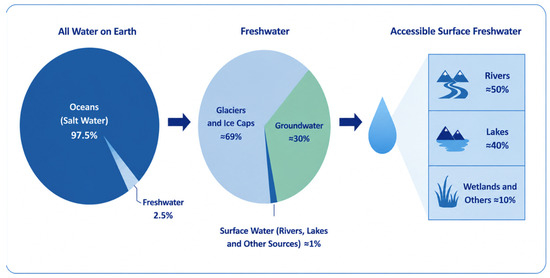
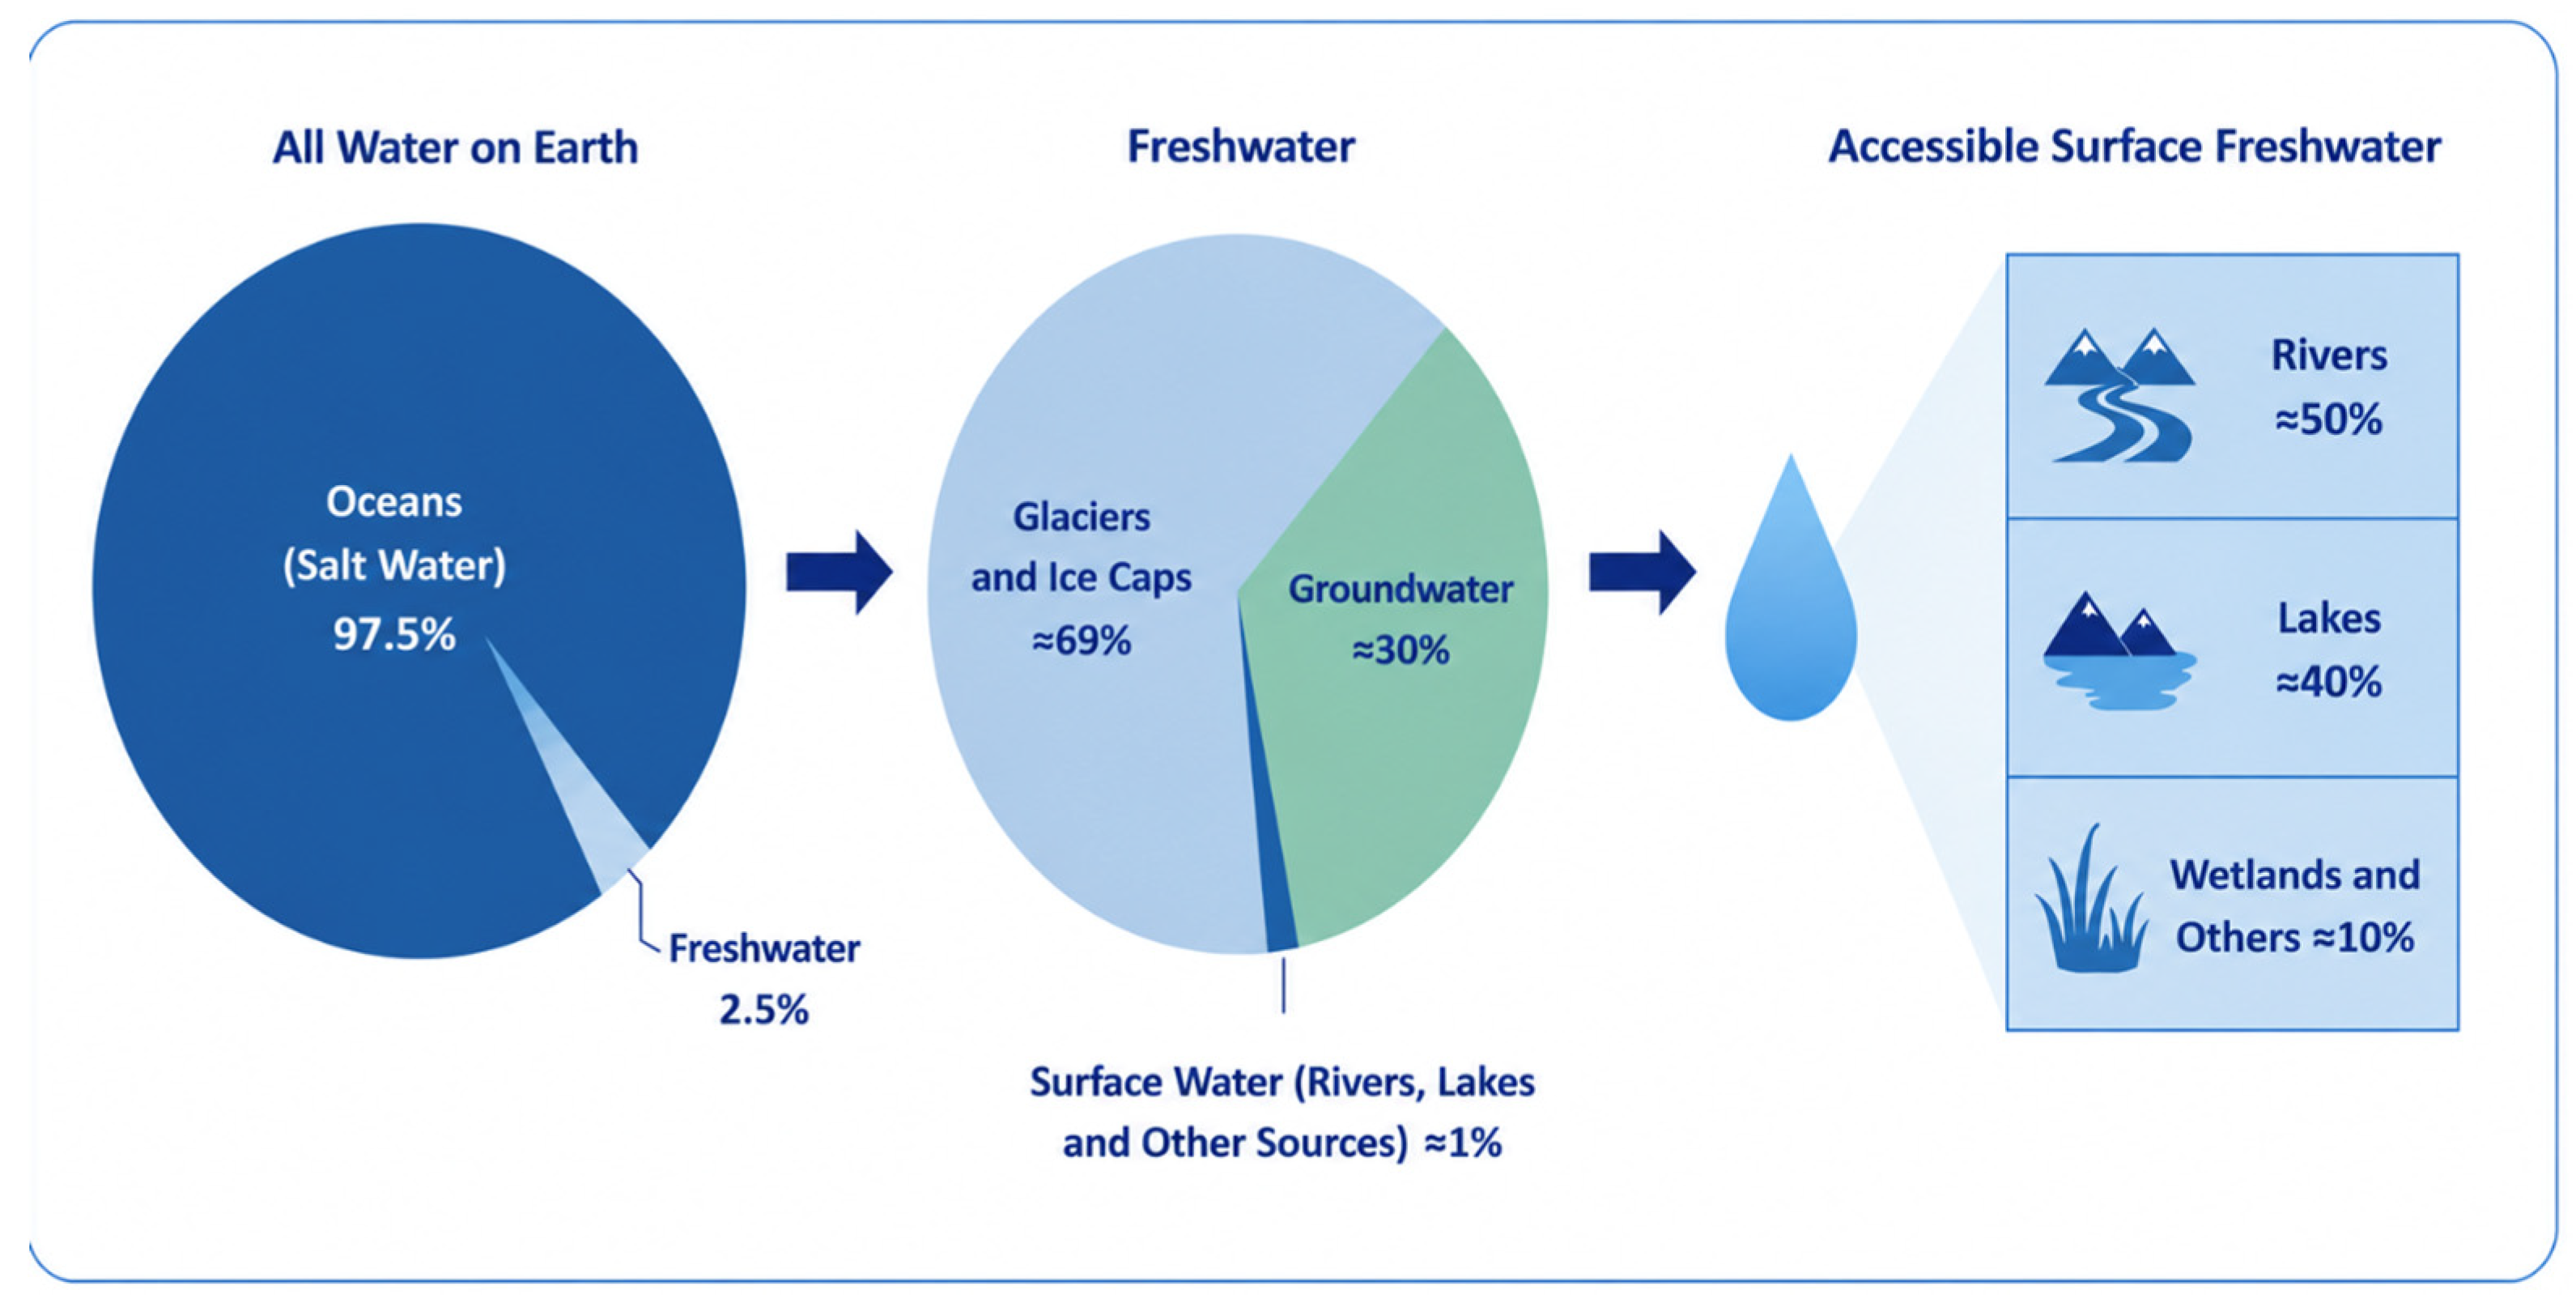
As illustrated in Figure 1, only a very small proportion of Earth’s water is readily available as accessible fresh water for human use. Most fresh water is stored in glaciers, ice caps, and groundwater, while only about 1% exists as surface fresh water in rivers, lakes, and other surface water bodies. This limited availability of accessible freshwater highlights why sustainable water management and water literacy have become global priorities despite the apparent abundance of water on Earth.
Figure 1.
Global distribution of Earth’s water resources. Original illustration generated using an AI-assisted visualization tool based on the numerical information synthesized from References [1,2,3] and presented in the Introduction section of this manuscript.
In the past, individuals had a closer understanding of the processes water underwent before reaching their homes. However, with technological advancements and the increasing automation of water systems, this awareness has diminished significantly, and people have become less mindful of their water consumption [5]. As [6] stresses, increasing public awareness is crucial for ensuring the effective management and sustainability of global water resources. This situation brings a new concept called water literacy. Water literacy can be defined with respect to the principles of sustainable development, and it encompasses the knowledge, attitudes, and behaviors required for the responsible use and conservation of water resources [7]. Water literacy also can be considered an essential tool for managing and sustaining water resources, underscoring the role of individual awareness of water use, quality, and safety [6].
Türkiye, although surrounded by seas on three sides, is also categorized as a water-stressed country due to its semi-arid climatic conditions and limited freshwater resources. According to the Republic of Türkiye Ministry of Agriculture and Forestry [MoAF] [8], the nation’s annual per capita renewable water availability was approximately 1313 m3 in 2022. Projections indicate that as Türkiye’s population approaches 100 million, this figure may fall to around 1000 m3, placing the country on the threshold of chronic water scarcity [9,10].
This situation highlights the urgent need to enhance individuals’ Water Awareness as a foundation for ensuring water security for future generations in Türkiye. Since September 2024, the national curriculum has been revised and has undergone a major reform under the Century of Türkiye Educational Model, which emphasizes sustainability and water literacy within the framework of the United Nations Sustainable Development Goals. This reform aims to equip students with the knowledge, awareness, and values necessary for the conservation, management, and sustainable use of water resources [11]. In this context, promoting water literacy from an early age is essential for fostering informed, responsible, and environmentally conscious citizens.
International and national reports provide extensive statistical evidence on water scarcity, water consumption, and future water security [3,8]. These statistics also alert researchers and educators about how important it is to raise water-literate societies who value water resources [12]. How families and their children at home use and value water may indicate whether the society is water literate. Therefore, research focused on whether young people, especially at an earlier age of their lives, possess the knowledge, attitudes, and behaviors necessary for sustainable water use may provide a better view of families and the society in which they live. Existing studies conducted in Türkiye have generally focused on limited populations, specific dimensions of water literacy, or restricted geographical areas [13,14,15,16]. Consequently, there is still no nationally representative and multidimensional assessment of middle school students’ water literacy that simultaneously examines regional, gender, and grade-level differences. Water scarcity becomes an increasingly important environmental challenge in Türkiye. As a result, developing water literacy from an early age becomes more important and essential for fostering sustainable water-use behaviors and making a more water-literate society [6,8]. Middle school education represents a critical developmental period for learning environmental knowledge, attitudes, and responsible behaviors through science education [17]. Therefore, addressing this gap is essential for informing evidence-based policies and sustainable-oriented educational practices. Accordingly, the present study aimed to develop a valid and reliable Water Literacy Scale and use it to provide a nationwide assessment of middle school students’ water literacy across Türkiye.
1.1. Theoretical Background
1.1.1. Water Literacy in Science Education
Enhancing water literacy, particularly among middle school students, is therefore a critical step toward building long-term awareness and behavioral change regarding water use. Strengthening individuals’ understanding of water systems, consumption patterns, and their broader environmental implications is fundamental to achieving both national and global water security [18]. As highlighted by [6], raising public understanding of water systems is a prerequisite for effective water governance and sustainable management at all levels.
Water literacy is widely conceptualized as a multidimensional construct that integrates knowledge, attitudes, awareness, and behaviors necessary for the responsible and sustainable use of water resources (Figure 2) [5,12]. Rather than referring solely to factual knowledge, it encompasses individuals’ ability to understand water systems, evaluate water-related issues, make informed decisions, and engage in environmentally responsible behaviors [12,19]. Accordingly, the present study adopts this multidimensional perspective and defines water literacy as the integration of cognitive, affective, and behavioral competencies that support sustainable water use. This conceptualization guided both the development of the Water Literacy Scale and the interpretation of the study findings. Today, many individuals interact with water only at the point of use, without knowing where it comes from or how wastewater is managed, contributing to low levels of water literacy. Collectively, previous studies suggest that higher levels of environmental and water literacy are associated with more responsible environmental behaviors, greater engagement in sustainable practices, and more sustainable water-use behaviors [12,20].
Figure 2.
Components of water literacy [12].
In the context of global climate change, integrating water literacy into education systems has become essential [21]. The K–12 curriculum plays a vital role in fostering early awareness and scientific understanding of water systems [17]. However, teaching about water remains fragmented and discipline-specific, thus limiting students’ ability to perceive it as part of an interconnected system [22,23,24]. Research has shown that students often hold misconceptions about the water cycle, typically recognizing its atmospheric components but overlooking groundwater and subsurface dynamics [25].
These limitations indicate that students generally develop a fragmented and incomplete understanding of water systems; this can hinder their ability to translate their knowledge into responsible behaviors regarding water. This situation highlights the need for a more comprehensive and integrated approach to water literacy that goes beyond conceptual understanding to encompass emotional and behavioral dimensions as well.
1.1.2. Theory of Planned Behavior and Environmental Behavior
The Theory of Planned Behavior (TPB), proposed by [26], provides a useful complementary perspective for understanding water-related and environmentally responsible behaviors. According to TPB, attitudes toward a behavior, subjective norms, and perceived behavioral control influence behavioral intentions, which subsequently shape actual behavior [26,27]. Within environmental contexts, TPB has been widely applied to explain behaviors such as water conservation, sustainable consumption, recycling, and resource management.
The theory posits that behavioral intention is the most immediate predictor of behavior and is determined by three key components: attitude toward the behavior, subjective norms, and perceived behavioral control. Attitude refers to an individual’s positive or negative evaluation of a behavior, subjective norms represent perceived social expectations regarding that behavior, and perceived behavioral control reflects an individual’s perception of their ability and available resources to perform it. In addition to its indirect effect through behavioral intention, perceived behavioral control may also directly influence behavior when individuals perceive sufficient opportunities and resources to act [26].
Previous studies have demonstrated that perceived behavioral control, social influences, and environmental responsibility play important roles in shaping water-related behaviors. Individuals are more likely to engage in water conservation practices when they perceive social support for conservation and believe they have the capacity to perform such behaviors [28]. Similarly, sustainable water consumption behaviors have been associated with positive attitudes, environmental concern, personal responsibility, and perceived behavioral control [29]. Furthermore, research on pro-environmental behaviors suggests that environmental knowledge alone may not directly lead to behavioral change unless it is accompanied by favorable attitudes, behavioral intentions, and perceptions of control [30]. Recent applications of TPB have also emphasized the role of self-efficacy, social norms, and behavioral intentions in promoting socially and environmentally responsible actions [31].
Taken together, these studies suggest that knowledge about water resources should be accompanied by positive attitudes, environmental awareness, and a sense of personal responsibility to foster sustainable water-use behaviors [28,29,30,31]. From a water literacy perspective, TPB provides a valuable complementary framework for interpreting the behavioral dimension of water literacy and understanding how water-related knowledge and attitudes may contribute to responsible environmental actions. However, water literacy encompasses broader cognitive, affective, and behavioral dimensions that extend beyond the scope of TPB.
The Water Literacy Scale developed in the present study was not directly grounded in the Theory of Planned Behavior (TPB). Rather, its development was informed by the broader water literacy, environmental literacy, and sustainability education literature. Nevertheless, some dimensions of the scale, particularly those related to attitudes toward water, awareness of water use, and water conservation behaviors, show conceptual alignment with TPB constructs. Therefore, TPB is not considered the primary theoretical foundation of the scale; rather, it serves as a complementary framework for interpreting the behavioral dimension of water literacy. The multidimensional structure of the scale enables a comprehensive assessment of students’ cognitive, affective, and behavioral aspects of water literacy rather than focusing solely on behavioral intention, thereby providing broader evidence for educational research and practice.
Although the Theory of Planned Behavior was originally developed for adults, previous studies have successfully applied it to children and adolescents [32,33]. In the context of middle school students, perceived behavioral control refers to students’ beliefs about their ability to perform everyday water-conservation behaviors, whereas agency reflects their confidence that their actions can contribute to sustainable water use. Therefore, TPB provides a useful complementary theoretical perspective for explaining how knowledge and attitudes may translate into water-related behavioral intentions in this age group.
1.1.3. Empirical Studies on Water Literacy
Empirical studies on water literacy have begun to move beyond basic awareness, gradually incorporating multiple dimensions, such as knowledge, attitudes, behaviors, and social responsibility. Another study [34] found that middle school students primarily associated water with life and consumption. Ref. [35] introduced the Water Consumption Literacy (WCL) scale, which measures community-level water knowledge, disease prevention, and sustainability. Similar studies by [36,37,38] expanded the construct to include scientific understanding, social responsibility, and perception of water issues. Similarly, [39] examined water literacy among Chinese participants aged 6–69, finding that behavior was the most influential component of literacy. In Türkiye, Ref. [13] developed a 30-item water literacy scale encompassing water saving, water consciousness, and water sensitivity. Their studies revealed that students performed best in water saving, moderately in water sensitivity, and at average levels in water consciousness. Follow-up research [14] demonstrated gender and regional differences, with higher scores in the Eastern Black Sea region and lower levels in Southeastern Anatolia. Also, [15] assessed secondary students’ literacy across five Turkish cities, revealing higher scores among younger students, those from economically disadvantaged families and students in rural communities. Similarly, Ref. [16] found moderate overall water literacy among 1965 high school students in Istanbul, with high levels of water saving but only moderate water sensitivity and consciousness. However, these studies often examine specific dimensions in isolation or focus on limited populations, highlighting the need for more comprehensive and integrative approaches. Despite these contributions, current research lacks comprehensive, large-scale, and multidimensional assessments of water literacy that simultaneously account for regional and demographic differences. Given the importance of cultivating sustainable mindsets from an early age, there is a noticeable gap in the literature regarding comprehensive studies that encompass all regions of the country while accounting for variables such as gender, grade level, and geographical differences. In this context, the present study centers on middle school students, a critical population for nurturing scientific reasoning, environmental awareness, and responsible water-use behaviors. Understanding students’ levels of water literacy will provide valuable insights for educators and policymakers to identify conceptual gaps, develop targeted educational interventions, and strengthen environmental education strategies.
Collectively, previous studies have advanced the conceptualization and assessment of water literacy across different populations and contexts [35,36]. However, studies conducted in Türkiye have generally focused on specific dimensions of water literacy, particular student groups, or geographically limited samples [13,14,15,16]. Consequently, nationally representative studies simultaneously examining the cognitive, affective, and behavioral dimensions of water literacy across gender, grade level, and regions remain limited. The present study addresses this gap by developing a multidimensional Water Literacy Scale and applying it to a large, nationwide sample of middle school students across Türkiye.
Regional differences are particularly relevant in Türkiye because the country exhibits substantial variation in climate, water availability, population density, urbanization, and agricultural practices conditions across its seven geographical regions. These contextual differences may shape students’ everyday experiences with water resources, environmental education opportunities, and perceptions of water-related issues, making regional comparisons essential for understanding water literacy.
Gender was also considered because previous studies have reported differences in environmental attitudes, concern, and pro-environmental behaviors between female and male students, although findings have not always been consistent [20,40]. Examining gender differences may therefore clarify whether similar patterns exist among Turkish middle school students.
1.2. Research Questions
Accordingly, this large-scale, multi-regional study aims to develop a valid and reliable Water Literacy Scale for middle school students in Türkiye and to assess students’ water literacy levels across regions and demographic variables. The following research questions guided this study:
RQ 1: What are middle school students’ levels of water literacy across the dimensions of Water Awareness, Behavior Toward Water Issues, Attitude Toward Water, Knowledge About Water, Water Ecosystem and Chemistry, and Water Conservation and Awareness?
RQ 2: Do middle school students’ scores on the dimensions of Water Awareness, Behavior Toward Water Issues, Attitude Toward Water, Knowledge About Water, Water Ecosystem and Chemistry, and Water Conservation and Awareness differ by gender, grade level, and geographical region?
2. Materials and Methods
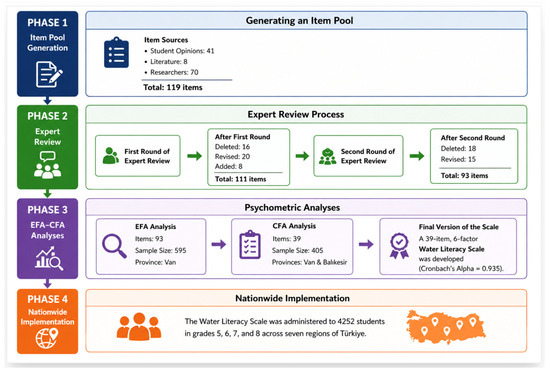
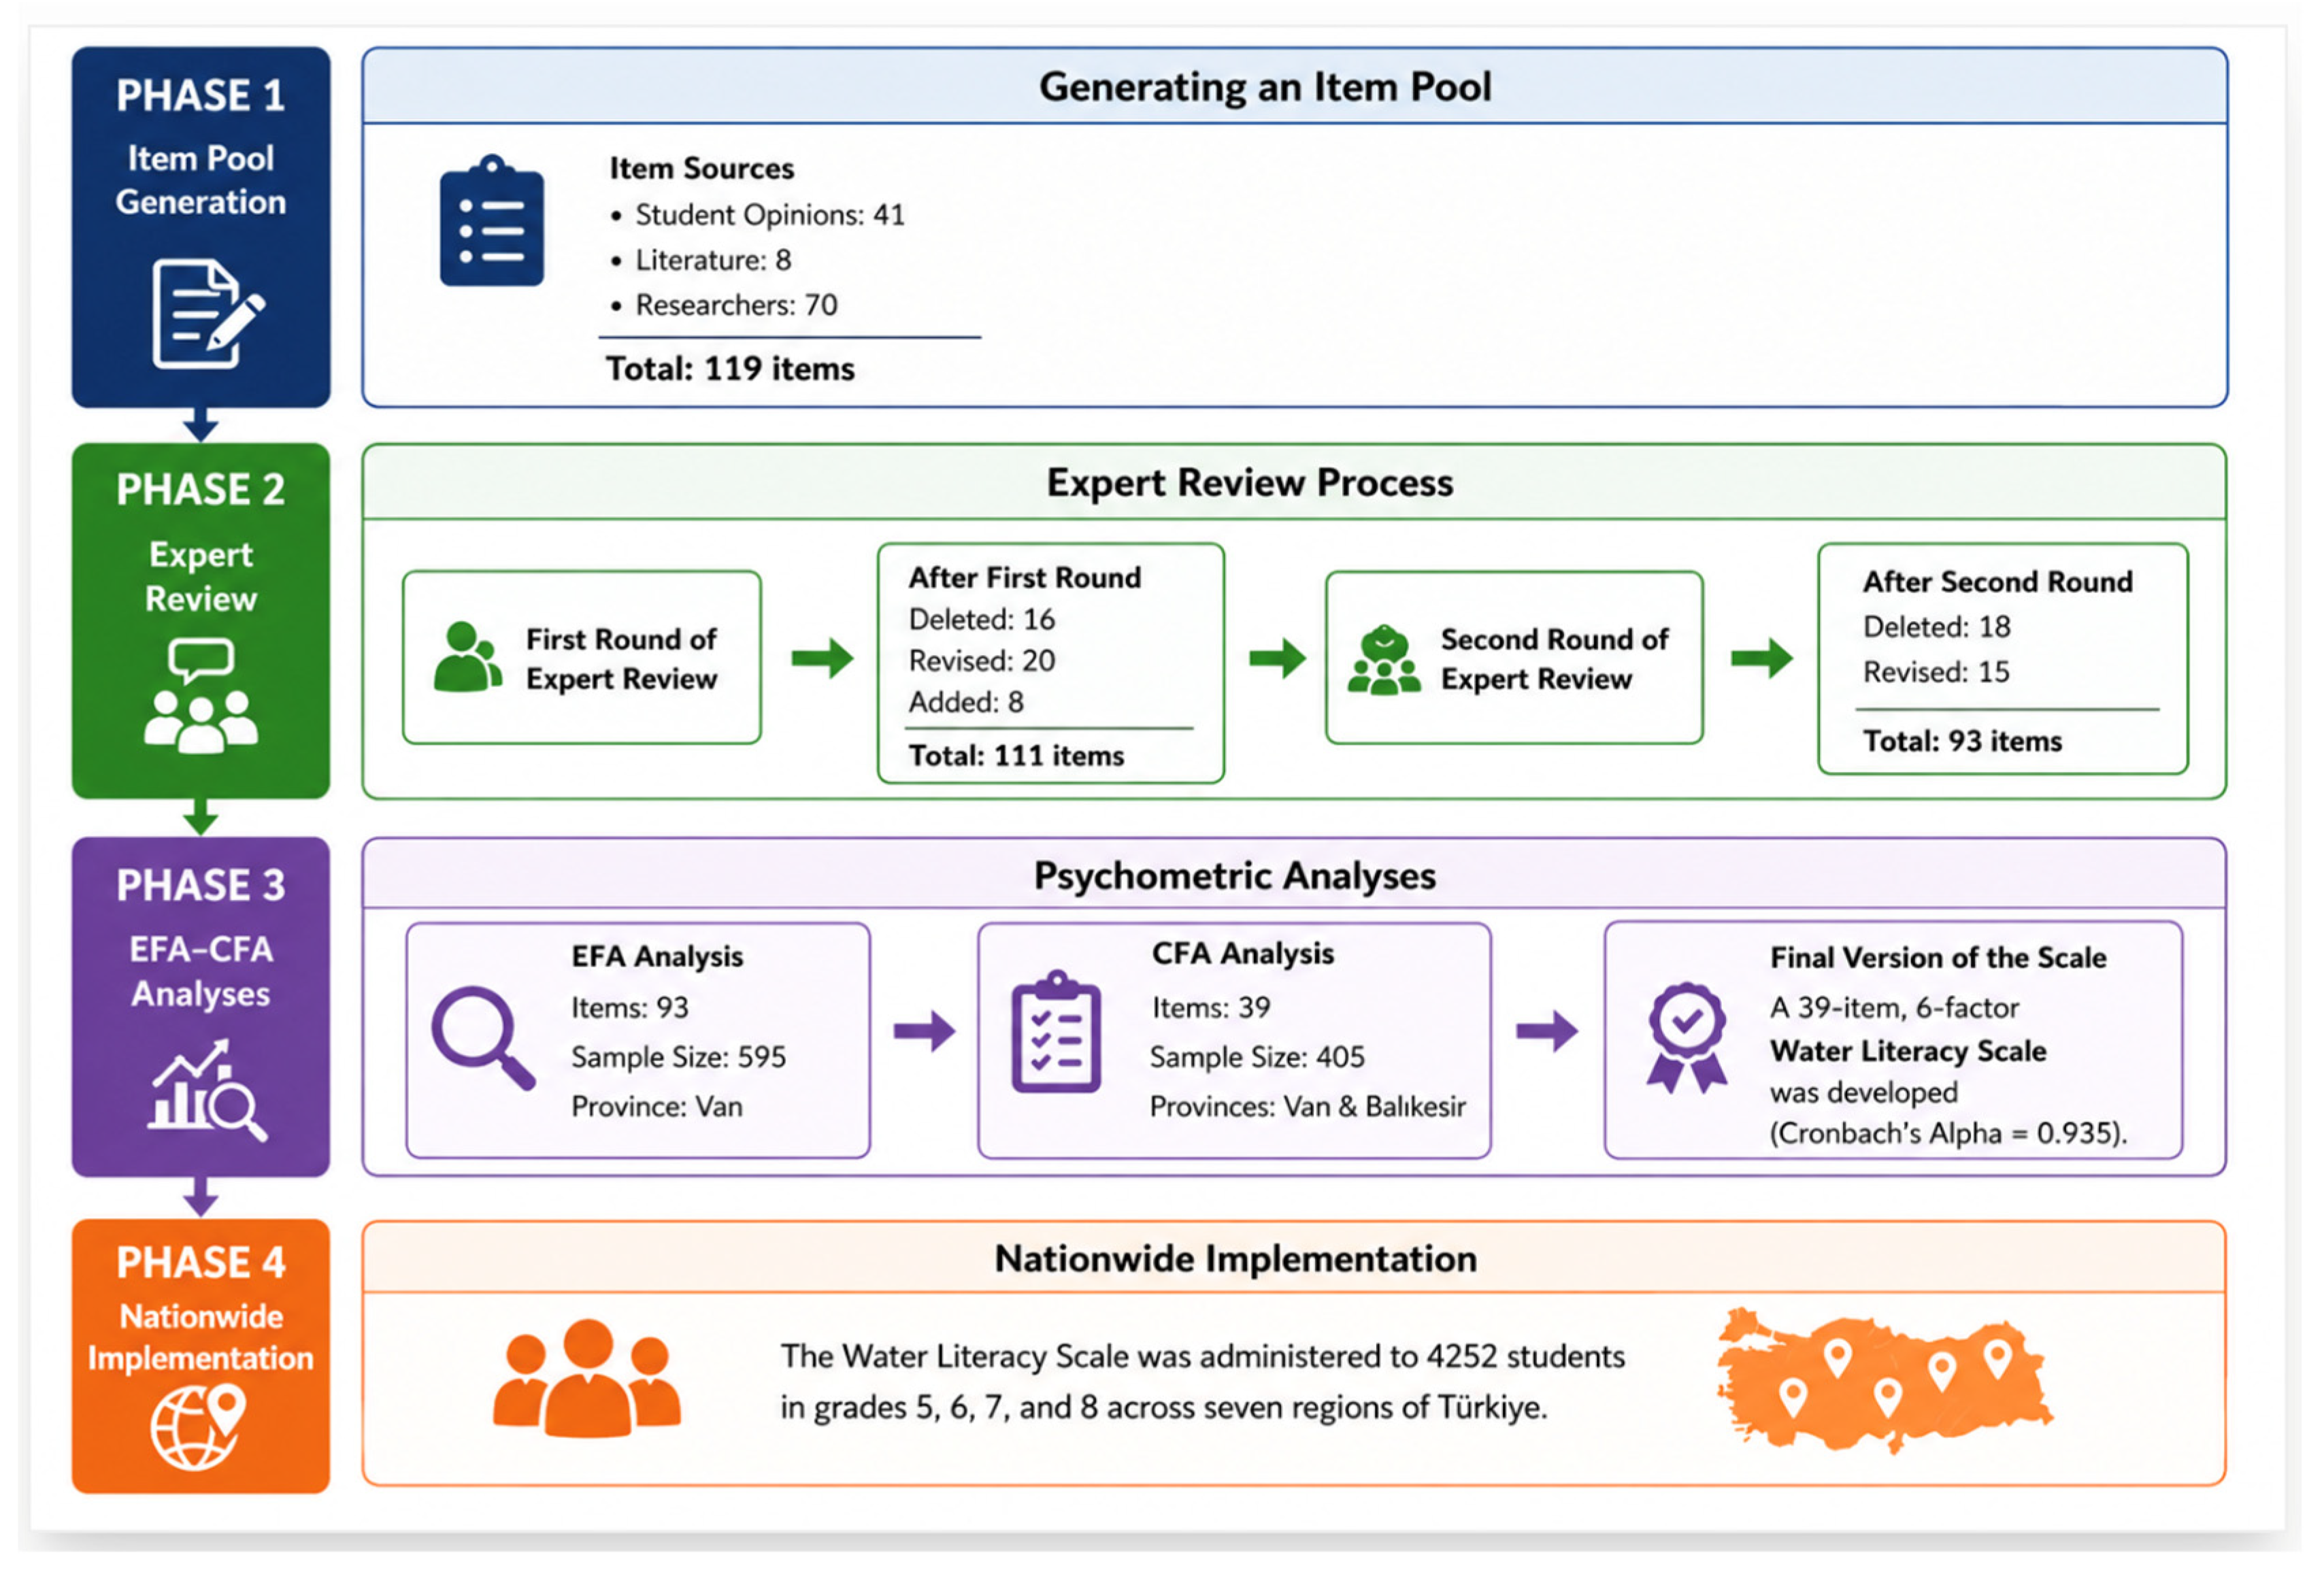
This study employed an Exploratory Sequential Mixed-Methods design, one of the typologies of mixed-methods research that integrates both qualitative and quantitative approaches [41]. This design was selected because this study first required qualitative data to generate contextually relevant scale items, followed by quantitative analyses to establish the psychometric properties of the instrument and subsequently conduct a nationwide assessment of middle school students’ water literacy. Accordingly, the exploratory sequential design was considered the most appropriate approach for the primary purpose of instrument development. During the scale development process, the stages outlined by [42] were followed. After the scale was developed and validated, nationwide data were collected through a survey study to determine the water literacy levels of middle school students across Türkiye (Figure 3).
Figure 3.
Flowchart of this study.
2.1. Sample
The target population of this study consisted of middle school students from the fifth grade to the eighth grade in Türkiye. According to Turkish Statistical Institute (TurkStat), Ankara [43], there are 16,640 public middle schools in Türkiye, with a total of 4,810,517 students enrolled during the 2022–2023 academic year. When constructing the sample distribution, Türkiye’s regional population structure was considered; a greater number of participants were selected from regions with higher population densities, while a smaller number were selected from regions with lower population densities. Accordingly, a higher number of students were included in the sample from the Marmara Region, which is Turkey’s most populous region. Therefore, regional comparisons should be interpreted in light of this population-based sampling strategy.
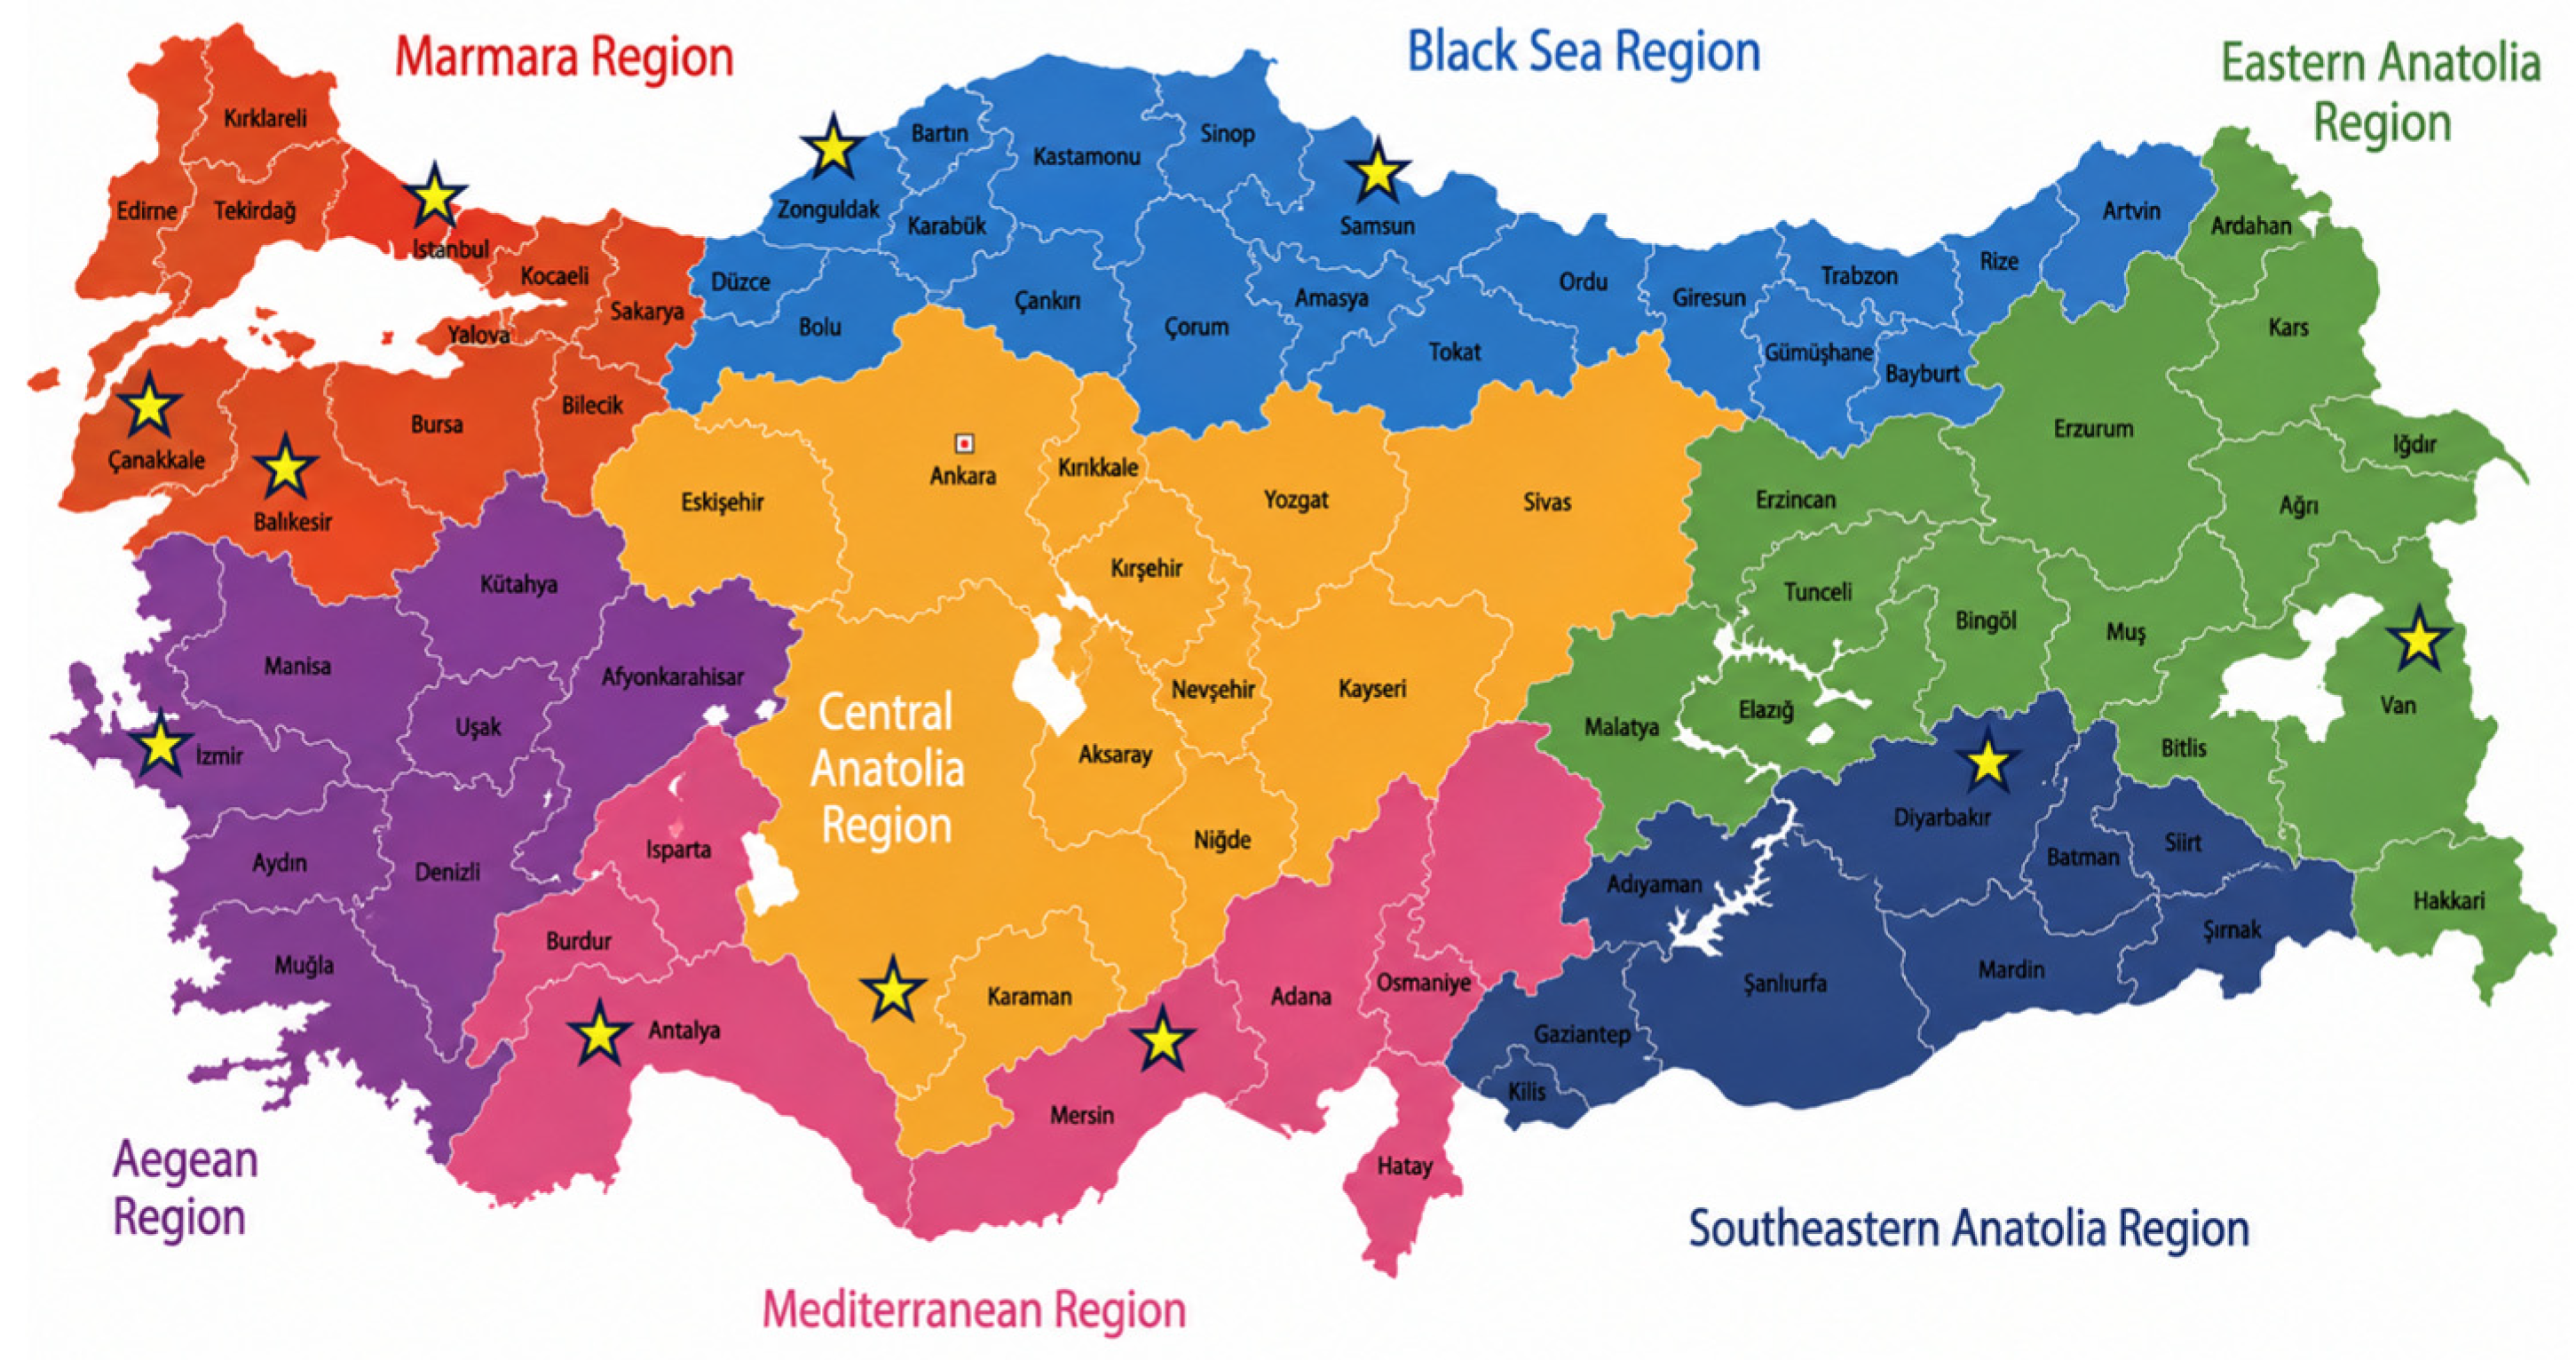
Figure 4 presents the geographical distribution of the study sample across the seven geographical regions of Türkiye. The nationwide survey included 4252 voluntary students from public middle schools from 11 provinces: Van (Eastern Anatolia, n = 426); Diyarbakır (Southeastern Anatolia, n = 309); İzmir (Aegean, n = 323); Konya (Central Anatolia, n = 344); İstanbul, Balıkesir and Çanakkale (Marmara, combined n = 1631); Antalya and Mersin (Mediterranean, combined n = 919); and Samsun and Zonguldak (Black Sea, combined n = 300).
Figure 4.
Distribution of the sample by region.
The investigation was conducted in two sequential phases. For the scale development phase, the sample comprised 1000 middle school students selected through convenience sampling. Among these, 595 students participated in the Exploratory Factor Analysis (EFA), and 405 students in the Confirmatory Factor Analysis (CFA). In the nationwide-survey phase, the validated Water Literacy Scale was administered to 4252 students. In total, 5252 middle school students participated in this study (Table 1).
Table 1.
Demographic characteristics of participants in the national survey study.
2.2. Data Analysis
In the data analysis phase, descriptive and inferential statistical analyses were conducted using IBM SPSS Statistics 29.0 (IBM Corp., Armonk, NY, USA), whereas CFA was performed using LISREL 8.8. (Scientific Software International Inc., Lincolnwood, IL, USA) For group comparisons, one-way analysis of variance (ANOVA) was used to examine differences across grade levels and geographical regions, followed by post hoc tests to identify the sources of significant differences. EFA was conducted to evaluate the construct validity of the WLS, and the resulting factor structure was subsequently confirmed through CFA. Multivariate Analysis of Variance (MANOVA) was then performed to examine the effects of gender, geographical region, and grade level on the six dimensions of the WLS. Prior to the MANOVA, the Box’s M test was used to assess the homogeneity of variance–covariance matrices. When this assumption was violated, Wilks’ Lambda was used as the primary multivariate test statistic. Effect sizes were interpreted using partial eta squared (η2), with values of 0.01, 0.06, and 0.14 indicating representing small, medium, and large effects, respectively [44].
2.3. Ethics, Reliability, and Validity
Ethical approval was obtained from the Istanbul University-Cerrahpaşa Social and Human Sciences Research Ethics Committee and official permission from the Turkish Ministry of National Education, Directorate General of Basic Education. The development and validation process followed internationally accepted procedures for scale development and validation [42,45,46]. Subsequently, EFA and CFA were performed on a sample of students from seven geographical regions of Türkiye to establish construct validity. Internal consistency was assessed using Cronbach’s alpha, yielding high reliability coefficients across subscales and an overall coefficient of 0.935, indicating strong internal consistency [47].
2.4. Data Collection Tool
In the first phase of this study, the WLS to be used in the research was developed. During the scale development process, the stages outlined by [42] were taken into consideration. The procedure consisted of three main steps: (1) creating an item pool, (2) obtaining expert opinions, and (3) conducting both EFA and CFA to ensure the validity and reliability of the scale.
Creating an item pool: At the initial stage of developing the WLS for Middle School Students, a comprehensive item pool was constructed using three sources: students, literature, and researchers. To capture students’ perspectives and real-life behaviors related to water use, semi-structured interviews were conducted with 40 students (18 female and 22 male) from grades 5 to 8, with ten students representing each grade level. The interviews included open-ended questions designed to explore students’ awareness, attitudes, and practices concerning water conservation. Based on the qualitative analysis of these responses, 41 preliminary items were generated, including examples such as “I turn off taps when I see water running unnecessarily”; “At home, we heat only as much water as we need (for tea, cooking, etc.)”; and “I watch documentaries or programs about water conservation.”
Next, an extensive literature review was conducted to establish the foundation of the scale and ensure the inclusion of validated indicators of water literacy. In this process, eight items were adapted from existing scales: two from [13], four from [48], and two from [49]. Additionally, the research team developed 70 new items informed by both frameworks and insights derived from the 2018 Turkish Science Curriculum [50], particularly the learning outcomes and objectives related to environmental awareness, sustainability, and water management. As a result, a preliminary item pool of 119 items was developed to represent the multidimensional construct of water literacy, encompassing cognitive, affective, and behavioral domains.
Obtaining expert opinions: To ensure content validity and eliminate redundancy, the draft scale was reviewed by field experts and language specialists. A total of five experts, three female and two male professors specializing in science education from four universities, were selected to review the scale items. The prepared item pool was organized into a standardized format, and an Expert Evaluation Form was designed to assess each item’s quality. This form enabled the experts to assess each item’s clarity, scientific accuracy, and conceptual relevance from an academic perspective. Experts evaluated the items by selecting one of the options: “Appropriate,” “Needs Revision,” or “Inappropriate.” A “Reason” column allowed them to justify their decisions, while an additional “Expert Suggestion” field provided space to recommend new items.
Following the first round of expert review, 16 items were removed, 20 revised, and 8 new items added, resulting in a total of 111 items. This version was subsequently reviewed by three additional field experts, leading to the removal of 18 items and revisions to 15 others. The revised scale was then evaluated by two language experts to ensure clarity, linguistic accuracy, and conceptual coherence. Based on their feedback, the final version of the WLS consisted of 93 items, structured as a five-point Likert-type scale. Conducting both EFA and CFA: For the EFA, data were collected from 595 students from grades 5 through 8, selected through a convenience sampling method. The Kaiser–Meyer–Olkin (KMO) measure of sampling adequacy was calculated as 0.940, indicating a high level of suitability for factor analysis. Bartlett’s Test of Sphericity also yielded significant results (χ2 = 8180.007, df = 741, and p < 0.001), confirming that the correlation matrix was appropriate for factor extraction. According to [46,51], a KMO value greater than 0.60 and a significant Bartlett’s test demonstrate that the dataset is adequate for factor analysis. EFA was conducted using the principal component analysis method with varimax rotation to ensure interpretability. Throughout the analysis process, 54 items were removed based on psychometric and conceptual criteria [52]. In addition to statistical criteria such as low factor loadings and cross-loadings, items were additionally evaluated for their conceptual consistency with the multidimensional framework of water literacy and their contribution to the content validity of the scale. Items that did not adequately represent the intended construct or that showed conceptual redundancy were excluded.
The final version of the WLS included six subdimensions (Table 2). The first had 14 items with factor loadings between 0.680 and 0.459. The second included six items with loadings from 0.640 to 0.560. The third contained five items with loadings between 0.704 and 0.583. The fourth had six items with loadings between 0.666 and 0.463. The fifth included four items with loadings between 0.643 and 0.522. The sixth consisted of four items with loadings from 0.726 to 0.496. As a result of this process, the final version of the WLS consisted of 39 items distributed across six factors. Collectively, these factors accounted for 49.15% of the total variance, reflecting a robust and consistent factor structure that supports the construct validity of the instrument.
Table 2.
Dimensions and item distribution of the scale based on EFA results.
Following the EFA, a CFA was conducted using LISREL to validate the factor structure of the scale established during the EFA phase. For this stage, data were collected from 405 students to confirm the validity of the proposed model. The model’s fit was evaluated using indices, including the Chi-square goodness-of-fit test (χ2), RMSEA, RMR, CFI, NNFI, NFI, IFI, RFI, GFI, and AGFI. No issues were detected with the t-values of the 39 items across the six factors. The Chi-square value was found to be statistically significant (χ2 = 1216.03, df = 687, and χ2/df = 1.77). The model fit indices were as follows: RMSEA = 0.044, RMR = 0.0461, CFI = 0.978, NNFI = 0.977, NFI = 0.951, IFI = 0.978, RFI = 0.948, and GFI = 0.867. Since most model fit indices indicated a good fit, no modifications were applied to the CFA model (Table 3).
Table 3.
Model fit indices for the WLS for middle school students.
As shown in Table 4, the WLS for Middle School Students consists of six subdimensions including 39 items with a total Cronbach’s alpha of 0.935, demonstrating high internal consistency and strong reliability across all dimensions (Appendix A).
Table 4.
Factors, items, and reliability coefficients of the WLS.
Use of generative artificial intelligence: A generative artificial intelligence (GenAI) tool (ChatGPT–5.5, OpenAI) was used solely to assist in creating the graphical illustrations presented in Figure 1, Figure 3 and Figure 4. These figures were generated based on information synthesized from the cited literature and author-developed content and were subsequently reviewed, edited, and approved by the authors. The GenAI tool was not used for data collection, scale development, statistical analyses, interpretation of findings, or manuscript writing. The authors take full responsibility for the accuracy and content of all AI-assisted figures.
3. Results
In the second phase of this study, a scale was administered to 4252 students from seven different regions of the country to address RQ 1, “What are the water literacy levels of middle school students?”; and RQ 2, “Do students’ water literacy levels vary by gender, grade level, and region?”
To determine the water literacy levels of middle school students (RQ 1), a descriptive analysis was conducted using the WLS. The descriptive results indicated that students achieved the highest scores in Water Awareness and the lowest scores in Water Conservation and Awareness (Table 5). Overall, students demonstrated strong awareness of water-related issues but comparatively lower engagement in conservation-oriented behaviors.
Table 5.
Descriptive analysis of the WLS.
3.1. Gender Differences in Students’ Water Literacy (RQ2)
In order to explore potential gender-based differences in students’ water literacy, MANOVA was employed. This analysis aimed to determine whether students’ scores across the six subdimensions of the WLS differed significantly between male and female participants.
As shown in Table 6, gender had a statistically significant, although small, multivariate effect on students’ water literacy. This finding indicates that gender has a statistically significant but small effect on water literacy subdimensions [44]. To determine which dependent variables were significantly influenced by gender, univariate analyses were conducted.
Table 6.
MANOVA results for gender.
As seen in Table 7, statistically significant differences were observed in WA, BTWI, and ATW subdimensions. These results indicate that male and female students differ significantly in their awareness, attitudes, and behaviors toward water-related issues. Although these differences were statistically significant, the observed effect sizes were small. No statistically significant gender differences were found in KAW, WEC, or WCA (p > 0.05), indicating that both male and female students performed similarly in these domains.
Table 7.
Univariate MANOVA results for water literacy subdimensions by gender.
In addition to MANOVA, independent t-tests were conducted to compare male and female students’ mean scores on each subdimension of the WLS. As presented in Table 8, female students demonstrated higher overall water literacy than male students. Significant differences were observed in Water Awareness, Behavior Toward Water Issues, and Attitude Toward Water, whereas no significant gender differences were found in the remaining subdimensions. Following the comparison by gender, the analyses were extended to examine whether students’ water literacy differed across grade levels.
Table 8.
Descriptive statistics for students’ water literacy in terms of gender.
3.2. Grade-Level Differences in Students’ Water Literacy (RQ2)
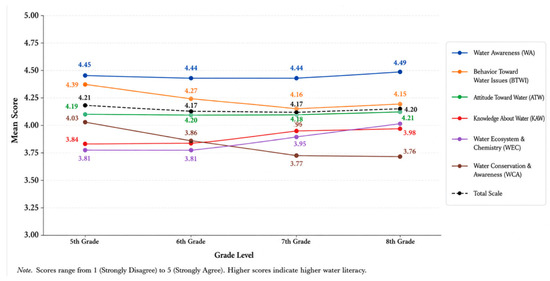
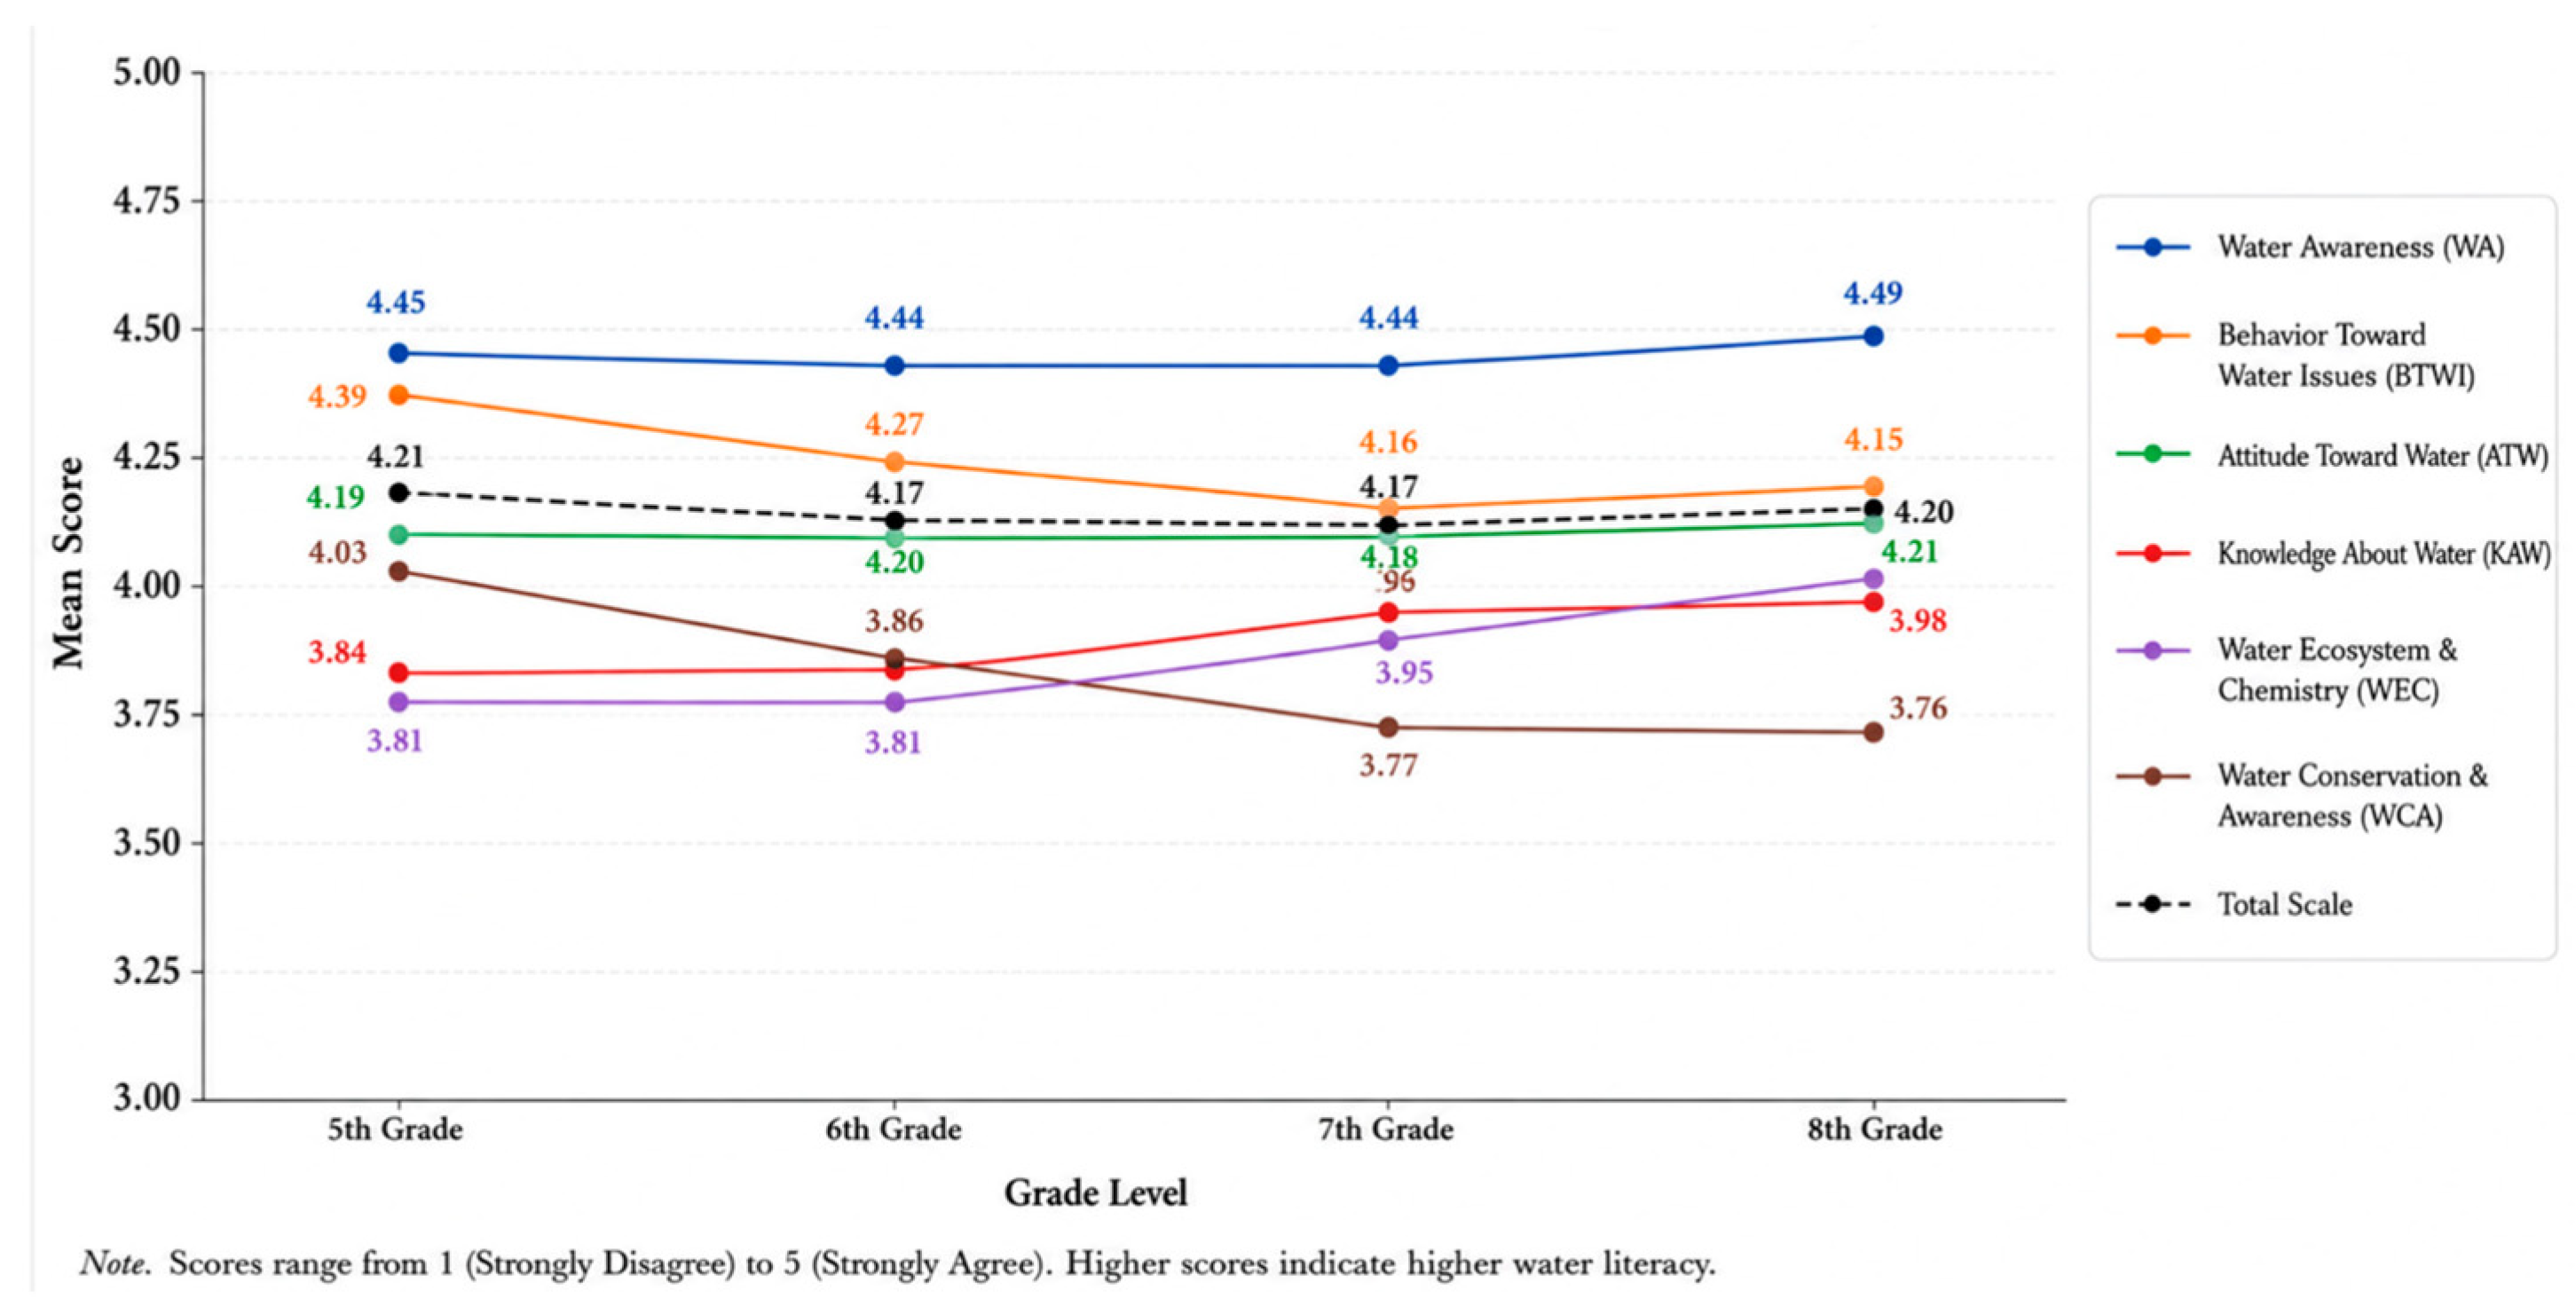
To examine how students’ water literacy levels vary across grade levels, descriptive and inferential analyses were conducted (Table 9). Descriptive results indicated that overall water literacy remained relatively stable across grade levels, with only minor variations (Table 9 and Figure 5).
Table 9.
Descriptive statistics for students’ water literacy in terms of grade.
Figure 5.
Mean scores of Water Literacy Scale and subscales by grade level.
Water Awareness remained consistently high across grade levels. In contrast, Behavior Toward Water Issues gradually declined in the upper grades, whereas Knowledge About Water and Water Ecosystem and Chemistry increased with grade level. Conversely, Water Conservation and Awareness showed a progressive decline across grades.
To addresses whether students’ scores on WLS differ significantly by grade level, a MANOVA was conducted. The MANOVA results revealed a statistically significant difference among grade levels across the combined dependent variables (Table 10). This finding indicates that grade level had a statistically significant, though small, multivariate effect on students’ water literacy. The obtained partial η2 value (0.02) corresponds to a small effect size, suggesting that grade level explains a modest portion of the variance.
Table 10.
MANOVA results for grade levels.
As shown in Table 11, statistically significant differences were found among grade levels for WA, BTWI, KAW, WEC, and WCA (p < 0.05). No significant difference was found for ATW. The largest effects were observed in BTWI (η2 = 0.020), WEC (η2 = 0.015), and WCA (η2 = 0.015), indicating that these subdimensions are most influenced by grade level.
Table 11.
MANOVA results for differences in subscale scores by grade level.
The post hoc analysis conducted following the ANOVA provided a detailed understanding of how water literacy dimensions varied across grade levels. Significant differences emerged among grades in several subdimensions of the WLS (Table 12). WA was significantly higher among 5th-, 6th-, and 7th-grade students compared to 8th graders, indicating a decline in awareness as students advance through school. Similarly, BTWI showed a marked difference, with 5th-grade students demonstrating stronger pro-environmental behaviors than those in higher grades (7th and 8th).
Table 12.
One-way ANOVA and post hoc results for grade level.
For the cognitive dimensions, a clear developmental trend was observed. KAW and WEC scores increased gradually, with 7th- and 8th-grade students outperforming their 5th- and 6th-grade peers, reflecting a growing conceptual understanding of water as students progress academically. However, the behavioral subdimension WCA followed a reverse trend; 5th-grade students scored significantly higher than those in 7th and 8th grade, indicating a gradual decline in conservation-oriented behaviors and daily water-saving habits as students mature. To further explore potential contextual differences, regional comparisons were subsequently conducted.
3.3. Regional Differences in Students’ Water Literacy (RQ2)
To investigate whether students’ water literacy levels vary significantly across different regions of Türkiye, a MANOVA was conducted on the combined subdimensions of the WLS.
As shown in Table 13, a statistically significant difference was found among regions in terms of the combined dependent variables. This indicates that the region variable had a statistically significant, but small, multivariate effect on students’ water literacy [44].
Table 13.
MANOVA results for water literacy by region.
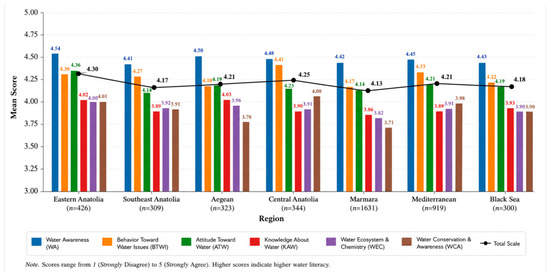
As presented in Table 14 and Figure 6, regional differences were observed across all dimensions of water literacy. Eastern Anatolia generally demonstrated the highest overall water literacy, whereas comparatively lower levels were observed in Marmara and some other regions. Across all regions, Water Awareness remained the strongest dimension, while Water Conservation and Awareness consistently showed the lowest scores, indicating that students’ awareness of water issues is generally stronger than their conservation-oriented behaviors.
Table 14.
Descriptive statistics for students’ water literacy by region.
Figure 6.
Mean scores of Water Literacy Scale and subscales by region.
As shown in Table 15, significant regional differences were identified across all subdimensions of the Water Literacy Scale. Among these dimensions, Water Conservation and Awareness exhibited the largest effect size, indicating that regional context had the greatest influence on conservation-oriented behaviors.
Table 15.
Univariate ANOVA results for water literacy subdimensions by region.
Post hoc comparisons (Table 16) revealed significant regional differences across all dimensions of water literacy. Overall, students from Eastern Anatolia consistently demonstrated higher performance across several dimensions, whereas comparatively lower scores were observed in Marmara. These findings suggest that regional context may contribute to differences in students’ water-related knowledge, attitudes, and conservation behaviors. To explore the relationships among the dimensions of water literacy, a Pearson correlation analysis was conducted. This analysis aimed to identify the strength and direction of the associations between the subdimensions of the WLS.
Table 16.
One-way ANOVA and post hoc results for water literacy by region.
As presented in Table 17, the Water Literacy Scale demonstrated strong and statistically significant positive correlations with all of its subdimensions. These findings support the internal consistency of the scale and indicate that higher overall water literacy is associated with higher levels of awareness, knowledge, attitudes, and conservation-related behaviors. Moderate positive correlations were also observed among the subdimensions, suggesting that although each dimension measures a distinct aspect of water literacy, they are conceptually related and collectively contribute to students’ overall water literacy.
Table 17.
Correlations between the WLS and its subdimensions.
4. Discussion
This study revealed significant differences in middle school students’ water literacy levels across gender, grade level, and region, providing a comprehensive understanding of variations in the cognitive, affective, and behavioral dimensions of water literacy. Overall, students exhibited moderately high levels of water literacy, characterized by strong awareness and positive attitudes but comparatively weaker conservation-oriented behaviors. This imbalance between understanding and action reflects a commonly observed trend in environmental literacy research, where knowledge does not automatically translate into consistent pro-environmental behaviors [15,25]. A similar interpretation is offered by the TPB, which emphasizes that environmentally responsible behaviors emerge through the interaction of knowledge, attitudes, perceived social expectations, and perceived behavioral control rather than knowledge alone [26,27]. Although previous studies have examined different dimensions of water literacy in various countries, direct international comparisons remain limited because of differences in measurement instruments, educational contexts, and study populations [12]. Therefore, the present findings are interpreted by considering both water literacy and the broader environmental literacy literature.
The analysis showed that female students scored higher than males in WA, BTWI, and ATW, although effect sizes were small. This finding aligns with previous studies reporting that girls tend to display greater environmental sensitivity, empathy, and engagement in conservation practices than boys [7,53,54]. However, studies such as [15,36] found no significant gender-based differences, suggesting that gender effects may be context-dependent and shaped by sociocultural norms or educational experiences. The results highlight the importance of incorporating gender-responsive pedagogy to engage male students and promote equitable participation in sustainability-oriented learning.
The gender differences observed in the present study are broadly consistent with international research indicating that environmental and water-related literacy may vary according to gender. Studies conducted in different educational contexts have reported that female students often demonstrate stronger environmental awareness, attitudes, and concern for sustainability-related issues; however, the magnitude and direction of these differences vary across populations [55,56,57]. These findings suggest that gender-related differences in water literacy are not unique to Türkiye but represent a broader international pattern. Nevertheless, the relatively small effect sizes obtained in the present study indicate that gender explains only a limited proportion of the variation in students’ water literacy.
Grade-level analysis revealed different patterns across the cognitive and behavioral dimensions of water literacy. Older students (7th–8th grades) achieved higher scores in KAW and WEC, indicating higher levels of conceptual understanding in these grade cohorts. In contrast, younger students (5th grade) scored higher in behavioral and affective dimensions such as WA, BTWI, and WCA, suggesting lower levels of pro-environmental engagement among higher-grade students. This grade-level pattern—where knowledge increases while behavior decreases—has also been noted in earlier research [14,15,25]. This pattern is also consistent with the Theory of Planned Behavior [26,27], which suggests that knowledge alone is insufficient to promote responsible behavior unless it is accompanied by favorable attitudes, social support, and perceived behavioral control. Accordingly, increases in water-related knowledge may not automatically translate into conservation-oriented actions when motivational and social dimensions remain underdeveloped. At the same time, students’ water-related behaviors should be interpreted cautiously because middle school students have limited autonomy over many everyday water-use decisions. Household water practices, parental guidance, and access to water-related resources may substantially influence conservation behaviors beyond students’ individual knowledge or attitudes [20,27]. Therefore, lower behavioral scores should not be interpreted solely as a lack of personal responsibility but also as reflecting the environmental and social contexts in which students make water-related decisions.
International studies similarly suggest that higher knowledge scores do not necessarily correspond to stronger environmental or water-related behaviors. Effective water literacy education requires the integrated development of knowledge, attitudes, skills, and responsible behaviors throughout K–12 education [17]. Likewise, [55] highlighted that perceptions and understanding of water-related issues differ across age groups. Similar grade-level differences have also been reported in environmental literacy research among lower-secondary students in Europe, where grade- and age-related differences were identified in both national and cross-national studies [20,40,57]. Together, these studies are consistent with the interpretation that higher knowledge scores do not necessarily coincide with stronger conservation-oriented behaviors, highlighting the complexity of translating knowledge into responsible environmental action across grade levels.
Regional disparities further highlighted the contextual nature of water literacy in Türkiye. Students in Eastern and Central Anatolia achieved the highest scores across multiple dimensions, particularly in awareness, attitude, and conservation. These results suggest that living in regions facing chronic water scarcity or environmental challenges fosters stronger environmental ethics and conservation behaviors. In contrast, students in Marmara and Mediterranean regions—despite higher levels of urbanization and educational access—scored lower in awareness and conservation, indicating weaker engagement with local water issues. The Aegean and Mediterranean regions demonstrated high Awareness but low conservation, reflecting a persistent “knowledge–behavior gap.” These results parallel [15], who found that urban students often exhibit strong conceptual knowledge but lower behavioral commitment. Overall, the findings confirm that regional context—ecological conditions and local culture—plays a decisive role in shaping students’ water literacy profiles.
The regional differences observed in the present study can also be interpreted in light of international evidence demonstrating that water and environmental literacy are shaped by geographical, social, and educational contexts. Consistently, [36] reported substantial regional variation in water literacy across 31 provincial capitals in China, indicating that local environmental conditions and educational opportunities influence water literacy outcomes. Similarly, Ref. [58] emphasized that water literacy is influenced by multiple contextual factors beyond individual knowledge, including social and environmental conditions. Likewise, Ref. [56] showed that environmental literacy varies according to contextual factors such as educational background and place of residence, highlighting the importance of local environmental experiences. Collectively, these findings suggest that the regional differences identified in Türkiye are likely to reflect the combined influence of geographical characteristics, educational opportunities, and socio-environmental contexts rather than geographical location alone.
The regional differences observed in this study should be interpreted within the broader geographical diversity of Türkiye. The country’s seven geographical regions differ considerably in terms of climate, water availability, agricultural activities, urbanization, and industrial development, all of which may influence students’ everyday experiences with water and environmental learning opportunities. For example, Eastern and Central Anatolia are generally characterized by relatively limited water availability and greater agricultural dependence, whereas the Marmara region is highly urbanized and industrialized. The Mediterranean region experiences intensive agricultural production and seasonal water demand, while the Black Sea region receives relatively high precipitation. These regional characteristics may contribute to differences in students’ water literacy by shaping their environmental experiences and learning contexts; however, these factors were not directly examined in the present study.
Overall, students demonstrated a moderately high level of water literacy (M = 4.17). Among the six dimensions, Water Awareness had the highest mean score (M = 4.45), whereas Water Conservation and Awareness had the lowest mean score (M = 3.87). This gap indicates that stronger awareness does not necessarily translate into conservation-oriented behaviors. Across gender, grade, and regional comparisons, a consistent pattern emerged: students generally possessed sound cognitive understanding and positive attitudes toward water but showed comparatively weaker conservation-oriented behaviors. This reinforces a broader challenge in sustainability education—bridging the gap between knowing and doing. Educational interventions should therefore extend beyond factual knowledge to cultivate action competence through experiential, community-based, and inquiry-driven learning approaches [12]. By embedding water-related sustainability themes across science curricula and local environmental projects, educators can support the development of water literacy and civic responsibility among students. From this perspective, the findings support the view that water literacy should be understood not only as a knowledge-based construct but also as a multidimensional construct involving attitudes, awareness, and behavioral tendencies. This interpretation is consistent with the complementary perspective offered by the Theory of Planned Behavior regarding the development of environmentally responsible actions.
These findings suggest that individuals with higher water literacy tend to display greater Water Awareness and stronger pro-environmental behaviors. Similarly, students with higher awareness scores are more likely to demonstrate positive attitudes toward water, greater sensitivity to water-related problems, and stronger conservation-oriented practices. Moreover, increased water literacy is associated with higher levels of knowledge about water systems, chemical properties, and ecosystem dynamics. Overall, the results highlight that cognitive, affective, and behavioral dimensions of water literacy are positively and interdependently related, reflecting the holistic and interconnected nature of the construct. This study contributes to the literature by providing one of the first large-scale, multidimensional assessments of water literacy among middle school students across diverse regions. The findings extend existing research by demonstrating that water literacy is not only a cognitive construct but also deeply influenced by contextual and developmental factors, highlighting the persistent gap between knowledge and behavior in sustainability education.
Overall, the present findings make several important contributions to the water literacy literature. First, this study provides a multidimensional and psychometrically validated instrument for assessing middle school students’ water literacy. The 39-item Water Literacy Scale comprised six dimensions, explained 49.15% of the total variance, demonstrated acceptable-to-good CFA fit indices (RMSEA = 0.044, CFI = 0.978), and showed high internal consistency (Cronbach’s α = 0.935). The scale was subsequently administered to 4252 middle school students across the seven geographical regions of Türkiye. Second, unlike previous studies that were limited to specific regions or smaller samples, this study presents a nationwide assessment of water literacy among middle school students across the seven geographical regions of Türkiye. The findings provide evidence that can inform curriculum development, educational policy, and sustainability education by identifying regional and demographic differences in water literacy. Furthermore, the validated scale may serve as a useful assessment tool for future national and international studies conducted in diverse educational contexts.
5. Conclusions
The findings showed that middle school students demonstrated a moderately high overall level of water literacy (M = 4.17). Among the six dimensions, Water Awareness received the highest mean score (M = 4.45), whereas Water Conservation and Awareness had the lowest mean score (M = 3.87), indicating that students’ awareness exceeded their conservation-oriented behaviors. Significant differences were also observed according to gender, grade level, and geographical region. Female students scored significantly higher in Water Awareness, Behavior Toward Water Issues, and Attitude Toward Water, while grade-level differences were dimension-specific, with higher-grade students performing better in knowledge-related dimensions and fifth-grade students obtaining higher scores in several awareness- and conservation-related dimensions. Regional analyses further revealed substantial variation across the seven geographical regions of Türkiye, with Eastern Anatolia generally exhibiting the highest levels of water literacy, potentially reflecting environmental and cultural factors associated with resource conservation.
These results reveal a developmental paradox: as students’ knowledge about water systems grows with grade level, their behavioral engagement and conservation practices tend to decline. To address this imbalance, science education must not only enhance conceptual understanding but also sustain affective and behavioral dimensions through hands-on, place-based, and inquiry-driven instruction. The 2024 Century of Türkiye Education Model [11], emphasizing sustainability, environmental ethics, and active citizenship, provides a promising framework to integrate water literacy into science curricula. However, its success will depend on effective teacher training, interdisciplinary collaboration, and the inclusion of authentic, context-based learning experiences that connect students’ lives with local water issues.
Regionally tailored education programs should also be prioritized—especially in coastal and urbanized regions, where knowledge remains high but conservation practices lag. Integrating local water management projects, experiential learning, and SDG 6 (Clean Water and Sanitation) initiatives can strengthen both cognitive and behavioral dimensions of water literacy.
Ultimately, fostering true water literacy means empowering students not only to understand but also to act—transforming scientific knowledge and positive attitudes into responsible, context-sensitive, and sustainable behaviors. Through inclusive, experiential, and regionally adaptive educational practices, Türkiye can cultivate a generation of scientifically literate citizens and support environmentally responsible behaviors. Beyond providing a valid and reliable measurement instrument, the present study offers evidence that may guide sustainability-oriented educational practices and future water literacy research at both national and international levels.
Although the present study examined regional differences in water literacy across the seven geographical regions of Türkiye, it did not investigate the potential influence of more specific geographical and environmental characteristics. Future studies could explore how proximity to rivers, lakes, reservoirs, coastal areas, mountainous regions, and different levels of urbanization influence students’ water literacy. Such analyses may provide a more comprehensive understanding of how local environmental contexts shape water literacy and support the development of context-specific educational strategies. Furthermore, future studies may adopt more balanced regional sampling designs when direct comparisons among geographical regions are the primary objective. Because the present study was based on cross-sectional, self-reported data, the findings should be interpreted as associations rather than evidence of developmental or causal relationships.
Author Contributions
Conceptualization, B.A., F.S.A. and İ.B.; methodology, B.A., F.S.A. and İ.B.; validation, B.A., F.S.A. and İ.B.; formal analysis, B.A., İ.B. and H.A.; investigation, B.A., F.S.A. and İ.B.; resources, B.A., F.S.A. and İ.B.; data curation, B.A., F.S.A. and İ.B.; writing—original draft preparation, B.A., F.S.A. and İ.B.; writing—review and editing, B.A., F.S.A., İ.B. and H.A.; visualization, B.A. and İ.B.; project administration, B.A., F.S.A. and İ.B. All authors have read and agreed to the published version of the manuscript.
Funding
This research received no external funding.
Data Availability Statement
The datasets generated and analyzed during the current study are not publicly available due to ethical and privacy restrictions involving data collected from minor participants. This study was conducted under institutional ethics approval and permission from the Ministry of National Education. To protect participant confidentiality, the data cannot be deposited in a public repository. Requests to access the anonymized dataset and stored in SPSS format, should be directed to the corresponding author upon reasonable request for academic and research purposes, subject to compliance with ethical and institutional regulations.
Acknowledgments
During the preparation of this manuscript/study, the authors used ChatGPT-5.5 (OpenAI) for the purpose of refining the academic language, translating specific sections of the discussion, ensuring the theoretical consistency of the text, and assisting in the preparation and refinement of the figures included in the manuscript. This study was presented as an oral presentation at the ESERA 2025 Conference. The authors gratefully acknowledge the Scientific and Technological Research Council of Türkiye (TÜBİTAK) for supporting the presentation of this study at the ESERA 2025 Conference through the 2224-A International Scientific Events Participation Support Program (2025/2) (Support No. 1919B022503822).
Conflicts of Interest
The authors declare no conflicts of interest.
Abbreviations
The following abbreviations are used in this manuscript:
| EFA | Exploratory Factor Analysis |
| CFA | Confirmatory Factor Analysis |
| TPB | The Theory of Planned Behavior |
| WA | Water Awareness |
| BTWI | Behavior Toward Water Issues |
| ATW | Attitude Toward Water |
| KAW | Knowledge About Water |
| WEC | Water Ecosystem and Chemistry |
| WCA | Water Conservation and Awareness |
Appendix A
WATER LITERACY SCALE
Demographic Information
| City | ||||
| School Name | ||||
| Grade | 5th grade | 6th grade | 7th grade | 8th grade |
| Gender | Female | Male | ||
Parents’ Educational Background
| Mother | Father | |
| Illiterate | ||
| Primary School Graduate | ||
| Middle School Graduate | ||
| High School Graduate | ||
| University Graduate | ||
| Master’s Degree | ||
| Doctoral Degree |
| Items | Strongly Agree | Agree | Neutral | Disagree | Strongly Disagree | |
| 1 | When making tea or cooking, only the necessary amount of water should be boiled. | |||||
| 2 | While waiting for the shower water to warm up, the running water should be collected in a bucket and later used when needed. | |||||
| 3 | Leaking taps should be repaired immediately. | |||||
| 4 | Harmful substances such as pesticides, chemicals, and plastics pollute rivers, lakes, seas, and other water sources. | |||||
| 5 | Waste that is not recycled pollutes water. | |||||
| 6 | Factory, ship, industrial, and household wastes pollute water. | |||||
| 7 | Pouring oil down the sink pollutes water. | |||||
| 8 | Water pollution threatens the lives of all living things. | |||||
| 9 | Water pollution causes a decrease in the number of living species. | |||||
| 10 | People in some regions of the world suffer from water shortages. | |||||
| 11 | Having clean water resources is important for a sustainable environment. | |||||
| 12 | Water is important for sustainable development and the future of humanity. | |||||
| 13 | Global climate change reduces freshwater resources. | |||||
| 14 | Water pollution harms both people and other living things. | |||||
| 15 | Icebergs float because the density of ice is lower than the density of liquid water. | |||||
| 16 | Sea water is a mixture that contains salt and various minerals. | |||||
| 17 | Pure water is a compound. | |||||
| 18 | The tap water in our homes is a mixture. | |||||
| 19 | The increase in the temperature of seas and oceans causes an increase in the amount of carbon dioxide in the atmosphere. | |||||
| 20 | About 50–70% of an adult human’s body weight is made up of water. | |||||
| 21 | The destruction of corals in the seas decreases the amount of oxygen in the atmosphere. | |||||
| 22 | The most important source of oxygen on Earth is the algae in seas and oceans. | |||||
| 23 | The chemical formula of water is H2O. | |||||
| 24 | Soil and air pollution also cause water pollution. | |||||
| 25 | I enjoy participating in awareness-raising activities about the correct use of water. | |||||
| 26 | I would provide financial support to protect clean water resources. | |||||
| 27 | I take part in all kinds of activities to reduce water pollution. | |||||
| 28 | I watch documentary programs about saving water. | |||||
| 29 | I turn off taps that are left running. | |||||
| 30 | At home, we heat only the amount of water we need (tea, cooking, etc.). | |||||
| 31 | I warn people who throw garbage into water. | |||||
| 32 | At school, I report leaking or broken taps to the school administration. | |||||
| 33 | I warn neighbors who wash their cars every day to save water. | |||||
| 34 | I warn family members at home when they waste water. | |||||
| 35 | I think that one of the biggest problems in the world is water shortage. | |||||
| 36 | I am worried that one day we may not even find clean water to drink. | |||||
| 37 | I am concerned that the drinking water in the place I live will decrease. | |||||
| 38 | I am worried about the rapid depletion of clean water resources. | |||||
| 39 | I am anxious about not being able to find clean water in the future. |
| Factor | Items | Cronbach Alpha |
| Water Awareness | 1–2–3–4–5–6–7–8–9–10–11–12–13–14 | 0.883 |
| Behavior Toward Water Issues | 29–30–31–32–33–34 | 0.792 |
| Attitude Toward Water | 35–36–37–38–39 | 0.796 |
| Knowledge About Water | 15–16–17–18–19–20 | 0.776 |
| Water Ecosystem and Chemistry | 21–22–23–24 | 0.709 |
| Water Conservation and Awareness | 25–26–27–28 | 0.755 |
| Total | 0.935 |
References
- Bhattacharya, S.; Gupta, A.B.; Gupta, A.; Pandey, A. (Eds.) Introduction to water remediation: Importance and Methods. In Water Remediation; Springer: Singapore, 2018; pp. 3–11. [Google Scholar] [CrossRef] [Scilit]
- United Nations Educational, Scientific and Cultural Organization (UNESCO). Water for People, Water for Life: The United Nations World Water Development Report; UNESCO; Berghahn Books: Paris, France, 2003. [Google Scholar]
- United Nations Educational, Scientific and Cultural Organization (UNESCO). The United Nations World Water Development Report 2024: Water for Prosperity and Peace; UNESCO Publishing: Paris, France, 2024; Available online: https://www.unesco.org/en/articles/united-nations-world-water-development-report-2024-water-prosperity-and-peace (accessed on 20 May 2026).
- Republic of Türkiye Ministry of Agriculture and Forestry. National Water Plan (2026–2035); General Directorate of Water Management: Ankara, Türkiye, 2026.
- Otaki, Y.; Sakura, O.; Otaki, M. Advocating water literacy. Mahasarakham Int. J. Eng. Technol. 2015, 1, 36–40. [Google Scholar] [CrossRef]
- United Nations Educational, Scientific and Cultural Organization (UNESCO). Education for Sustainable Development Goals: Learning Objectives; UNESCO Publishing: Paris, France, 2017; Available online: https://unesdoc.unesco.org/ark:/48223/pf0000247444 (accessed on 20 May 2026).
- Küçük, A. Investigation of Turkish middle and high school students’ water literacy as a factor predicting Sustainable Development Goals. Educ. Q. Rev. 2022, 5, 192–201. [Google Scholar] [CrossRef] [Scilit]
- Republic of Türkiye Ministry of Agriculture and Forestry. Water Efficiency Strategy Document and Action Plan Within the Framework of Adaptation to the Changing Climate (2023–2033); Republic of Türkiye Ministry of Agriculture and Forestry: Ankara, Türkiye, 2024. Available online: https://faolex.fao.org/docs/pdf/tur228724.pdf?utm_source (accessed on 20 May 2026).
- Republic of Türkiye Ministry of Agriculture and Forestry. Türkiye Water Report 2023: National Water Plan and Management Strategy; General Directorate of Water Management: Ankara, Türkiye, 2023.
- Falkenmark, M. The massive water scarcity now threatening Africa: Why isn’t it being addressed? Ambio 1989, 18, 112–118. [Google Scholar]
- Ministry of National Education (MoNE). Türkiye Yüzyılı Maarif Modeli [The Century of Türkiye Education Model]; Ministry of National Education: Ankara, Türkiye, 2024.
- McCarroll, M.; Hamann, H. What we know about water: A water literacy review. Water 2020, 12, 2803. [Google Scholar] [CrossRef] [Scilit]
- Sözcü, U.; Türker, A. Development of water literacy scale. Third Sect. Soc. Econ. Rev. 2020, 55, 1155–1168. [Google Scholar] [CrossRef] [Scilit]
- Sözcü, U.; Türker, A. Examining the water literacy levels of high school students according to some variables. Asian J. Educ. Train. 2020, 6, 569–582. [Google Scholar] [CrossRef] [Scilit]
- Erbaş, S.; Kılıçoğlu, G.; Aksoy, B. Examination of water literacy levels of secondary school students in terms of different variables. J. Teach. Educ. Lifelong Learn. 2023, 5, 194–208. [Google Scholar] [CrossRef] [Scilit]
- Yentür, M.M.; Sözcü, U.; Aydınözü, D. Determining the Water Literacy Levels of high school students: The case of Istanbul. Ondokuz Mayıs Univ. J. Educ. Fac. 2022, 41, 381–421. [Google Scholar]
- Mostacedo-Marasovic, S.J.; Mott, B.C.; White, H.; Forbes, C.T. Towards water literacy: Analysis of standards for teaching and learning about water on Earth. J. Geosci. Educ. 2023, 71, 394–409. [Google Scholar] [CrossRef] [Scilit]
- Ursavaş, N.; Aytar, A. Analyzing pre-school students’ water awareness and water literacy development in a project-based study. J. Res. Inform. Environ. 2018, 3, 19–45. [Google Scholar]
- Dinç, H. Requirements on the effectiveness of water literacy education. Anatol. Teach. J. 2018, 2, 169–176. [Google Scholar]
- Cincera, J.; Kroufek, R.; Bogner, F.X. The perceived effect of environmental and sustainability education on environmental literacy among Czech teenagers. Environ. Educ. Res. 2023, 29, 1276–1293. [Google Scholar]
- Su, H.J.; Chen, M.J.; Wang, J.T. Developing a water literacy. Curr. Opin. Environ. Sustain. 2011, 3, 517–519. [Google Scholar] [CrossRef] [Scilit]
- Forbes, C.T.; Zangori, L.; Schwarz, C.V. Empirical validation of integrated learning performances for hydrologic phenomena: 3rd grade students’ model-driven explanation construction. J. Res. Sci. Teach. 2015, 52, 895–921. [Google Scholar] [CrossRef] [Scilit]
- Gunckel, K.L.; Covitt, B.A.; Salinas, I.; Anderson, C.W. A learning progression for water in socio-ecological systems. J. Res. Sci. Teach. 2012, 49, 843–868. [Google Scholar] [CrossRef] [Scilit]
- Zangori, L.; Vo, T.; Forbes, C.T.; Schwarz, C.V. Supporting 3rd grade students’ model-based explanations about groundwater: A quasi-experimental study of a curricular intervention. Int. J. Sci. Educ. 2017, 39, 1421–1442. [Google Scholar] [CrossRef] [Scilit]
- Ben-Zvi Assaraf, O.; Eshach, H.; Orion, N.; Alamour, Y. Cultural differences and students’ spontaneous models of the water cycle: A case study of Jewish and Bedouin children in Israel. Cult. Stud. Sci. Educ. 2012, 7, 451–477. [Google Scholar] [CrossRef] [Scilit]
- Ajzen, I. The theory of planned behavior. Organ. Behav. Hum. Decis. Process. 1991, 50, 179–211. [Google Scholar] [CrossRef] [Scilit]
- Ajzen, I. Constructing a Theory of Planned Behavior Questionnaire: Conceptual and Methodological Considerations; University of Massachusetts Amherst: Amherst, MA, USA, 2006. [Google Scholar]
- Chaudhary, A.K.; Warner, L.A.; Lamm, A.J.; Israel, G.D.; Rumble, J.N.; Cantrell, R.A. Using the theory of planned behavior to encourage water conservation among extension clients. J. Agric. Educ. 2017, 58, 185–202. [Google Scholar] [CrossRef] [Scilit]
- Saefi, M.; Fauzi, A.; Kristiana, E.; Adi, W.C.; Islami, N.N.; Ikhsan, M.A.; Ramadhani, M.; Ningrum, D.E.A.F.; Setiawan, M.E.; Muchson, M. Theory of planned behavior to analyze students’ intentions in consuming tap water. Eurasia J. Math. Sci. Technol. Educ. 2023, 19, e2236. [Google Scholar] [CrossRef] [Scilit] [PubMed]
- Correia, E.; Sousa, S.; Viseu, C.; Leite, J. Using the theory of planned behavior to understand the students’ pro-environmental behavior: A case study in a Portuguese higher education institution. Int. J. Sustain. High. Educ. 2022, 23, 1070–1089. [Google Scholar] [CrossRef] [Scilit]
- Worthington, D.; Graham, B.; Gilliard, H.; Kelp, N.C. Development of a scale to measure planned behavior in inclusive science communication: Validity evidence in undergraduate STEM students. CBE Life Sci. Educ. 2024, 23, ar48. [Google Scholar] [CrossRef] [Scilit] [PubMed]
- Mullan, B.A.; Wong, C.; Kothe, E.J. Predicting adolescents’ safe food handling using an extended Theory of Planned Behavior. Food Control 2013, 31, 454–460. [Google Scholar] [CrossRef] [Scilit]
- Rivis, A.; Sheeran, P. Descriptive norms as an additional predictor in the Theory of Planned Behaviour: A meta-analysis. Curr. Psychol. 2003, 22, 218–233. [Google Scholar] [CrossRef] [Scilit]
- Özerdinç, F.; Hamalosmanoğlu, M. Views of secondary school students on water footprint, water awareness and water literacy. Anatol. J. Teach. 2021, 5, 296–315. [Google Scholar] [CrossRef] [Scilit]
- Fernandes, A.; Figueiredo, M.; Chaves, H.; Neves, J.; Vicente, H. Assessment of water consumers literacy. In Emerging Technologies for Water Supply, Conservation and Management; Balaji, E., Veeraswamy, G., Mannala, P., Madhav, S., Eds.; Springer: Singapore, 2023; pp. 1–27. [Google Scholar]
- Tian, K.; Wang, H.; Wang, Y. Investigation and evaluation of water literacy of urban residents in China based on data correction method. Water Policy 2021, 23, 77–95. [Google Scholar] [CrossRef] [Scilit]
- Glithero, L.D.; Zandvliet, D.B. Evaluating ocean perceptions and ocean values: The Canadian ocean literacy survey. Can. J. Environ. Educ. 2021, 24, 216–232. [Google Scholar]
- Johnson, D.R.; Courter, J.R. Assessing water literacy at a primarily undergraduate university in Ohio. J. Nat. Resour. Life Sci. Educ. 2020, 49, e20024. [Google Scholar] [CrossRef] [Scilit]
- He, H.S. Construction of the index system of water literacy and application in a case study of four Chinese communities. J. Discret. Math. Sci. Cryptogr. 2018, 21, 485–491. [Google Scholar] [CrossRef] [Scilit]
- Svobodová, S.; Kroufek, R. Environmental literacy of ISCED 2 pupils in the Czech Republic and Slovakia. Eur. J. Sci. Math. Educ. 2022, 10, 519–528. [Google Scholar] [CrossRef] [Scilit]
- Creswell, J.W. Research Design: Qualitative, Quantitative, and Mixed Methods Approaches, 4th ed.; SAGE Publications: Thousand Oaks, CA, USA, 2014. [Google Scholar]
- Li, X.; Su, X.; Du, Y. The environmental sustainability of an exhibition in visitors’ eyes: Scale development and validation. J. Hosp. Tour. Manag. 2021, 46, 172–182. [Google Scholar] [CrossRef] [Scilit]
- Turkish Statistical Institute (TurkStat). Net Schooling Rate, Number of Schools, Students, Teachers, and Classrooms in Preschool Education by Academic Year. 2025. Available online: https://veriportali.tuik.gov.tr/en/press/58002 (accessed on 8 July 2026).
- Cohen, J. Statistical Power Analysis for the Behavioral Sciences, 2nd ed.; Lawrence Erlbaum Associates: Hillsdale, NJ, USA, 1988. [Google Scholar]
- Creswell, J.W.; Plano Clark, V.L. Designing and Conducting Mixed Methods Research, 3rd ed.; SAGE Publications: Thousand Oaks, CA, USA, 2018. [Google Scholar]
- Seçer, I. SPSS ve LISREL ile Pratik Veri Analizi: Analiz ve Raporlaştırma; Anı Yayıncılık: Ankara, Türkiye, 2015. [Google Scholar]
- George, D.; Mallery, P. IBM SPSS Statistics 26 Step by Step: A Simple Guide and Reference, 16th ed.; Routledge: New York, NY, USA, 2019. [Google Scholar]
- Güven, E. The Effect of Project-Based Learning Method Supported by Prediction-Observation-Explanation on Different Variables in Environmental Education and Students’ Views Concerning This Method. Ph.D. Dissertation, Gazi University, Ankara, Türkiye, 2011. [Google Scholar]
- Yücel, E.Ö.; Özkan, M. Development of environmental attitudes scale for secondary school students. J. Uludag Univ. Fac. Educ. 2014, 27, 27–48. [Google Scholar] [CrossRef] [Scilit]
- Ministry of National Education (MoNE). Science Curriculum; Ministry of National Education: Ankara, Türkiye, 2018.
- Field, A. Discovering Statistics Using IBM SPSS Statistics, 5th ed.; SAGE Publications: London, UK, 2018. [Google Scholar]
- Tabachnick, B.G.; Fidell, L.S. Using Multivariate Statistics, 7th ed.; Pearson: New York, NY, USA, 2019. [Google Scholar]
- Çakır, A. An Investigation of Middle School Students’ Attitudes and Awareness of Water Use. Master’s Thesis, Afyon Kocatepe University, Afyonkarahisar, Türkiye, 2016. [Google Scholar]
- Çakır Yıldırım, B.; Karaarslan Semiz, G. Future teachers’ sustainable water consumption behavior: A test of the value-belief-norm theory. Sustainability 2019, 11, 1558. [Google Scholar] [CrossRef] [Scilit]
- Barreiros, A.M.; Durão, A.; Galvão, A.; Matos, C.; Mateus, D.; Araújo, I.; Neves, L.; Mourato, S. Higher education institutions’ students’ literacy in sustainable use of potable water. Sustainability 2024, 16, 5217. [Google Scholar] [CrossRef] [Scilit]
- Kuruppuarachchi, J.; Hemadila, P.; Madurapperuma, B. Comparison of the literacy level on major environmental issues of the G.C.E. (A/L) students of different disciplines in Kandy District, Sri Lanka. Sustainability 2023, 15, 3968. [Google Scholar] [CrossRef] [Scilit]
- Svobodová, S.; Chval, M. Environmental literacy of lower secondary school pupils in the Czech Republic. J. Biol. Educ. 2024, 58, 383–405. [Google Scholar]
- Kang, T. Construction and empirical analysis of citizens’ water literacy evaluation index system: A structural equation model. Water Resour. Manag. 2022, 36, 1393–1411. [Google Scholar] [CrossRef] [Scilit]



Disclaimer/Publisher’s Note: The statements, opinions and data contained in all publications are solely those of the individual author(s) and contributor(s) and not of MDPI and/or the editor(s). MDPI and/or the editor(s) disclaim responsibility for any injury to people or property resulting from any ideas, methods, instructions or products referred to in the content. |
© 2026 by the authors. Licensee MDPI, Basel, Switzerland. This article is an open access article distributed under the terms and conditions of the Creative Commons Attribution (CC BY) license.