


Abstract
Using an upstream tailings pond in Beijing as the prototype, this study constructed a 1:150 physical model to investigate the internal response and overtopping failure evolution of tailings dams under continuous rainfall (T1) and intermittent rainfall (T2). The results showed that the cumulative rainfall duration at failure in T2 was approximately 11.1% shorter than that in T1. The duration from local overtopping to overall failure in T2 was 40% shorter than that in T1. Under T2, during the first rainfall interval, the average rise rates of the phreatic line, volumetric water content, pore water pressure, and earth pressure were approximately 0.35, 0.42, 0.29, and 0.32 times the corresponding rise rates under T1, respectively. During the second rainfall interval, the average decline rates of the phreatic line, pore water pressure, and earth pressure were approximately 1.83, 2.79, and 3.52 times the corresponding rise rates under T1, respectively. Overtopping failure under both rainfall patterns was a composite instability process controlled by internal seepage weakening and overtopping erosion. The process can be divided into four stages: toe seepage, dam deformation, local overtopping, and overall sliding failure. These findings indicate that rainfall pattern and internal response should be considered in tailings dam risk identification.
1. Introduction
Tailings ponds are engineering facilities with high potential energy that store tailings produced during mineral processing and other industrial wastes [1]. Once a failure occurs, it can seriously threaten the life and property safety of downstream residents and the ecological environment [2,3,4,5]. With the continuous development of mineral processing technology, tailings particles have become increasingly fine, and annual tailings production has continued to increase. As a result, safety risks in large, high tailings dams dominated by fine-grained tailings have become increasingly prominent. Statistics show that heavy rainfall is a major trigger of dam deformation and failure [6,7,8,9]. Heavy rainfall can raise the water level in the reservoir area and shorten the dry beach length. This can promote breach formation and expansion, leading to dam instability and eventual failure [10]. Therefore, it is necessary to investigate the overtopping failure process under heavy rainfall to provide technical support for safety monitoring and control.
Previous studies have examined the instability of tailings dams under rainfall through theoretical analysis and numerical simulation. Koyama et al. [11] and Cheng et al. [12] combined the limit equilibrium method with seepage analysis. They showed that the minimum safety factor decreases with increasing rainfall. Wang et al. [13] used a critical rainfall pattern curve (CRPC) and showed that a higher saturated permeability coefficient corresponds to a higher safe rainfall intensity. Lin et al. [14], Kang et al. [15], and Zhu et al. [16] further examined seepage characteristics and pore water pressure variations under rainfall conditions. These studies indicate that rainfall infiltration gradually increases the degree of saturation of tailings.
In terms of physical model tests, Wang et al. [17] found that the variation in the phreatic line in tailings dams clearly lagged behind the change in water level during the initial stage of rainfall. Experiments by Hu et al. [18] and Wang et al. [19] showed that an increase in pore water pressure can trigger tailings particle migration and further induce local liquefaction. Wu et al. [20] and Gui et al. [21] investigated the evolution of the internal seepage field of dam bodies under different rainfall intensities and durations. Their results showed a positive correlation between surface pore water pressure and rainfall duration. In addition, monitoring indicators such as volumetric water content and earth pressure have also been used to reflect internal water migration and changes in the stress state of tailings dams [22,23,24]. Many scholars have also investigated the overtopping failure evolution of tailings dams under continuous rainfall conditions. These studies involved the formation and expansion of breaches, erosion of the dam slope, and the division of the dam failure process into stages [25,26,27,28]. Physical model tests have become an important approach in tailings dam research [28,29,30].
However, the above studies were mostly based on continuous rainfall conditions. Natural rainfall events are often intermittent. In recent years, the influence of intermittent rainfall on slope stability has gradually attracted attention. Wang [31] and Zhang et al. [32] showed that intermittent rainfall affects soil infiltration, pore water pressure response, and the evolution of slope stability. Jayakody et al. [33] indicated that, even under the same cumulative rainfall, the intermittent rainfall pattern can change the initiation time of slope instability. Zhong et al. [34] showed through physical model tests that slope failure may occur during rainfall intervals. Yang et al. [35] further indicated that intermittent rainfall has a clear cumulative effect on slope displacement and pore water pressure, and that this effect becomes stronger as the rainfall interval shortens. These studies suggest that intermittent rainfall may cause re-infiltration and staged drainage. These processes may also affect the internal response and instability path of tailings dams.
Overall, previous studies have revealed the influence of continuous rainfall on tailings dam instability from the perspectives of internal response and external failure evolution. However, compared with continuous rainfall, systematic understanding of the internal response and overtopping failure evolution of tailings dams under intermittent rainfall remains limited. To address this gap, this study conducted two 1:150 physical model tests based on an upstream tailings pond in Beijing. This study focuses on the internal response characteristics and overtopping failure evolution of the tailings dam under different rainfall patterns. The analysis further examines the stage transitions and instability mechanism.
2. Materials and Methods
2.1. Prototype Overview
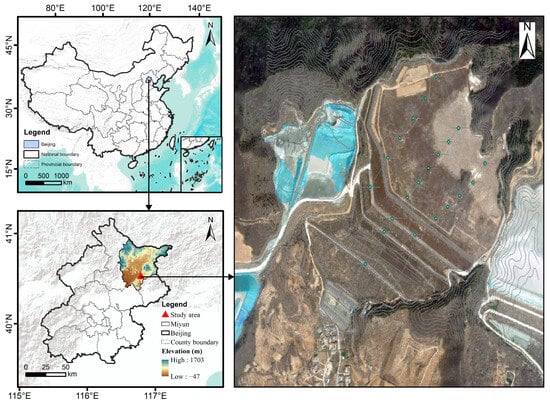
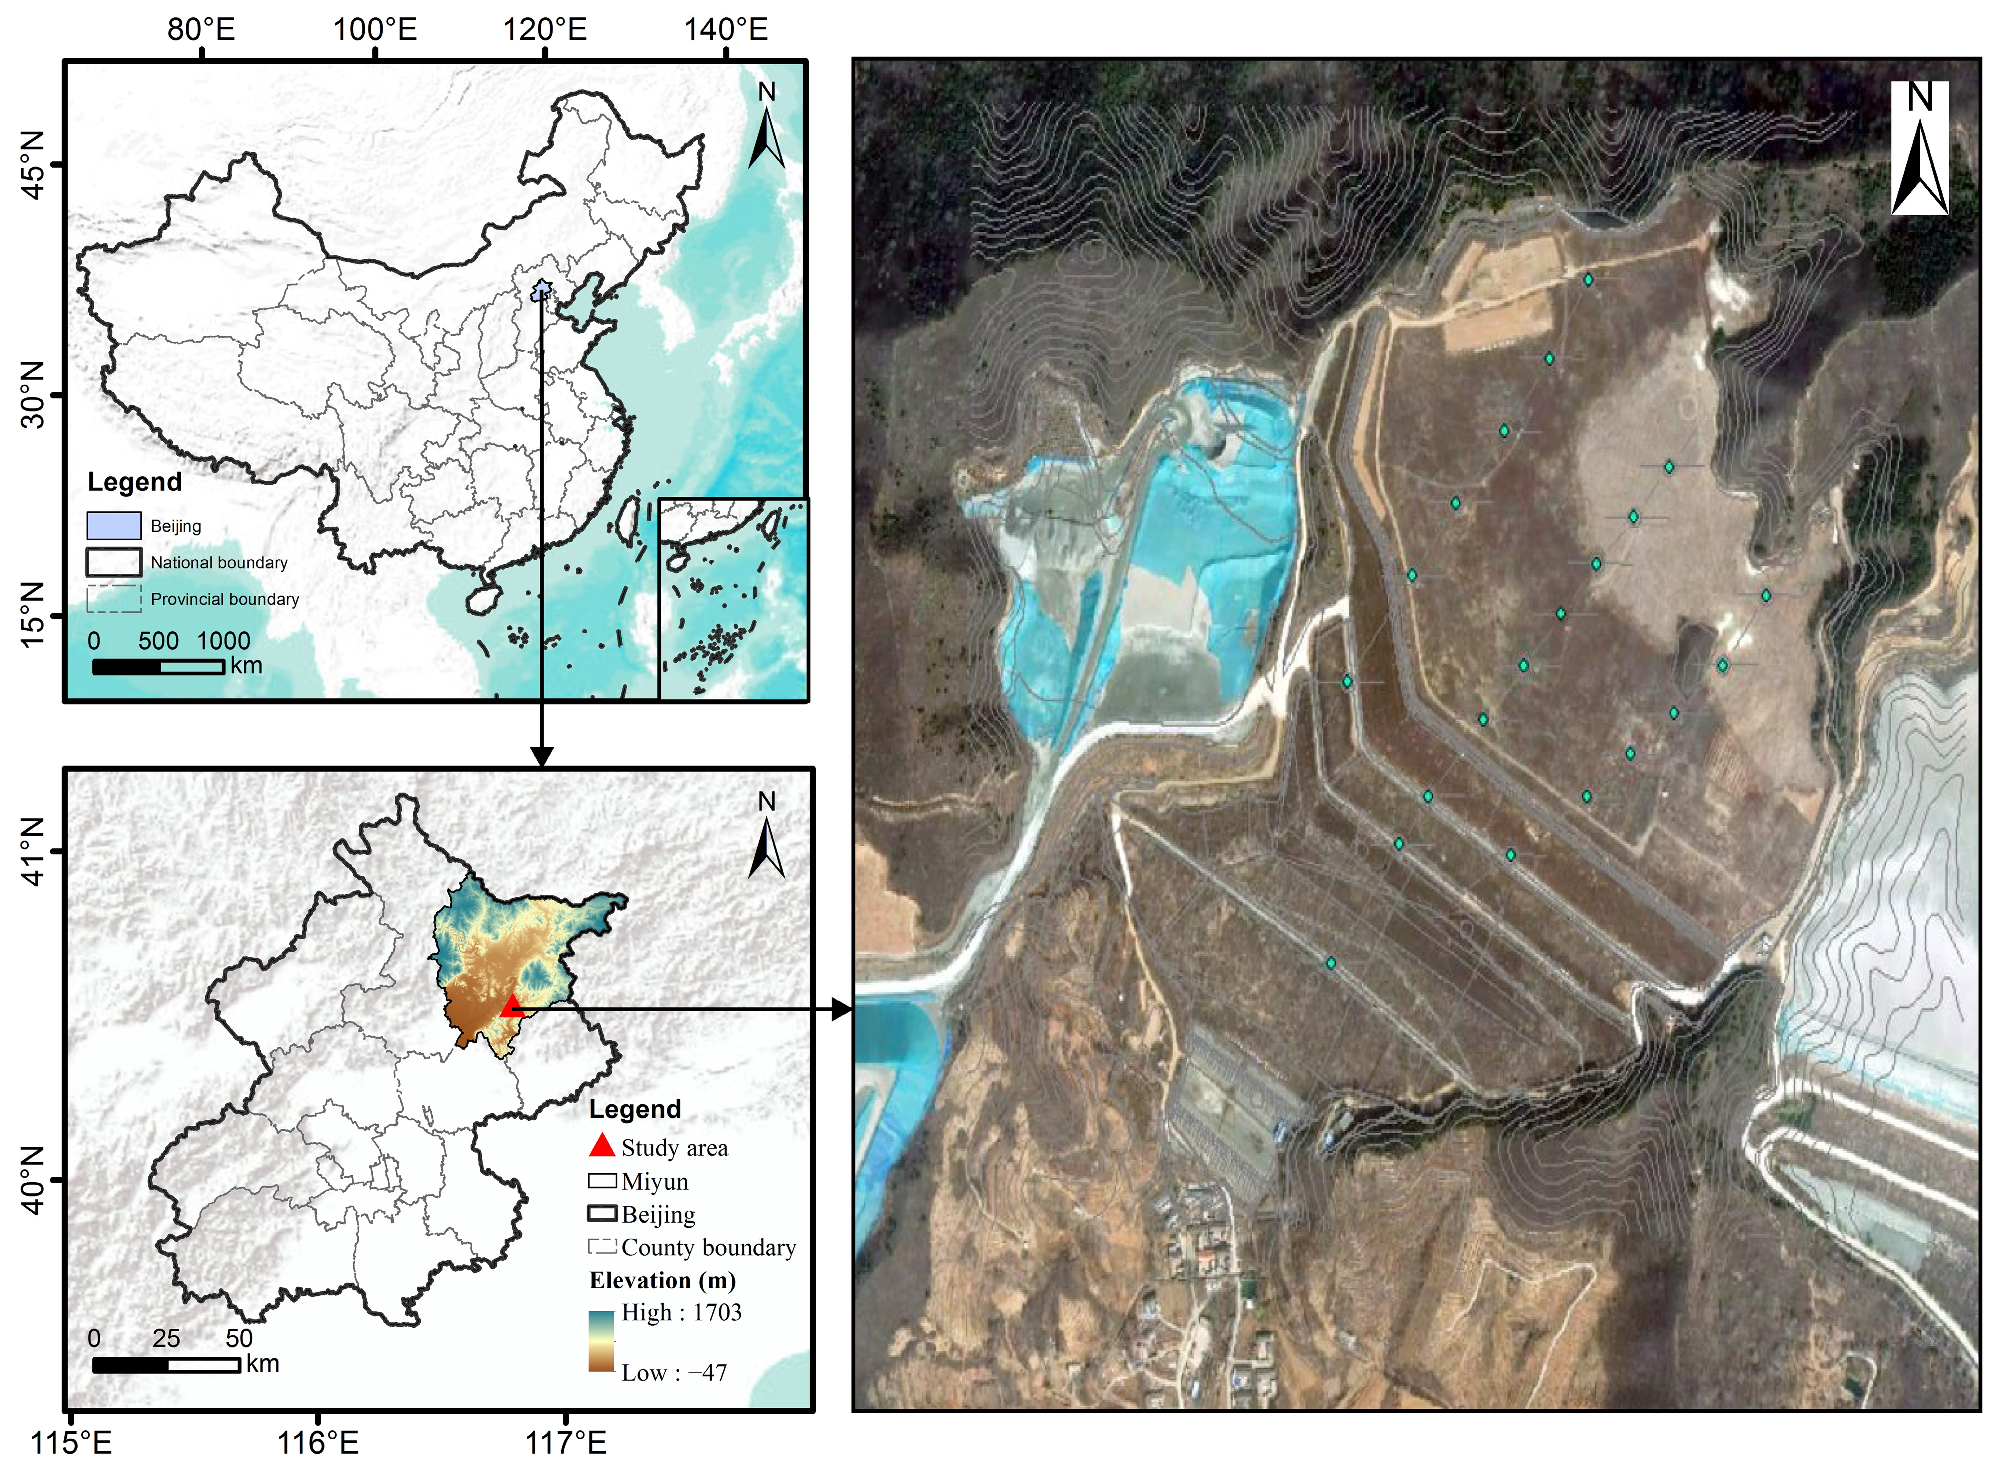
This study focused on an upstream tailings pond located in Miyun District, Beijing, China. Figure 1 shows the location and setting of the prototype tailings pond. The accumulation dam had a crest elevation of 230 m. The total dam height, initial dam height, and total storage capacity of the tailings pond were 82.5 m, 43.5 m, and approximately 9.1 million m3, respectively. According to the current classification standard, the tailings pond was classified as Grade III. The slope ratio of the initial dam was 1:1, whereas that of the outer slope of the accumulation dam was 1:4.16. The pond area is located in a low- to medium-elevation mountainous region and is surrounded by mountains on three sides. The gully topography is distinct, extending from northeast to southwest, with generally higher terrain in the north and lower terrain in the south. Rainfall in this area is strongly seasonal, and intense rainfall events occur mainly during the flood season. Under such gully terrain conditions, short-duration rainstorms can readily generate concentrated runoff.
Figure 1.
Location and topographic setting of the prototype tailings pond.
2.2. Model Size Design
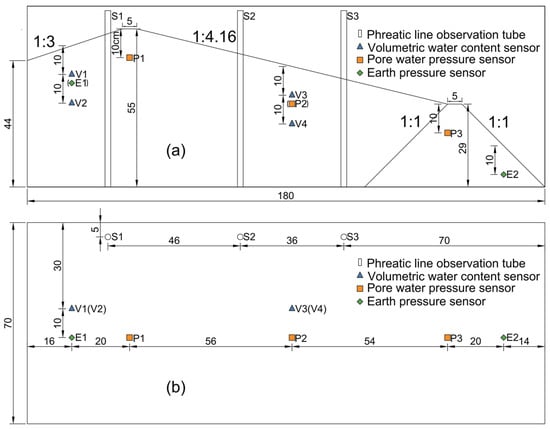
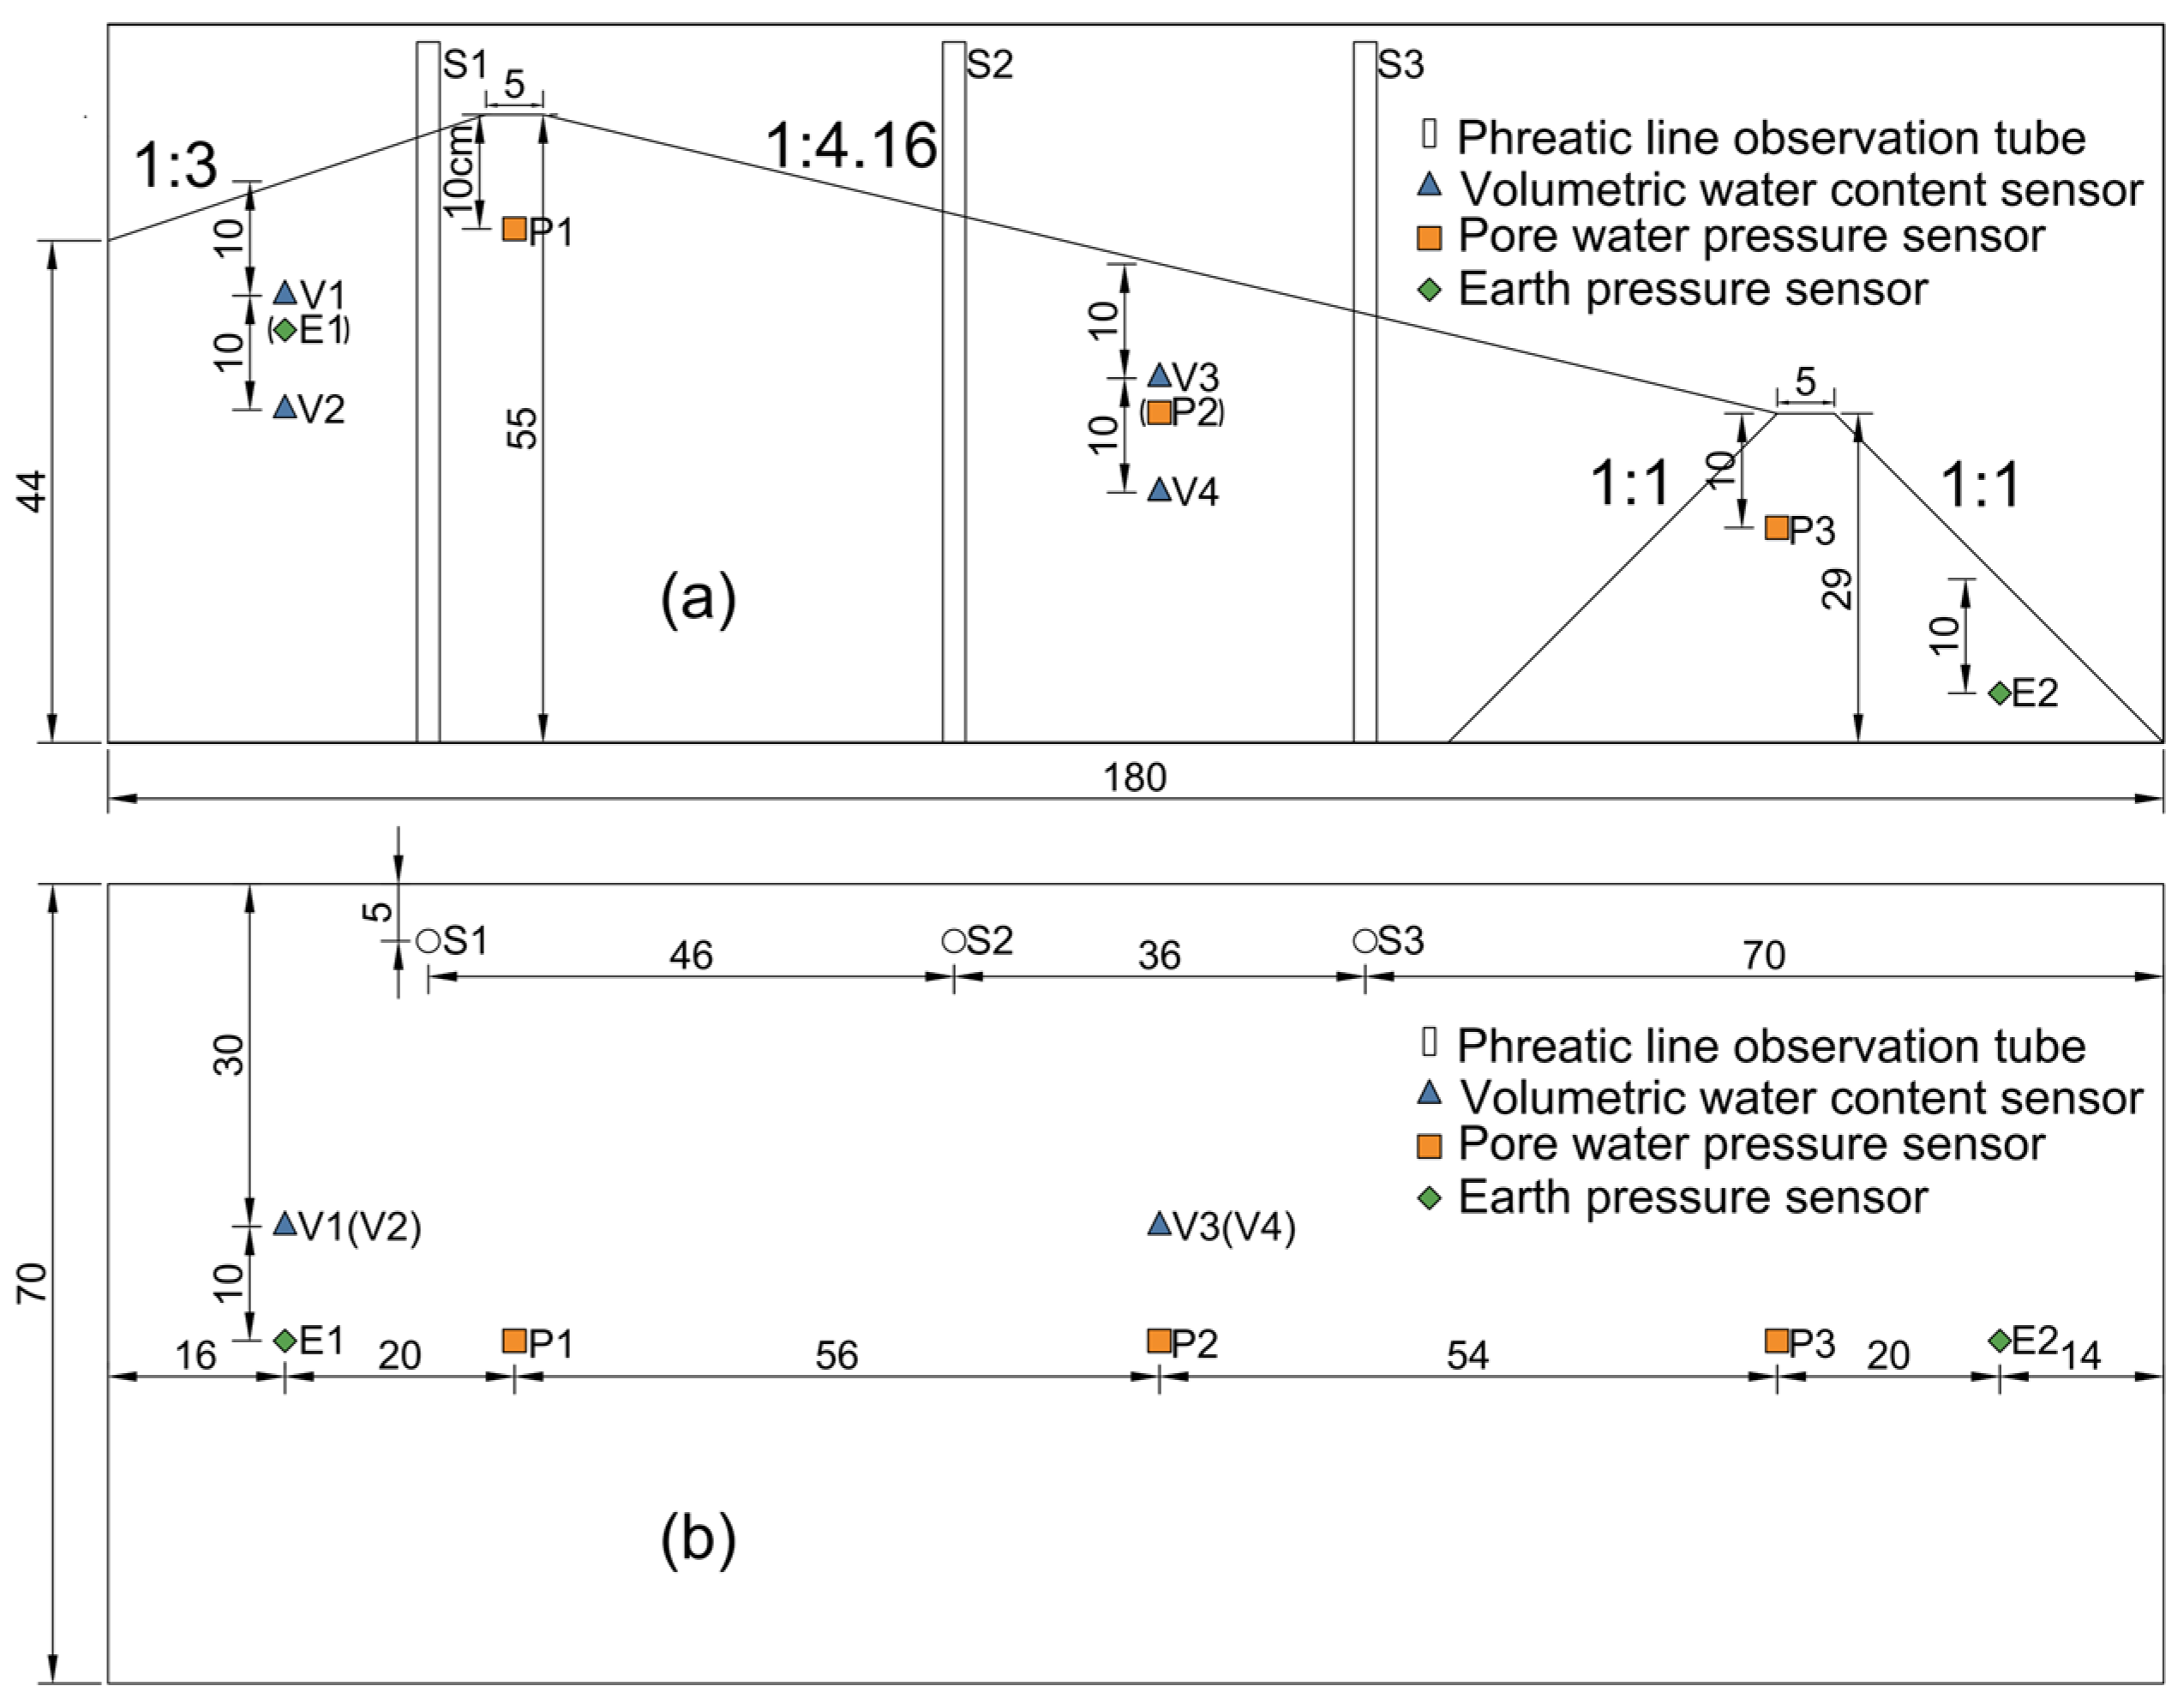
Overtopping failure of a tailings dam is mainly controlled by the upstream hydraulic head and the state of tailings in the near-dam area. Therefore, a key zone measuring 270 m × 105 m was selected from the prototype tailings pond. The prototype was locally simplified for physical modeling, and the upstream reservoir area was generalized as a 1:3 storage slope section. Based on the principles of similarity theory, the geometric scale of the model was set to 1:150. Accordingly, an experimental model measuring 180 cm × 55 cm × 70 cm was constructed in the flume, and the detailed model dimensions are shown in Figure 2.
Figure 2.
Model dimensions and monitoring layout: (a) longitudinal section; (b) top view. All linear dimensions are in cm.
The failure process of a tailings pond is complex, involving water erosion, dam instability, and the evolution of water–tailings flow. Full similarity is difficult to achieve [17]. This study focuses on comparative tests under continuous and intermittent rainfall. During overtopping, the flow over the dam crest is mainly controlled by gravity and inertia. Therefore, the Froude criterion was adopted as the main hydrodynamic similarity criterion. Table 1 lists the main similarity ratios.
Table 1.
Main similarity scales used in the model tests.
2.3. Experimental Apparatus
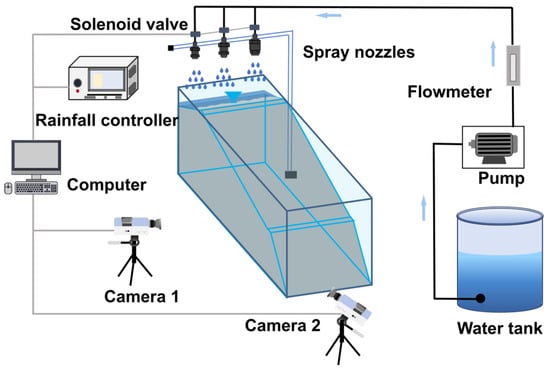
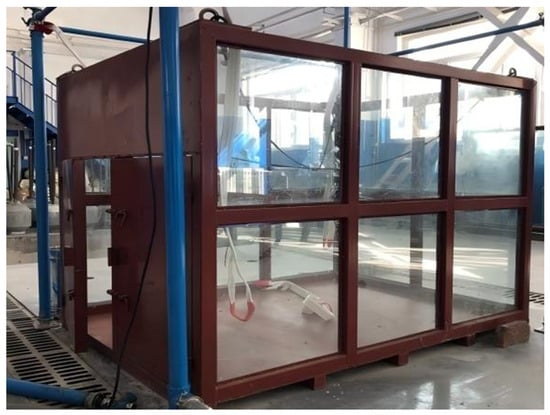
The indoor experimental apparatus consisted of a model flume, a rainfall system, a monitoring system, a control console, and a water tank, as shown in Figure 3. This apparatus was capable of simulating different rainfall scenarios and synchronously acquiring monitoring data during the experiment. Before the formal tests, the rainfall system was calibrated through preliminary tests. The system was equipped with three types of nozzles. By adjusting the nozzle flow rate and water supply pressure, the average rainfall intensity over the model was kept close to the target value. As shown in Figure 4, the model flume measured 2000 mm × 1500 mm × 1500 mm (length × width × height). Three sides of the flume were made of Plexiglas, which facilitated observation of rainfall infiltration and the entire failure evolution of the tailings dam.
Figure 3.
Experimental apparatus.
Figure 4.
Model flume.
2.4. Experimental Materials and Model Construction
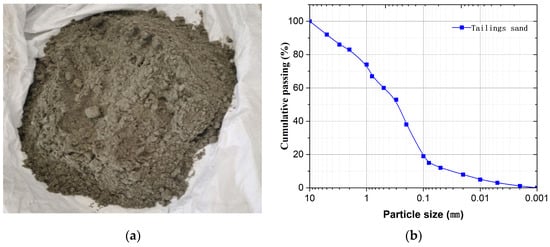
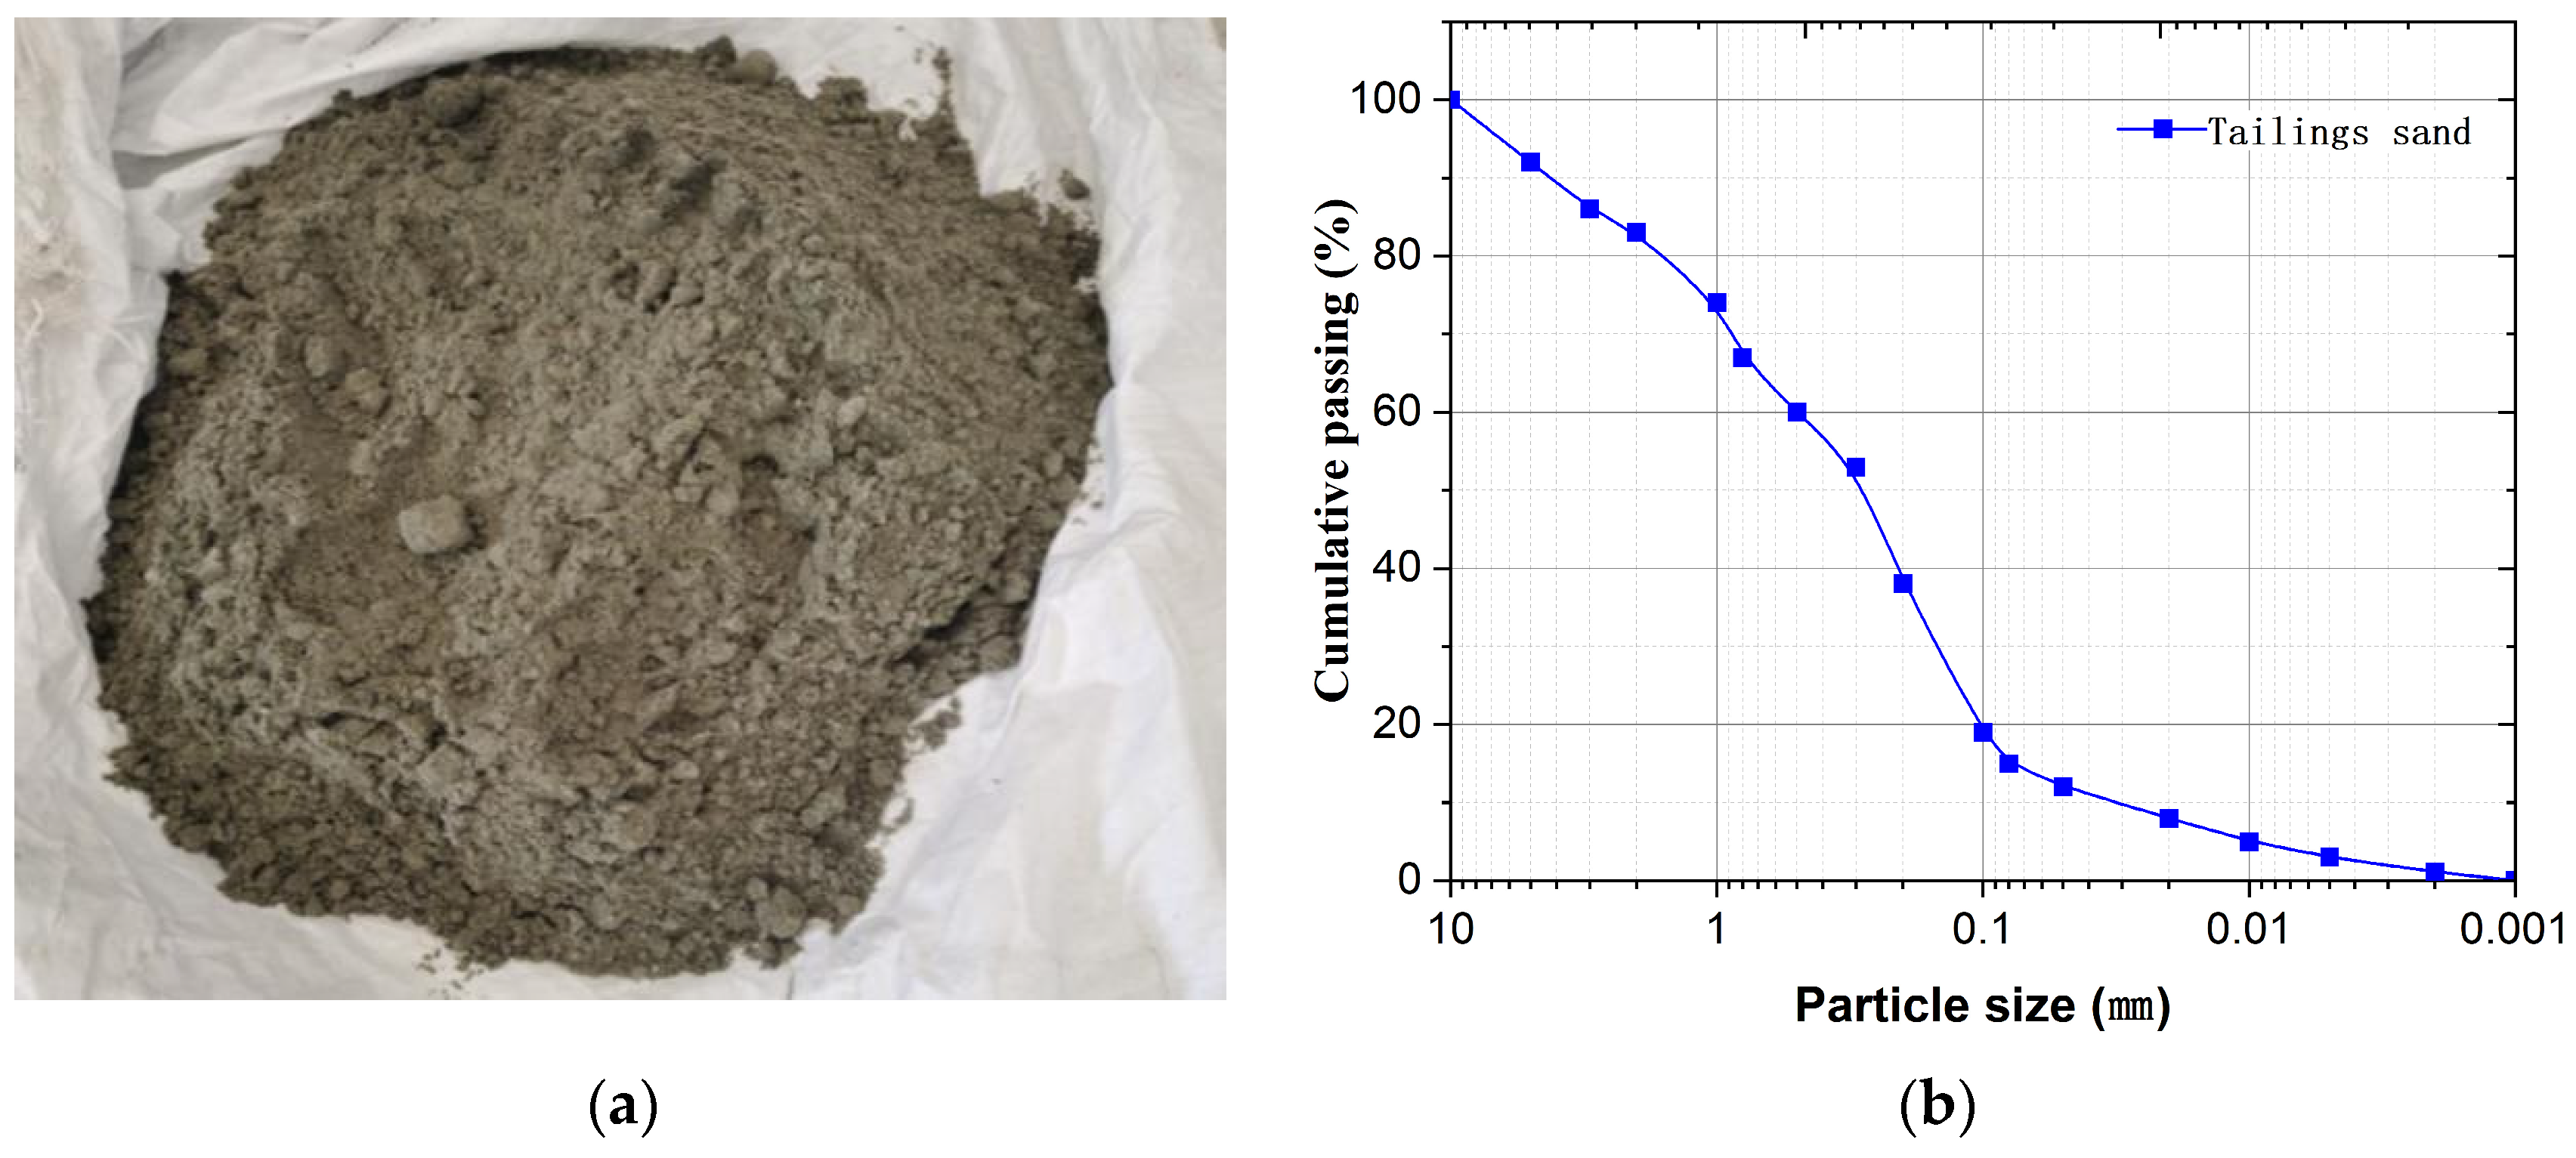
The tailings sand used in the experiment was collected from the target tailings dam. To determine its basic physical properties, particle-size distribution analysis and physical and mechanical property tests were conducted in accordance with the Standard for Geotechnical Testing Method (GB/T 50123-2019) [36]. The main physical and mechanical parameters of the tailings sand under the target filling state of the model are listed in Table 2. The particle-size distribution curve is shown in Figure 5. The coefficient of uniformity and coefficient of curvature of the tailings sand were 10.67 and 1.76, respectively. According to the engineering classification standard for soils, the material was classified as well-graded fine sand.
Table 2.
Physical and mechanical parameters of the model tailings sand at the target filling state.
Figure 5.
Tailings sand used in the experiment and particle size distribution: (a) tailings sand sample; (b) particle size distribution curve.
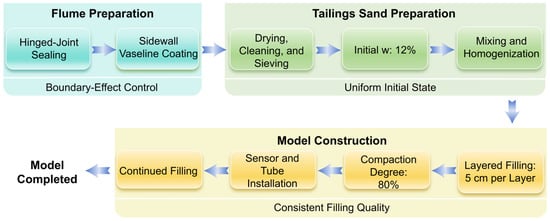
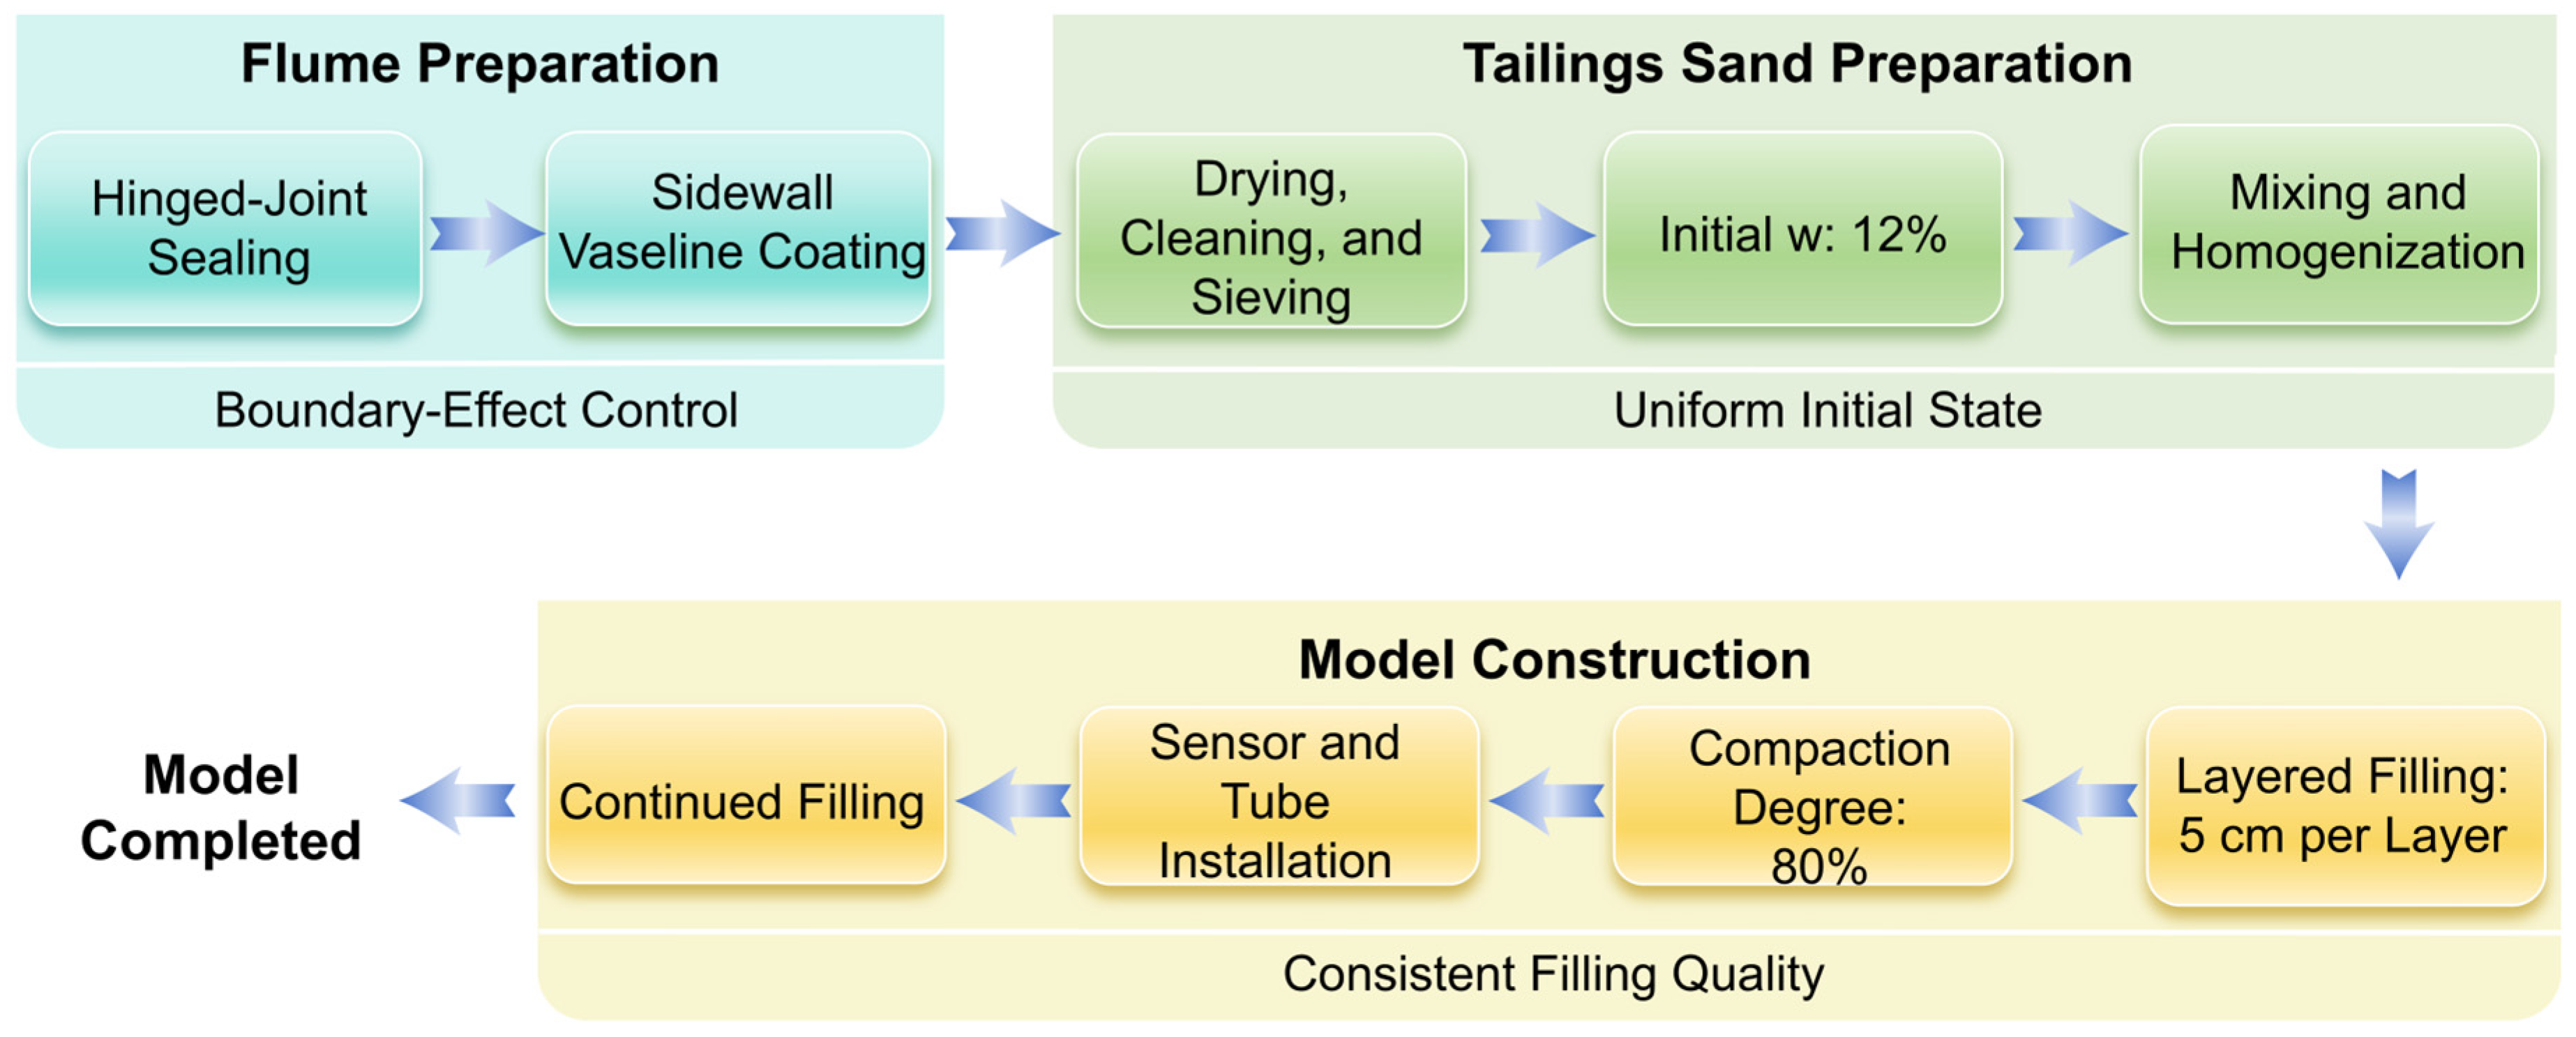
To reduce boundary effects, all hinged joints of the flume were sealed with waterproof epoxy resin before model filling. Vaseline was also applied to the inner sidewalls of the flume to reduce sidewall friction. The detailed filling process of the tailings dam model is shown in Figure 6.
Figure 6.
Flowchart of tailings dam model construction. Note: w denotes gravimetric water content.
2.5. Experimental Scheme
The prototype reservoir area is located in mountainous gully terrain, where short-duration intense rainfall can readily cause rapid runoff concentration and water-level rise in the pond. Therefore, a rainfall intensity of 120 mm/h was selected. During the experiment, it was assumed that the drainage facilities of the tailings pond could not effectively discharge floodwater. The water level in the reservoir area was not controlled by an external constant head. Instead, it rose naturally due to rainfall inflow. The water level then gradually rose above the dam crest and ultimately triggered overtopping failure. This study adopted a controlled-variable design and included two test scenarios, T1 and T2. T1 represented a continuous rainfall scenario, with an effective rainfall duration of 106 min and a total test duration of 106 min. T2 represented an intermittent rainfall scenario. Rainfall was applied during 0–30, 40–70, and 80–116 min. Rainfall was suspended during two rainfall suspension intervals, namely 30–40 min and 70–80 min. These two suspension periods are hereafter referred to as the first and second rainfall intervals. The detailed test scheme is listed in Table 3.
Table 3.
Experimental scheme for the T1 and T2 rainfall scenarios.
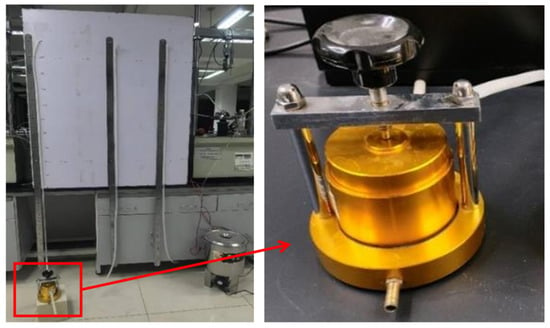
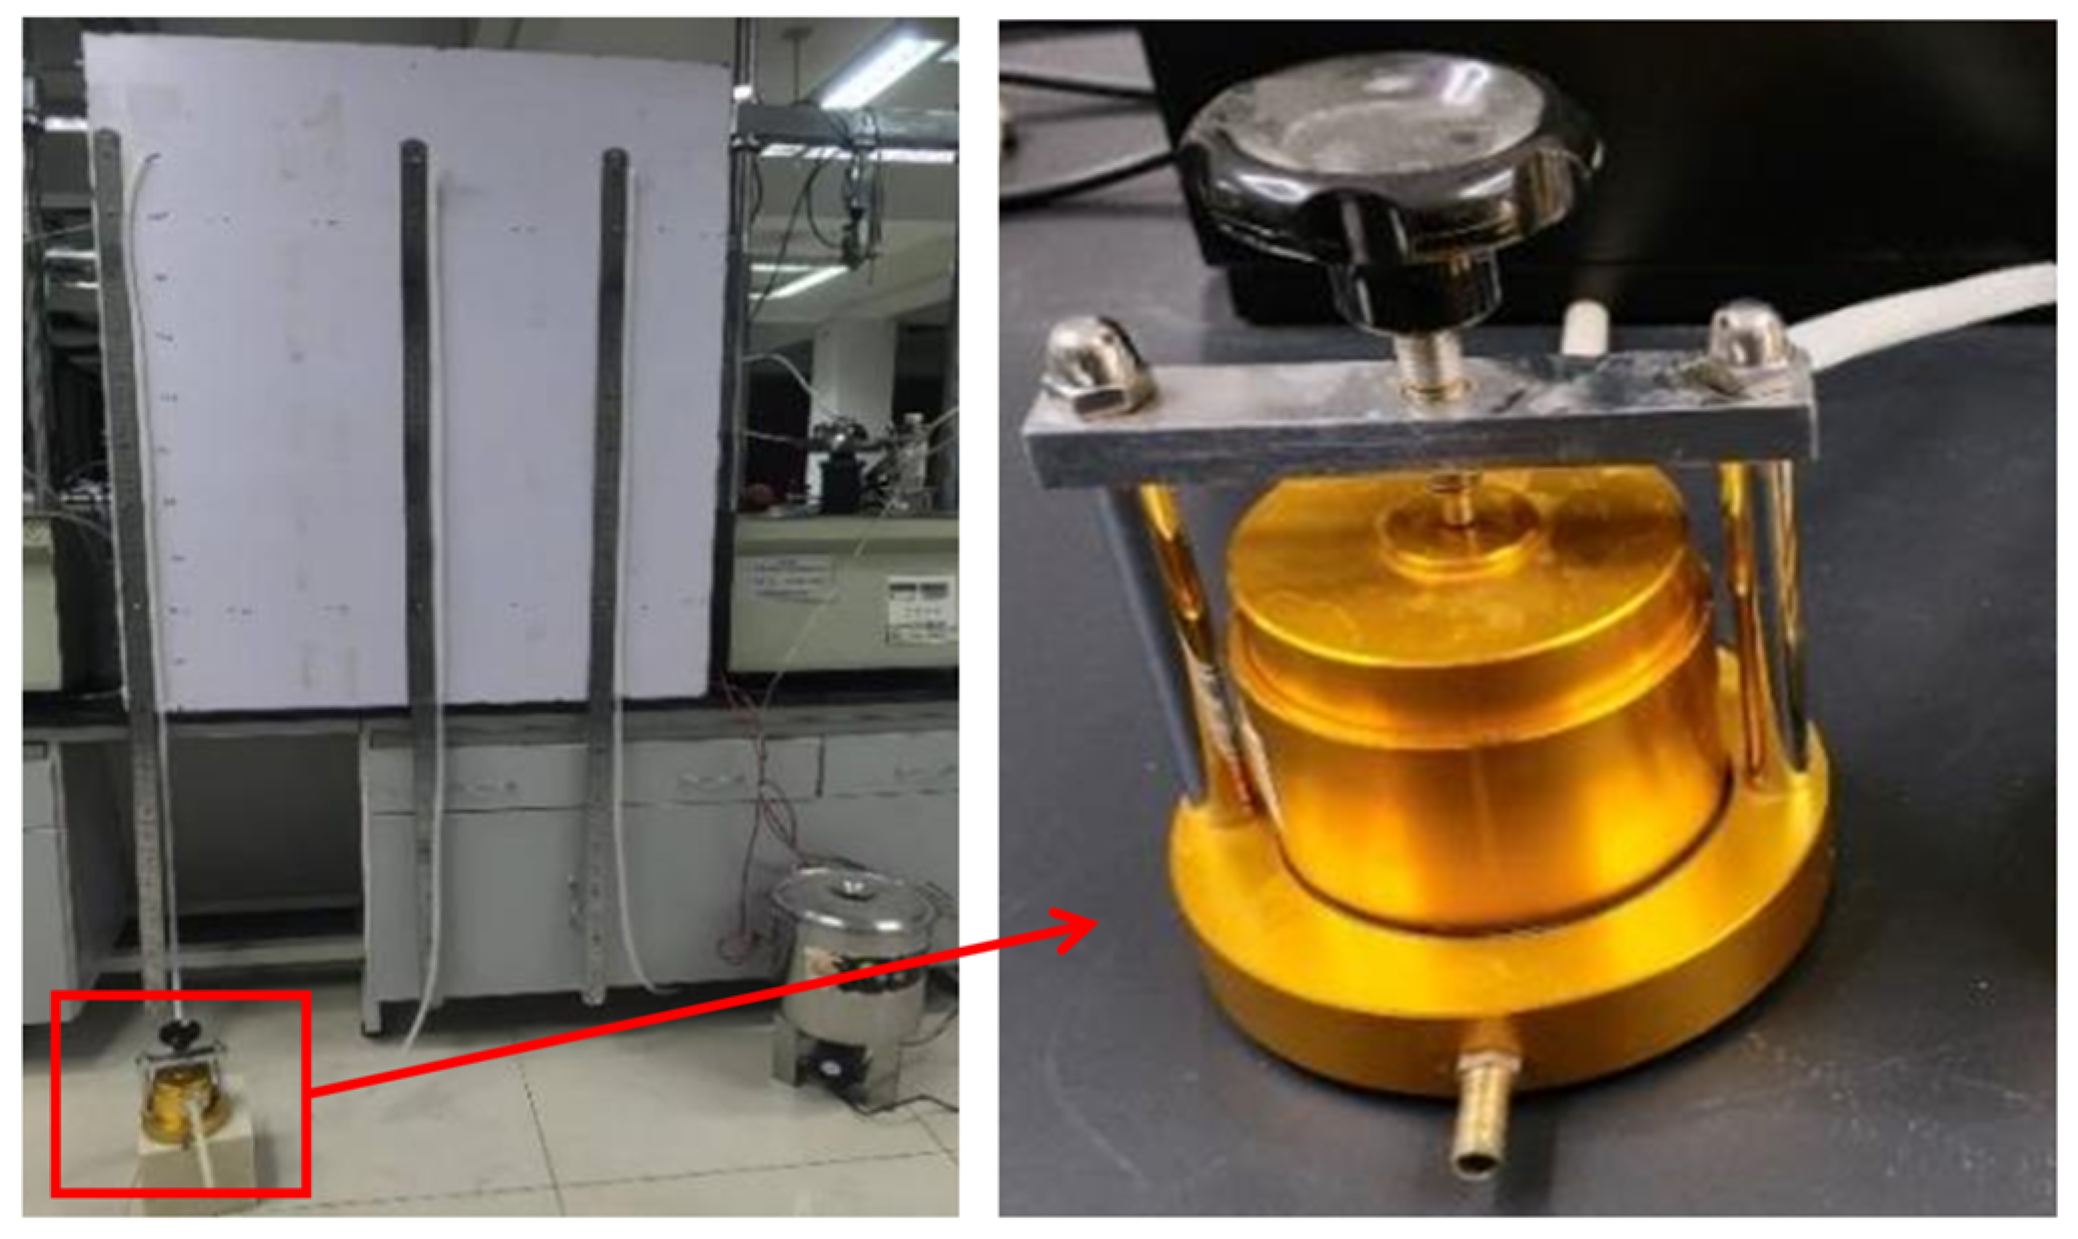
To verify the consistency of the initial filling quality between the T1 and T2 experimental models, three groups of specimens were collected from the compacted filling layers of each model during model construction. The specimens were tested for compaction degree and permeability coefficient. Considering the relatively high fine-particle content of the model tailings sand, the permeability coefficient was determined using the falling-head method. The falling-head permeability test apparatus is shown in Figure 7. This method was adopted to reduce measurement errors under low-flow conditions. The test results are listed in Table 4. The average compaction degree and average permeability coefficient of the T1 and T2 specimens were close. These results indicate that the initial filling quality of the two models was basically consistent.
Figure 7.
Falling-head permeability test apparatus.
Table 4.
Compaction degree and permeability coefficient of the T1 and T2 specimens.
2.6. Monitoring Layout
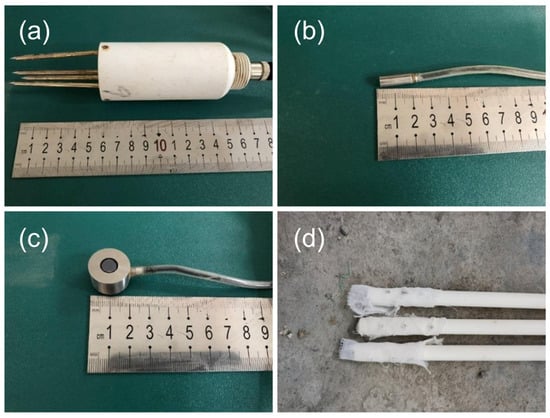
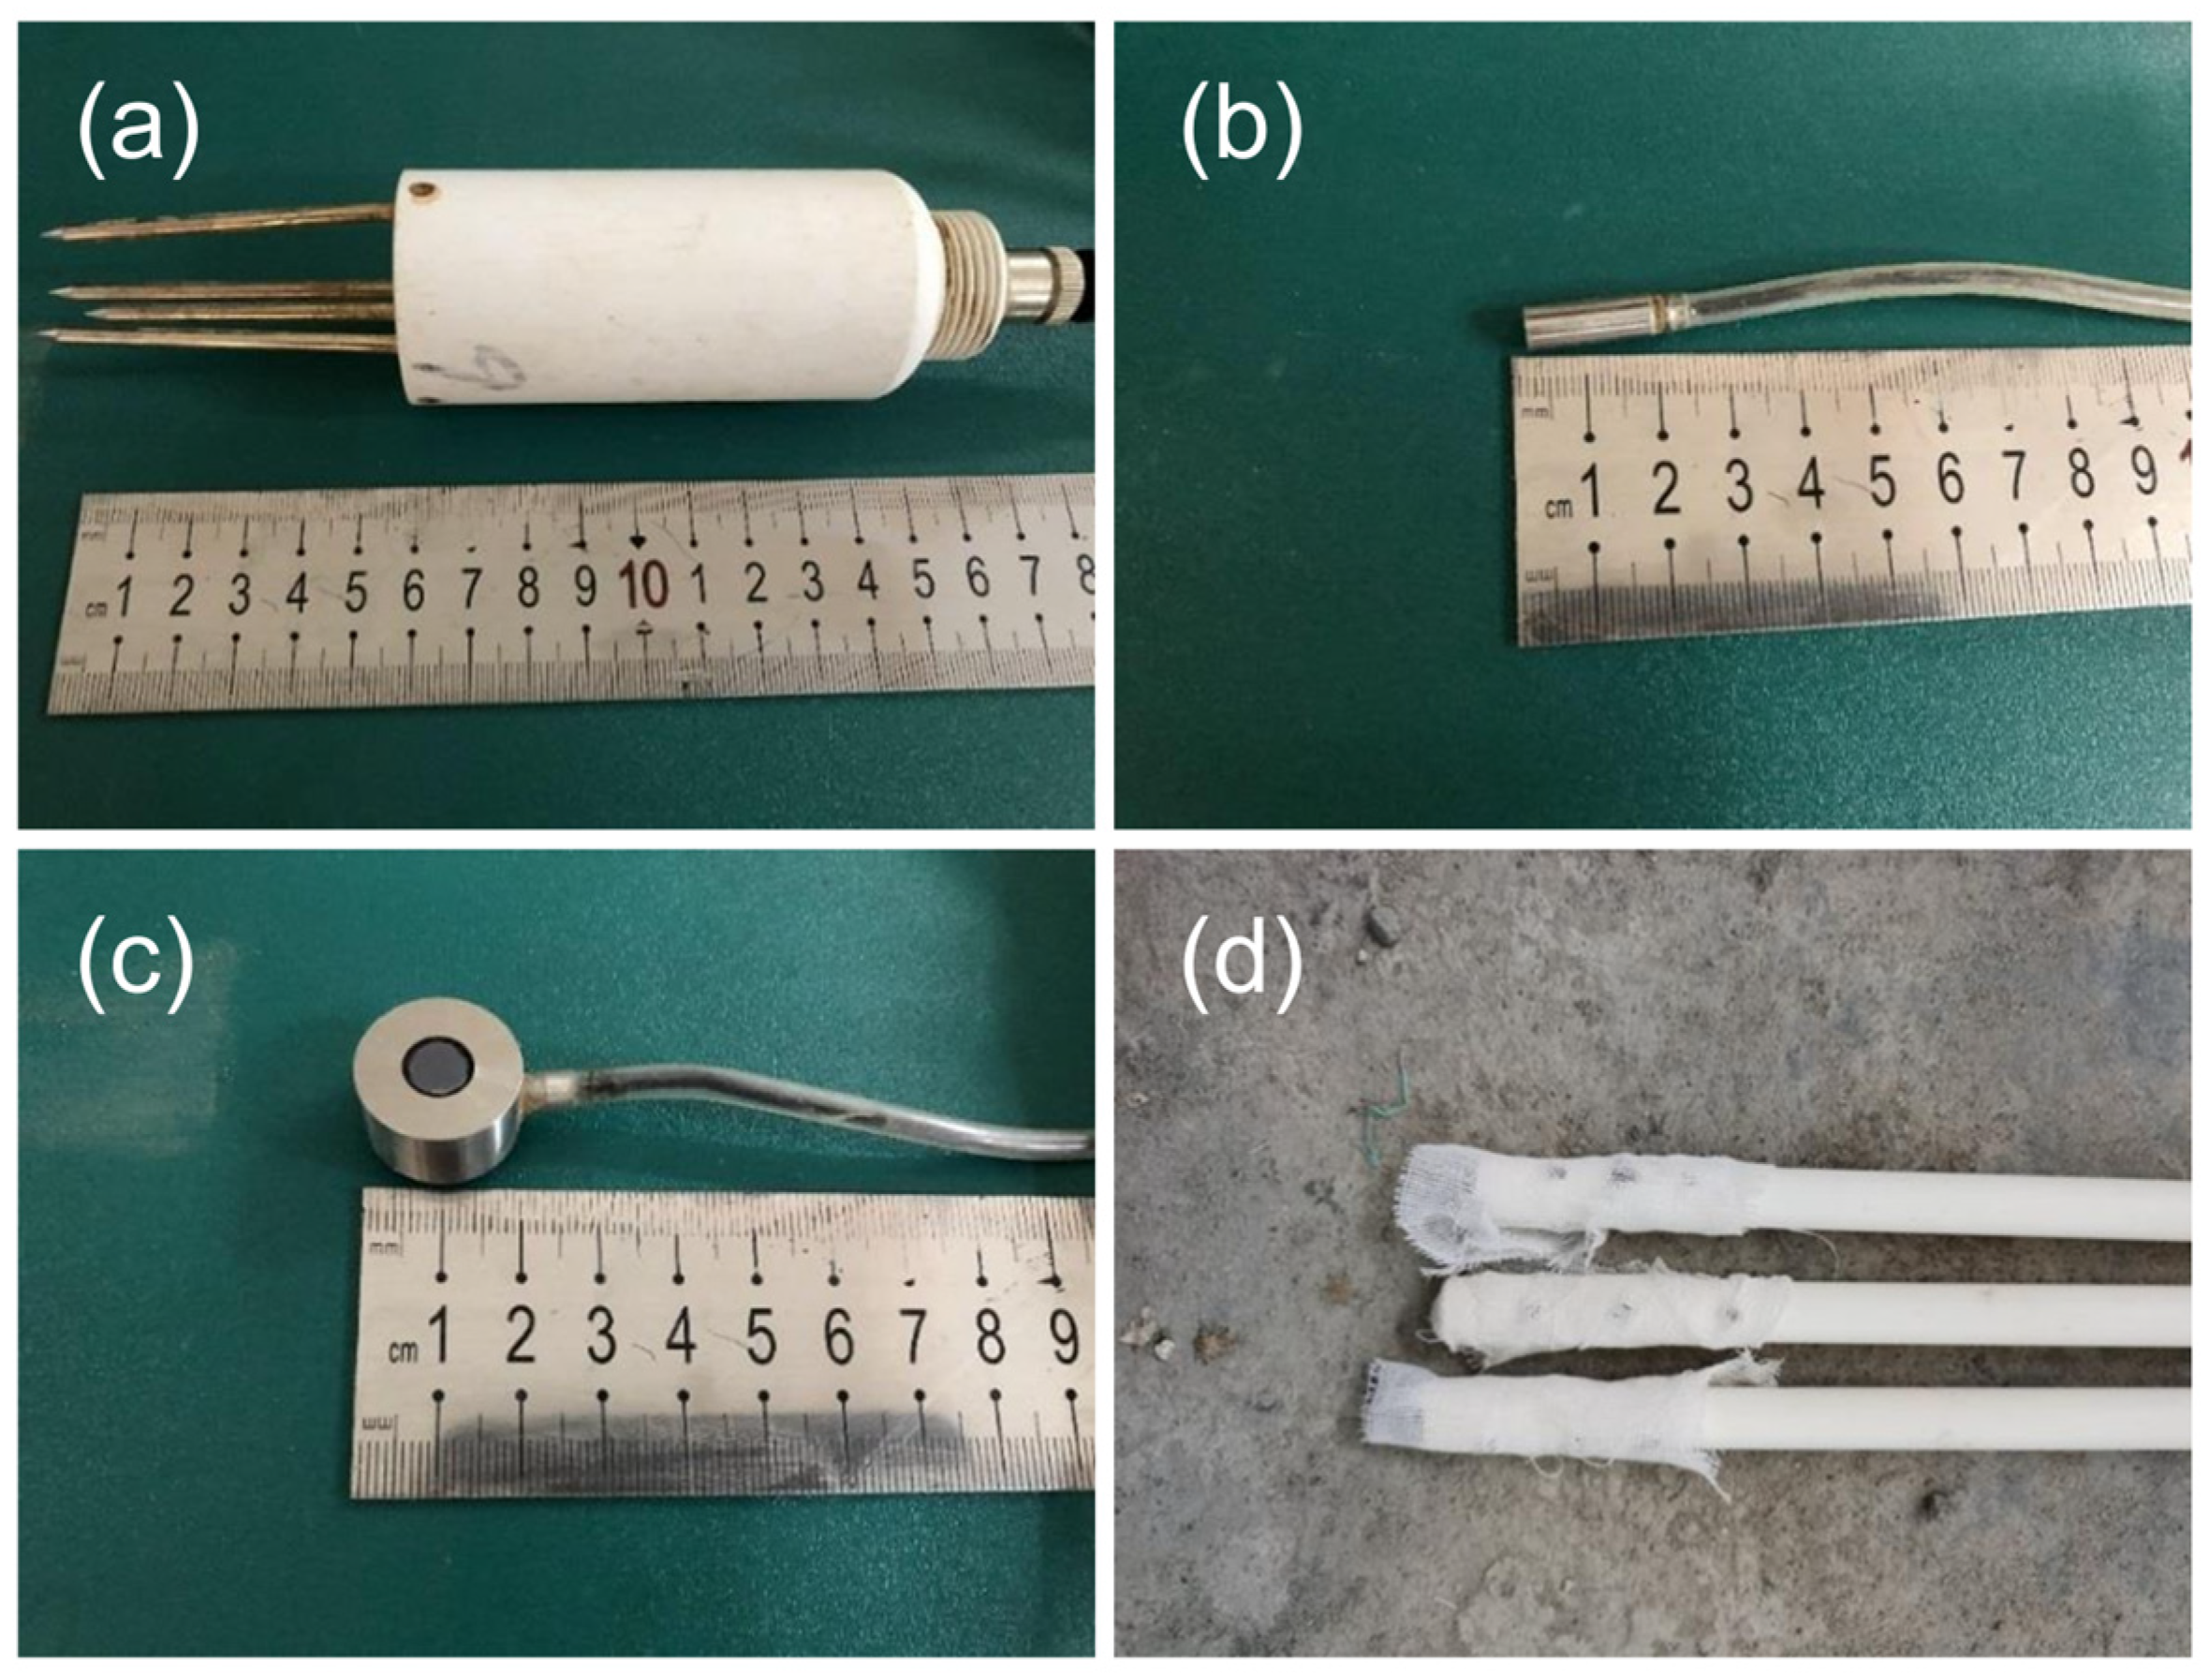
To monitor the internal evolution of the tailings dam during rainfall, several monitoring devices were installed in the model. Volumetric water content was monitored using CSF11 sensors (Star Sensor, Xi’an, China), with a measurement range of 0–60% and a measurement accuracy of ±2%. Pore water pressure was monitored using HC-25 pore water pressure sensors (Beijing Hengrui Changtai Technology Co., Ltd., Beijing, China), with a range of −25–25 kPa and an accuracy of 0.2%. Earth pressure was monitored using HC-16 miniature earth pressure sensors (Beijing Hengrui Changtai Technology Co., Ltd., Beijing, China), with a range of 0–100 kPa and an accuracy of 0.3% of the full scale. In addition, the test used custom-made observation tubes to monitor the phreatic line. Changes in the color-change position of the moisture-sensitive paper were used to record the temporal evolution of the phreatic line. A connectivity test ensured the accuracy of the observations. Photographs of the monitoring devices are shown in Figure 8. Prior to the tests, all sensors were checked for their initial readings and stability. The data acquisition system was also tested under no-load conditions to confirm the normal operation of all acquisition channels.
Figure 8.
Photographs of the monitoring devices used in the experiment: (a) volumetric water content sensor; (b) pore water pressure sensor; (c) earth pressure sensor; (d) phreatic line observation tube.
The monitoring points were arranged from the reservoir area to the dam slope and dam toe. The volumetric water content sensors were arranged in upper and lower layers, with a vertical spacing of 10 cm between the two layers. To avoid mutual influence between sensors, a horizontal spacing of 10 cm was maintained between each volumetric water content sensor and the adjacent pore water pressure and earth pressure monitoring points. To maintain consistent installation conditions, the burial depth of the upper sensors was set to 10 cm. Three phreatic line observation tubes were installed on one side of the model, 5 cm away from the flume sidewall. The detailed layout of the monitoring points is shown in Figure 2.
Four volumetric water content sensors (V1–V4) were installed in the reservoir area (V1 and V2) and the middle part of the dam slope (V3 and V4). Three pore water pressure sensors (P1–P3) were embedded in the upper part of the reservoir area, the middle part of the dam slope, and the lower part of the dam slope, respectively. Two earth pressure sensors (E1 and E2) were installed in the reservoir area and at the dam toe, respectively. In addition, three phreatic line observation tubes (S1–S3) were successively arranged in the reservoir area, the upper-middle part of the dam slope, and the lower-middle part of the dam slope.
2.7. Data Processing
Data from all electronic sensors were continuously collected at a sampling interval of 3 s. These data were synchronized with the test start time and video records. The raw data were first checked, and values outside the sensor measurement range, missing values, and isolated spikes that clearly deviated from the local continuous trend were removed. To reduce the influence of instantaneous fluctuations, the valid raw data points within each 1 min time window were averaged. The averaged values were used to plot temporal variation curves and calculate quantitative indicators. The phreatic line height was read at 5 min intervals according to the color-change position of the moisture-sensitive paper in the observation tubes. Straight line segments were used to connect adjacent readings. Data plotting was performed using OriginPro (Version 2021, OriginLab Corporation, Northampton, MA, USA).
To quantify the temporal response of each monitoring indicator, the rate of change was calculated as the change in the monitored value at a single monitoring point divided by the corresponding time interval. For the i-th monitoring point of the m-th monitoring indicator, it was calculated as follows:
where and are the monitored values of the m-th indicator at the i-th monitoring point at times and , respectively.
The average rate of change was calculated as the arithmetic mean of the rates of change at multiple monitoring points for the same monitoring indicator:
where is the number of monitoring points used to calculate the average rate of change for the m-th monitoring indicator. The uncertainty in the processed data was mainly related to sensor accuracy and fluctuations in the acquired signals.
3. Results and Analysis
3.1. Evolution Process of Overtopping Failure
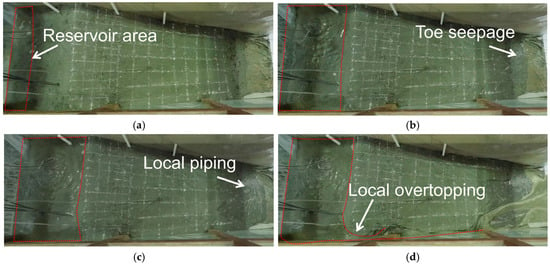
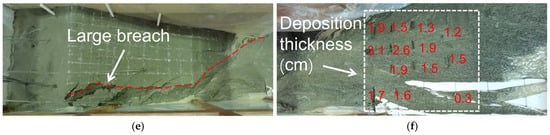
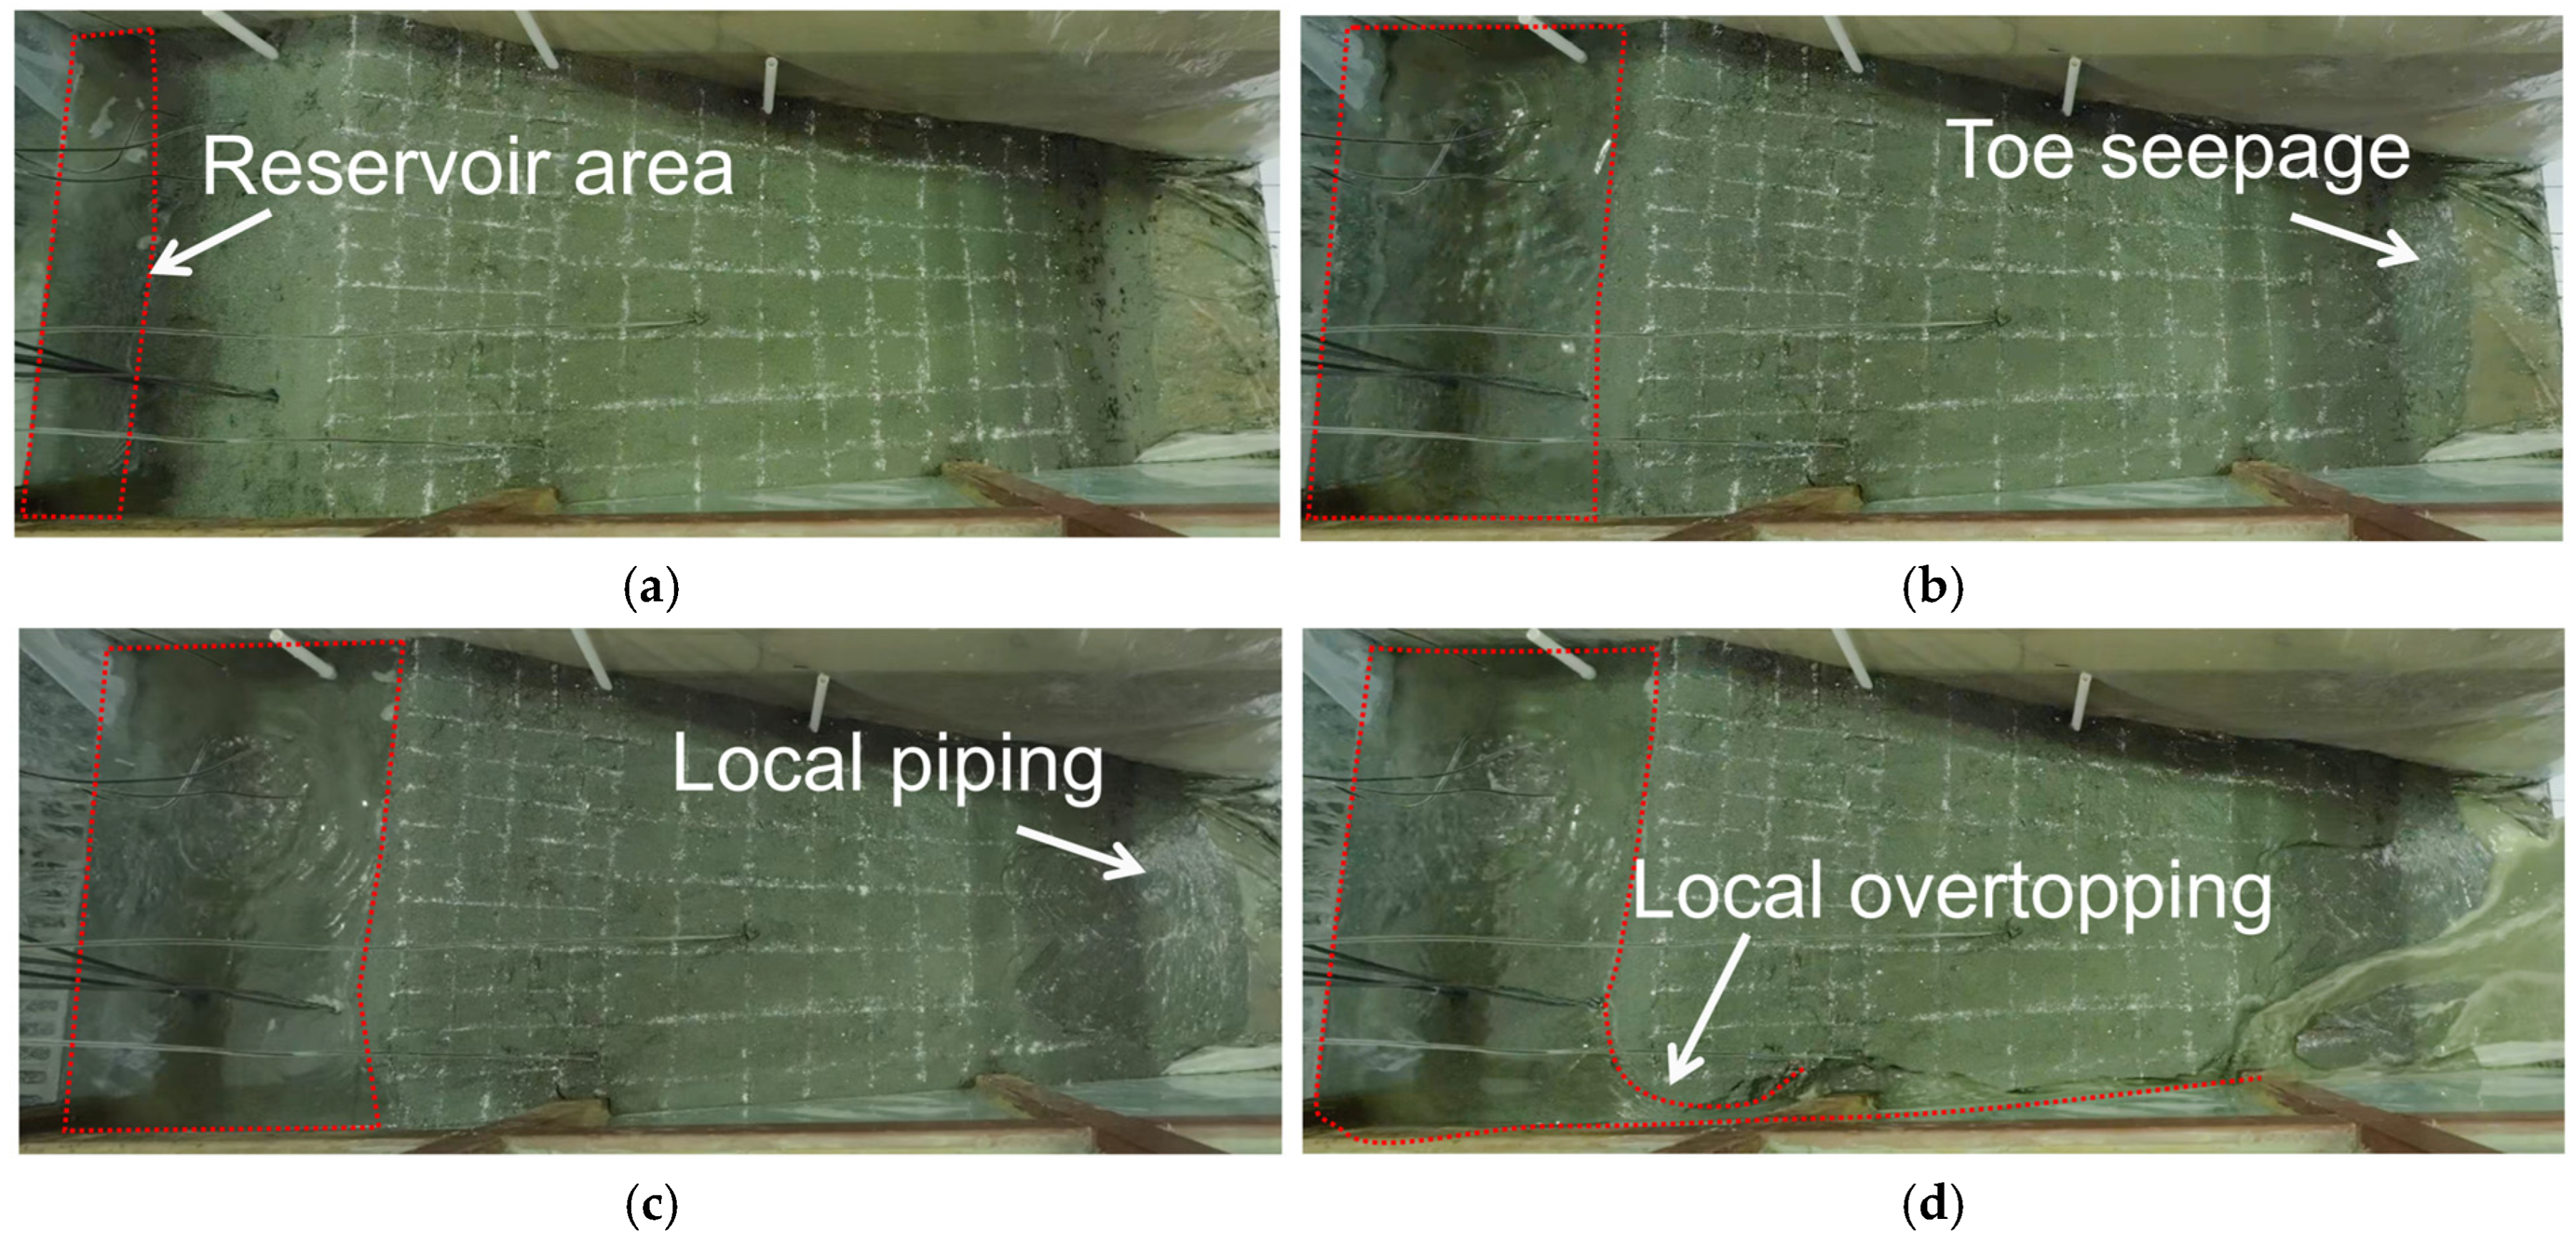
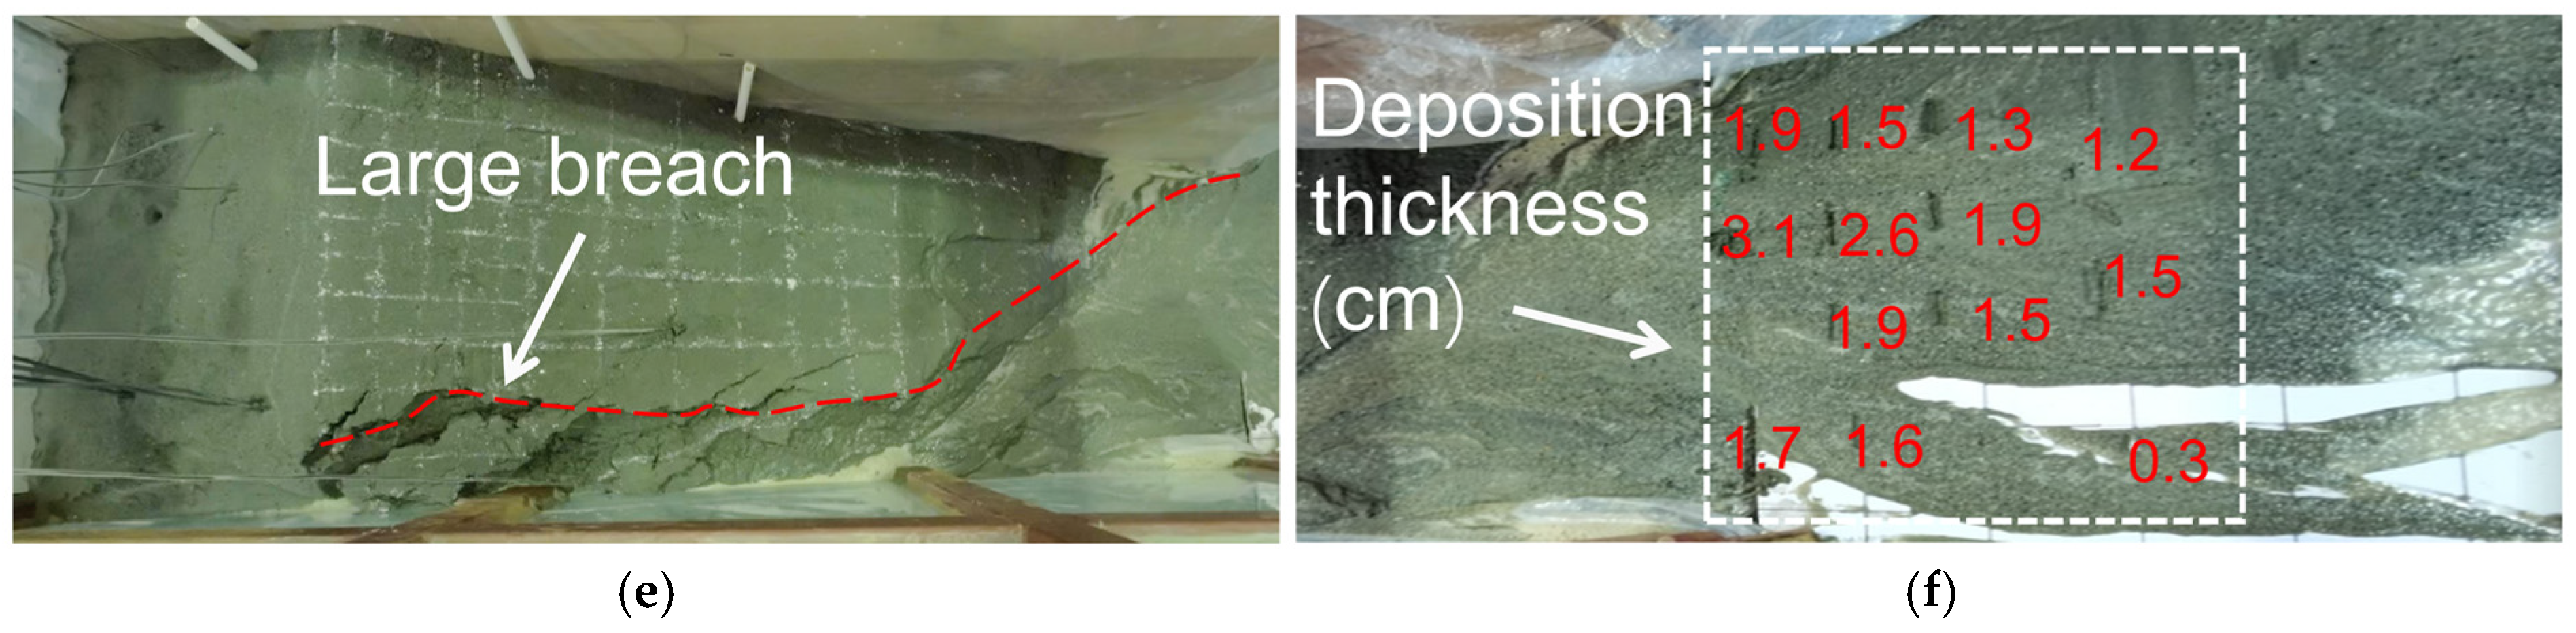
Both T1 and T2 ultimately resulted in overtopping failure of the tailings dam. Overall failure occurred at approximately 90 min in T1 and 100 min in T2. The cumulative rainfall duration in T2 at failure was about 80 min, approximately 11.1% shorter than that in T1. Under both scenarios, the macroscopic evolution proceeded from continuous infiltration, toe seepage, and local piping to local overtopping, breach expansion, and overall failure. Compared with T1, T2 showed a more abrupt failure process after local overtopping. After dam failure, a large amount of tailings rapidly flowed down the dam slope and accumulated in the downstream area of the model. The deposit thickness gradually decreased with increasing transport distance, and only a small amount of fine particles was deposited in areas farther from the dam, as shown in Figure 9f.
Figure 9.
Evolution of overtopping failure under the T1 scenario: (a) reservoir water storage; (b) toe seepage; (c) local piping; (d) local overtopping; (e) large breach; (f) downstream deposition after failure.
The evolution process of overtopping failure under the T1 scenario is shown in Figure 9. At the beginning of the test, no obvious water storage had formed in the reservoir area, and no seepage was observed at the dam toe, while rainfall infiltrated into the dam body. At approximately 13 min, water storage began to form in the reservoir area, and the water level subsequently continued to rise without an obvious decline before dam failure. As rainfall continued, a small amount of seepage first appeared at the dam toe after about 46 min. At approximately 60–70 min, the area near the dam toe gradually became marshy, and small flows continuously carried tailings sand out of the dam. Around 70 min, concentrated seepage and local piping could be observed at the dam toe, as shown in Figure 9c. At approximately 75–80 min, uneven settlement appeared in the upper part of the dam body, accompanied by tensile cracks. After about 80 min, the water level in the reservoir area remained high, and the dam entered a short stable stage. During this period, seepage at the dam toe persisted, but no immediate overall failure occurred. Around 85 min, local overtopping occurred at the dam crest. At approximately 87–88 min, small gullies formed on the slope surface and further expanded into an initial breach. Sediment was also flushed downstream. Subsequently, the breach rapidly deepened downward and widened laterally. Finally, at approximately 90 min, the breach cut through the dam body and developed into a large breach, as shown in Figure 9e.
Under the T2 scenario, before the first rainfall interval, the macroscopic evolution of the dam body was basically consistent with that of T1. The water level in the reservoir area decreased during both rainfall intervals. In contrast to T1, however, T2 did not experience a short stable stage in which the water level in the reservoir area remained high before failure. At approximately 97 min, local overtopping occurred, after which gullies rapidly developed on the slope surface and formed an initial breach. The breach then continued to expand, and overall failure occurred at approximately 100 min. The duration from local overtopping to overall failure in T2 was 40% shorter than that in T1.
3.2. Internal Response of the Dam Body
3.2.1. Phreatic Line Response
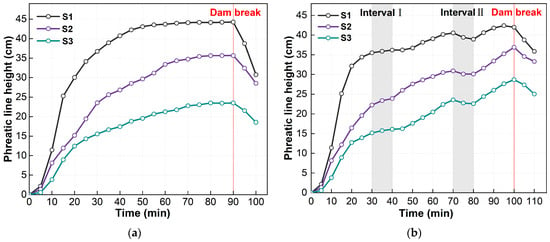
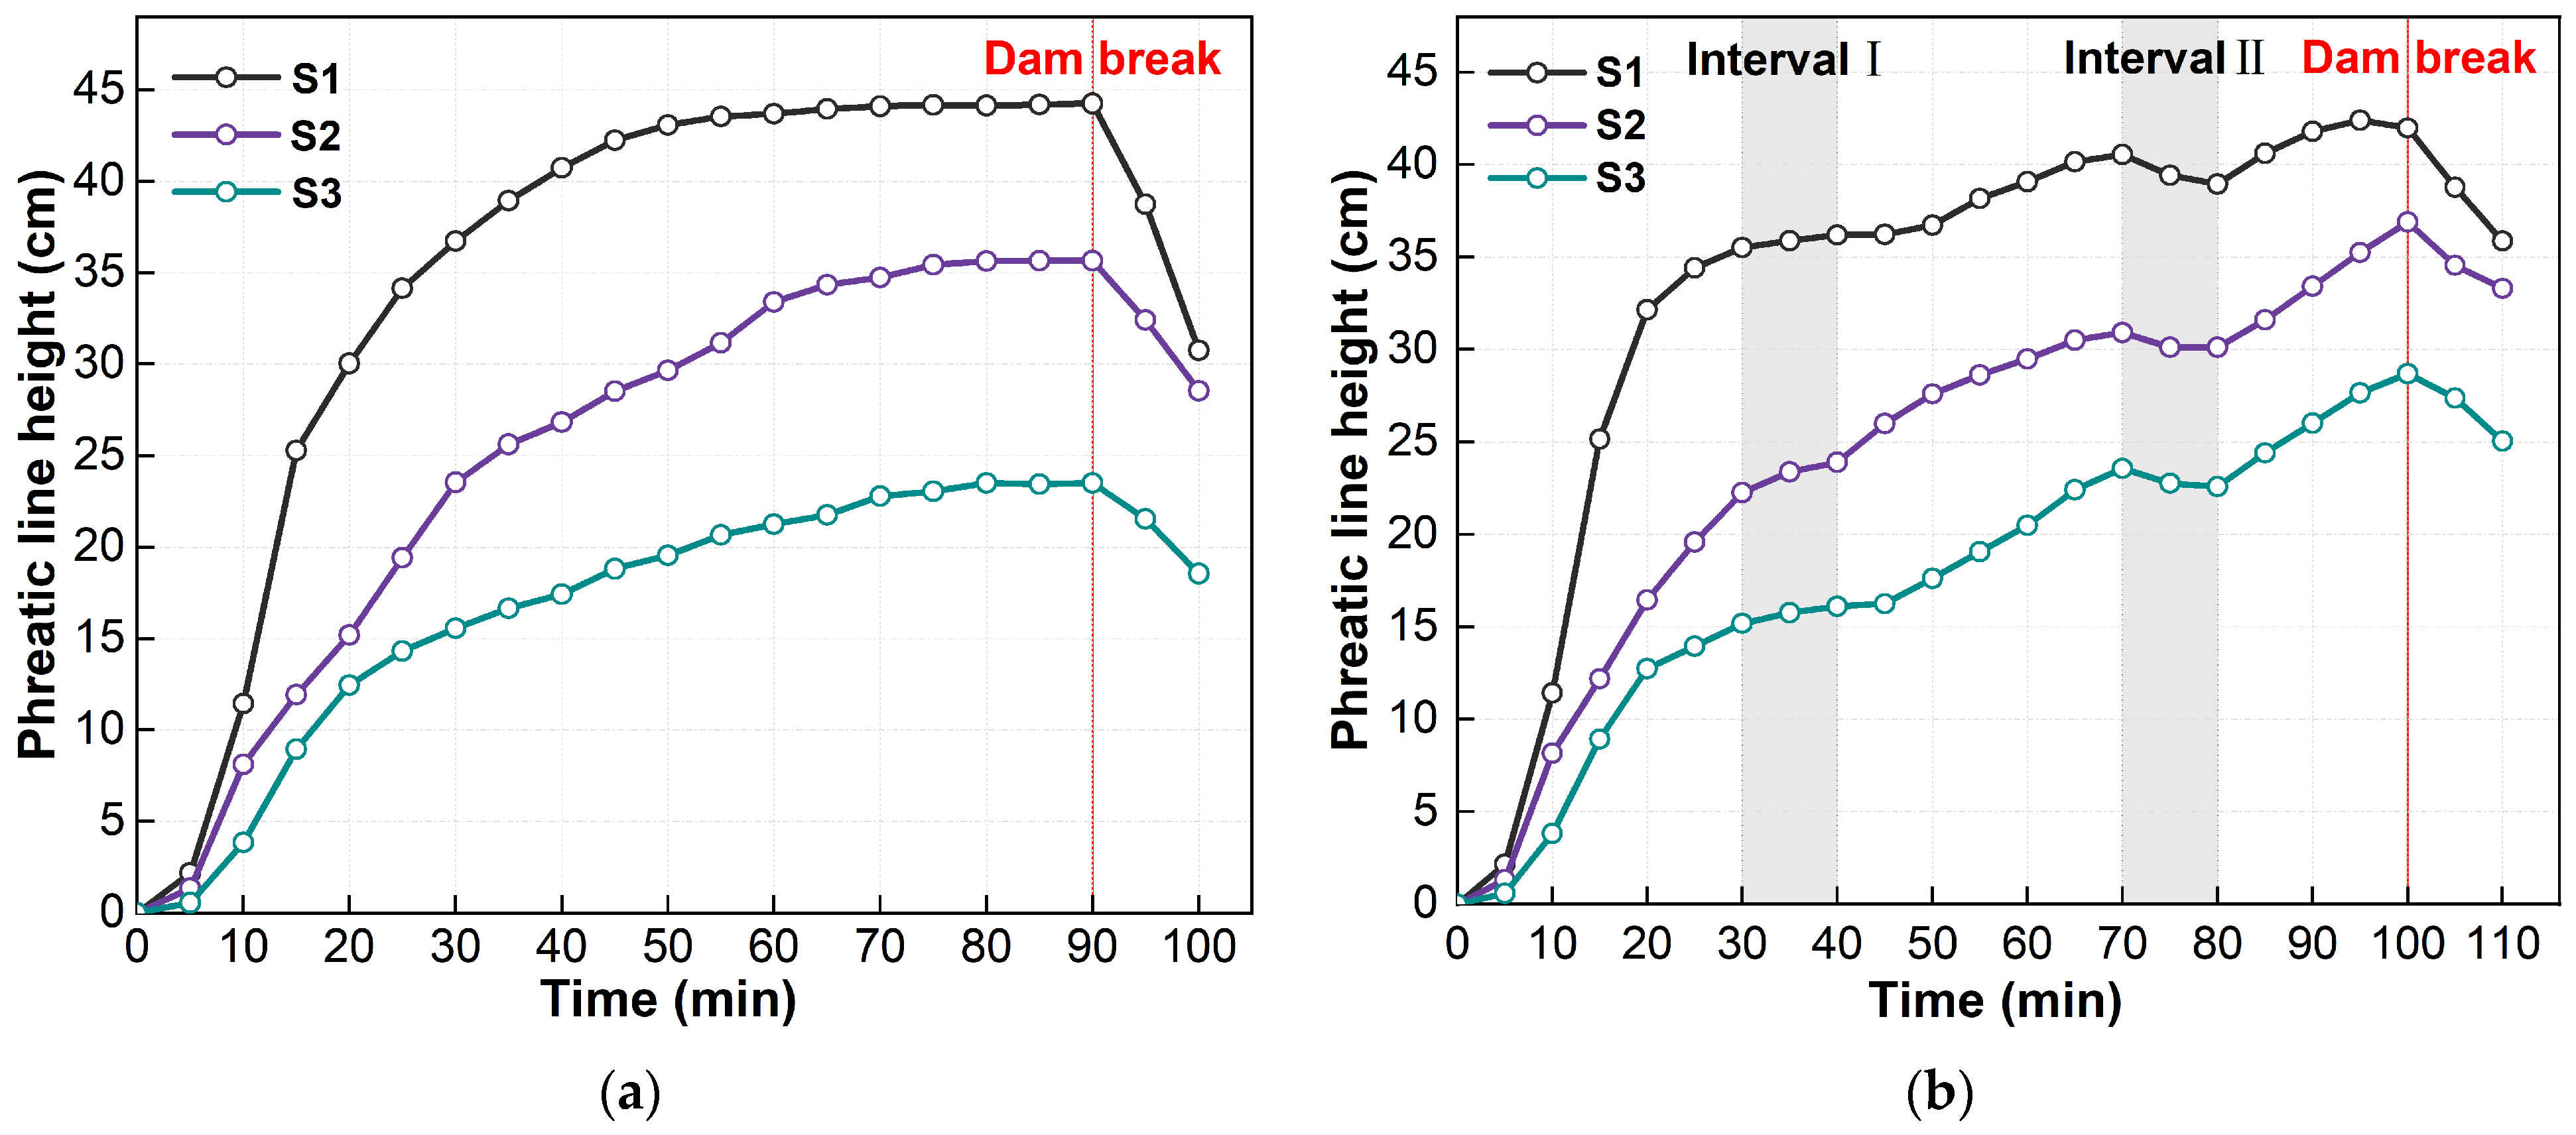
The variation in the phreatic line is shown in Figure 10. During the 0–30 min interval, the two scenarios showed similar trends. Taking T1 as an example, during 0–10 min, the rates of change in phreatic line height at S1, S2, and S3 were approximately 1.15, 0.81, and 0.39 cm/min, respectively. During 10–30 min, the corresponding rates of change at S1, S2, and S3 were approximately 1.27, 0.77, and 0.59 cm/min, respectively. These results indicate that the rise of the phreatic line showed a certain lag and clear spatial differences [17]. The closer the observation point was to the reservoir area, the faster the phreatic line rose. During 30–40 min, the average rates of change in phreatic line height under T1 and T2 were approximately 0.31 and 0.11 cm/min, respectively. The average rise rate under T2 was approximately 0.35 times the corresponding average rise rate under T1. During 70–80 min, the average rates of change in phreatic line height under T1 and T2 were approximately 0.06 and −0.11 cm/min, respectively. The average decline rate under T2 was approximately 1.83 times the corresponding average rise rate under T1. After dam failure, the phreatic line heights at all monitoring points declined, but they still remained above their initial positions.
Figure 10.
Variation in phreatic line height under different rainfall scenarios: (a) T1 scenario; (b) T2 scenario.
3.2.2. Volumetric Water Content Response
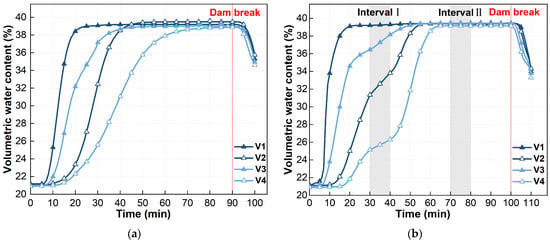
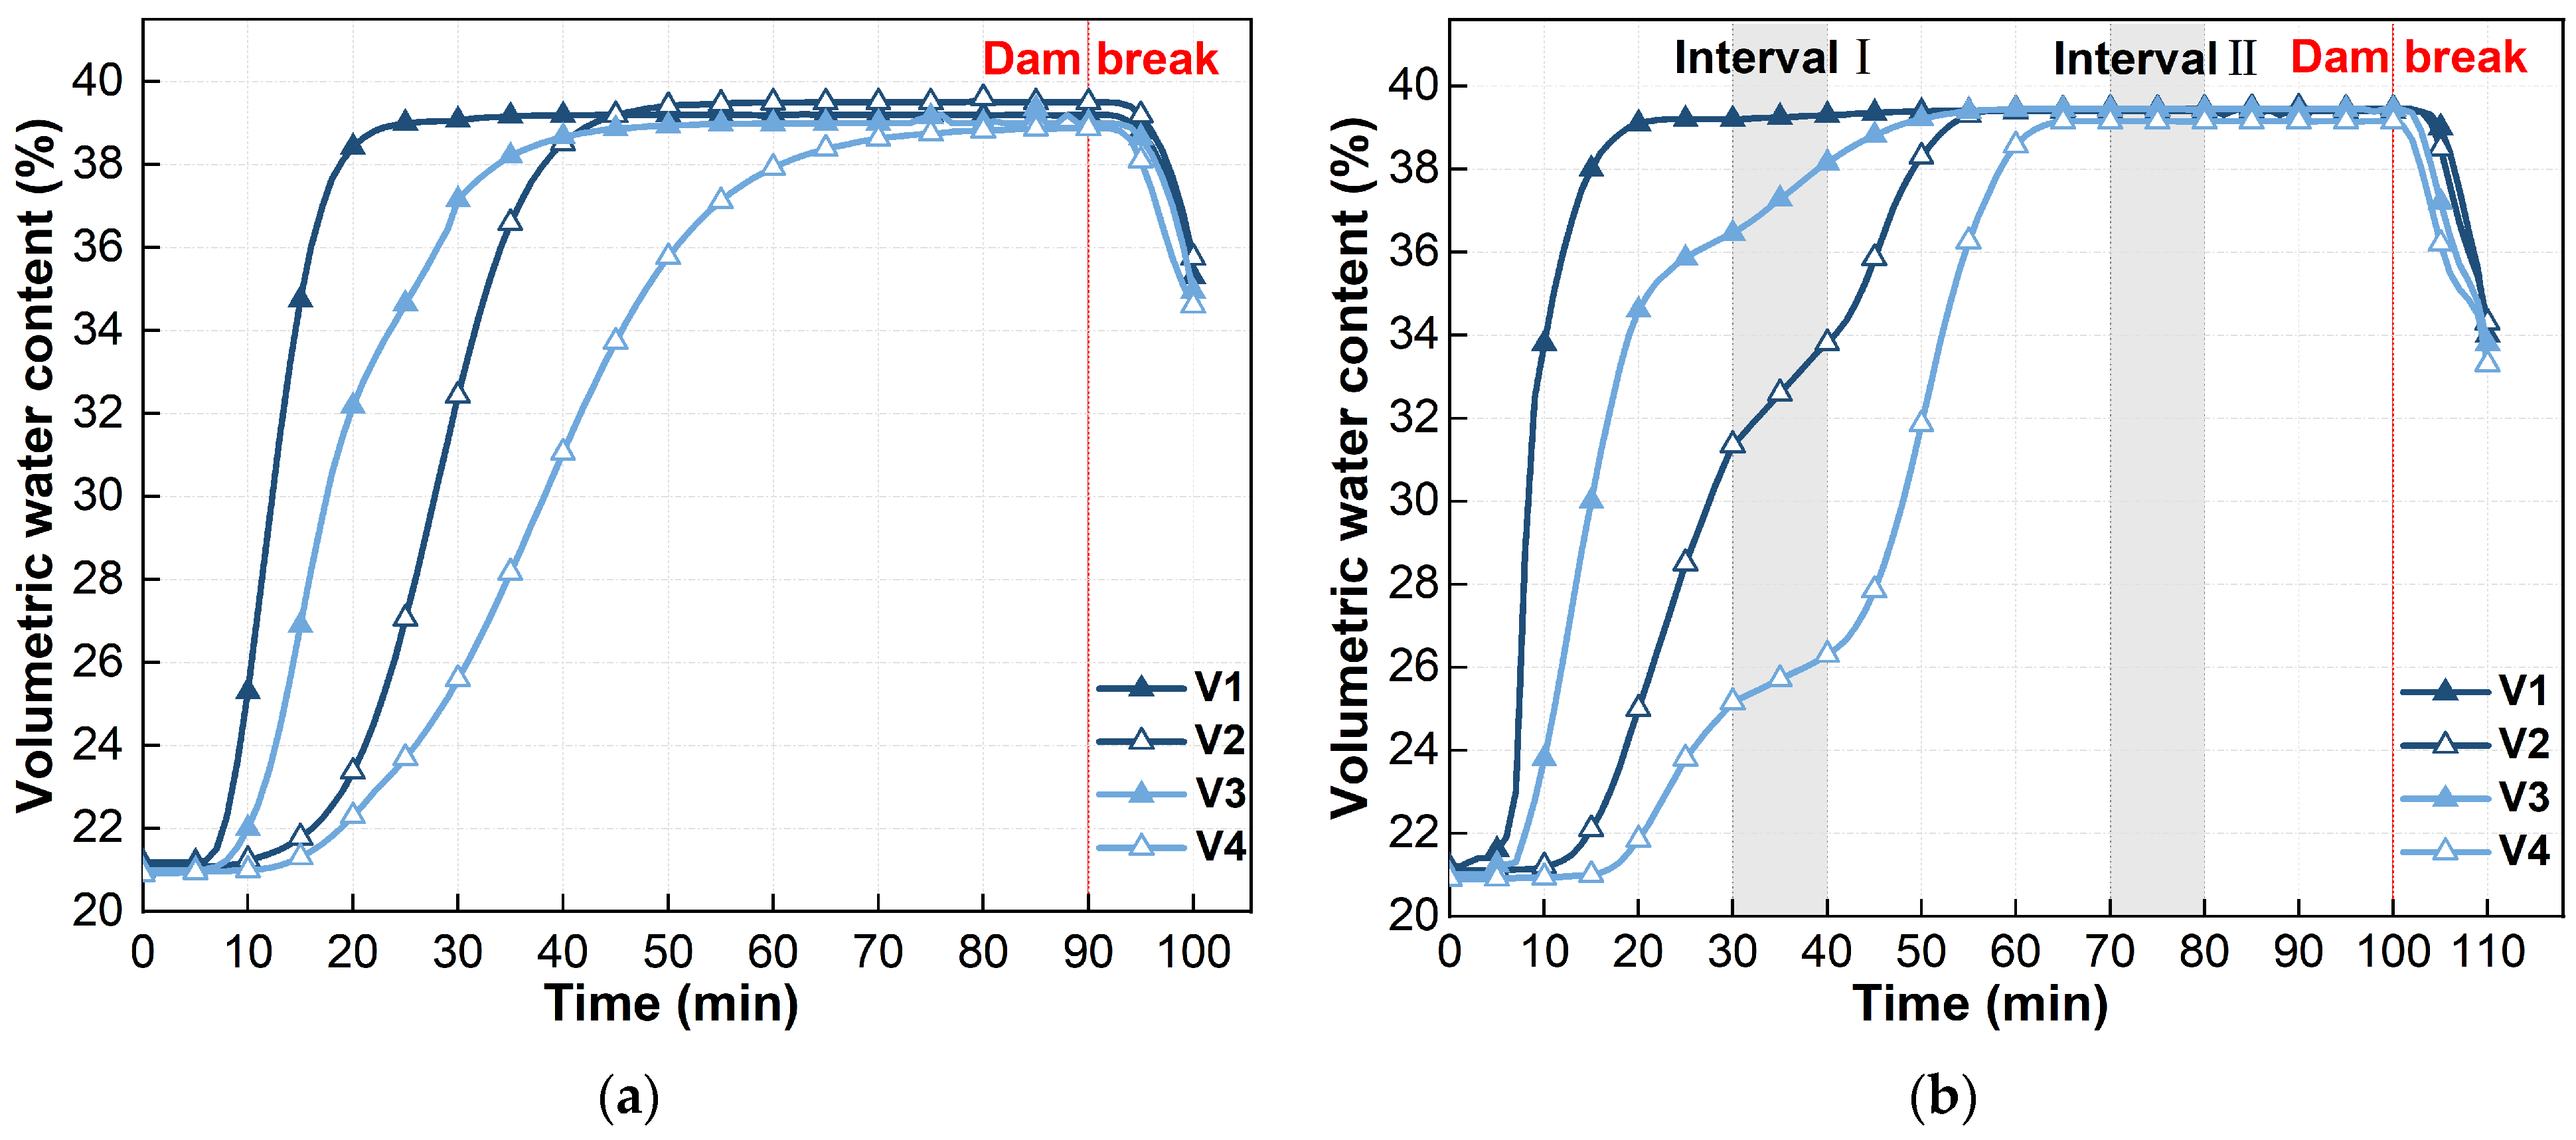
Figure 11 shows the variation in volumetric water content under the two scenarios. The volumetric water content at all monitoring points gradually increased during rainfall and eventually stabilized at approximately 39%. V1 and V3 started to increase at approximately 7 min, whereas V2 and V4 started to increase at approximately 15 min. This indicates that rainfall infiltration gradually developed from the upper part to the lower part of the model. V1 was located in the shallow part of the reservoir area and was the most sensitive to rainfall. Its volumetric water content increased rapidly and quickly approached saturation. During 30–40 min, the average rates of change in volumetric water content under T1 and T2 were approximately 0.33 and 0.14%/min, respectively. The average rise rate under T2 was approximately 0.42 times the corresponding average rise rate under T1. Unlike the phreatic line, which showed a short-term decline during the second rainfall interval, the volumetric water content did not decrease during this interval but remained at a relatively high level overall. In T1, during approximately 93–100 min, the average volumetric water content decreased from 39.11% to 35.15%. In T2, during approximately 103–110 min, it decreased from 38.92% to 33.85%.
Figure 11.
Variation in volumetric water content under different rainfall scenarios: (a) T1 scenario; (b) T2 scenario.
3.2.3. Pore Water Pressure Response
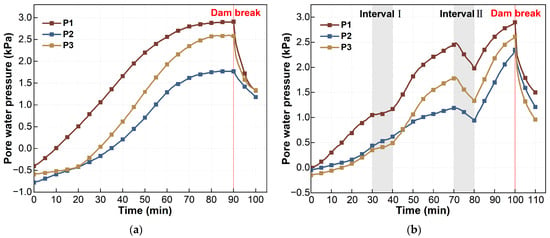
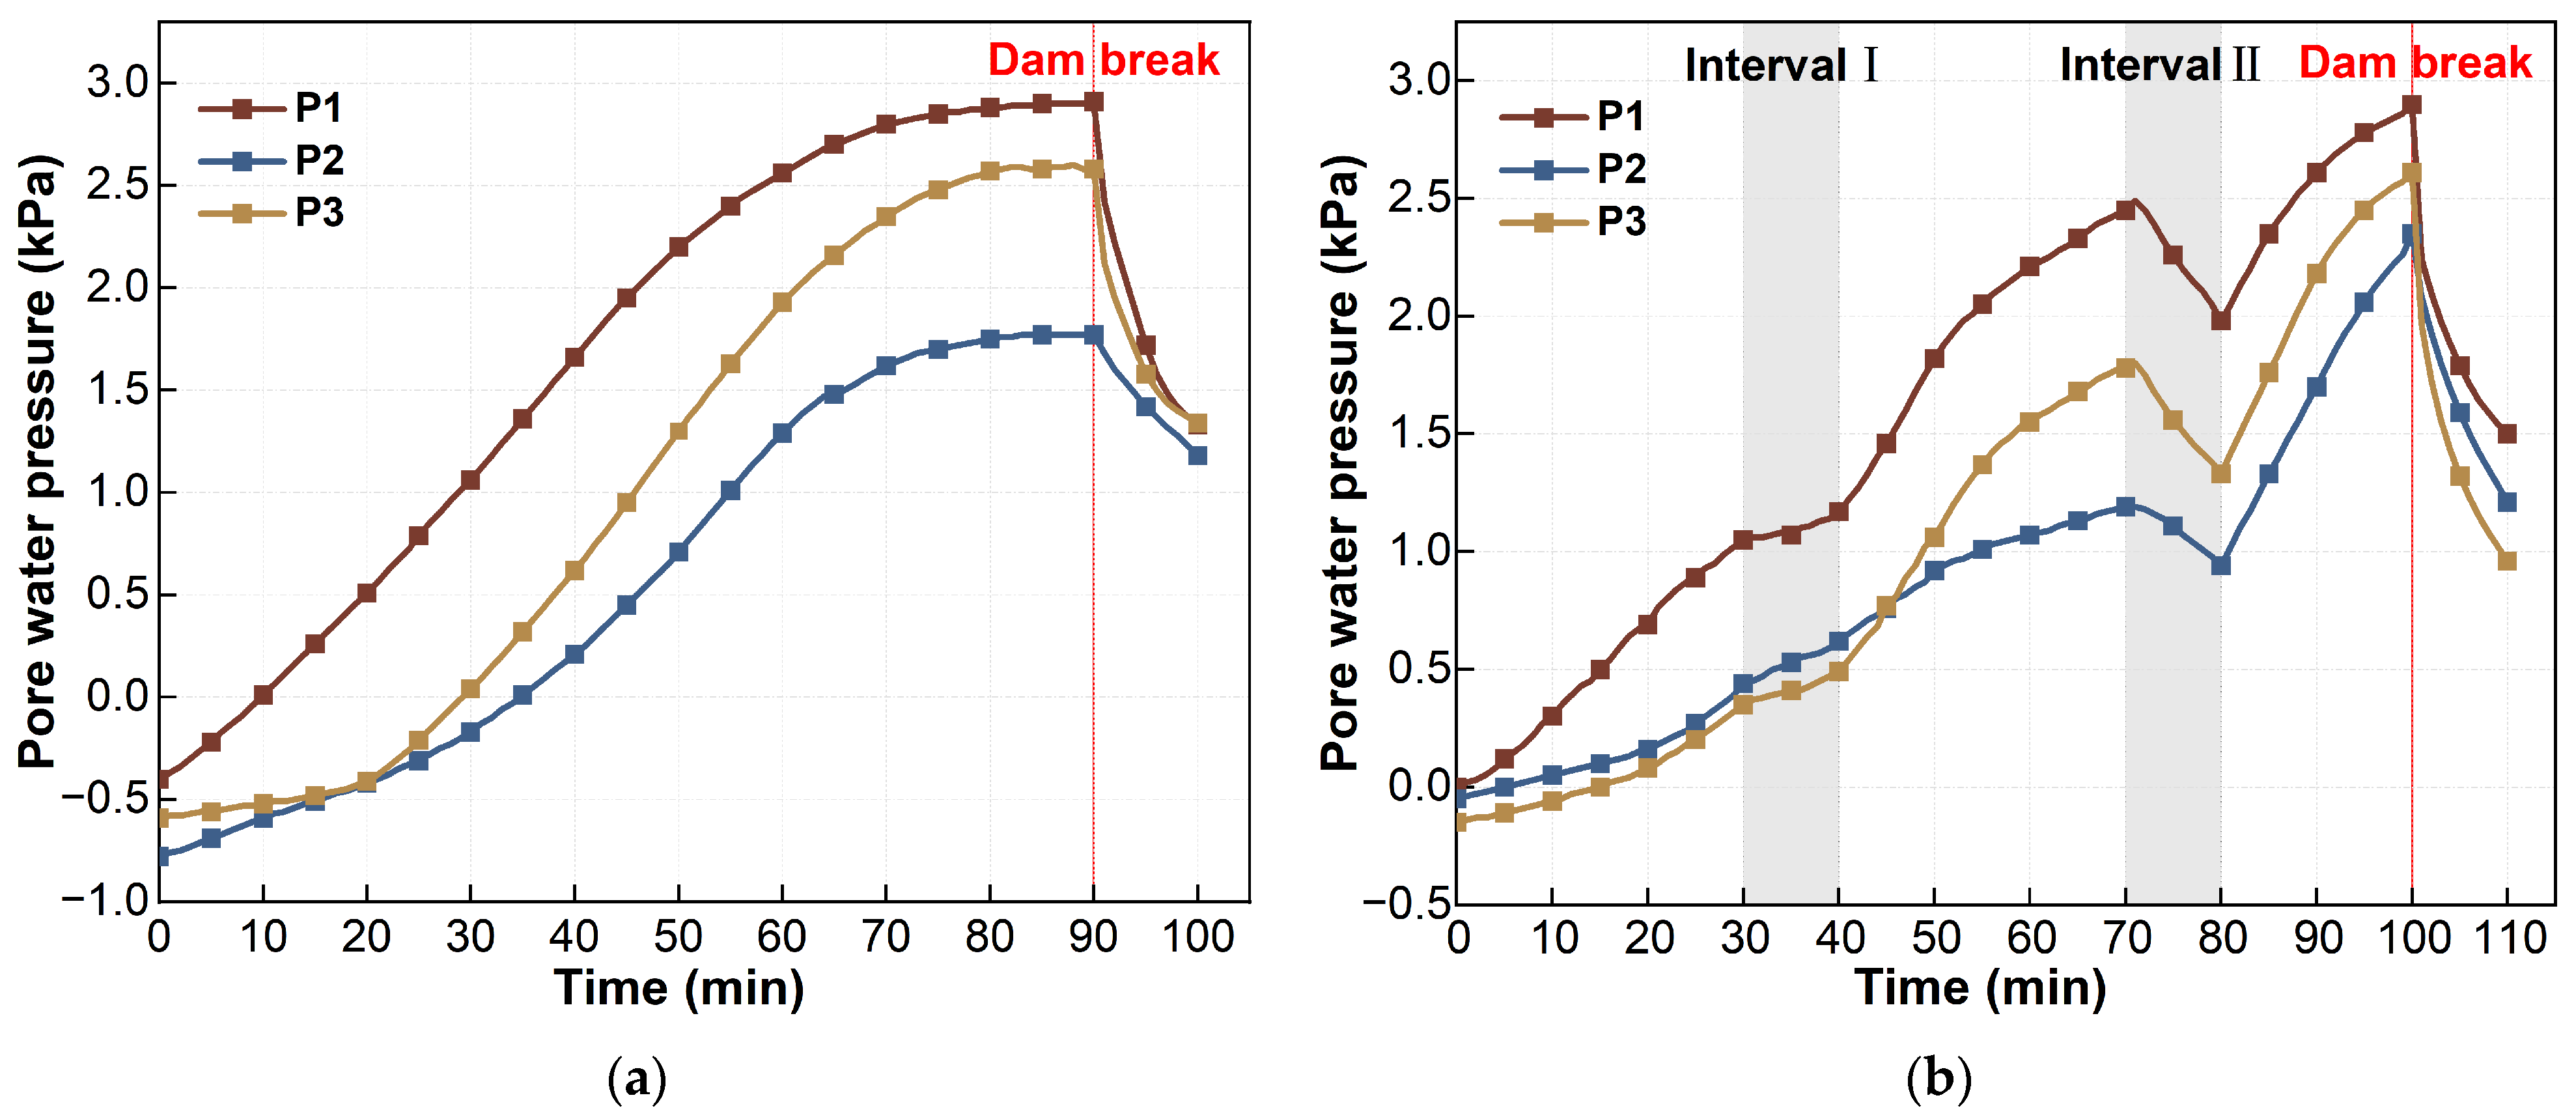
Figure 12 shows the variation in pore water pressure under the two scenarios. At some monitoring points, pore water pressure showed negative values, reflecting the unsaturated state of the soil and the presence of matric suction. Under T1, the pore water pressures at P1–P3 tended to stabilize after approximately 85 min, with values of approximately 2.90, 1.77, and 2.58 kPa, respectively. Under T2, the values at P1–P3 reached peaks before failure, at approximately 2.90, 2.35, and 2.61 kPa, respectively. The values at P1 remained higher than those at P2 and P3. This indicates that infiltrated rainwater mainly accumulated near P1 in the reservoir area. During 30–40 min, the average rates of change in pore water pressure under T1 and T2 were approximately 0.052 and 0.015 kPa/min, respectively. The average rise rate under T2 was approximately 0.29 times the corresponding average rise rate under T1. During 70–80 min, the average rates of change in pore water pressure under T1 and T2 were approximately 0.014 and −0.039 kPa/min, respectively. The average decline rate under T2 was approximately 2.79 times the corresponding average rise rate under T1. During 80–100 min, the average rise rate of pore water pressure under T2 was approximately 0.060 kPa/min. This rate was higher than the absolute value of the average rate of change during the second rainfall interval.
Figure 12.
Variation in pore water pressure under different rainfall scenarios: (a) T1 scenario; (b) T2 scenario.
3.2.4. Earth Pressure Response
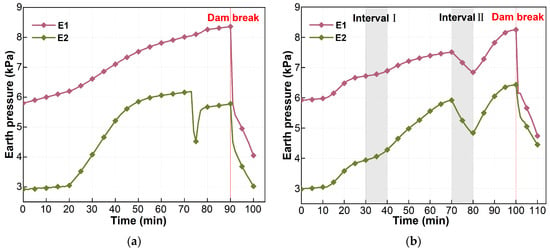
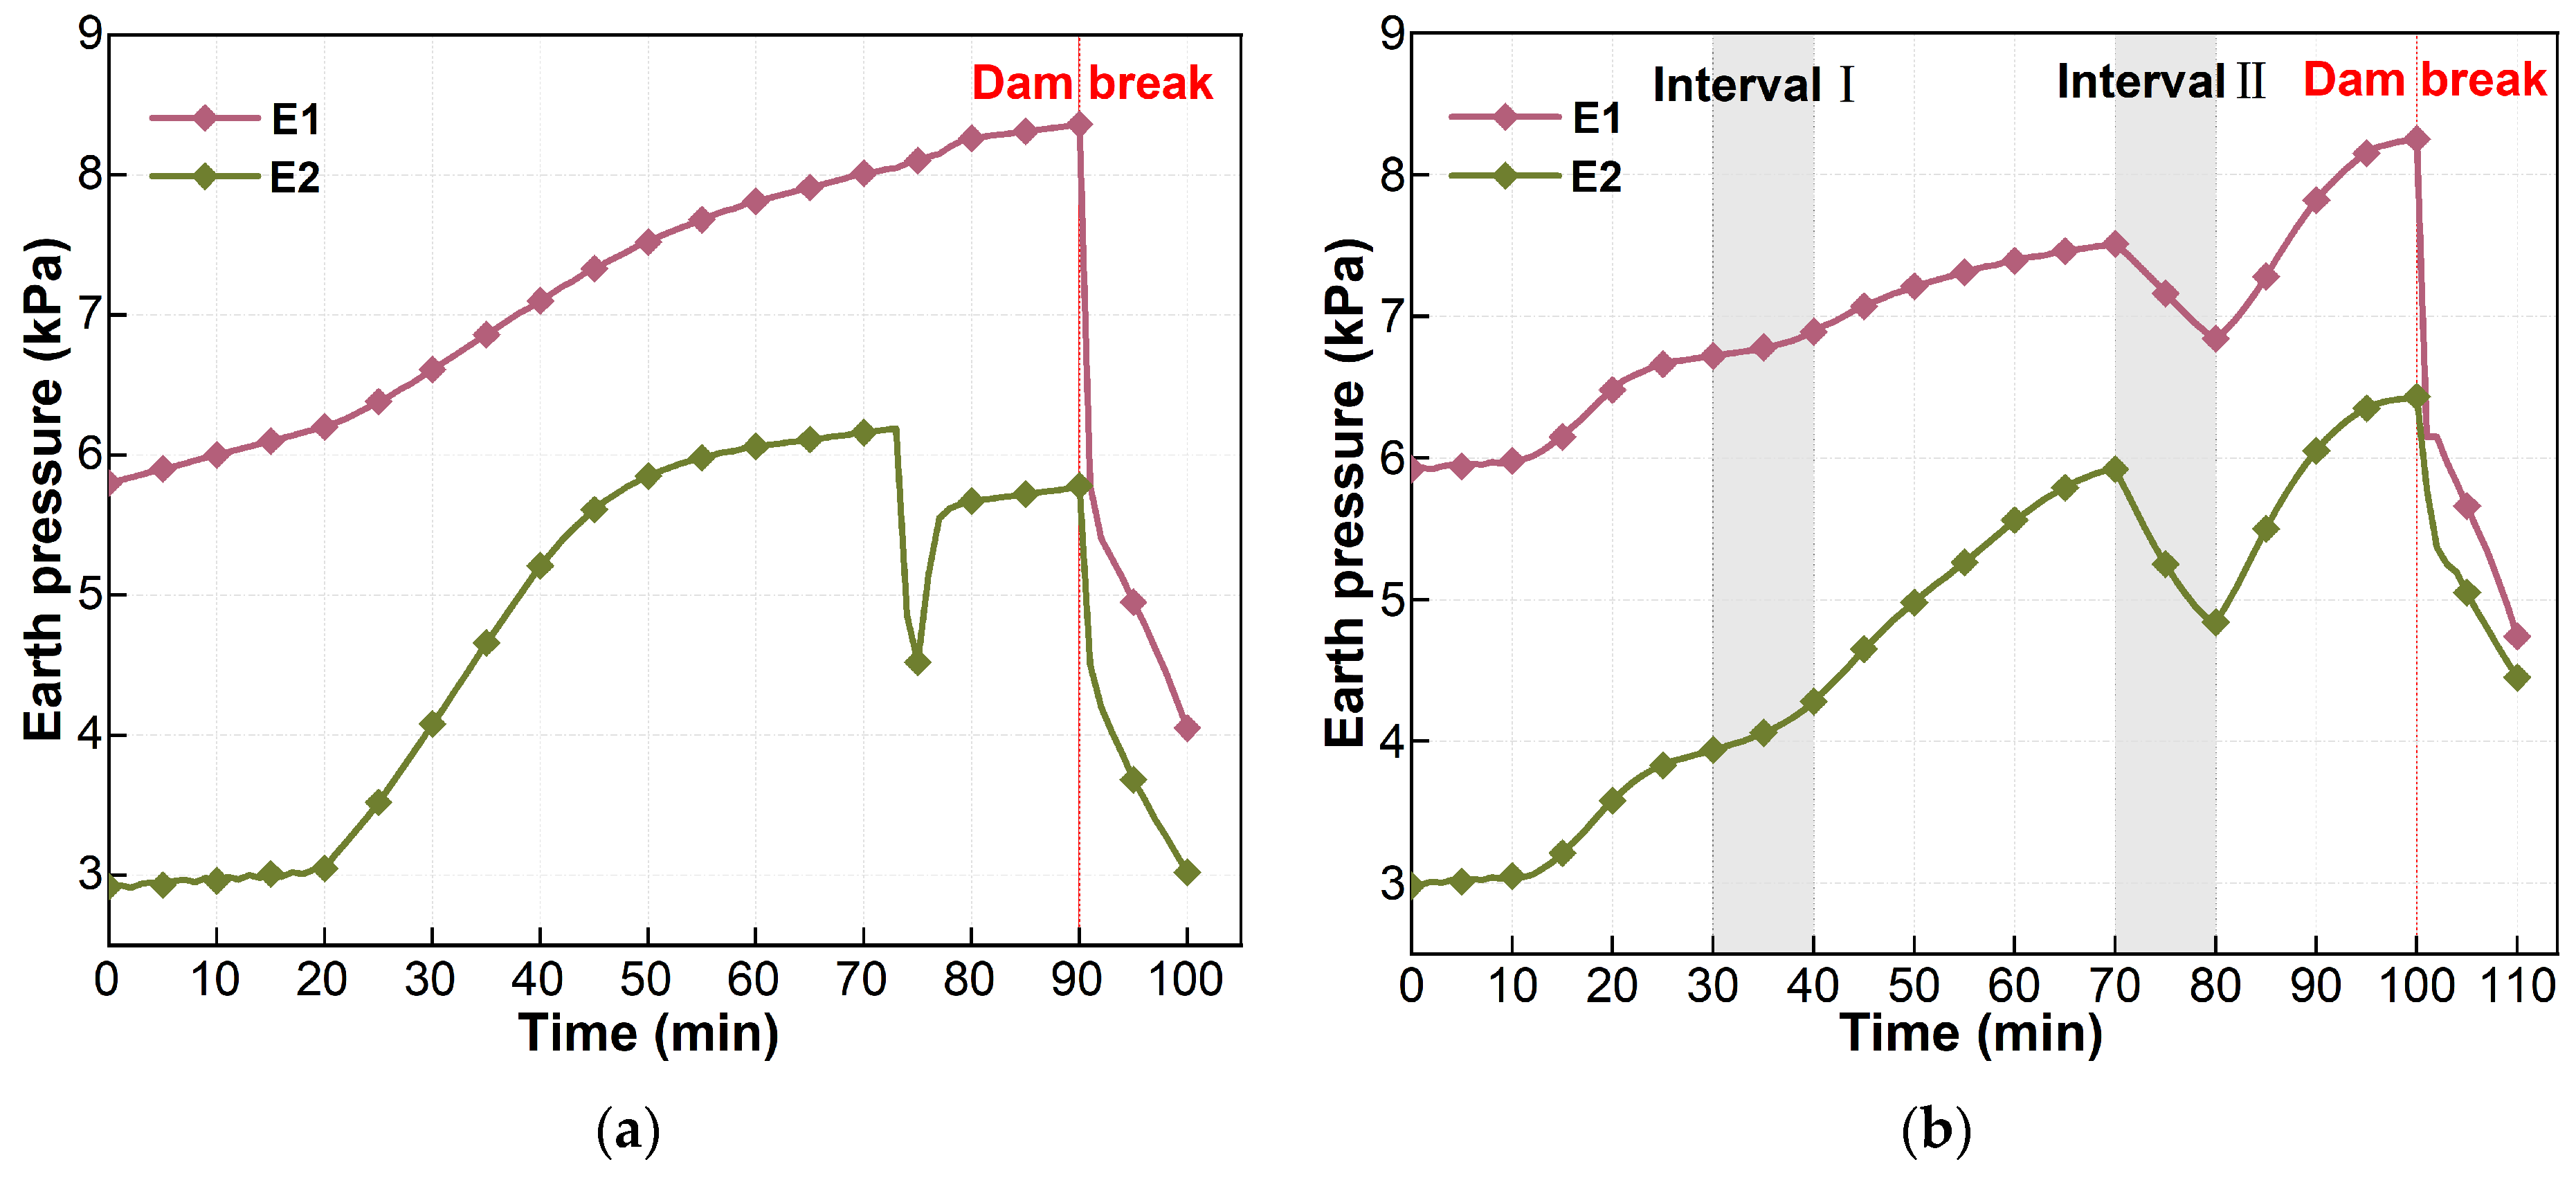
Figure 13 shows the variation in earth pressure under the two scenarios. Overall, earth pressure generally varied consistently with pore water pressure [22]. Under T1, E2 showed a brief abrupt drop at approximately 74 min, possibly due to local failure near the monitoring point. Therefore, E2 under T1 was excluded from the calculation of the average rate of change in earth pressure during 70–80 min. During 30–40 min, the average rates of change in earth pressure under T1 and T2 were approximately 0.081 and 0.026 kPa/min, respectively. The average rise rate under T2 was approximately 0.32 times the corresponding average rise rate under T1. During 70–80 min, the average rates of change in earth pressure under T1 and T2 were approximately 0.025 and −0.088 kPa/min, respectively. The average decline rate under T2 was approximately 3.52 times the corresponding average rise rate under T1. During 80–100 min, the average rise rate of earth pressure under T2 was approximately 0.075 kPa/min. At the moment of dam failure, earth pressure at both monitoring points dropped abruptly.
Figure 13.
Variation in earth pressure under different rainfall scenarios: (a) T1 scenario; (b) T2 scenario.
4. Discussion
4.1. Internal Response Under Different Rainfall Patterns
During the initial 0–30 min rainfall stage, the internal responses of the dam body were generally consistent under the two scenarios. Therefore, this stage is not discussed in detail here. Under the T1 scenario, the internal monitoring indicators generally increased as rainfall continuously infiltrated into the dam body. However, different indicators showed differences in response sequence, rate of change, and stage characteristics [37]. Before dam failure, the phreatic line and other internal monitoring indicators tended to stabilize. Macroscopically, continuous seepage appeared at the lower part of the dam slope. This indicated that internal water migration within the dam body had entered a relatively stable stage. The phreatic line remained at a relatively high position for a long period. Continuous seepage occurred at the dam toe and was accompanied by the loss of fine particles. These processes gradually weakened the local stability of the dam body [22,38]. Subsequently, under the combined effect of overtopping erosion, the dam body gradually evolved from local damage to overall instability, as shown in Figure 9e.
Under the T2 scenario, during the first rainfall interval, the volumetric water content at V2, V3, and V4 continued to increase. The phreatic line, pore water pressure, and earth pressure increased slowly, with average rates of change of 0.11 cm/min, 0.015 kPa/min, and 0.026 kPa/min, respectively. This indicates that previously infiltrated rainwater continued to migrate within the dam body. At this stage, the dam body did not enter a recovery state. Instead, it was in a transition from an unsaturated state to a saturated state. Wang et al. [31] and Zhang et al. [32] showed that rainfall infiltration can increase water content and pore water pressure, reduce matric suction, and weaken the shear strength of unsaturated soil. This indicates that the first rainfall interval mainly reflected a delayed infiltration response within the dam body. It did not indicate recovery of dam stability.
The internal response during the second rainfall interval differed from that during the first rainfall interval. At this stage, the volumetric water content at all monitoring points remained nearly stable and approached a saturated state. On the one hand, the phreatic line and pore water pressure declined, with average decline rates of 0.11 cm/min and 0.039 kPa/min, respectively, as shown in Figure 10b and Figure 12b. This indicates that rainfall suspension did not immediately stop internal drainage. Free water within the dam body continued to drain downstream under gravity. On the other hand, the water level in the reservoir area decreased. This reduced the load exerted by the overlying water and tailings with high water content on the dam body. Earth pressure declined accordingly, with an average decline rate of 0.088 kPa/min, as shown in Figure 13b.
After rainfall resumed, the water level in the reservoir area rose again. The average rates of change in pore water pressure and earth pressure shifted from −0.039 and −0.088 kPa/min during the second rainfall interval to 0.060 and 0.075 kPa/min, respectively. This change indicates rapid pore water pressure accumulation and stress redistribution within the dam body. Some indicators reached peak values before failure, higher than those before the beginning of the second rainfall interval. The duration from local overtopping to overall failure in T2 was 40% shorter than that in T1. This indicates a more abrupt failure process.
Overall, continuous and intermittent rainfall affected internal water migration, pore water pressure accumulation, and stress redistribution within the dam body. These internal changes governed the progression of the tailings dam from local damage to overall instability.
4.2. Stage Division of the Overtopping Failure Process
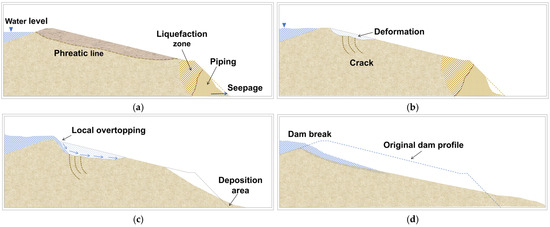
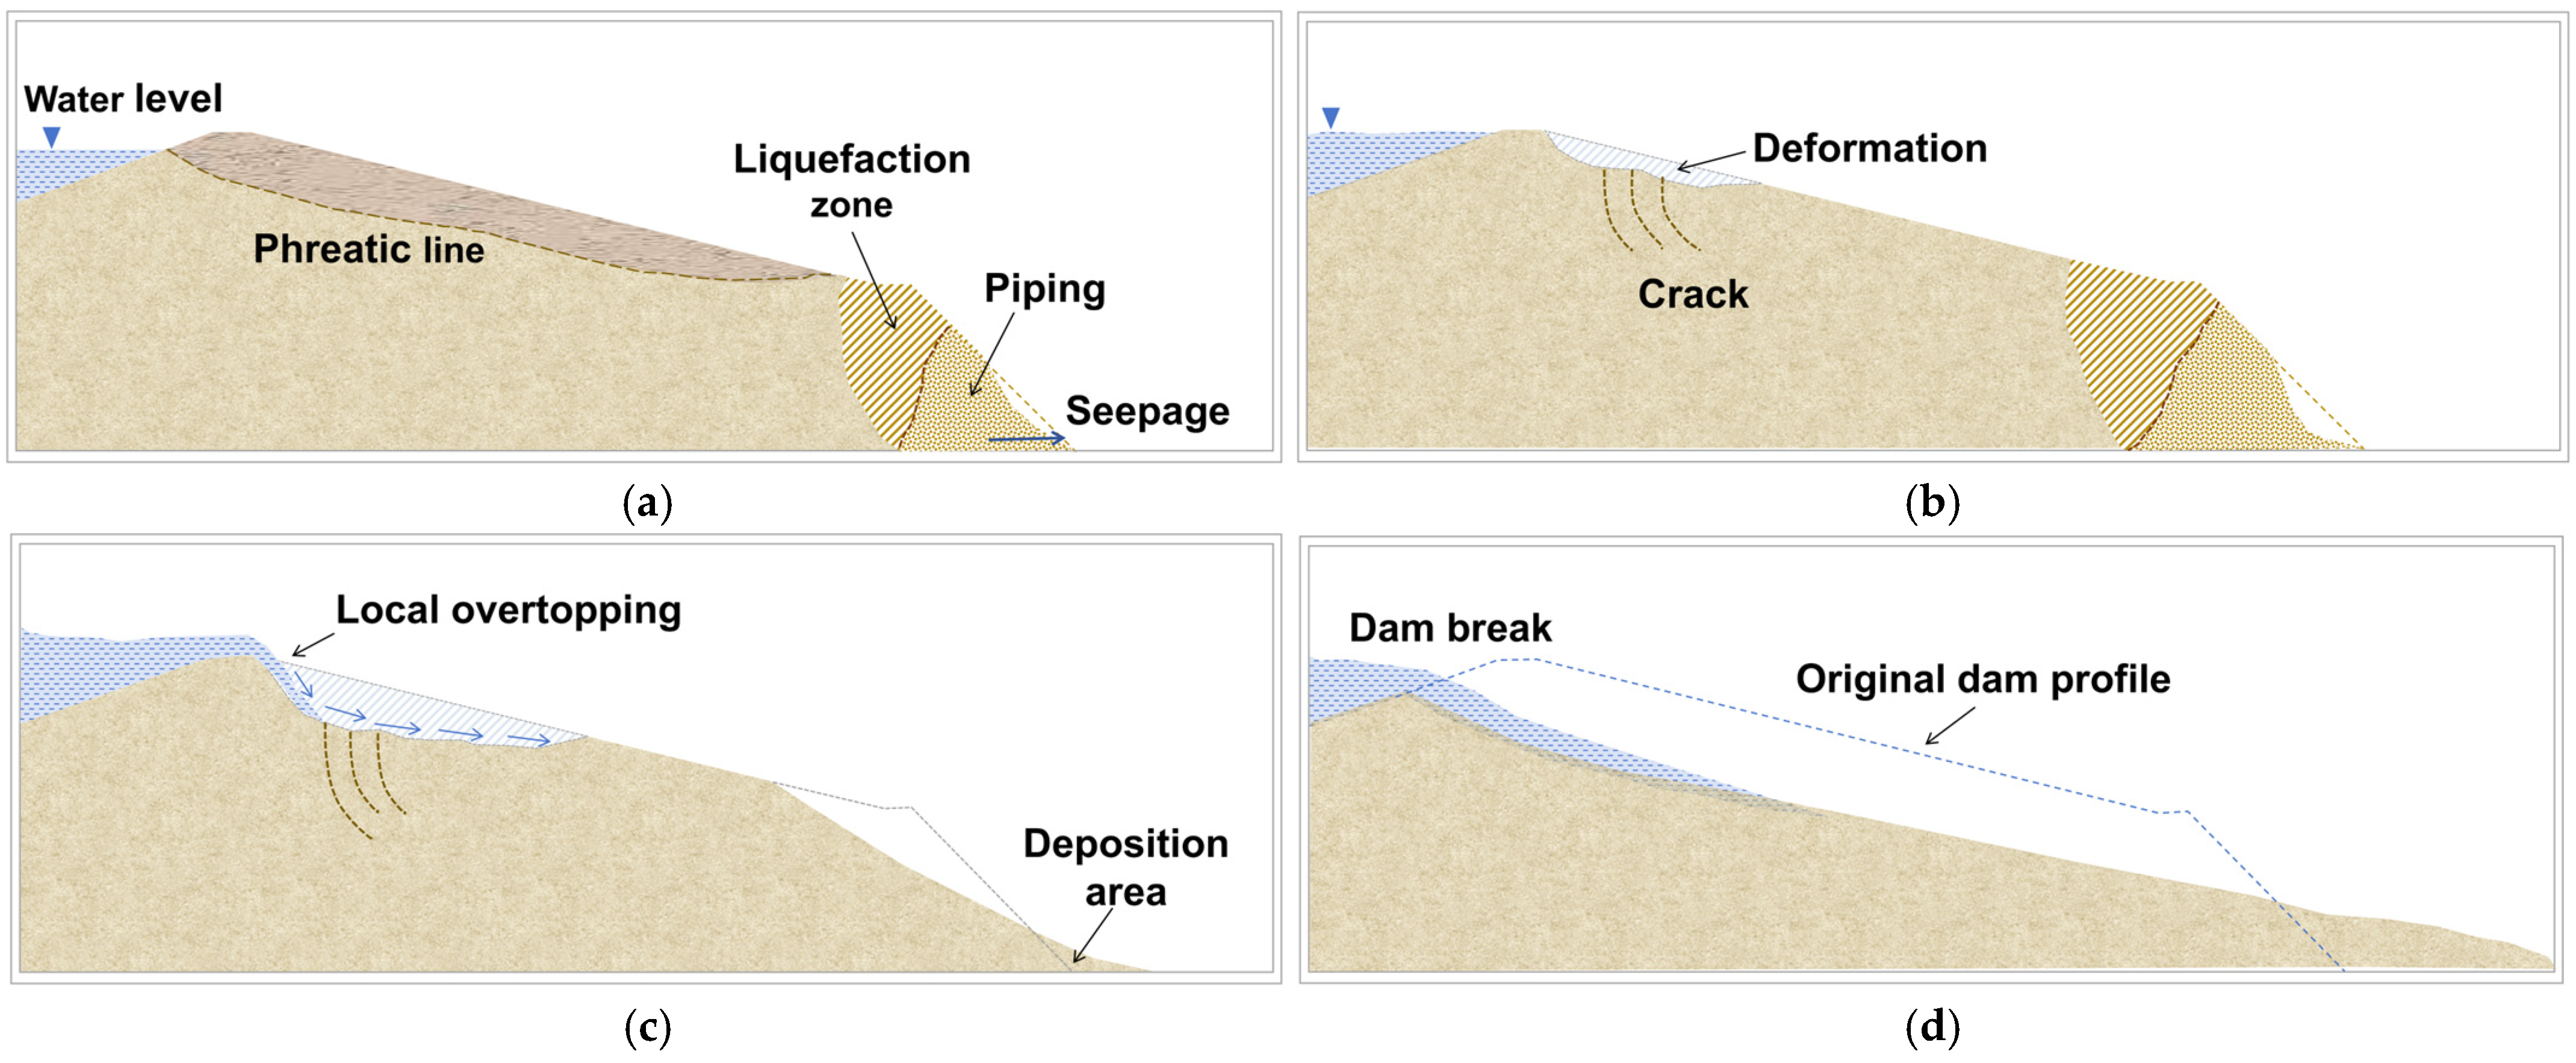
Most previous stage divisions mainly focused on the external erosion process after breach formation. For example, Zhao et al. [39] divided this process into five stages, from gully formation to the stabilization of a step-shaped erosion gully. However, Wang et al. [17] found that, under rainfall conditions, seepage on the dam slope and local collapse had already occurred before overall failure. Duan et al. [40] also pointed out that the mechanism of overtopping failure in tailings dams cannot be explained only by external overtopping flow. Therefore, based on previous studies and the present test results, this study proposed a four-stage division of the whole overtopping failure process, as shown in Figure 14. This division was based on the sequence of dam damage and monitoring data, and considered the coupling between internal seepage and external overtopping erosion.
Figure 14.
Typical features of the four stages during overtopping failure: (a) toe seepage stage; (b) dam deformation stage; (c) local overtopping stage; (d) overall sliding failure stage.
- 1
- Toe Seepage Stage.
As rainfall continuously infiltrated, the phreatic line in the tailings dam gradually rose. Seepage and marshy conditions first appeared at the dam toe. This indicates that the dam toe first entered a locally saturated state. At this stage, pore water pressure continued to increase. The effective stress decreased continuously. This gradually weakened the shear strength of the tailings sand at the dam toe, and a tendency toward local liquefaction appeared in some areas. When the local hydraulic gradient exceeded the critical hydraulic gradient, fine particles began to migrate with seepage flow. This process gradually developed into piping. Macroscopic failure was not obvious at this stage, and the tailings dam was in an initial damage state induced by internal seepage.
- 2
- Dam Deformation Stage.
Under the effects of continuous toe seepage and local piping, the lower support of the dam body gradually weakened. Uneven settlement, local depressions, and tensile cracks appeared in the upper part of the dam body. This indicates that dam deformation had propagated upward from the dam toe. Meanwhile, volumetric water content, pore water pressure, earth pressure, and the phreatic line all remained at high response levels. The dam body was close to instability. Under T1, before local overtopping, the water level in the reservoir area remained high, and the dam entered a short stable stage. Under T2, because of the two rainfall intervals, the dam did not experience a clear stage in which the water level in the reservoir area remained high.
- 3
- Local Overtopping Stage.
When the water level in the reservoir area further rose and exceeded a local depression on the dam crest, local overtopping began. Small gullies first formed on the dam slope surface. Under continuous flow erosion, these gullies continued to deepen and widen. They gradually evolved into an initial breach. Meanwhile, internal seepage within the dam body continued to develop. The additional hydrostatic pressure generated by water-filled cracks promoted crack opening. This stage indicates that local failure occurred under the combined action of external overtopping erosion and internal seepage.
- 4
- Overall Sliding Failure Stage.
As the breach continued to deepen and widen, local failure of the dam body evolved into overall instability. A breach eventually formed and cut through the dam body. A large amount of tailings with high water content rapidly flowed downward along the sliding surface and accumulated downstream. At this stage, pore water pressure and earth pressure in the tailings dam dropped abruptly at the same time. However, the volumetric water content of the failed dam body remained at a high level after failure. This indicates that the overtopping failure was not a complete failure. A large amount of water and saturated tailings still remained inside the residual dam body.
5. Limitations
Physical model tests cannot fully reproduce field conditions. To preserve the grain-size distribution and hydro-mechanical behavior of the tailings, the particles were not geometrically scaled. Consequently, full particle-scale, flow-scale, capillary, and permeability similarity could not be achieved simultaneously in the normal-gravity physical model. This study focuses on the relative differences in internal response of the dam body and overtopping failure evolution under continuous and intermittent rainfall. The results are not intended for direct prediction of prototype breach dimensions, failure time, or erosion rates. This does not conflict with the comparative objective of this study. In addition, this study included two complete breaching tests. The rainfall intensity and rainfall suspension duration were fixed at 120 mm/h and 10 min, respectively. Future studies should examine different rainfall intensities and rainfall suspension durations. Future work should also include replicate tests to improve the understanding of overtopping failure mechanisms under different rainfall conditions.
6. Conclusions
Based on physical model tests, this study compared the overtopping failure process of a tailings pond under continuous and intermittent rainfall. The instability evolution and internal response characteristics of the tailings dam under different rainfall patterns were revealed. The main conclusions are as follows:
- (1)
- At the time of failure, the cumulative rainfall duration in T2 was approximately 11.1% shorter than that in T1. The duration from local overtopping to overall failure in T2 was 40% shorter than that in T1.
- (2)
- Under T1, the internal monitoring indicators continued to increase and stabilized at relatively high levels before failure. Under T2, the internal responses differed between the two rainfall intervals. During the first rainfall interval, the average rise rates of the phreatic line, volumetric water content, pore water pressure, and earth pressure were approximately 0.35, 0.42, 0.29, and 0.32 times the corresponding average rise rates under T1, respectively. During the second rainfall interval, the average decline rates of the phreatic line, pore water pressure, and earth pressure were approximately 1.83, 2.79, and 3.52 times the corresponding average rise rates under T1, respectively.
- (3)
- The overtopping failure process can be divided into four stages: toe seepage, dam deformation, local overtopping, and overall sliding failure. The two scenarios showed the same stage sequence but different transition timing. In essence, both failures were composite instability processes controlled by the coupling of internal seepage weakening and external overtopping erosion.
- (4)
- Under rainfall conditions, risk identification for tailings dams should consider rainfall pattern, internal response of the dam body, and the state of the residual dam body after failure, rather than rainfall duration alone.
Author Contributions
Conceptualization, W.G., Z.S., S.S., and W.W.; methodology, W.G., Z.S., S.S., and W.W.; validation, W.G., Z.S., and S.S.; formal analysis, W.G.; investigation, W.G.; resources, Z.S., S.S., and W.W.; data curation, W.G.; writing—original draft preparation, W.G.; writing—review and editing, W.G., Z.S., S.S., and W.W.; visualization, W.G.; supervision, Z.S. and S.S.; project administration, Z.S. and S.S.; funding acquisition, Z.S. All authors have read and agreed to the published version of the manuscript.
Funding
This research was funded by the Key Project of the Special Fund for Scientific and Technological Innovation and Entrepreneurship of China Coal Technology and Engineering Group Co., Ltd., grant number 2022-ZD002, and the National Key Research and Development Program of China under the project “Key Technologies and Demonstration for Risk Prevention and Control of Typical Disasters and Accidents in Open-Pit to Underground Mining”, grant numbers 2024YFC3013904 and 2024YFC3013901.
Data Availability Statement
The data presented in this study are available from the corresponding author upon reasonable request. The data are not publicly available due to privacy restrictions.
Acknowledgments
The authors would like to express their sincere gratitude to all those who supported this study.
Conflicts of Interest
The authors declare no conflicts of interest. This study received funding from the Key Project of the Special Fund for Scientific and Technological Innovation and Entrepreneurship of China Coal Technology and Engineering Group Co., Ltd. The funder was not involved in the study design, collection, analysis, or interpretation of data, the writing of this article, or the decision to submit it for publication.
References
- Chunfu, Y. Tailings Dam. In The ECPH Encyclopedia of Mining and Metallurgy; Springer Nature: Singapore, 2026; pp. 2104–2105. [Google Scholar]
- Lima, A.T.; Bastos, F.A.; Teubner, F.J., Jr.; Neto, R.R.; Cooper, A.; Barroso, G.F. Strengths and weaknesses of a hybrid post-disaster management approach: The Doce River (Brazil) mine-tailing dam burst. Environ. Manag. 2020, 65, 711–724. [Google Scholar] [CrossRef] [Scilit]
- Buch, A.C.; Niemeyer, J.C.; Marques, E.D.; Silva-Filho, E.V. Ecological risk assessment of trace metals in soils affected by mine tailings. J. Hazard. Mater. 2021, 403, 123852. [Google Scholar] [CrossRef] [Scilit] [PubMed]
- Chen, X.; Jing, X.; Chen, Y.; Pan, C.; Wang, W. Tailings dam break: The influence of slurry with different concentrations downstream. Front. Earth Sci. 2021, 9, 726336. [Google Scholar] [CrossRef] [Scilit]
- Wang, S.; Mei, G.; Xie, X.; Guo, L. The influence of the instantaneous collapse of tailings pond on downstream facilities. Adv. Civ. Eng. 2021, 2021, 4253315. [Google Scholar] [CrossRef] [Scilit]
- Nishimura, S.; Shibata, T.; Shuku, T. Reliability-based design for earth-fill dams against severe natural disaster events. Soils Found. 2021, 61, 271–282. [Google Scholar] [CrossRef] [Scilit]
- Piciullo, L.; Storrøsten, E.B.; Liu, Z.; Nadim, F.; Lacasse, S. A new look at the statistics of tailings dam failures. Eng. Geol. 2022, 303, 106657. [Google Scholar] [CrossRef] [Scilit]
- Sun, Y.; Gu, X.; Xu, X. Experimental study on hydraulic erosion characteristics of ecological slope of tailings reservoir under rainfall. KSCE J. Civ. Eng. 2021, 25, 2426–2436. [Google Scholar] [CrossRef] [Scilit]
- Stark, T.D.; Moya, L.; Lin, J. Rates and causes of tailings dam failures. Adv. Civ. Eng. 2022, 2022, 7895880. [Google Scholar] [CrossRef] [Scilit]
- Barlow, K.; Walsh, A.; McKellar, M.; Mulligan, R.; McDougall, S.; Evans, S.G.; Take, W.A. Effect of the Presence of a Tailings Dam Beach on Breach Outflow and Erosion during Overtopping Failure. Eng. Geol. 2025, 344, 107805. [Google Scholar] [CrossRef] [Scilit]
- Koyama, A.; Fujimoto, T.; Suetsugu, D.; Fukubayashi, Y. Analysis of embankment failure mechanism in reservoirs due to rainfall infiltration during heavy rainfall. Geomat. Nat. Hazards Risk 2022, 13, 1849–1866. [Google Scholar] [CrossRef] [Scilit]
- Cheng, H.; Wu, Z.; Chen, H.; Zhou, X. Stability analysis of unsaturated–saturated soil slopes under rainfall infiltration using the rigorous limit equilibrium method. Bull. Eng. Geol. Environ. 2024, 83, 147. [Google Scholar] [CrossRef] [Scilit]
- Wang, C.; Jing, H.; Liu, L.; Li, L.; Zhang, Y. Reliability-based critical rainfall pattern curve for slope stability of tailing dams. Earth Surf. Process. Landf. 2025, 50, e70123. [Google Scholar] [CrossRef] [Scilit]
- Lin, Z.; Zhou, Z.; Jian, W.; Luo, M.; Xu, Y.; Nie, W.; Ncube, L. Analysis of Seepage Characteristics in Tailings Ponds by 3D Random Modeling. Mine Water Environ. 2025, 44, 413–429. [Google Scholar] [CrossRef] [Scilit]
- Kang, X.; Wang, S.; Su, Z.; Li, D.; Wu, W. Pore-pressure generation initiating a rainfall-induced landslide: Experimental insights and numerical modelling. Bull. Eng. Geol. Environ. 2026, 85, 106. [Google Scholar] [CrossRef] [Scilit]
- Zhu, M.; She, T.T. Numerical simulation of dam seepage characteristics of tailings reservoir under rainfall conditions. J. Water Conserv. Sci. Technol. Econ. 2021, 27, 67–71. [Google Scholar]
- Wang, G.; Zhao, B.; Lan, R.; Liu, D.; Wu, B.; Li, Y.; Li, Q.; Zhou, H.; Liu, M.; Liu, W.; et al. Experimental study on failure model of tailing dam overtopping under heavy rainfall. Lithosphere 2022, 2022, 5922501. [Google Scholar] [CrossRef] [Scilit]
- Hu, W.; Xin, C.L.; Li, Y.; Zheng, Y.; van Asch, T.; McSaveney, M. Instrumented flume tests on the failure and fluidization of tailings dams induced by rainfall infiltration. Eng. Geol. 2021, 294, 106401. [Google Scholar] [CrossRef] [Scilit]
- Wang, C.; Wang, Y.; Qin, W.; He, H.; Wang, H.; Wang, H.; Leng, X.; Chang, M.; Fang, K. Pore water pressure surge and piping failure characteristics in tailings dam: Evidence from large-scale physical modeling. Bull. Eng. Geol. Environ. 2025, 84, 509. [Google Scholar] [CrossRef] [Scilit]
- Wu, W.; Song, Z.; You, Y.; Peng, R.; Gan, Y.; Zhang, B. Pore water pressure and consolidation of tailing dams based on numerical simulation and similar modeling temporal and spatial distribution study. Sci. Rep. 2025, 15, 26122. [Google Scholar] [CrossRef] [Scilit]
- Gui, R.; He, G. The effects of internal erosion on the physical and mechanical properties of tailings under heavy rainfall infiltration. Appl. Sci. 2021, 11, 9496. [Google Scholar] [CrossRef] [Scilit]
- Chang, S.; Dong, X.; Liu, X.; Xu, X.; Zhang, H.; Huang, Y. Study on the Characteristics and Evolution Laws of Seepage Damage in Red Mud Tailings Dams. Water 2024, 16, 1487. [Google Scholar] [CrossRef] [Scilit]
- Nie, W.; Li, C.; Hu, J.; Saffari, P.; Wang, W.; Luo, M. Spatial Variation of Physical and Mechanical Properties of Tailings under Different Rainfall Intensities and the Interaction Pattern. Geomech. Geophys. Geo-Energy Geo-Resour. 2023, 9, 86. [Google Scholar] [CrossRef] [Scilit]
- Li, G.; Zhang, H.; Li, M.; Shen, Z.; Tian, A.; Wang, L. Study on Coal Wall Spalling Mechanism of Large Mining Height Working Face Based on Folding Mutation Theory. Sci. Rep. 2026, 16, 15277. [Google Scholar] [CrossRef] [Scilit]
- Zhao, T.L.; Chen, S.S.; Zhong, Q.M. Advances in Studies of Tailing Dam Break Mechanism and Process. Hydro-Sci. Eng. 2015, 1, 105–111. [Google Scholar]
- Zhang, X.K.; Sun, E.J.; Li, Z.X. Experimental Study on Evolution Law of Tailings Dam Flood Overtopping. China Saf. Sci. J. 2011, 21, 118–124. [Google Scholar]
- Liu, L.; Zhang, H.W.; Zhong, D.Y.; Miao, R.Z. Research on Tailings Dam Break Due to Overtopping. J. Hydraul. Eng. 2014, 45, 675–681. [Google Scholar]
- Mei, S.; Zhong, Q.; Chen, S.; Shan, Y. Investigation of the Overtopping-Induced Breach of Tailings Dams. Comput. Geotech. 2022, 149, 104864. [Google Scholar] [CrossRef] [Scilit]
- Chang, M.; Qin, W.; Wang, H.; Wang, H.; Wang, C.; Zhang, X. Study on the Evolution of a Flooded Tailings Pond and Its Post-Failure Effects. Water 2023, 15, 173. [Google Scholar] [CrossRef] [Scilit]
- Hou, Y.; Miao, C.; Zhu, D.; Li, Z.; Du, F.; Cao, Z. Flow Mechanism of Grouting Slurry in Rough Fracture Based on CFD-DEM Coupling Method. Processes 2026, 14, 1307. [Google Scholar] [CrossRef] [Scilit]
- Wang, M.; Li, L. Slope stability analysis considering degradation of soil properties induced by intermittent rainfall. Water 2025, 17, 814. [Google Scholar] [CrossRef] [Scilit]
- Zhang, C.; Wang, S.; Wang, L.; Chen, Y.; He, Y.; Li, X.; Fang, K. Hydrological response and stability of landslide with cracks under intermittent rainfall: Integrating physical modeling, numerical simulation, and field investigations. J. Hydrol. 2025, 663, 134316. [Google Scholar] [CrossRef] [Scilit]
- Jayakody, S.H.S.; Uzuoka, R.; Ueda, K.; Xu, J. Unsaturated slope behavior under antecedent intermittent rainfall patterns: Centrifuge and numerical study. Acta Geotech. 2023, 18, 5773–5790. [Google Scholar] [CrossRef] [Scilit]
- Zhong, W.; Zhu, Y.; He, N. Physical Model Study of an Intermittent Rainfall-Induced Gently Dipping Accumulation Landslide. Water 2022, 14, 1770. [Google Scholar] [CrossRef] [Scilit]
- Yang, Y.; Cai, R.; Zhang, G.; Su, S.; Liu, W. Evaluating and analyzing the stability of loess slope using intermittent rainfall and various rainfall patterns. Arab. J. Geosci. 2022, 15, 218. [Google Scholar] [CrossRef] [Scilit]
- GB/T 50123-2019; Standard for Geotechnical Testing Method. Ministry of Housing and Urban-Rural Development of the People’s Republic of China: Beijing, China; China Architecture & Building Press: Beijing, China, 2019.
- Hamze-Guilart, M.; Ayres da Silva, L.A.; Ayres da Silva, A.L.M.; Boscov, M.E.G. Analyzing the Effect of Drainage on the Stability of Tailings Dams Using the Interpretation of Cross-Correlations. Sensors 2025, 25, 1833. [Google Scholar] [CrossRef] [Scilit]
- Alizadeh, P.; Latifi, M. The study of the factors affecting phreatic line position and stability in upstream tailings dams. Results Eng. 2025, 25, 104092. [Google Scholar] [CrossRef] [Scilit]
- Zhao, Y.-S.; Zhou, X.; Jing, X.-F.; Liu, K.-H.; Ye, C.; Zhang, X.-S. Experimental Study on Overtopping Failure Mode of Reinforced Tailings Dam. In International Conference on Advances in Energy and Environmental Science; Atlantis Press: Dordrecht, The Netherlands, 2015; pp. 1414–1419. [Google Scholar]
- Duan, Z.; Chen, J.; Xie, J.; Li, Q.; Zhang, H.; Chen, C. Study on the Evolution Characteristics of Dam Failure Due to Flood Overtopping of Tailings Ponds. Water 2024, 16, 2406. [Google Scholar] [CrossRef] [Scilit]

Disclaimer/Publisher’s Note: The statements, opinions and data contained in all publications are solely those of the individual author(s) and contributor(s) and not of MDPI and/or the editor(s). MDPI and/or the editor(s) disclaim responsibility for any injury to people or property resulting from any ideas, methods, instructions or products referred to in the content. |
© 2026 by the authors. Licensee MDPI, Basel, Switzerland. This article is an open access article distributed under the terms and conditions of the Creative Commons Attribution (CC BY) license.