


Abstract
The residual non-aqueous phase liquid (NAPL) within low-permeability lenses of aquifers is a major contributor to “tailing”, a phenomenon that complicates the remediation of NAPL-contaminated sites. A fundamental challenge in addressing this issue is the lack of understanding of the primary controlling factors and underlying effects of NAPL residuals in these aquifer lenses. This study aims to identify the key factors and mechanisms affecting NAPL residuals in low-permeability lenses through a series of experimental approaches. These include soil column simulation experiments on NAPL residuals in various low-permeability lenses, adsorption experiments on aquifer and lens particles, pore mercury intrusion testing, and particle size distribution analysis. The experiments provided valuable data on residual NAPL saturation SR, particle adsorption capacity, particle size, gradation, and pore size and distribution in different lenses. Using a mass conservation approach, the particle adsorption contributed less than 0.5% to the total NAPL residuals, while retention accounted for more than 99.5%, highlighting that retention is the dominant mechanism governing NAPL persistence in these lenses. The mechanism underlying this result was further clarified through an analysis of particle size characteristics. Correlation analysis was conducted to examine the relationships between residual NAPL and macropore porosity (nmax, diameter > 60 μm), mesopore porosity (nmid, diameter = 30~60 μm), and small pore porosity (nmin, diameter < 30 μm). The results demonstrated that mesopores exhibited the strongest correlation with NAPL retention, due to their pronounced capillary action and sufficient storage capacity for NAPL.
1. Introduction
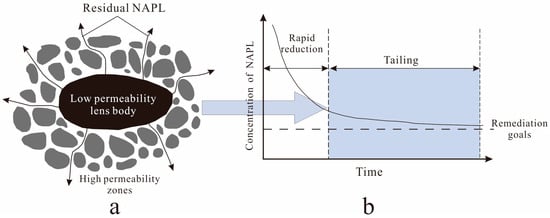
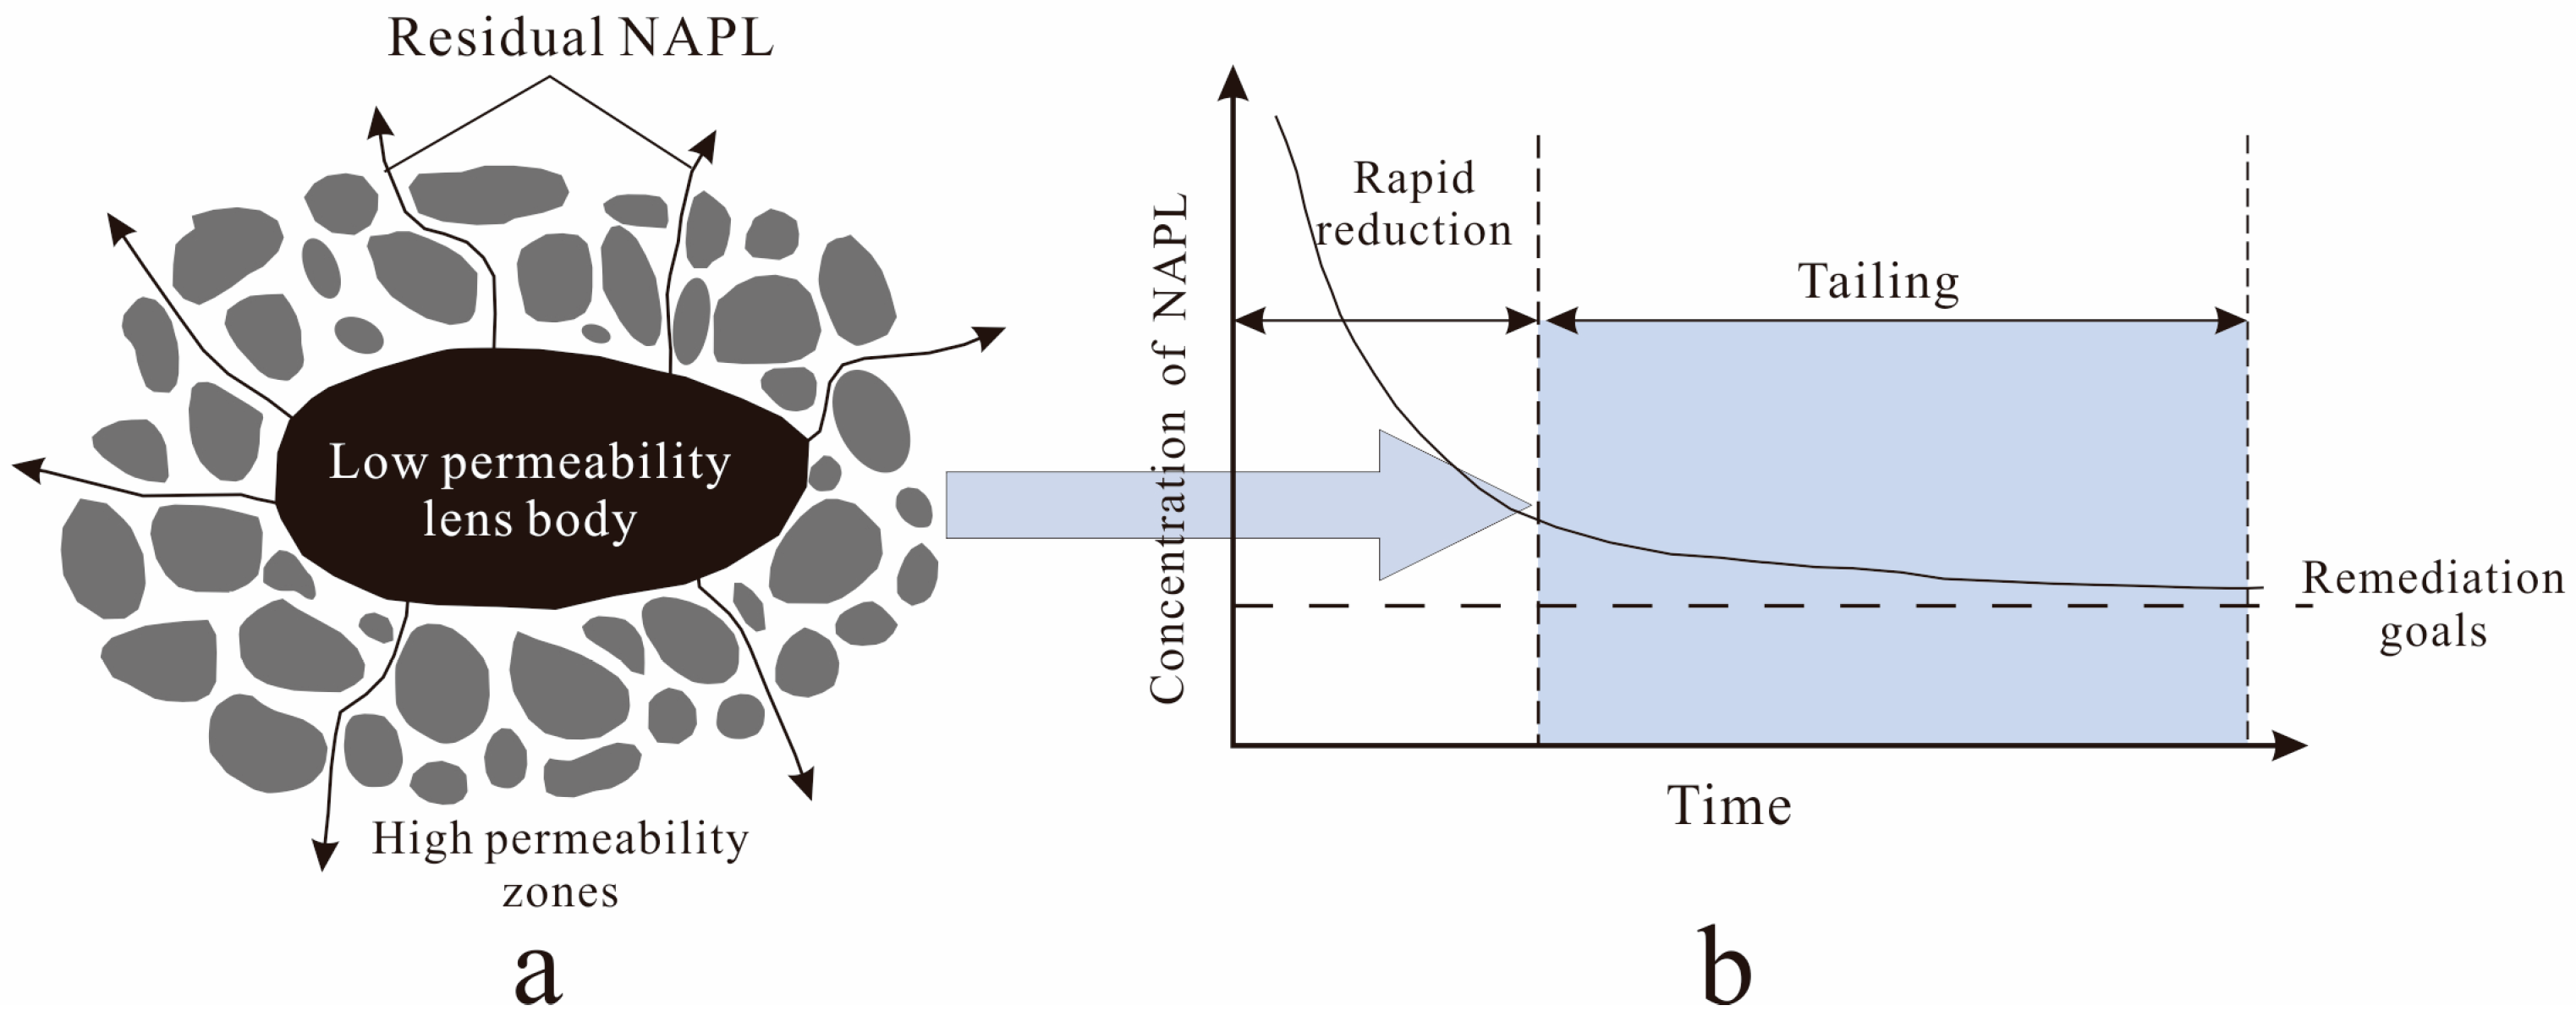
In recent years, the increased utilization of organic chemical products has led to a significant influx of organic compounds into the subsurface environment during processes such as refining, storage, transportation, and usage [1,2,3,4]. Among these compounds, petroleum and petroleum-based chemical pollutants frequently manifest in water as non-aqueous phase liquid (NAPL) [5,6,7]. NAPL can be classified into two categories according to their density. One category is Light Non-Aqueous Phase Liquids (LNAPLs) with a density less than that of water. Common LNAPLs include diesel, benzene, xylene, etc. The other category is Dense Non-Aqueous Phase Liquids (DNAPLs) with a density greater than that of water. Common DNAPLs include tetrachloroethylene, chlorinated organic solvents, etc. NAPL pollutants are characterized by their high toxicity, chemical stability, and resistance to degradation [8,9,10], which contributes to their prolonged persistence in subsurface soil and water environments, thereby posing significant threats to both ecological and human health. During the remediation of NAPL-contaminated sites, it has been observed that the “tailing” phenomenon, resulting from residual NAPL in low-permeability lenses (a low-permeability lens refers to a geological body whose permeability is poorer than that of the surrounding aquifer media and whose volume is much smaller than that of the aquifer) of aquifers (Figure 1), is a primary factor contributing to the failure of pollution treatment efforts [11,12,13,14]. Therefore, it is imperative to identify the key controlling factors and mechanisms that affect the presence of residual NAPL in low-permeability lenses of aquifers to enhance the effectiveness of NAPL pollution remediation strategies.
Figure 1.
Residual NAPL in low-permeability lens body (a) leads to “tailing” (b).
To investigate the effect of aquifer lenses on NAPL residuals, researchers both domestically and internationally have undertaken a series of studies. The findings suggest that NAPL residuals in aquifers are primarily composed of pore retention and particle adsorption [15,16,17]. The particle size of the lens plays a significant role in affecting NAPL residuals: in fine-grained media, coarser lenses facilitate NAPL migration, thereby reducing residuals; conversely, in coarse-grained media, finer lenses impede migration, resulting in increased NAPL residuals [18,19,20]. Additionally, alterations in the pore structure of the lenses also affect NAPL residuals. Smaller pores elevate the critical displacement pressure, hindering water flow from overcoming capillary forces to penetrate low-permeability regions. In these zones, residual NAPL aggregates form NAPL-contaminated areas, consequently increasing NAPL residuals [21,22,23,24,25,26].
In summary, NAPL residuals in aquifers are affected by particle adsorption and pore retention mechanisms. Variations in NAPL residuals are associated with the grain size and pore characteristics of aquifer lenses. However, the extent to which NAPL residuals are sensitive to particle adsorption and pore retention, as well as the underlying mechanisms driving these effects, remain inadequately understood. To investigate this issue, this study designed soil column simulation experiments that varied permeability coefficient ratios Kmn, which represent the ratio of the permeability coefficient of the aquifer medium to the lens. By modifying the permeability of the lenses, this study simulated aquifers containing different lens types to examine the variations in NAPL residuals under diverse lens conditions. Additionally, particle adsorption experiments were conducted to quantify the maximum adsorption capacity of the lenses for NAPL. Utilizing the law of mass conservation, this study calculated the sensitivity ranking of NAPL residuals in relation to particle adsorption and pore retention, thereby identifying the primary factors that control NAPL behavior in aquifer lenses. Furthermore, particle size distribution experiments and mercury intrusion tests were performed to ascertain the grain size and pore characteristics of both aquifers and lenses. By integrating the influence rankings of particle adsorption and retention on residual NAPL, correlation analysis was employed to elucidate the mechanisms that affect NAPL residuals in aquifer lenses.
2. Materials and Methods
To achieve the objectives of this study, a series of experiments were designed, including soil column simulation experiments, particle adsorption experiments, mercury intrusion porosimetry, and particle size analysis. Furthermore, a standard curve for NAPL concentration was established based on experimental measurements. The materials and methods employed in each experiment are detailed below.
2.1. Soil Column Simulation Experiment
2.1.1. Experimental Materials
No. 0 diesel is a non-toxic and easily accessible LNAPL. Its properties, such as density, viscosity, solubility, etc., are similar to those of common NAPL pollutants like xylene, crude oil, and aviation kerosene. So, in this experiment, non-toxic and available No. 0 diesel was utilized as a substitute for NAPL pollutants. The properties of the diesel are summarized in Table 1. To prevent microbial degradation from affecting the experimental results [27], white quartz sand with low clay content was selected to simulate the aquifer medium. This sand was procured from Henan Minghai Environmental Technology Co., Ltd. (Zhengzhou City, Henan Province, China) and underwent sterilization at high temperatures (105) prior to its application. The physical properties of the quartz sand are outlined in Table 2.
Table 1.
Physicochemical properties of diesel used in NAPL experiments.
Table 2.
Physical and permeability characteristics of quartz sand used in NAPL simulations.
The experimental setup included a HACH DR3900 spectrophotometer, an emulsifier, a HACH DRB200 digester, 500 mL beakers, pipettes, and HACH reagent tubes.
2.1.2. Experimental Apparatus and Design
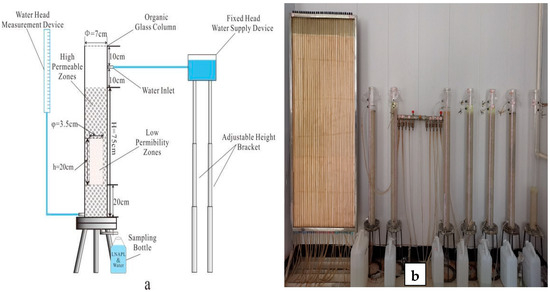
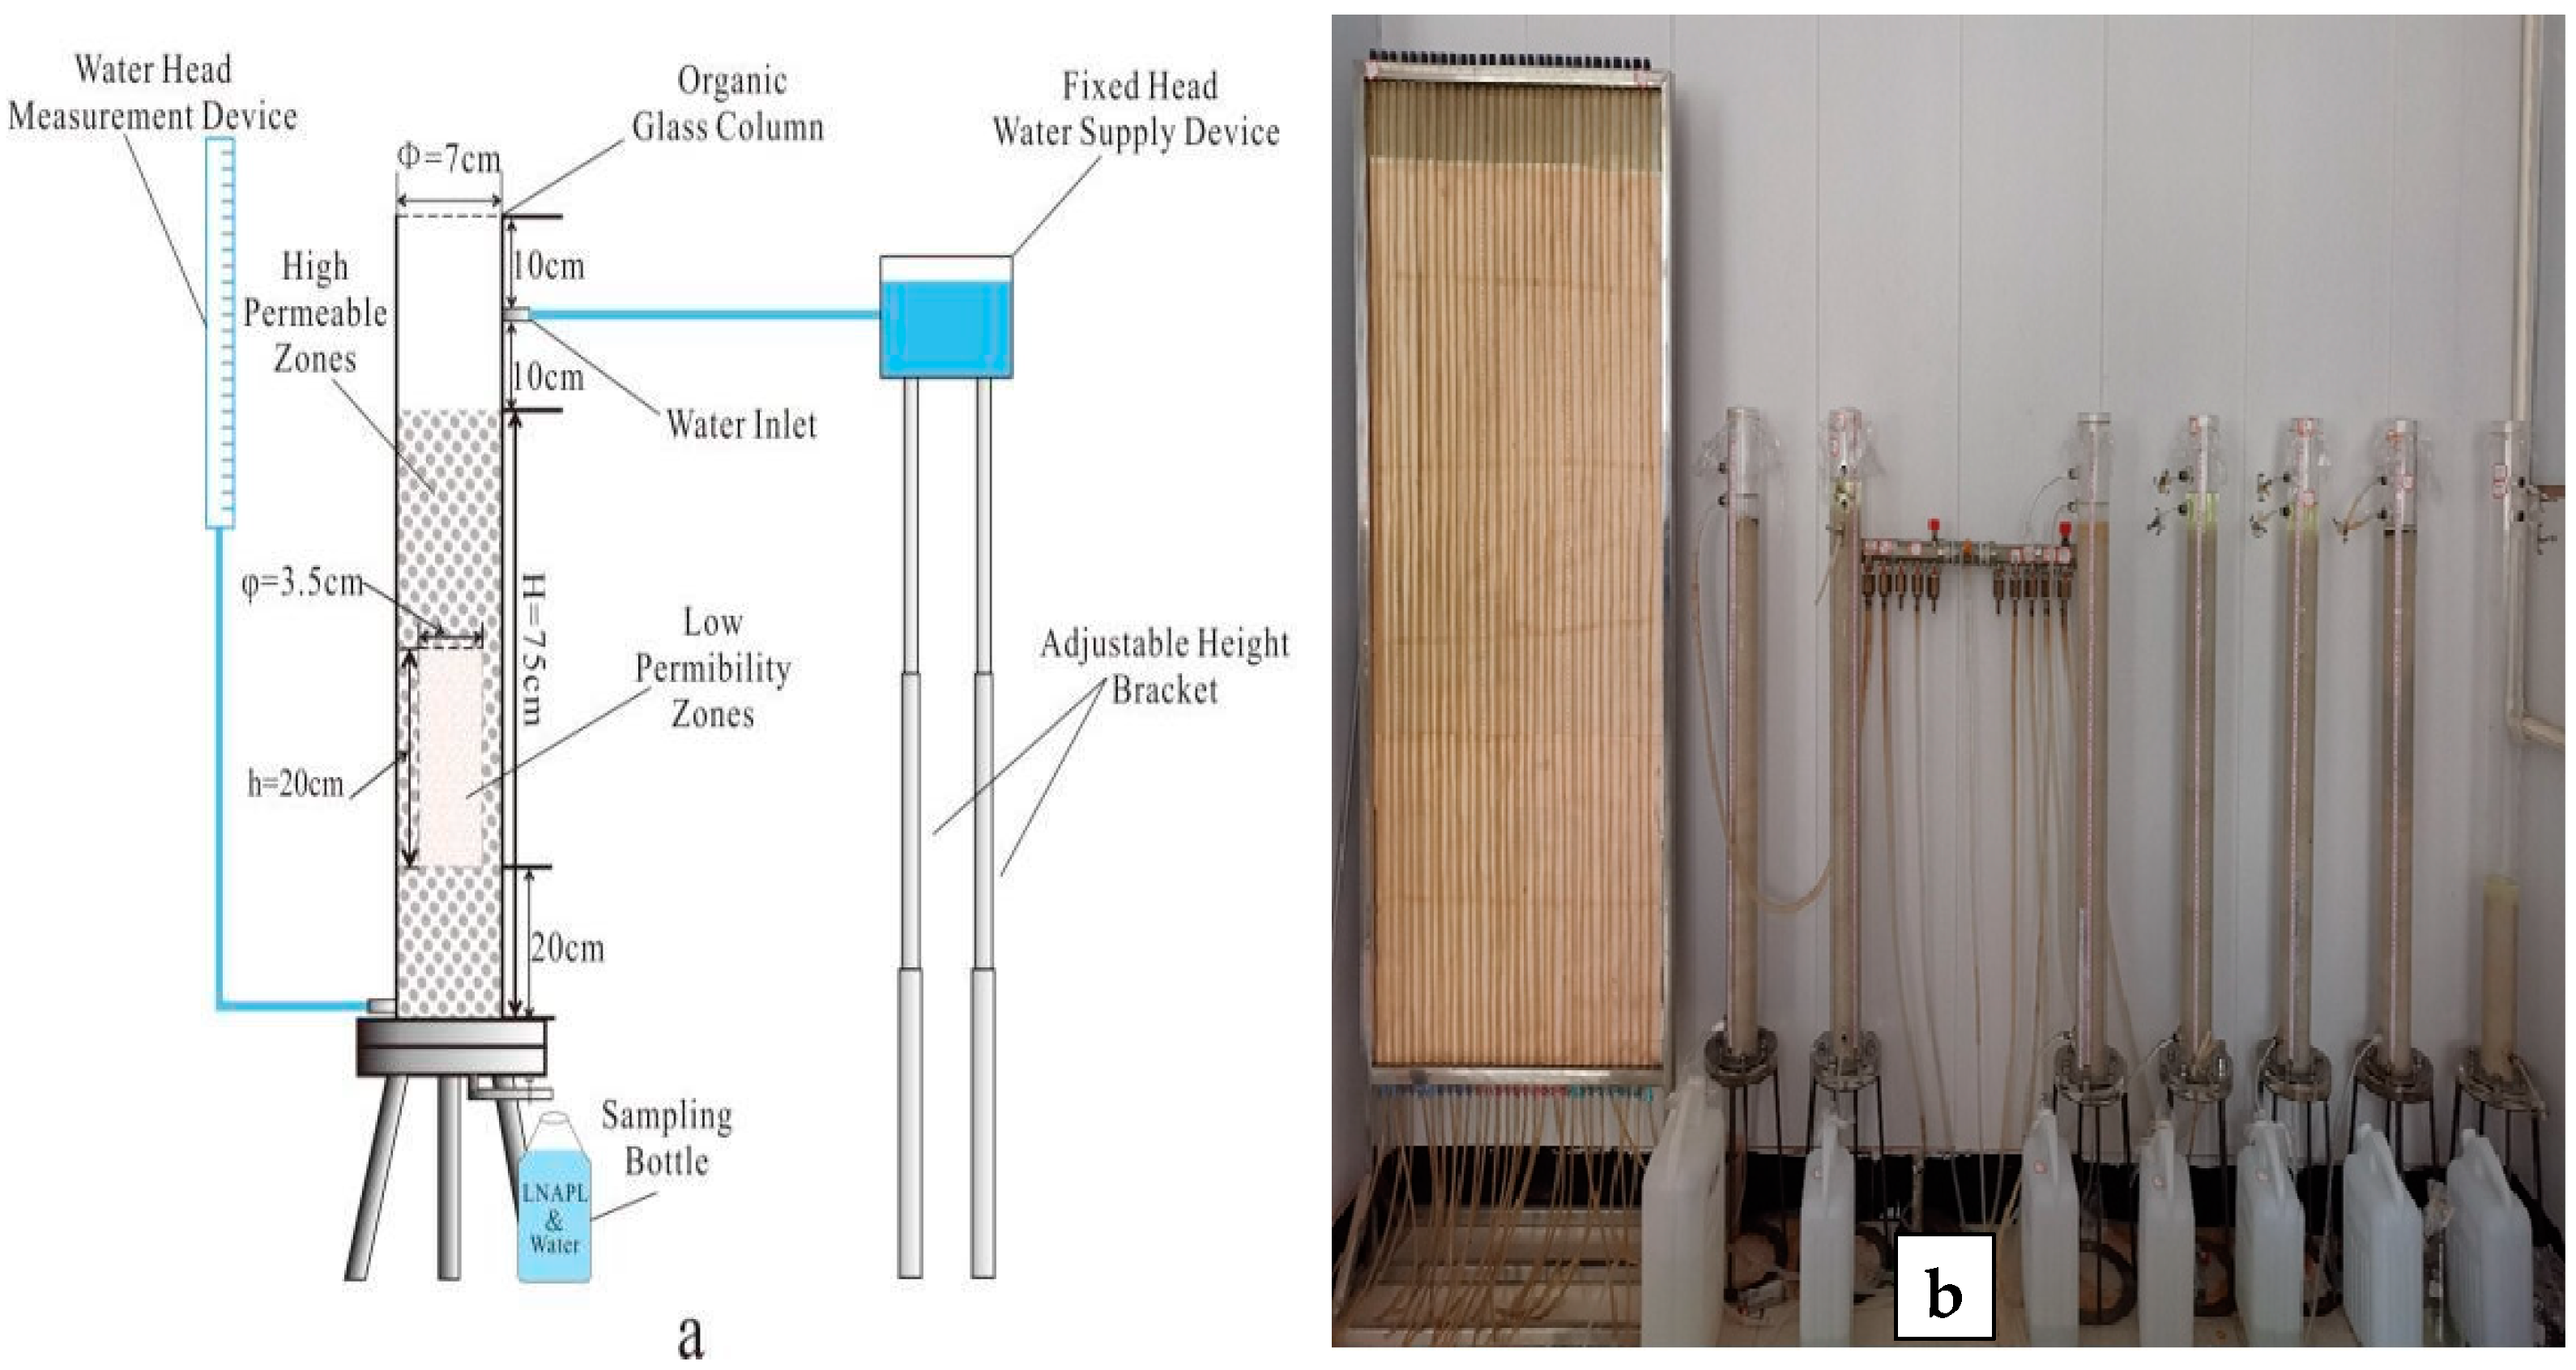
In this study, soil column simulation experiments were employed to investigate the variations in NAPL residuals under varying conditions by modifying the permeability, size, and hydraulic gradient of the lens. The soil column was constructed from polymethyl methacrylate (PMMA), measuring 95 cm in height and 7 cm in diameter, with a maximum filling height of 75 cm. A sampling port and a downstream head measurement device were installed at the base of the column, while an inlet connected to a constant-head water supply was positioned 10 cm from the top (Figure 2a). The lens was designed with a diameter of φ = 3.5 cm and a height of h = 20 cm, taking into account the dimensions of the soil column, the flow characteristics of liquids within the column, and the effect of the lens on NAPL residuals. Based on the permeability coefficients of the media in Table 2, five levels of Kmn were established at 1, 5, 11, 23, and 50. Previous research indicates that the hydraulic gradient of groundwater in plain areas typically ranges from 1‰ to 12‰ [28,29]. For the permeability coefficients of the media utilized in this experiment, the flow velocity was set at 0.14 cm/min to facilitate monitoring; the filled soil column is shown in Figure 2b. A comprehensive overview of the experimental design is summarized in Table 3.
Figure 2.
Schematic diagram of filling soil column (a) and photos of completed filling (b).
Table 3.
Experimental design for soil column simulations of NAPL residuals.
Following the completion of the packing process, NAPL was introduced from the top of the column with the assistance of a glass rod to facilitate the flow. Liquid samples were collected from the sampling port located at the bottom of the column, and the injection of NAPL was halted once the collected liquid was entirely composed of NAPL. At this juncture, the total volume of NAPL injected into the plexiglass column (V0) was recorded. Subsequently, the constant head water supply apparatus was activated, and the experiment commenced in accordance with the design in Table 3. Samples were taken from the sampling port at the base of the soil column, and the volume of the effluent was documented. The concentration of NAPL in the effluent was measured at various time intervals (NAPL concentration determination method in Section 2.5) until a steady concentration was achieved, at which point the experiment was complete. The total volume of NAPL discharged (Vc) was calculated utilizing the mass conservation principle. Residual NAPL saturation (Sr) in each soil column was determined using Equation (1) [30,31,32].
where V represents the total pore volume, V0 represents the total volume of NAPL injected into the plexiglass column, and Vc represents the volume of NAPL discharged.
2.2. Adsorption Experiment
2.2.1. Experimental Equipment and Materials for Adsorption Experiments
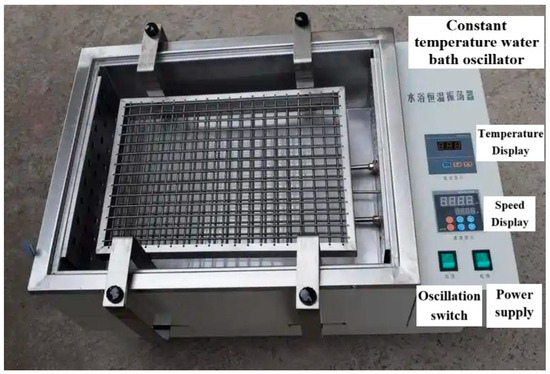
The materials and equipment utilized in the adsorption experiment comprised a THZ-82 constant temperature water bath oscillator (Figure 3), 250 mL stoppered Erlenmeyer flasks, quartz sand (Table 2), a HACH DR3900 spectrophotometer, and an FA2004N electronic balance.
Figure 3.
Image of THZ-82 thermostatic oscillator used in adsorption experiments.
2.2.2. Experimental Design for Adsorption Experiments
- 1.
- Adsorption Equilibrium Time
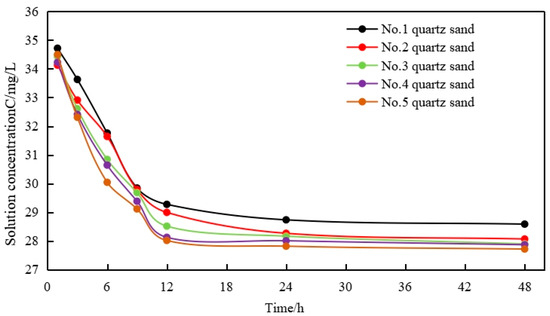
In the work of Xia et al. [33], the adsorption kinetics experiments revealed that NAPL is adsorbed by fine micro-sized sand aggregates in less than 24 h. To ensure the accuracy of the data obtained, the adsorption time between quartz sand and NAPL solution in this study was established at intervals of 1 h, 3 h, 6 h, 9 h, 12 h, 24 h, and 48 h. A total of 150 mL of NAPL solution was measured using a graduated cylinder and subsequently added to seven stoppered Erlenmeyer flasks, labeled 1 through 7. The thermostatic water bath oscillator was set to the desired temperature and oscillation frequency, with a preheating period of 20 min following stabilization of the water temperature at 20 °C, after which the flasks were placed into the oscillator. Subsequently, 3 g of quartz sand was introduced into each flask, and the water bath oscillator was activated. One flask was removed from the oscillator at each of the specified time intervals: 1 h, 3 h, 6 h, 9 h, 12 h, 24 h, and 48 h. For the determination of NAPL concentration (NAPL concentration determination method in Section 2.5), 2 mL of the middle-layer solution was extracted from each flask. A curve depicting the relationship between NAPL concentration (C) and time (t) was plotted. The experiment was concluded when the slope of the curve stabilized, indicating that the medium had reached adsorption equilibrium.
- 2.
- Theoretical Maximum Adsorption Capacity
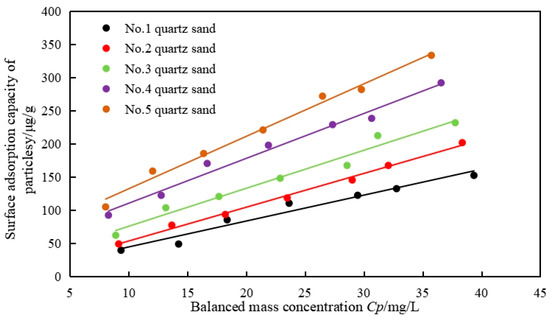
A series of NAPL solutions with varying concentration gradients, including the maximum NAPL concentration observed at the conclusion of the soil column experiment, was prepared. For each concentration, 150 mL of NAPL solution was transferred into a 250 mL stoppered Erlenmeyer flask. The temperature and oscillation frequency of the thermostatic water bath oscillator were adjusted, and once the water temperature stabilized at 20 °C, the flasks were placed into the oscillator for a preheating period of 20 min. Subsequently, 3 g of quartz sand was added to each flask, and the oscillator was activated. Oscillation was ceased once the adsorption equilibrium time was attained. A 2 mL sample from the middle layer of each solution was extracted, and NAPL concentration was determined (NAPL concentration determination method in Section 2.5). The adsorption capacity of each medium was calculated using the mass conservation method, and an isothermal adsorption curve was plotted and fitted. Utilizing the packing mass of the lens in Table 3 and NAPL concentration at the conclusion of the soil column experiment, the maximum adsorption capacity of each lens for NAPL was calculated.
2.3. Mercury Intrusion Porosimetry
2.3.1. Experimental Equipment and Materials for Mercury Intrusion Experiment
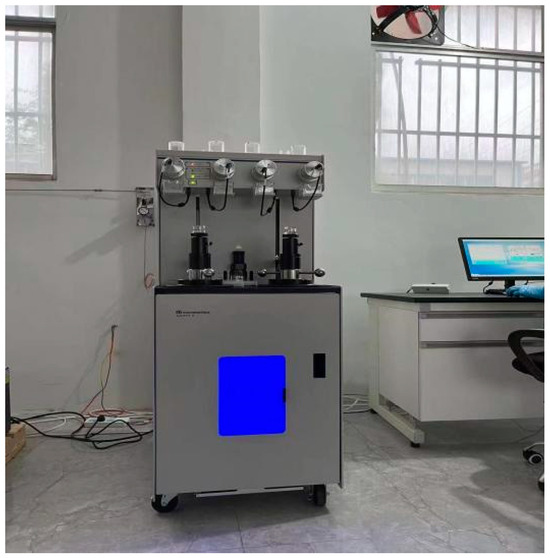
The mercury intrusion porosimetry test was conducted at Qinghai University, and experiment was MicroActive Autopore V 9620 mercury intrusion porosimeter, produced by Micromeritics, Norcross, GA, USA (Figure 4). The principal materials employed in the experiment comprised quartz sand, with its specifications and physical properties in Table 2, as well as an FA2004N electronic balance.
Figure 4.
Image of mercury intrusion porosimeter for pore structure analysis.
2.3.2. Experimental Design for Mercury Intrusion Porosimetry
According to the principles of mercury intrusion porosimetry [34,35], the testing process begins with mercury entering larger pores at a specified pressure. The porosimeter measures these larger pores. As the pressure is incrementally increased, mercury progressively penetrates smaller pores, thereby facilitating the determination of pore size and the characteristics of pore volume distribution within the sample.
To measure the pore size distribution of each lens, a predetermined amount of quartz sand was accurately weighed and subsequently placed into 5 cc sample tubes. Mercury intrusion experiments were performed to ascertain the pore size distribution of each sample.
2.4. Particle Size Analysis
2.4.1. Experimental Apparatus and Materials for Particle Size Analysis
The primary apparatus utilized for particle size analysis comprised sieves with varying mesh sizes and a Mastersizer 3000 laser particle size analyzer (The Mastersizer 3000 laser particle size analyzer is produced by Malvern Instruments Limited in Malvern, UK). The principal materials employed in this analysis included quartz sand, with the specifications and physical properties in Table 2, as well as an FA2004N electronic balance.
2.4.2. Particle Size Analysis Design
The analysis boundaries were established utilizing both the sieving method and the laser particle size analyzer, tailored to the characteristics of the media under investigation. For the aquifer media, specifically Quartz Sand 1, which exhibits relatively large particle sizes, the sieving method was employed. A sample weighing 50 g of Quartz Sand 1 was accurately measured using a balance and subsequently placed in a series of sieves arranged in descending order of mesh size, from top to bottom. The sieves were subjected to horizontal shaking to facilitate the measurement of the mass of quartz sand retained on each sieve. A particle size distribution curve was generated based on the mass percentage of quartz sand corresponding to various particle sizes, thereby yielding the results of the particle size analysis. In contrast, for Quartz Sands 2, 3, 4, and 5, the particle size distribution was determined through the use of a laser particle size analyzer. The percentage of particles within each size range was quantified, and cumulative particle size curves were constructed to derive the particle size analysis results.
2.5. NAPL Concentration Determination
The liquid collected in the sampling bottles from the soil column simulation experiment comprised a mixture of NAPL and water. To accurately quantify NAPL concentration in the effluent, a standard curve correlating NAPL concentration with chemical oxygen demand (CODCr) was developed by preparing standard solutions [36]. Subsequently, NAPL concentration in the effluent was determined using this standard curve.
2.5.1. Experimental Apparatus and Materials for NAPL Concentration Determination
HACH DR3900 spectrophotometer(The HACH DR3900 spectrophotometer is produced by Hash Corporation in Loveland, CO, USA), an emulsifier, HACH DRB200 digester, 500 mL beakers, pipettes, and HACH reagent tubes.
2.5.2. Establishment of Standard Curve
The procedure for establishing the standard curve was conducted as follows: Eight NAPL–water mixed solutions were prepared, exhibiting concentration gradients of 20 mg/L, 50 mg/L, 100 mg/L, 200 mg/L, 400 mg/L, 600 mg/L, 800 mg/L, and 1200 mg/L, with each solution having a volume of 500 mL in separate beakers. The emulsifier speed was set to 5000 r/min, and each solution was emulsified from low to high concentration for a duration of 3 min. Following the emulsification process, 2 mL of each sample was extracted using a pipette and transferred into HACH CODCr tubes containing potassium dichromate as the indicator. The samples were then digested at a temperature of 150 °C for 2 h utilizing a HACH DRB200 digester. After digestion, the tubes were allowed to cool to room temperature, and the CODCr values of the samples were measured using a spectrophotometer.
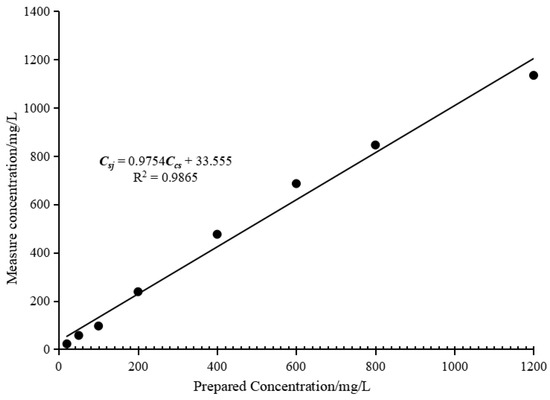
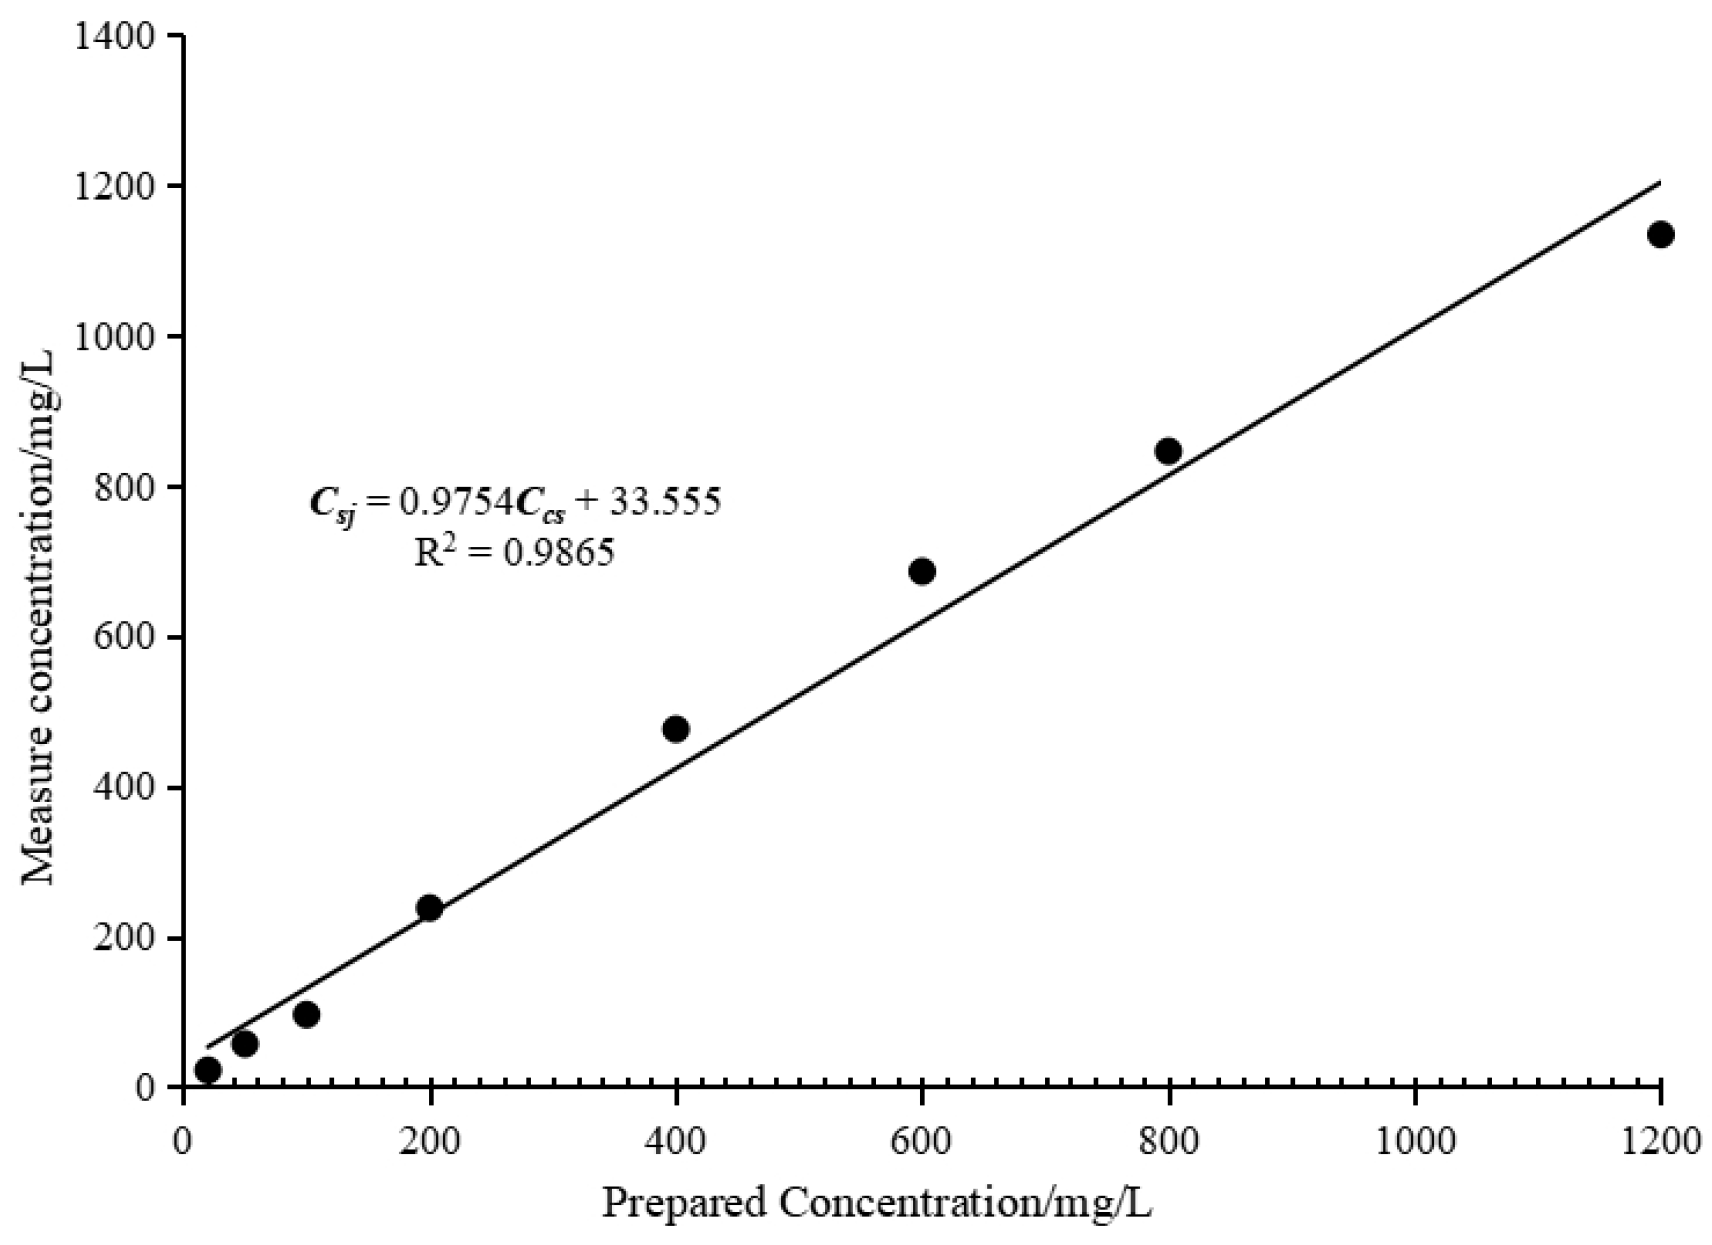
A standard curve correlating the concentration of NAPL with CODCr was established using the aforementioned procedure (Figure 5). The fitted equation is expressed as Csj = 0.9754 Ccs + 33.555, where Csj represents NAPL concentration in the prepared solution and Ccs represents NAPL concentration as determined by the spectrophotometer. The correlation coefficient (R2) was 0.987, indicating a strong degree of correlation and thereby validating the feasibility of utilizing CODCr measurements to quantify diesel concentration. All experiments conducted for the determination of NAPL concentration in this study adhered to this method for NAPL quantification.
Figure 5.
NAPL relationship between NAPL concentration and CODCr for quantification.
3. Results
3.1. Soil Column Experiment Results
3.1.1. Experimental Results of Soil Columns with Different Kmn
Following the conclusion of the soil column simulation experiments, the residual saturation of NAPL in each experimental group Sr, the residual saturation of NAPL in the lens SR, and the concentration of NAPL in the solution of each experimental group CD are summarized in Table 4.
Table 4.
Results of soil column simulation experiments for NAPL residuals.
3.1.2. Relationship Between Overall Sr and Kmn
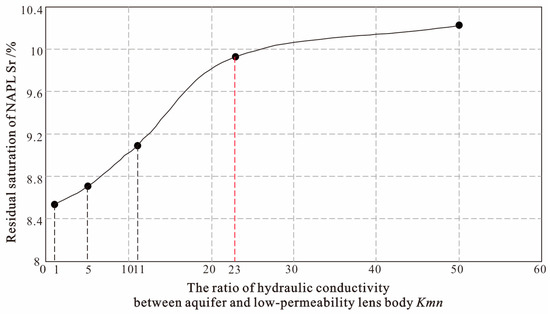
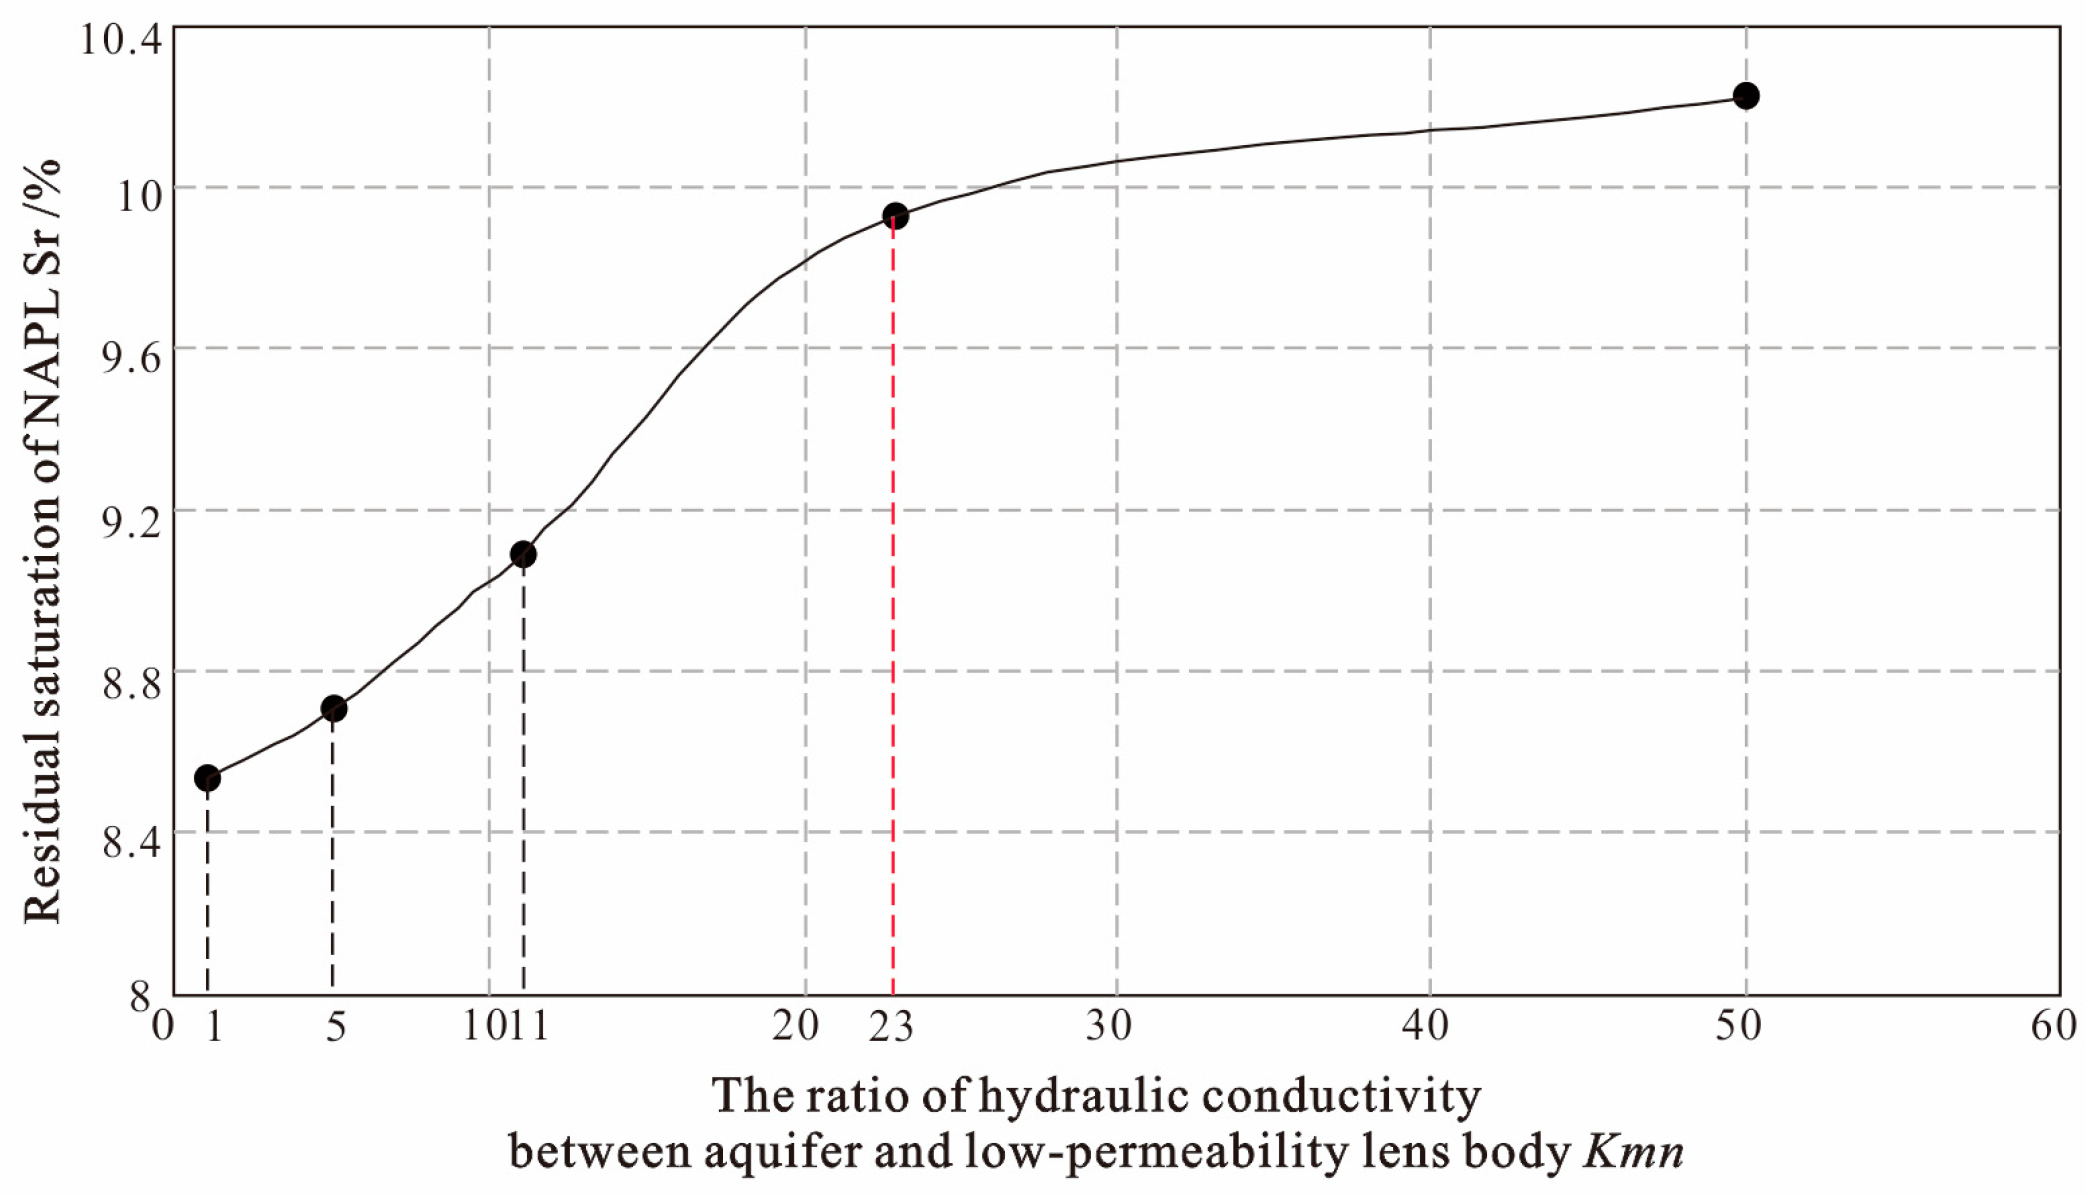
Low-permeability lenses significantly affect the overall Sr of NAPL within the medium. The data obtained from the soil column simulation experiments (Table 4) illustrate the relationship between Sr and Kmn (Figure 6).
Figure 6.
Relationship curve between NAPL residual saturation (Sr) and permeability coefficient gradient (Kmn).
As shown in Figure 6, Sr tends to increase with an increase in Kmn. However, when Kmn surpasses 23, the slope of the curve exhibits a reduction in steepness. For Kmn < 23, variations in Kmn exert a more significant impact on Sr compared to the range where Kmn is between 23 and 50.
According to existing studies, NAPL residuals in aquifers characterized by lenses predominantly arise from adsorption and entrapment processes. To investigate the sensitivity of NAPL residuals to particle adsorption and pore entrapment within low-permeability lenses, a series of particle adsorption experiments were conducted on both the aquifer and the lenses. The results of these experiments are detailed in Section 3.2.
3.2. Adsorption Experiment Results
3.2.1. Adsorption Equilibrium Time
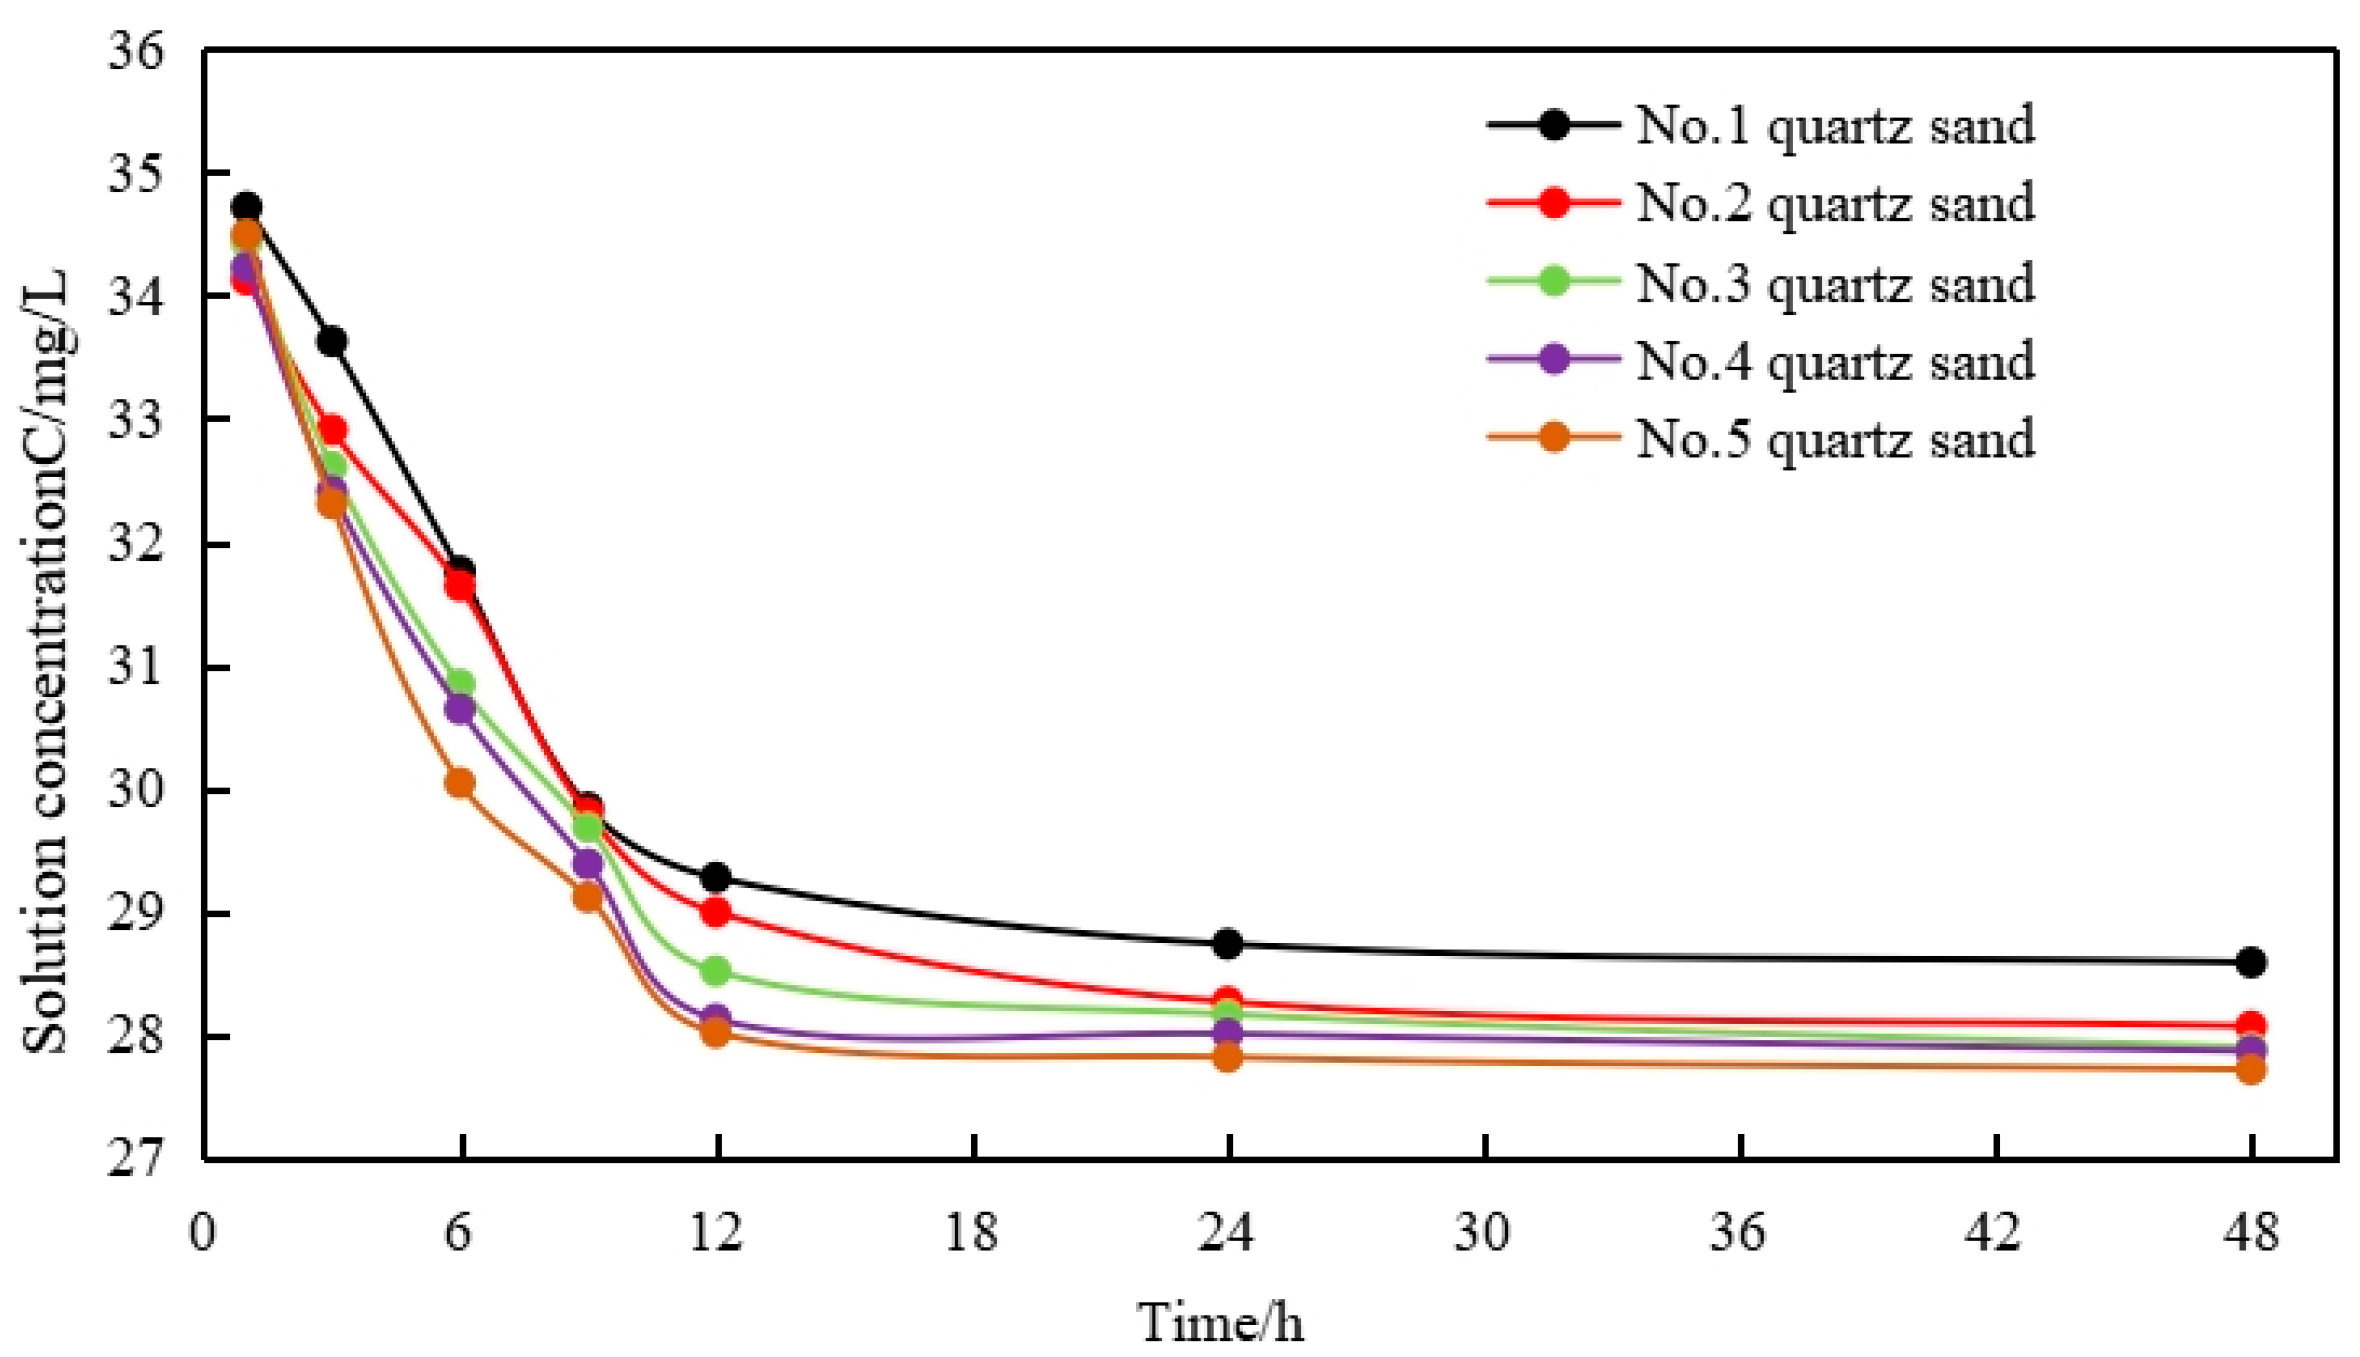
Utilizing five types of quartz sand (1, 2, 3, 4, and 5) as adsorbents, an NAPL solution with a concentration of 35.2 mg/L was formulated, informed by the results from the soil column experiment (Table 4). An adsorption kinetics experiment was subsequently performed, and analysis of the adsorption kinetics curve (Figure 7) revealed that the time required to reach adsorption equilibrium was 24 h.
Figure 7.
Adsorption kinetics curves of different quartz sands.
3.2.2. Maximum Adsorption Capacity
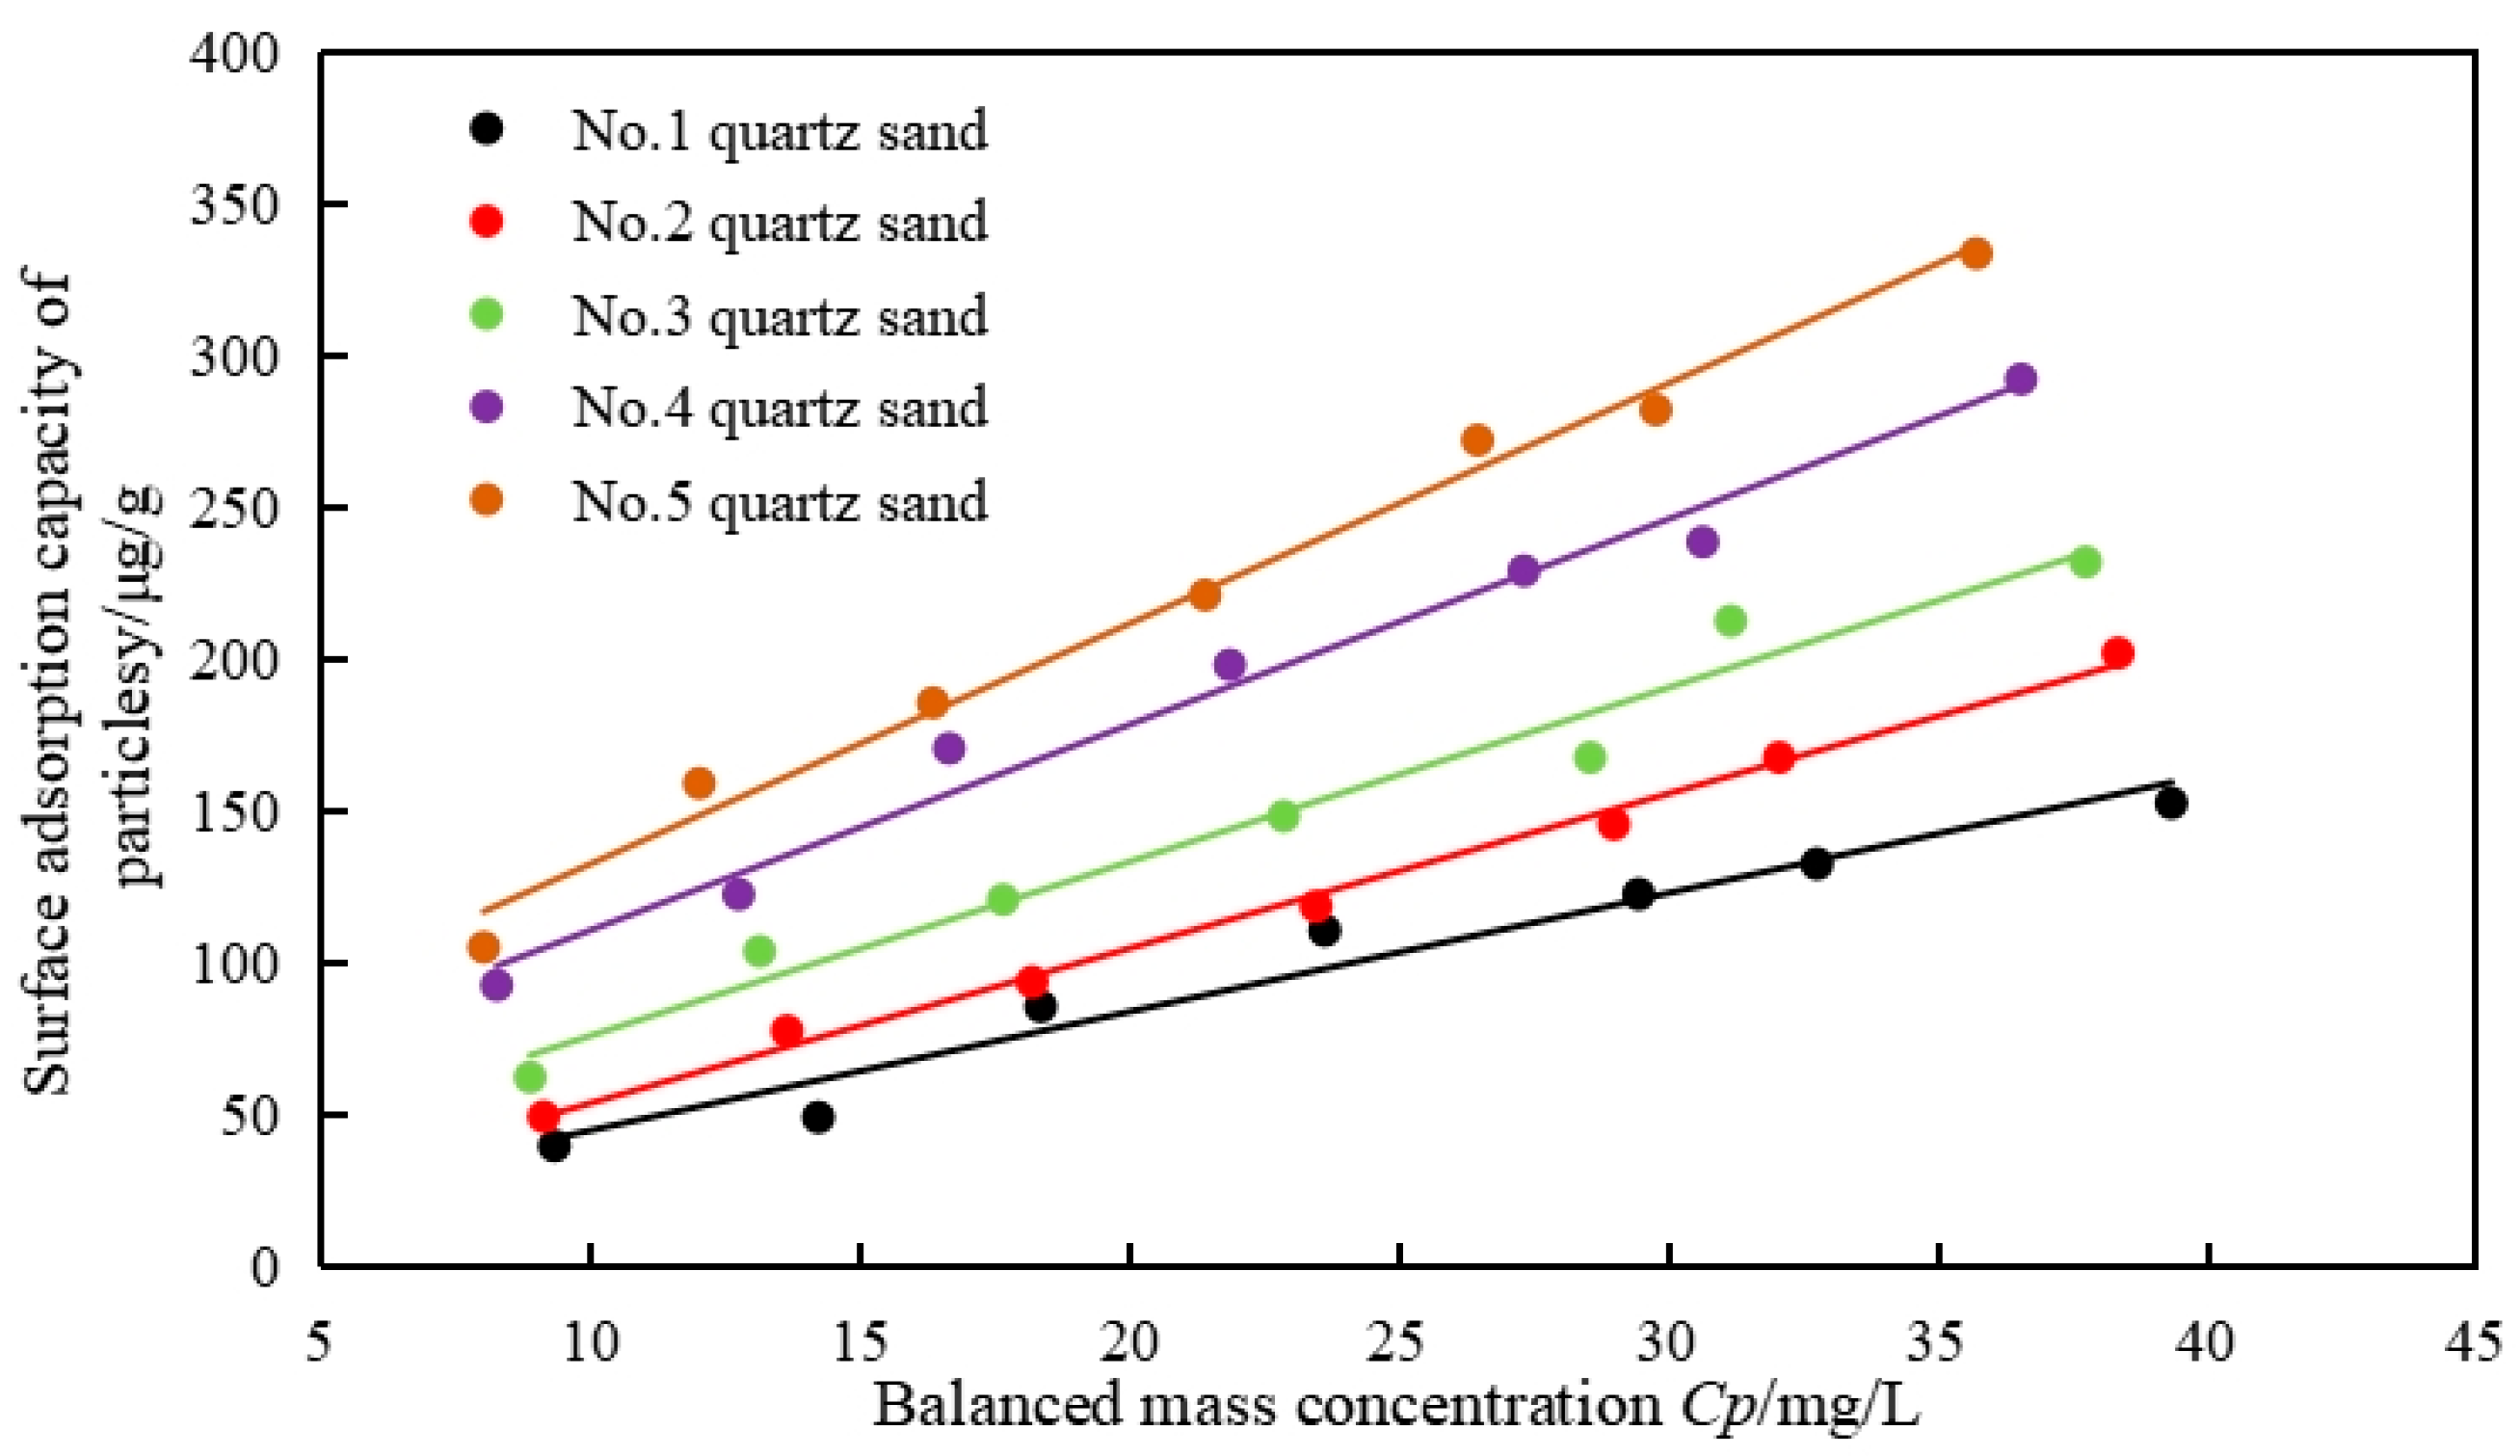
Isothermal adsorption experiments were conducted over a duration of 24 h, utilizing varying concentrations of NAPL solutions. Figure 8 illustrates the isothermal adsorption curves corresponding to each individual medium. To ascertain the theoretical maximum adsorption capacity of each medium, a Langmuir-type equation was employed, which delineates the relationship between the theoretical maximum adsorption capacity of the particle surface (y, µg/g) and the equilibrium solute concentration (CP, mg/L) in the solution. All experimental data were analyzed using the Langmuir adsorption model, and the isothermal adsorption equilibrium equations for the two different media are presented in Table 5. The NAPL concentration in the solution, as recorded upon the completion of the soil column experiment CD (Table 4), represents the equilibrium concentration. The y of the quartz sand particle surfaces was determined by substituting the corresponding CD into the adsorption equilibrium equation.
Figure 8.
Isothermal adsorption curves of various quartz sands.
Table 5.
Adsorption isotherm equations for quartz sands of varying particle sizes.
Based on the theoretical maximum adsorption capacity y in Table 5, in conjunction with mt (Table 3) and ρo (Table 1), the maximum adsorption capacity in the lens body Sc can be determined as follows:
Based on SR in Table 4, the porosity n in Table 2, and the lens body volume Vt, the residual amount of NAPL in the lens body St can be determined. The equation for this calculation is given as follows:
The proportion of the adsorption quantity in relation to the residual amount of NAPL within the lens body is 00%, and the percentage of the retention amount in relation to the residual amount of NAPL within the lens body is 00%. The results of the aforementioned calculations are outlined in Table 6.
Table 6.
Summary of NAPL residual quantities, adsorption, and retention in low-permeability lenses.
As shown in Table 6, the maximum adsorption capacity of NAPL by low-permeability lens body particles constitutes only 0.45% of the total residual volume of NAPL, whereas the retention capacity accounts for over 99.5% of the total NAPL residual volume. Therefore, retention emerges as the primary factor affecting NAPL residuals within the low-permeability lens body of the aquifer. The adsorption of NAPL by particles is affected by both particle size and specific surface area. To further investigate the relationship between particle size and NAPL adsorption, particle size distribution tests were conducted.
3.3. Particle Size Distribution Results
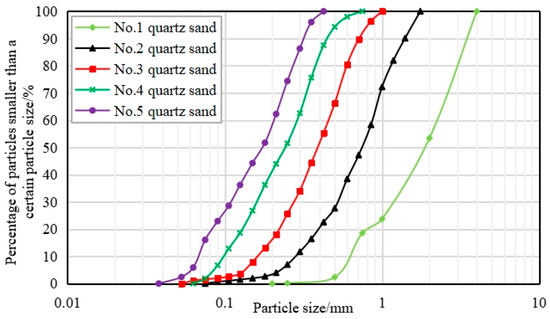
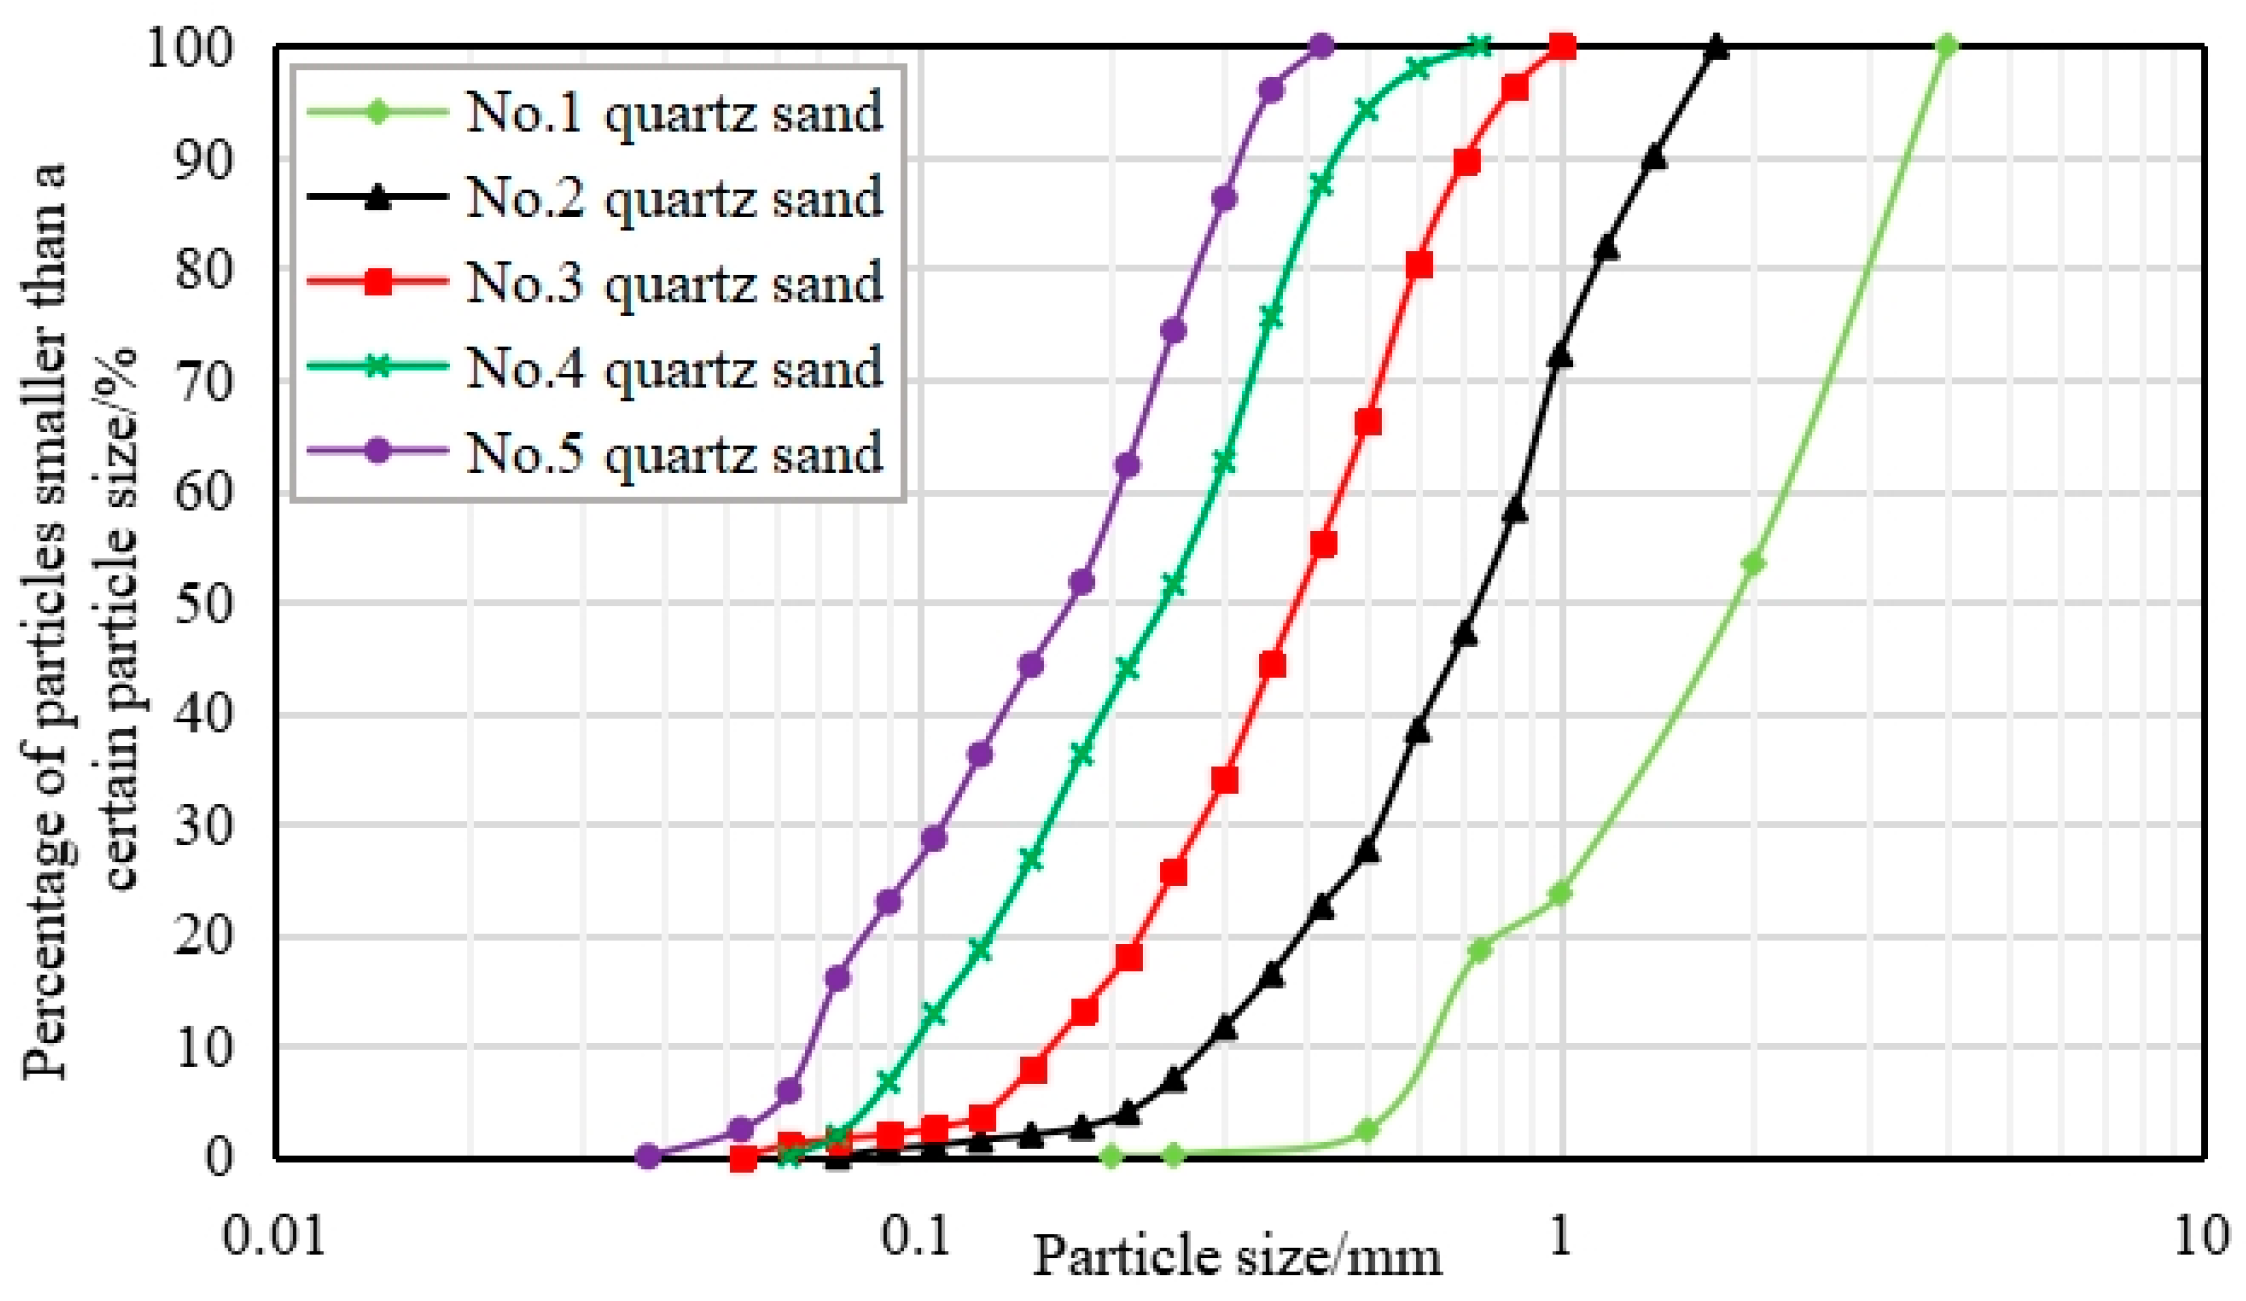
Figure 9 depicts the cumulative particle size distribution curves for each type of quartz sand, as derived from the results of the particle size distribution experiment. Table 7 summarizes the average particle diameter, uniformity coefficient Cu, and curvature coefficient Cs for each type of quartz sand, as determined from the cumulative distribution curve.
Figure 9.
Cumulative curve of particle distribution.
Table 7.
Particle size and distribution metrics for quartz sand types.
The average particle size is a physical parameter that characterizes the overall dimensions of particles within a given medium. Cu and Cs serve as indicators of the distribution of various particle sizes. A Cu value of less than 5 signifies a relatively uniform distribution of particles, while a Cs value between 1 and 3 suggests that there are no missing particle sizes within the specified range. As shown in Table 8, the particle sizes of different quartz sands in the lenses exhibit variability. However, the values of Cu and Cs remain notably similar.
Table 8.
Proportions of pore categories in quartz sand samples.
The difference between low-permeability lenses and aquifer media is primarily attributed to the permeability coefficient. The pore characteristics serve as a direct factor affecting the disparity in permeability, which in turn affects the retention of residual NAPL. To investigate the mechanisms underlying residual NAPL retention in lenses, mercury intrusion experiments were performed, and the results are presented in Section 3.4.
3.4. Mercury Intrusion Experiment Results
3.4.1. Pore Distribution of Each Low-Permeability Lens Body
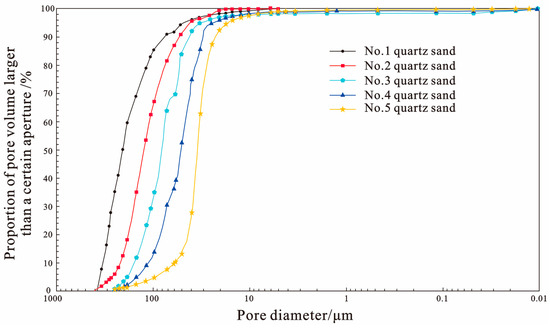
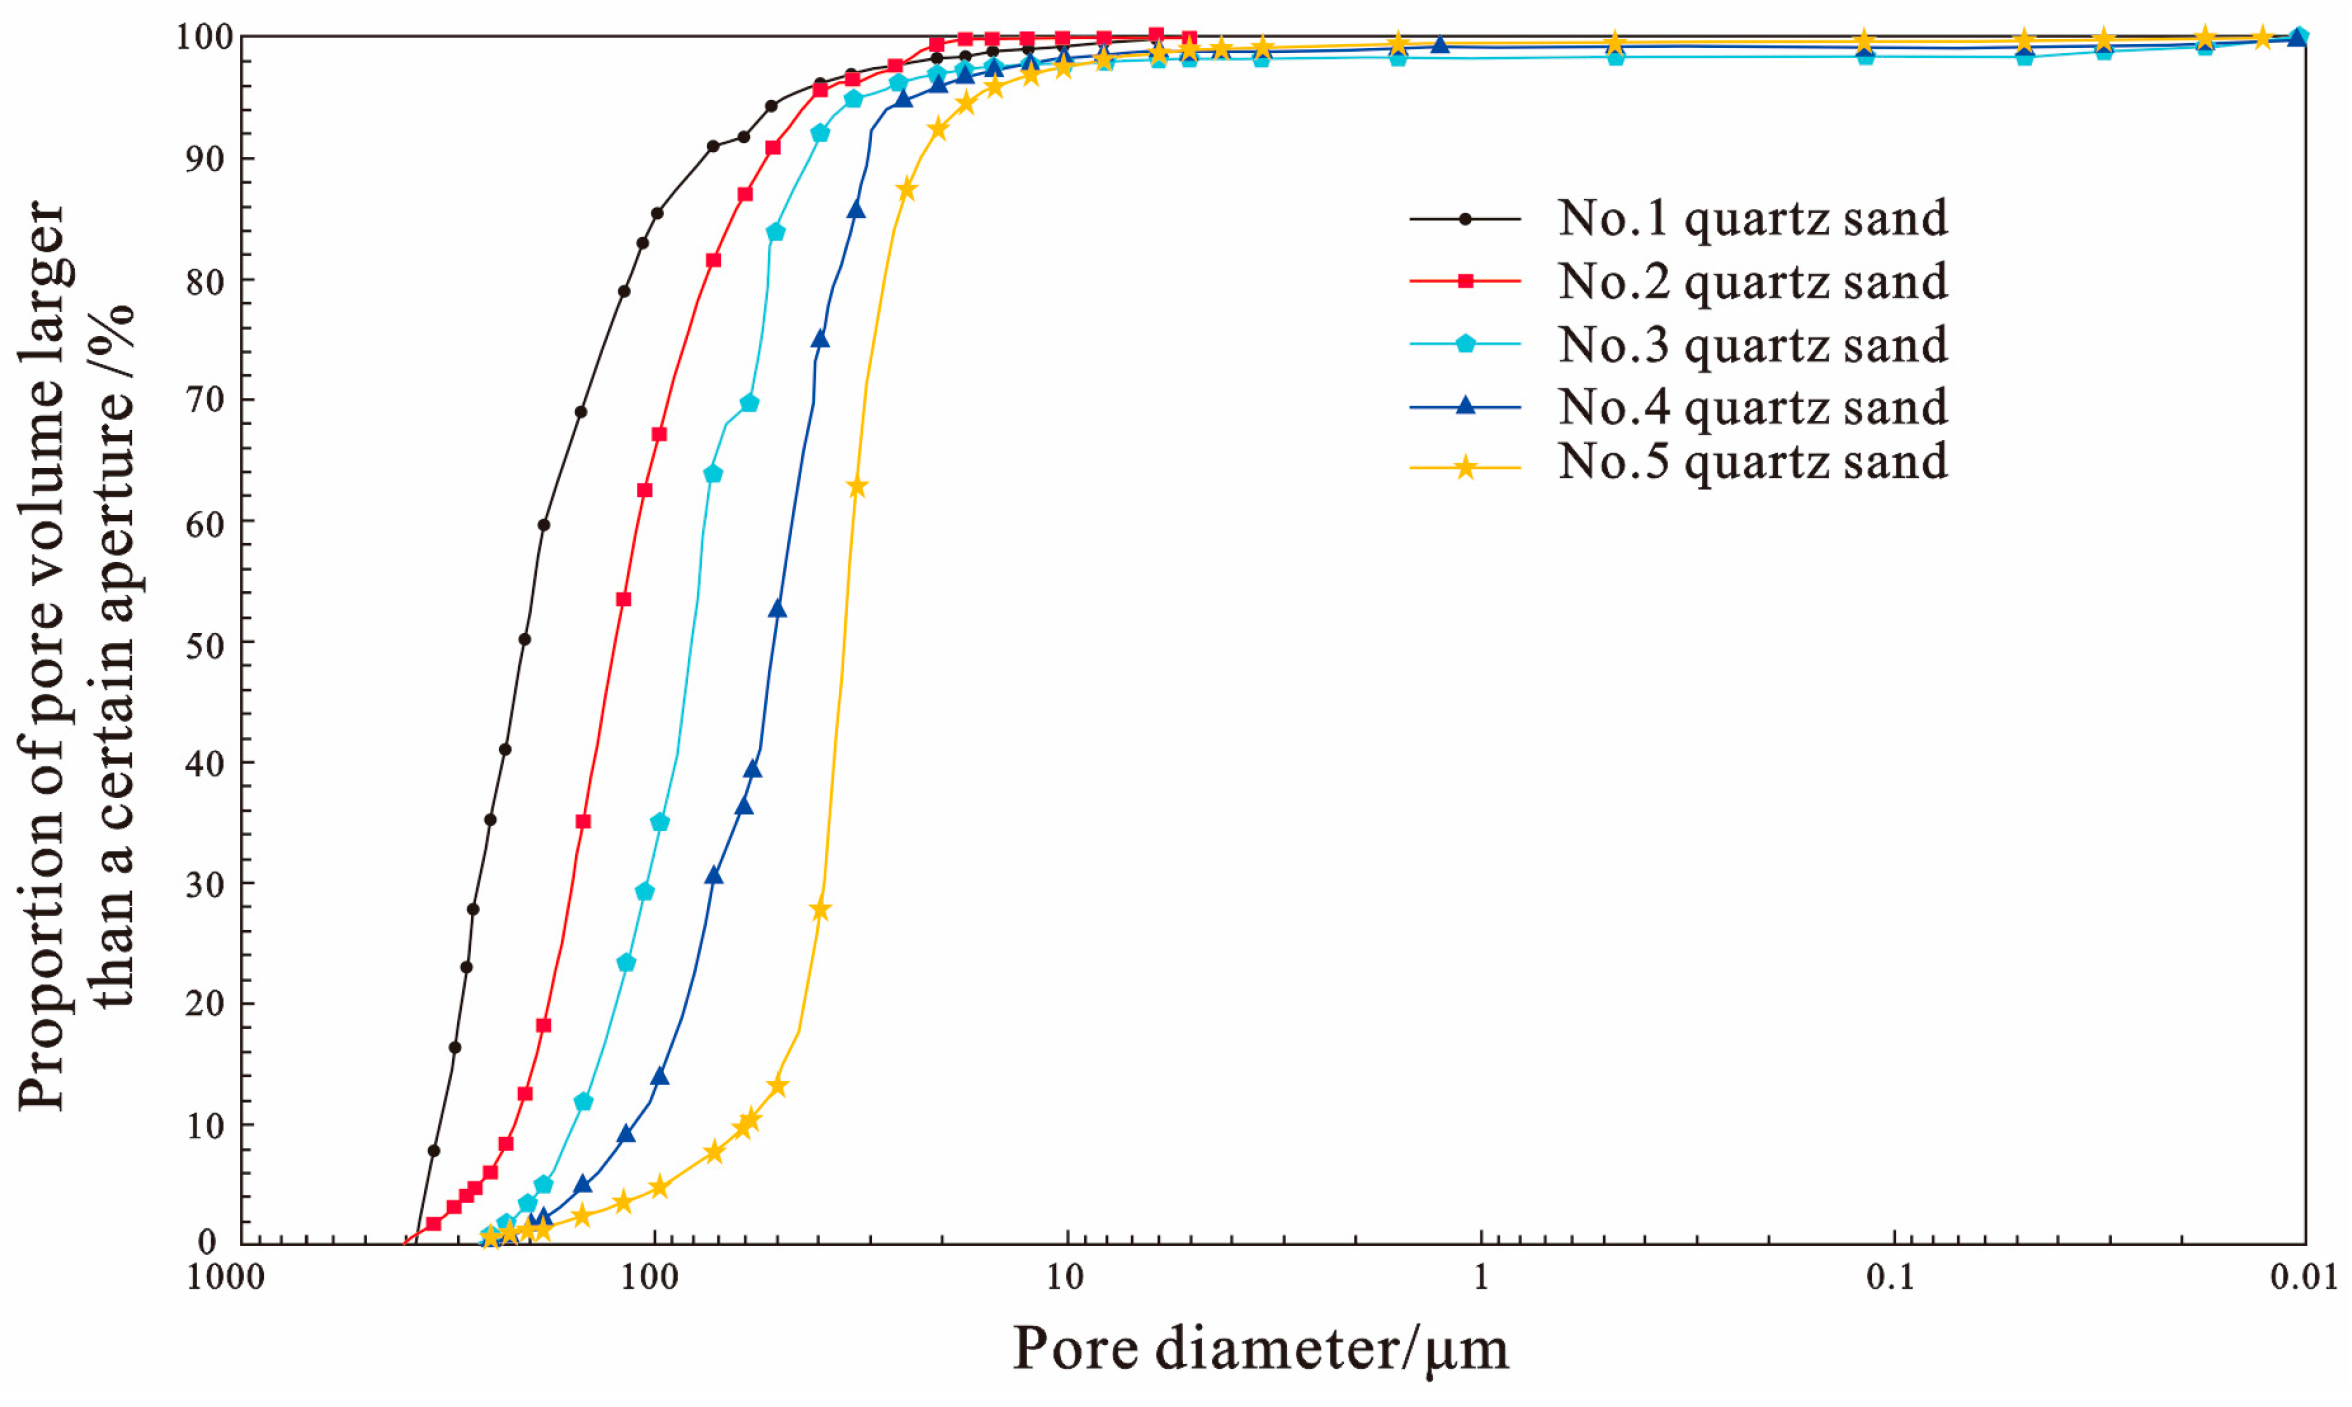
The cumulative pore size distribution curves are presented in Figure 10, where the horizontal axis represents the pore diameter and the vertical axis denotes the volume fraction of pores with diameters smaller than a specified value. An analysis of these curves reveals that the pores in quartz sands 1, 2, 3, 4, and 5 are predominantly concentrated within the diameter range of 20 μm to 300 μm. Notably, quartz sand 1 exhibits the highest curve among all the samples, indicating that it possesses the largest pore sizes across the various diameter ranges when compared to the other groups of quartz sands.
Figure 10.
Cumulative curve of pore diameter distribution.
Huang et al. [37] suggested that pores with diameters ranging from 0 μm to 30 μm are classified as storage pores, which encompass bound water pores. Pores with diameters between 30 and 100 μm are identified as capillary pores, whereas pores exceeding 100 μm exhibit minimal capillary force and are categorized as gravity water pores. Thomasson [38] revealed that when pore diameters surpass 60 μm, the capillary forces diminish, resulting in these pores showing characteristics typical of gravity water pores. Consequently, pores are categorized into three classifications based on their diameters: macropores (diameter > 60 μm), mesopores (diameter = 30~60 μm), and small pores (diameter < 30 μm). The proportions of the pore volume of each type are outlined in Table 8.
3.4.2. Experimental Results
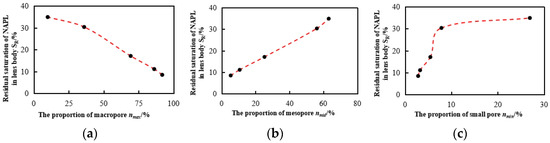
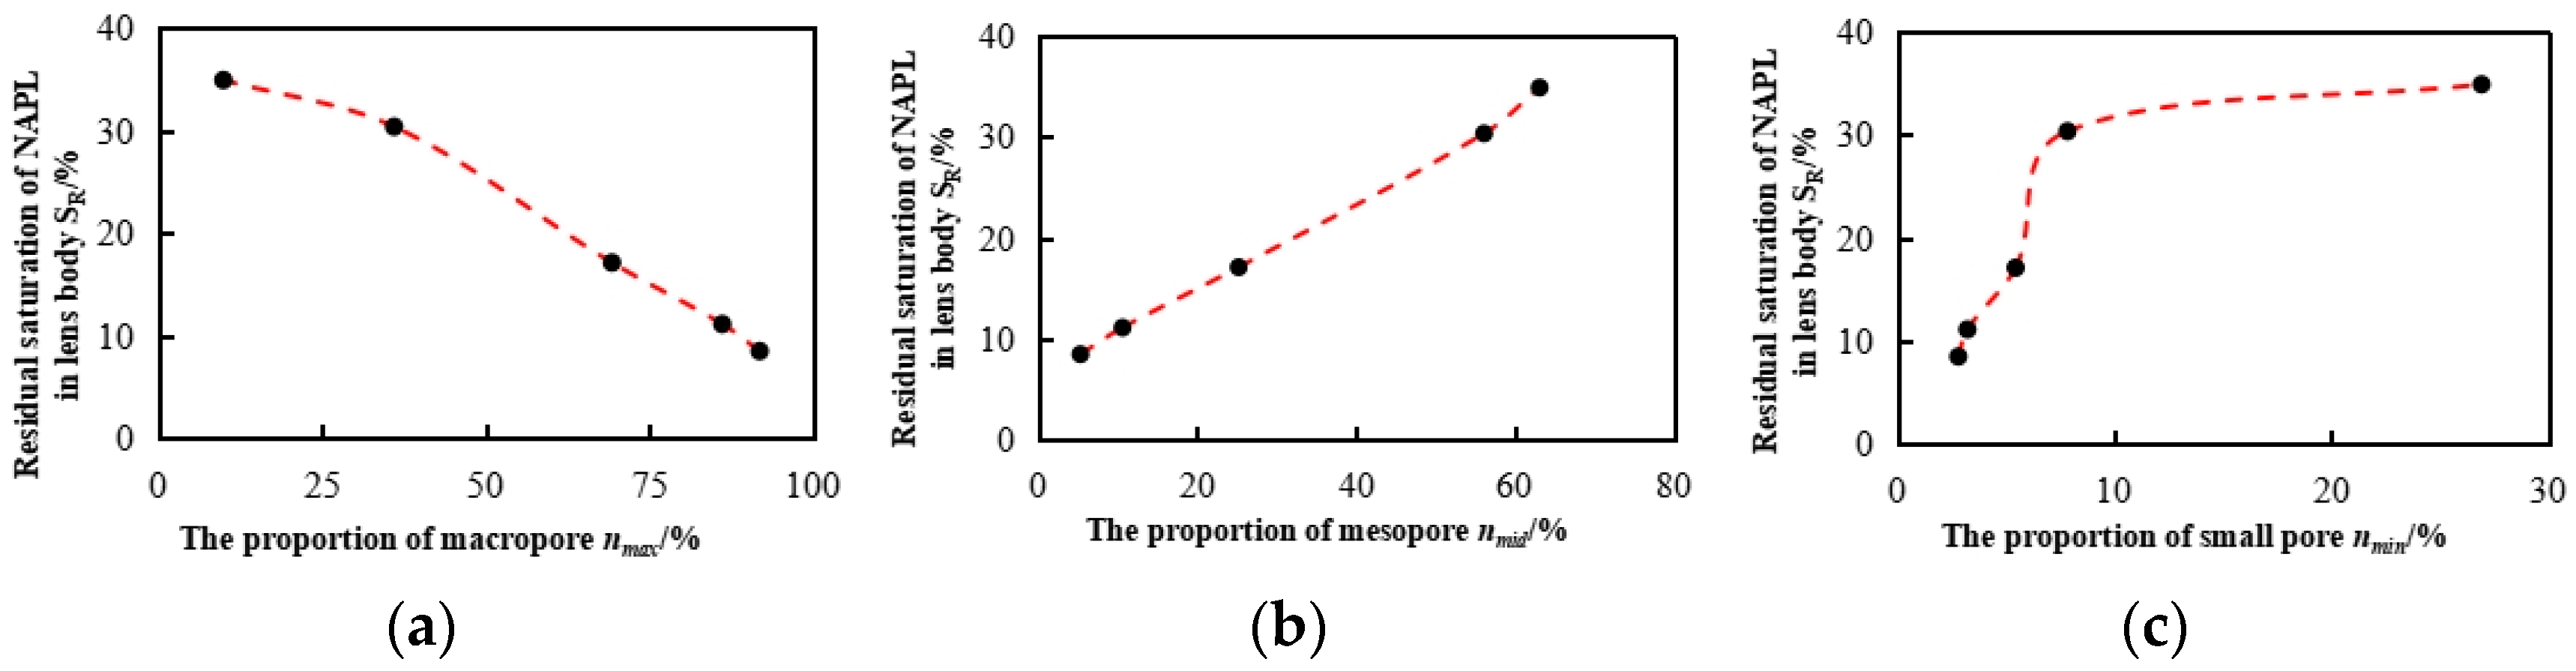
To elucidate the mechanism by which a low-permeability lens affects residual NAPL, a correlation analysis was conducted between the porosity of the aforementioned pore types and SR of both the aquifer and the lens body (Figure 11).
Figure 11.
The variation curve of residual saturation SR of lens body with the proportion of various pore volumes. NOTE: (a) is the variation curve of SR with macropore porosity, (b) is the variation curve of SR with mesopore porosity, and (c) is the variation curve of SR with small pore porosity.
As shown in Figure 11, the SR of the aquifer and lens body exhibits a negative correlation with the proportion of macropore volume (nmax). Specifically, when the volume fraction of macropores surpasses 36.04%, the slope of the curve increases, resulting in an accelerated rate of change in SR (Figure 11a). Conversely, SR shows a positive correlation with the proportion of mesopore volume (nmid), exhibiting an approximately linear increase (Figure 11b). Additionally, SR is positively correlated with the small pore volume (nmin). Notably, when nmin is below 7.85%, the slope of the curve also increases, which contributes to a heightened rate of change in SR (Figure 11c).
4. Discussion
4.1. Effects of Particle Adsorption on NAPL
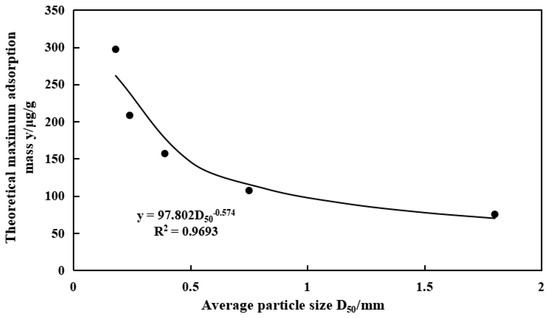
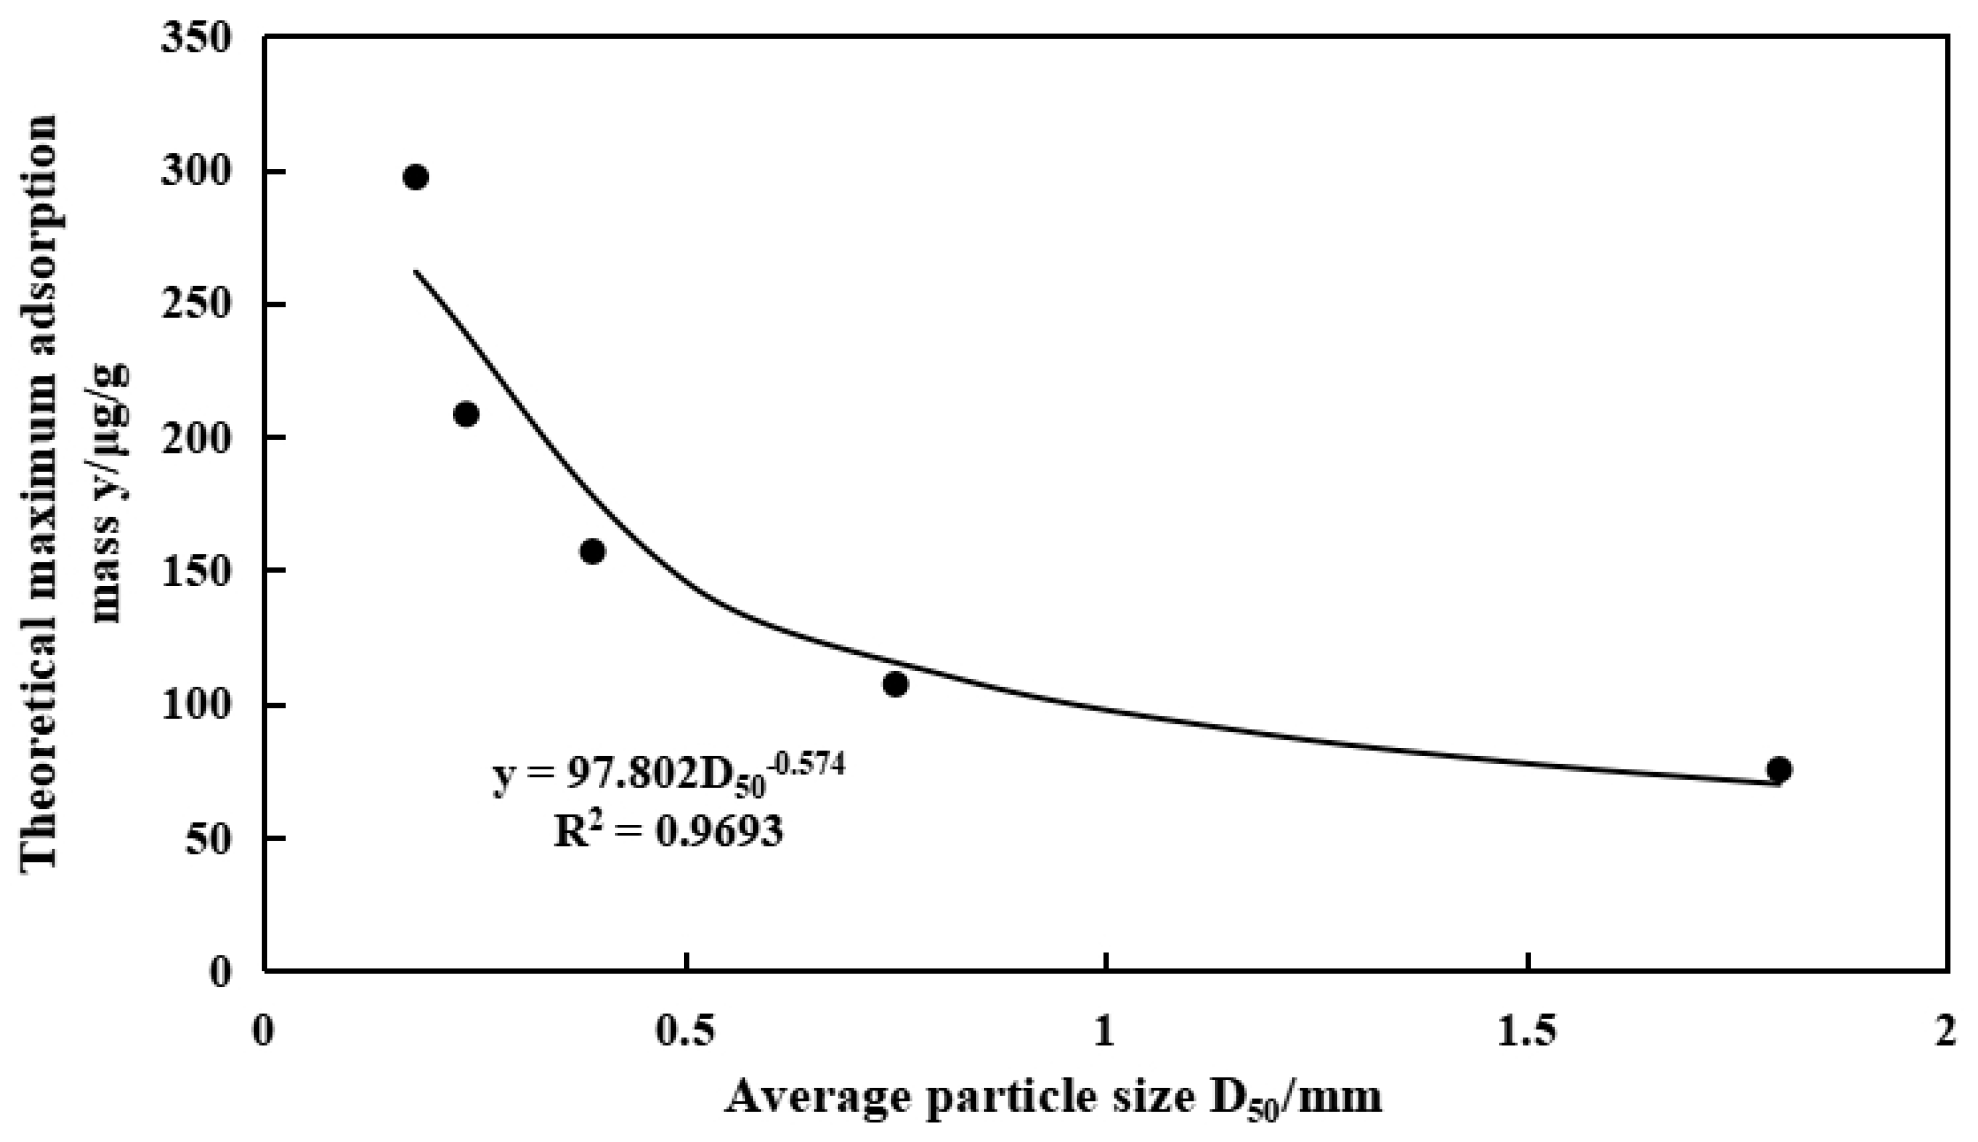
Based on y in Table 6 and the average particle diameter (D50) in Table 7, a curve illustrating the relationship between theoretical maximum adsorption capacity and particle size was generated (Figure 12). The data indicate that the adsorption capacity diminishes as particle size increases, conforming to a power-law function. The ability of quartz sand to adsorb NAPL in solution can be attributed to the similarity in the double electric layer structure present on the surfaces of both quartz sand and NAPL particles. Upon contact, a common counter-ion layer is established. Given the substantial disparity in particle size and mass between the two, the attractive force of the common counter-ion layer is adequate to facilitate the adherence of dissolved NAPL to the surfaces of quartz sand particles, thereby forming a relatively stable structure [39,40,41]. Therefore, water flow alone is insufficient to completely separate these entities, enabling quartz sand particles to effectively adsorb dissolved NAPL.
Figure 12.
The variation law of adsorption capacity with particle size.
The observed decrease in adsorption capacity, which follows a power-law function as particle size increases, can be attributed to the relationship between the adsorption of soluble NAPL by quartz sand and the specific surface area of the particles. Specifically, a larger specific surface area correlates with a greater quantity of NAPL that can be adsorbed. The specific surface area increases exponentially as particle size decreases [42,43,44]. Therefore, smaller particles exhibit higher adsorption capacities, and y can be represented in the form of a power-law function.
This study elucidates that the adsorption capacity of quartz sand particles for NAPL is relatively limited for the following reasons: 1. The water solubility of NAPL is exceedingly low, with concentrations typically in ppm range. As a result, the maximum adsorption of NAPL onto quartz sand particles is constrained. 2. This study utilized high-purity quartz sand, primarily composed of silicon dioxide, which possesses a crystalline structure and a smooth surface with few active adsorption sites. Its ability to adsorb NAPL is relatively low. Therefore, the retention of low-permeability lens bodies is the most important cause of residual NAPL.
4.2. Effects of Pore Characteristics on NAPL Retention
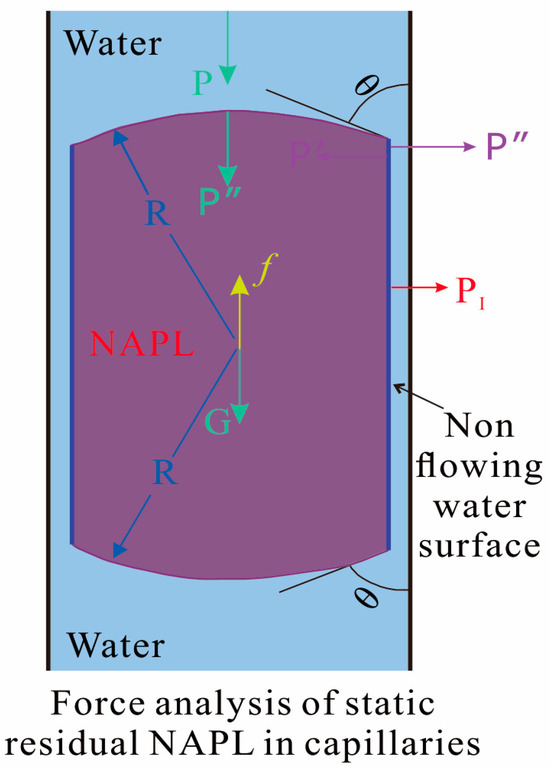
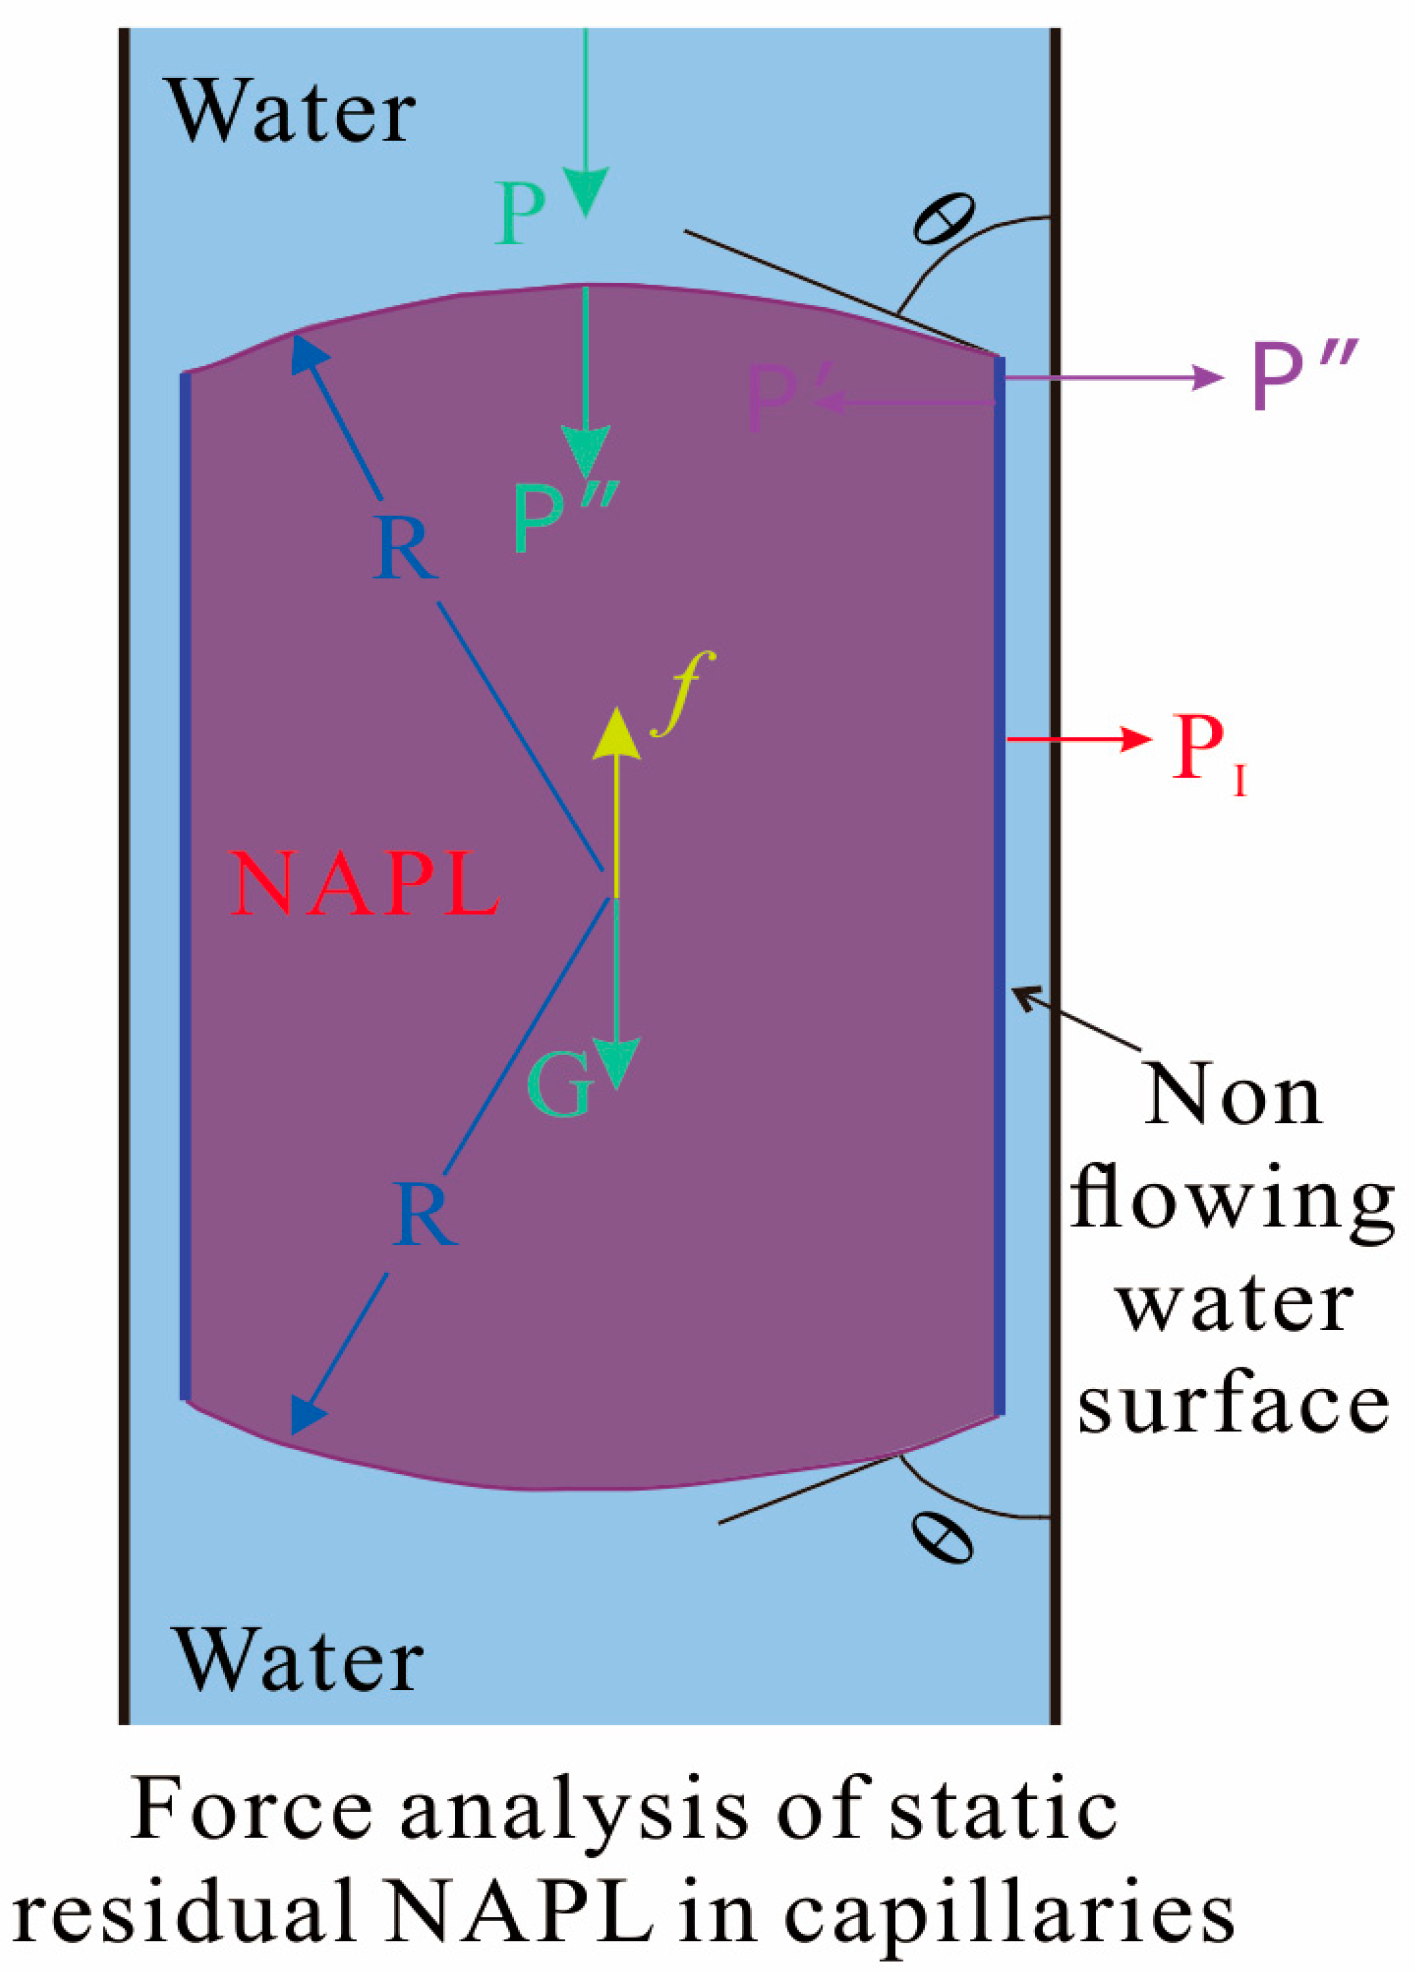
To elucidate the relationship between various types of porosity and the residuals of NAPL, as well as to investigate the effects underlying the variations in Sr across different pore size ranges, an analysis of the forces acting on residual NAPL droplets within the pores was performed (Figure 13).
Figure 13.
Force analysis of static residual NAPLs in capillaries.
As shown in Figure 13, the pores function as capillary tubes with a uniform diameter, while the residual NAPL is represented as a stationary spherical droplet. This droplet is subjected to several forces: the water flow pressure (p), its own gravitational force (G), buoyancy (f), the spherical capillary force exerted on the pore wall (P″), and the cylindrical capillary force acting at the center of the pore (P′). The resultant force (PI), which is directed towards the pore wall, is the vector sum of P′′ and P′. The calculations for P″, P′, and PI are derived based on the Laplace equation [45], where P″ and P′ can be obtained as follows:
Therefore, PI can be determined as follows:
The function of PI is to enhance the adhesion of an NAPL droplet to the pore wall. For the droplet to migrate, the additional frictional resistance along the pore wall induced by PI must be surmounted. Given that the residual NAPL exists as a spherical droplet, remains constant, while the magnitude of PI is contingent upon the pore radius (r). An increase in pore radius results in a reduction in resistance to NAPL migration, thereby decreasing Sr. Conversely, a decrease in pore radius leads to an increase in resistance to NAPL migration, resulting in a higher Sr.
Huang [37] and Thomasson [38] suggested that when the pore diameter exceeds 60 μm, the capillary forces within the pores become weak. In such instances, the driving force for the migration of NAPL surpasses the capillary force, resulting in reduced resistance to NAPL migration and a decreased likelihood of NAPL retention. Therefore, Sr demonstrates a negative correlation with nmax; specifically, as nmax increases, Sr decreases (Figure 11a). Conversely, when the pore diameter ranges from 30 μm to 60 μm, the pores exhibit enhanced capillary action. In this scenario, the capillary force exceeds the driving force for NAPL migration, thereby increasing resistance to NAPL movement and enhancing the probability of NAPL residuals. Therefore, Sr is positively correlated with nmid. As nmid increases, Sr also increases (Figure 11b). In cases where the pore diameter is less than 30 μm, the pores exhibit very strong capillary forces and may contain certain extremely small capillary pores. In these situations, discontinuous NAPL droplets that enter these pores can become encapsulated by water and retained within the pores [46]. However, the storage capacity for residual NAPL within these pores is limited, which consequently restricts the amount of NAPL that can be retained. Although there is a positive correlation between Sr and nmin, this correlation diminishes when the porosity exceeds 7.8%, as the increase in Sr slows down (Figure 11c). Therefore, while small pores do contribute to NAPL residuals, their effect on Sr is less pronounced than mesopores.
4.3. Effects of Kmn on Sr
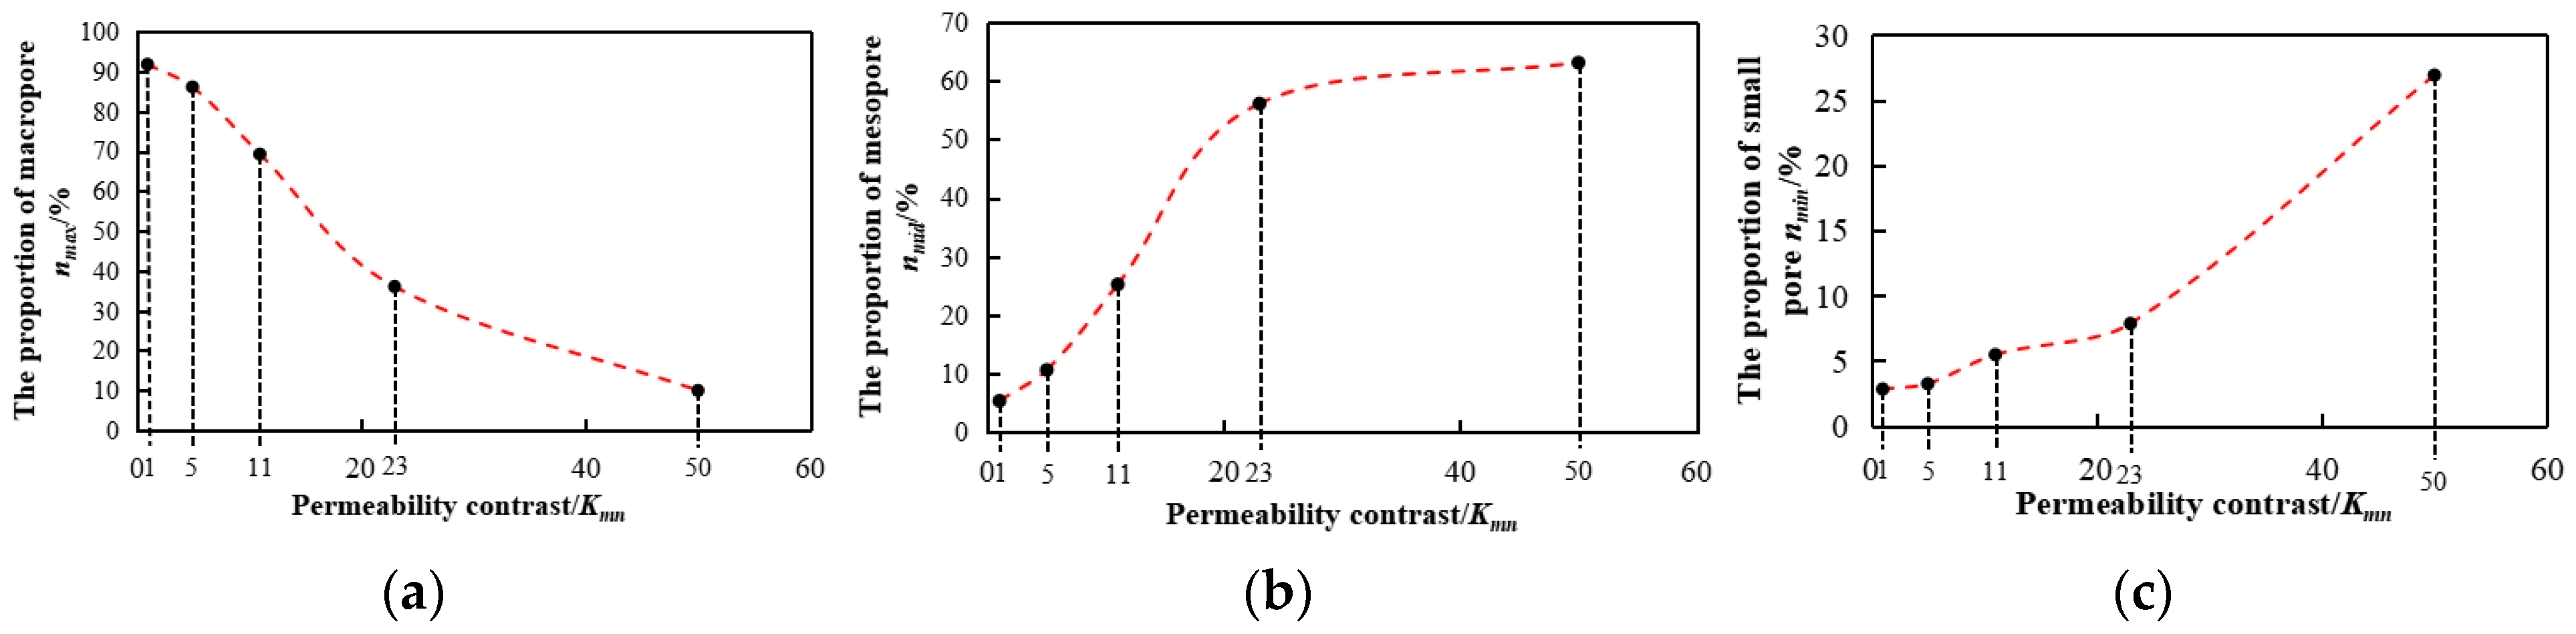
To examine the effect of Kmn on Sr, Kmn was designated as the independent variable. The proportions of various pore types in Table 8 were utilized as dependent variables. The resulting correlation variation curves are illustrated in Figure 14.
Figure 14.
Correlation curve between the proportions of various pore volumes and the permeability contrast Kmn. NOTE: (a) is the variation curve of nmax with Kmn, (b) is the variation curve of nmid with Kmn, and (c) is the variation curve of nmin with Kmn.
As shown in Figure 14, an increase in Kmn is associated with a decrease in nmax. Specifically, when Kmn is less than 23, the rate of change in the curve is relatively pronounced, suggesting that for Kmn values below 23, nmax diminishes rapidly as Kmn increases. In the range of Kmn between 23 and 50, the rate of decrease in nmax diminishes with further increases in Kmn (Figure 14a). Conversely, nmid shows an increasing trend with rising Kmn. For Kmn values below 23, the rate of change is significant, indicating that nmid increases rapidly as Kmn rises. However, within the interval of Kmn from 23 to 50, the rate of increase in nmid begins to slow (Figure 14b). Similarly, nmin also increases with an increase in Kmn. Notably, when Kmn is less than 23, the rate of change is relatively modest, indicating that nmin increases gradually as Kmn rises. In contrast, for Kmn values within the range of 23 to 50, the increase in nmin accelerates (Figure 14c).
The integration of the experimental results in Section 3.1 with the effect of NAPL residuals discussed in Section 4.2 allows for the conclusion that the inflection point observed at Kmn = 23 in Sr versus Kmn curve (Figure 6) is attributable to specific changes in pore volume distribution. When Kmn is less than 23, there is a rapid decrease in nmax (diameter > 60 μm), accompanied by a rapid increase in nmid (diameter = 30~60 μm), while nmin (diameter < 30 μm) increases at a slower rate. This dynamic results in a significant increase in the space available for NAPL residuals. Conversely, within the range of Kmn ∈ (23, 50), the rate of increase in Sr diminishes primarily due to a slower increase in nmid, contrasted with a rapid increase in nmin. This shift leads to a more gradual increase in the space available for NAPL residuals.
5. Conclusions and Outlook
5.1. Conclusions
- Experimental Results from Soil Columns with Different Kmn: Sr generally increases with Kmn, as demonstrated by the experimental results. However, when Kmn exceeds 23, an inflection point is observed. Specifically, for Kmn less than 23, Sr increases rapidly with increasing Kmn. In the range Kmn ∈ (23, 50), the increase in Sr slows down. This phenomenon can be attributed to the following: when Kmn < 23, nmax (diameter > 60 μm) decreases sharply, nmid (diameter = 30~60 μm) increases significantly, and nmin (diameter < 30 μm) increases gradually. This leads to an enhanced availability of space for NAPL residuals. However, when Kmn ∈ (23, 50), the rate of increase in Sr slows down primarily because nmid increases at a reduced rate, while nmin increases rapidly, limiting the available space for NAPL residuals.
- Contribution of Particle Adsorption and Retention to NAPL Residuals: The maximum contribution of NAPL adsorption by particles in low-permeability lenses to the total NAPL residual is only 0.45%, while retention accounts for over 99.5% of the total NAPL residual. This indicates that the primary factor affecting NAPL residuals in low-permeability lenses is retention. This result is explained by the fact that although both quartz sand and NAPL particles exhibit similar double-layer structures on their surfaces, enabling the formation of a common ion layer upon contact, the attraction between these particles is sufficient to cause NAPL to adhere to the surface of quartz sand particles. This interaction forms a stable structure that facilitates NAPL adsorption. However, due to the extremely low solubility of NAPL in water, and because the quartz sand used in this study is of high purity with a highly crystalline structure and few active adsorption sites, its capacity for NAPL adsorption is limited. Therefore, retention is the dominant factor controlling NAPL residuals in low-permeability lenses.
- Effect of Pore Size Distribution on NAPL Residuals: The primary reason for the formation of NAPL residuals in low-permeability lenses is the differential distribution of pore sizes, specifically nmax (diameter > 60 μm), nmid (diameter = 30~60 μm), and nmin (diameter < 30 μm). In macropores, the resistance to NAPL migration is minimal, meaning that the larger nmax, the lower Sr. In contrast, mesopores exhibit the strongest capillary action, which hinders NAPL migration, thereby facilitating the formation of NAPL residuals. Therefore, a larger nmid results in a higher Sr. Small pores, which contain bound water, exhibit strong capillary action but are limited in their ability to store NAPL due to the small volume of space available for liquid flow. Consequently, while small pores contribute to NAPL residuals, their effect on NAPL saturation is less significant than mesopores.
5.2. Outlook
This study takes diesel as an example to investigate the primary controlling factors of NAPL residuals in low-permeability lenses of aquifers and examines the effects underlying their persistence. However, diesel is an LNAPL, and its properties differ significantly from those of DNAPLs. Therefore, the conclusions of this study are applicable to LNAPL pollutants with properties similar to diesel, such as aviation kerosene and xylene. In addition, high-purity quartz sand was used for the low-permeability lenses in this study. But, in actual subsurface lenses, there are often a large number of clay minerals, which can increase the influence of adsorption on NAPL residues. Whether the conclusions of this study are applicable when clay minerals are present in low-permeability lenses remains unknown.
Consequently, in the next step, we will use trichloroethylene (TCE) as a representative of DNAPLs to continue the research on NAPL residues in low-permeability lenses of aquifers [47]. Different proportions of clay minerals will be added to the low-permeability lenses to explore whether DNAPL residues in low-permeability lenses of aquifers conform to this conclusion, and whether the presence of clay minerals in low-permeability lenses will change the NAPL residue mechanism. This will further reveal the influencing mechanism of NAPL residues in low-permeability lenses of aquifers.
Author Contributions
Conceptualization, W.S., L.S. and S.W.; methodology, W.S. and S.W.; software, W.S., J.Y. and H.L.; validation, W.S. and S.W.; formal analysis, W.S. and H.L.; investigation, S.W., L.S. and J.Y.; resources, W.S., L.S. and S.W.; data curation, W.S. and J.Y.; writing—original draft preparation, W.S.; writing—review and editing, W.S. and L.S.; project administration, J.Y. and H.L.; funding acquisition, W.S. and L.S. All authors have read and agreed to the published version of the manuscript.
Funding
This research was supported by the National Natural Science Foundation of China (No. 42007171), the S&T Program of Hebei, (grant number 242S4201Z, 22377602D) and Basal Research Found of IHEG (CAGS:sk202319).
Data Availability Statement
The original contributions presented in this study are included in this article; further inquiries can be directed to the corresponding author.
Acknowledgments
The authors are thankful for the support from the laboratory of Qinghai University in terms of experiments.
Conflicts of Interest
The authors declare no conflicts of interest.
References
- Qiu, J. China faces up to groundwater crisis. Nature 2010, 466, 308. [Google Scholar] [CrossRef] [Scilit] [PubMed]
- Sheng, Y.; Tian, X.; Wang, G.; Hao, C.; Liu, F. Bacterial Diversity and Biogeochemical Processes of Oil-Contaminated Groundwater, Baoding, North China. Geomicrobiol. J. 2016, 33, 537–551. [Google Scholar] [CrossRef] [Scilit]
- Fei, G.; Feng, L.; Wang, H. Numerical modelling of the dynamic process of oil displacement by water in sandstone reservoirs with random pore structures. J. Groundw. Sci. Eng. 2021, 9, 233–244. [Google Scholar]
- Li, S.; Liu, F.; Li, W.; Li, C.; Huang, F.; Jin, S.; Liu, J.; Yang, L.; Piao, H.; Zhang, Y.; et al. Prioritization of organic contaminants in China’s groundwater based on national-scale monitoring data and their persistence, bioaccumulation, and toxicity. Sci. Total Environ. 2024, 929, 172656. [Google Scholar] [PubMed]
- Zhang, M.; Guo, C.; Shi, C.; Ning, Z.; Chen, Z. A quantitative redox zonation model for developing natural attenuation-based remediation strategy in hydrocarbon-contaminated aquifers. J. Clean. Prod. 2021, 290, 125743. [Google Scholar] [CrossRef] [Scilit]
- Ye, W.; Jin, Q.; Huang, Y.; Tang, Y. Progress in Experimental Research on Groundwater Pollution. J. Hydraul. Eng. 2005, 36, 251–255. [Google Scholar]
- Monteiro, L.; Traunspurger, W.; Roeleveld, K.; Lynen, F.; Moens, T. Direct toxicity of the water-soluble fractions of a crude and a diesel-motor oil on the survival of free-living nematodes. Ecol. Indic. 2018, 93, 13–23. [Google Scholar]
- Sheng, Y.; Liu, Y.; Yang, J.; Dong, H.; Liu, B.; Zhang, H.; Li, A.; Wei, Y.; Li, G.; Zhang, D. History of petroleum disturbance triggering the depth-resolved assembly process of microbial communities in the vadose zone. J. Hazard. Mater. 2021, 402, 124060. [Google Scholar] [CrossRef] [Scilit]
- Zheng, F.; Gao, Y.; Shi, X.; Wu, J. Influence of groundwater flow velocity and geological heterogeneity on DNAPL migration in saturated porous media. J. Hydraul. Eng. 2015, 46, 925–933. [Google Scholar]
- Shi, Y. Fate and Transport of Typical Organic Pollutants in Saturated Porous Media. Ph.D. Thesis, Nanjing University, Nanjing, China, 2019. [Google Scholar]
- Chrysikopoulos, C.V.; Lee, K.Y. Contaminant transport resulting from multicomponent nonaqueous phase liquid pool dissolution in three-dimensional subsurface formations. J. Contam. Hydrol. 1998, 31, 1–21. [Google Scholar] [CrossRef] [Scilit]
- Pan, Y.; Yang, J.; Jia, Y.; Xu, Z. Experimental study on non-aqueous phase liquid multiphase flow characteristics and controlling factors in heterogeneous porous media. Environ. Earth Sci. 2016, 75, 1–13. [Google Scholar] [CrossRef] [Scilit]
- Song, Y.; Hou, D.; Zhao, Y.; Zhu, J.; Zhang, Q.; Qin, C.; Wang, W. Remediation strategies for contanminated groundwater at chemical industrial sites in the Bejing-Tianjin-Hebei region. Res. Environ. Sci. 2020, 33, 1345–1356. [Google Scholar]
- Mateas, D.J.; Tick, G.R.; Carroll, K.C. In situ stabilization of NAPL contaminant source-zones as a remediation technique to reduce mass discharge and flux to groundwater. J. Contam. Hydrol. 2017, 204, 40–56. [Google Scholar] [CrossRef] [Scilit] [PubMed]
- Zhang, X. Identification of the Dominated Soil Structure Factors for Diesel Migration and Residual Under Leaking Condition. Master’s Thesis, Chinese Research Academy of Environmental Sciences, Beijing, China, 2015. [Google Scholar]
- Shu, S.; Liang, H.; Yuan, Y. Numerical analysis of transportation and distribution of light non-aqueous phase liquids in partially saturated heterogeneous soils. J. Hydraul. Eng. 2002, 11, 31–37. [Google Scholar]
- Cheng, Z.; Wu, J.; Xu, H.; Wang, J.; Gao, Y.; Li, J.; Dong, S. Investigation of the migration characteristic of DNAPL in aquifer with lenses and under the action of surfactant. China Environ. Sci. 2014, 34, 2888–2896. [Google Scholar]
- Wang, L. Experimental Study on Multiphase Flow in Soil Contaminated with Light Non-Aqueous Phase Liquid (LNAPL). Master’s Thesis, Chang’an University, Xi’an, China, 2009. [Google Scholar]
- Panter, S.E. The Hidden Potential of Mass-based Treatment: A Method for Preventing Rebound. Remediat. J. 2015, 25, 99–109. [Google Scholar] [CrossRef] [Scilit]
- Tao, J.; Shi, X.; Kang, X.; Xu, H.; Wu, J. Numerical analyses of factors affecting the LNAPL source-zone architecture. Hydrogeol. Eng. Geol. 2018, 45, 132–140. [Google Scholar]
- Kueper, B.H.; Abbott, W.; Farquhar, G. Experimental observations of multiphase flow in heterogeneous porous media. J. Contam. Hydrol. 1989, 5, 83–95. [Google Scholar] [CrossRef] [Scilit]
- Liu, H.; Zhou, Q.; Xu, S. Anexperimental investigationof LNAPL migration and redistribution in unsaturated heterogeneous porous media. Hydrogeol. Eng. Geol. 2006, 33, 52–57. [Google Scholar]
- Zhang, Y.; Zhu, S.; Xiao, R.; Wang, J.; Li, F. Vertical transport of polycyclic aromatic hydrocarbons in different particle-size fractions of sandy soils. Environ. Geol. 2008, 53, 1165–1172. [Google Scholar] [CrossRef] [Scilit]
- Shi, X.; Wu, J.; Liu, D.; Jiang, S.; Sun, Y.; Xu, H. Numerical simulation of transportation of dense non-aqueous phase liquids in the subsurface environment. J. Nanjing Univ. 2011, 47, 299–307. [Google Scholar]
- Al-Raoush, R.I. Experimental investigation of the influence of grain geometry on residual NAPL using synchrotron microtomography. J. Contam. Hydrol. 2014, 159, 1–10. [Google Scholar] [CrossRef] [Scilit] [PubMed]
- Zhang, J.; Liu, Z.; Liu, S.; Wei, Q.; Wang, Y.; Lu, L. Study on Influence of Geological Heterogeneity on Migration of LNAPL in Contaminated Site Through Numerical Analysis; Springer: Singapore, 2019; pp. 834–841. [Google Scholar]
- Chen, X.; Sheng, Y.; Wang, G.; Guo, L.; Zhang, H.; Zhang, F.; Yang, T.; Huang, D.; Han, X.; Zhou, L. Microbial compositional and functional traits of BTEX and salinity co-contaminated shallow groundwater by produced water. Water Res. 2022, 215, 118277. [Google Scholar] [CrossRef] [Scilit] [PubMed]
- Liu, C.; Zhang, F.; Zhang, Y.; Song, S.; Zhang, S.; Ye, H.; Hou, H.; Yang, L.; Zhang, M. Experimental and numerical study of pollution process in an aquifer in relation to a garbage dump field. Environ. Geol. 2005, 48, 1107–1115. [Google Scholar]
- Ning, Z.; Sheng, Y.; Gan, S.; Guo, C.; Wang, S.; Cai, P.; Zhang, M. Metagenomic and Isotopic Insights into Carbon Fixation by Autotrophic Microorganisms in a Petroleum Hydrocarbon Impacted Red Clay Aquifer. Environ. Pollut. 2024, 361, 124824. [Google Scholar] [CrossRef] [Scilit]
- Heidari, P.; Li, L. Solute transport in low-heterogeneity sandboxes: The role of correlation length and permeability variance. Water Resour. Res. 2015, 50, 8240–8264. [Google Scholar] [CrossRef] [Scilit]
- Mackay, D.M.; Cherry, J.A. Groundwater contamination: Pump-and-treat remediation. Environ. Sci. Technol. 1989, 23, 630–636. [Google Scholar] [CrossRef] [Scilit]
- Hunt, J.R.; Sitar, N.; Udell, K.S. Nonaqueous phase liquid transport and cleanup: 1. Analysis of mechanisms. Water Resour. Res. 1988, 24, 1247–1258. [Google Scholar] [CrossRef] [Scilit]
- Xia, Y.; Wang, B.; Qu, Z.; Zhao, Y. Research on the natural attenuation of diesel in aeration zone. Environ. Eng. 2024, 32, 1085–1089. [Google Scholar]
- Li, Y.; Zhang, Y.; Zhang, L.; Hou, J. Characterization on pore structure of tectonic coals based on the method of mercury intrusion, carbon dioxide adsorption and nitrogen adsorption. J. China Coal Soc. 2019, 44, 1188–1196. [Google Scholar]
- Zhang, X.; Kong, L.; Guo, A.; Tuo, Y. Experiment study of pore distribution of strong structural clay under different consolidation pressures. Rock Soil Mech. 2014, 35, 2794–2800. [Google Scholar]
- Sun, L.; Wang, S.-W.; Guo, C.-J.; Shi, C.; Su, W.-C. Using pore-solid fractal dimension to estimate residual LNAPLs saturation in sandy aquifers: A column experiment. J. Groundw. Sci. Eng. 2022, 10, 87–98. [Google Scholar]
- Huang, C.; Xu, J. Soil Science; China Agricultural Press: Beijing, China, 2010. [Google Scholar]
- Thomasson, A.J. Towards an Objective Classification of Soil Structure. Eur. J. Soil Sci. 1978, 29, 38–46. [Google Scholar] [CrossRef] [Scilit]
- Qian, N.; Wang, Z. Mechanics of Sediment Transport; Science Press: Beijing, China, 1986; pp. 28–32. [Google Scholar]
- Becher, P. Emulsions: Theory and Practice; Reinhold Publishing Corp: New York, NY, USA, 1965. [Google Scholar]
- Zhao, G. Physical Chemistry of Surfactants; Peking University Press: Beijing, China, 1991; pp. 65–127. [Google Scholar]
- Xiao, Y.; Lu, Q.; Cheng, H.; Zhu, X.; Tang, H. Surface properties of sediments and its effect on phosphorus adsorption. J. Sediment Res. 2011, 6, 64–68. [Google Scholar]
- Xiao, Y.; Han, K.; Cheng, H.; Li, Q. Surface Properties of Sediments in the Waterway of Poyang Lake to YangtzeRiver and the Nanjing Reach of Yangtze River. South-North Water Transf. Water Sci. Technol. 2014, 12, 47–50. [Google Scholar]
- Wu, J.; Zheng, X.; Li, L.; Sun, J. Adsorption of Aqueous Oil on Sands and Its Studies of Effective Factors. Environ. Sci. 2006, 27, 2019–2023. [Google Scholar]
- Fetter, C.W.; Boving, T.; Kreamer, D. Contaminant Hydrogeology, 2nd ed.; Zhou, N.; Huang, Y., Translators; Higher Education Press: Beijing, China, 2011. [Google Scholar]
- Wang, X.; Wang, X.; Li, T.H.Y.; Hou, L. The mechanism of NAPL layer formation in a microfluidic device with dual-permeability: Experiments and numerical simulation. In IOP Conference Series: Earth and Environmental Science; IOP Publishing: Bristol, UK, 2021; Volume 675, p. 012175. [Google Scholar]
- Chrysikopoulos, C.V.; Harmon, T.C.; Lee, K.Y. Dissolution of a well-defined trichloroethylene pool in saturated porous media: Experimental design and aquifer characterization. Water Resour. Res. 2000, 36, 1687–1696. [Google Scholar] [CrossRef] [Scilit]

Disclaimer/Publisher’s Note: The statements, opinions and data contained in all publications are solely those of the individual author(s) and contributor(s) and not of MDPI and/or the editor(s). MDPI and/or the editor(s) disclaim responsibility for any injury to people or property resulting from any ideas, methods, instructions or products referred to in the content. |
© 2025 by the authors. Licensee MDPI, Basel, Switzerland. This article is an open access article distributed under the terms and conditions of the Creative Commons Attribution (CC BY) license (https://creativecommons.org/licenses/by/4.0/).