


Abstract
Long-distance sewerage network systems have serious vulnerabilities, specifically pipeline blockage, leakage, sedimentation, mixed connection, and other problems. A vulnerability evaluation system for a sewage network was established in this study with the comprehensive consideration of three aspects: basic attributes of the sewage network, operation and maintenance (O&M) drivers, and structural level. First, we obtained vulnerability indicators for the sewage pipeline network system through data collection and the preliminary selection and screening of indicators. The extent of the importance of each criterion level to the vulnerability was clarified through principal component analysis (PCA), with the basic attribute indicators being the per capita GDP (X3) and the urbanization rate (X5), the O&M-driven indicators being the daily per capita wastewater treatment volume (X7) and the industrial wastewater discharge volume (X8), and the structural-level indicators being the pipe diameter (X13) and the flow capacity (X15). Qingshanhu District, Jiangxi province, was taken as an example for diagnosing and evaluating vulnerability. Using the ranking size of PCA indicators as the evaluation level of the importance for the analytic hierarchy process (AHP) indicators, a hierarchical structure model was established. The evaluation value was obtained by weighting the hierarchical structure model results with the scores of each indicator. The comprehensive evaluation values of basic attributes, operation and maintenance drivers, and structural level were 58.38, 68.67, and 73.17, which corresponded to vulnerability levels of III, II, and II, respectively.
1. Introduction
Urban sewage network systems represent an important form of social infrastructure. There are two modes of sewage treatment in these systems: centralized and decentralized [1,2]. In the construction of urban sewage networks, the centralized treatment mode is dominant in early development; however, with the expansion of the city, the advantages of the centralized mode decline, and there is a gradual shift over to decentralized or hybrid decentralized wastewater treatment mode in order to improve the efficiency and sustainability of urban drainage systems [3]. The centralized treatment mode and the decentralized treatment mode have their own advantages and disadvantages in the operation of an urban sewage network. The centralized sewage treatment mode facilitates the unified management and control of sewage but has higher operating costs. There is a serious vulnerability in this mode, mainly in sewage networks, whereby the design, hydraulics, damage, management, and other factors lead to pipeline clogging, sludge deposition, pipeline damage and leakage, and so on. Large-scale drainage systems with complex water system networks have long pipeline transportation distances, which increases the operational risk. The operation, maintenance, and pipe network construction costs are high for long-distance complex pipeline network systems. In addition, the wastewater treated by centralized large-scale sewage treatment plants is not conducive to decentralized utilization. These factors contribute to low sewerage collection rates in the operation of urban sewerage networks [4,5]. The decentralized wastewater treatment mode in sewage transportation has a high degree of flexibility and lower operating costs but is difficult to operate and manage. It is necessary to comprehensively consider the operating costs and terrain conditions and avoid the vulnerability of sewage network systems in the selection of a sewage treatment mode in urban construction [6]. However, the extent of decentralization and its impact on the overall vulnerability of the pipeline network are unclear.
Scholars have analyzed the vulnerability of pipelines by analyzing the above factors throughout the entire lifecycles of these systems. Overall, this analysis can be divided into three levels. The first category is pipeline performance prediction and diagnosis. Drainage pipeline failure and its possible consequences can be determined by considering factors such as the design of the drainage pipeline network, hydraulic performance, and pipeline status based on the evaluation results. The risks that may be caused by these consequences can be further predicted through optimization simulation [7,8]. The second category is the operation and planning of drainage systems. The vulnerability assessment of the ecological, social, economic, and pipeline planning of drainage systems is mainly conducted from the perspectives of economics and management. It involves aspects such as pipeline operation, service, and planning. After the evaluation is completed, it is generally linked to subsequent improvements or optimizations [9,10]. The third category is the safety risk assessment of drainage systems. It is a form of risk assessment based on the potential risks of accidents that accounts for environmental, overflow pollution, poisoning, and explosion risks, among others. [11,12]. A range of methods, such as hierarchical analysis, principal component analysis, network analysis, and fuzzy mathematics, is commonly used for vulnerability assessment [13]. Each methodology has its own scope of application, alongside advantages and disadvantages, but there is a lack of consideration of the selection of vulnerability indicators and their weights.
The socioeconomic characteristics of cities and basic indicators, namely, the population density, concentration of buildings, industrial production, and economic activities, highlight the socioeconomic context in which wastewater networks operate [14,15]. These indicators reveal how urban development and population growth influence the demand for wastewater networks and the sources of pressure they face [16]. They also expose the alignment issues between urban development and wastewater networks’ carrying capacity and the external pressures exerted on the systems. Operation and maintenance (O&M) indicators are used to assess operational efficiency, wastewater treatment capacity, and the impact of industrial discharge, as well as investments in treatment infrastructure [17]. These indicators reflect whether a wastewater network can effectively manage complex wastewater sources, maintain efficient operations, and ensure long-term sustainability. They are used to evaluate the network’s operational efficiency, management quality, and capacity to address challenges related to industrial wastewater management. Structural indicators, on the other hand, are utilized to examine the design quality and physical capacity of the wastewater network [18]. These indicators reveal whether the network has an adequate physical capacity and design to meet both current and future wastewater treatment demands. They reflect the rationality of the system’s design and its ability to sustain long-term operational stability while also revealing resilience to potential risks.
Vulnerability analysis has been applied to a variety of fields, such as natural disaster management, ecology, hydrology, and social sciences [19]. However, the current vulnerability assessment of drainage network systems focuses mainly on stormwater networks, and there is insufficient research on vulnerability diagnosis and assessment in the area of long-distance sewage networks. A vulnerability diagnosis and evaluation of a sewage drainage network system were carried out in this study considering three aspects, namely, basic attributes, operation and maintenance drivers, and structural level, with the aim of exploring the influencing factors affecting the vulnerability of the sewage network and adopting corresponding measures. In order to achieve this goal, the following steps were taken to realize the research purpose: (i) A technical framework system for the diagnosis and evaluation of a sewage pipe network drainage system was constructed, and the logical relationship of each research link and the complete process of data analysis were clarified. (ii) The three indicator dimensions were analyzed with PCA, the influence of multiple covariance among multiple indicators was removed, and thus, the weights of the indicators that affect the vulnerability of sewage pipelines were accurately determined. (iii) Weighted scoring of the indicators using an AHP was carried out to assess the important factors affecting the vulnerability of sewage pipelines in the study area. This approach systematically and comprehensively considers the differences in the importance of the indicators at different levels so as to make the assessment results more scientific and reasonable and provide reliable decision-making support for the subsequent development of corresponding measures for the important factors affecting the vulnerability of sewage pipelines.
2. Vulnerability Assessment System for Sewerage Network Systems
2.1. The Concept of Vulnerability Evaluation
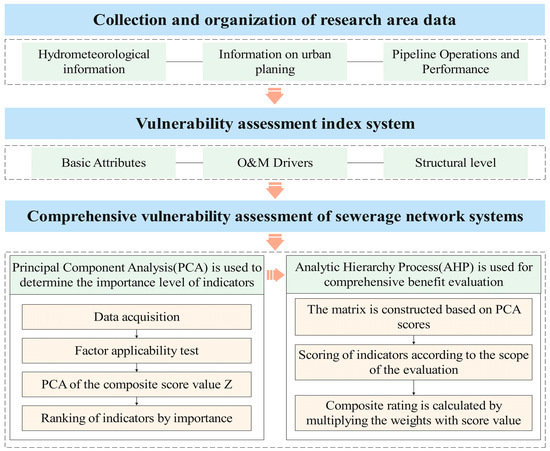
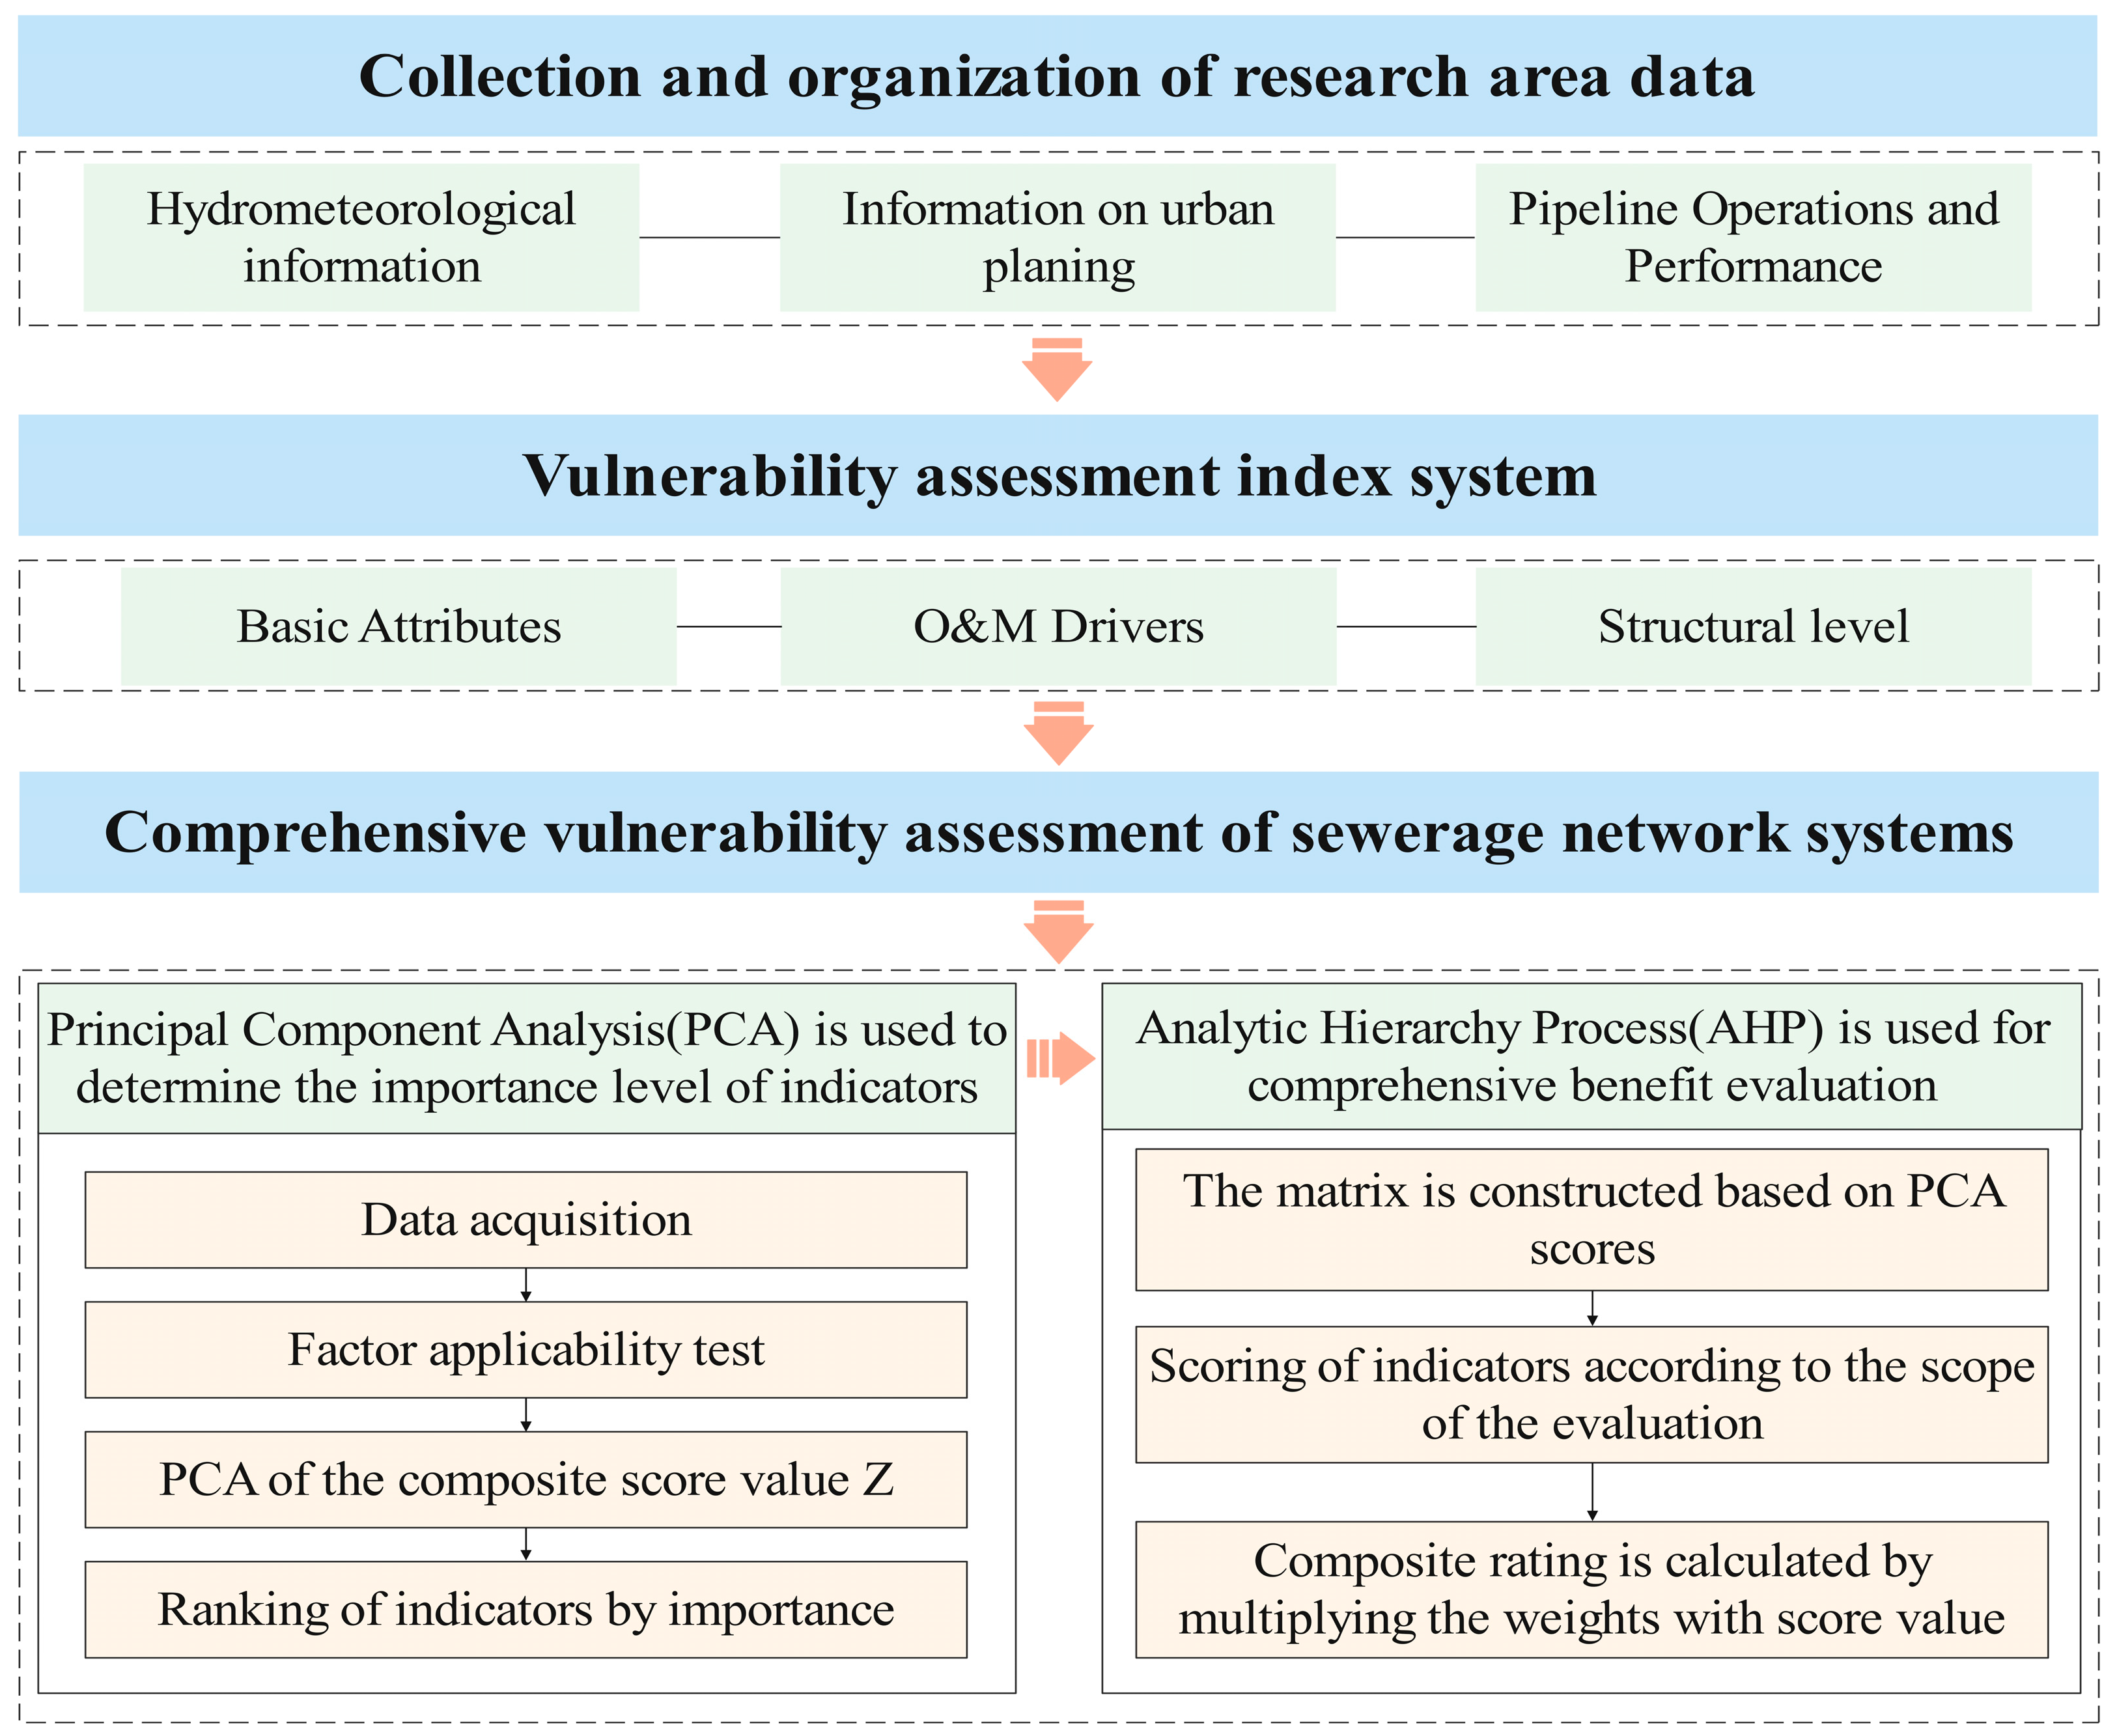
The vulnerability of an urban sewerage network refers to the extent to which the network is subjected to external, hydraulic, design, operation, and maintenance management factors. It reflects the degree of susceptibility to disturbance by unfavorable factors and the lack of ability to cope with unfavorable factors. Vulnerability evaluation is an important tool for assessing the unfavorable factors of an urban sewage network. Vulnerability evaluation was conducted in this study as follows: The factors relevant to the vulnerability of the sewerage network system were screened through the collection of information on hydrometeorology, urban utilities, pipeline operation, and performance in the study area. The vulnerability evaluation index system for sewage drainage network systems was constructed considering three aspects (basic attributes, operation and maintenance drivers, and structural level), and the vulnerability diagnosis and analysis of a sewage network system were carried out. Firstly, PCA was used to identify and rank the important influencing factors that cause the vulnerability of the urban sewage network system. Considering the degree of influence of the indicators on the vulnerability of the construction, an AHP judgment matrix was created for calculation, and the obtained score and weight were multiplied by the comprehensive score. Then, the vulnerability degree of the sewage network was obtained according to the evaluation score. The flowchart of this study is shown in Figure 1.
Figure 1.
Flowchart of the research program.
2.2. Construction of the Indicator Evaluation System
2.2.1. Initial Selection of Indicators
The relevant literature at home and abroad was fully reviewed in this study to establish the main factors affecting the vulnerability of sewage network systems. A vulnerability evaluation model of the current sewage network system was constructed, and the evaluation indicators, impact factors, and integrated statistics of various types of evaluation data were determined. A comprehensive analysis of the vulnerability evaluation of the sewage network system was also carried out. The vulnerability of an urban sewage network system is affected by a variety of factors, and the principles of science, representativeness, comprehensiveness, effectiveness, and systematicity should be followed when selecting the evaluation indexes. The indicators were organized into the three levels of basic attribute indicators, operation- and maintenance-driven indicators, and structural-level indicators after extensively reviewing the literature and researching regional statistics.
The per capita daily domestic water consumption, per capita combined sewage volume, sewage pipe network density, sewage pumping station size and setup, natural growth rate of the urban population, per capita GDP, city size (in terms of population), service life of the pipeline network, composition of pipeline materials, total annual sewage discharge volume, annual sewage treatment volume, and urbanization rate were selected for the basic attribute indicator layer. The sewage collection rate, centralized urban sewage treatment rate, per capita daily sewage treatment rate, sewage network coverage, industrial wastewater discharge, number of sewage plants, industrial wastewater reuse rate, the amount invested by industrial enterprises to treat wastewater, the quality of sewage network construction, supervision, maintenance and management, the share of environmental pollution control in GDP, and the average annual investment in pipeline network maintenance were selected for the O&M-driven indicator layer. The pipe length, design flow rate, pipe diameter, slope, flow rate, and overflow capacity were selected for the structural level index layer.
2.2.2. Screening of Indicators
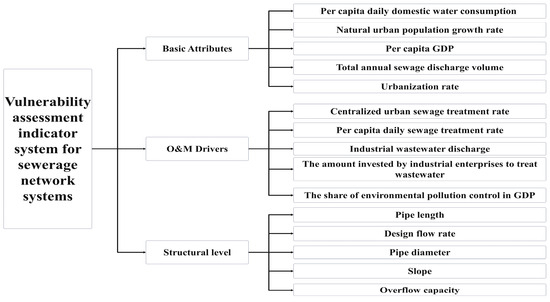
It was difficult to collect information using some of the indicators, and these indicators were unrelated to sewage network coverage, specifically, the number of sewage plants, the reuse rate of industrial wastewater, the average annual investment in maintenance of the network, the supervision of the quality of the construction of the sewage network and the management of maintenance, and the average annual investment in the maintenance of the network. Accordingly, these indicators were not utilized. In the case of repeated indicators, namely, per capita daily water consumption and comprehensive sewage volume, urban scale (in terms of population) and the natural growth rate of the urban population, the total annual discharge of sewage and the annual sewage treatment, sewage collection rate and centralized treatment of sewage, and flow rate and the design flow rate, one indicator was selected, and the other was not used. The meanings and calculation equations of the selected indicators are given in Table 1. The hierarchical structural modeling based on the final indicator selection is shown in Figure 2.
Table 1.
Vulnerability indicators for sewerage network systems and their interpretation [20,21].
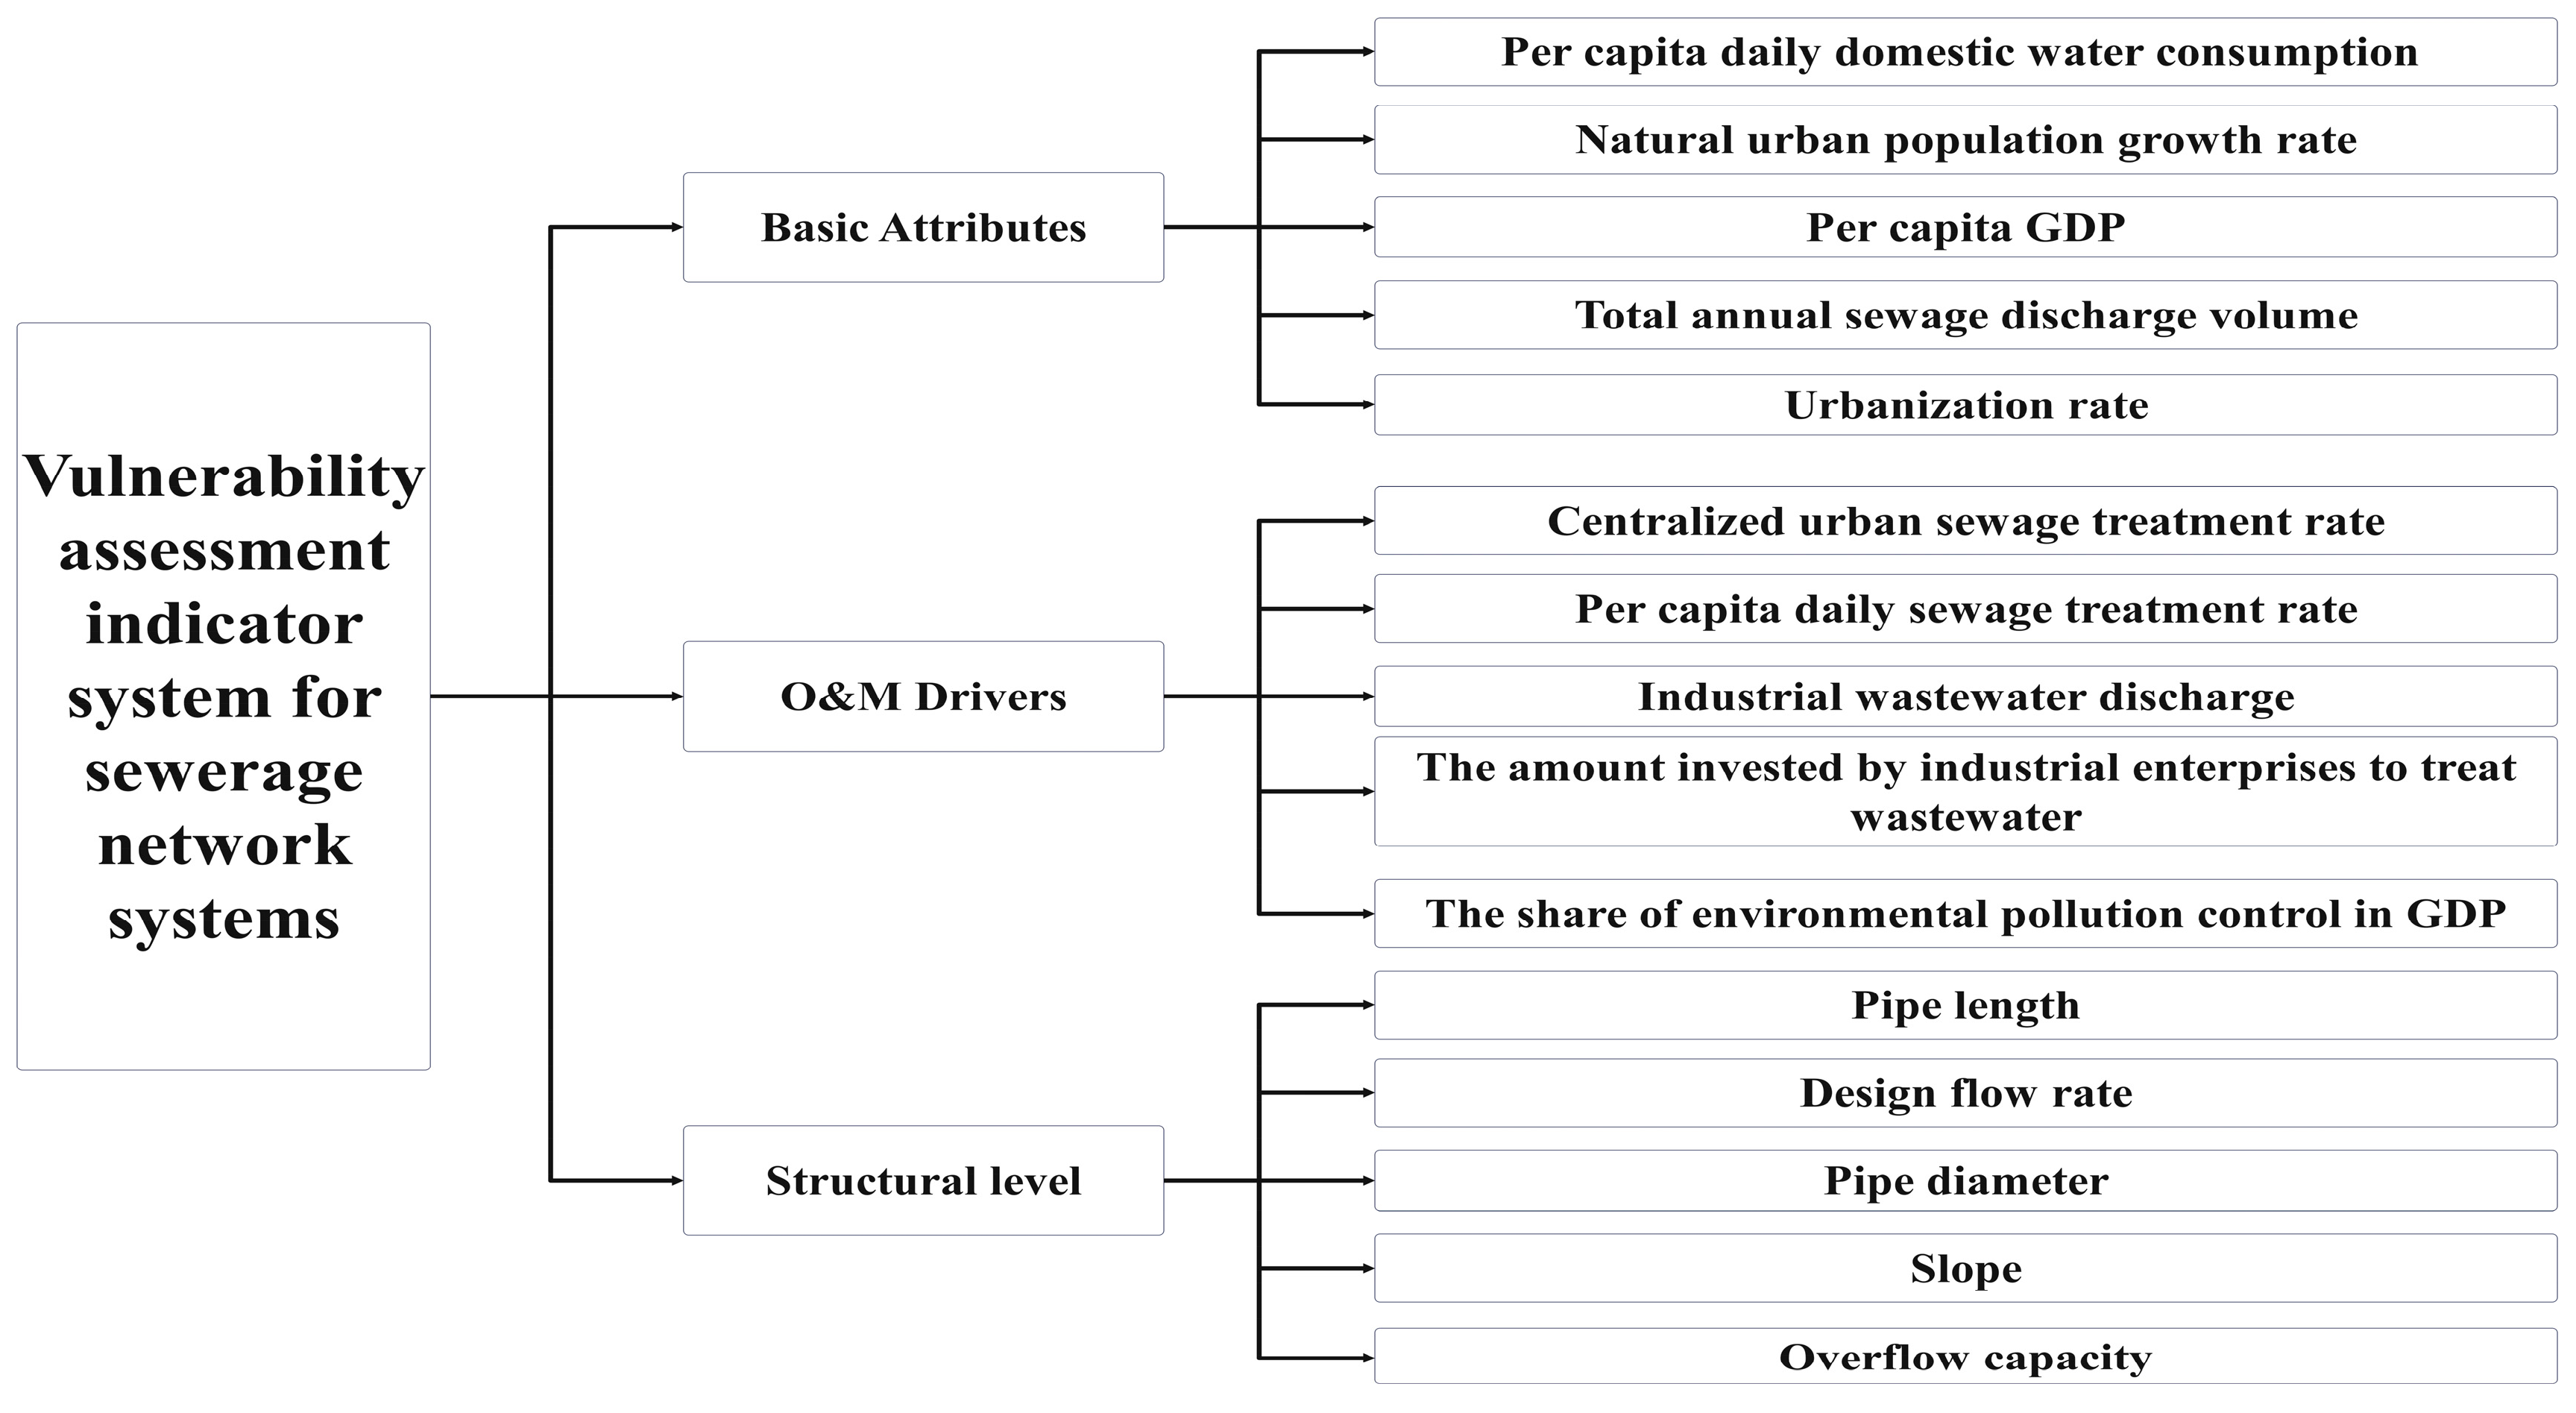
Figure 2.
Vulnerability assessment indicator system for sewerage network systems.
2.3. Evaluation Methodology
The extent to which the indicators affect the sewerage network system was determined in this study through PCA of the indicators. Then, an AHP based on the determined weights was used to comprehensively assess the vulnerability of the drainage network system.
Principal component analysis was performed using SPSS 27.0 software to process the data, and the basic calculation steps were as follows:
(1) Standardization of evaluation indexes.
The raw indicators were standardized using Formula (1) in order to eliminate the effect of the outline of the value of each evaluation indicator:
where is the standardized value of the original indicator value, is the original value of the jth evaluation indicator of the ith sample, and and are the sample mean and sample standard deviation of the jth indicator, respectively.
(2) Calculation of the correlation coefficient matrix R.
In this matrix,
where R is the n × n matrix of correlation coefficients, and is the correlation coefficient.
(3) Calculation of eigenvalues and eigenvectors.
To solve the characteristic equation , the Jacobi method is generally used to determine the eigenvalues , which are arranged in order of magnitude, i.e., . The eigenvectors corresponding to the eigenvalues are determined, and the requirement of is set.
(4) Calculation of the principal component contribution rate and cumulative contribution rate.
The contribution of the principal component is as follows:
The cumulative contribution rate is as follows:
where is the contribution rate of the principal component; is the eigenvalue; and P is the cumulative contribution rate, generally taking the first, second, …, m(m ≤ n) principal components corresponding to the eigenvalues with a cumulative contribution rate of 85% or more [22].
(5) Calculation of the principal component load.
where is the main principal component load factor.
(6) Selection of the principal components and calculation of the composite score value Z.
where is the principal component score, and Z is the principal component composite score.
The basic calculation steps of the AHP method are as follows: ① establishment of problem hierarchy framework; ② construction of the two-by-two comparison judgment matrix and consistency test, including the calculation of the consistency index CI, the average stochastic consistency index RI, and the consistency ratio CR; ③ determination of the weights of each element; and ④ calculation of the comprehensive diagnostic index. The AHP is used to determine the relative importance of each hierarchical element through pairwise comparisons and calculate a vector of weights. To verify the consistency of these weights, consistency indicators (CIs) and consistency ratios (CRs) are calculated [23].
where CI is the consistency index, and the larger the CI value, the more serious the degree of inconsistency of the judgment matrix; is the maximum eigenvalue; n is the number of matrix orders; and CR is the consistency ratio. The CR value should be less than 0.1 in order for the judgment matrix to pass the consistency test. RI is the stochastic consistency index, a measure of the magnitude of the CI, which is related to the number of orders of the matrix.
The vulnerability of the urban sewerage system in the study area was judged according to the composite rating values generated using the hierarchical analysis method (Table 2).
Table 2.
Vulnerability levels of urban sewerage systems.
3. Results and Discussion
3.1. Regional Overview
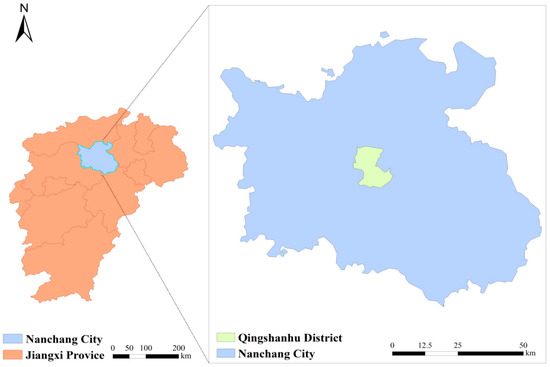
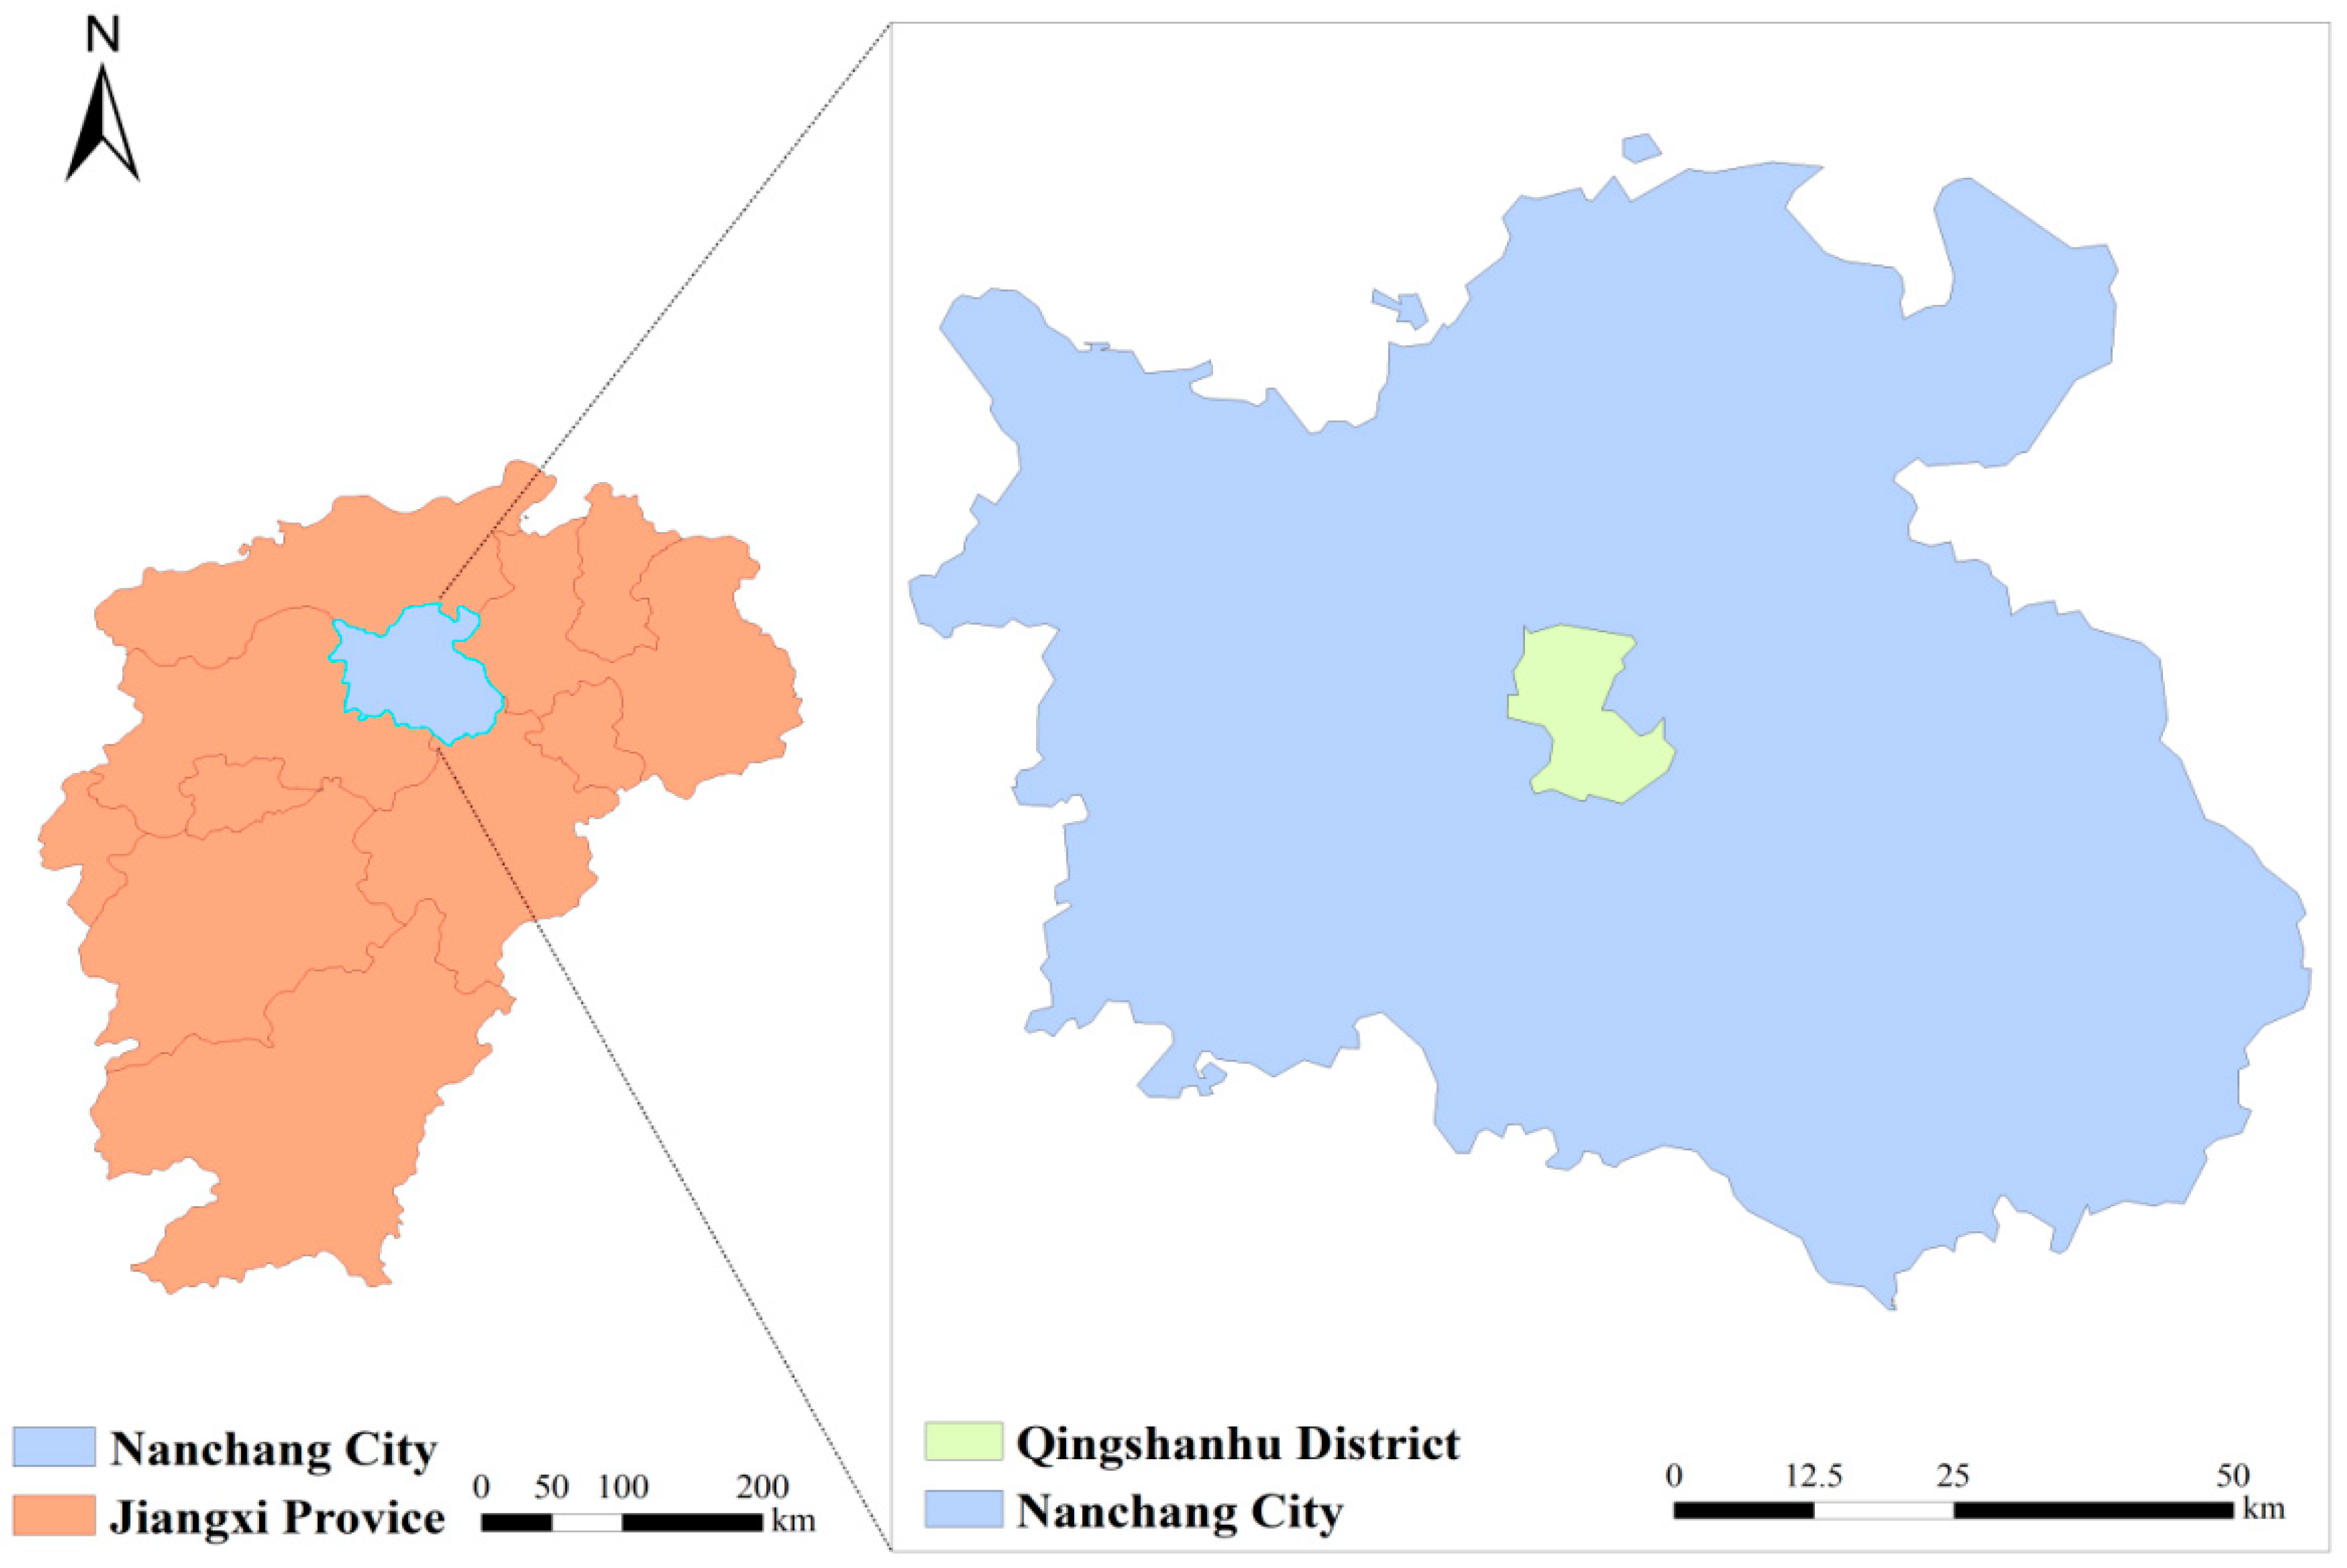
The capital city of Jiangxi Province is Nanchang. Qingshanhu District is an urban district under the jurisdiction of Nanchang (Figure 3). It is located in the north-central part of Jiangxi Province and on the lower reaches of the Ganjiang River. This area has a complete water system, dense river networks, and abundant water resources. The total population of the area is 443,000, and the total area is 224 square kilometers. Most of the area is flat, with a humid and mild climate and an annual rainfall of 1558.9 mm. As of 2023, the natural population growth rate of Nanchang is 6.19‰, the urbanization rate has reached 78.92%, and the centralized sewage treatment rate is 96.3%.
Figure 3.
Scope of the study area.
3.2. Analysis of Vulnerability Indicators in the Sewage Pipeline Network System
3.2.1. Data Acquisition
A dataset for evaluating the vulnerability indicators of the sewage pipeline network system from 2011 to 2022 was compiled (Appendix A) by consulting the “Nanchang Statistical Yearbook” and the “Nanchang Water Resources Bulletin”. The table was used to calculate the basic attributes and operational and maintenance drivers of the vulnerability evaluation of the sewage pipeline network system. According to the special sewage planning instructions of Nanchang, data were compiled to obtain a hydraulic calculation table of the main sewage collection pipes of the Qingshanhu District sewage treatment plant (Appendix B). The table was used to calculate the structural level factors for the vulnerability evaluation of the sewage pipeline network system.
3.2.2. Factor Applicability Test
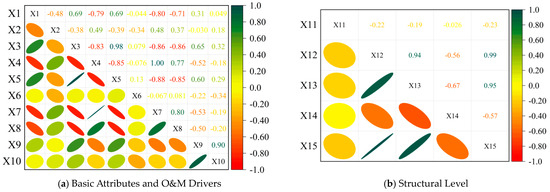
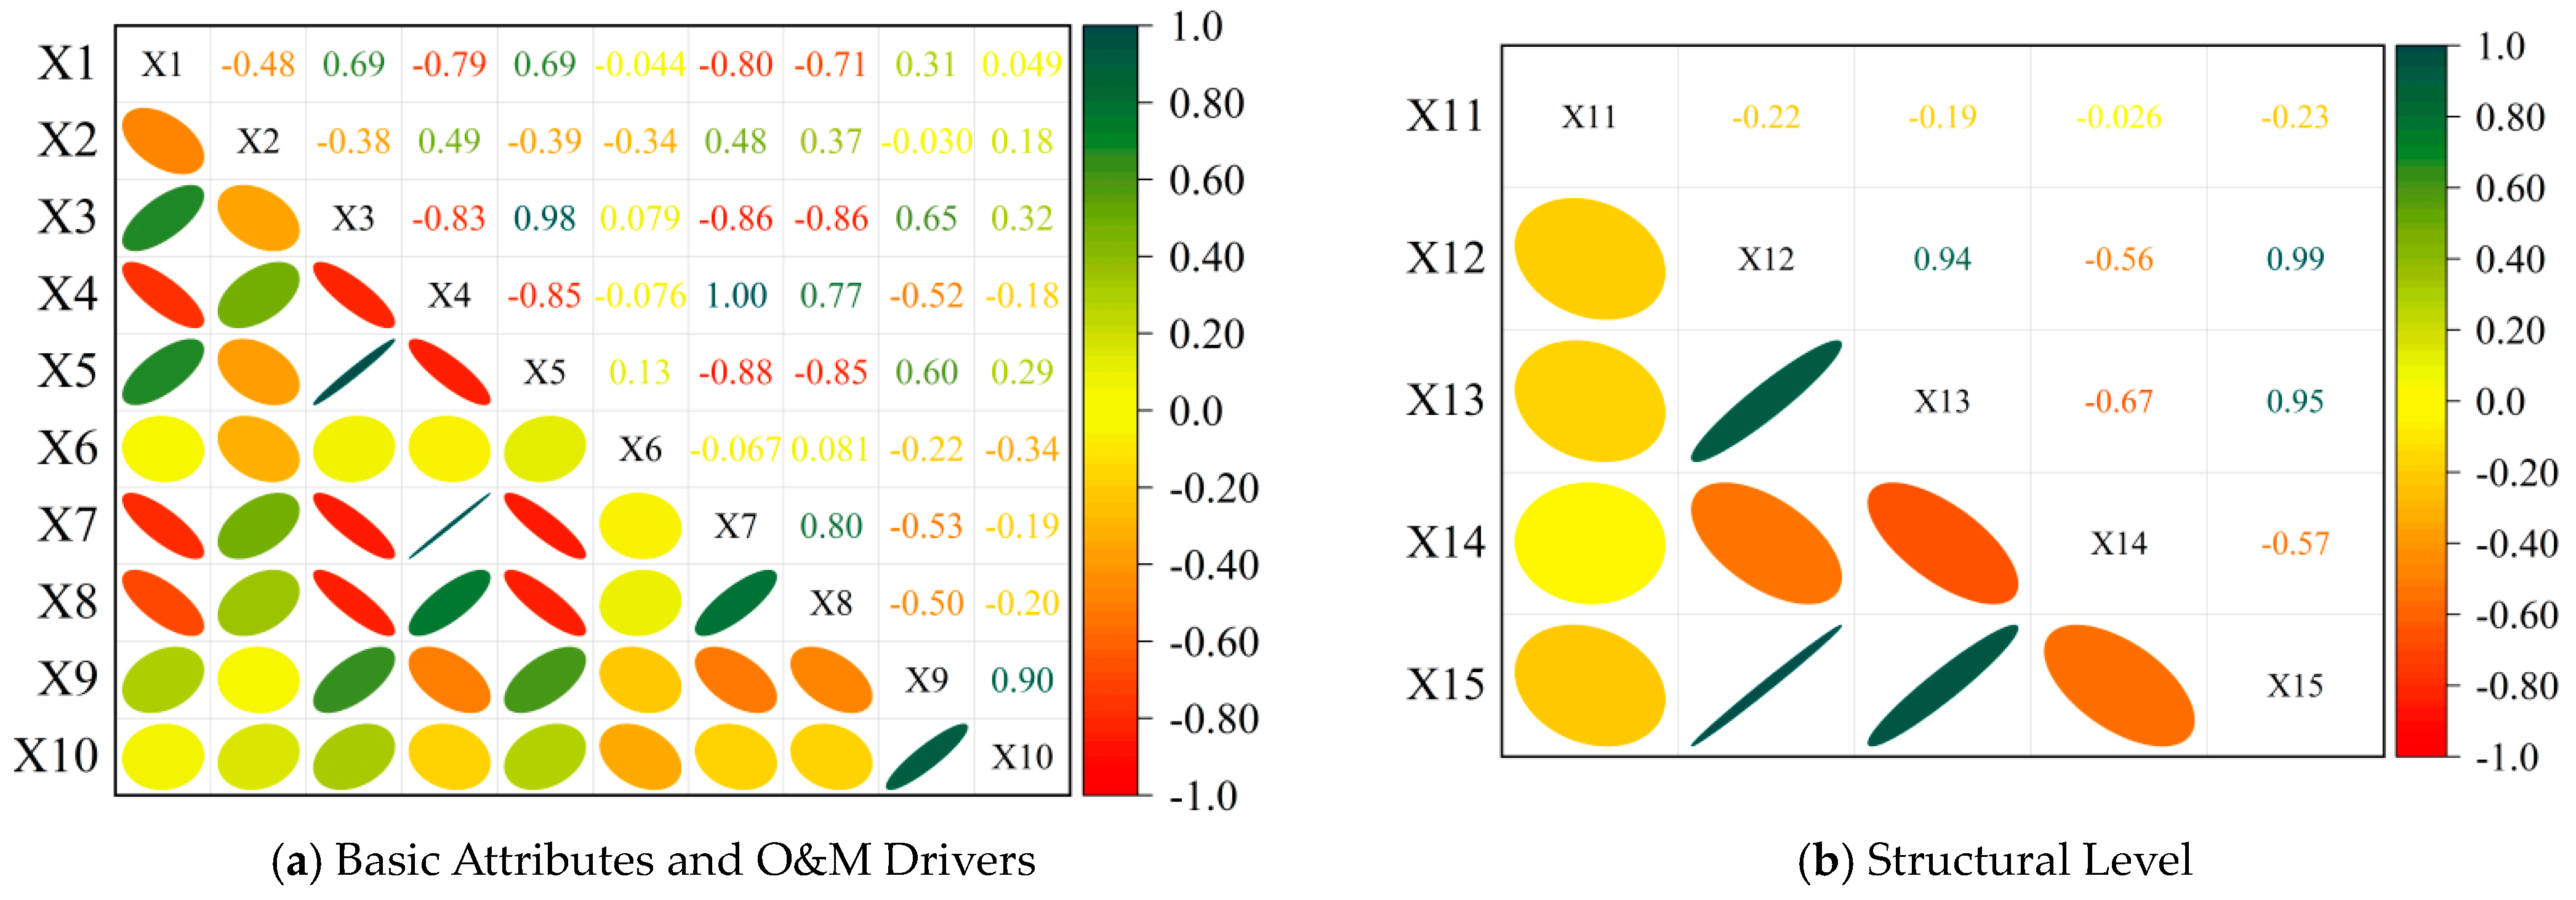
The principal component analysis was conducted using IBM SPSS Statistics 27 due to the fact that the data between the indicators are very different, and there are differences in the units of the scale. In order to eliminate the influence of the scale on the results of the analysis, the data in the indicator evaluation dataset were first standardized to make the processed data comparable, and the matrix of correlation coefficients was calculated (Figure 4).
Figure 4.
Correlation coefficient matrices. Note: positive correlation in red, negative correlation in green.
The applicability of the data can be tested using the correlation coefficient matrix. The correlation matrix helps determine whether there are relationships between the factors. From the correlation matrix, it can be seen that fewer than 5% of the absolute values are smaller than 0.1, while the rest are greater than 0.1, indicating a strong correlation among the indicators. Additionally, the applicability of factor analysis for the basic attributes, operational and maintenance drivers, and structural levels was tested using the KMO test and Bartlett’s sphericity test. The results showed KMO values of 0.588 and 0.747, both greater than 0.5, and Bartlett’s sphericity test values of 146.029 and 455.848, with significance values < 0.05, meeting the requirements for principal component analysis [24,25].
3.2.3. Principal Component Analysis (PCA)
Using the correlation coefficient matrix, principal component analysis was performed on the vulnerability evaluation indicators affecting the study area. The eigenvalues, contribution rates, and cumulative contribution rates were calculated (Table 3).
Table 3.
Principal component eigenvalues, contributions, and cumulative contributions.
Eigenvalues are indicators that can represent the extent to which the principal components explain the data. The contribution rate indicates the weight of a particular influencing factor on the vulnerability indicators of the drainage pipeline network. The larger the contribution rate, the greater the influence on the vulnerability of the drainage pipeline network. The cumulative variance contribution rate shows the percentage of information from all factors included by the first few principal components. Typically, principal components are selected based on the principle of a cumulative contribution rate greater than 85% [26]. Therefore, three principal components were selected for the basic attributes and operational and maintenance driver indicator layers, and two principal components were selected for the structural level. The principal component loading matrix was extracted using IBM SPSS Statistics 27 software, and the correlation coefficient matrix was calculated according to Equation (6) (Table 4).
Table 4.
Correlation coefficients of principal component load matrix.
The scores of the three principal components were calculated with Equation (7).
The comprehensive scores of the principal components were calculated with Equation (8). The scores were weighted based on the variance contribution rate of each principal component. The results are shown in Table 5.
Table 5.
Principal component evaluation values and composite evaluation values.
The importance of each indicator in the three criteria layers—basic attributes, operational and maintenance drivers, and structural levels—to the vulnerability of the sewage pipeline system is ranked as follows: X3 > X5 > X4 > X1 > X2; X7 > X8 > X9 > X10 > X6; X13 > X15 > X12 > X14 > X11. The degree of vulnerability in the sewage pipeline system can be inferred from the principal component scores, where a positive score indicates that the influencing factors of the drainage system vulnerability are higher than the average level and are positively correlated with the principal component. Conversely, a negative score indicates a below-average level and a negative correlation. According to the aggregate score in Table 5, in terms of basic attributes, the per capita GDP, urbanization rate, and per capita daily household water consumption have positive comprehensive evaluation values, indicating a positive correlation with the vulnerability of the sewage pipeline system. Higher per capita GDP and urbanization rates reflect the region’s economic strength, the scale of sewage pipeline construction, and the degree of development, which, in turn, indicate residents’ living standards and water usage levels. Additionally, per capita daily household water consumption reflects the residents’ water usage and the drainage system’s capacity to transport wastewater, playing a positive role in the sewage pipeline’s basic attributes. The urban population’s natural growth rate and the annual total sewage discharge are negatively correlated indicators. As the population gradually increases, the amount of sewage also increases, posing a significant threat to the sewage pipeline system in centralized long-distance transportation and treatment modes [27]. Among operational and maintenance drivers, the factor with the greatest impact on the sewage pipeline system’s vulnerability is the per capita daily treatment volume of sewage, followed by industrial sewage discharge. Within structural levels, the primary factors causing vulnerability in urban sewage pipeline systems are pipe diameter and flow capacity. During the long-distance transportation of domestic and industrial sewage, particulate matter and polymers in the pipelines, typically composed of sand, silt, organic matter, debris, and pollutants [28], tend to settle to the bottom of the pipes due to uneven flow rates and gravity, forming a sediment layer [29]. This reduces the effective cross-sectional area for sewage flow, increasing the risk of sewage overflow and pipe blockages, which can severely impact the environment [30,31]. Additionally, severe sedimentation along the sewage transportation path reduces the influent concentration at the sewage treatment plant, making long-distance centralized sewage transportation more vulnerable [32].
3.3. Vulnerability Assessment of Sewage Pipeline Systems Based on the AHP
3.3.1. Calculation of Comprehensive Vulnerability Evaluation Value for Sewerage Systems
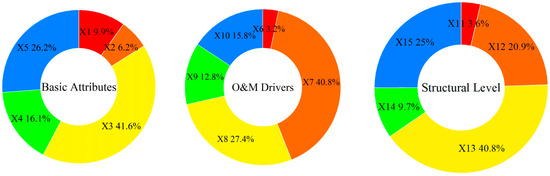
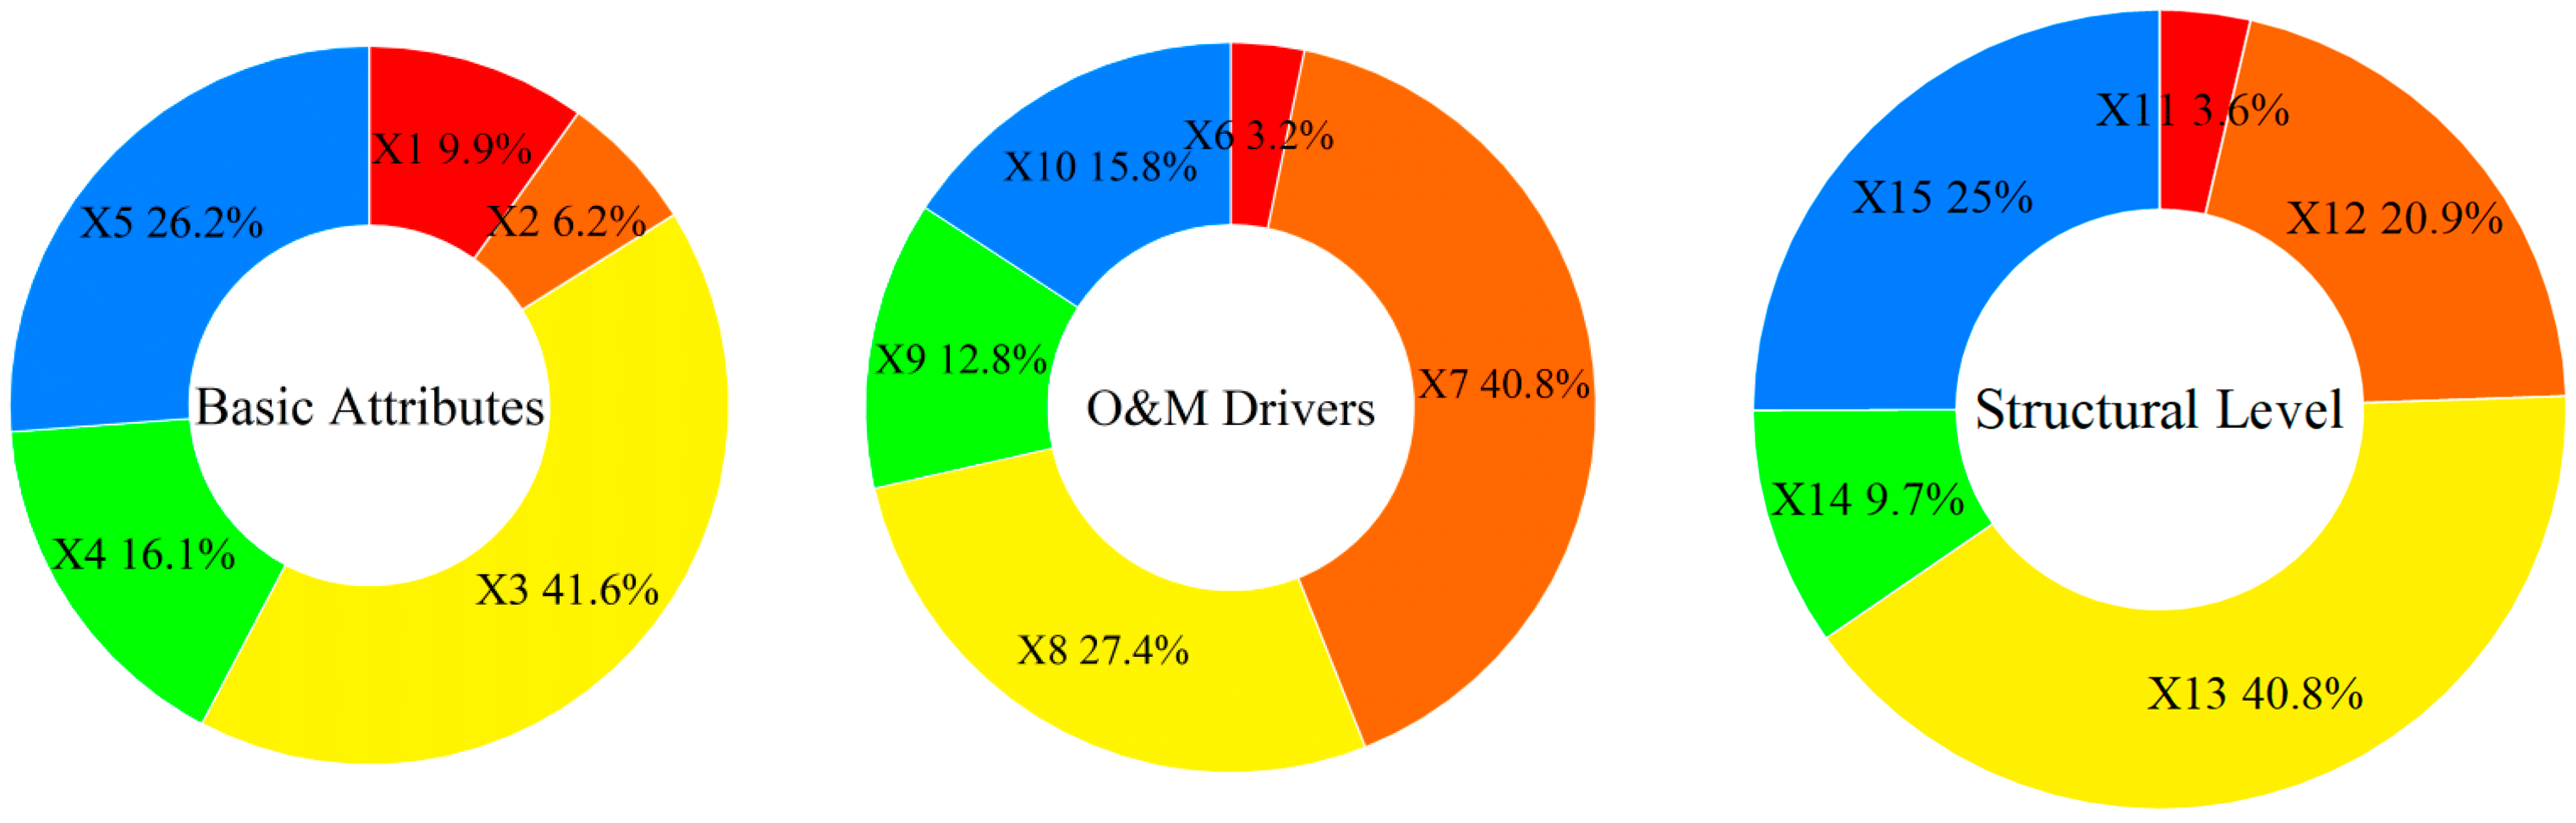
Normalization was performed based on the importance ranking values of the selected indicators from Section 3.2. A pairwise comparison matrix for the criteria layer elements was calculated for each level. The specific eigenvalues, eigenvectors, and consistency check scores are shown in Table 6, and the weight distribution of the criteria layer is illustrated in Figure 5.
Table 6.
Maximum eigenvalues, eigenvectors, and consistency tests for each criterion layer.
Figure 5.
Percentage of weights at the normative level. Note: X1–X15 are per capita daily domestic water consumption, natural urban population growth rate, per capita GDP, total annual sewage discharge volume, urbanization rate, centralized urban sewage treatment rate, per capita daily sewage treatment rate, industrial wastewater discharge, the amount invested by industrial enterprises to treat wastewater, the share of environmental pollution control in GDP, pipe length, design flow rate, pipe diameter, slope, and overflow capacity, respectively.
Each indicator was scored according to the evaluation scope of the indicators. The weighted scores were obtained by multiplying the weight data of each indicator from Figure 5 by the corresponding scores. The specific data are shown in Table 7. According to the vulnerability levels in Table 2, the weighted score for basic attributes is 58.38, which is classified as level III vulnerability. The O&M-driven and structural level scores are 68.68 and 73.17, respectively, and the vulnerability is classified as level II. Among the three criteria layers, the basic attributes have the lowest score. In urban infrastructure, it is crucial to consider the suitability of the sewage pipeline system in the face of population growth and investment in sewage treatment. Water environment safety, improvement in the quality and efficiency of the sewage pipeline system, and investment in funding are essential [33]. In the case of the operational and maintenance drivers’ criteria layer, the per capita daily treatment volume of sewage and industrial wastewater volume have a significant impact on the pipeline system’s vulnerability. Additionally, during the centralized collection of sewage by treatment plants, external factors may cause damage to the sewage pipeline network, potentially leading to sewage overflow or external water intrusion, which reduces sewage concentration, increases the treatment plant’s load, and decreases efficiency [34,35]. Regarding the water volume change in external water intrusion, the proportion of external water inflow and infiltration can be analyzed by using the characteristic factor–chemical mass balance method [36]. In order to further locate the point of external water inflow and infiltration, CCTV and fiber-optic DTS can be used, but they are easily limited by the operating level of the sewage network, the transmission distance, and the installation location [37].
Table 7.
Vulnerability scoring table of sewerage system in Qingshanhu District, Nanchang, China.
The highest score was the structural level of the sewage pipeline network system. In a centralized treatment mode, the slope of long-distance pipelines is a crucial factor affecting the vulnerability of the sewage pipeline network. The longer the pipeline, the more significant the impacts under long-distance transportation conditions, such as pipeline blockages, sludge accumulation, pipeline damage, and leakage [38]. At the structural level, pipe length has the lowest score of 2.59. In related studies, the length of the pipe has a considerable weight in the management and maintenance of the pipe and affects the transportation efficiency of the drainage system [39]. In sewage pipelines, particulate matter usually exists in a condensed state. Suspended particulate matter undergoes cohesion interactions with the pipe sludge, clogging the pipe when the particulate volume fraction is about 50%, reaching its filling limit [40]. Moreover, the presence of a large number of hydrocarbons, which have strong adhesive properties, in the pipeline makes clogging more likely to occur [41]. When the outlet flow rate of the pipeline is low and the diameter is small, particles accumulate above the sediment, gradually diffuse, and fill the pipeline [42]. Therefore, the overflow capacity and pipe diameter in the structure level improve resistance to vulnerability, and the pipe length is the key factor.
3.3.2. Response of the Sewerage Network System
The basic attribute is primarily related to the socioeconomic characteristics of the city and the amount of sewage discharged, etc. It reflects the basic conditions and pressures faced by the city’s sewage network system. A low score in this area indicates that sewage treatment is facing greater pressure or the carrying capacity of the system itself is weaker. Response measures have focused on adjusting and optimizing basic conditions and improving the coordination of socioeconomic and environmental management. Examples include improving water use efficiency and wastewater reuse, enhancing wastewater treatment capacity and facilities, strengthening environmental protection policies and investment guidance, and promoting green development and sustainable urbanization [43,44,45].
The O&M drivers reflect the efficiency of the operation, maintenance, and management of the sewage network, covering wastewater treatment capacity, investment in wastewater treatment, and industrial wastewater treatment. There is a need to improve management efficiency, strengthen operation and maintenance, and enhance wastewater treatment capacity. In this respect, it is necessary to strengthen the routine maintenance and management of wastewater treatment facilities, increase investment in industrial wastewater treatment, and improve the environmental protection investment mechanism [46].
The structure level reflects the design capacity and physical carrying capacity of the sewer network, as well as, to some extent, the efficiency and emergency response capability of the network system. The structural level scores high, but there is still a need to strengthen risk resilience by optimizing and upgrading the design of the pipeline network to ensure that it can be adapted to future urban development needs. The main countermeasures are to optimize the design and renovation of the pipeline network, to strengthen the monitoring and emergency response capacity of the official website, and to carry out regional meshing to improve the efficiency of the drainage system [47,48]. Pipelines are subjected to breakage, leakage, and positional deviation, which affect the vulnerability of the pipeline. The accurate detection and localization of underground structures can be performed via deep learning and RTM combined with GPR signal processing to detect the abnormal state of the pipeline [49].
4. Conclusions and Outlook
A vulnerability evaluation system for sewage pipe network systems was constructed in this study, considering three aspects: basic attribute indicators, O&M driver indicators, and structural level indicators. The degree of importance of these indicators was first determined using PCA, and then the judgment matrix of the AHP was constructed for comprehensive vulnerability evaluation. When evaluating and calculating the complex areas of a typical pipeline network, the weighted score for basic attributes is 58.38, indicating level III vulnerability. The natural urban population growth rate has the lowest score at 3.95. This indicator reflects the rate of population growth, which indirectly influences the potential increase in total wastewater discharge. The weighted score for O&M drivers is 68.68, indicating level II vulnerability. The lowest-scoring indicator in this category is the centralized urban sewage treatment rate, with a score of 2.60, which represents the coverage and accessibility of centralized treatment facilities. The weighted score for structural levels is 73.17, again reflecting level II vulnerability. The pipe length has the lowest score at 2.59. This indicator reflects the coverage and density of the sewer network, determining the service area size. However, transporting wastewater over long pipeline distances can lead to issues such as sludge deposition and blockages, reducing the pollutant concentration in the influent to treatment plants. This increases the operational load on treatment plants, thereby exacerbating the vulnerability of the wastewater pipeline system.
The recommendations for vulnerability diagnostics for sewer network systems are twofold: Consideration should be given to the impact of the level of diagnostic capacity of the sewerage network system, the level of management services, the impact on the environment, and the reuse and intelligent management of wastewater. It is essential to design the sewage pipeline system with a rational layout, adhering to principles of moderate concentration, local treatment, and proximity reuse. Additionally, optimizing the location and scale of sewage treatment plants will enhance both sewage treatment and reuse capabilities.
Author Contributions
X.Y.: conceptualization, writing—original draft, and resources. W.X.: conceptualization and formal analysis. T.W., J.S. and K.Z.: writing—original draft and writing—review and editing. C.J.: investigation, methodology, and writing—review and editing. All authors have read and agreed to the published version of the manuscript.
Funding
This research was financially supported by the science and technology projects in the field of housing construction in Jiangxi Province (2023-28).
Data Availability Statement
The original contributions presented in this study are included in the article. Further inquiries can be directed to the corresponding author.
Conflicts of Interest
Author Xiaobin Yin was employed by the company Nanchang Urban Planning & Design Institute Group Co., Ltd. The remaining authors declare that the research was conducted in the absence of any commercial or financial relationships that could be construed as a potential conflict of interest.
Appendix A. Sewerage System Vulnerability Indicator Evaluation Dataset 2011–2022
| Indicator Name | 2011 | 2012 | 2013 | 2014 | 2015 | 2016 | 2017 | 2018 | 2019 | 2020 | 2021 | 2022 |
| Per capita daily domestic water consumption (X1, L) | 234.34 | 277.11 | 238.14 | 241.04 | 217.04 | 389 | 387 | 381 | 379 | 377 | 350 | 349 |
| Natural urban population growth rate (X2, ‰) | 9.32 | 6.64 | 9.01 | 22.5 | 10.04 | 10.52 | 3.57 | 10.72 | 7.14 | 2.36 | 7.24 | 6.19 |
| per capita GDP (X3, CNY) | 51,569 | 55,073 | 60,245 | 64,446 | 68,185 | 72,954 | 77,957 | 85,772 | 91,088 | 93,307 | 105,765 | 111,031 |
| Total annual sewage discharge volume (X4, ten thousand tons) | 40,492 | 43,708 | 44,104 | 43,433 | 46,493 | 32,550 | 31,794 | 31,140 | 38,437 | 23,335 | 23,522.5 | 25,715.25 |
| urbanization rate (X5, %) | 67.24 | 68.45 | 69.83 | 70.86 | 71.56 | 72.29 | 73.32 | 74.23 | 75.16 | 78.08 | 78.64 | 78.92 |
| Centralized urban sewage treatment rate (X6, %) | 88.3 | 94.6 | 94.2 | 91 | 92.72 | 93.5 | 99.8 | 71.6 | 91 | 95 | 95.8 | 96.3 |
| Per capita daily sewage treatment rate (X7, tons/person-day) | 0.22 | 0.236 | 0.237 | 0.23 | 0.245 | 0.171 | 0.166 | 0.160 | 0.196 | 0.119 | 0.119 | 0.129 |
| Industrial wastewater discharge (X8, ten thousand tons) | 9367 | 12909 | 10602 | 8656 | 10,016 | 10,258 | 3861 | 3990 | 3716 | 3715.9 | 3798.8 | 3355.4 |
| The amount invested by industrial enterprises to treat wastewater (X9, ten thousand CNY) | 5819.4 | 12,856.3 | 26,872.3 | 21,767.5 | 31,064.9 | 21,221 | 25,331 | 60,886 | 21,253 | 16,004 | 87,187.5 | 43,149.6 |
| The share of environmental pollution control in GDP (X10, %) | 0.022 | 0.045 | 0.084 | 0.062 | 0.082 | 0.051 | 0.056 | 0.119 | 0.038 | 0.028 | 0.130 | 0.060 |
Appendix B. Structural Horizontal Vulnerability Dataset for Sewerage Network Systems
| Serial Number | Pipe Section Number | Pipe Length (X11, m) | Design Flow rate (X12, L/s) | Pipe Diameter (X13, mm) | Slope (X14, °) | Overflow Capacity (X15, L/s) |
| 1 | Q6a–Q6b | 423 | 29.46 | 500 | 0.0029 | 39.82 |
| 2 | Q6b–Q6c | 647 | 91.43 | 500 | 0.0015 | 98.25 |
| 3 | Q6c–Q6d | 630 | 204.53 | 800 | 0.001 | 209.08 |
| 4 | Q6d–Q6 | 1053 | 421.88 | 1000 | 0.001 | 444.08 |
| 5 | Q9a–Q9 | 1727 | 351.55 | 800 | 0.001 | 350.1 |
| 6 | Q1–2 | 713 | 85.03 | 500 | 0.0032 | 106.8 |
| 7 | Q2–3 | 1324 | 118.23 | 600 | 0.001 | 130.45 |
| 8 | Q3–4 | 480 | 192.26 | 800 | 0.0011 | 256.88 |
| 9 | Q4–5 | 543 | 226.06 | 800 | 0.001 | 244.92 |
| 10 | Q5–6 | 368 | 243.63 | 800 | 0.001 | 280.94 |
| 11 | Q6–7 | 565 | 647.79 | 1000 | 0.0012 | 695.36 |
| 12 | Q7–8 | 372 | 654.68 | 1000 | 0.0012 | 695.36 |
| 13 | Q8–9 | 595 | 746.47 | 1000 | 0.0015 | 777.44 |
| 14 | Q9–10 | 508 | 1034.75 | 1200 | 0.0012 | 1130.74 |
| 15 | Q10–10a | 502 | 1126.63 | 1200 | 0.001 | 1124.24 |
| 16 | Q10a–10b | 405 | 1187.11 | 1500 | 0.0008 | 1343.26 |
| 17 | Q10b–10c | 1213 | 1235.32 | 1500 | 0.0008 | 1343.26 |
| 18 | Q14a–Q14b | 209 | 77.67 | 600 | 0.001 | 80.88 |
| 19 | Q14b–Q14 | 810 | 140.8 | 600 | 0.001 | 146.87 |
| 20 | Q11–Q12 | 1050 | 114.89 | 600 | 0.001 | 140.08 |
| 21 | Q12–Q13 | 347 | 127.56 | 600 | 0.0025 | 206.26 |
| 22 | Q13–Q14 | 624 | 237.41 | 800 | 0.001 | 244.92 |
| 23 | Q14–Q15 | 629 | 346.15 | 1000 | 0.001 | 379.09 |
| 24 | Q15–Q16 | 806 | 459.53 | 1000 | 0.001 | 573.49 |
| 25 | Q16–Q17 | 825 | 554.85 | 1000 | 0.001 | 573.49 |
| 26 | Q17–Q17p | 451 | 591.19 | 1200 | 0.001 | 616.44 |
| 27 | Q18–Q19 | 692 | 653.78 | 1200 | 0.001 | 722.12 |
| 28 | Q19–Q20 | 700 | 789.93 | 1500 | 0.0008 | 832.8 |
| 29 | Q20––Q21 | 1338 | 789.93 | 1500 | 0.0008 | 832.8 |
| 30 | S1–2 | 424 | 156.39 | 600 | 0.0015 | 199.1 |
| 31 | S2–3 | 303 | 181.07 | 600 | 0.0015 | 199.1 |
| 32 | S3–4 | 154 | 1104.76 | 1200 | 0.0011 | 1179.11 |
| 33 | S5–6 | 471 | 1206.66 | 1200 | 0.0013 | 1281.83 |
| 34 | S6–7 | 295 | 1211.57 | 1200 | 0.0013 | 1281.83 |
| 35 | S7–8 | 107 | 1223.99 | 1200 | 0.0013 | 1281.83 |
| 36 | S8–9 | 335 | 1223.99 | 1200 | 0.0013 | 1281.83 |
| 37 | S10–11 | 240 | 1371.3 | 1500 | 0.0006 | 1578.93 |
| 38 | S11–12 | 560 | 1395.61 | 1500 | 0.0006 | 1578.93 |
| 39 | S12–13 | 166 | 1395.61 | 1500 | 0.0006 | 1578.93 |
| 40 | S13–14 | 225 | 1487.7 | 1500 | 0.0006 | 1578.93 |
| 41 | S14–15 | 327 | 1511.13 | 1500 | 0.0006 | 1578.93 |
| 42 | S15–16 | 474 | 1605.59 | 1500 | 0.0007 | 1705.44 |
| 43 | S16–17 | 159 | 1605.59 | 1500 | 0.0007 | 1705.44 |
| 44 | S17–18 | 438 | 1738.4 | 1800 | 0.0005 | 2343.8 |
| 45 | S18–19 | 374 | 1801.71 | 1800 | 0.0005 | 2343.8 |
| 46 | S19–20 | 373 | 1801.71 | 1800 | 0.0005 | 2343.8 |
| 47 | S20–21 | 320 | 1830.18 | 1800 | 0.0005 | 2343.8 |
| 48 | S21–22 | 319 | 1878.26 | 1800 | 0.0005 | 2343.8 |
| 49 | S22–23 | 373 | 3011.84 | 2000 | 0.0006 | 3400.42 |
| 50 | S23–24 | 1000 | 3028.53 | 2000 | 0.0006 | 3400.42 |
| 51 | S25–26 | 308 | 3109.52 | 2000 | 0.0006 | 3400.42 |
| 52 | S26–27 | 365 | 3123.76 | 2000 | 0.0006 | 3400.42 |
| 53 | S27–28 | 593 | 3150.4 | 2000 | 0.0006 | 3400.42 |
| 54 | S28–29 | 863 | 3251.86 | 2000 | 0.0006 | 3400.42 |
| 55 | S29–30 | 295 | 3340.61 | 2000 | 0.0006 | 3400.42 |
| 56 | S31–32 | 299.6 | 42.5 | 500 | 0.0012 | 109.51 |
| 57 | S32–33 | 930 | 134.71 | 600 | 0.0012 | 178.08 |
| 58 | S33–34 | 837 | 165.63 | 600 | 0.0011 | 170.5 |
| 59 | S34–30 | 1303.1 | 210.19 | 800 | 0.0009 | 332.14 |
| 60 | S17-1–S17-2 | 1128 | 188.42 | 600 | 0.0012 | 178.08 |
| 61 | S17-2–S17-3 | 113 | 226.14 | 600 | 0.002 | 229.9 |
| 62 | S17-3–S17-4 | 262 | 299.19 | 800 | 0.001 | 350.1 |
| 63 | S17-4–S17-5 | 346 | 348.71 | 800 | 0.001 | 350.1 |
| 64 | S17-5–S17 | 275 | 381.5 | 800 | 0.0012 | 383.52 |
References
- Ghavami, S.M.; Borzooei, Z.; Maleki, J. An effective approach for assessing risk of failure in urban sewer pipelines using a combination of GIS and AHP-DEA. Process Saf. Environ. Prot. 2020, 133, 275–285. [Google Scholar] [CrossRef] [Scilit]
- Maw, M.M.; Boontanon, N.; Aung, H.K.Z.Z.; Jindal, R.; Fujii, S.; Visvanathan, C.; Boontanon, S.K. Microplastics in wastewater and sludge from centralized and decentralized wastewater treatment plants: Effects of treatment systems and microplastic characteristics. Chemosphere 2024, 361, 142536. [Google Scholar] [CrossRef] [Scilit] [PubMed]
- Cheng, M.; Li, J. Optimal sensor placement for leak location in water distribution networks: A feature selection method combined with graph signal processing. Water Res. 2023, 242, 120313. [Google Scholar] [CrossRef] [Scilit]
- Xu, J.; Chu, W.; Liu, S.; Wang, S.; Xu, Z. Technical method of evaluation and analysis for key points of improving the quality and efficiency of urban sewage treatment in China. Water Wastewater Eng. 2022, 48, 1–7. [Google Scholar]
- Yin, H.; Zhang, H.; Xu, Z. Review of Intelligent Decision-Making Technologies for Urban Drainage System. J. Tongji Univ. Nat. Sci. 2021, 49, 1426–1434. [Google Scholar]
- Huang, Y.; Li, P.; Li, H.; Zhang, B.; He, Y. To centralize or to decentralize? A systematic framework for optimizing rural wastewater treatment planning. J. Environ. Manag. 2021, 300, 113673. [Google Scholar] [CrossRef] [Scilit] [PubMed]
- Okwori, E.; Viklander, M.; Hedström, A. Performance assessment of Swedish sewer pipe networks using pipe blockage and other associated performance indicators. H2Open J. 2020, 3, 46–57. [Google Scholar] [CrossRef] [Scilit]
- Zeydalinejad, N.; Javadi, A.A.; Webber, J.L. Global perspectives on groundwater infiltration to sewer networks: A threat to urban sustainability. Water Res. 2024, 262, 122098. [Google Scholar] [CrossRef] [Scilit] [PubMed]
- Ananda, J. Assessing the operational efficiency of wastewater services whilst accounting for data uncertainty and service quality: A semi-parametric approach. Water Int. 2020, 45, 921–944. [Google Scholar] [CrossRef] [Scilit]
- Ge, J.; Li, J.; Qiu, R.; Shi, T.; Zhang, C.; Huang, Z.; Yuan, Z. A data-driven method for estimating sewer inflow and infiltration based on temperature and conductivity monitoring. Water Res. 2024, 261, 122002. [Google Scholar] [CrossRef] [Scilit] [PubMed]
- Ba, Z.; Fu, J.; Liang, J.; Liang, K.; Wang, M. Risk Assessment Method of Drainage Network Operation Based on Fuzzy Comprehensive Evaluation Combined with Analytic Network Process. J. Pipeline Syst. Eng. Pract. 2021, 12, 04021009. [Google Scholar] [CrossRef] [Scilit]
- Baah, K.; Dubey, B.; Harvey, R.; McBean, E. A risk-based approach to sanitary sewer pipe asset management. Sci. Total Environ. 2015, 505, 1011–1017. [Google Scholar] [CrossRef] [Scilit]
- Yan, M.; Wang, H.; Liu, Z.; Gong, W.; Dai, X. Establishment and study on the evaluation index system for operational efficiency of urban drainage systems. Chin. J. Environ. Eng. 2023, 17, 3124–3136. [Google Scholar]
- Liu, X.; Guo, W. Dynamic nonlinear effects of urbanization on wastewater discharge based on inertial characteristics of wastewater discharge. Sci. Total Environ. 2023, 904, 166514. [Google Scholar] [CrossRef] [Scilit]
- Shakeri, H.; Motiee, H.; Mcbean, E. Forecasting impacts of climate change on changes of municipal wastewater production in wastewater reuse projects. J. Clean. Prod. 2021, 329, 129790. [Google Scholar] [CrossRef] [Scilit]
- Xu, J.; Xu, Z. China sewage treatment engineering issues assessment. J. Clean. Prod. 2022, 377, 134391. [Google Scholar] [CrossRef] [Scilit]
- Singh, B.J.; Chakraborty, A.; Sehgal, R. A systematic review of industrial wastewater management: Evaluating challenges and enablers. J. Environ. Manag. 2023, 348, 119230. [Google Scholar] [CrossRef] [Scilit] [PubMed]
- Wang, J.; Liu, G.-H.; Wang, J.; Xu, X.; Shao, Y.; Zhang, Q.; Liu, Y.; Qi, L.; Wang, H. Current status, existent problems, and coping strategy of urban drainage pipeline network in China. Environ. Sci. Pollut. Res. 2021, 28, 43035–43049. [Google Scholar] [CrossRef] [Scilit]
- Dhawale, R.; Schuster-Wallace, C.J.; Pietroniro, A. Assessing the multidimensional nature of flood and drought vulnerability index: A systematic review of literature. Int. J. Disaster Risk Reduct. 2024, 112, 104764. [Google Scholar] [CrossRef] [Scilit]
- Wang, Q.; Li, L. The effects of population aging, life expectancy, unemployment rate, population density, per capita GDP, urbanization on per capita carbon emissions. Sustain. Prod. Consum. 2021, 28, 760–774. [Google Scholar]
- Cheng, Y.; Xu, Z. Fiscal centralization and urban industrial pollution emissions reduction: Evidence from the vertical reform of environmental administrations in China. J. Environ. Manag. 2023, 347, 119212. [Google Scholar] [CrossRef] [Scilit]
- Sinaei, A.; Dziedzic, R.; Creaco, E. Holistic Assessment of Social, Environmental and Economic Impacts of Pipe Breaks: The Case Study of Vancouver. Water 2025, 17, 252. [Google Scholar] [CrossRef] [Scilit]
- Bogdan, P.-L.; Nedeff, V.; Panainte-Lehadus, M.; Chitimuș, D.; Barsan, N.; Nedeff, F.M. Delineation of Groundwater Potential Zones Using Geospatial Techniques. Case Study: Roman City and the Surrounding Area in the Northeastern Region, Romania. Water 2024, 16, 3013. [Google Scholar] [CrossRef] [Scilit]
- Ibrahim, A.; Ismail, A.; Juahir, H.; Iliyasu, A.B.; Wailare, B.T.; Mukhtar, M.; Aminu, H. Water quality modelling using principal component analysis and artificial neural network. Mar. Pollut. Bull. 2023, 187, 114493. [Google Scholar] [CrossRef] [Scilit] [PubMed]
- Zhang, X.; Li, S. Spatial and Temporal Distribution Characteristics of Water Quality in Beiluo River and Pollution Sources Based on Principal Component Analysis. Bull. Soil Water Conserv. 2022, 42, 153–160,171. [Google Scholar]
- Xing, J.; Song, N.; Chen, X. Water Quality Assessment of Heilongjiang Control Section in Songhua River Basin Based on Principal Component Analysis. China Water Wastewater 2021, 37, 89–94. [Google Scholar]
- Anbarasu, S.; Brindha, K.; Elango, L. Multi-influencing factor method for delineation of groundwater potential zones using remote sensing and GIS techniques in the western part of Perambalur district, southern India. Earth Sci. Inform. 2020, 13, 317–332. [Google Scholar] [CrossRef] [Scilit]
- Li, C.; Chen, K.; Bao, Z.; Ng, S.T. Hybrid knowledge and data driven approach for prioritizing sewer sediment cleaning. Autom. Constr. 2024, 165, 105577. [Google Scholar] [CrossRef] [Scilit]
- Luo, Y.; Bao, S.; Yang, S.; Zhang, Y.; Ping, Y.; Lin, C.; Yang, P. Characterization, Spatial Variation and Management Strategy of Sewer Sediments Collected from Combined Sewer System: A Case Study in Longgang District, Shenzhen. Int. J. Environ. Res. Public Health 2021, 18, 7687. [Google Scholar] [CrossRef] [Scilit] [PubMed]
- Jimoh, M.; Abolfathi, S. Modelling pollution transport dynamics and mixing in square manhole overflows. J. Water Process Eng. 2022, 45, 102491. [Google Scholar] [CrossRef] [Scilit]
- Montes, C.; Kapelan, Z.; Saldarriaga, J. Predicting non-deposition sediment transport in sewer pipes using Random forest. Water Res. 2021, 189, 116639. [Google Scholar] [CrossRef] [Scilit] [PubMed]
- Xu, Z.; Xu, J.; Jin, W.; Yin, H.; Lin, H. Challenges and opportunities of black and odorous water body in the cities of China. Water Wastewater Eng. 2019, 45, 1–5+77. [Google Scholar]
- Zaharia, C. Decentralized wastewater treatment systems: Efficiency and its estimated impact against onsite natural water pollution status. A Rom. Case Study. Process Saf. Environ. Prot. 2017, 108, 74–88. [Google Scholar] [CrossRef] [Scilit]
- Gao, Y.; Shi, X.; Jin, X.; Wang, X.C.; Jin, P. A critical review of wastewater quality variation and in-sewer processes during conveyance in sewer systems. Water Res. 2023, 228, 119398. [Google Scholar] [CrossRef] [Scilit] [PubMed]
- Pramanik, S.K.; Bhuiyan, M.; Robert, D.; Roychand, R.; Gao, L.; Cole, I.; Pramanik, B.K. Bio-corrosion in concrete sewer systems: Mechanisms and mitigation strategies. Sci. Total Environ. 2024, 921, 171231. [Google Scholar] [CrossRef] [Scilit] [PubMed]
- Liu, S.; Xu, Z.; Chu, W.; Wang, S.; Xu, Z. Numerical analysis and location method of stormwater inflow in urban sewer network. Water Wastewater Eng. 2023, 49, 150–156. [Google Scholar]
- Beheshti, M.; Saegrov, S. Quantification Assessment of Extraneous Water Infiltration and Inflow by Analysis of the Thermal Behavior of the Sewer Network. Water 2018, 10, 1070. [Google Scholar] [CrossRef] [Scilit]
- Cao, Y.; Jun, W.; Liu, Z.; Zhang, Y.; Kroiss, H.; Daigger, G.; Peng, Y. Four factors need to be considered to improve and upgrade current sewer systems in China:Quantitative analysis. Water Wastewater Eng. 2022, 48, 45–55. [Google Scholar]
- Wang, H.; Yan, M.; Gao, Y.; Wang, Y.; Dai, X. An Evaluation System for Assessing the Operational Efficiency of Urban Combined Sewer Systems Using AHP—Fuzzy Comprehensive Evaluation: A Case Study in Shanghai, China. Water 2023, 15, 3434. [Google Scholar] [CrossRef] [Scilit]
- Balakin, B.V.; Chang, Y.-F.; Øynes, M.; Struchalin, P.G. Plugging of pipes by cohesive particles. Computed tomography investigation and theoretical analysis. Chem. Eng. Sci. 2024, 296, 120214. [Google Scholar] [CrossRef] [Scilit]
- Rensing, P.J.; Liberatore, M.W.; Sum, A.K.; Koh, C.A.; Sloan, E.D. Viscosity and yield stresses of ice slurries formed in water-in-oil emulsions. J. Non-Newton. Fluid Mech. 2011, 166, 859–866. [Google Scholar] [CrossRef] [Scilit]
- Struchalin, P.G.; Balakin, B.V. Blocking dead zones to avoid plugs in pipes. Chem. Eng. Res. Des. 2023, 194, 649–652. [Google Scholar] [CrossRef] [Scilit]
- Nieuwenhuis, E.; Cuppen, E.; Langeveld, J.; de Bruijn, H. Towards the integrated management of urban water systems: Conceptualizing integration and its uncertainties. J. Clean. Prod. 2021, 280, 124977. [Google Scholar] [CrossRef] [Scilit]
- Tsatsou, A.; Frantzeskaki, N.; Malamis, S. Nature-based solutions for circular urban water systems: A scoping literature review and a proposal for urban design and planning. J. Clean. Prod. 2023, 394, 136325. [Google Scholar] [CrossRef] [Scilit]
- Xia, B.; Li, S.; Shen, W.; Mi, M.; Zhuang, Y.; Zhang, L. Sewage leakage challenges urban wastewater management as evidenced by the Yangtze River basin of China. Npj Clean Water 2024, 7, 99. [Google Scholar] [CrossRef] [Scilit]
- Pasciucco, F.; Pecorini, I.; Iannelli, R. Planning the centralization level in wastewater collection and treatment: A review of assessment methods. J. Clean. Prod. 2022, 375, 134092. [Google Scholar] [CrossRef] [Scilit]
- Martínez, D.; Bergillos, S.; Corominas, L.; Comas, J.; Wang, F.; Kooij, R.; Calle, E. Enhancing reclaimed water distribution network resilience with cost-effective meshing. Sci. Total Environ. 2024, 938, 173051. [Google Scholar] [CrossRef] [Scilit]
- Xu, K.; Zhang, X.; Bin, L.; Shen, R. An improved global resilience assessment method for urban drainage systems: A case study of Haidian Island, south China. J. Environ. Manag. 2024, 360, 121135. [Google Scholar] [CrossRef] [Scilit]
- Lei, J.; Fang, H.; Zhu, Y.; Chen, Z.; Wang, X.; Xue, B.; Yang, M.; Wang, N. GPR detection localization of underground structures based on deep learning and reverse time migration. NDT E Int. 2024, 143, 103043. [Google Scholar] [CrossRef] [Scilit]

Disclaimer/Publisher’s Note: The statements, opinions and data contained in all publications are solely those of the individual author(s) and contributor(s) and not of MDPI and/or the editor(s). MDPI and/or the editor(s) disclaim responsibility for any injury to people or property resulting from any ideas, methods, instructions or products referred to in the content. |
© 2025 by the authors. Licensee MDPI, Basel, Switzerland. This article is an open access article distributed under the terms and conditions of the Creative Commons Attribution (CC BY) license (https://creativecommons.org/licenses/by/4.0/).