Article

Metformin Mineralization via an Fe-PILC-Catalyzed Photo-Fenton Reaction Driven by UV and Visible Light


by
Deysi Amado-Piña
1,
Rubi Romero
1,*,
Armando Ramírez-Serrano
1,
Sandra Luz Martínez-Vargas
2,
Teresa Torres-Blancas
3 and
Reyna Natividad
1,*
1
Chemical Engineering Laboratory, Centro Conjunto de Investigación en Química Sustentable, UAEM-UNAM, Universidad Autónoma del Estado de México, km 14.5 Toluca-Atlacomulco Road, Toluca 50200, Mexico
2
Chemistry Faculty, Universidad Autónoma del Estado de México, UAEMex, km 14.5 Toluca-Atlacomulco Road, Toluca 50200, Mexico
3
Division of Graduate Studies and Research, Technological Institute of Toluca, Tecnologico Avenue, Metepec 52149, Mexico
*
Authors to whom correspondence should be addressed.
Water 2025, 17(20), 3028; https://doi.org/10.3390/w17203028
Submission received: 24 September 2025 / Revised: 14 October 2025 / Accepted: 17 October 2025 / Published: 21 October 2025

Abstract

The presence of various drugs in wastewater has generated growing concern about the contamination of water bodies. This requires urgent attention and the development of effective methods for their degradation in aquatic ecosystems. The present study evaluates the efficiency of metformin (MET) degradation via various photochemical processes—photolysis, H2O2 photodecomposition, photocatalysis, and photo-Fenton—using iron-pillared bentonite clays (Fe-PILC) as a catalyst. The influence of radiation wavelength (254 nm and visible light) was investigated, while MET degradation, H2O2 consumption, and total organic carbon (TOC) removal were monitored as key response variables. Structural characterization confirmed successful pillaring, increasing the surface area of bentonite from 35 to 246 m2/g, with iron content at 11 wt. % quantified by atomic absorption spectroscopy. Fe3O4 and FeO were identified using XPS, and a 2.08 eV band-gap energy was revealed via diffuse reflectance spectroscopy. Experiments were conducted at environmentally relevant MET concentrations (13,000 ng L−1) in a 0.1 L batch photoreactor at 25 °C. The results demonstrate that (i) photo-Fenton was the most efficient process to remove and mineralize MET (100% degradation after 10 min and 83% mineralization after 90 min); (ii) Fe-PILC is effectively activated at λ < 700 nm, enabling 75% mineralization under visible light; (iii) hydroxyl radicals and valence band holes were the primary oxidative species driving MET oxidation; and (iv) cyanoguanidine and carboxylic acids were identified as main oxidation by-products via UHPLC. Pseudo-first-order kinetic constants were determined for all processes, offering insight into their relative efficiencies. Notably, the rate constant for photo-Fenton under visible light (0.406 min−1) was comparable to that under UV -light (0.545 min−1), highlighting the potential of visible light-driven treatments. Therefore, this study demonstrated the metformin degradation capability of iron-pillared clays under both visible and UV light.

1. Introduction

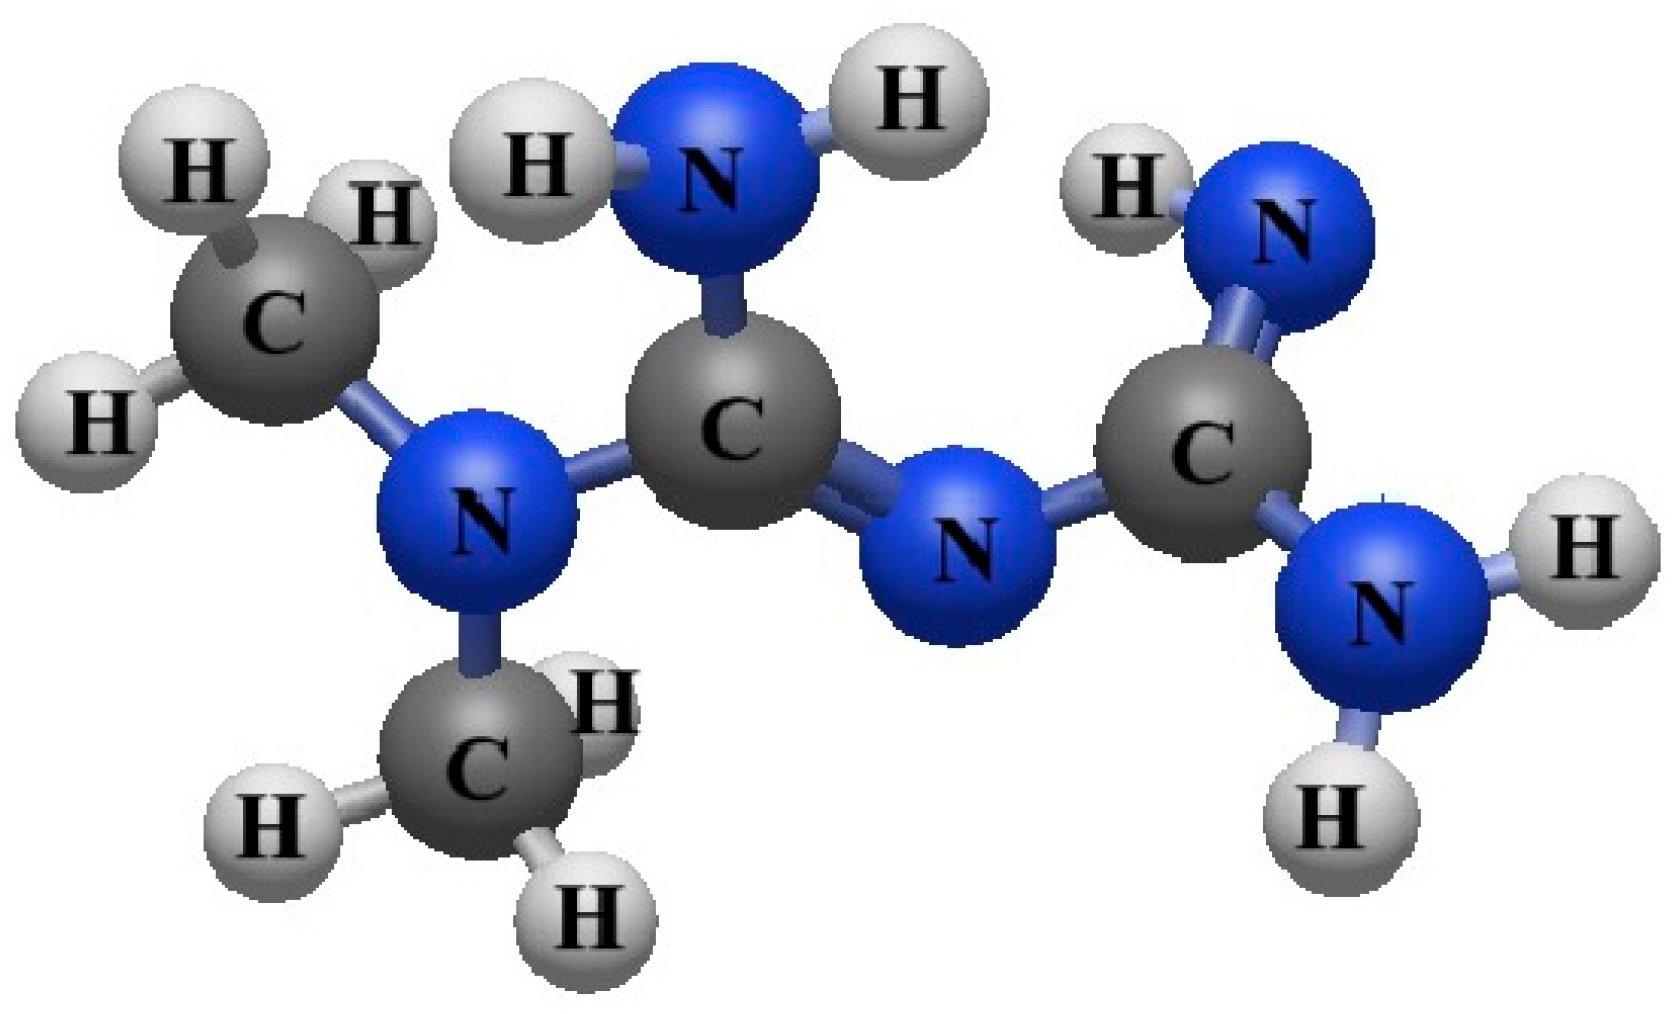
Rapid industrial growth and the ever-increasing population have led to a considerable increase in pollution levels, placing significant pressure on the environment and compromising its sustainability [1,2]. In this context, water pollution is a priority problem that requires immediate attention to mitigate its environmental effects. Among the various types of pollutants, pharmaceutical waste stands out for its negative impact, as it poses a significant threat to environmental health. Metformin (MET), also known as N-1,1-dimethyl-biguanide (Figure 1), is an emerging contaminant [3] found in many water bodies around the globe, and this has been ascribed to the fact that it is widely prescribed for the control of diabetes (type 2) [4]. In addition, unmetabolized metformin by the human body is excreted through feces and urine [5]. In this way, MET reaches water treatment plants and/or water bodies [6]. In this sense, it has been reported that unprocessed and thus excreted metformin is ca. 70% of ingested doses [7]. Metformin has been detected in water bodies of 14 nations in three continents, including Germany, China, Spain, Austria, Canada, the United States, and Mexico [7].
In Mexico, the MET concentrations found in Madin reservoir (MR) range 378–11,694 ng L−1 [8], depending on the sampling site. This reservoir is in the State of Mexico, between the towns of Atizapan de Zaragoza and Naucalpan de Juarez. The Tlalnepantla River and MR both receive sewage water from various locations without any prior treatment. Besides providing drinking water to neighboring settlements, the MR is also a destination for eco-tourism activities, including kayaking, sailing, and carp fishing. However, the reservoir’s common carp population has noticeably declined over time [9]. Thus, it is important to remove pollutants like metformin from this water body.
Currently, various methods and technologies are used for wastewater treatment, such as sedimentation, coagulation, flocculation, and filtration. However, it has been proven that these processes are not effective for removing pharmaceutical compounds [10]. Therefore, it is necessary to incorporate complementary treatments, such as biological processes, ozonation [11] or other advanced oxidation processes, to allow for their complete degradation.
Advanced oxidation processes (AOPs) are a powerful alternative technique to degrade recalcitrant organic compounds, aiming to convert the contaminant to carbon dioxide and water or to some oxidized inorganic anions or to more easily degradable molecules by biological means [12]. AOPs are processes based on the production of hydroxyl radicals (HRs). These can be electrochemical, photochemical, ultrasound, ozone, or a combination of them. Most works studying the degradation of metformin focus on photocatalysis using a wide variety of catalysts, such as TiO2/Bi2WO6 (90% degradation: visiblelight) [11], Fe3+/TiO2 (93.8% degradation: UV light) [13], and TiO2-CuO/beach sand granules (74.8% degradation: UVC light) [14], with minimal works based on Fenton-type processes.
Fenton is a type of AOP that comes in a variety of forms, such as homogeneous and heterogeneous Fenton, photo-Fenton, electro-Fenton, photo-electro-Fenton, and other hybrid Fenton processes [15]. H. J. Fenton first identified the Fenton reaction in 1894 [16] and described it as the increased oxidizing power of hydrogen peroxide when iron (Fe) is used as a reaction catalyst and at acidic pH. Fenton processes involve different reactions, (1)–(6) [12].
F e 2 + + H 2 O 2 → F e 3 + + H O • + O H −
H O • + H 2 O 2 → H O 2 • + H 2 O
F e 2 + + H O • → F e 3 + + O H −
F e 3 + + H O 2 • → F e 2 + + O 2 + H +
H O • + H O • → H 2 O 2
O r g a n i c   p o l l u t a n t s + H O • → D e g r a d e d   p r o d u c t s
Nevertheless, the advance of Reaction (1) implies that the Fenton reaction halts once all the Fe2+ ions have been used up. This can be overcome by adding light to the system and the process is then called photo-Fenton. In photo-Fenton, ferrous ions are regenerated via Reaction (7)–(13) and this allows the Fenton cycle to be repeated [12]. In addition, hydroxyl radical production and oxidation of organic compounds are enhanced [17].
F e 3 + + h v → F e 2 + + H O • + H +
F e 2 + + H 2 O 2 → F e 3 + + H O • + O H −
F e 3 + + H 2 O 2 → F e − O O H 2 + + H +
F e − O O H 2 + → F e 2 + + H O 2 •
F e 3 + + H 2 O → F e ( H 2 O ) 3 +
F e ( H 2 O ) 3 + → F e ( O H ) 2 + + H +
F e ( O H ) 2 + + h v → F e 2 + + H O •
H 2 O 2 + h v → 2 H O •
H O • + o r g a n i c   p o l l u t a n t s → o x i d i z e d   p r o d u c t s
Homogeneous Fenton is usually preferred due to its high efficiency; however, it poses some drawbacks, i.e., an acid must be added to avoid catalyst precipitation and catalyst cannot be reused. These challenges can be overcome with the use of heterogeneous catalysts, such as the one assessed here, iron-pillared clays (Fe-PILC).
Regarding iron, the photocatalytic activity of Fe3O4 has been demonstrated in the literature, showing advantages such as being magnetic and stable [18,19]. Ferric oxide, Fe2O3, is another iron-based compound with proven photocatalytic properties under visible light [20]. These works have also demonstrated the importance of the support material. Ideally, the support should provide a large area for metal deposition, since the first step in the heterogeneous Fenton involves the sorption of hydrogen peroxide onto an active site, Fe2+ or Fe3+ [21].
According to [22], the use of clays offers economic advantages due to their low-cost, as well as environmental benefits, given their inherent safety and compatibility with ecological systems. Pillared clays have opened a wide range of applications in the environmental field, since the introduction of various polyoxocations between their layers leads to the formation of firmly anchored oxides. This modification results in materials with a high surface area, porous structure, good thermal stability, and high acidity [23]. Iron-pillared clays (Fe-PILC) can be obtained from smectites (bentonite) via ion exchange of the metal polyoxycation (Fe), followed by heat treatment. In addition to the previously mentioned advantages, Fe-PILCs exhibit high catalytic activity over a wide pH range (3–7) [24]. Previous studies have confirmed the presence of iron oxides, specifically ferrous oxide (Fe2+) and ferrous ferric oxide (Fe3O4), in Fe-PILCs [25]. The presence of iron species in these catalysts facilitates the generation of hydroxyl radicals (•OH), which allows the degradation of organic contaminants and recalcitrant compounds. Additionally, they exhibit high stability over multiple reaction cycles and negligible metal leaching [23], suggesting that their reuse is highly feasible. Previous studies have reported [25,26] iron leaching in pillared clays in the range of 2% and 3%. Ding et al. (2012) [27] observed that solution pH influences iron leaching in heterogeneous photo-Fenton catalysts.
This study aims to evaluate the feasibility of using Fe-PILC for the degradation and mineralization of metformin (MET) at environmental relevant concentrations, under both UV and visible light irradiation, employing photocatalysis and photo-Fenton processes. To contextualize the results, additional experiments were performed to assess MET degradation by photolysis and hydrogen peroxide (HP) photodecomposition. This work also presents the contribution of different reactive oxygen species in each of the assessed processes and the kinetic constants for each process. It will be demonstrated that the synthesized catalyst enables us to obtain competitive results under visible light via the photo-Fenton process.

2. Materials and Methods

Ferric chloride hexahydrate 99.7%, sodium hydroxide 98.5%, hydrochloric acid 37.2%, acetonitrile HPLC 99.98%, and sulfuric acid 96.6% were from Fermont; clay (Bentonite) was from Fisher; N,N-dimethylimidodi-carbonimidic diamide hydrochloride 97% and Dicyandiamide (cyanoguanidine) 99% were purchased from Aldrich; formic acid 99%, oxalic acid 99%, and acetic acid 99.0%, were purchased from Merck; and potassium phosphate monobasic was purchased from J. T. Baker 99.0%. Deionized water was used to prepare the catalyst and for all experiments.

2.1. Catalyst Synthesis

Under constant stirring, a pillaring solution was prepared by mixing a 0.2 M solution of sodium hydroxide with a 0.2 M aqueous solution of ferric chloride. This solution was then stirred for a further 4 h while a 5 M solution of hydrochloric acid was used to adjust the pH to 1.8 ± 0.02. This pillaring solution is then dropwise added to a bentonite suspension (0.1 percent w/w). The resulting solution was aged at room temperature for a further 18 h while being stirred. The solid was then obtained by filtering, washed with deionized water to remove chloride ions until conductivity reached 5 S/cm, dried for an overnight period at 75 °C, and then calcined for two hours at 400 °C.

2.2. Catalyst Characterization

Diffuse reflectance spectroscopy, X-ray diffraction (XRD), X-ray photoelectron spectroscopy (XPS), atomic absorption spectroscopy (AAS), and nitrogen physisorption were used to characterize the synthesized Fe-PILC.
The band-gap energy of Fe-PILC was determined using a Tauc plot, constructed from the absorbance spectrum obtained with a UV-Vis spectrophotometer Lambda 365 (Shelton, CT, USA) equipped with a diffuse reflectance and integrating sphere. To validate the band-gap energy estimated from the Tauc plot, the second derivative of the absorbance spectrum was calculated using the finite difference method. This approach allows for a more accurate identification of the point of maximum curvature, which corresponds to the band-gap energy. It is particularly useful for amorphous materials or those with diffuse absorption edges, as it minimizes the subjectivity involved in selecting the linear region for extrapolation in Tauc plots [28].
Cu Kα radiation was used at 30 kV and 25 mA in a Bruker Advance 8 apparatus to produce the XRD pattern. Data were collected over a 2θ range of 3–40°, with a step size of 0.02°/min and a scan speed of 0.3 s/step.
A JPS 9200 spectrophotometer made by JEOL in Tokyo, Japan, with a Mg-K excitation source (1253.6 eV) was used to conduct an X-ray photo-electronic spectroscopy (XPS) analysis to establish the oxidation states of iron species.
The iron content (wt. %) was quantified with AAS using a AA240FS spectrometer made by Varian in Palo Alto, CA, USA. Prior to analysis, the Fe-PILC sample was digested in hydrofluoric acid and diluted appropriately to fall within the instrument’s measurement range.
Textural properties, including specific surface area and pore volume, were determined via nitrogen adsorption–desorption isotherms using a Quadrasorb SI pore size and surface area analyzer. Before measurement, the pillared clay sample was degassed at 180 °C under high vacuum (1013 mbar).

2.3. Metformin (MET) Degradation

Photochemical processes—photolysis (P), hydrogen peroxide photodecomposition (PHP), photocatalysis (PC), and photo-Fenton (PF)—under UV and visible light irradiation were all conducted in a cylindrical Pyrex glass reactor (2.8 cm in diameter and 23 cm in height) containing 0.1 L of an aqueous solution of metformin at an environmentally relevant concentration (C0 = 13,000 ng L−1). This concentration resembles the level previously reported in the Madin Reservoir (11,694 ng/L). The reactor was equipped with a cooling jacket to maintain a constant temperature throughout the experiments.
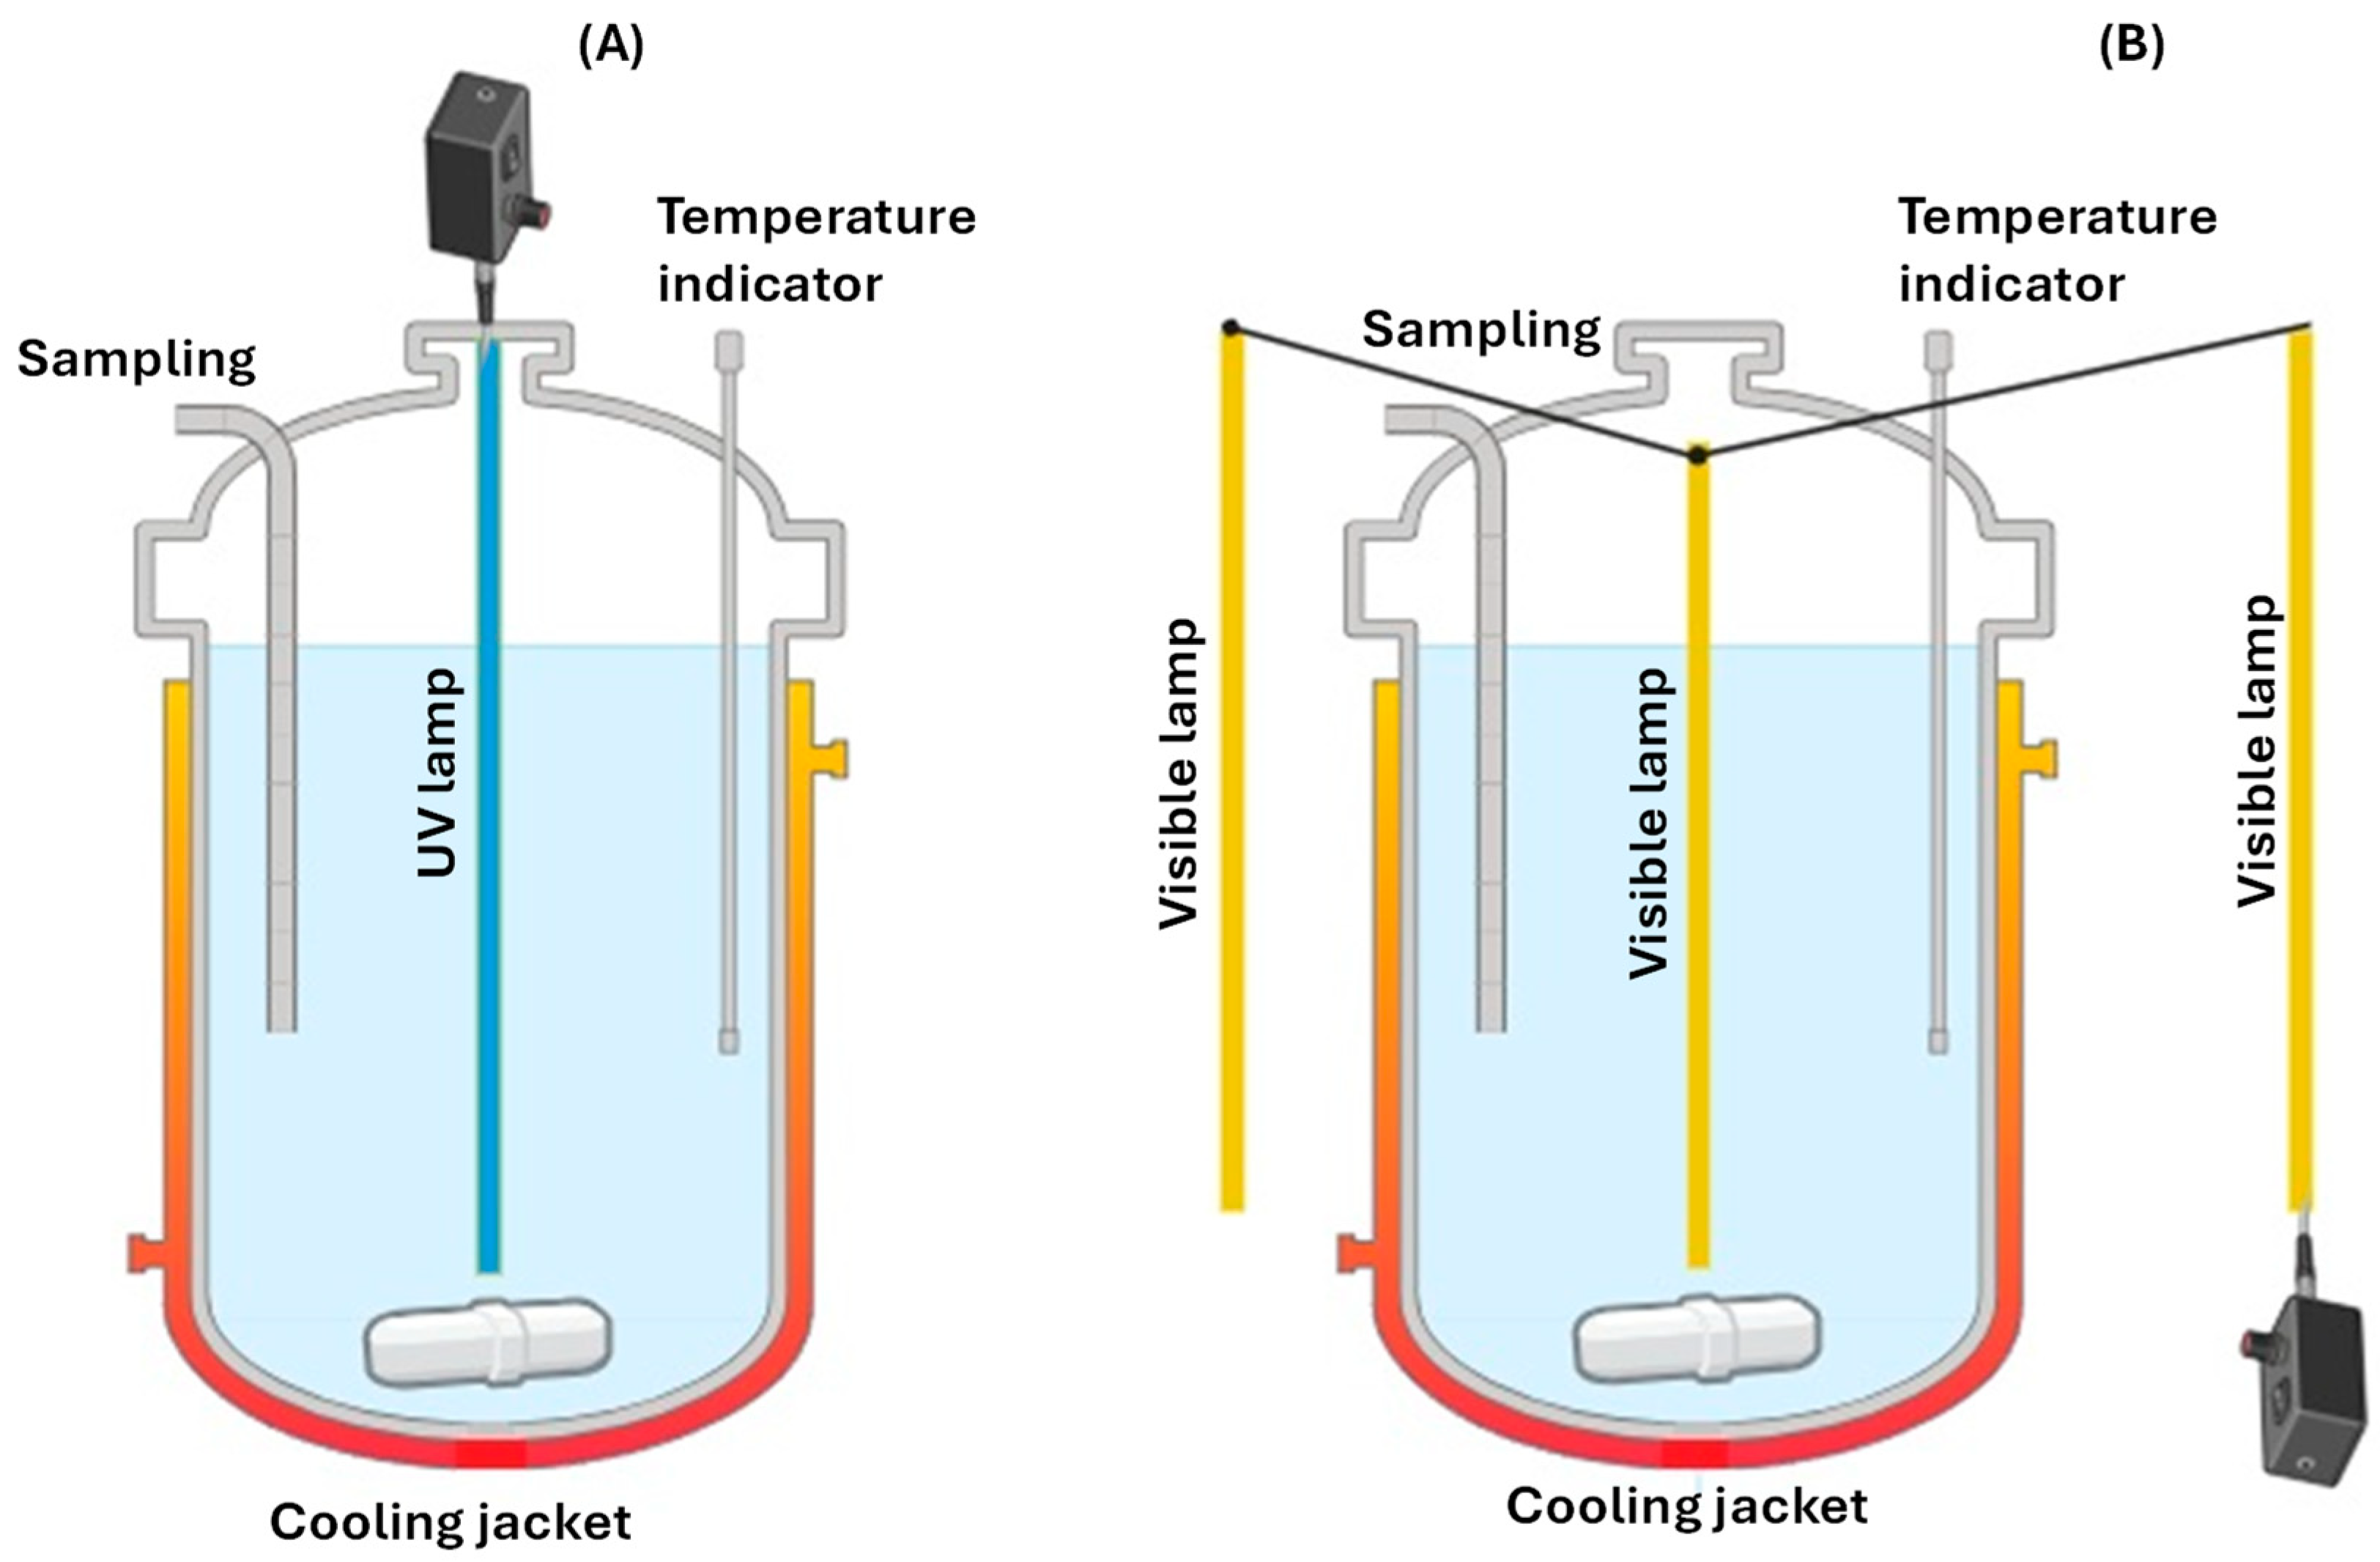
Control experiments included metformin degradation via adsorption onto Fe-PILC and via the addition of hydrogen peroxide (H2O2) alone. For UV-driven experiments, an 8 W high-pressure mercury lamp (UVP-Pen Ray Model 3SC-9.00-AO-16S), emitting predominantly at 254 nm with a relative radiation intensity of 4400 μW/cm2, was placed at the center of the reactor (see Figure 2A). For experiments under visible light, λ > 400 nm (Vis light), three lamps (14 W, 100 W/m2 each) were positioned around the reactor (see Figure 2B). These conditions were selected based on prior optimization reported by Martin del Campo 2014 [29] and Hurtado 2019 [25].
A typical experiment involved the addition of the MET solution to the reactor, followed by the dispersion of 50 mg of the catalyst (Fe-PILC), the onset of illumination, and the subsequent addition of a stoichiometric amount of H2O2 to the system to trigger the photo-Fenton process. The reaction time was fixed at 90 min.
In all experiments, the temperature was kept at 298 K and the solution was continuously stirred at 800 rpm. The pH was recorded but was not adjusted at any time. The experiments were performed in triplicate, and the corresponding error bars have been included in the results.

2.4. Chemical Analysis

To establish the degradation of MET and by-products, as well as the percentage of mineralization reached, samples were periodically taken. For this purpose, total organic carbon (TOC) and High-Performance Liquid Chromatography (HPLC) analyses were conducted.
A UV-Vis and PDA detector-equipped Ultra-High-Performance Liquid Chromatograph (Vanquish, Thermo Scientific, Waltham, MA, USA) was used to measure the concentration of metformin (MET). Chromatography was carried out in a Discovery C18 (Supelco, Bellefonte, PA, USA) column (150 mm × 4.6 mm and 5 m), and data analysis was conducted with Chromeleon 7 software. Samples were analyzed under the conditions summarized in Table 1 and Table 2.
The mobile phase was 5:95 v/v solution of acetonitrile and acidified water (pH 3.0). This was prepared and degasified immediately before analysis. To prepare the acidified water (pH 3.0), orthophosphoric acid (H3PO4 10%) was dissolved in 1000 mL of deionized water. For the analysis of carboxylic acids, a sulfuric acid solution (3 mM) was used instead.
Metformin stock standard solution (13 mg L−1) was prepared by combining 1.3 mg of metformin hydrochloride and 1.3 mg of Dicyandiamide (cyanoguanidine) with 100 mL of deionized water. A standard solution with a known concentration of 13,000 ng L−1 MET and cyanoguanidine was produced by diluting 1 mL of stock standard solution with 100 mL of deionized water.
The concentration of 13,000 ng/L was selected based on a previous study conducted with real water from the Madín Dam, which reported metformin (MET) concentrations ranging from 378 to 11,694 ng/L [8]. In that study, concentrations were determined using Ultra-High-Performance Liquid Chromatography coupled with Mass Spectrometry (UHPLC-MS/MS). However, in the present work, only UHPLC was used as the analytical method, so it was necessary to work with higher concentrations—in this case, 13,000 ng/L—close to the upper limit reported by Pérez-Coyotl et al. (2019) [8] to ensure the quantification of pharmaceutical products such as metformin.
A standard stock of carboxylic acids was prepared with a concentration of 0.001 M of oxalic acid, formic acid, and acetic acid to produce a known-concentration solution. This was then diluted to generate the calibration curve for carboxylic acid quantification.
Hydrogen peroxide (H2O2) was quantified by a colorimetric method [30,31,32], using 3 mL of titanium sulfate (Ti4+) reagent and 7 mL of sample, a colorimetric approach was used to measure the hydrogen peroxide H2O2 concentration profile. Using a VELAB UV/Vis spectrophotometer, the absorbance of the samples was measured and correlated to H2O2 concentration. Within a quartz cell with a 1 cm optical path, the samples were scanned. A maximum absorbance at 410 nm was noted after the absorbance of the samples was examined from 200 to 900 nm. The technique uses the titanium sulfate (Ti4+) reagent to treat hydrogen peroxide solutions and then measures the color intensities by measuring the absorbance. The reaction’s yellow hue is a result of Reaction (16), which produces pertitanic acid [30,32].
T i 4 + + H 2 O 2 + 2 H 2 O → T i O 2 · H 2 O 2 p e r t i t a n i c   a c i d + 4 H +
Total organic carbon (TOC), which was measured with a Shimadzu TOC-VCSH instrument, was used to directly determine the degree of metformin mineralization after 90 min of treatment.

3. Results

3.1. Catalyst Characterization

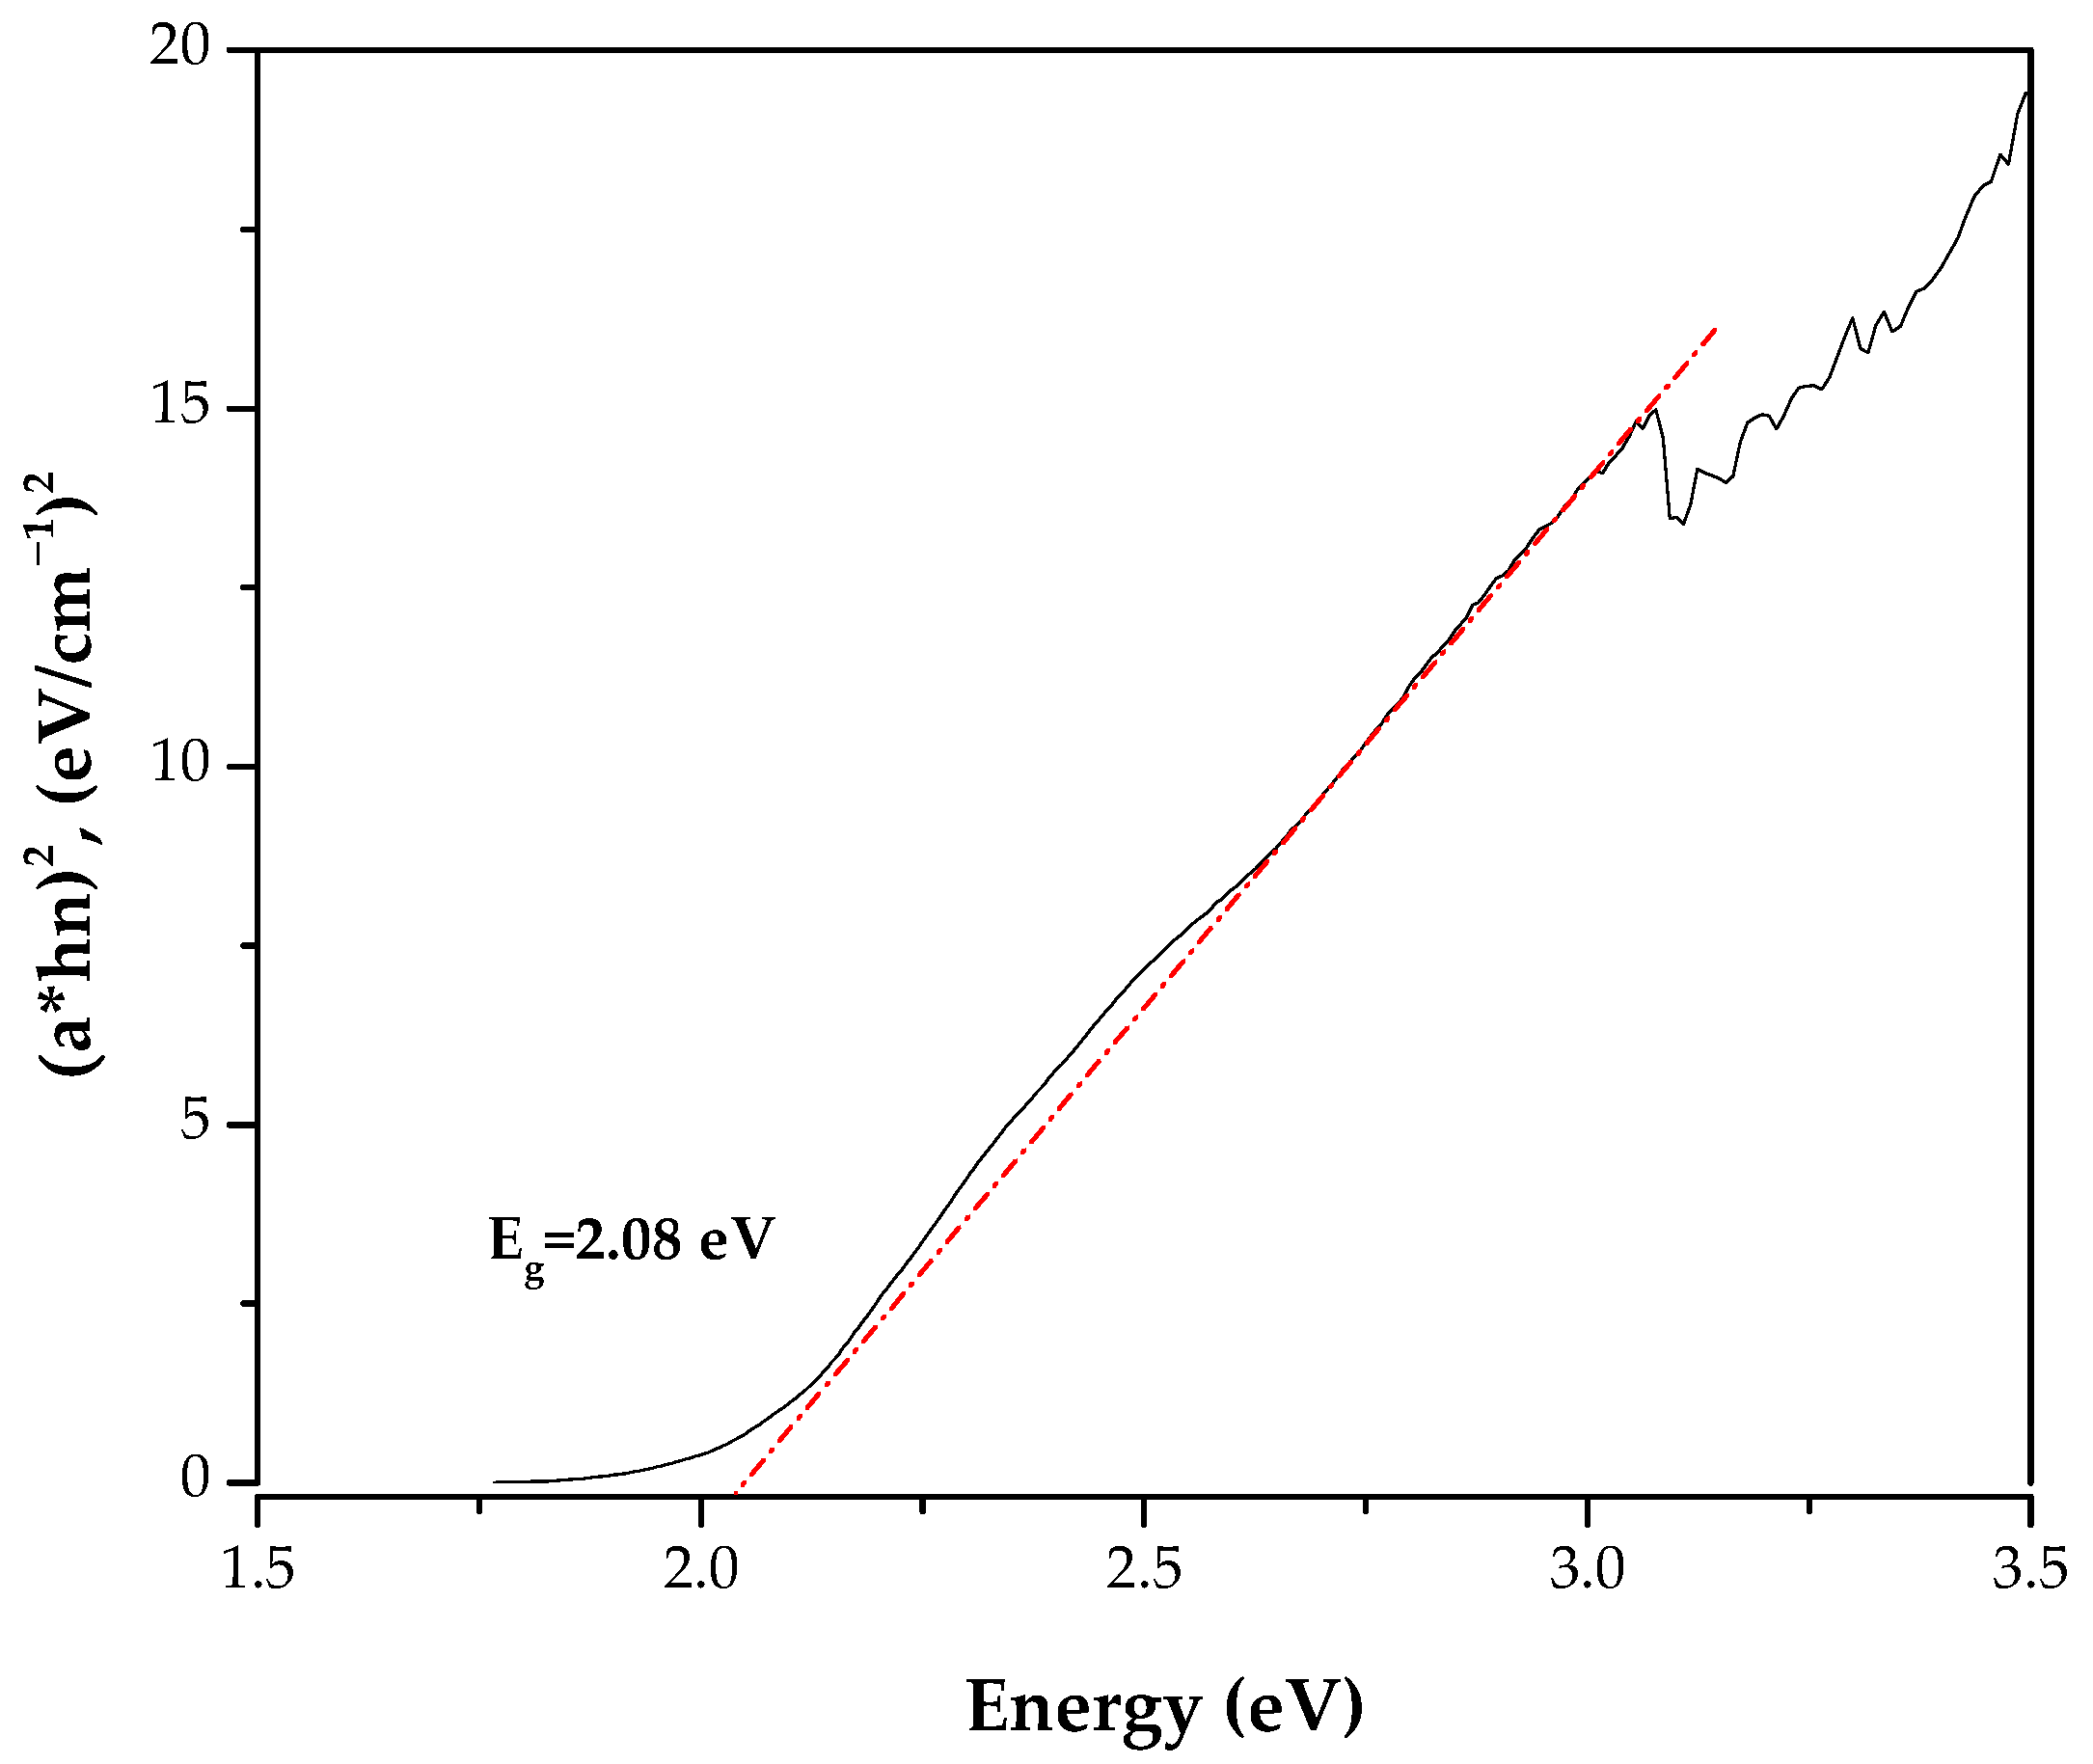
Figure 3 presents the Tauc plot derived from the absorbance spectrum obtained via UV-Vis spectroscopy. It can be observed that the resulting band-gap energy was 2.08 eV. Using the second derivative approach (Figure S1, Supplementary Material), the band-gap energy was estimated at 2.2 eV. Both values fall within the range reported for magnetite, typically between 2.0 and 2.2 eV [33].
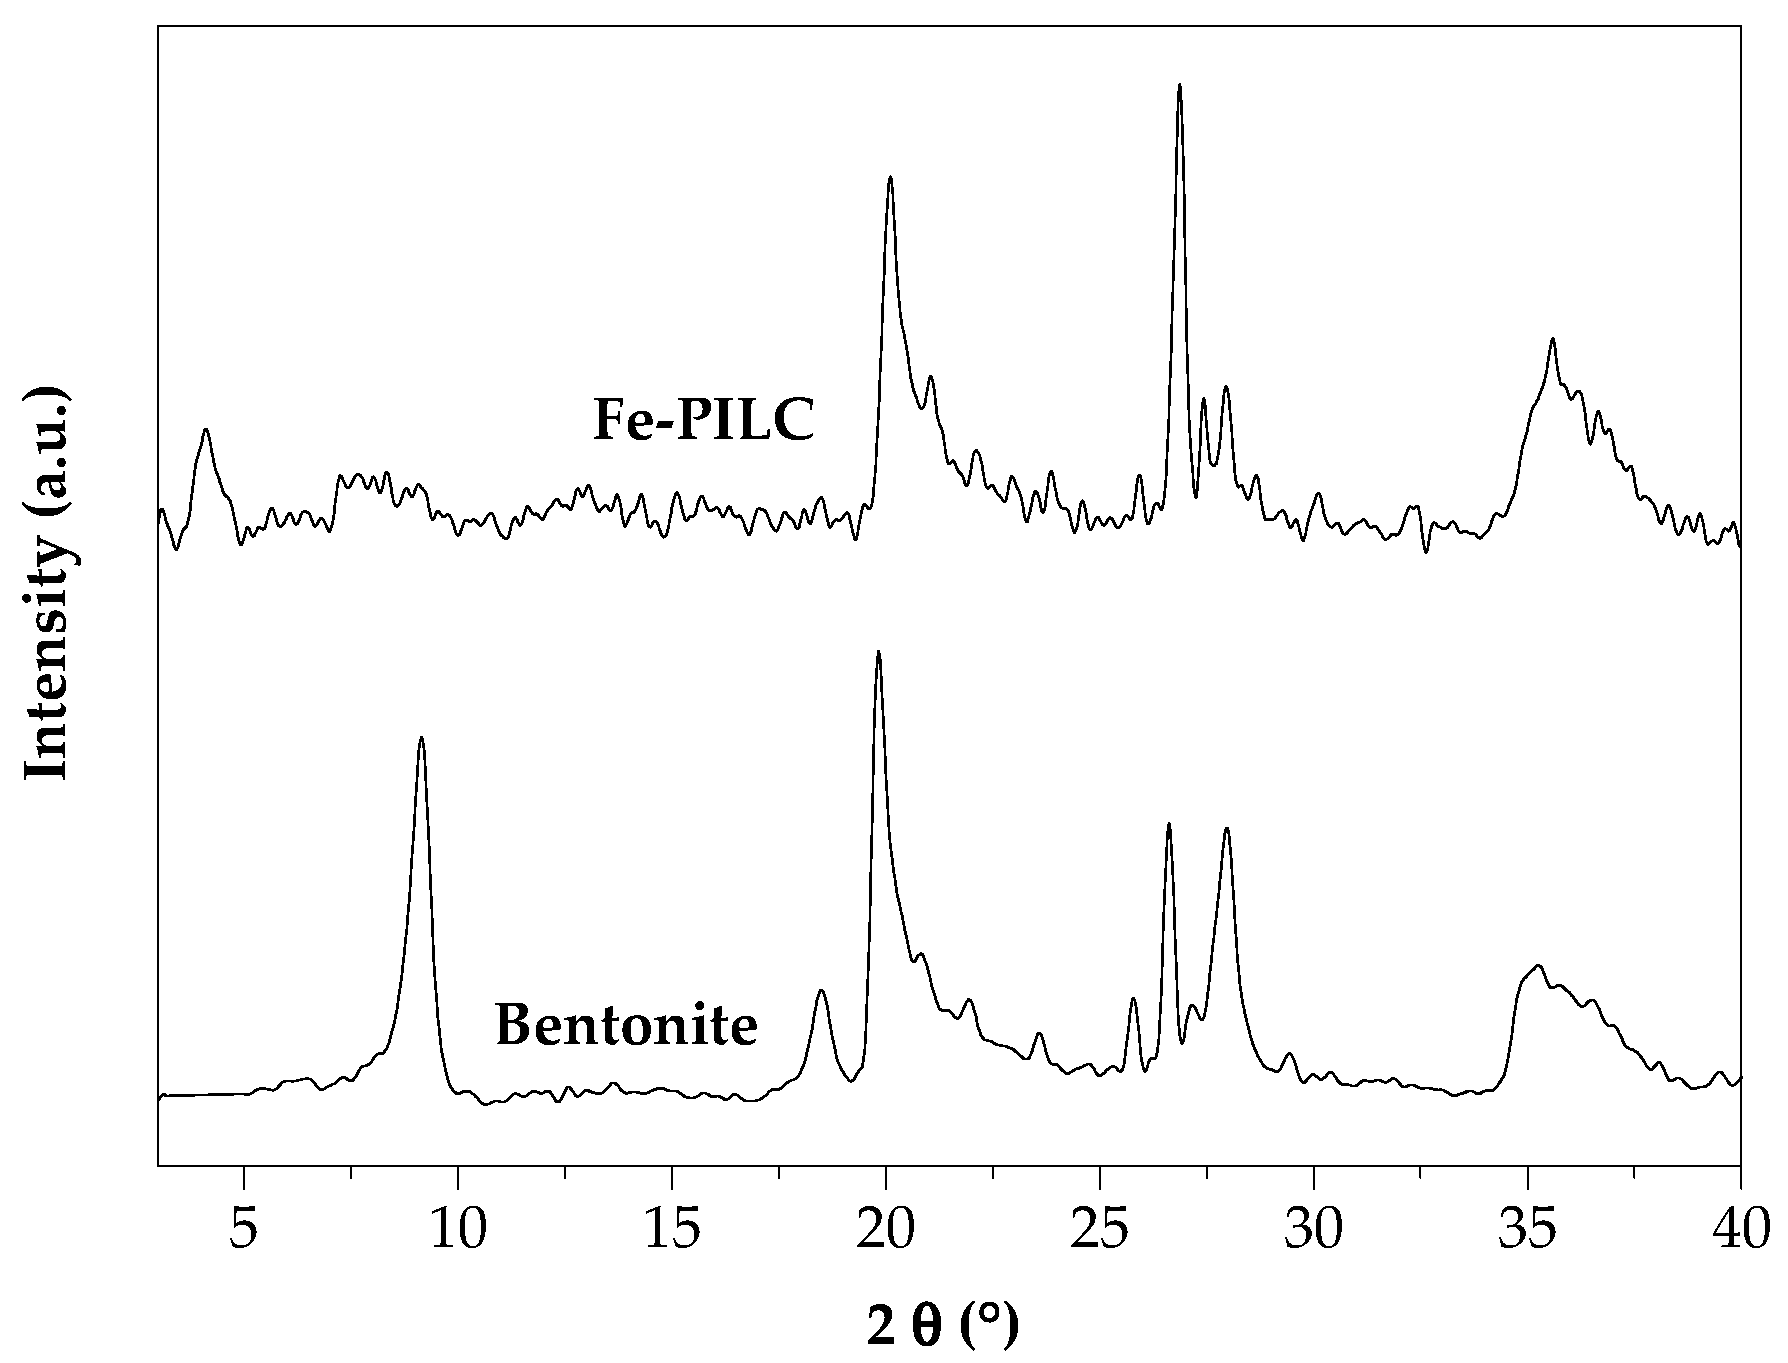
X-ray diffraction (XRD) patterns of bentonite (raw clay) and Fe-PILC are shown in Figure 4. The XRD pattern of Fe-PILC displays two main peaks located approximately at 4° and 9° in 2θ. The first peak, around 4°, confirms that the pillarization process was successfully carried out [34]. This peak corresponds to a basal spacing of 21.4 Å, resulting from the insertion of iron (Fe) polycations between the clay layers, forming the Fe-PILC structure. This spacing includes both the thickness of a single clay layer (9.6 Å) and the additional interlayer distance generated by the pillars.
The second peak, observed between ~7–9° in 2θ, corresponds to the characteristic basal reflection of natural bentonite at 9° in 2θ. After pillarization, this signal decreases in intensity, consistent with structural modification of the basal (001) plane. Additionally, bentonite exhibits characteristic peaks at 20° and 27° in 2θ according with the Joint Committee on Powder Diffraction Standards (JCPDS No. 01-088-0891) [35], which are attributed to the presence of quartz, a mineral phase commonly associated with bentonite.
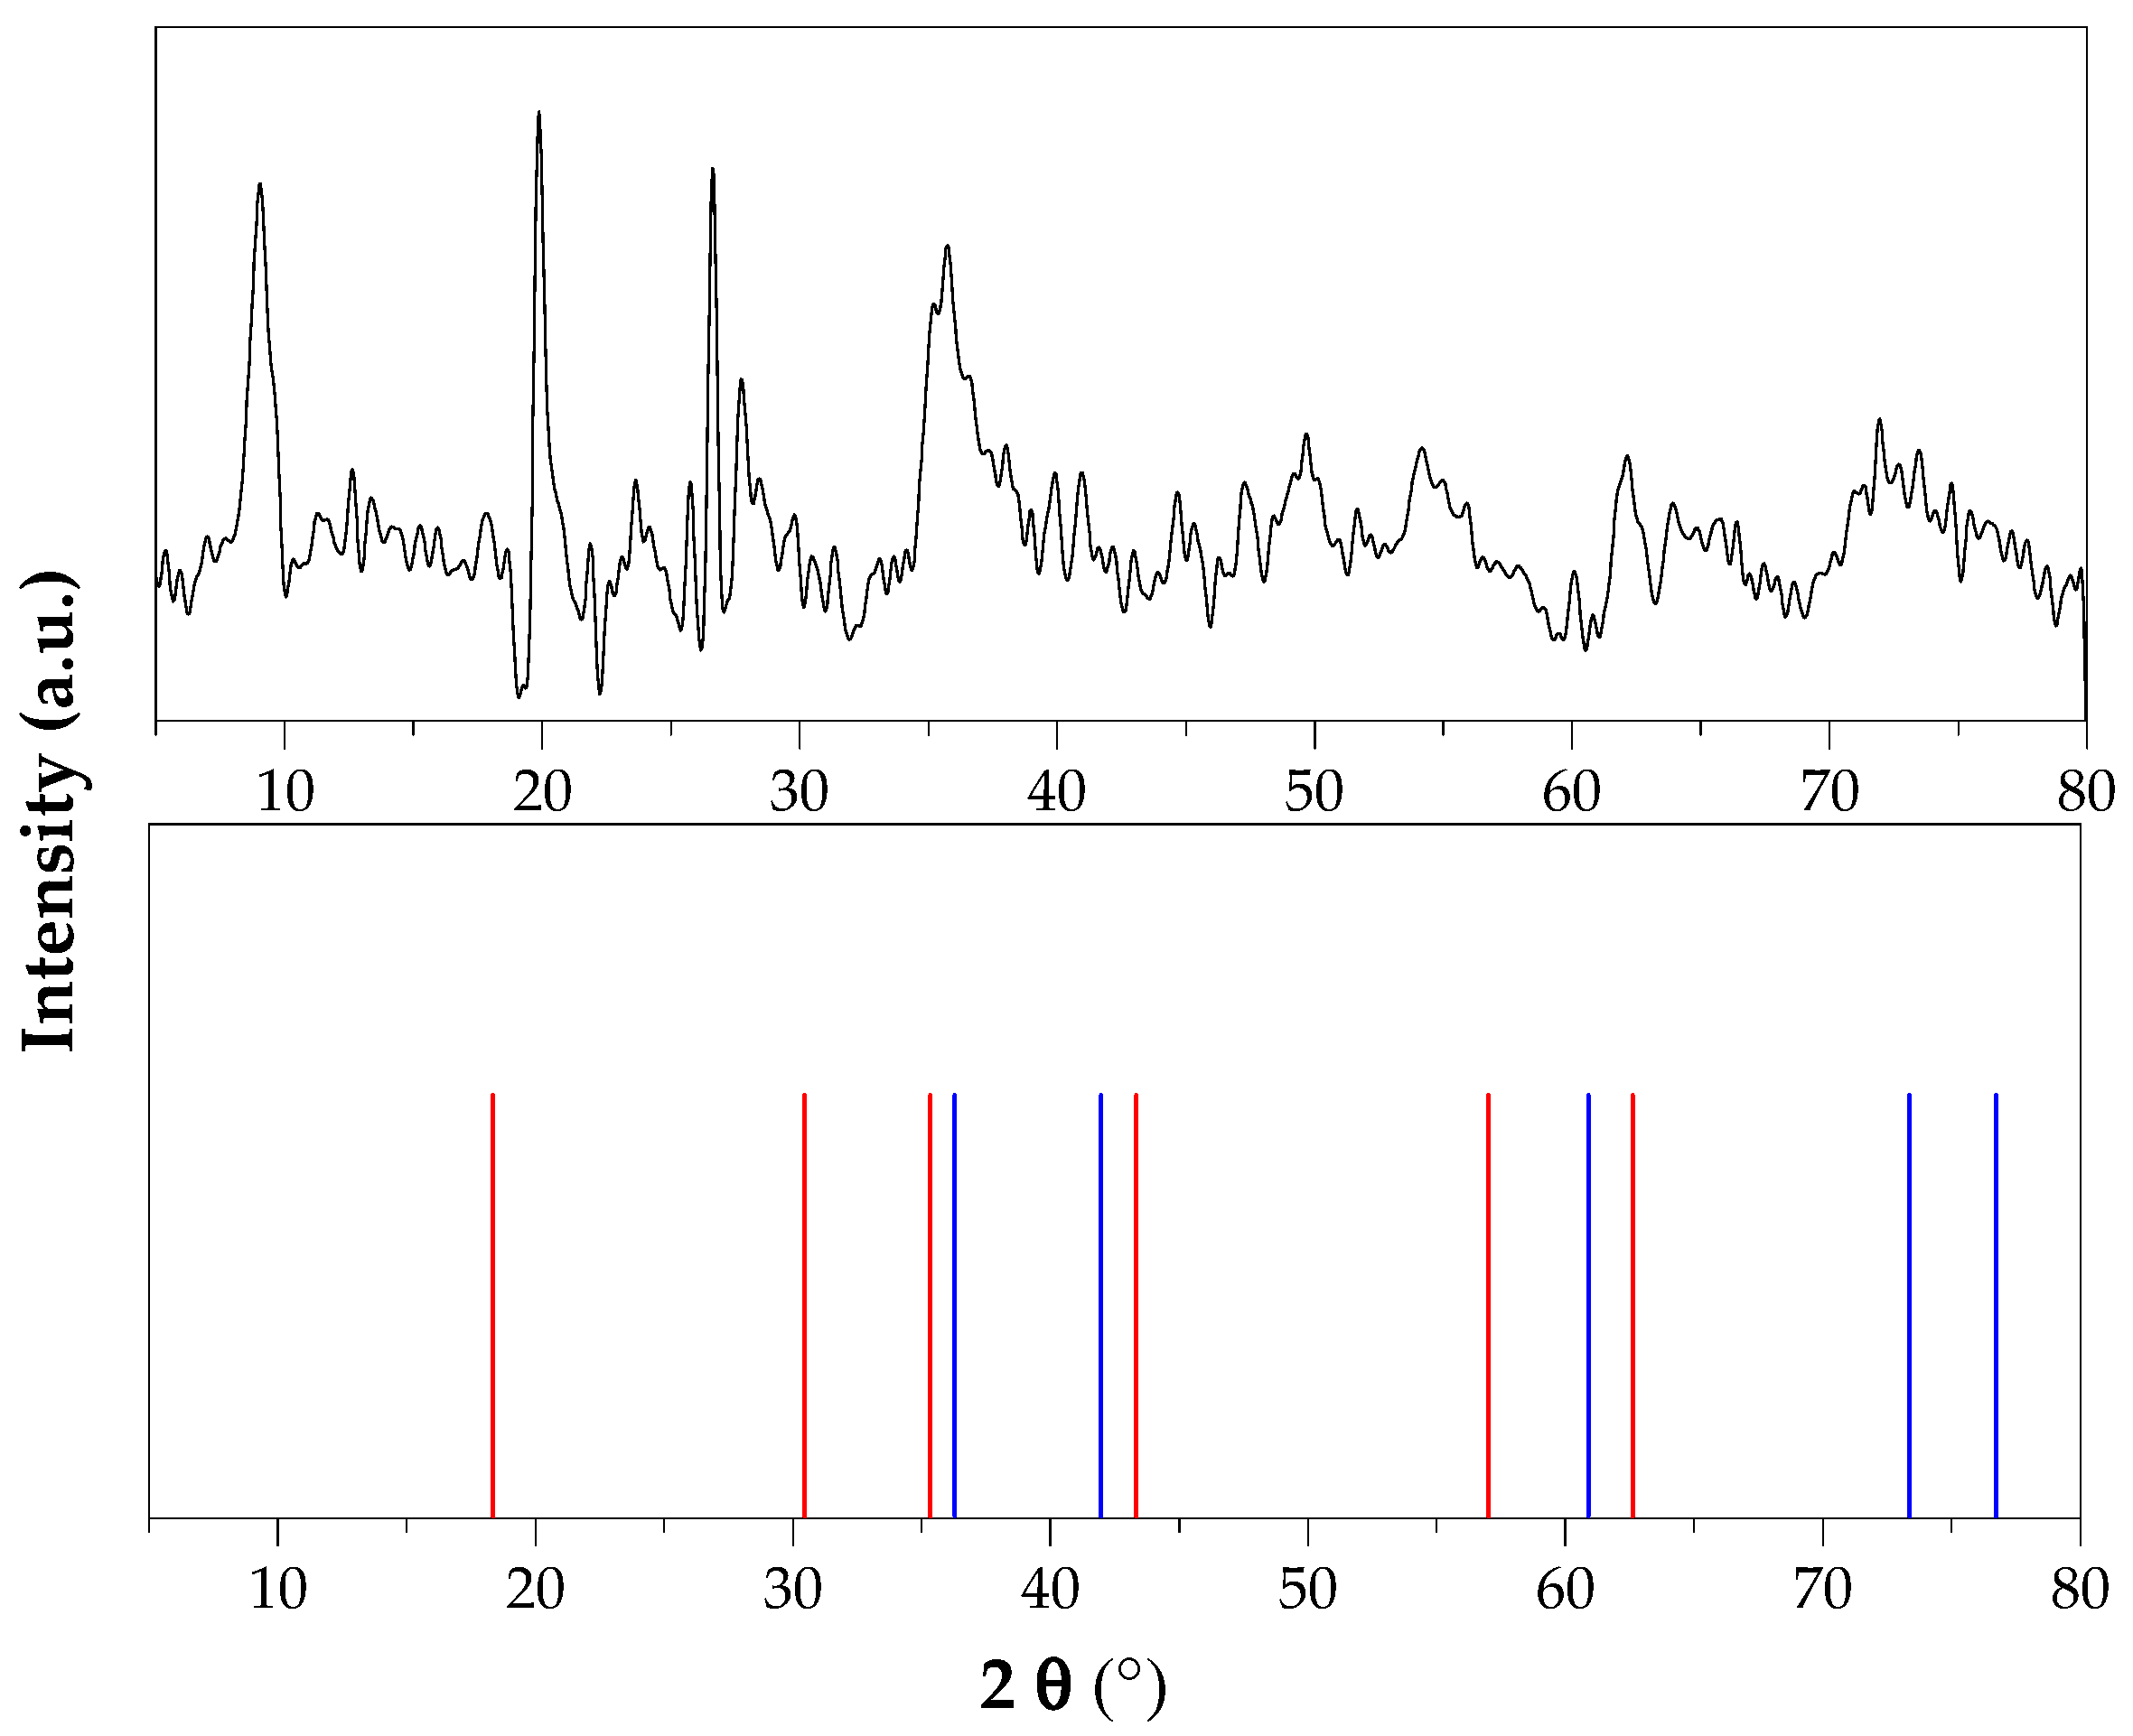
X-ray diffraction analysis of Fe-PILC was performed over a 2θ range of 3° to 80° (Figure 5) to identify the iron species incorporated into the pillared clay. Comparison of the diffraction peaks with standard JCPDS patterns revealed the presence of FeO phases at 36°, 41.5°, 61°, 73.5°, and 76.8° (JCPDS No. 00-003-0968) [36]. Additionally, characteristic peaks of Fe3O4 (magnetite) were identified at 18.5°, 30°, 35.5°, 43°, 57° and 62.5° (JCPDS No. 01-075-1610) [37]. The detection of these phases confirms the successful incorporation of iron polycations into the interlayer space of the clay during the calcination process, leading to the formation of iron oxide pillars (FeO and Fe3O4).
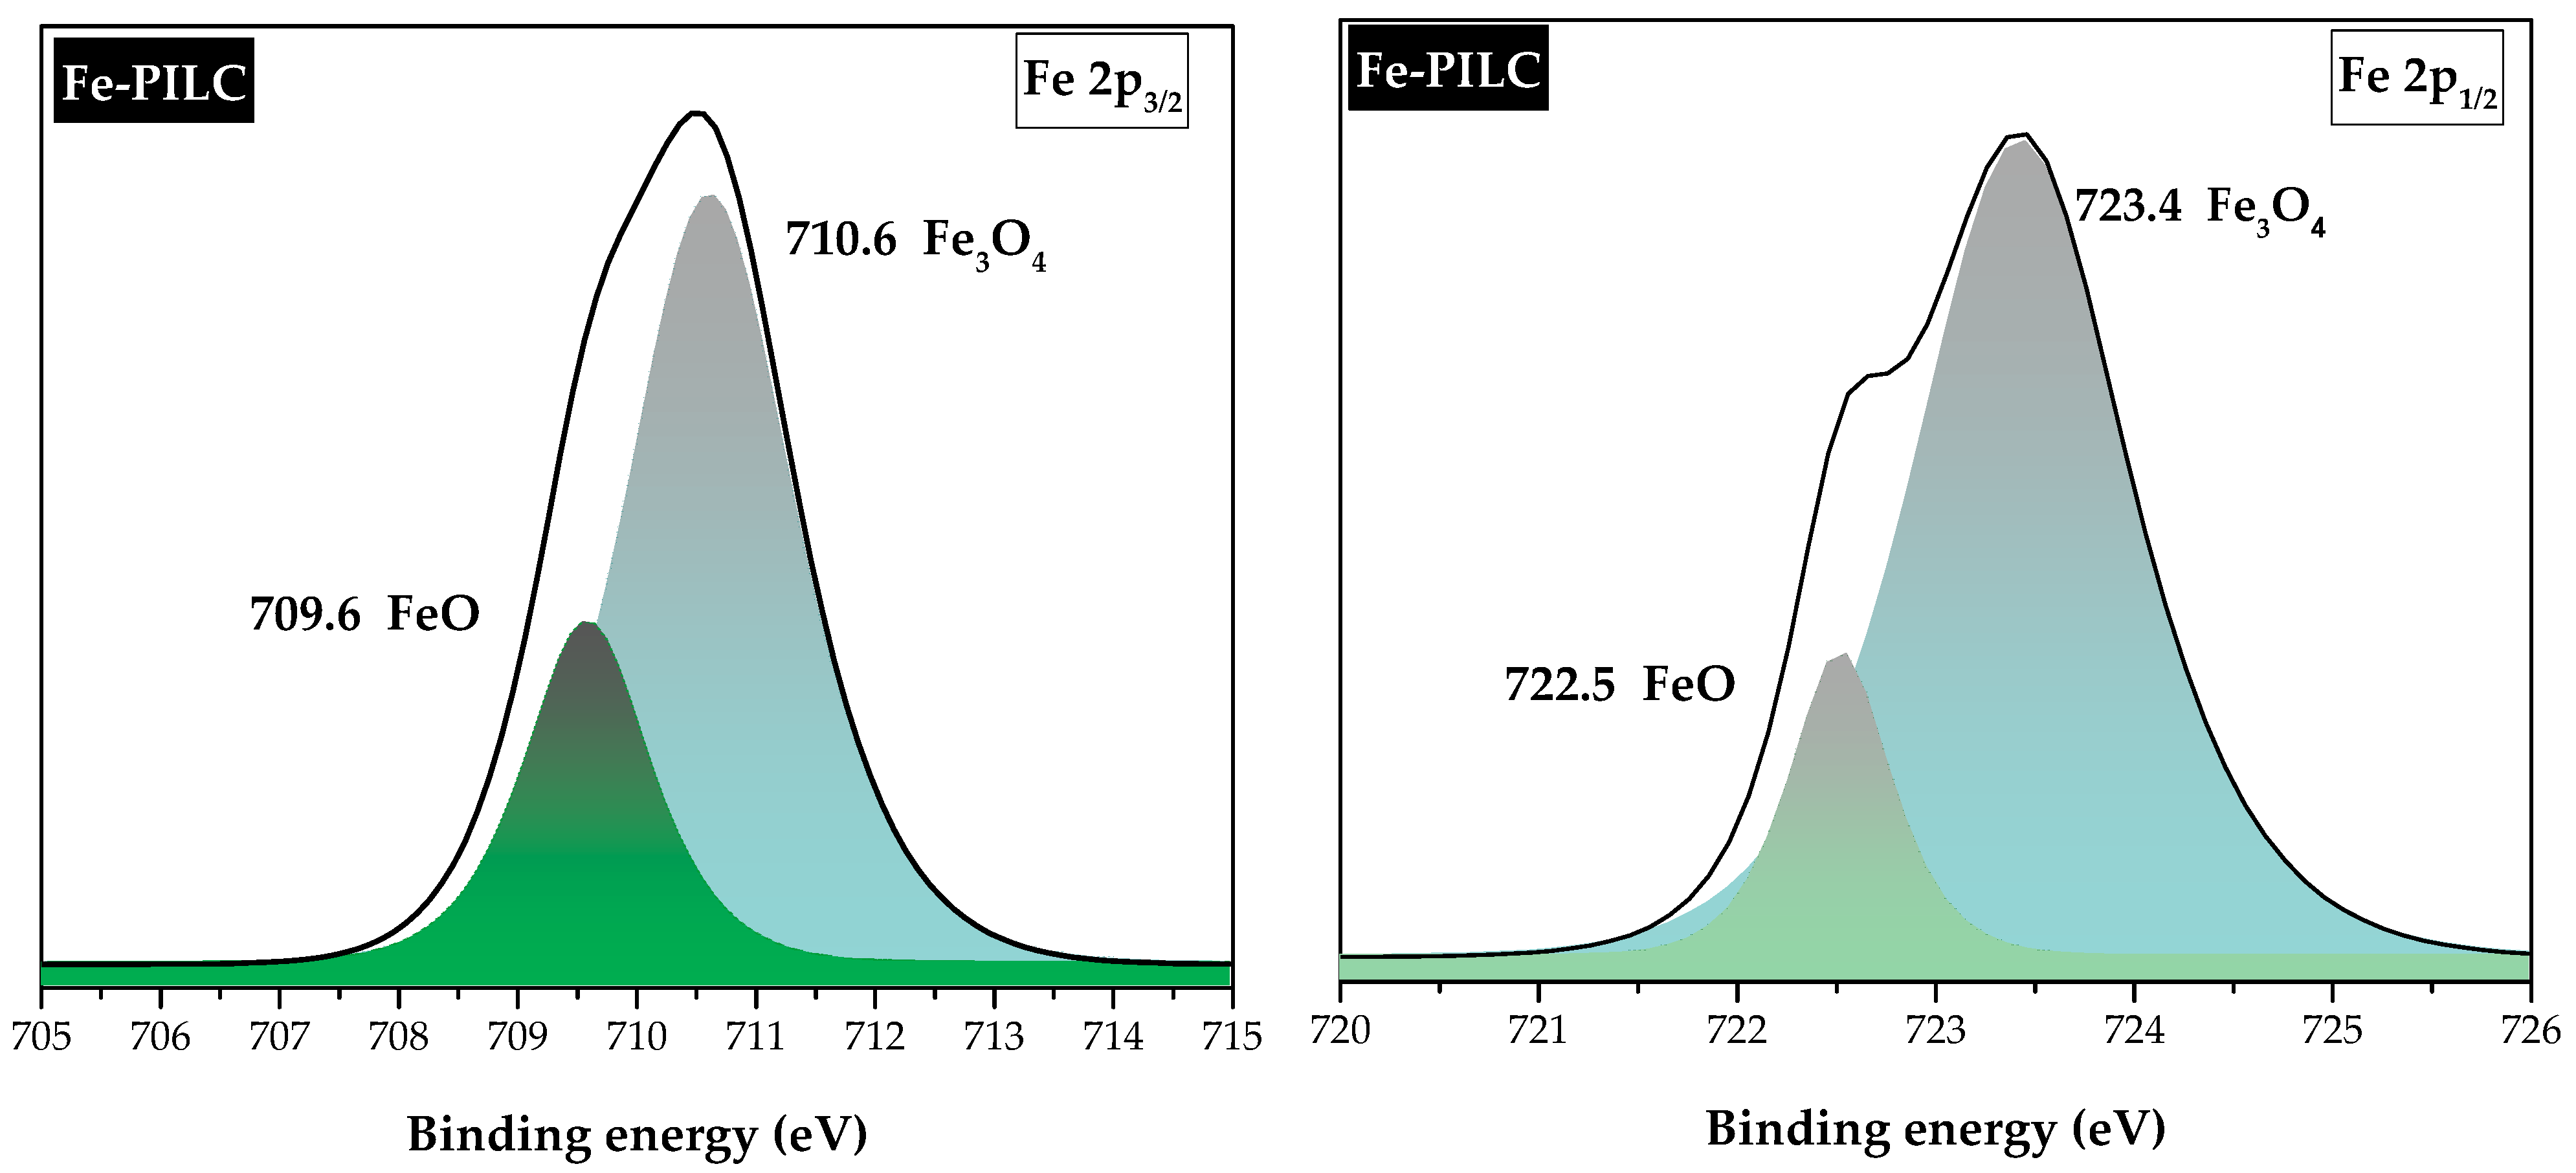
Figure 6 shows the X-ray photoelectron spectroscopy (XPS) results used to identify the oxidation states of iron in Fe-PILC. The doublets observed in the Fe 2p region (2p3/2 and 2p1/2) arise from spin–orbit coupling, which results from the interaction between the electron’s orbital angular momentum (l) and its spin (s = ±0.5) [38]. This interaction produces two sublevels with different total angular momentum values, generating two distinct peaks in the 2p spectrum. The deconvolution of the Fe 2p3/2 and Fe 2p1/2 peaks (Figure 6), based on reference data from the National Institute of Standards and Technology (NIST), indicates the presence of FeO (Fe2+) at 709.6 eV and 722.5 eV, and Fe3O4 or magnetite (Fe2+/Fe3+) at 710.6 eV and 723.4. These findings are consistent with the XRD analysis.
Previous studies [39] have highlighted the relevance of magnetite in photo-Fenton processes due to its chemical stability across a wide pH range and its mixed-valence state (Fe2+/Fe3+), which facilitates the continuous generation of hydroxyl radicals. Moreover, the presence of these crystalline iron phases is further supported by temperature-programmed reduction (TPR) results reported in the literature [29,40], where Fe-pillared clays exhibit a reduction peak in the range of 350–370 °C, corresponding to the Fe3+ to Fe2+ reduction process.
The textural characteristics and iron content of the Fe-PILCs are summarized in Table 3. As can be seen, the pillaring process results in an increase in surface area and pore volume, which is primarily accomplished by the development of micropores [41]. According to some authors [42,43], the development of mesopores results from the aggregation of iron polyoxoanions on the clay mineral surface, whereas the production of micropores is caused by the intercalation of smaller hydrolyzed iron oxides. Analysis by atomic absorption spectroscopy (AAS) indicated that the iron content in the Fe-PILC was 11% w/w.
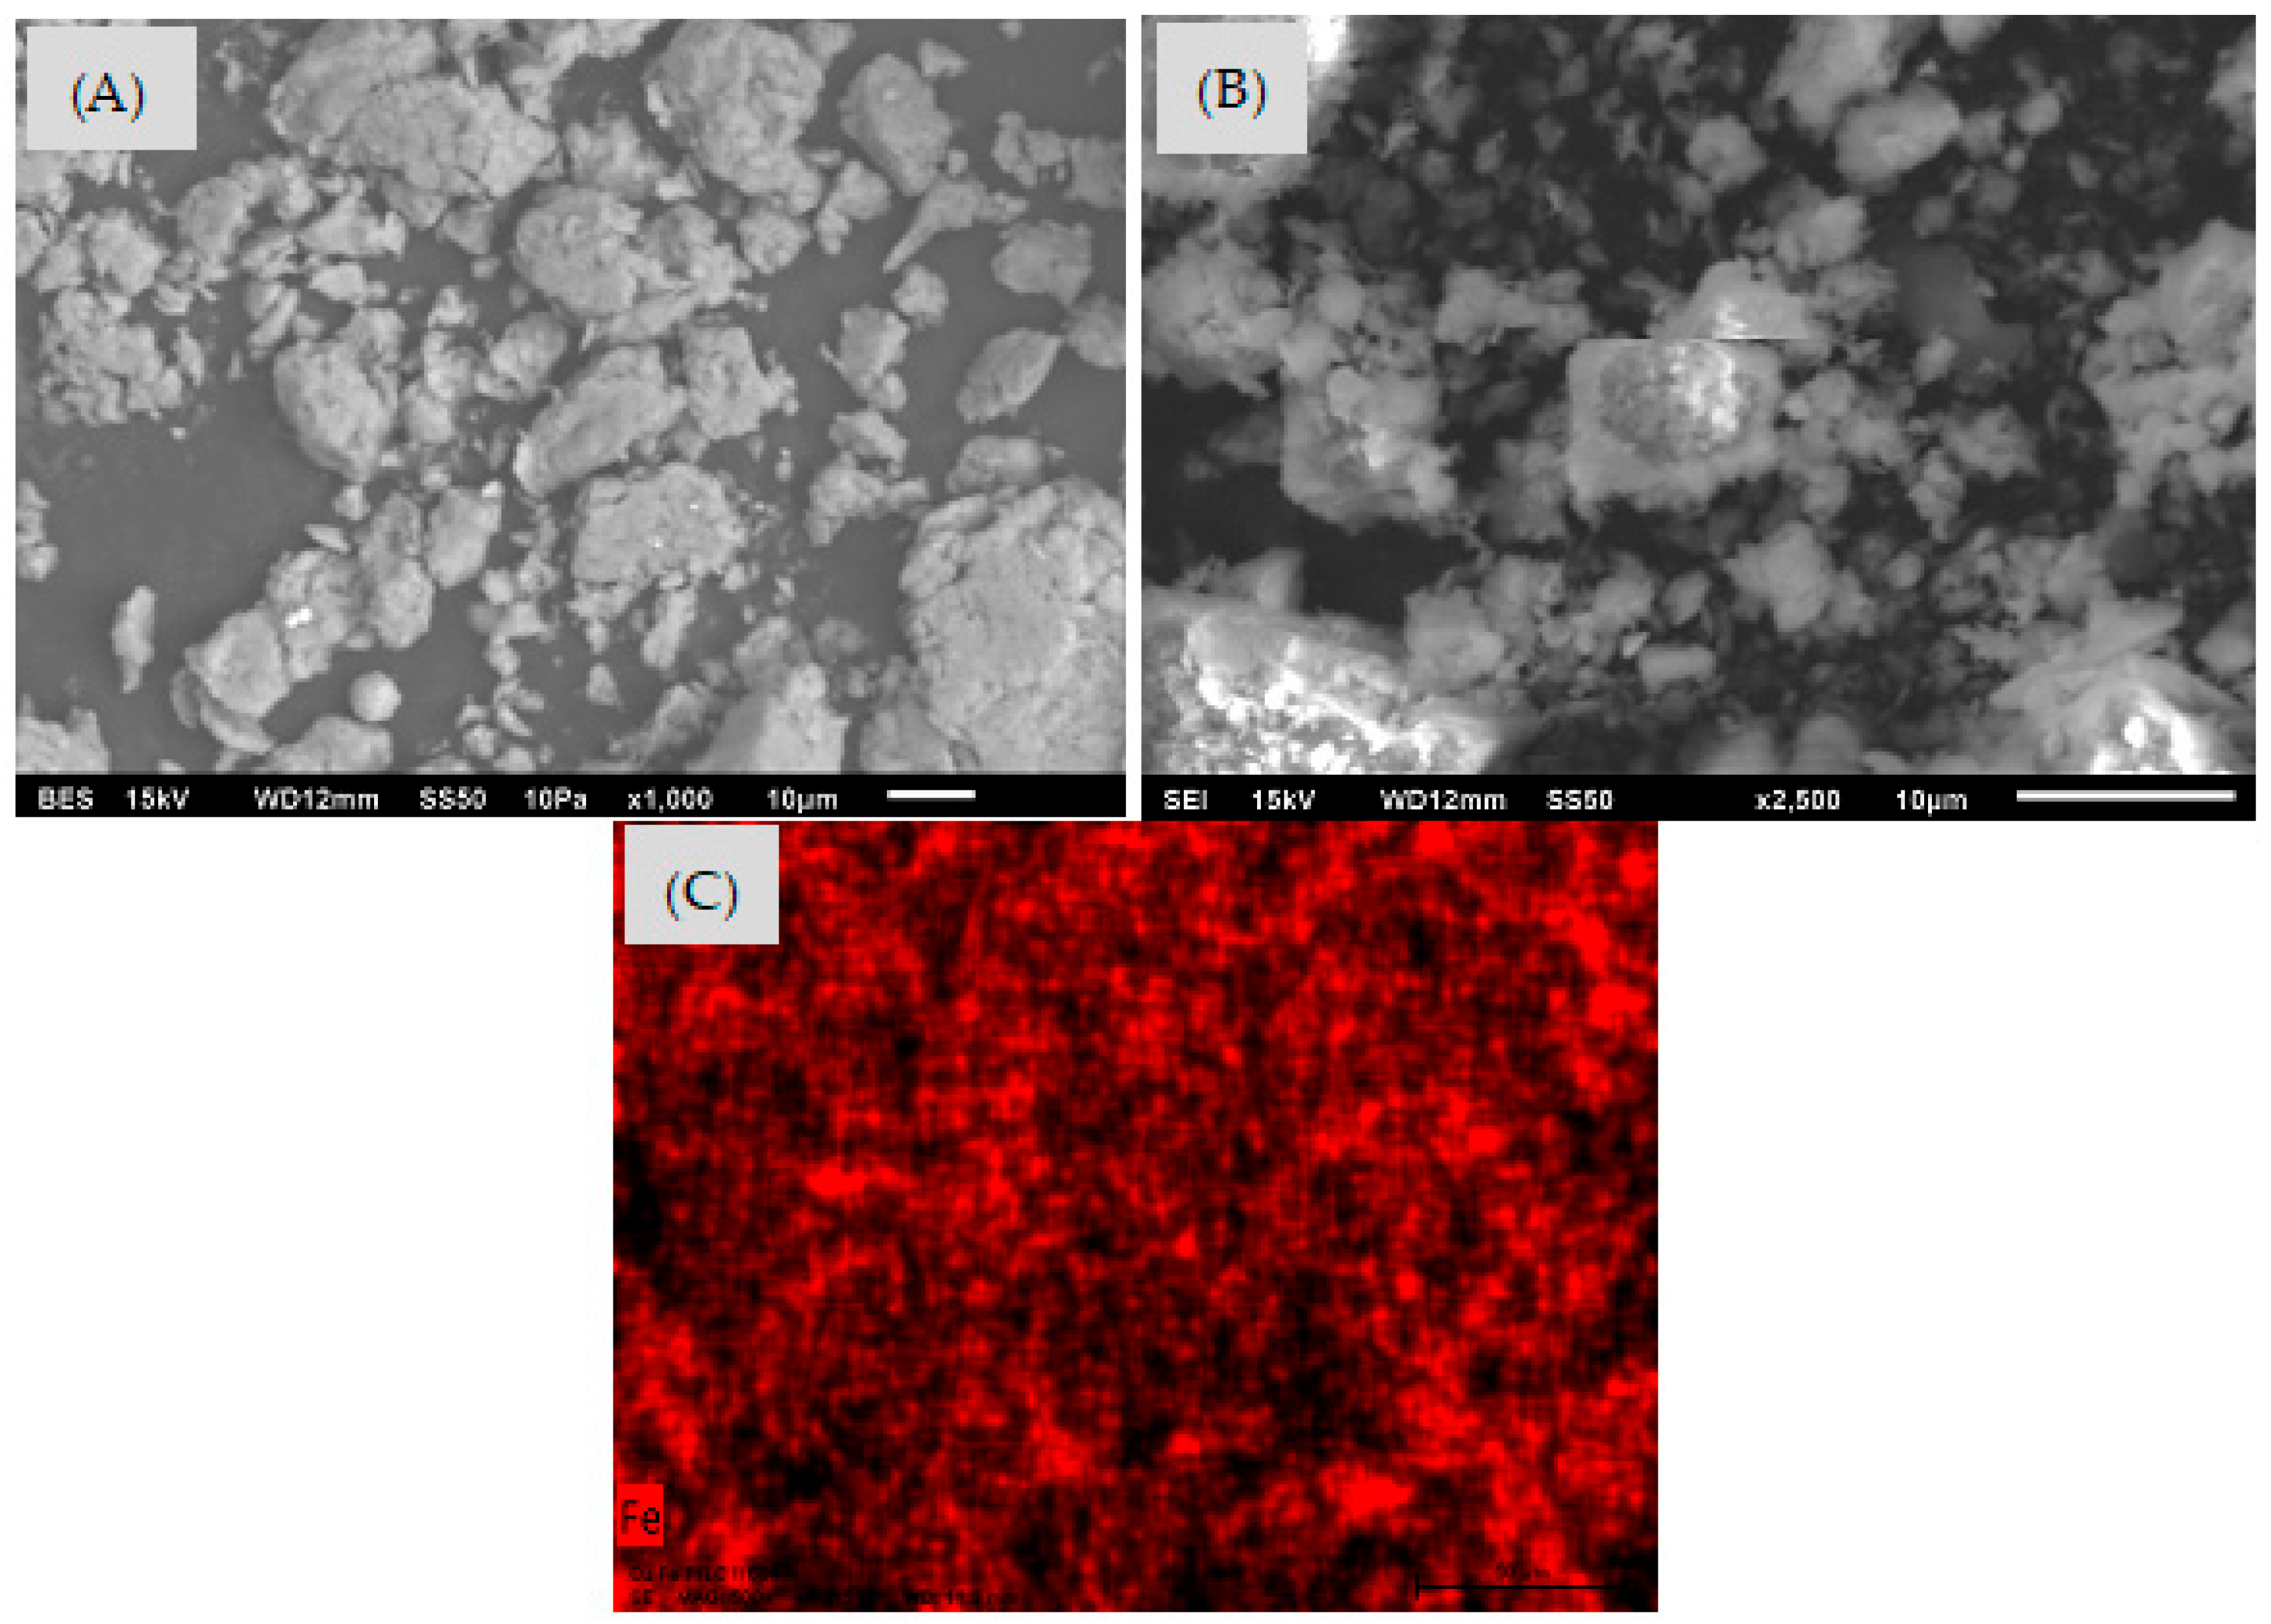
Figure 7A,B present the micrographs obtained with scanning electron microscopy (SEM), in which no significant morphological changes were detected, compared to bentonite clay. The iron distribution on the surface was evaluated using elemental analysis via energy-dispersive spectroscopy (EDS), as shown in Figure 7C. This image reveals a uniform distribution of the metal.

3.2. Effect of Treatment Type on Metformin Degradation and Mineralization

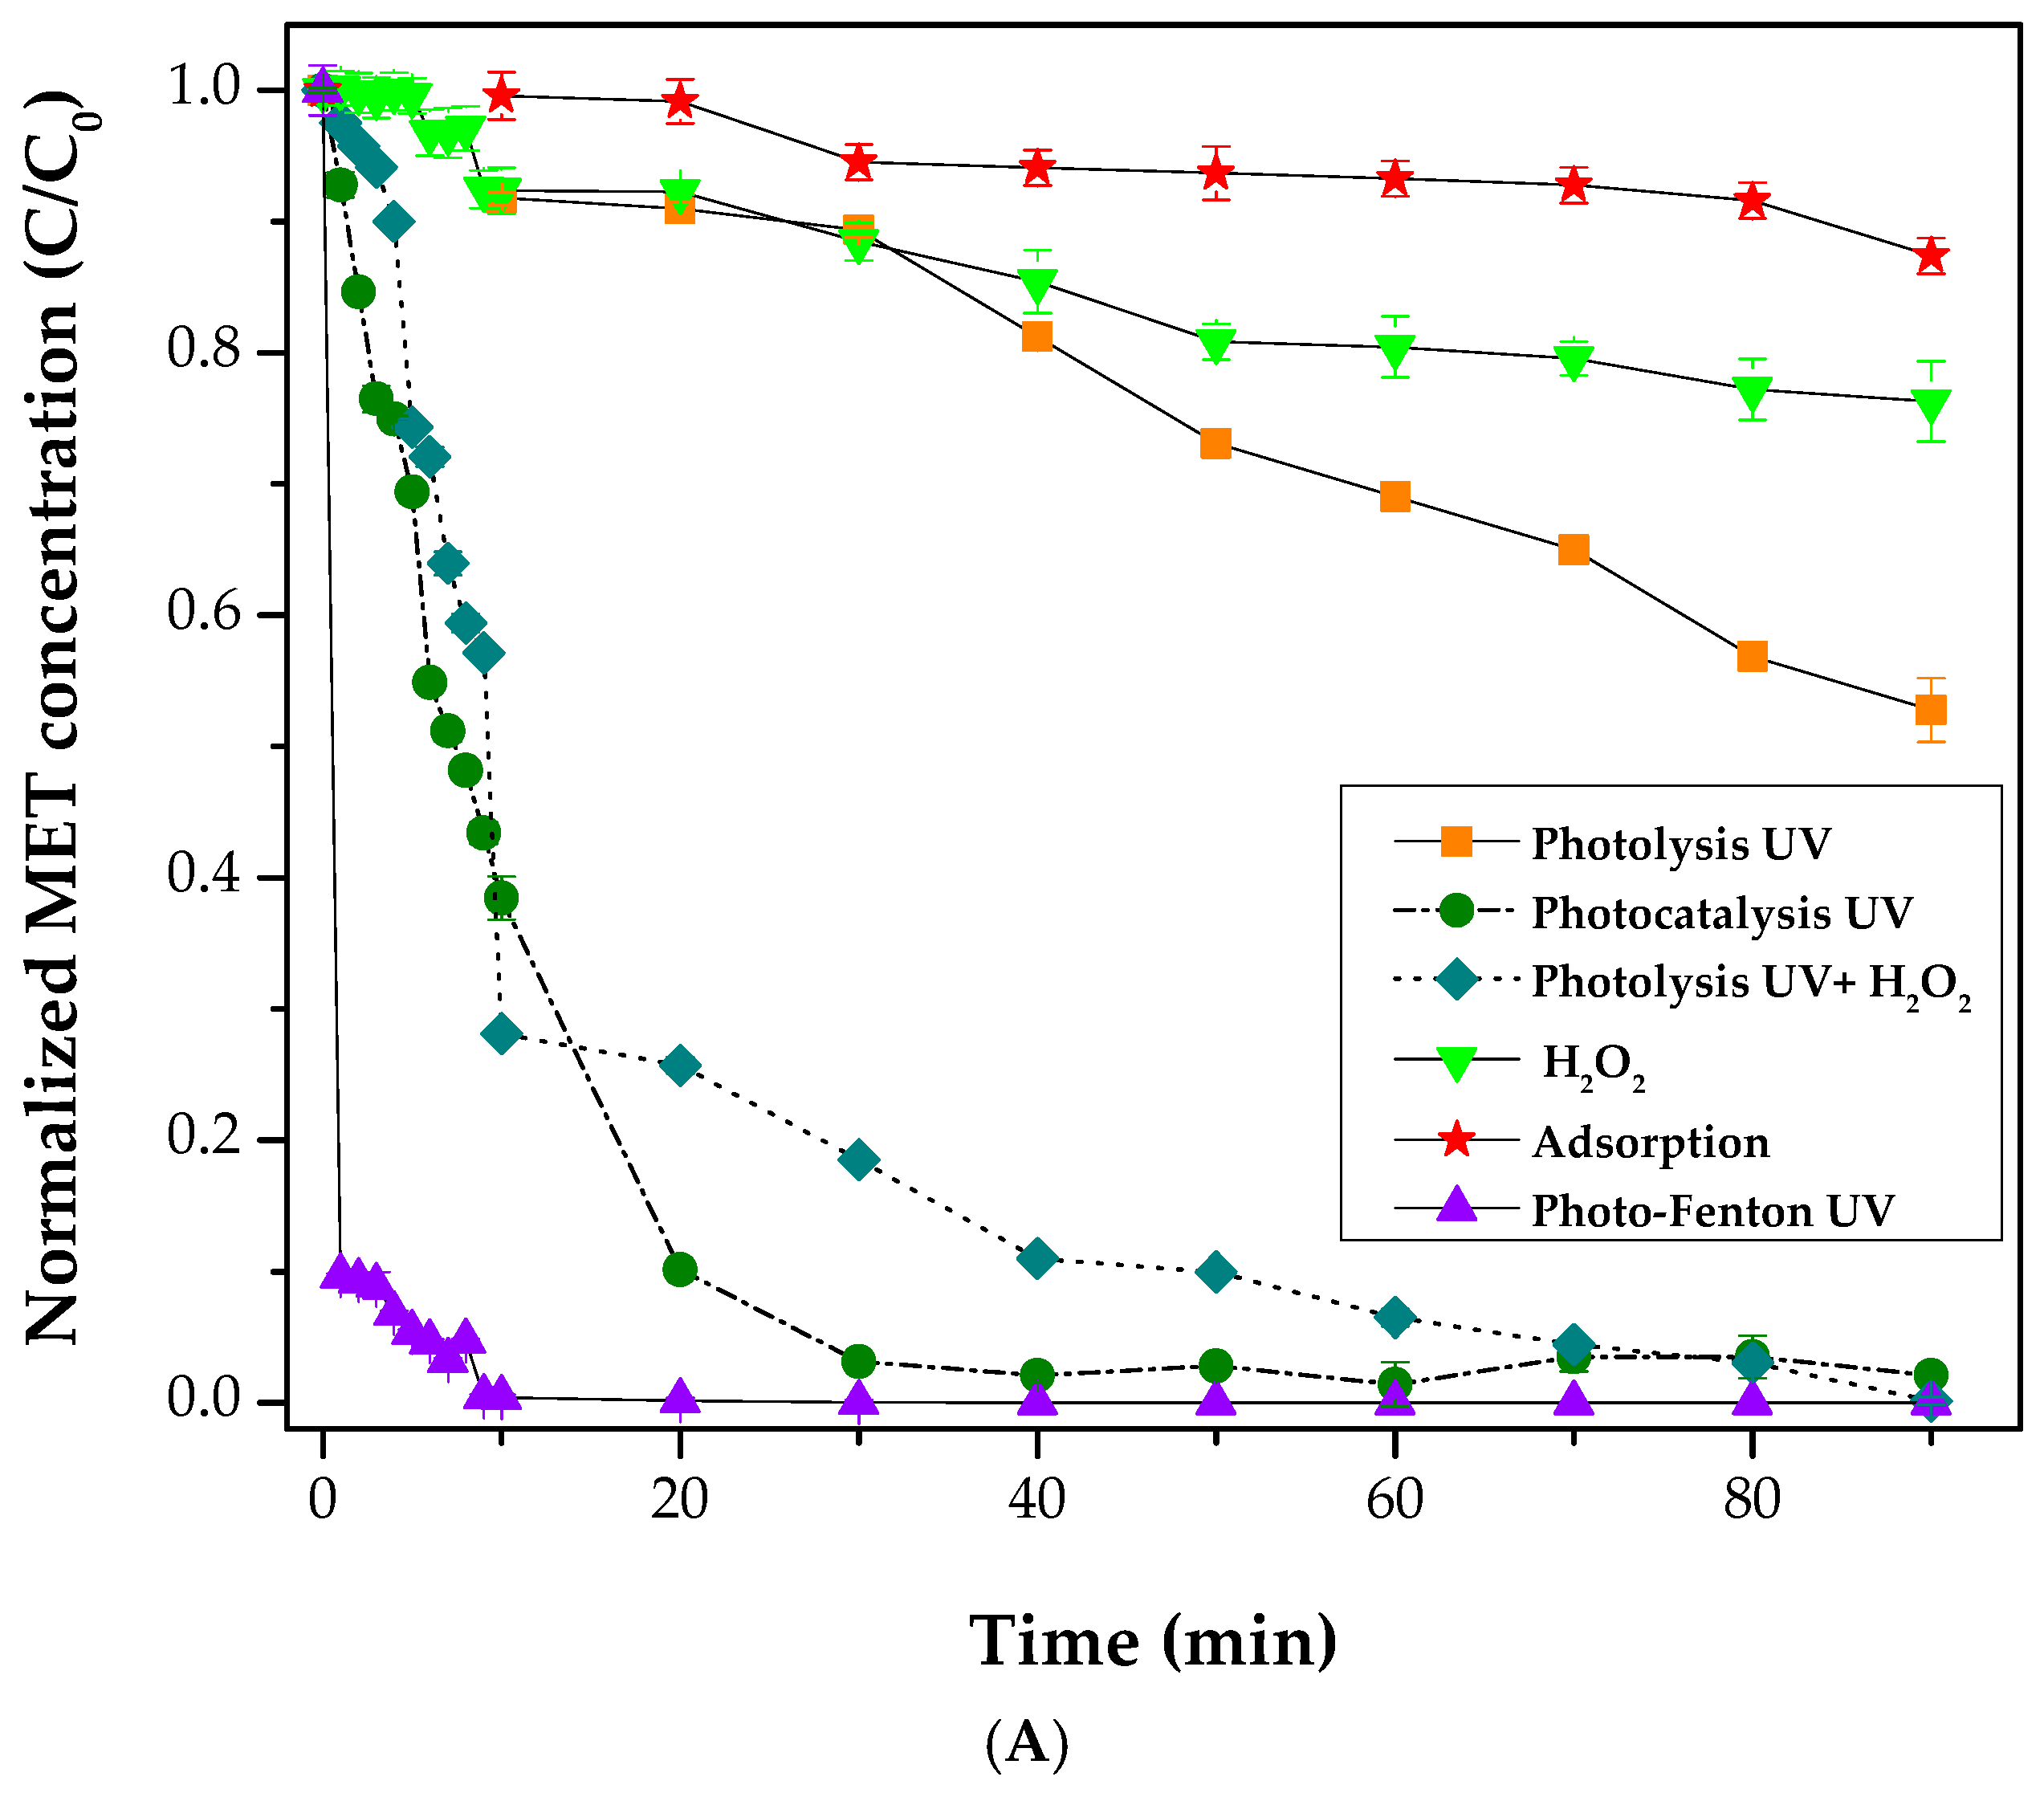
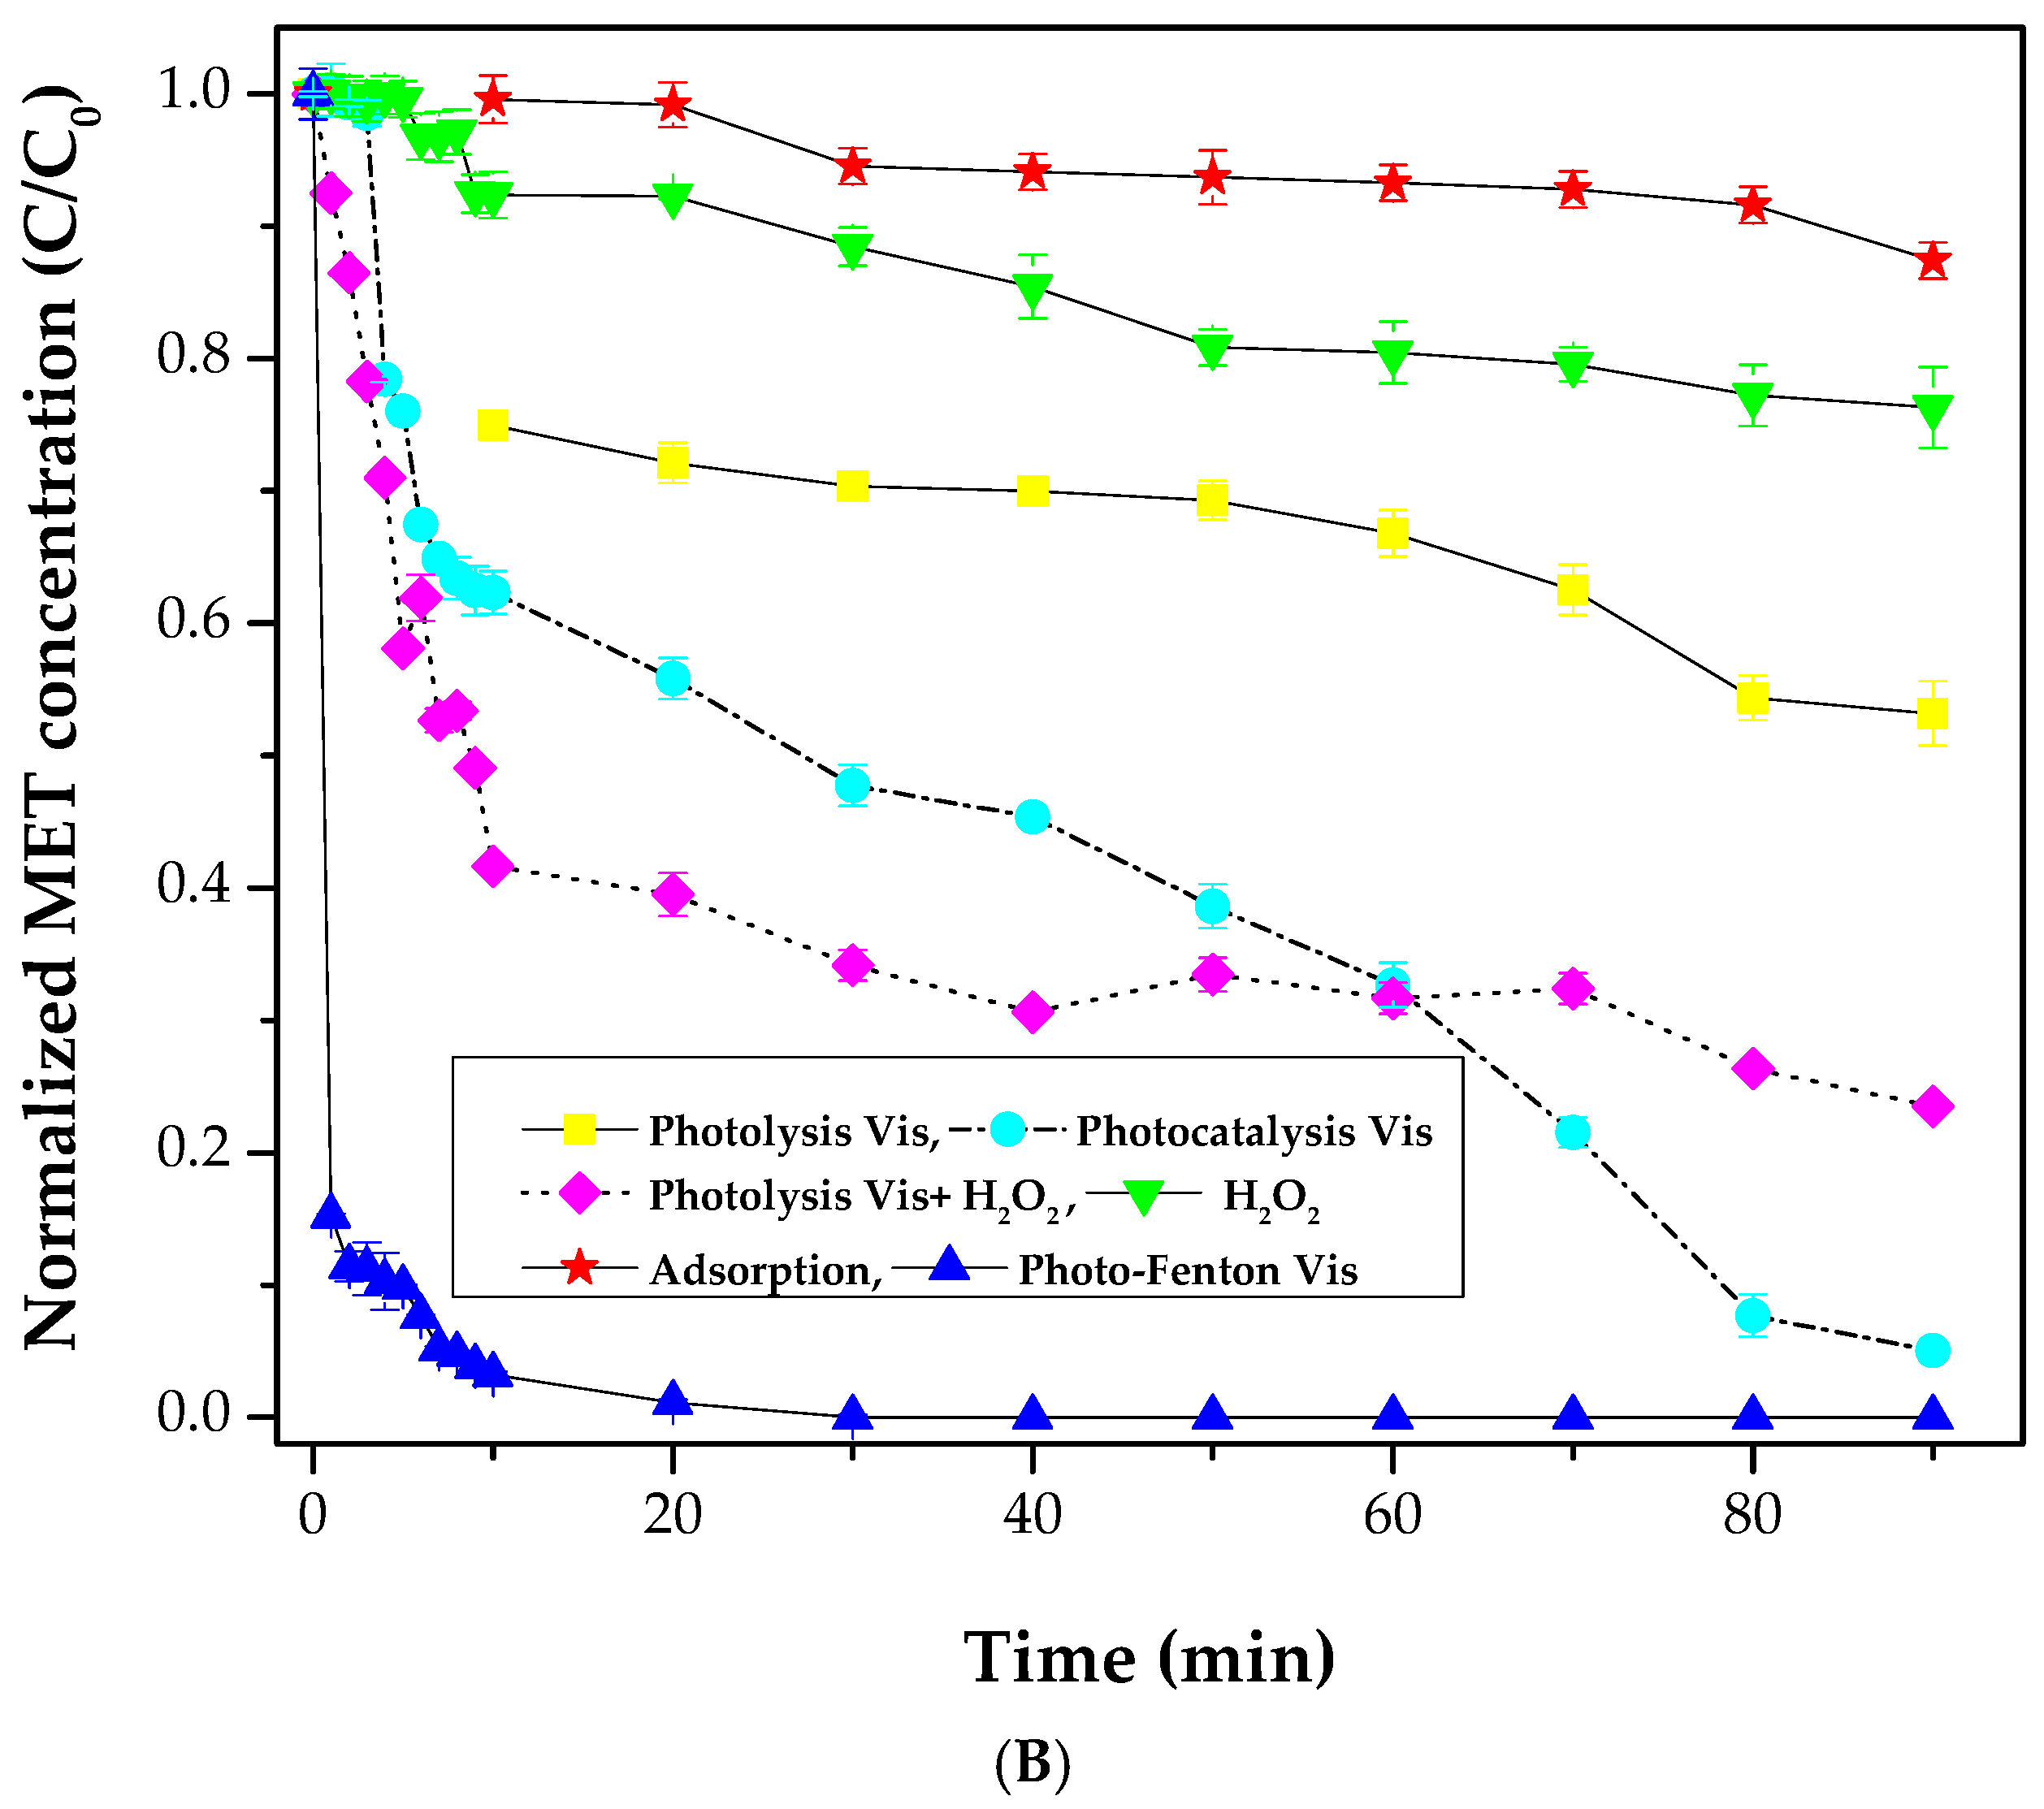
Figure 8A shows the effect of UV light (photolysis), adsorption on the catalyst surface (adsorption), hydrogen peroxide (H2O2), hydrogen peroxide and UV light (photolysis + H2O2), catalyst and UV light (photocatalysis), and catalyst + UV light + H2O2 (photo-Fenton) on the normalized temporary concentration profiles of metformin. Alike profiles were generated using visible light instead of UV light, and the results are shown in Figure 8B. Each process will be discussed separately.

3.2.1. Adsorption

It can be observed in Figure 8A that the removal of metformin by adsorption on the catalyst surface, at an initial pH of 5.5, is 10% during the 90 min of treatment. MET adsorption by iron-based adsorbents, i.e., Fe3O4/moringa, has been previously reported [44], and therefore, it was also expected in this work. In this case, however, the removal rate is considerably lower than that observed with Fe3O4/moringa and very similar to that reported by [45]. The removal by adsorption can be due to pore filling and electrostatic attraction [45] due to its protonated form at a pH of 5.5 [46]. It can be concluded that MET removal by adsorption during the treatment time (90 min) is very low compared to the degradation extent achieved by the other types of treatments.

3.2.2. Photolysis of Metformin and H2O2

The corresponding profile of photolysis (see Figure 8A) indicates that metformin is degraded by the highly energetic applied radiation (UV). Nevertheless, this photolytic degradation is relatively slow, and only 45% MET degradation is achieved at the end of treatment. This is an unexpected result since the maximum degradation rate with 254 nm UV lamps has been reported to be around 9% [47,48,49]. In fact, [49] did not identify any intermediary during MET photolysis, thus suggesting a MET degradation process was not plausible under only UV. This work shows otherwise, and this can be ascribed to the observed hydrogen peroxide (HP) production, different MET initial concentration, reaction volume, and reactor design. It is also worth noting that the analytical methods play a crucial role, and they could lead to different conclusions, mainly due to the appearance of guanidine by-products. These can overlap with MET with the use of a non-optimized chromatographic method. While [49] did not identify any intermediary, cyanoguanidine was observed in all treatments in this work, mainly with photolysis under UV. Other intermediaries, like carboxylic acids, were also identified, i.e., formic, acetic, and oxalic acids. These results are in concordance with the pH decrease observed during the photolysis treatment, either with UV or visible light. In addition, the total organic carbon measurement indicated a mineralization of 22% under UV light and 11% under Vis light.
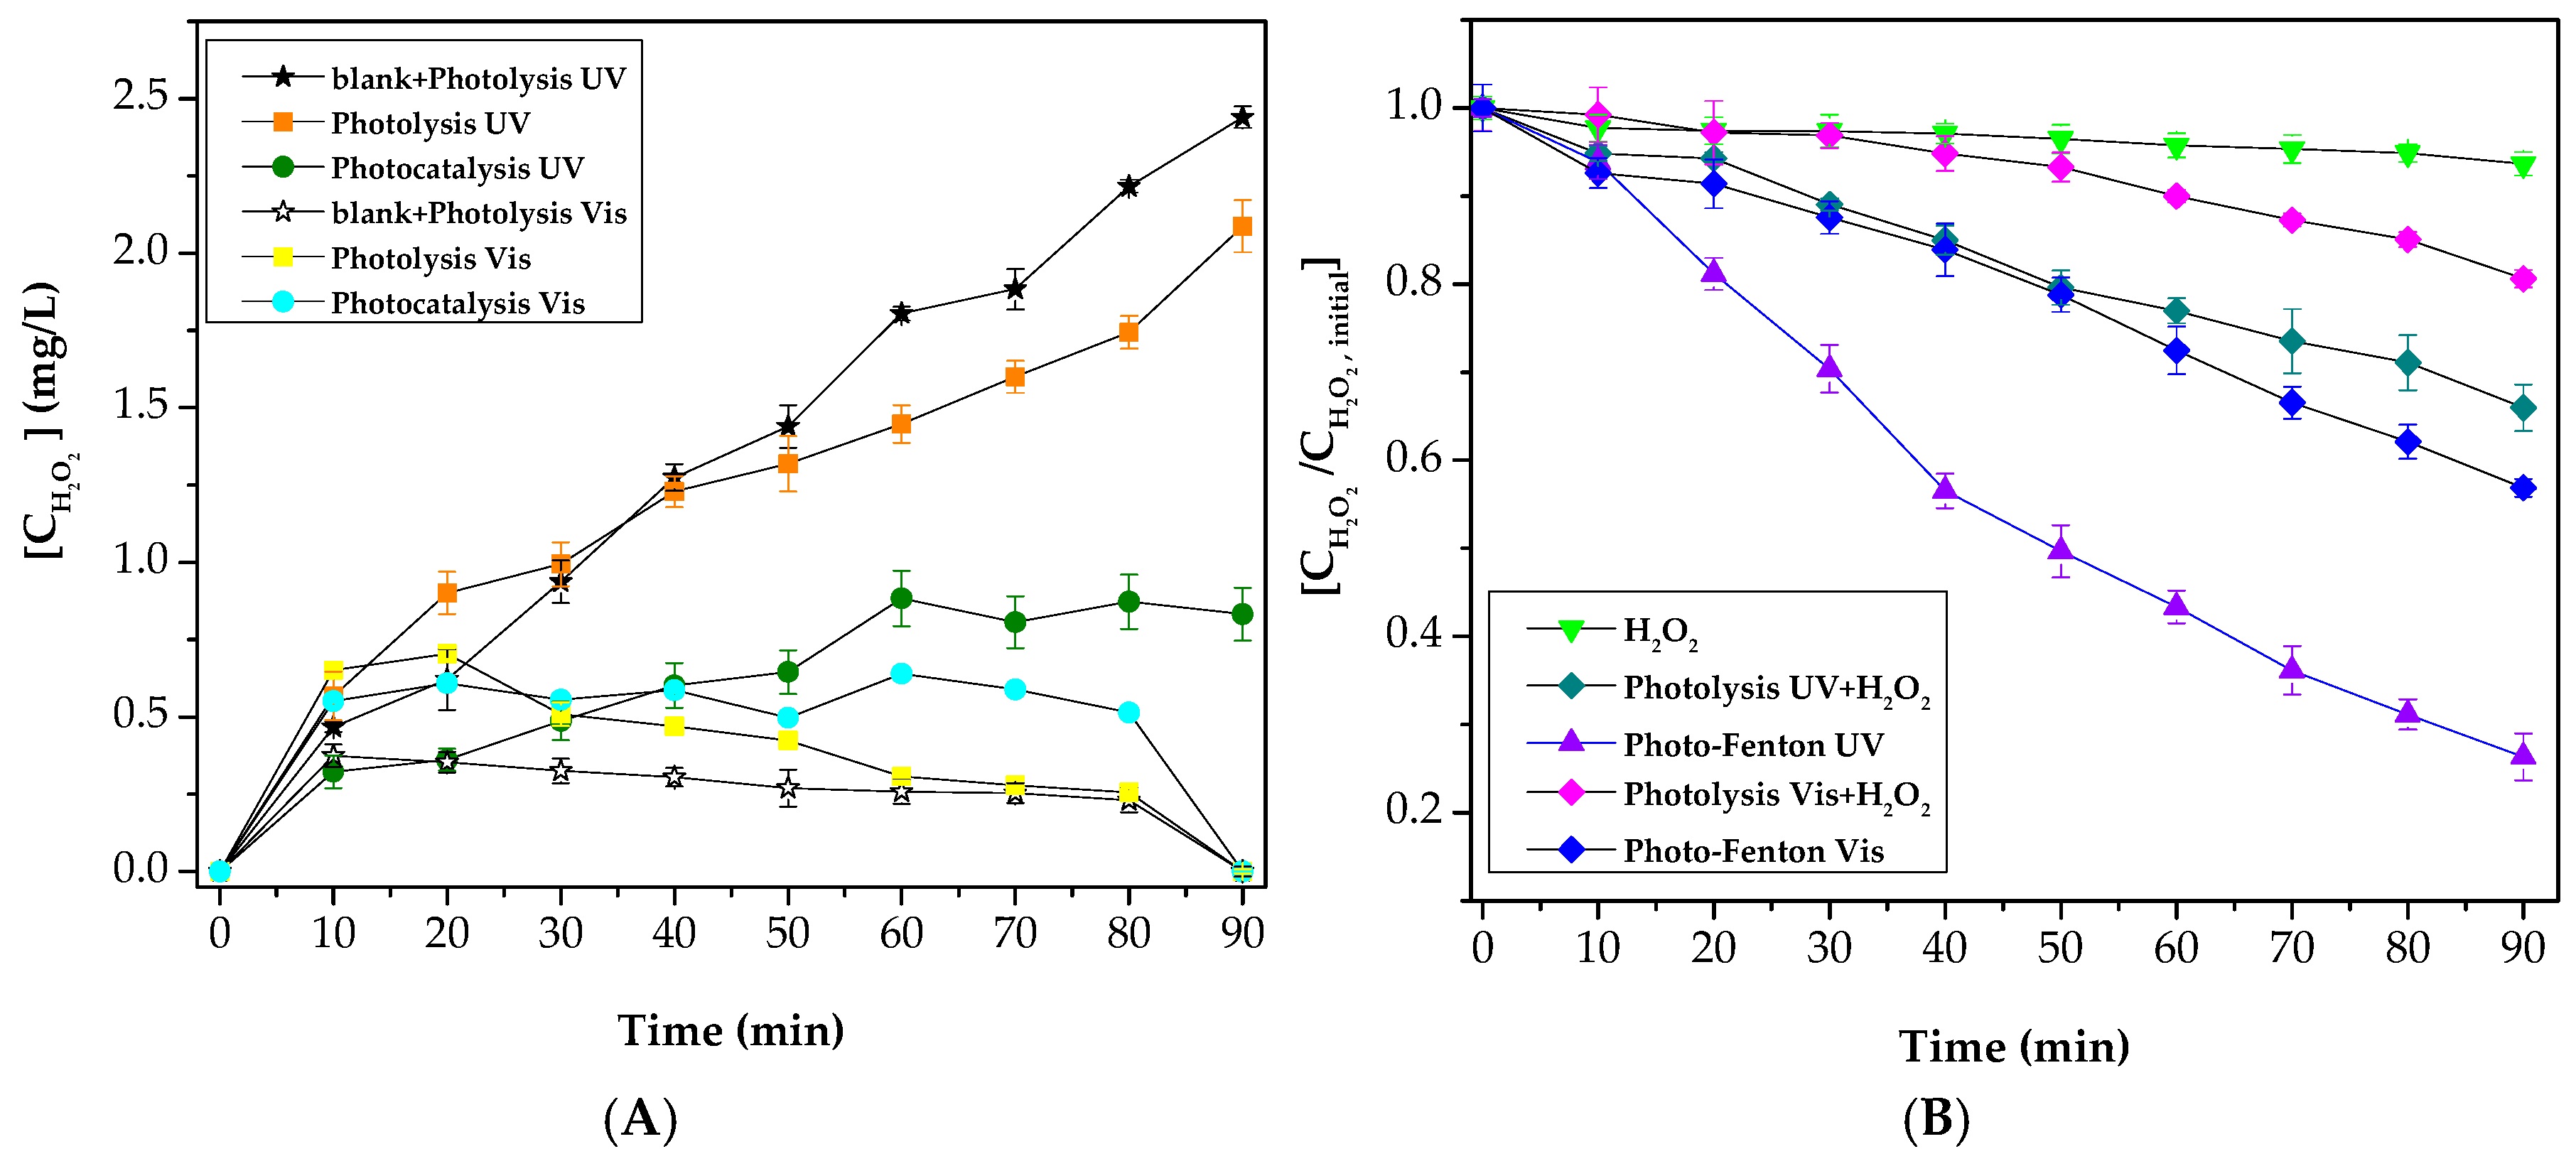
To verify the production of H2O2 during photolysis, three experiments were conducted with each wavelength, UV and Vis light. In these experiments, H2O2 was not added but monitored during each experiment. These experiments were as follows: (i) blank + Photolysis: this involved only water and the UV lamp or visible light lamp; (ii) photolysis: this experiment was conducted with MET and a UV lamp or visible light lamp; and (iii) photocatalysis: MET, the catalyst, and a UV lamp or visible light lamp were placed all together in the reactor. The results are shown in Figure 9A,B.
From the results in Figure 9A (black star marker), it can be corroborated that UV light promotes the production of H2O2. This process has been acknowledged to proceed via the homolysis of water only under VUV light (λ < 200 nm) [50,51]. In this case, however, the electromagnetic spectrum of the used UV lamp indicates most of the radiation is 254 nm, although there is also 185 nm radiation, albeit in a very low amount compared to the main one of 254 nm. Therefore, the production of hydrogen peroxide observed in Figure 9A can be ascribed mainly to the activation of a water molecule and the production of the intermediaries H O 2 • / O 2 • − , which finally lead to hydrogen peroxide being obtained via the following general reactions [52]:
H 2 O + h v → H 2 O *
H 2 O * + H 2 O → H 2 O 2 + H 2  
H 2 O * + O 2 → H 2 O 2 + 1 2 O 2
These reactions have been postulated [52] to proceed at wavelengths of 254 nm (Reaction (18)) and <1220.7 nm (Reaction (19)). Thus, the production of H2O2 peroxide under Vis light is expected to occur via Reaction (19). It is worth noting that the values presented in Figure 9A are higher than those obtained via the homolysis of water [50,51,53]. For instance, the highest production of H2O2 reported by [53] with a VUV lamp was 0.15 mg L−1, while in this work, it was 2.5 mg L−1 (see Figure 9A) with a 254 nm UV lamp. In this sense, the production of hydrogen peroxide with 254 nm UV lamps has also been acknowledged by [54].
In Figure 9A, the photolysis UV profile indicates that the presence of MET leads to a reduction in the accumulated concentration of H2O2 (HP) after 90 min of treatment, and this can be ascribed to MET consuming some of the produced H2O2. This consumption is also reflected in the decrease in normalized MET concentration via photolysis UV (Figure 8A). This confirms that the degradation of MET and its by-products occurs not only via the action of light but also via hydroxyl radical attack (Reaction (15)). Such radicals are produced by HP decomposition driven by light (Reaction (14)).
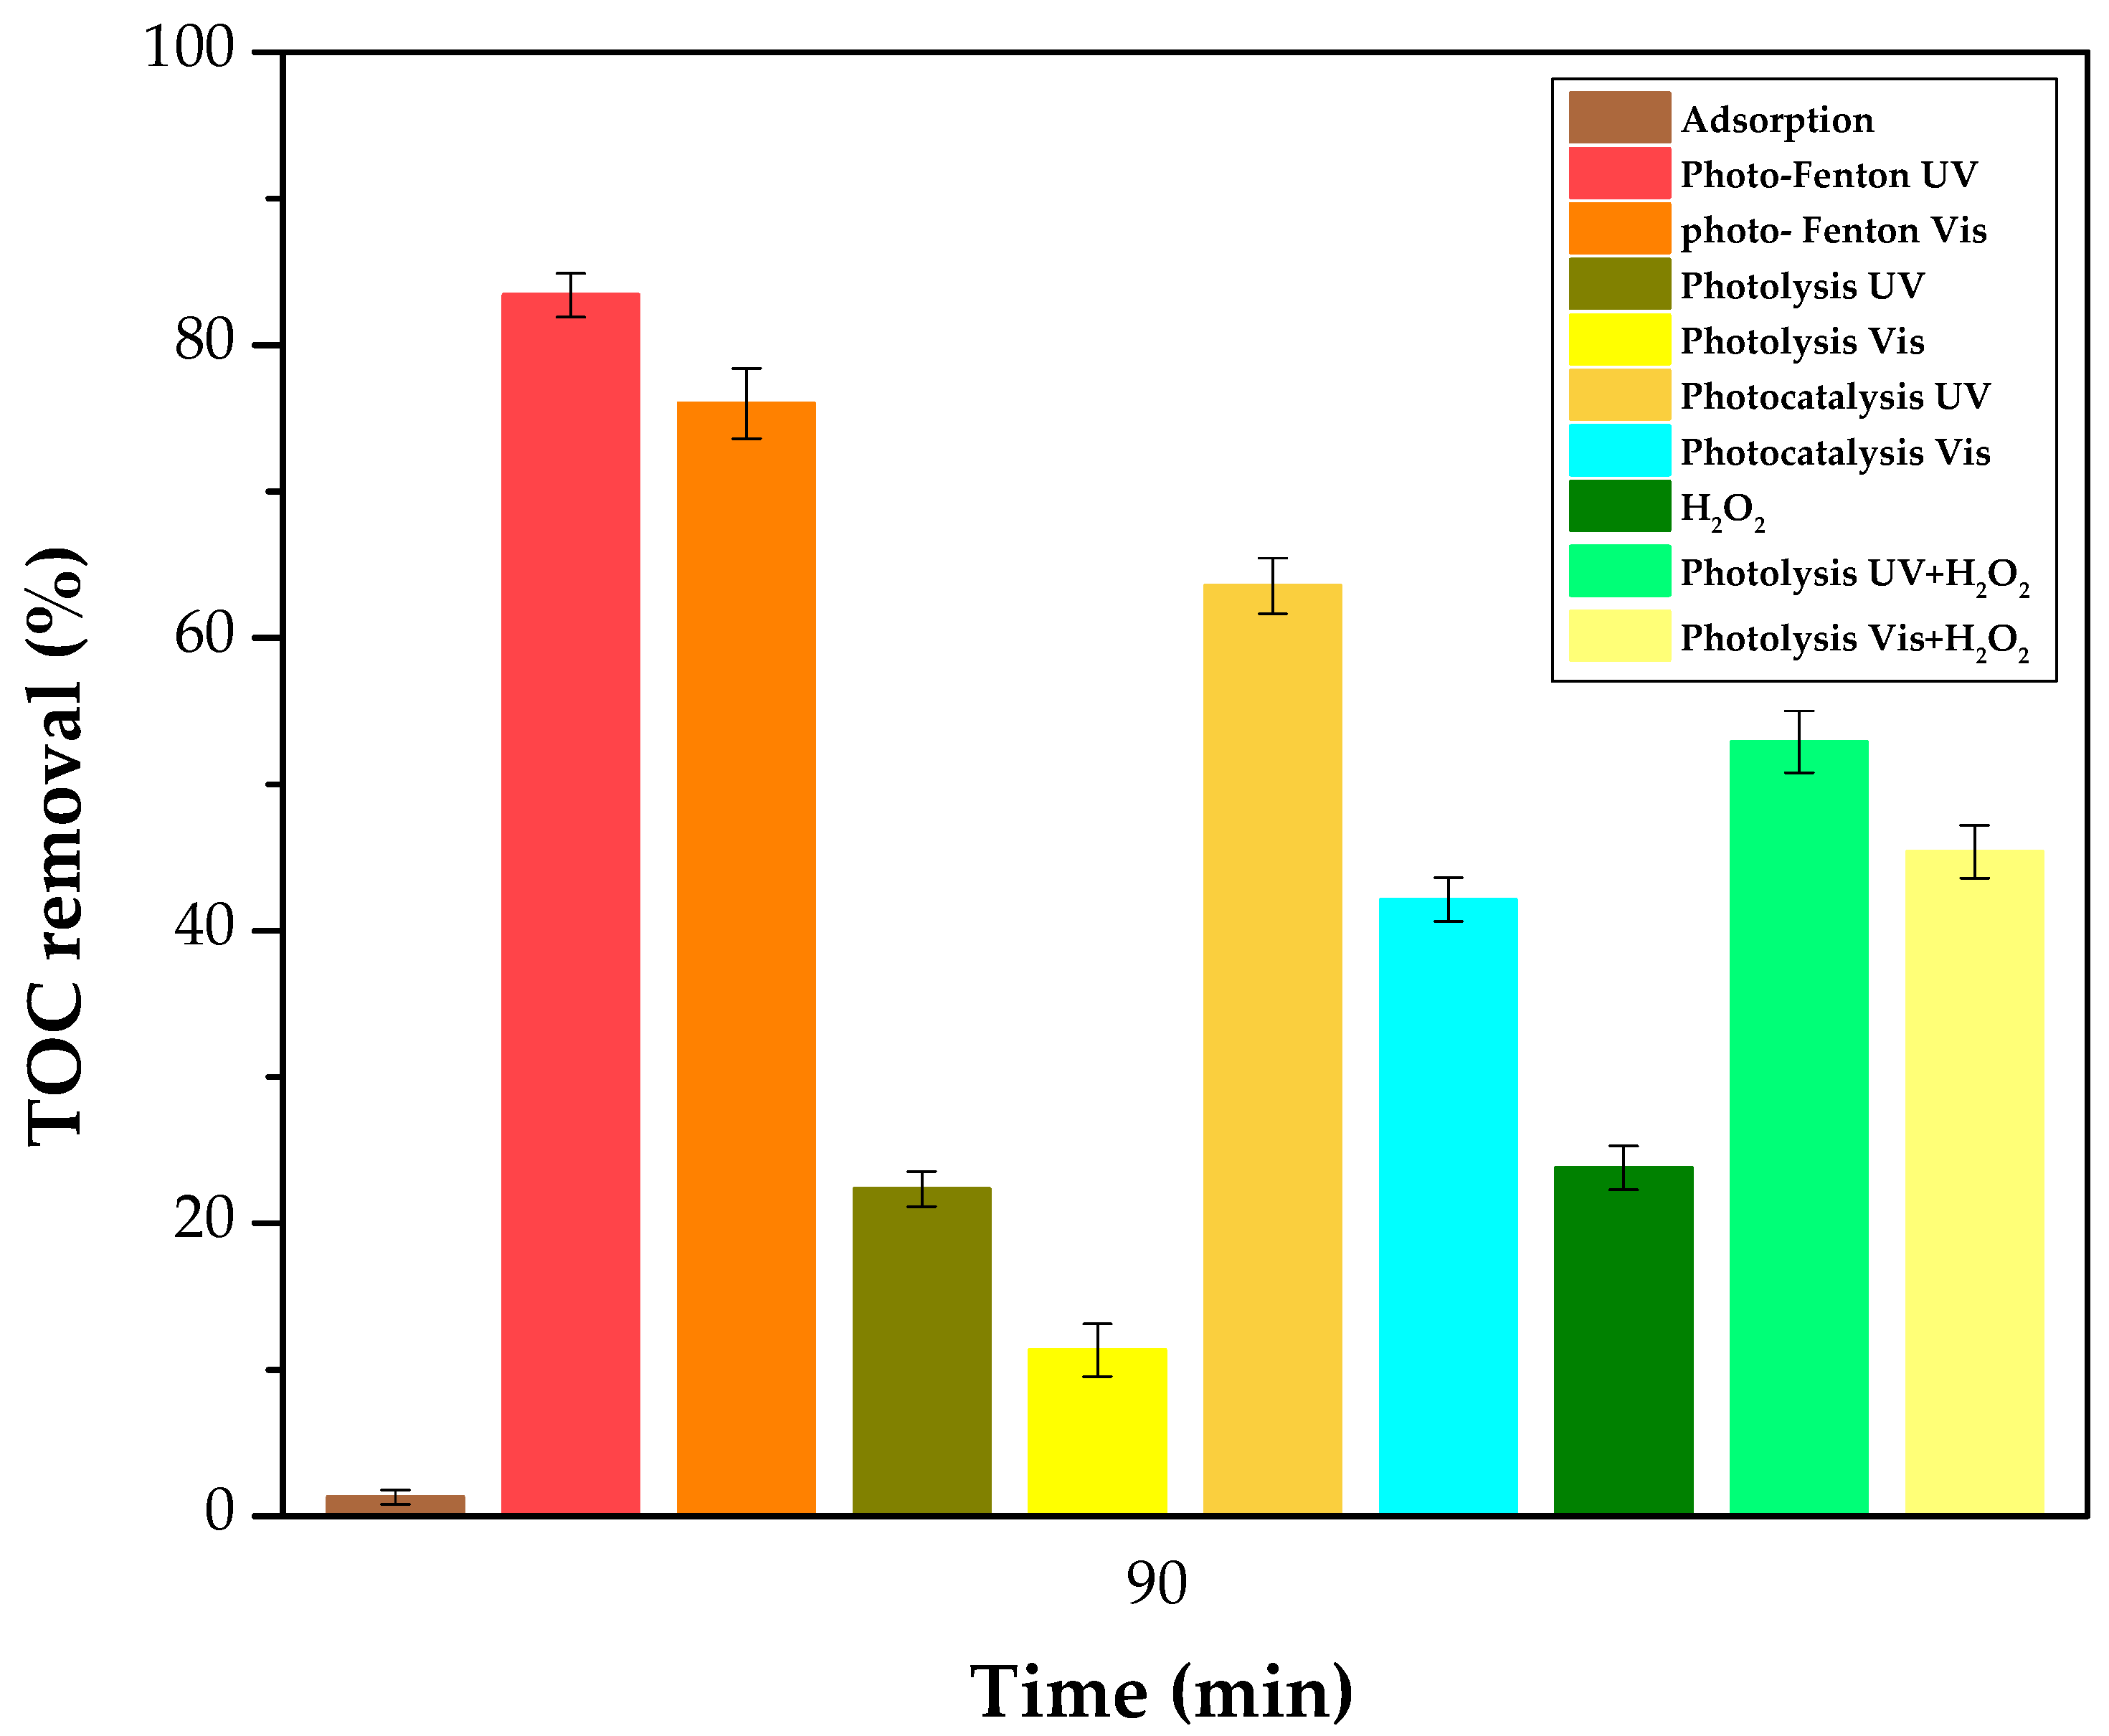
When H2O2 is added to the photolytic system (HPP), i.e., photolysis UV + H2O2, this leads to practically complete MET degradation being obtained at the end of treatment, see Figure 8A (rhombus marker). In this profile, however, it is worth noting that most of the degradation (72%) occurs in the first 10 min of reaction, and in the following 80 min of treatment, only a further 28% of MET degradation is achieved. This can be ascribed to the effect of both light and hydroxyl radicals produced by hydrogen peroxide (HP) decomposition by light (Reaction (14)). The HP decomposition was verified by monitoring the HP normalized concentration along time (Figure 9B). As shown in this figure, there is a consumption of approximately 35% of the initially added HP to the system and this practically degrades all initial MET. Nevertheless, only 50% TOC removal is achieved under these conditions (see Figure 10).
Figure 8B shows the results of experiments similar to those presented in Figure 8A. In this case, however, the results were obtained under visible light. It is worth noting that the MET degradation by solar light has been previously reported by [55]. The photolysis profile indicates that metformin is also degraded by Vis light and a 45% MET degradation is achieved at the end of this treatment. This value is significantly enhanced when H2O2 is added to the system, and this leads to ca. 75% MET degradation being obtained. In this profile, PVHP (photolysis Vis + H2O2) degrades in a similar fashion to when UV light is used; however, most of the degradation (60%) occurs in the first 10 min of reaction, and in the following 80 min of treatment, only a further 15% MET degradation is achieved.
To explain the observed results, the production and consumption of hydrogen peroxide (HP) were also monitored during all treatments conducted with visible light. Figure 9A,B depict the effect of visible light and the presence of metformin and catalyst (Fe-PILC) on the H2O2 temporary concentration profiles. The photolysis experiments were conducted without adding any HP. As observed in Figure 9A in the first 10 min of treatment, the HP production by photolysis with MET addition is about twice of that observed with Vis light and without MET (star marker, Figure 9A). In this case, however, the initial HP concentration is practically maintained during the whole treatment, and this can be ascribed to the limited production of HP and reactive oxygen species (ROS) like hydroxyl radicals and H O 2 • / O 2 • − . The results in Figure 9A also suggest that MET degradation, either by photolysis or photocatalysis, aids HP production, although to a much lesser extent than with UV light.
The results in Figure 9B (rhombus marker) demonstrate that hydrogen peroxide also decomposes under visible light, and the produced ROS are responsible for the observed MET degradation in Figure 8B (rhombus marker). Under these conditions, the achieved mineralization was 40% (see Figure 10). Figure 10 depicts the total organic carbon (TOC) removal percentage after 90 min of treatment under the same conditions presented in Figure 8A,B.
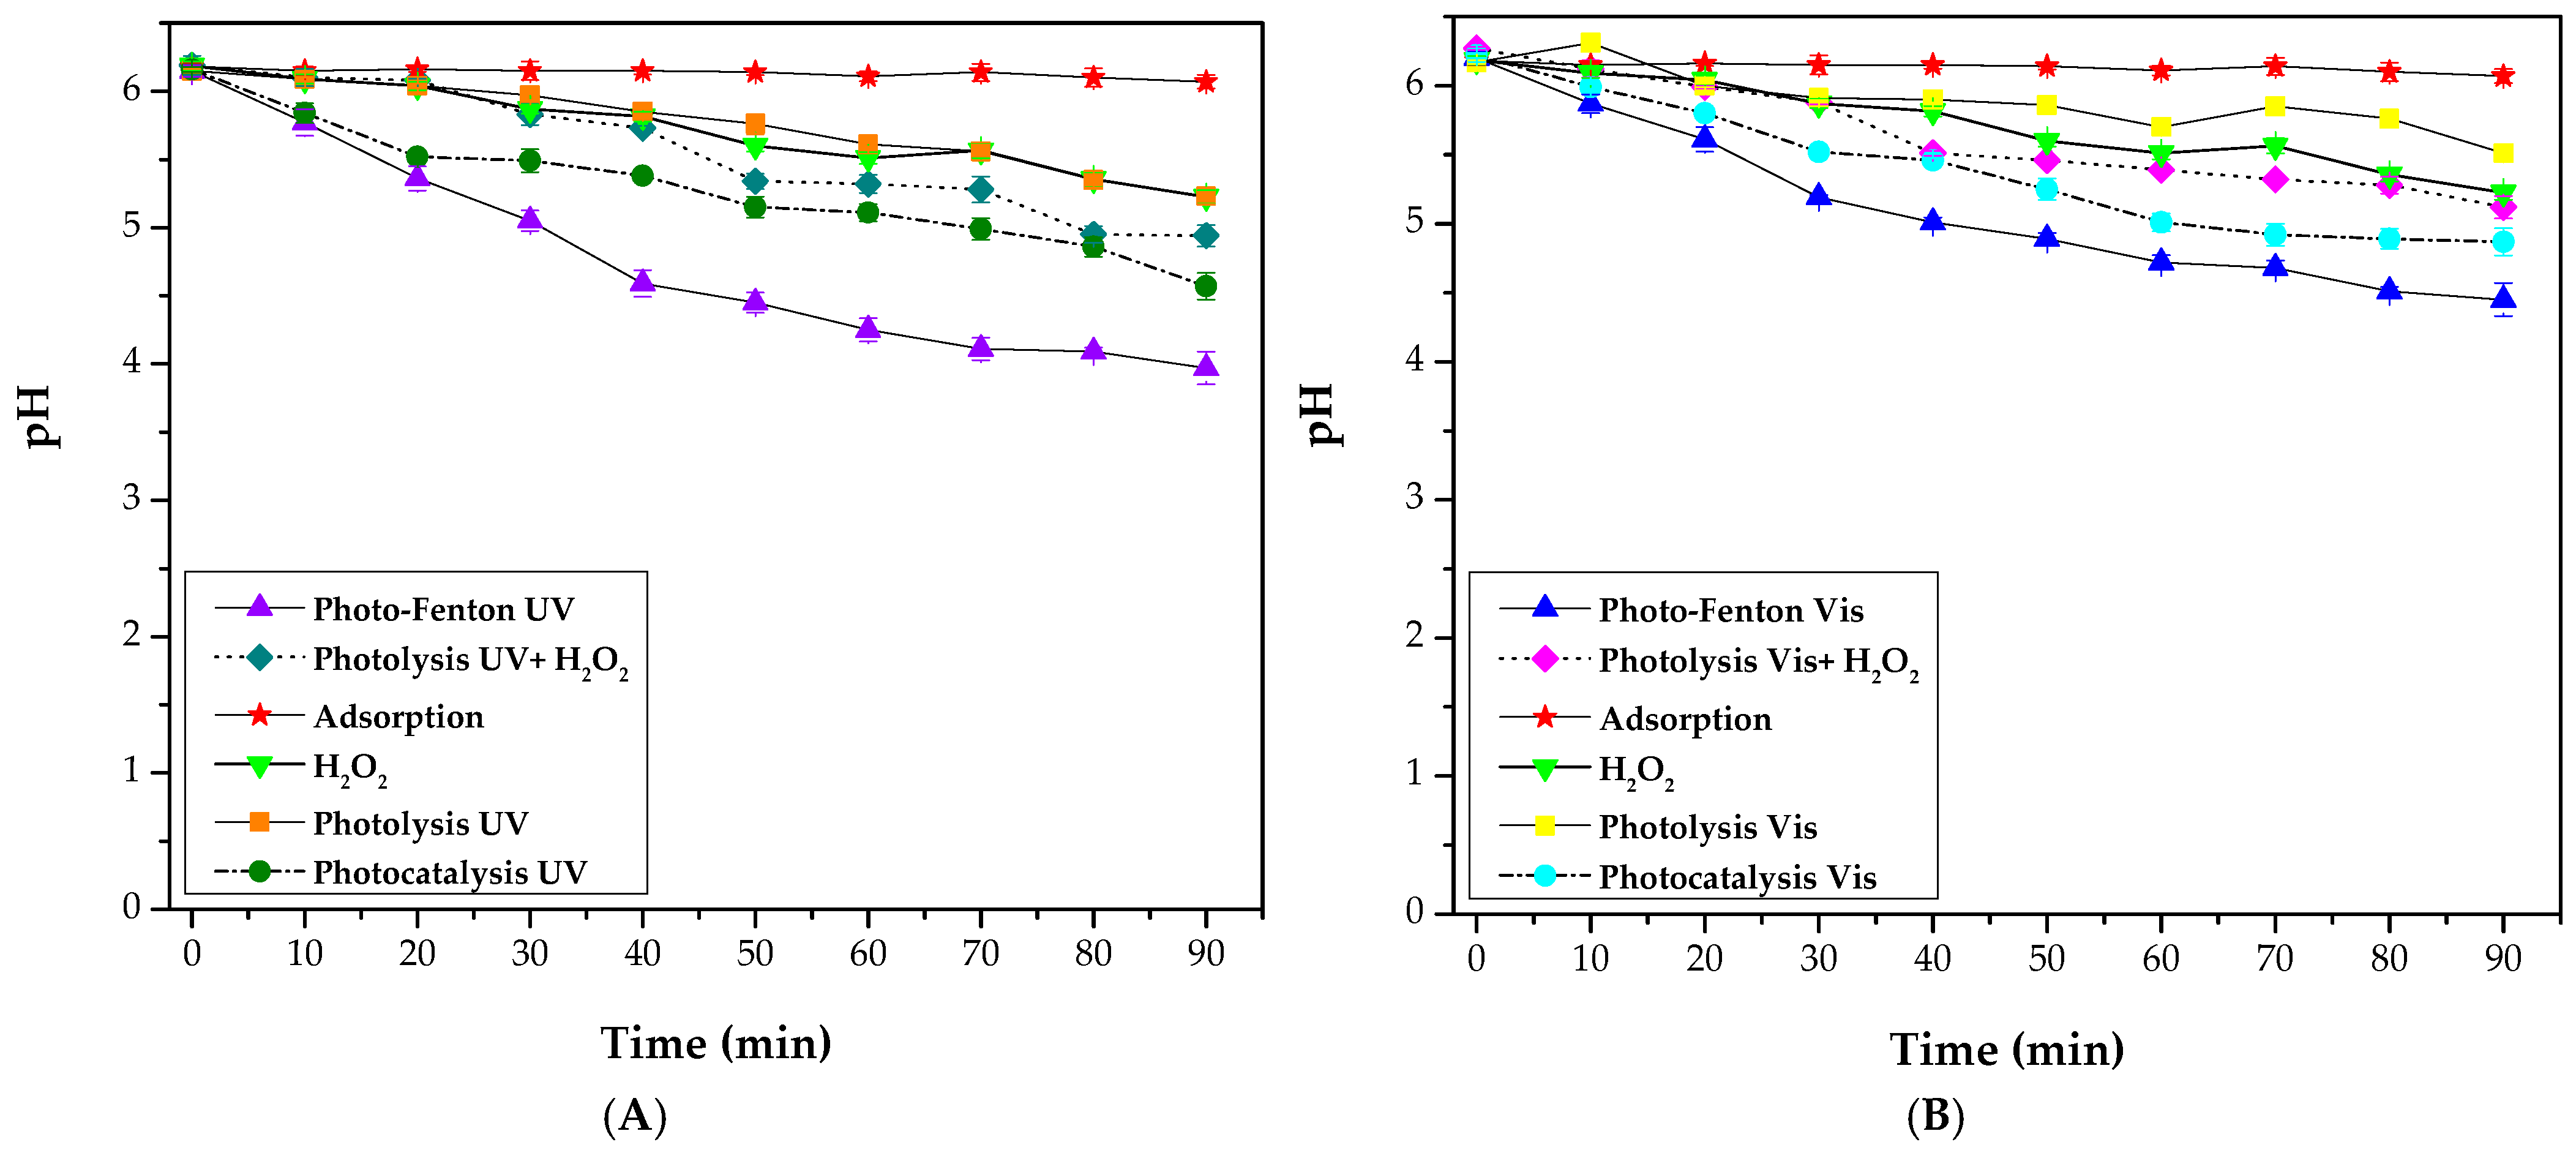
The achieved mineralization also impacts the final solution pH, i.e., 5.4 for the case of photolysis Vis + H2O2 (see Figure 11B).

3.2.3. Photocatalysis

It can also be observed in Figure 8A that ca. 98% MET degradation is achieved with photocatalysis, PC (UV light + catalyst), after only 30 min of treatment. It can also be observed in Figure 8B that 95% MET degradation is achieved with photocatalysis (Vis light + catalyst), albeit at a relatively long reaction time, 90 min. This result can be ascribed to MET degradation via photolysis and hydroxyl radicals produced by HP decomposition driven by light. It is worth keeping in mind that hydrogen peroxide is not added in the photocatalytic process; nevertheless, it is being generated by the action of UV light (see Figure 9A).
According to Figure 6, the catalyst contains a mixture of semi-conductors, i.e., Fe3O4 and FeO, with a calculated band-gap energy of 2.08 eV (Figure 3). This value explains the photocatalysis not only driven by UV light but also by visible light. The corresponding results are observed in Figure 8B, where near-complete MET degradation is achieved by photocatalysis driven with visible light, albeit at a longer time (~3×) than with UV light.
According to the principle of photocatalysis and the results shown in Figure 8, radiating Fe-PILC with light with a wavelength (λ) lower than 700 nm excites an electron from the valence band (VB) towards the conduction band (CB), leaving behind a positive energetic hole in the VB, where hydroxyl radicals and protons are produced via water oxidation. The results in Figure 8A (solid circle markers) suggest that the production of such radicals readily proceeds, thus enhancing MET degradation rate. This occurs at a higher rate than hydrogen peroxide (HP) photodecomposition. Therefore, it can be concluded that the Fe-PILC catalyst is more effective than HP in providing ROS ( H O • / H O 2 • / O 2 • − ) to the process driven by UV light. These results agree with other studies [56,57] that show that clay materials (smectites) with Fe (II) can produce ROS without the need to add H2O2. This conclusion is also supported by the mineralization results: 65% mineralization is attained by photocatalysis UV, while only 55% mineralization is achieved with photolysis UV + H2O2. This is relevant since photocatalysis not only eliminates the use of HP but also allows one to completely remove MET in a much shorter time than photolysis+H2O2, thus consuming less energy using the lamp and the stirrer of the reactor.
Regarding the excited electron in the conduction band, this can be captured by oxygen from the solution, thus producing the superoxide radical (Reaction (20)) [51]. Dissolved oxygen also reacts with protons from the valence band and produce hydroperoxyl radicals (Reaction (21)) [51]. All of them are ROS that contribute not only to MET degradation but also to its mineralization through MET oxidation by-products. The kinetic constants were reported by [51].
e − + O 2 → O 2 −   ;                     k = 2 × 10 10 M − 1 s − 1
H • + O 2 → H O 2 • ;                     k = 1 × 10 10 M − 1 s − 1
Regarding photocatalysis driven by visible light (PCV), it can be observed in Figure 8B that in the first ten minutes, the MET degradation by this process is slower than that by photolysis Vis + H2O2 (PVHP). This suggests the use of the Fe-PILC catalyst under visible light is not as effective as H2O2 in providing hydroxyl radicals (HRs). As the process proceeds, however, it can be observed that the MET degradation by PVHP slows down and only 72% is achieved after 90 min of treatment, while practically complete MET degradation is achieved by PCV after the same reaction time. This suggests the availability of HRs in the PVHP process might be limited, not only because HP is not readily decomposed by visible light (see the magenta markers in Figure 9B) but also because intermediary products might compete for them with MET. The mineralization results in Figure 11 support this statement since 45% TOC removal is achieved by PVHP, while only 42% TOC removal was achieved by PCV. In addition, PVHP’s effectiveness relies only on HR production, while PCV’s effectiveness relies also on the production of other ROS. Thus, by contrasting the complete normalized MET concentration temporal profiles for PCV and PVHP, in Figure 8B, it can be concluded that although ROS are not produced by PCV as fast as by PVHP, they are produced in a sufficient amount to oxidize MET and its by-products. The photocatalytic effect under visible light can be ascribed to the presence of Fe3O4, which reduces the band-gap energy of the catalytic system and improves the absorption of photons with λ < 700 nm [58].

3.2.4. Photo-Fenton

Figure 8A presents photo-Fenton driven by UV light (PFUV) as the most efficient method since 100% MET degradation is achieved in only 9 min of reaction. This implies an important improvement in energy consumption to completely remove metformin. Under visible light (PFV), the results also show that photo-Fenton is the most efficient method since 100% MET degradation is achieved in 30 min of reaction.
This phenomenon can be ascribed to the increased production of ROS, since this catalyst improves H2O2 (HP) dissociation according to the Fenton reaction (Reaction (1)). The increase in HP decomposition rate was verified by monitoring the HP concentration in both processes, PFUV and PFV. The results are presented in Figure 9B. This is indicative of the action of the catalyst surface over the HP molecule (Reaction (1)). It can also be concluded from Figure 9B that HP concentration depletion is not only aided by the presence of the catalyst but also by the action of light (compare the purple triangle markers with the cyan rhombus). UV light is observed to produce a much stronger effect on the hydrogen peroxide consumption rate than visible light, according to Reaction (14) [51]. In addition, HP is an electron acceptor. Therefore, further HRs are produced by HP trapping the electrons that were excited towards the CB as part of the photocatalytic effect and also reacting with ROS via Reactions (22)–(24), whose kinetic constants have previously been reported [51,55]. Based on the results shown in Figure 8, the photocatalytic and photolytic effects cannot be disregarded in the photo-Fenton process.
H 2 O 2 + e a q − → H O • + O H − ;                                         k = 1.1 × 10 10 M − 1 s − 1
H 2 O 2 + H O 2 • → H O • + O 2 + H 2 O ;               k = 5.3 × 10 2 M − 1 s − 1
H 2 O 2 + O 2 • − → H O • + O 2 + O H − ;                   k = 1.6 × 10 1 M − 1 s − 1
Figure 11A,B show the pH temporal profiles for each one of the assessed processes. Both figures show that the pH decreases at different rates depending on the process type. These decreases can be ascribed to the production of carboxylic acids. Therefore, the lower the final pH, the higher the mineralization percentage reached. The lowest pH is achieved with the process generating the highest TOC removal, i.e., photo-Fenton, either aided by UV or Vis light.
In Figure 10, It can be observed that after 90 min of treatment, the maximum TOC removal is 83% with the photo-Fenton treatment driven by UV light. It is worth noting that photo-Fenton driven by Vis light also leads to a high TOC percentage removal (76%) and that this value is higher than with the other photochemical methods, driven either by UV or by Vis light. The results in Figure 10 suggest the MET mineralization extent attained by photo-Fenton is not only due to the hydroxyl radicals produced by the Fenton process, but there is also an important contribution from photocatalysis through photolytic attack of the organic molecules and through the hydroxyl radicals produced by light-driven H2O2 dissociation (Photolysis + H2O2).
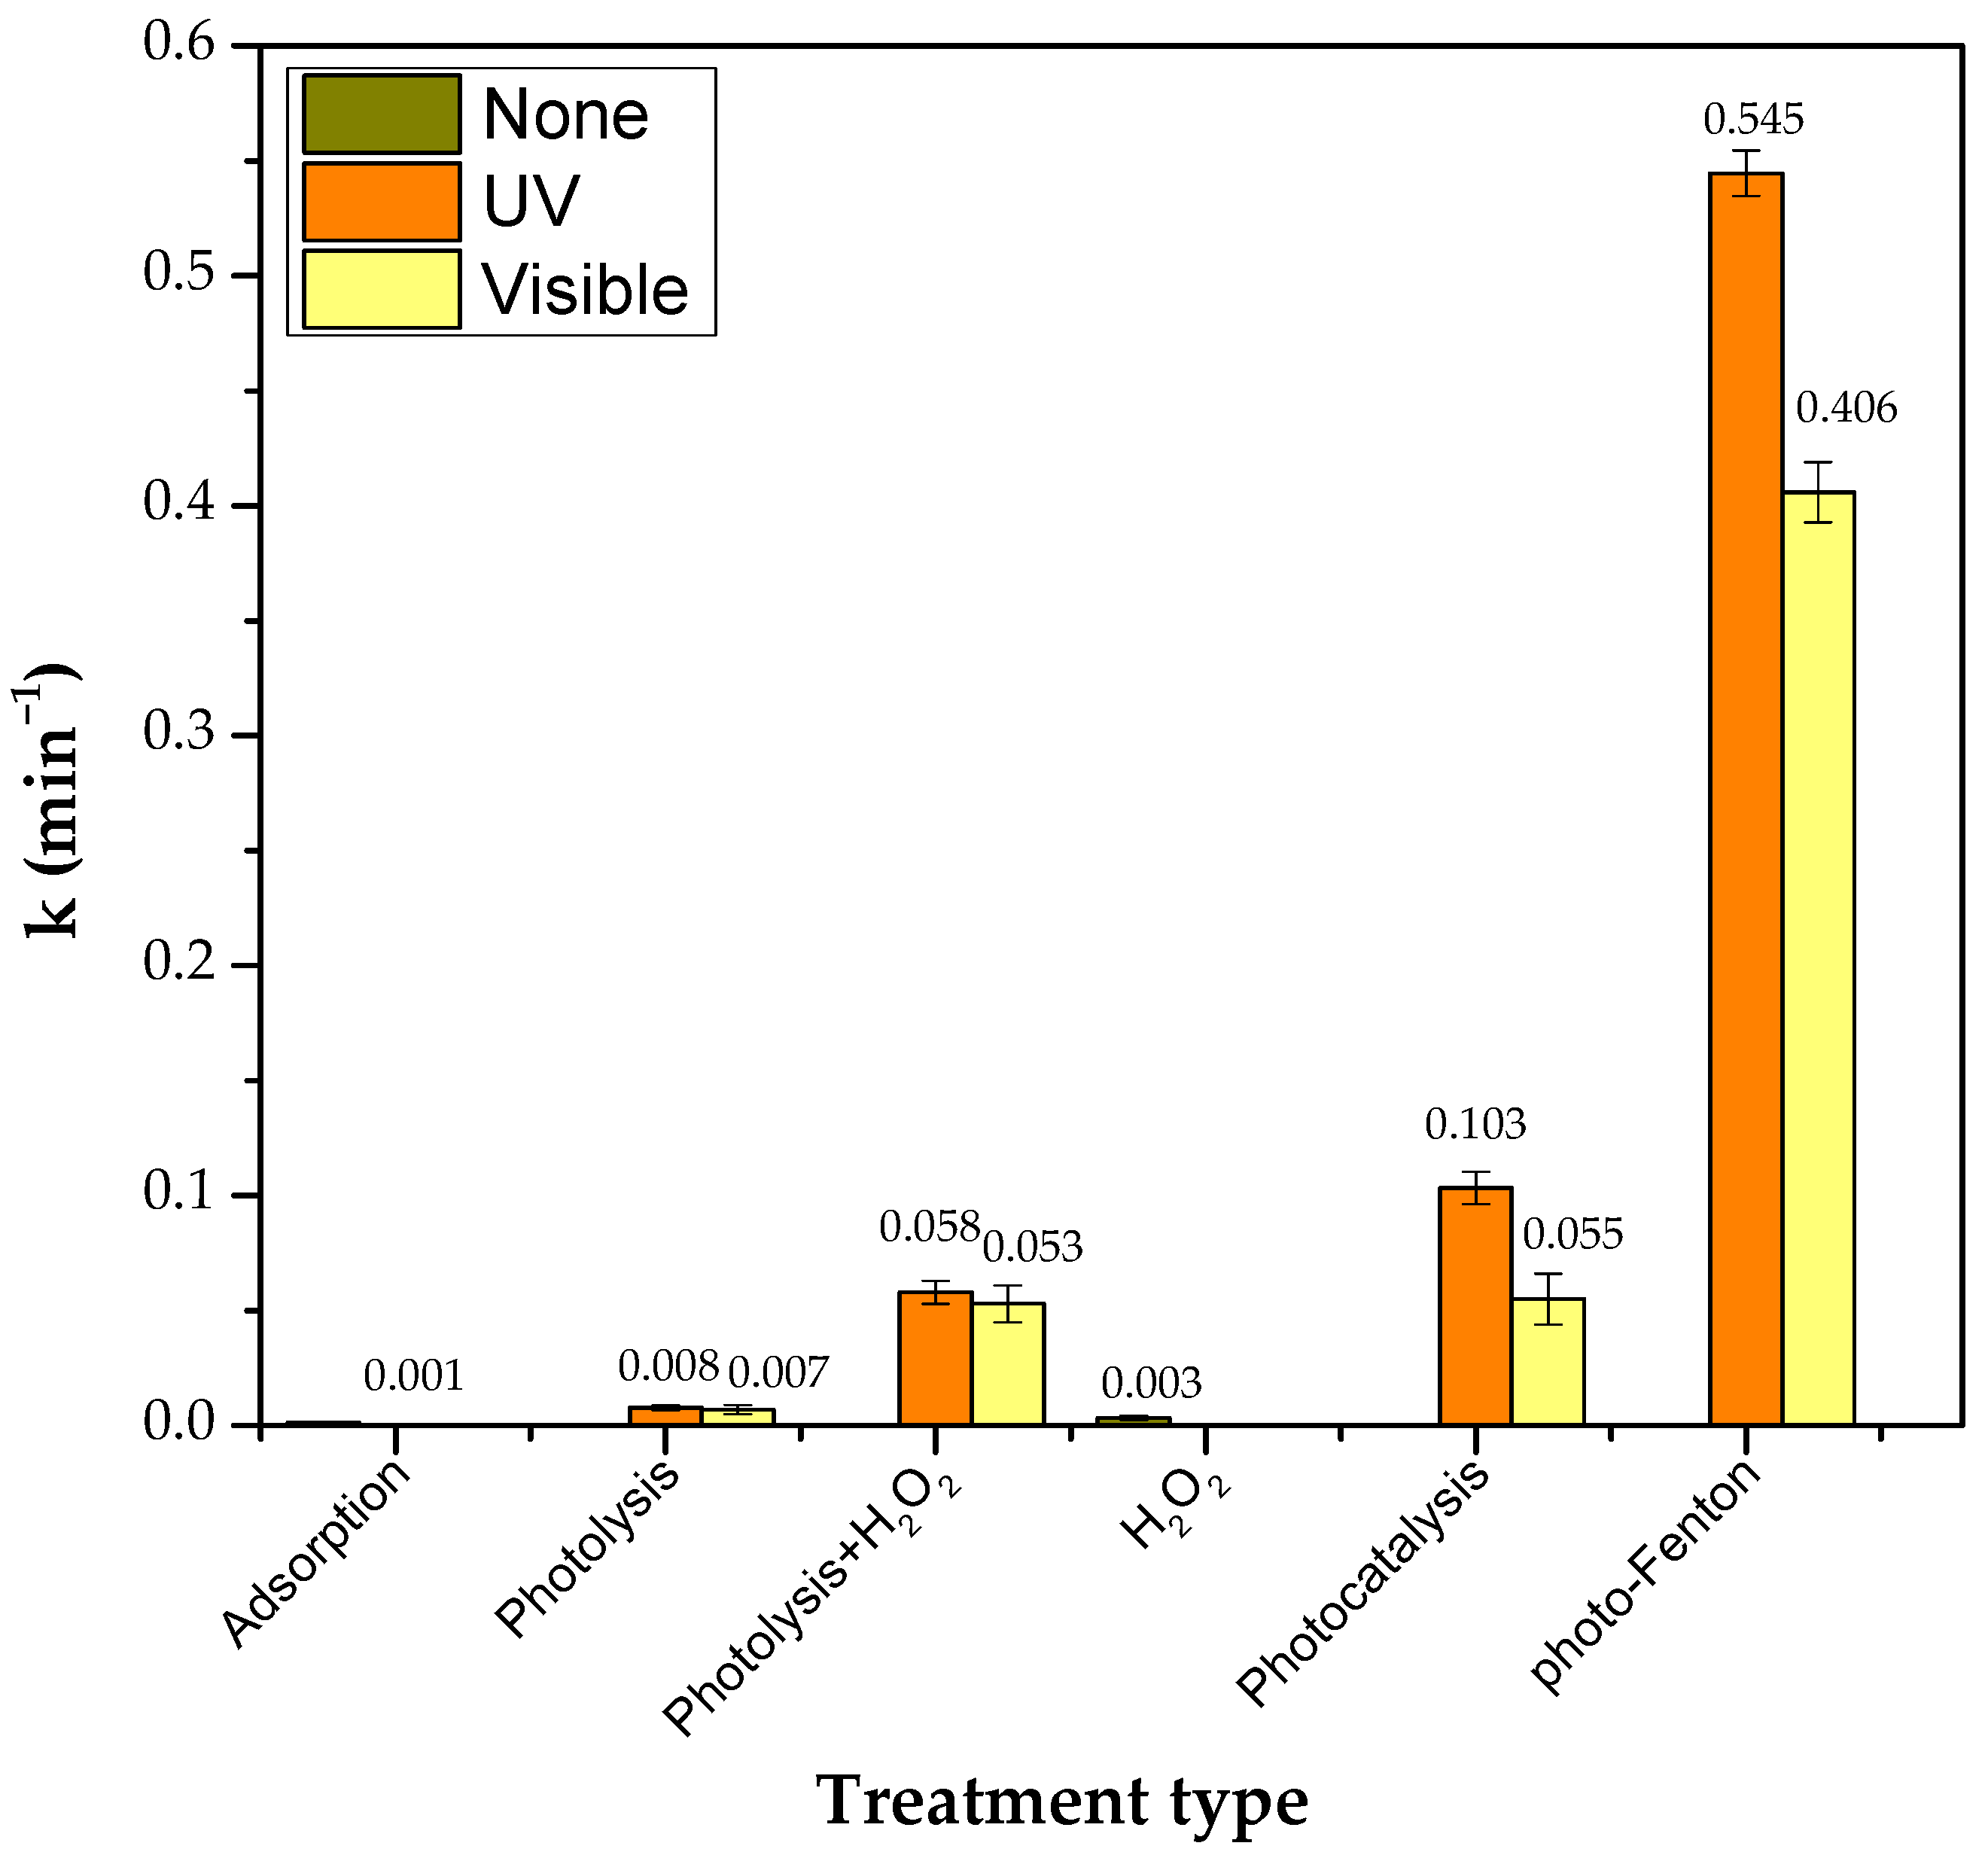
Figure 12 presents the pseudo-first-order kinetic constants of metformin degradation under all assessed reaction conditions shown in Figure 8A,B. This constant is apparent for the photo-assisted heterogeneous processes. It can be observed that in all cases, the kinetic constant is superior when using UV instead of visible light. Nevertheless, when applying photo-Fenton, the difference is only about 20%. In photocatalysis by UV light, the kinetic constant is one order of magnitude higher than when the process is activated by visible light. The photo-Fenton process being faster than the others implies a lower energy consumption than the other photo-assisted processes because the lamp does not have to be on for as much time during the photo-Fenton reaction to completely degrade MET. The same conclusion is reached when comparing the processes driven by UV or visible light. However, it must be kept in mind that the processes under visible light have the potential to become solar, thus eliminating the energy consumption by the lamps.
Table 4 presents a summary of the reaction conditions and results regarding MET degradation. It must be borne in mind that such results not only reflect the photo-catalyst activity or the oxidizing power of the added agent, i.e., hydrogen peroxide or persulfates, but they are also affected by reactor design, catalyst concentration, lamp power and wavelength, initial MET and hydrogen peroxide concentration ratio, initial pH, and reaction volume. This limits a comprehensive and straightforward comparison among the entries of Table 4. Nevertheless, some general observations can be stated.
It can be observed in Table 4 that a high MET degradation percentage, between 90 and 100%, is achieved through photocatalysis and photo-Fenton. A significant MET degradation rate of 92% when using photolysis with UV light was reported in [54]. Most works do not mention mineralization percentage, which would be more informative about the effectiveness of the reaction system. A strategy to increase the MET degradation percentage via photolysis is the addition of percarbonates [48], sulfites [33,51], persulfates [52], or hydrogen peroxide (this work). Unfortunately, not all the works in Table 4 report an apparent kinetic constant. It is worth noting, however, that the kinetic constants obtained when adding sulfur-based anions to a photolytic system [51,52] are higher than those obtained in this work at a similar wavelength. This could be influenced by persulfate being a stronger oxidant than H2O2. Also, relatively slow H2O2 decomposition into hydroxyl radicals by UV light, in Reaction (14) (see Figure 8A), could be impacting the comparison outcome.
Regarding the photo-Fenton process, only a couple of works dedicated to MET degradation were found. Those included in Table 4 deal with homogeneous photo-Fenton [45] and therefore use an acidic pH, which prevents iron precipitation. In that study, initial MET and hydrogen peroxide initial concentrations were also different to the ones used in this work. If the first-order kinetic model obtained here is applied to predict the conversion of the initial MET concentration used in [49], 100% MET degradation is obtained after the 90 min of reaction also used in [49] with FeCl3. This must be taken with caution since this outcome might be biased by all factors previously mentioned. A similar phenomenon is observed with the results obtained under photocatalysis. Nevertheless, the results attained in this work when using photo-Fenton and photocatalysis driven by UV and Vis light seem very promising, with the added advantages of catalyst recovery and activation under visible light. It can be observed that an additional advantage of this work is that metformin degradation reaches 95–100% at a circumneutral pH.

3.3. Proposed Reaction Pathway and MET Oxidation By-Products

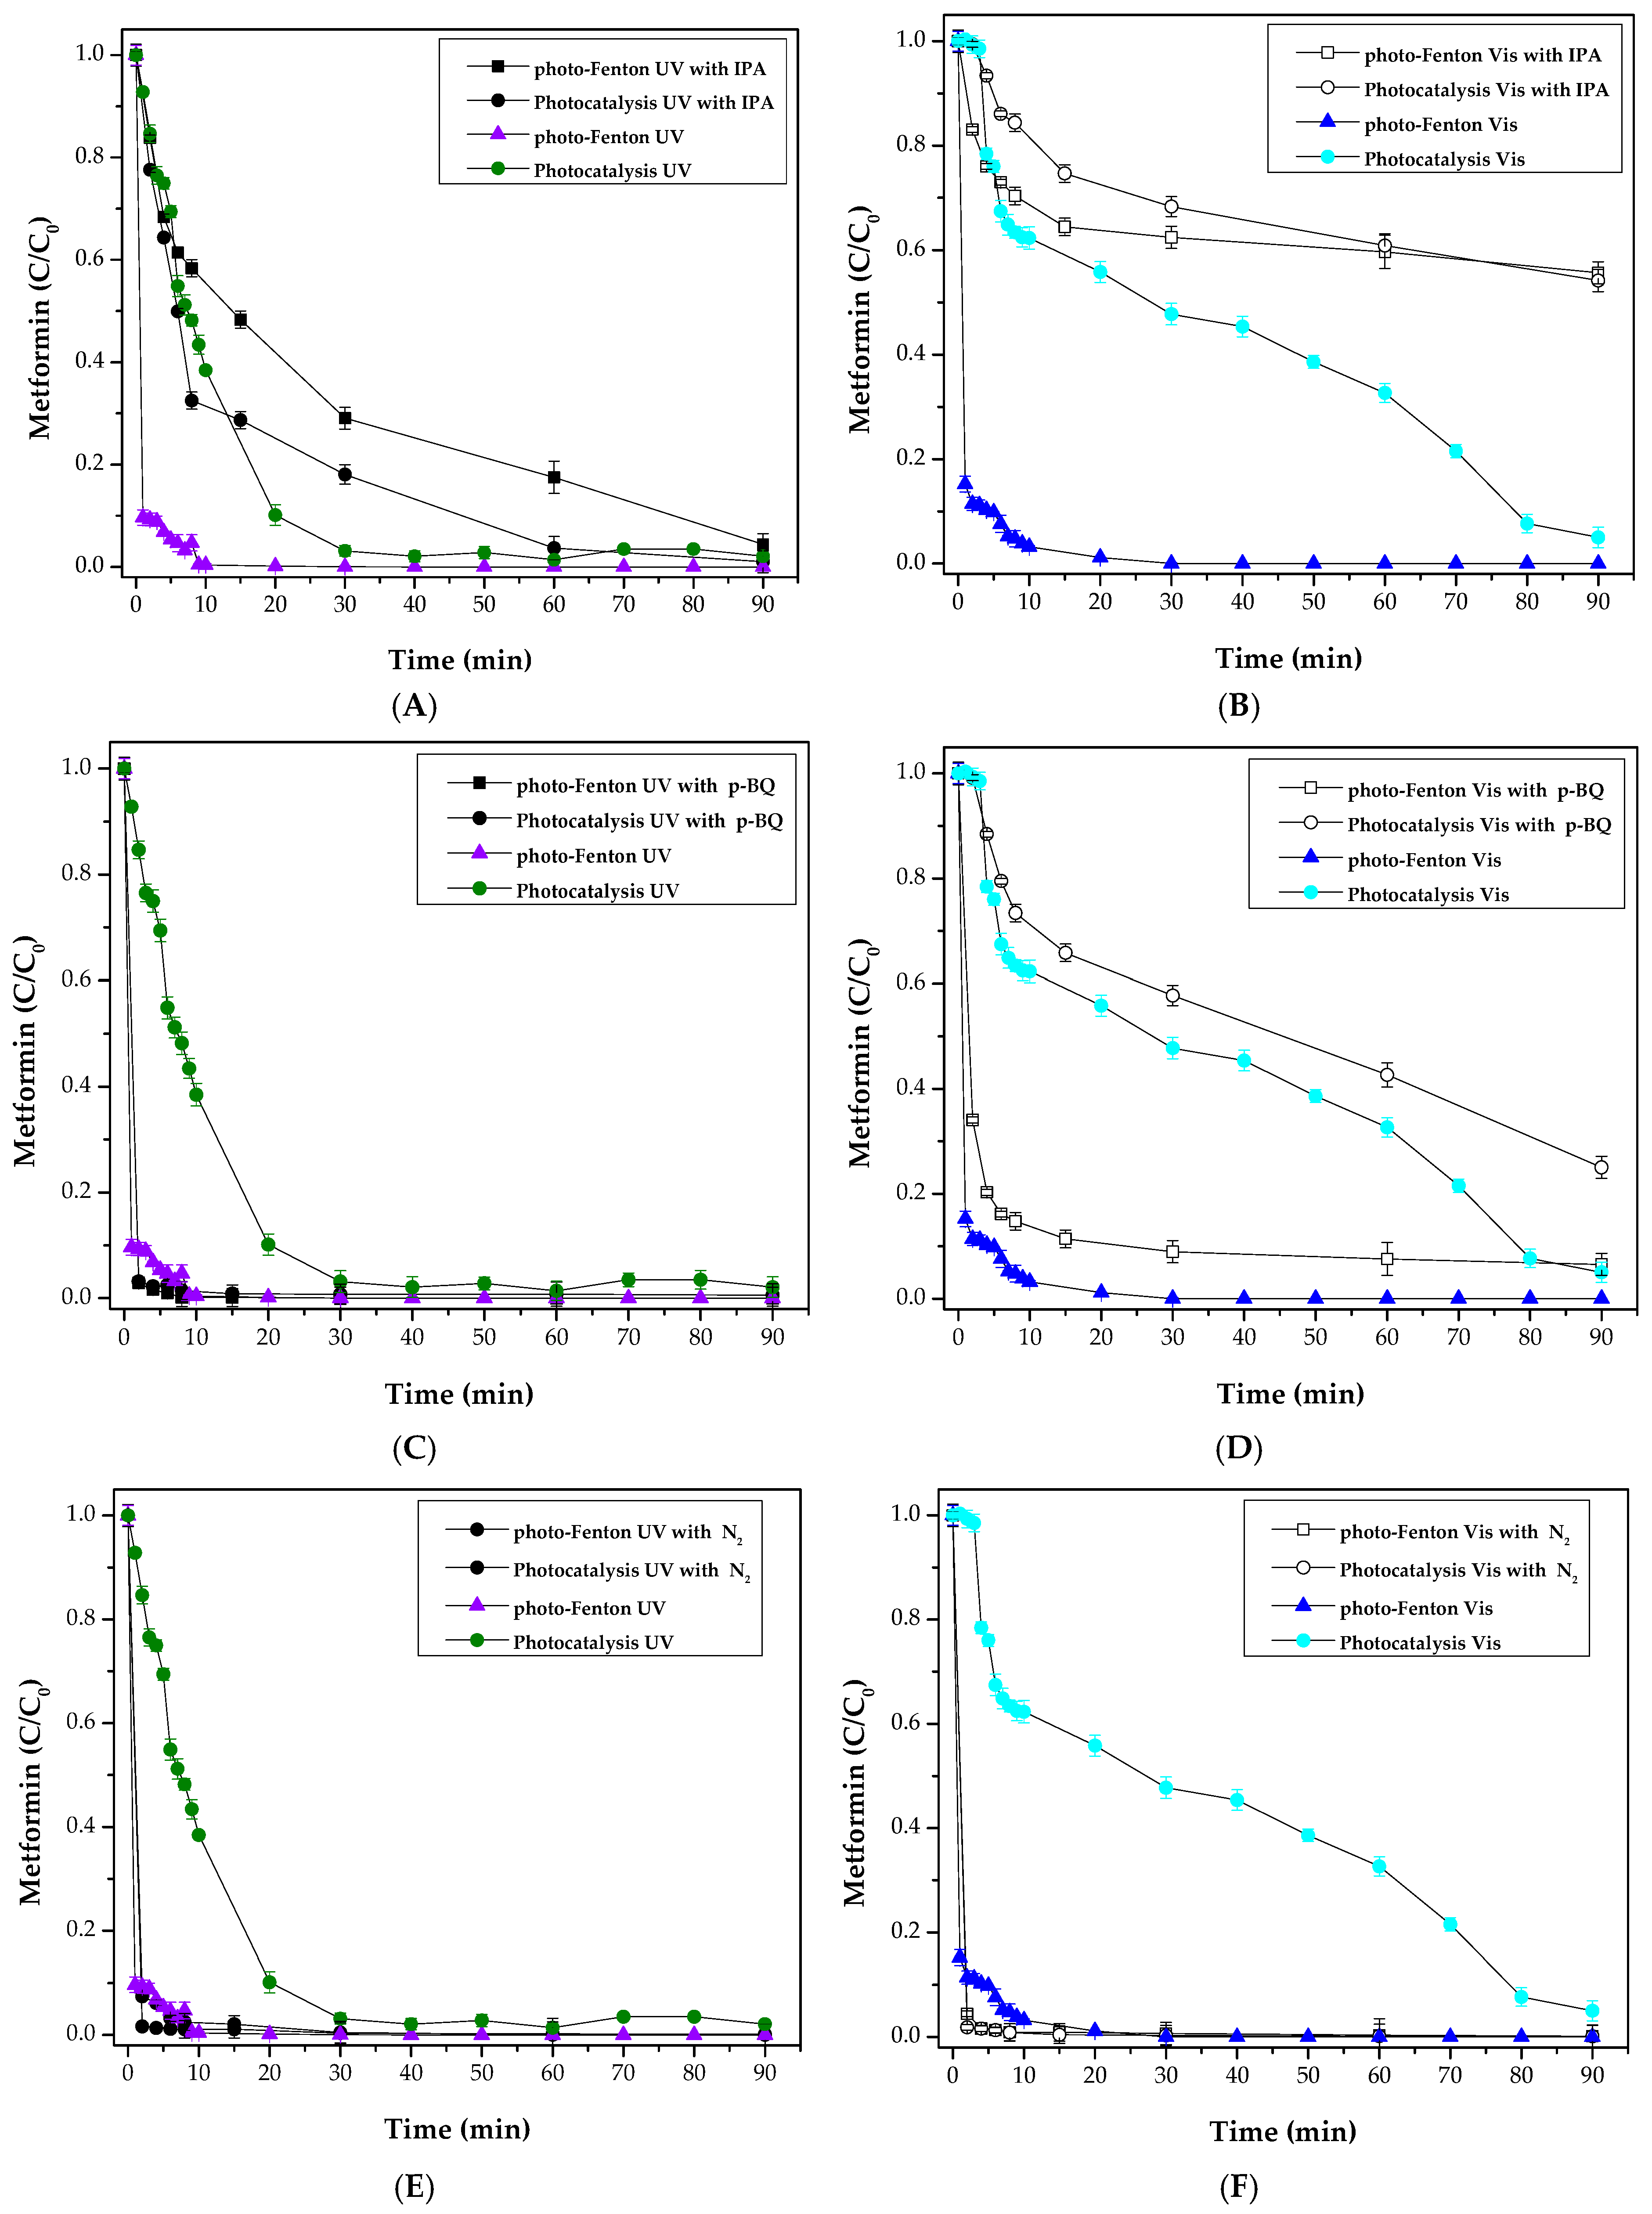
Figure 13A,B show the effect of adding isopropanol (IPA), a well-known scavenger of hydroxyl radicals (HR), on the normalized concentration temporal profile of MET under photo-Fenton and photocatalysis conditions. The addition of IPA to the photo-Fenton process under UV light (PFUV) (Figure 13A) decreased the initial reaction rate by about 6 times. Under Vis light (Figure 13B), the contribution of HRs was higher than with UV since MET degradation decreased about 55%. Since MET oxidation was not totally inhibited in any of the cases, the participation of other ROS, like the superoxide and hydroperoxyl radicals and holes in the valence band, was elucidated through the addition of p-BQ and N2.
p-BQ traps both radicals, superoxide and hydroperoxyl, via a simple electron transfer mechanism [21,62,63],
BQ + O 2 • − → B Q • − + O 2
BQ + H O 2 • → B Q • − + O 2 + H +
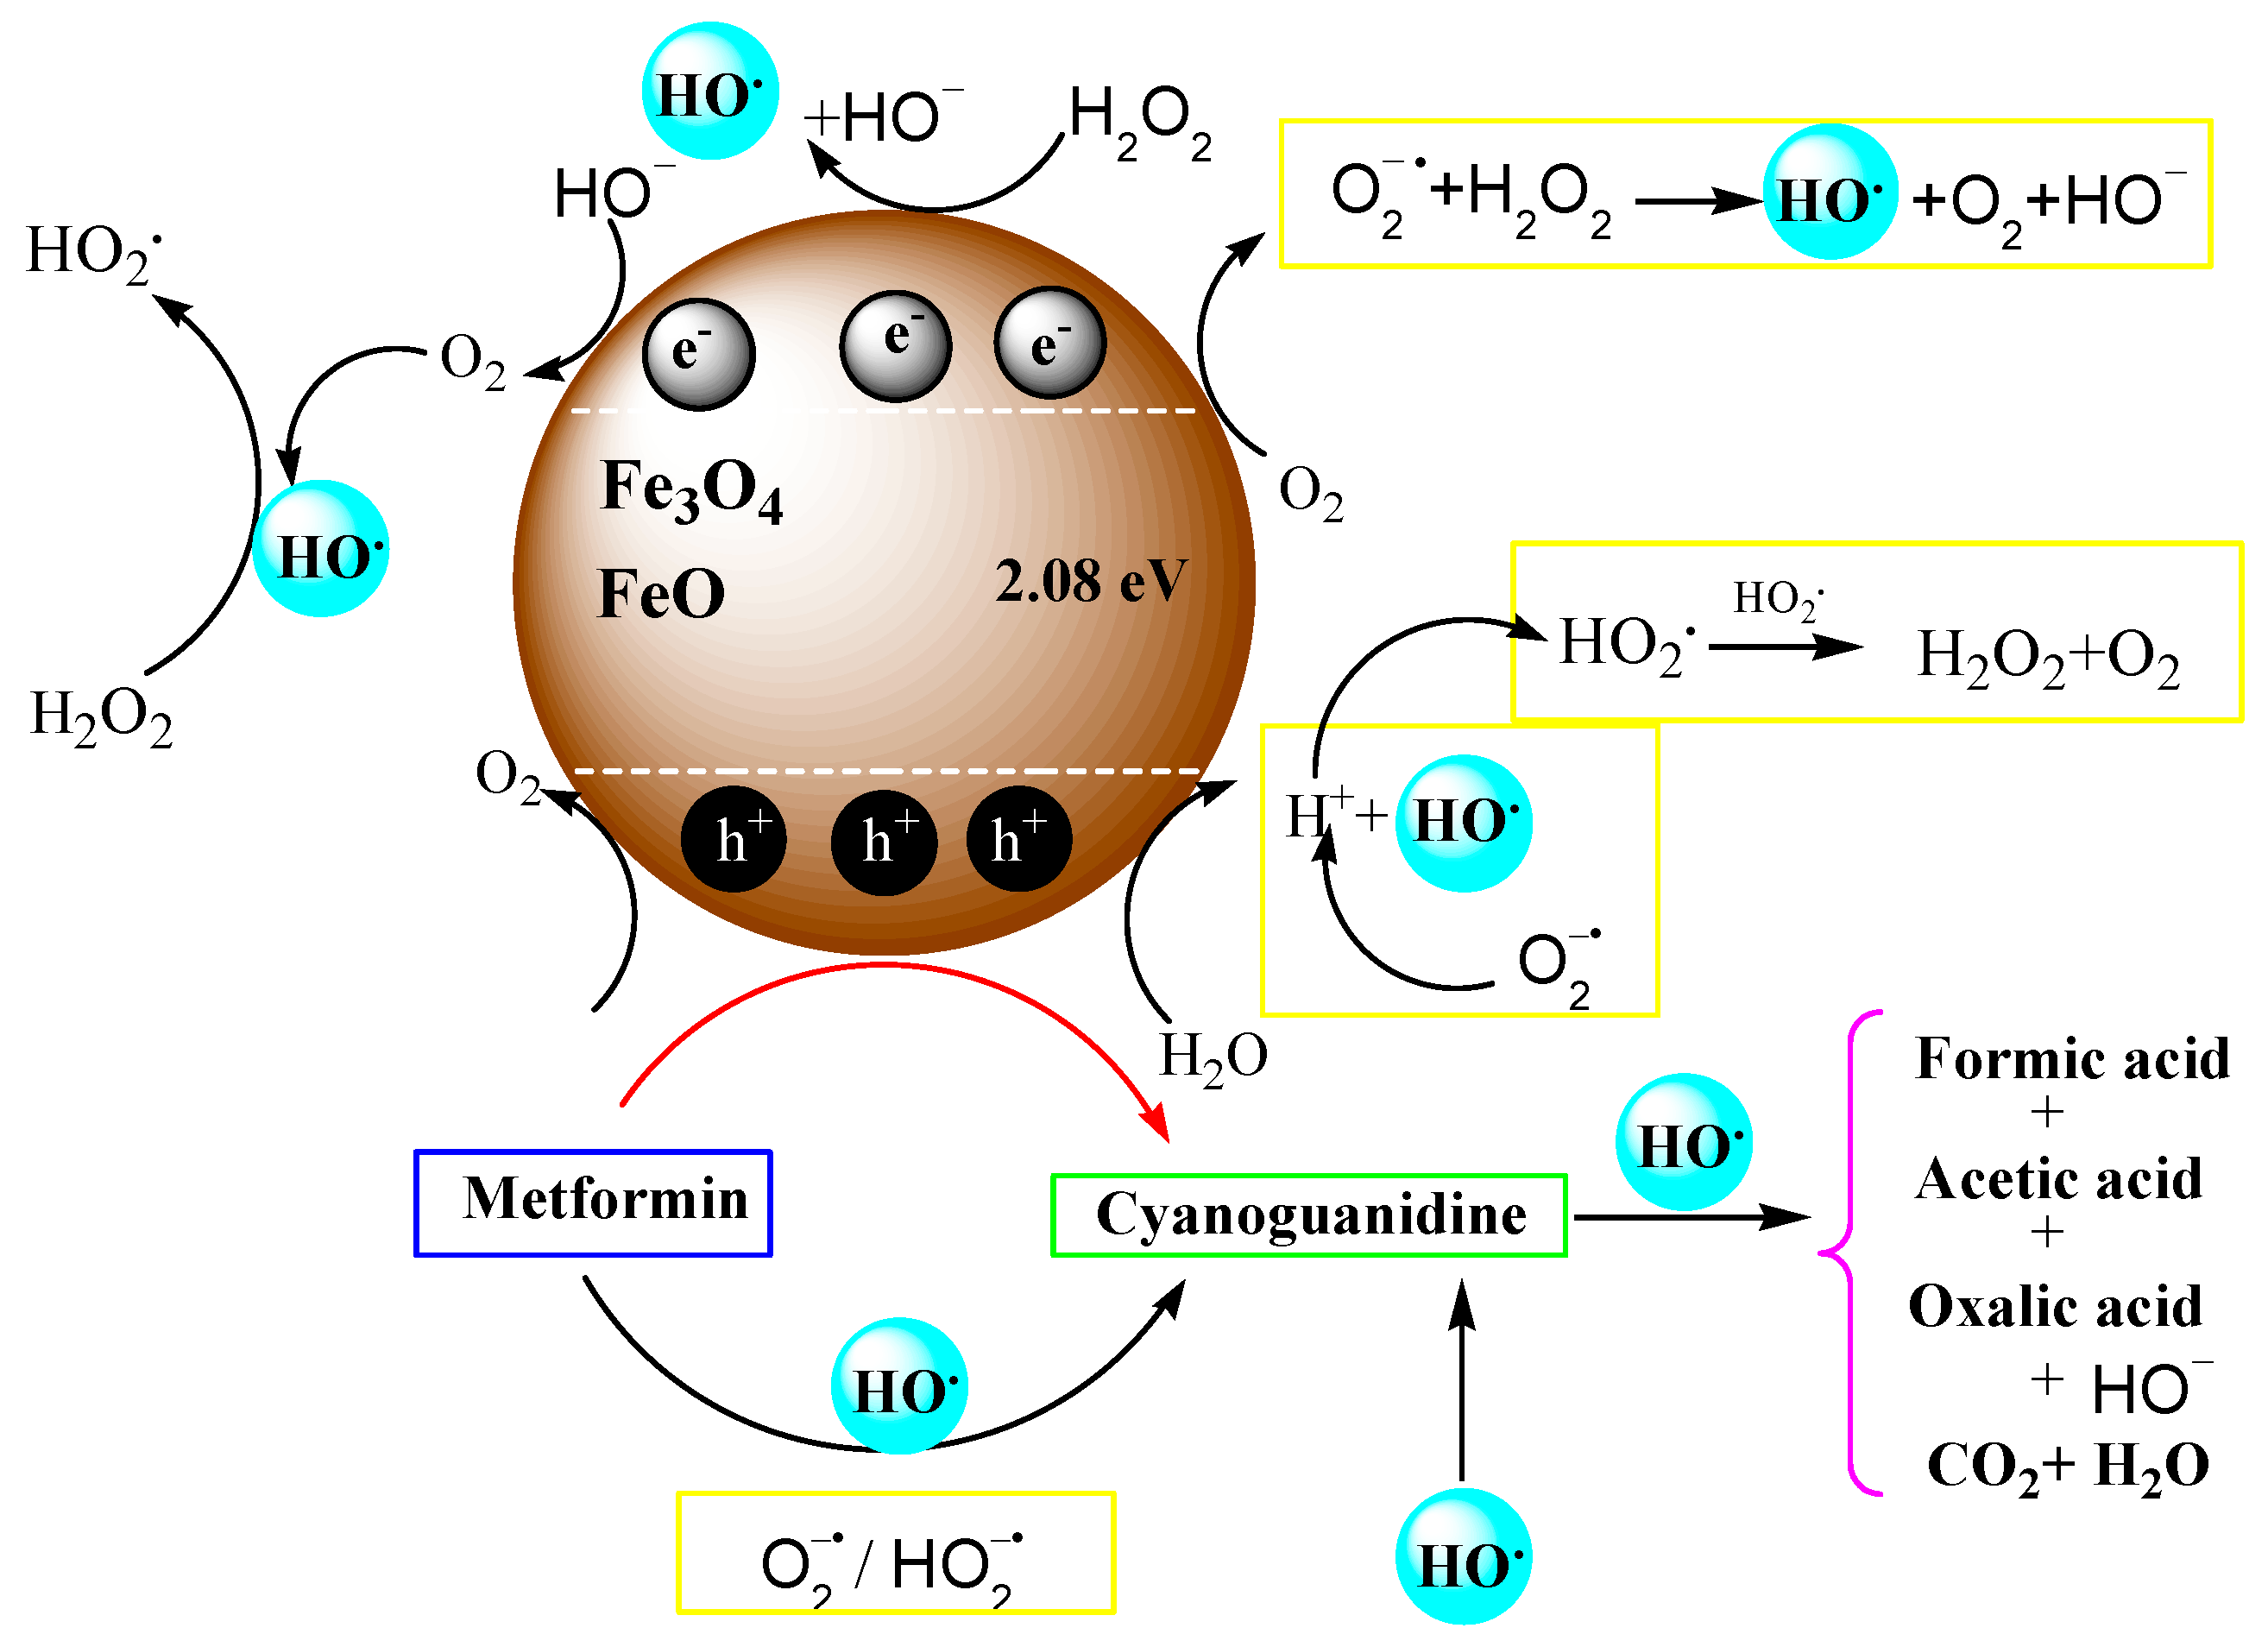
Therefore, p-BQ addition is usually expected to lead to a reduction in organic compound oxidation. Figure 13C shows otherwise, since there PFUV induces no effect on the MET degradation percentage. Figure 13D shows that there is a reduction of 10% in MET degradation induced by PFV. This leads us to the conclusion that superoxide anions contribute to MET degradation when photo-Fenton is activated by Vis light but not when it is driven by UV light. Therefore, the reactions where these species are contributing to oxidation are enclosed in the yellow squares in Figure 14.
Figure 13E,F show the effect of bubbling the solution with nitrogen before adding the catalyst and switching on the lamp. The aim of this was to deoxygenate the reacting solution. In the PFUV system, oxygen deprivation produceds a similar effect to adding p-BQ. This effect was also observed for photocatalysis UV, photocatalysis Vis, and photo-Fenton Vis. This leads us to conclude that superoxide radicals limit MET degradation in heterogeneous processes driven by UV or Vis light.
Oxygen might be limiting the production of hydroxyl radicals by competing with H2O2 for e− (Reaction (20)), thus inhibiting Reaction (22). It is worth pointing out that the kinetic constants of both reactions, (20) and (22), are of the same order of magnitude. These reactions are more likely to occur than Reactions (23) and (24) since these are slower [55]. In addition, depriving the system of oxygen will prevent the production of the superoxide radical and this will also free valence band holes (h+) that otherwise would produce singlet oxygen through Reaction (27) [64]. Thus, without oxygen, such valence holes are free to directly oxidize MET. The direct oxidation of metformin in valence holes has been previously reported in [21,65], albeit on TiO2, and is acknowledged in Figure 14. On the other hand, metformin oxidation by superoxide free radicals has been previously discarded [66].
O 2 • − + h + → O 2 1
Regarding photocatalysis driven by UV light, the effect of adding IPA was not as dramatic as in photo-Fenton—see Figure 13A. It was observed that in the first 10 min of the reaction, the MET degradation rate of the photocatalytic process with IPA was practically the same than under photocatalysis without any scavenger. A MET degradation rate of 48% was achieved with IPA addition and 43% was achieved without any scavenger. After this time, the profile with IPA slowed down, indicating a mechanism dominated by hydroxyl radicals. Although at twice the time than photocatalysis alone, complete MET degradation was attained with IPA. This supports the conclusion of valence band holes (h+) contributing significantly to MET oxidation, as previously observed with TiO2 [65]. This also suggests that hydroxyl radicals contribute to MET oxidation but not to the same extent as in photo-Fenton. Under visible light, this phenomenon is reduced (Figure 13B) and the results suggest a more important contribution of hydroxyl radicals in this case. This can be concluded since the MET degradation was about 95% without IPA and only 45% with the hydroxyl radical scavenger.
The important contribution of h+ to MET oxidation was verified with the addition of p-BQ to the photocatalytic system. This caused a behavior superior to photo-Fenton UV (Figure 13C). This suggests that superoxide anions compete with MET for the same active site, h+. This is not the case under visible light (Figure 13D), where it can be observed that both processes, photo-Fenton and photocatalysis, were delayed when adding p-BQ. It is noteworthy that while 95% MET degradation is achieved with PCV, only 75% is obtained when the superoxide anions are trapped using p-BQ. Thus, the contribution of these species to the whole process is acknowledged and is illustrated by yellow blocks in Figure 14. The contribution of these species is more important in the photocatalytic process than in the photo-Fenton.
Based on the information discussed above, Figure 14 summarizes the plausible reactions proceeding in the assessed system under UV and Vis light. The yellow blocks indicate reactions and species contributing to MET oxidation under Vis light-driven processes. As illustrated in Figure 14, the role of magnetite and FeO is not only to provide the active sites to chemisorb hydrogen peroxide but also to complete the Fenton reaction to produce hydroxyl radicals and then oxidize metformin. Their semi-conductor character allows the generation of other active sites, h+, to complete MET oxidation.
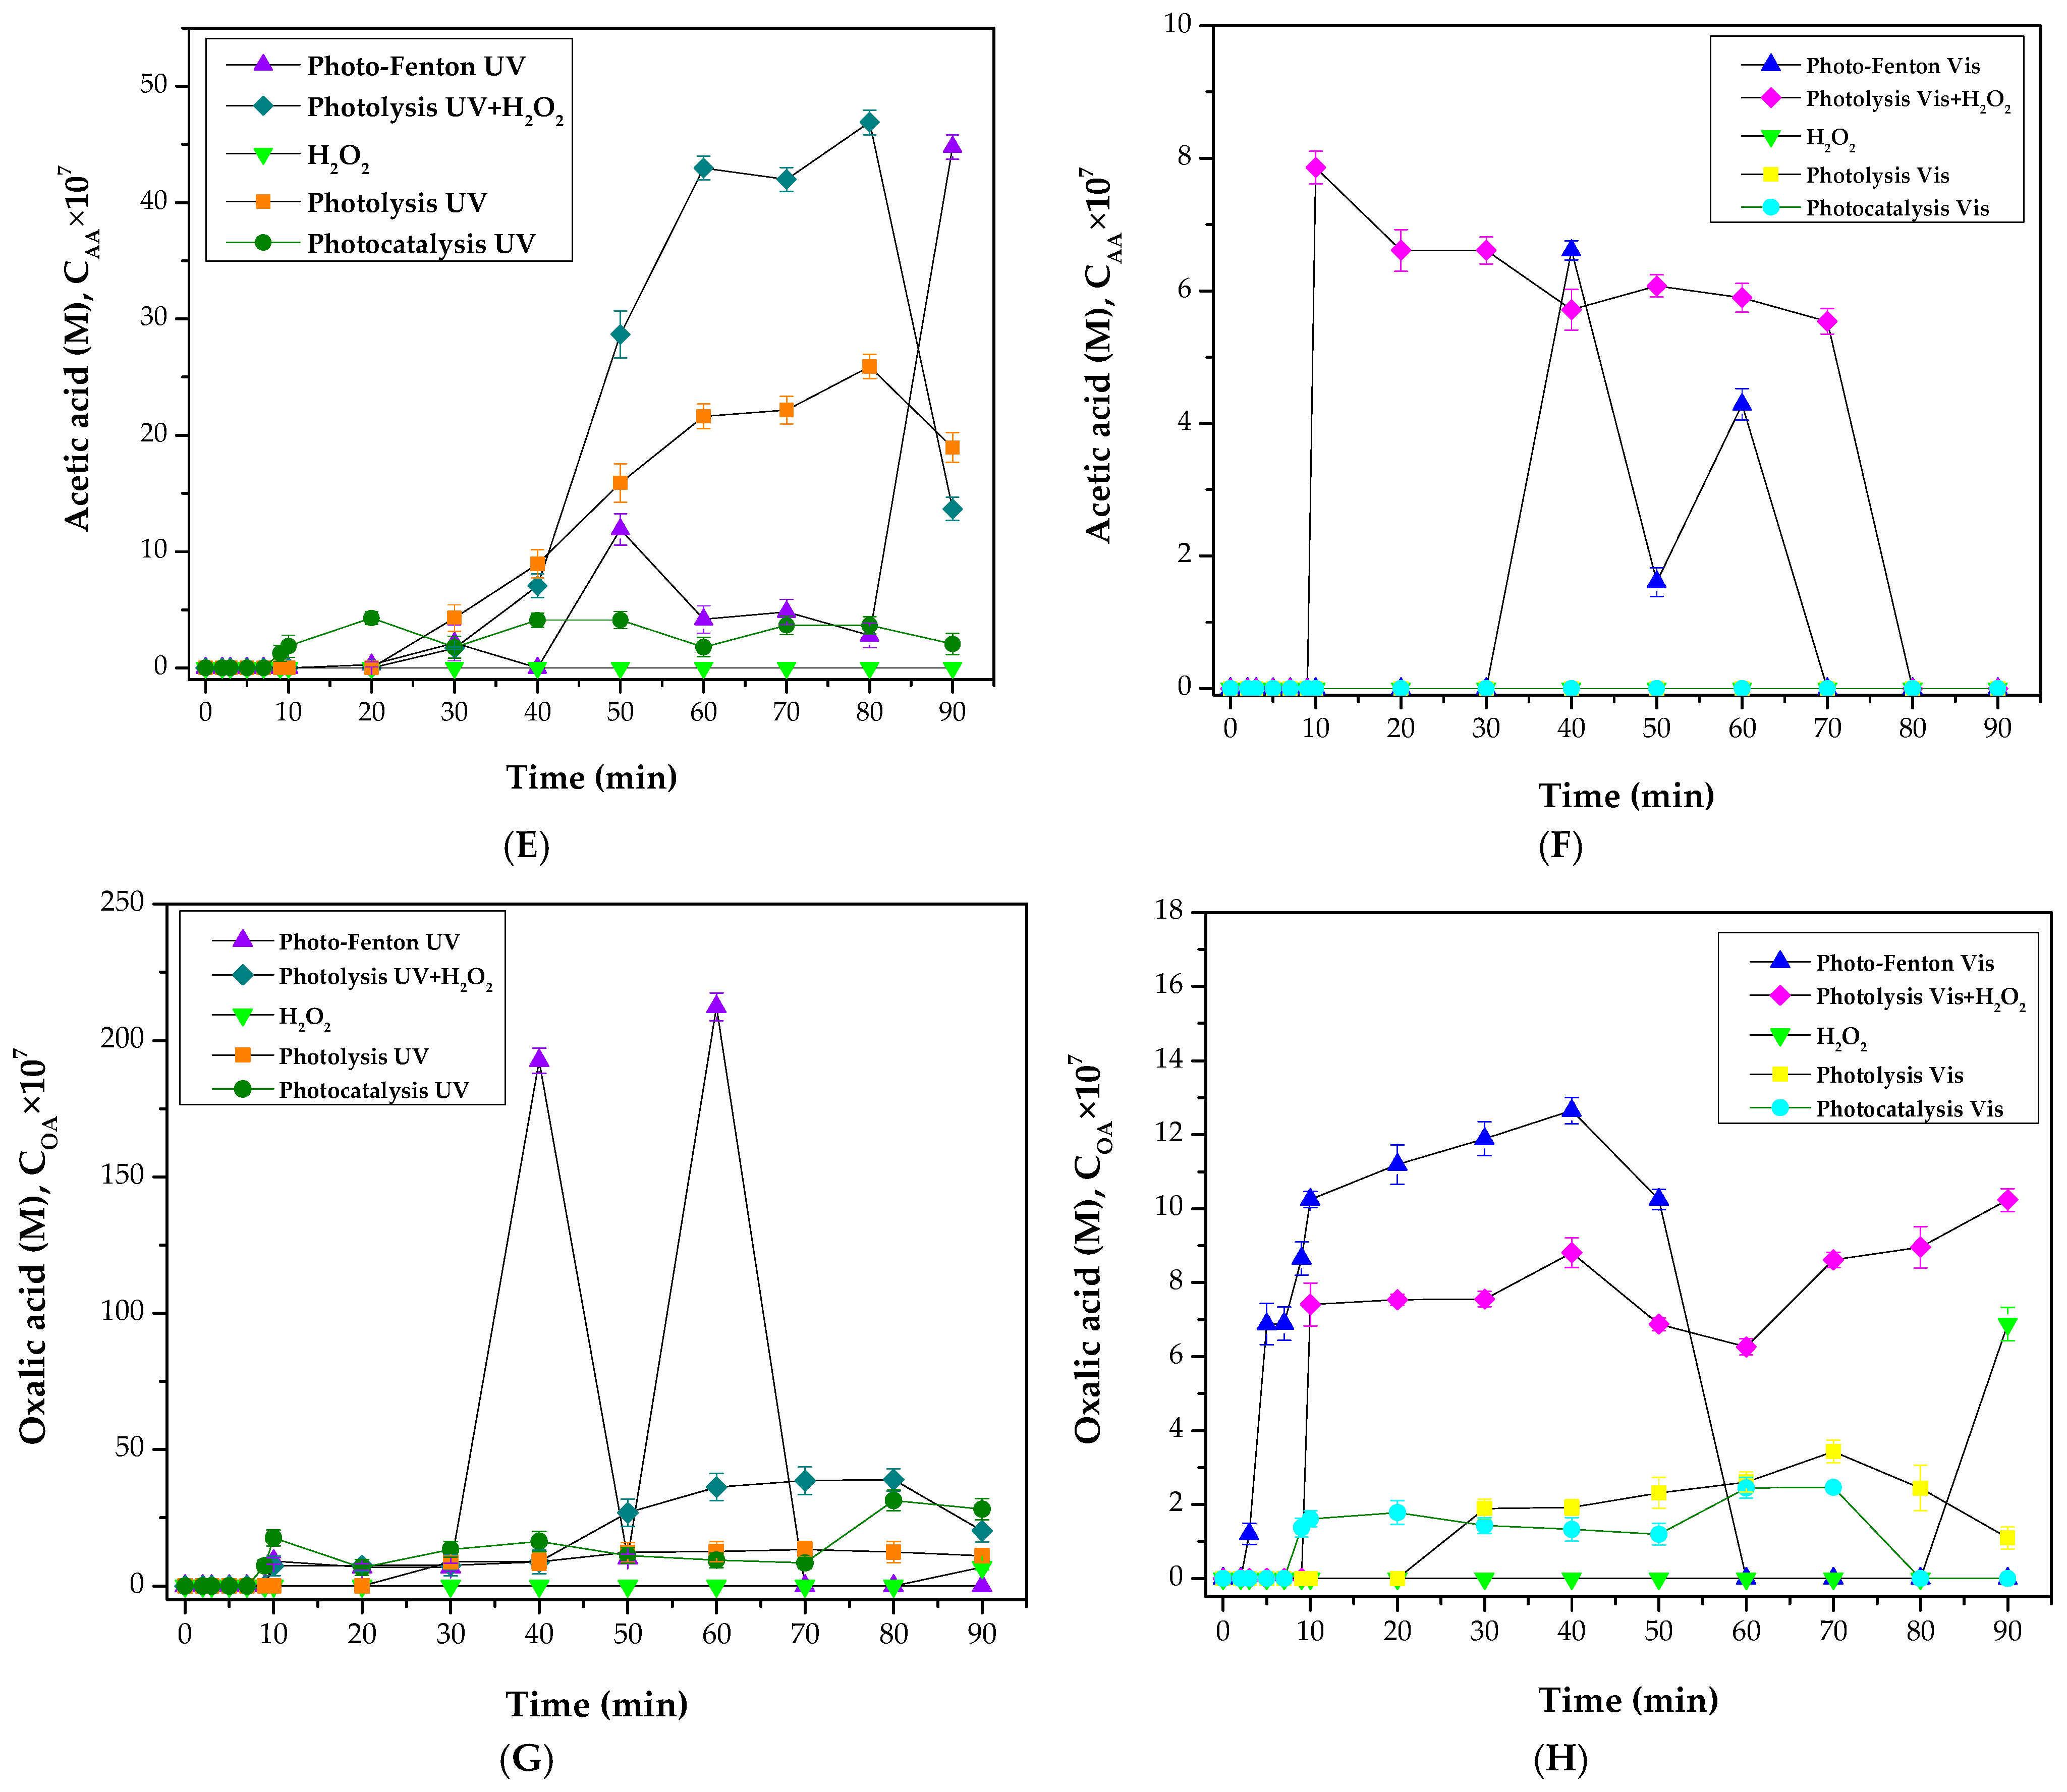
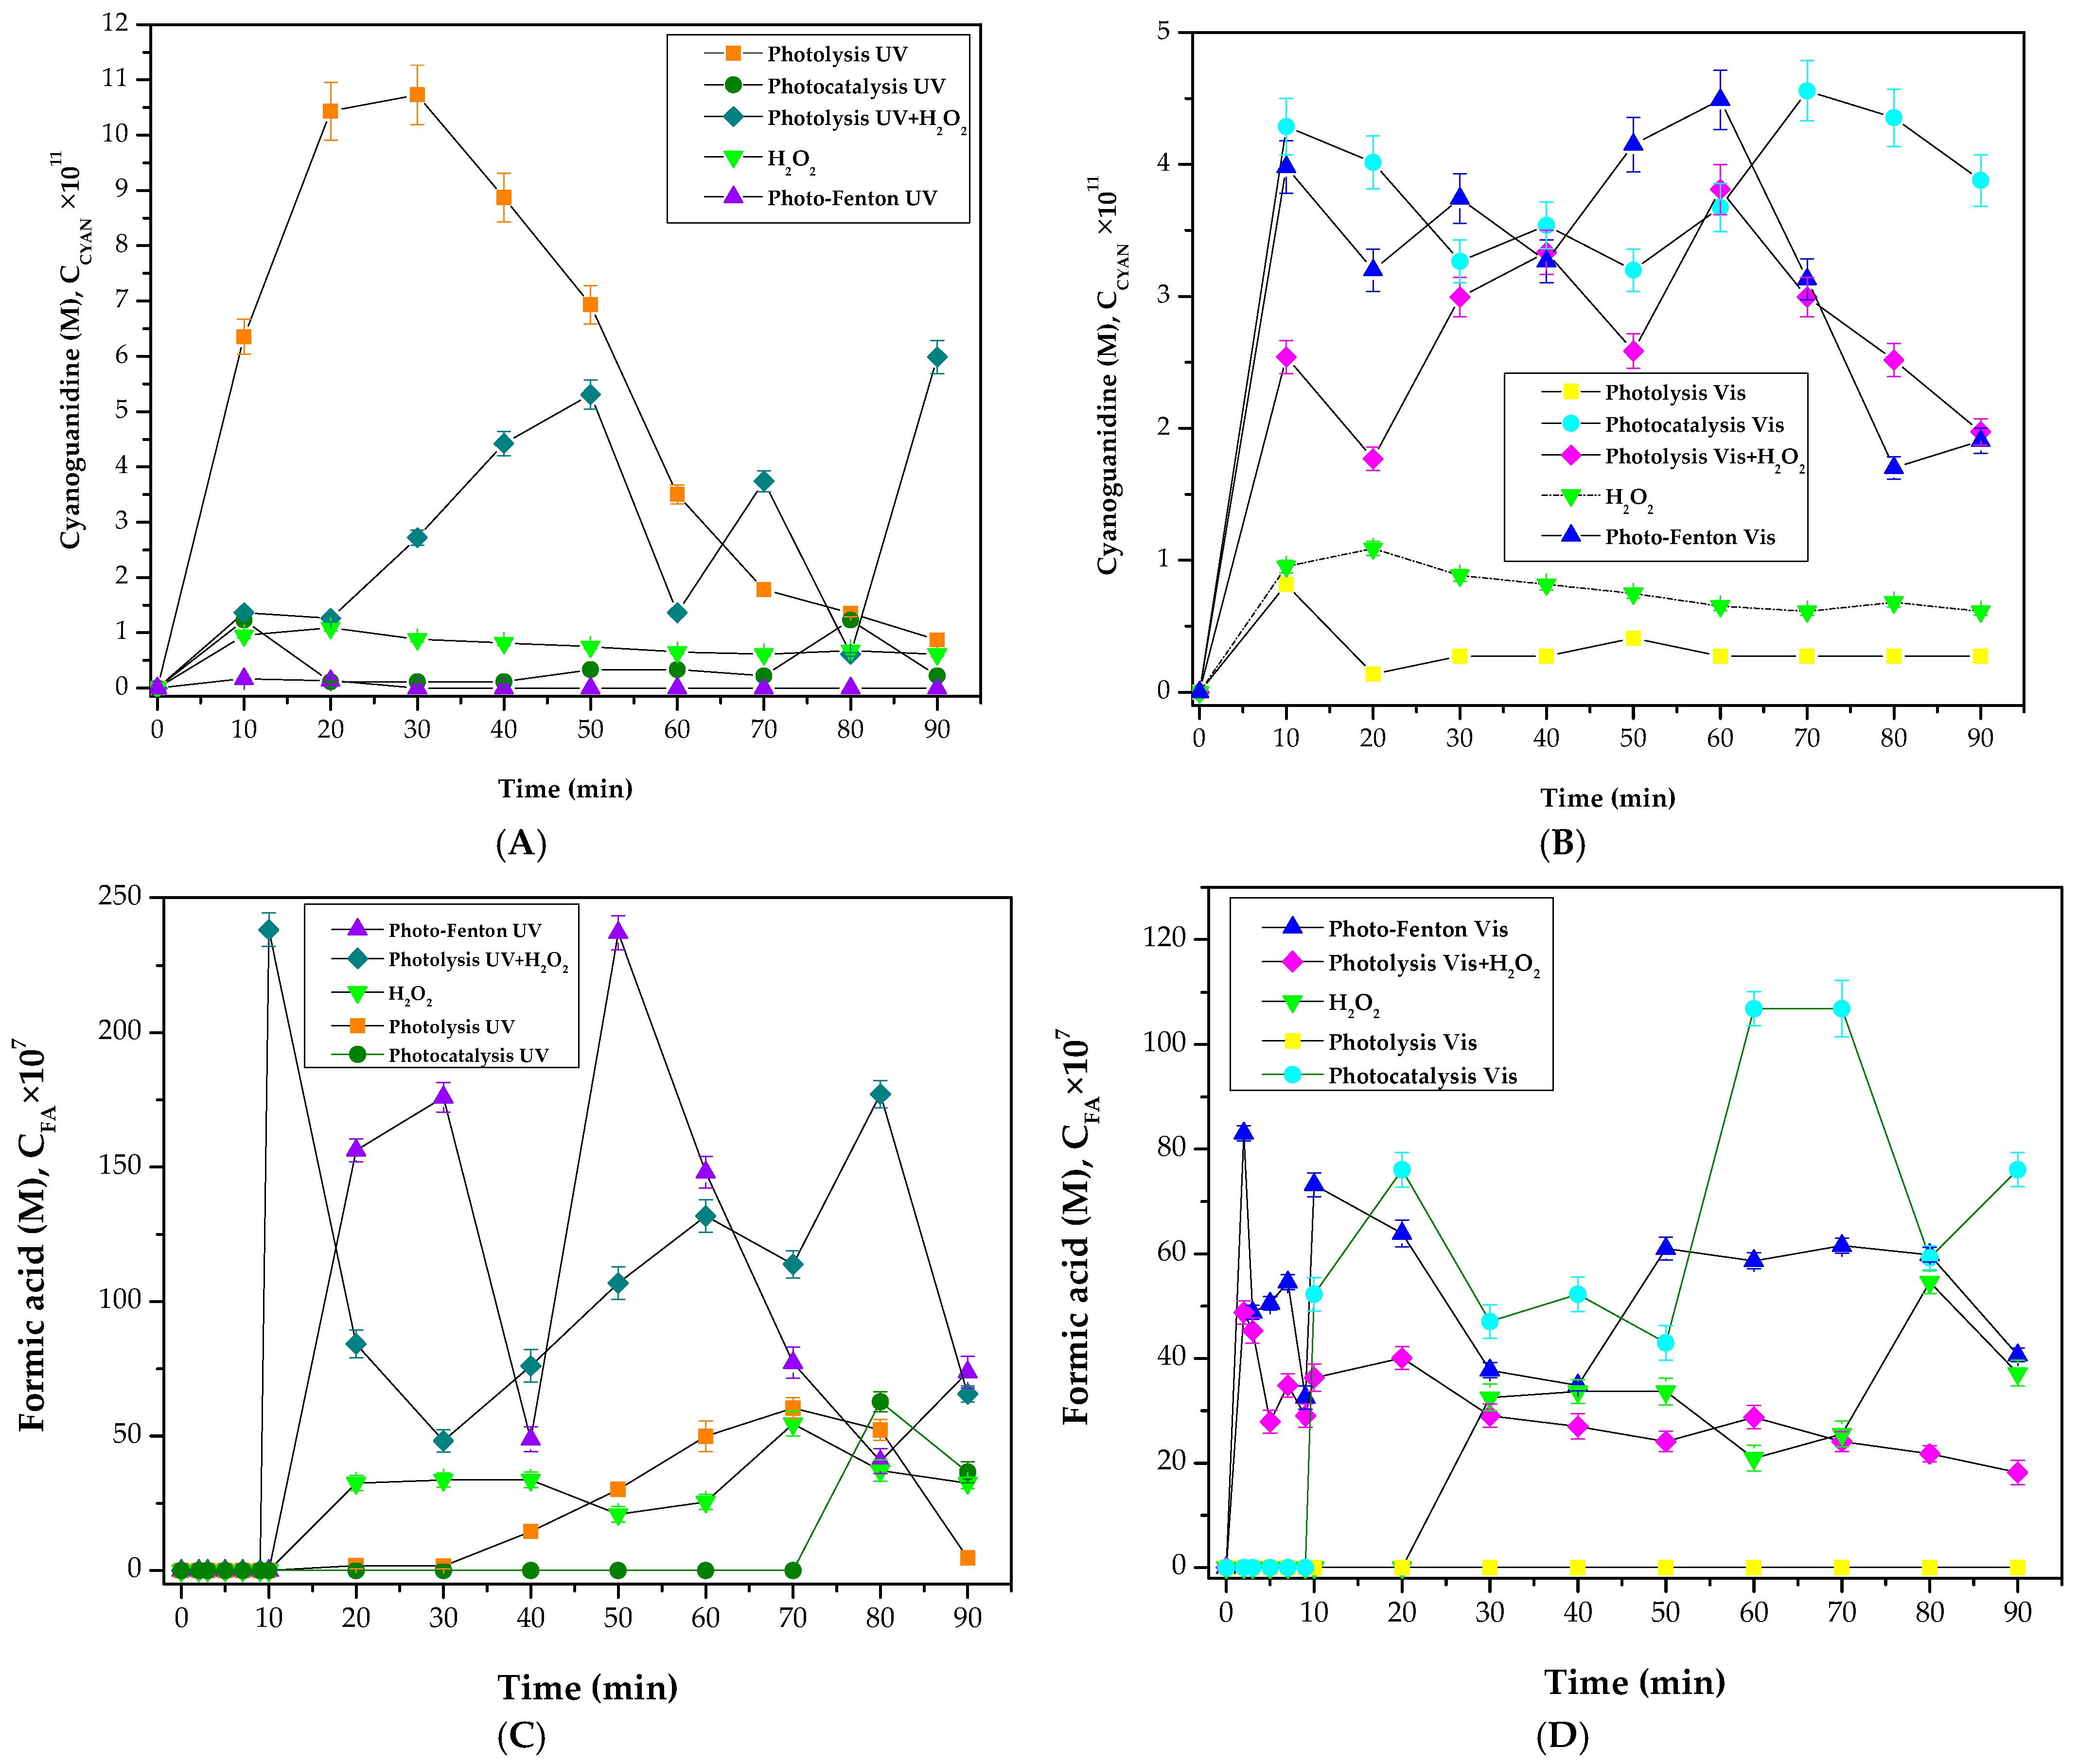
Figure 15 shows the by-product distribution observed with each one of the applied processes. In all cases, it can be observed that the first by-product was cyanoguanidine, followed by the production of carboxylic acids. It is worth noting that the maximum concentration of cyanoguanidine, 10.8 × 10⁻¹¹ mol·L−1, was determined for the photolytic process driven by UV light. This means that a lower amount of HRs was produced by this method since the MET and cyanoguanidine (CYAN) oxidation was led by hydroxyl radicals. Thus, the results in Figure 15A also suggest that the amount of hydroxyl radicals produced by the PFUV process is sufficient not only to readily degrade MET but also to readily degrade CYAN. This might also explain that the highest concentration of carboxylic acids, i.e., formic, acetic, and oxalic, was found with the PFUV: 240 × 10−7 mol·L−1, 45 × 10−7 mol·L−1 and 215 × 10−7 mol·L−1, respectively. It is worth noting, however, that the temporal profiles shown in Figure 15 demonstrate not only the production of carboxylic acids as intermediaries of MET oxidation by the assessed photochemical processes, but they also show their removal, mainly by photo-Fenton.
In an ecotoxicological study conducted by Neamt et al. in 2014 [67], it was demonstrated that by-products such as oxalic acid, oxamic acid, maleic acid, and guanilylurea (the main degradation product of metformin) are more toxic to the alga Chlamydomonas reinhardtii than metformin itself. Thus, from this study and with the final concentrations of carboxylic acids and cyanoguanidine shown in Figure 15, the final toxicity of the treated solutions could be inferred, and the lowest toxicity might be associated with the photo-Fenton process.
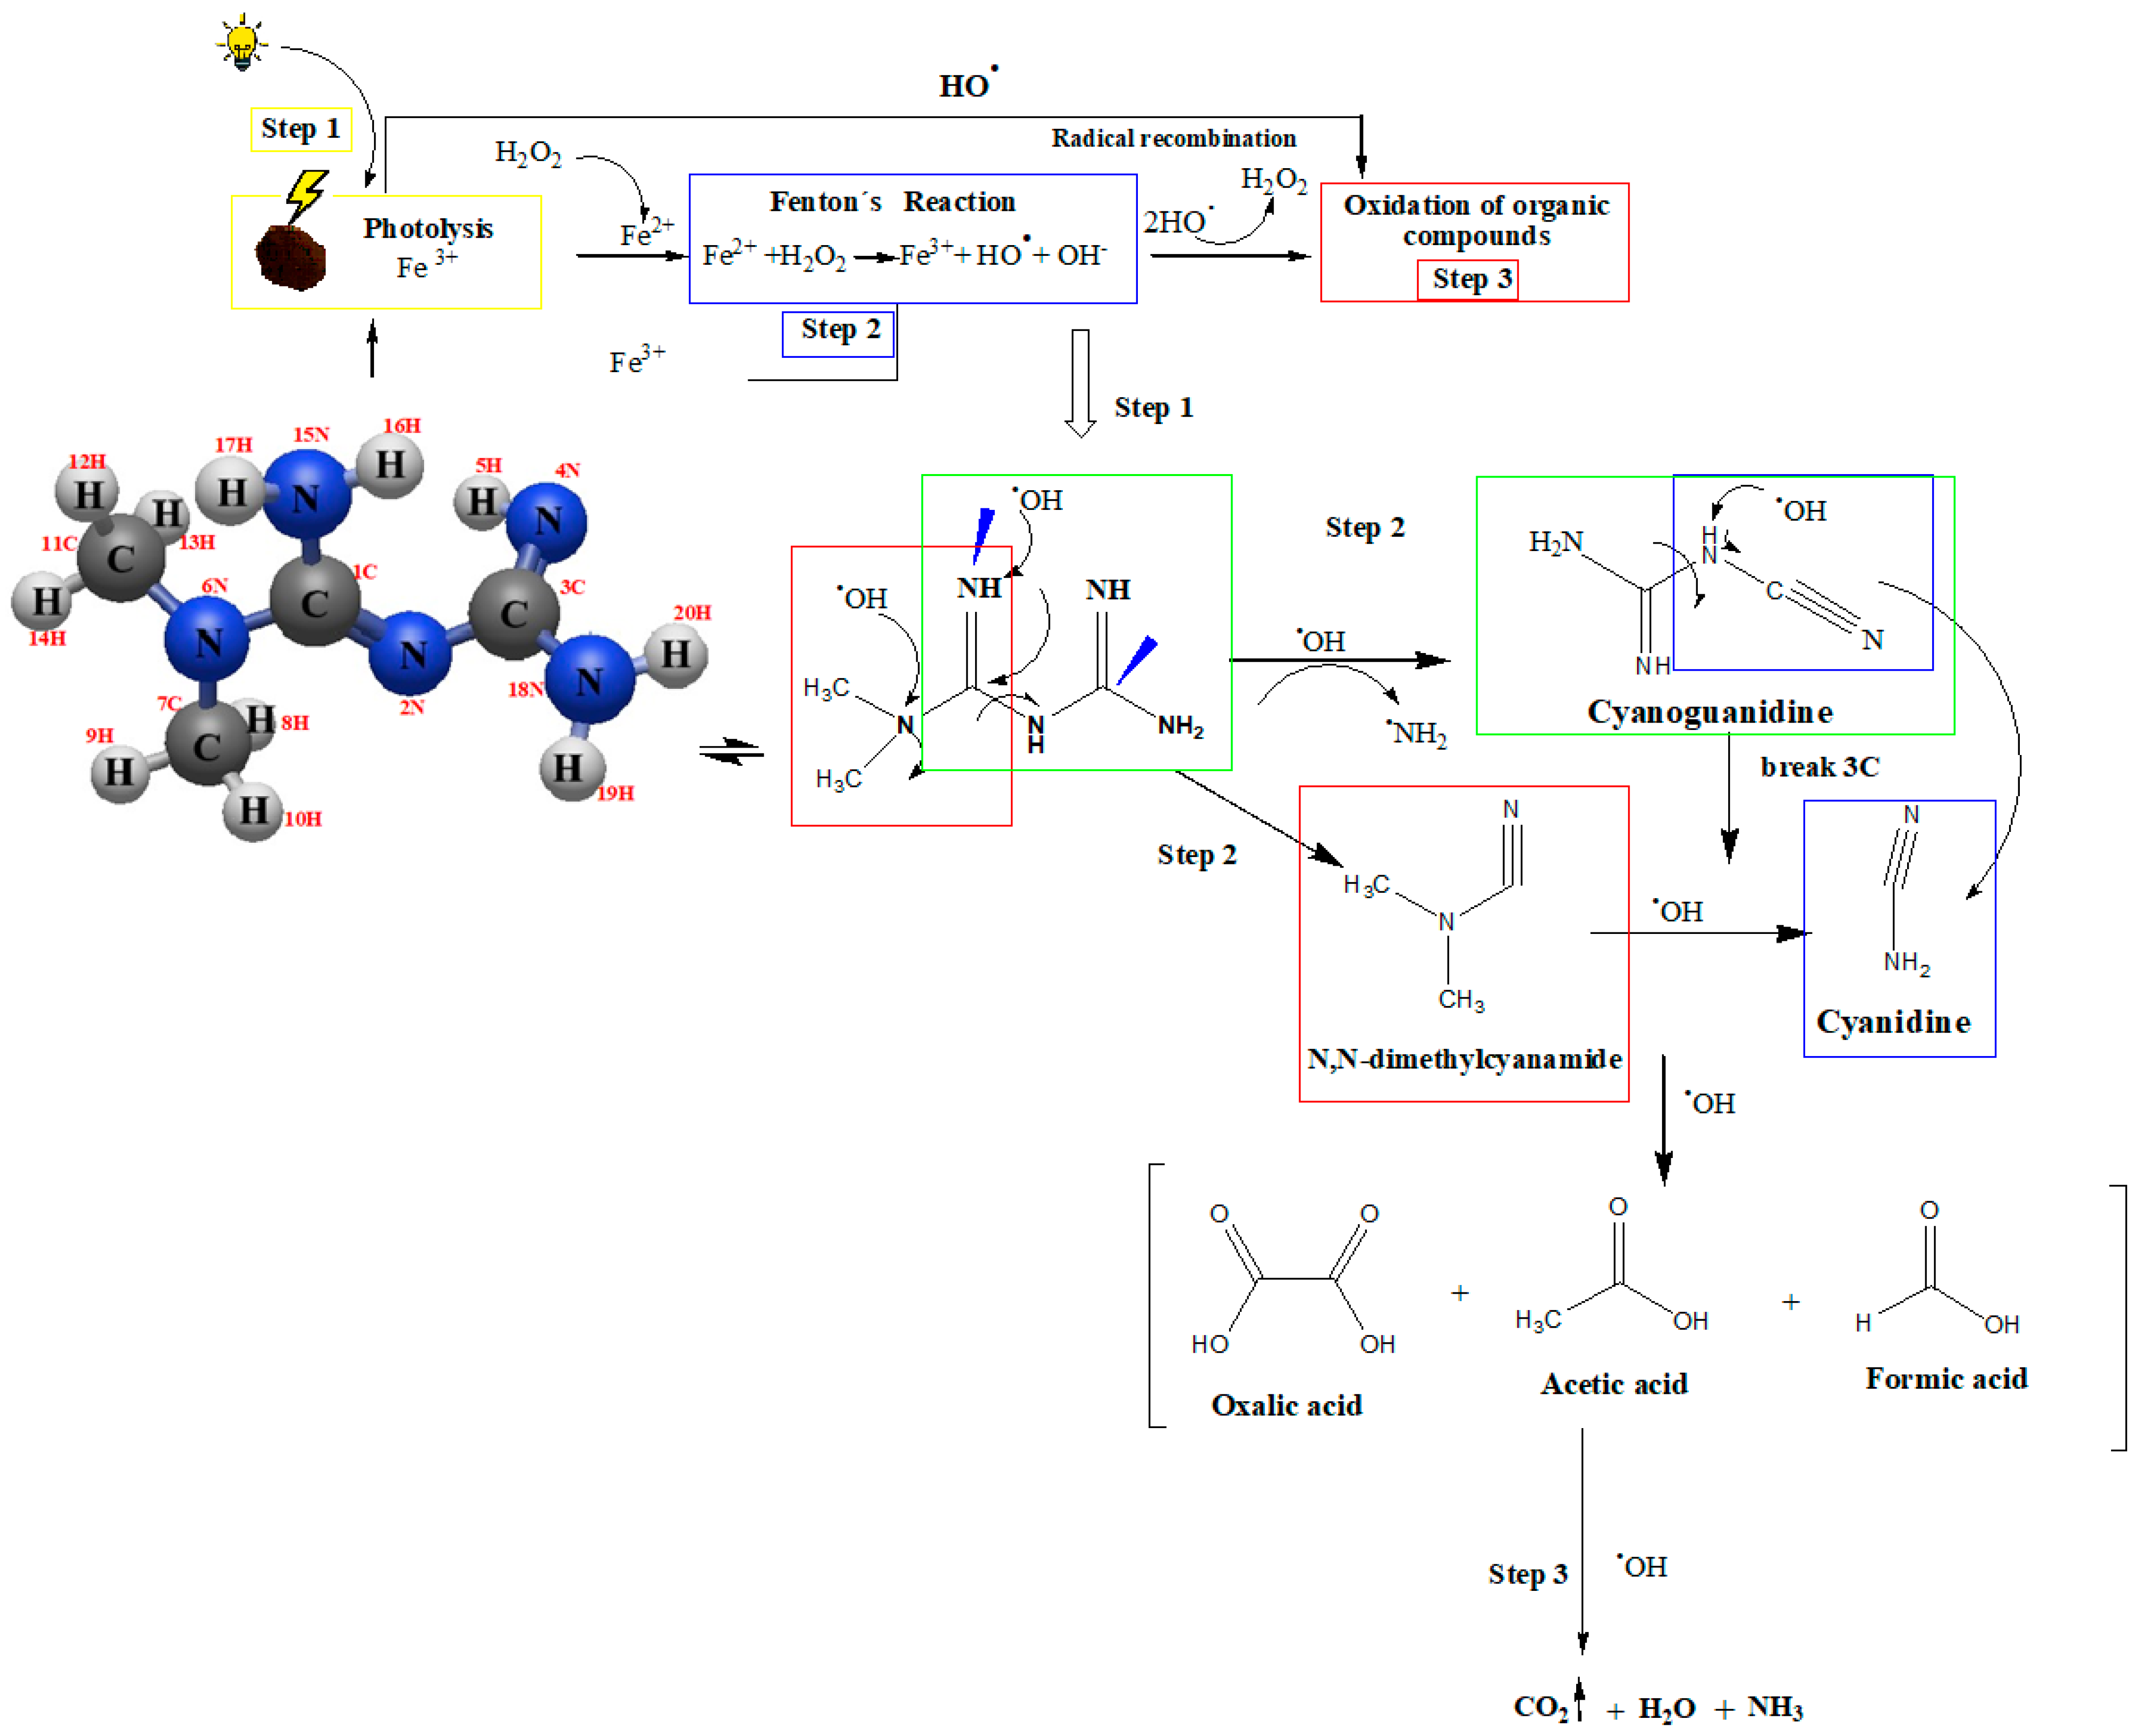
The MET molecule contains several sites that are susceptible to attack by hydroxyl radicals (HRs), making it prone to oxidation. These include two carbon–nitrogen double bonds, five lone electron pairs, and two methyl groups. The oxidation process via HRs can proceed through various pathways, including electron abstraction, the extraction of a hydrogen atom, and the addition of double bonds [68]. According to Liao 2021 [69], the order of vulnerability to HR attack of the atoms in the MET molecule is 4N > 6N > 3C > 1C > 15N > 18N > 2N > 7C > 11C. The attack of HRs on 4N and 6N, as shown in Figure 16, leads to biguadine (not identified in this work). In this case the MET oxidation product identified first was cyanoguanidine, and this is in concordance with previous work [48]. Then, the HRs might attack the adjacent N-H bond and produce cyanidine, as proposed by [69]. The production of carboxylic acids (Figure 15C–H) indicates the abstraction of methyl groups and scavenging by HRs.

4. Conclusions

A comparison of efficiencies and produced intermediaries of different photochemical processes to remove metformin, i.e., photolysis (P), hydrogen peroxide photodecomposition (HPP), photocatalysis (PC), and photo-Fenton (PF), was conducted. All processes were studied under UV light and visible light. The MET degradation kinetics obeyed a pseudo-first-order reaction in any of the two studied regions of the electromagnetic spectrum. These kinetic constants followed the order kPF > kPC > kHPP > kP. The pseudo-first-order kinetic constant for PFUV was 0.5446 min−1, while it was 0.4059 min−1 for PFV. These results are the consequence of producing ROS ( H O • / H O 2 • / O 2 • − ) via four routes: photolysis, photocatalysis, photodecomposition of hydrogen peroxide, and photo-Fenton.
The TOC removal percentage followed the same order, and it was 83% with PFUV and 75% with PFVis after 90 min of treatment. MET oxidation proceeded mainly via hydroxyl radicals and holes in the valence band. A main intermediary in the assessed processes was cyanoguanidine. Superoxide anions limited MET degradation by heterogeneous processes driven by UV light while favoring it when the heterogeneous process was driven by Vis light.
Fe-PILC is a catalyst that allows one to conduct the degradation and mineralization of metformin via photochemical processes driven either by UV light or visible light. In any case, the results regarding mineralization and MET oxidation rate under Vis light are less significant but compete with those attained under UV light. The results also compete with those attained with the homogeneous Fenton process, with the additional advantages of catalyst recovery and activity in the visible region of the electromagnetic spectrum. All this presents Fe-PILC as a promising catalyst for accomplishing metformin degradation via sustainable advanced oxidation processes activated by visible light.

Supplementary Materials

The following supporting information can be downloaded at: https://www.mdpi.com/article/10.3390/w17203028/s1, Figure S1: Second derivative plot to estimate the wavelength to calculate the band-gap energy in the synthesized Fe-PILC.

Author Contributions

Conceptualization, R.R. and R.N.; data curation, D.A.-P. and T.T.-B.; formal analysis, R.R. and R.N.; funding acquisition, R.R. and R.N.; investigation, D.A.-P. and T.T.-B.; methodology, D.A.-P., R.R., A.R.-S., S.L.M.-V., T.T.-B. and R.N.; project administration, R.R. and R.N.; resources, R.R., A.R.-S. and R.N.; software, D.A.-P. and A.R.-S.; supervision, R.R. and R.N.; validation, D.A.-P., R.R., S.L.M.-V. and T.T.-B.; visualization, D.A.-P., A.R.-S. and T.T.-B.; writing—original draft, D.A.-P., R.R., A.R.-S., S.L.M.-V., T.T.-B. and R.N.; writing—review and editing, R.N. All authors have read and agreed to the published version of the manuscript.

Funding

This research was funded by CONAHCYT (grant number 6656) and UAEMex (grant number 7211/2025CIB).

Data Availability Statement

Data are available upon request.

Acknowledgments

D.A.-P. (CVU 481734) and T.T.-B. acknowledge SECIHTI’s financial support of their postdoctoral studies. The authors are also grateful to SECIHTI for their financial support through SNII (National System of Researchers). The technical support from Uvaldo Hernández Balderas and Citlalit Martínez Soto is greatly appreciated.

Conflicts of Interest

The authors declare no conflicts of interest.

Abbreviations

The following abbreviations are used in this manuscript:
AAAcetic acid
FAFormic acid
OAOxalic acid
CYANCyanoguanidine
UHPLCUltra-High-Performance Liquid Chromatograph
HPHydrogen peroxide
HPPHydrogen peroxide photodecomposition
HRHydroxyl radical
IPAIsopropanol
kKinetic constant
MRMadin Reservoir
METMetformin
TOCTotal organic carbon
p-BQPara-benzoquinone
H3PO4Phosphoric acid
PPhotolysis
PCPhotocatalysis
PFPhoto-Fenton
PFUVPhoto-Fenton driven by UV light
PFVPhoto-Fenton driven by visible light
PCVPhotocatalysis driven by visible light
PVHPPhotolysis Vis + H2O2
PILCPillared clay
ROSReactive oxygen species
H2SO4Sulfuric acid
UVUltraviolet
VisVisible light
HRHydroxyl rRadical

References

  1. Fang, Q.; Sun, Q.; Ge, J.; Wang, H.; Qi, J. Multidimensional Engineering of Nanoconfined Catalysis: Frontiers in Carbon-Based Energy Conversion and Utilization. Catalysts 2025, 15, 477. [Google Scholar] [CrossRef] [Scilit]
  2. Li, X.; Shi, X.-L.; Wang, J.; Shi, K.; Wang, Q. Effect of Different Hydrogen Donors on the Catalytic Conversion of Levulinic Acid to γ-Valerolactone over Non-Noble Metal Catalysts. J. Ind. Eng. Chem. 2024, 138, 17–33. [Google Scholar] [CrossRef] [Scilit]
  3. Carbuloni, C.F.; Savoia, J.E.; Santos, J.S.P.; Pereira, C.A.A.; Marques, R.G.; Ribeiro, V.A.S.; Ferrari, A.M. Degradation of Metformin in Water by TiO2–ZrO2 Photocatalysis. J. Environ. Manag. 2020, 262, 110347. [Google Scholar] [CrossRef] [Scilit] [PubMed]
  4. Porta, V.; Schramm, S.G.; Kano, E.K.; Koono, E.E.; Armando, Y.P.; Fukuda, K.; Helena, C. HPLC-UV Determination of Metformin in Human Plasma for Application in Pharmacokinetics and Bioequivalence Studies. J. Pharm. Biomed. Anal. 2008, 46, 143–147. [Google Scholar] [CrossRef] [Scilit]
  5. Kosma, C.I.; Lambropoulou, D.A.; Albanis, T.A. Comprehensive Study of the Antidiabetic Drug Metformin and Its Transformation Product Guanylurea in Greek Wastewaters. Water Res. 2015, 70, 436–448. [Google Scholar] [CrossRef] [Scilit]
  6. Balakrishnan, A.; Sillanpää, M.; Jacob, M.M.; Vo, D.V.N. Metformin as an Emerging Concern in Wastewater: Occurrence, Analysis and Treatment Methods. Environ. Res. 2022, 213, 113613. [Google Scholar] [CrossRef] [Scilit]
  7. Ambrosio-albuquerque, E.P.; Fernando, L.; Am, P.; Borin-carvalho, L.A.; Luiza, A.; Portela-castro, D.B. Metformin Environmental Exposure: A Systematic Review. Environ. Toxicol. Pharmacol. 2021, 83, 103588. [Google Scholar] [CrossRef] [Scilit]
  8. Pérez-Coyotl, I.; Galar-Martínez, M.; García-Medina, S.; Gómez-Oliván, L.M.; Gasca- Pérez, E.; Martínez-Galero, E.; Islas-Flores, H.; Pérez-Pastén, B.R.; Barceló, D.; López de Alda, M.; et al. Polluted Water from an Urban Reservoir (Madín Dam, México) Induces Toxicity and Oxidative Stress in Cyprinus Carpio Embryos. Environ. Pollut. 2019, 251, 510–521. [Google Scholar] [CrossRef] [Scilit] [PubMed]
  9. Elizalde-Velázquez, G.A.; Gómez-Oliván, L.M. Occurrence, Toxic Effects and Removal of Metformin in the Aquatic Environments in the World: Recent Trends and Perspectives. Sci. Total Environ. 2020, 702, 134924. [Google Scholar] [CrossRef] [Scilit] [PubMed]
  10. Xie, Q.; Zhao, K.; Li, S.; Lian, Y.; Yang, M.; Liu, H.; Chen, C.; Fang, C. Degradation of Typical Tetracycline Antibiotics in Landfill Leachate by Three-Dimensional Aerated Electrocatalytic Reactor (3D-AER): Electrode Properties, Influencing Factors and Degradation Mechanism. J. Environ. Manage. 2025, 386, 125787. [Google Scholar] [CrossRef] [Scilit]
  11. Chaharmahali, R.; Fattah-alhosseini, A.; Karbasi, M.; Dastan, D.; Giannakis, S. Synergistic Effects of PEO and Hydrothermal Post-Treatment on the Photocatalytic Behavior of TiO2/Bi2WO6 Coatings: Distinguishing between Type II and Z-Scheme Heterojunctions. J. Environ. Chem. Eng. 2025, 13, 116583. [Google Scholar] [CrossRef] [Scilit]
  12. Ameta, R.; Chohadia, A.K.; Jain, A.; Punjabi, P.B. Fenton and Photo-Fenton Processes. In Advanced Oxidation Processes for Waste Water Treatment; Elsevier: Amsterdam, The Netherlands, 2018; pp. 49–87. ISBN 9780128105252. [Google Scholar]
  13. Nematolahi, S.Z.; Dehghani, M.; Yousefinejad, S.; Hashemi, H.; Golaki, M.; Mohammadpour, A.; Abdollahi, S.H. Removal of Metformin from Aqueous Solution Using Fe3+ Doped TiO2 Nanoparticles under UV Irradiation. Desalin. Water Treat. 2021, 236, 182–189. [Google Scholar] [CrossRef] [Scilit]
  14. Solano, R.; Mallarino, L.; Mueses, M.; Herrera, A. Photocatalytic Degradation of Metformin Using TiO2-CuO Heterojunctions Synthesized by Green Chemistry and Immobilized on Beach Sand Granules in Fluidized Bed Annular Photoreactor (FBAP). J. Environ. Chem. Eng. 2024, 12, 113576. [Google Scholar] [CrossRef] [Scilit]
  15. Goi, A.; Trapido, M. Hydrogen Peroxide Photolysis, Fenton Reagent and Photo-Fenton for the Degradation of Nitrophenols: A Comparative Study. Chemosphere 2002, 46, 913–922. [Google Scholar] [CrossRef] [Scilit] [PubMed]
  16. Fenton, H.J.H. OXIDATION OF TARTARIC ACID IN PRESEXCE OF IRON. 899 LXXZIl.-Oxictutioiz of Tcxriaric Acid Iia Prcseizce of Jrolz. J. Chem. Soc. 1894, 65, 899–910. [Google Scholar] [CrossRef] [Scilit]
  17. Kim, S.M.; Vogelpohl, A. Degradation of Organic Pollutants by the Photo-Fenton-Process. Chem. Eng. Technol. 1998, 21, 187–191. [Google Scholar] [CrossRef]
  18. Bazrafshan, E.; Mohammadi, L.; Zarei, A.A.; Mosafer, J.; Zafar, M.N.; Dargahi, A. Optimization of the Photocatalytic Degradation of Phenol Using Superparamagnetic Iron Oxide (Fe3O4) Nanoparticles in Aqueous Solutions. RSC Adv. 2023, 13, 25408–25424. [Google Scholar] [CrossRef] [Scilit]
  19. Singh, P.; Manori, A.; Kumar, A.; Chandra, R.; Raina, K.K.; Shukla, R.K.; Manori, S. Photocatalytic Degradation of Malachite Green Using PVDF Membranes Doped with Fe3O4 Nanoparticles: Role of Porosity and Surface Roughness. Phys. Scr. 2023, 98, 105953. [Google Scholar] [CrossRef] [Scilit]
  20. Vijayarengan, P.; Panchangam, S.C.; Stephen, A.; Bernatsha, G.; Murali, G.K.; Loka, S.S.; Manoharan, S.K.; Vemula, V.; Karri, R.R.; Ravindran, G. Highly Efficient Visible Light Active Iron Oxide-Based Photocatalysts for Both Hydrogen Production and Dye Degradation. Sci. Rep. 2024, 14, 18299. [Google Scholar] [CrossRef] [Scilit] [PubMed]
  21. Zhao, L.; Lin, Z.R.; Ma, X.H.; Dong, Y.H. Catalytic Activity of Different Iron Oxides: Insight from Pollutant Degradation and Hydroxyl Radical Formation in Heterogeneous Fenton-like Systems. Chem. Eng. J. 2018, 352, 343–351. [Google Scholar] [CrossRef] [Scilit]
  22. Moussi, B.; Hajjaji, W.; Hachani, M.; Hatira, N.; Labrincha, J.A.; Yans, J.; Jamoussi, F. Numidian Clay Deposits as Raw Material for Ceramics Tile Manufacturing. J. African Earth Sci. 2020, 164, 103775. [Google Scholar] [CrossRef] [Scilit]
  23. Nisticò, R. A Comprehensive Study on the Applications of Clays into Advanced Technologies, with a Particular Attention on Biomedicine and Environmental Remediation. Inorganics 2022, 10, 40. [Google Scholar] [CrossRef] [Scilit]
  24. De León, M.A.; Rodríguez, M.; Marchetti, S.G.; Sapag, K.; Faccio, R.; Sergio, M.; Bussi, J. Raw Montmorillonite Modified with Iron for Photo-Fenton Processes: Influence of Iron Content on Textural, Structural and Catalytic Properties. J. Environ. Chem. Eng. 2017, 5, 4742–4750. [Google Scholar] [CrossRef] [Scilit]
  25. Hurtado, L.; Romero, R.; Mendoza, A.; Brewer, S.; Donkor, K.; Gómez-Espinosa, R.M.; Natividad, R. Paracetamol Mineralization by Photo Fenton Process Catalyzed by a Cu/Fe-PILC under Circumneutral PH Conditions. J. Photochem. Photobiol. A Chem. 2019, 373, 162–170. [Google Scholar] [CrossRef] [Scilit]
  26. Amado-Piña, D.; Romero, R.; Salazar Carmona, E.; Ramírez-Serrano, A.; Gómez-Oliván, L.M.; Elizalde-Velázquez, G.; Natividad, R. Photo-Fenton Treatment under UV and Vis Light Reduces Pollution and Toxicity in Water from Madín Dam, Mexico. Catalysts 2024, 14, 620. [Google Scholar] [CrossRef] [Scilit]
  27. Ding, Z.; Dong, Y.; Li, B. Preparation of a Modified PTFE Fibrous Photo-Fenton Catalyst and Its Optimization towards the Degradation of Organic Dye. Int. J. Photoenergy 2012, 2012, 121239. [Google Scholar] [CrossRef] [Scilit]
  28. Cinvestav, I.P.N. α − Fe2O3 Films Grown by the Spin-on Sol-Gel Deposition Method—2003—N.Pdf. Rev. Mex. Física 2003, 49, 219–223. [Google Scholar]
  29. Martin Del Campo, E.; Romero, R.; Roa, G.; Peralta-Reyes, E.; Espino-Valencia, J.; Natividad, R. Photo-Fenton Oxidation of Phenolic Compounds Catalyzed by Iron-PILC. Fuel 2014, 138, 149–155. [Google Scholar] [CrossRef] [Scilit]
  30. Eisenberg, G. Colorimetric Determination of Hydrogen Peroxide. Ind. Eng. Chem. Anal. Ed. 1943, 15, 327–328. [Google Scholar] [CrossRef] [Scilit]
  31. Hurtado, L.; Mohan, A.; Ulmer, U.; Natividad, R.; Tountas, A.A.; Sun, W.; Wang, L.; Kim, B.; Sain, M.M.; Ozin, G.A. Solar CO2 hydrogenation by Photocatalytic Foams. Chem. Eng. J. 2022, 435, 134864. [Google Scholar] [CrossRef] [Scilit]
  32. Amado-Piña, D.; Roa-Morales, G.; Molina-Mendieta, M.; Balderas-Hernández, P.; Romero, R.; Barrera Díaz, C.E.; Natividad, R. E-Peroxone Process of a Chlorinated Compound: Oxidant Species, Degradation Pathway and Phytotoxicity. J. Environ. Chem. Eng. 2022, 10, 108148. [Google Scholar] [CrossRef] [Scilit]
  33. Bagbi, Y.; Sarswat, A.; Mohan, D.; Pandey, A.; Solanki, P.R. Lead and Chromium Adsorption from Water Using L-Cysteine Functionalized Magnetite (Fe3O4) Nanoparticles. Sci. Rep. 2017, 7, 7672. [Google Scholar] [CrossRef] [Scilit]
  34. Dorado, F.; García, P.B.; de Lucas, A.; Ramos, M.J.; Romero, A. Hydrocarbon Selective Catalytic Reduction of NO over Cu/Fe-Pillared Clays: Diffuse Reflectance Infrared Spectroscopy Studies. J. Mol. Catal. A Chem. 2010, 332, 45–52. [Google Scholar] [CrossRef] [Scilit]
  35. International Centre for Diffraction Data. JCPDS-ICDD 2001, File No. 01-088-0891.
  36. International Centre for Diffraction Data. JCPDS-ICDD 2001, File No. 00-003-0968.
  37. International Centre for Diffraction Data. JCPDS-ICDD 2001, File No. 01-075-1610.
  38. Watts, J.F.; Wolstenholme, J. An Introduction to Surface Analysis by XPS and AES; Wiley: Hoboken, NJ, USA, 2003; ISBN 9780470847121. [Google Scholar]
  39. Minella, M.; Marchetti, G.; De Laurentiis, E.; Malandrino, M.; Maurino, V.; Minero, C.; Vione, D.; Hanna, K. Photo-Fenton Oxidation of Phenol with Magnetite as Iron Source. Appl. Catal. B Environ. 2014, 154–155, 102–109. [Google Scholar] [CrossRef] [Scilit]
  40. Valverde, J.L.; Romero, A.; Romero, R.; García, P.B.; Sánchez, M.L.; Asencio, I. Preparation and Characterization of Fe-PILCs. Influence of the Synthesis Parameters. Clays Clay Miner. 2005, 53, 613–621. [Google Scholar] [CrossRef] [Scilit]
  41. Pesquera, C.; Gonzalez, F.; Benito, I.; Mendioroz, S.; Pajares, J.A. Synthesis and Characterization of Pillared Montmorillonite Catalysts. Appl. Catal. 1991, 69, 97–104. [Google Scholar] [CrossRef] [Scilit]
  42. Yang, L.; Yu, L.E.; Ray, M.B. Photocatalytic Oxidation of Paracetamol: Dominant Reactants, Intermediates, and Reaction Mechanisms. Environ. Sci. Technol. 2009, 43, 460–465. [Google Scholar] [CrossRef] [Scilit] [PubMed]
  43. Undabeytia, T.; Galán-Jiménez, M.C.; Gómez-Pantoja, E.; Vázquez, J.; Casal, B.; Bergaya, F.; Morillo, E. Fe-Pillared Clay Mineral-Based Formulations of Imazaquin for Reduced Leaching in Soil. Appl. Clay Sci. 2013, 80–81, 382–389. [Google Scholar] [CrossRef] [Scilit]
  44. Cusioli, L.F.; Quesada, H.B.; de Brito Portela Castro, A.L.; Gomes, R.G.; Bergamasco, R. Development of a New Low-Cost Adsorbent Functionalized with Iron Nanoparticles for Removal of Metformin from Contaminated Water. Chemosphere 2020, 247, 125852. [Google Scholar] [CrossRef] [Scilit]
  45. Pap, S.; Shearer, L.; Gibb, S.W. Effective Removal of Metformin from Water Using an Iron-Biochar Composite: Mechanistic Studies and Performance Optimisation. J. Environ. Chem. Eng. 2023, 11, 110360. [Google Scholar] [CrossRef] [Scilit]
  46. Parra-Marfil, A.; López-Ramón, M.V.; Aguilar-Aguilar, A.; García-Silva, I.A.; Rosales-Mendoza, S.; Romero-Cano, L.A.; Bailón-García, E.; Ocampo-Pérez, R. An Efficient Removal Approach for Degradation of Metformin from Aqueous Solutions with Sulfate Radicals. Environ. Res. 2023, 217, 114852. [Google Scholar] [CrossRef] [Scilit]
  47. Garazade, N.; Can-Güven, E.; Güven, F.; Yazici Guvenc, S.; Varank, G. Performance Evaluation and Optimization of Pharmaceutical Removal with Sulfate Radical-Based Photooxidation Processes by Machine Learning Algorithms. Sep. Purif. Technol. 2025, 376, 134047. [Google Scholar] [CrossRef] [Scilit]
  48. Castañeda-Sánchez, J.M.; Silerio-Vázquez, F.d.J.; Villanueva-Fierro, I.; García-Prieto, J.C.; González-Burciaga, L.A.; Proal-Nájera, J.B. Metformin Degradation by Advanced Oxidation Processes: Performance, Limitations, and Environmental Concerns. Int. J. Mol. Sci. 2025, 26, 5925. [Google Scholar] [CrossRef] [Scilit]
  49. Quintão, F.J.O.; Freitas, J.R.L.; de Fátima Machado, C.; Aquino, S.F.; de Queiroz Silva, S.; de Cássia Franco Afonso, R.J. Characterization of Metformin By-Products under Photolysis, Photocatalysis, Ozonation and Chlorination by High-Performance Liquid Chromatography Coupled to High-Resolution Mass Spectrometry. Rapid Commun. Mass Spectrom. 2016, 30, 2360–2368. [Google Scholar] [CrossRef] [Scilit] [PubMed]
  50. Du, J.; Wang, C.; Zhao, Z.; Cui, F.; Ou, Q.; Liu, J. Role of Oxygen and Superoxide Radicals in Promoting H2O2 Production during VUV/UV Radiation of Water. Chem. Eng. Sci. 2021, 241, 116683. [Google Scholar] [CrossRef] [Scilit]
  51. Zhang, Q.; Wang, L.; Chen, B.; Chen, Y.; Ma, J. Understanding and Modeling the Formation and Transformation of Hydrogen Peroxide in Water Irradiated by 254 Nm Ultraviolet (UV) and 185 Nm Vacuum UV (VUV): Effects of PH and Oxygen. Chemosphere 2020, 244, 125483. [Google Scholar] [CrossRef] [Scilit] [PubMed]
  52. Piskarev, I.M.; Astaf’Eva, K.A.; Ivanova, I.P. The UV-C Radiation Mechanism to Form HO2• Radicals from Water. J. Phys. Conf. Ser. 2018, 1094, 3–7. [Google Scholar] [CrossRef] [Scilit]
  53. Li, J.; Zhang, Q.; Chen, B.; Wang, L.; Zhu, R.; Yang, J. Hydrogen Peroxide Formation in Water during the VUV/UV Irradiation Process: Impacts and Mechanisms of Selected Anions. Environ. Res. 2021, 195, 110751. [Google Scholar] [CrossRef] [Scilit]
  54. Crapulli, F.; Santoro, D.; Sasges, M.R.; Ray, A.K. Mechanistic Modeling of Vacuum UV Advanced Oxidation Process in an Annular Photoreactor. Water Res. 2014, 64, 209–225. [Google Scholar] [CrossRef] [Scilit]
  55. Nezar, S.; Laoufi, N.A. Electron Acceptors Effect on Photocatalytic Degradation of Metformin under Sunlight Irradiation. Sol. Energy 2018, 164, 267–275. [Google Scholar] [CrossRef] [Scilit]
  56. Zeng, Q.; Dong, H.; Wang, X.; Yu, T.; Cui, W. Degradation of 1, 4-Dioxane by Hydroxyl Radicals Produced from Clay Minerals. J. Hazard. Mater. 2017, 331, 88–98. [Google Scholar] [CrossRef] [Scilit]
  57. Chen, N.; Fang, G.; Zhu, C.; Wu, S.; Liu, G.; Dionysiou, D.D.; Wang, X.; Gao, J.; Zhou, D. Surface-Bound Radical Control Rapid Organic Contaminant Degradation through Peroxymonosulfate Activation by Reduced Fe-Bearing Smectite Clays. J. Hazard. Mater. 2020, 389, 121819. [Google Scholar] [CrossRef] [Scilit] [PubMed]
  58. Zhang, B.; Li, X.; Ma, Y.; Jiang, T.; Zhu, Y.; Ren, H. Visible-Light Photoelectrocatalysis/H2O2 Synergistic Degradation of Organic Pollutants by a Magnetic Fe3O4@SiO2 @mesoporous TiO2 Catalyst-Loaded Photoelectrode. RSC Adv. 2022, 12, 30577–30587. [Google Scholar] [CrossRef] [Scilit] [PubMed]
  59. Elizalde-Velázquez, G.A.; Victoria, C.; Amado-Piña, D.; Herrera-Vázquez, S.E.; Romero, R.; Natividad, R.; Gómez-Oliván, L.M. Detrimental Impact of Photo-Fenton Treated COVID-19 Drugs on Liver Function: A Thorough Investigation in Danio Rerio. J. Environ. Manag. 2025, 381, 125182. [Google Scholar] [CrossRef] [Scilit]
  60. Estrada-Arriaga, E.B.; García-Sánchez, L.; Falcón-Rojas, A. Experimental Design Approach for the Removal of the Antidiabetic Drug, Metformin at a High Concentration by Photocatalytic Processes. Water Environ. J. 2021, 35, 759–771. [Google Scholar] [CrossRef] [Scilit]
  61. Binjhade, R.; Mondal, R.; Mondal, S. Photocatalytic Degradation of Ciprofloxacin and Metformin in a Continuous-Flow Tubular Reactor. React. Chem. Eng. 2025, 10, 1577–1586. [Google Scholar] [CrossRef] [Scilit]
  62. Pignatello, J.J.; Oliveros, E.; MacKay, A. Advanced Oxidation Processes for Organic Contaminant Destruction Based on the Fenton Reaction and Related Chemistry. Crit. Rev. Environ. Sci. Technol. 2006, 36, 1–84. [Google Scholar] [CrossRef] [Scilit]
  63. Palominos, R.; Freer, J.; Mondaca, M.A.; Mansilla, H.D. Evidence for Hole Participation during the Photocatalytic Oxidation of the Antibiotic Flumequine. J. Photochem. Photobiol. A Chem. 2008, 193, 139–145. [Google Scholar] [CrossRef] [Scilit]
  64. Richard, C.; Boule, P. Reactive Species Involved in Photocatalytic Transformations on Zinc Oxide. Sol. Energy Mater. Sol. Cells 1995, 38, 431–440. [Google Scholar] [CrossRef] [Scilit]
  65. Eddy, D.R.; Nur Sheha, G.A.; Permana, M.D.; Saito, N.; Takei, T.; Kumada, N.; Irkham; Rahayu, I.; Abe, I.; Sekine, Y.; et al. Study on Triphase of Polymorphs TiO2 (Anatase/Rutile/Brookite) for Boosting Photocatalytic Activity of Metformin Degradation. Chemosphere 2024, 351, 141206. [Google Scholar] [CrossRef] [Scilit]
  66. Khouri, H.; Collin, F.; Bonnefont-Rousselot, D.; Legrand, A.; Jore, D.; Gardès-Albert, M. Radical-induced Oxidation of Metformin. Eur. J. Biochem. 2004, 271, 4745–4752. [Google Scholar] [CrossRef] [Scilit] [PubMed]
  67. Neamt, M.; Grandjean, D.; Sienkiewicz, A. Applied Catalysis B: Environmental Degradation of Eight Relevant Micropollutants in Different Water Matrices by Neutral Photo-Fenton Process under UV 254 and Simulated Solar Light Irradiation—A Comparative Study. Appl. Catal. B Environ. J. 2014, 158–159, 30–37. [Google Scholar] [CrossRef] [Scilit]
  68. Collin, F.; Khoury, H.; Bonnefont-Rousselot, D.; Thérond, P.; Legrand, A.; Jore, D.; Gardès-Albert, M. Liquid Chromatographic/Electrospray Ionization Mass Spectrometric Identification of the Oxidation End-Products of Metformin in Aqueous Solutions. J. Mass Spectrom. 2004, 39, 890–902. [Google Scholar] [CrossRef] [Scilit] [PubMed]
  69. Liao, X.; Shen, L.; Jiang, Z.; Gao, M.; Qiu, Y.; Qi, H.; Chen, C. NDMA Formation during Ozonation of Metformin: Roles of Ozone and Hydroxyl Radicals. Sci. Total Environ. 2021, 796, 149010. [Google Scholar] [CrossRef] [Scilit]
Figure 1. Structure of metformin N,N-dimethylimidodi-carbonimidic diamide.
Water 17 03028 g001
Figure 2. Reactor setup for the experiments driven by (A) UV light: an 8W lamp (254 nm, 4400 μW/cm2) placed at the center of the reactor and (B) visible light ( λ > 400 nm): three 14 W lamps positioned around the reactor.
Water 17 03028 g002
Figure 3. Tauc plot to determine band-gap energy of the prepared catalyst, Fe-PILC.
Water 17 03028 g003
Figure 4. XRD pattern from bentonite and Fe-PILC.
Water 17 03028 g004
Figure 5. XRD pattern of synthesized Fe-PILC (FeO, JCPDS: No. 00-003-0968 and Fe3O4, JCPDS No. 01-075-1610).
Water 17 03028 g005
Figure 6. XPS spectra of Fe/PILC corresponding to Fe 2p3/2 and Fe 2p1/2.
Water 17 03028 g006
Figure 7. SEM images for (A) Bentonite and (B) Fe-PILC. (C) EDS of iron distribution.
Water 17 03028 g007
Figure 8. Normalized metformin (MET) concentration temporal profiles under different treatments driven by (A) UV light: UV only (photolysis); photodecomposition of H2O2 by UV (photolysis UV + H2O2); addition of catalyst and UV light (photocatalysis); addition of catalyst, H2O2, and UV light (photo-Fenton UV); (B) visible light: only Vis light (photolysis); photodecomposition of H2O2 by Vis light (photolysis Vis + H2O2); addition of catalyst and Vis light (photocatalysis); addition of catalyst, H2O2 and Vis light (photo-Fenton Vis). Reaction conditions: CMET,0 = 13,000 ng L−1, rpm = 800, T = 298 K, H2O2 (11.2 mg·L−1), Wcat = 0.5 g·L−1, Vreaction = 0.1 L.
Water 17 03028 g008aWater 17 03028 g008b
Figure 9. Effect of treatment type on (A) hydrogen peroxide concentration profile under photolysis and photocatalysis with and without (blank) metformin addition, with UV and Vis light; (B) hydrogen peroxide normalized concentration profile under photo-Fenton and H2O2 photodecomposition, driven by UV and Vis light. Reaction conditions: CMET,0 = 13,000 ng L−1, rpm = 800, T = 298 K, H2O2 (11.2 mg·L−1), Wcat = 0.5 g·L−1, Vreaction = 0.1 L. Blank indicates MET was not added.
Water 17 03028 g009
Figure 10. Effect of type of treatment on total organic carbon (TOC) removal percentage. Treatments: photolysis (only light, UV or Vis); photodecomposition of H2O2 by UV or Vis (photolysis UV or Vis + H2O2); addition of catalyst and light (photocatalysis); addition of catalyst, H2O2, and light (photo-Fenton UV or Vis). Reaction conditions: CMET,0 = 13,000 ng L−1, rpm = 800, T = 298 K, H2O2 (11.2 mg·L−1), Wcat = 0.5 g·L−1, Vreaction = 0.1 L, pHo = 6.2, treatment time = 90 min.
Water 17 03028 g010
Figure 11. Effect of treatment type on (A) pH temporal profiles of processes driven by UV light, and (B) pH temporal profiles of processes driven by Vis light. Reaction conditions: CMET,0 = 13,000 ng L−1, rpm = 800, T = 298 K, H2O2 (11.2 mg·L−1), Wcat = 0.5 g·L−1, Vreaction = 0.1 L.
Water 17 03028 g011
Figure 12. Pseudo-first-order kinetic constants (k) (min−1) of metformin degradation under various treatments driven by UV or visible light. Reaction conditions: CMET,0 = 13,000 ng L−1, rpm = 800, T = 298 K, H2O2 (11.2 mg·L−1), Wcat = 0.5 g·L−1, Vreaction = 0.1 L.
Water 17 03028 g012
Figure 13. Effect of treatment type, scavenger addition, isopropanol (IPA), para-benzoquinone (p-BQ), and oxygen removal on metformin-normalized concentration temporal profiles. Treatments: addition of catalyst and light (photocatalysis UV or Vis); addition of catalyst, H2O2, and light (photo-Fenton UV or Vis). Reaction conditions: CMET,0 = 13,000 ng L−1, rpm = 800, T = 298 K, H2O2 (11.2 mg·L−1), Wcat = 0.5 g·L−1, Vreaction = 0.1 L, pHo = 6.2.
Water 17 03028 g013
Figure 14. A reaction scheme of the heterogeneous photocatalytic and photo-Fenton process catalyzed by Fe-PILC under UV and Vis light. The yellow blocks indicate reactions and species contributing to MET oxidation under Vis light-driven processes.
Water 17 03028 g014
Figure 15. Effect of treatment type on distribution of by-products of metformin oxidation: (A) Cyanoguanidine production under UV light driven processes, (B) Cyanoguanidine production under Vis light driven processes, (C) Formic acid production under UV light driven processes, (D) Formic Acid production under Vis light driven processes, (E) Acetic acid production under UV light driven processes, (F) Acetic acid production under Vis light driven processes, (G) Oxalic acid production under UV light driven processes, (H) Oxalic acid production under Vis light driven processes. Reaction conditions: CMET,0 = 13,000 ng L−1, rpm = 800, T = 298 K, H2O2 (11.2 mg·L−1), Wcat = 0.5 g·L−1, Vreaction = 0.1 L, pHo = 6.2.
Water 17 03028 g015aWater 17 03028 g015b
Figure 16. Proposed reaction pathway of metformin oxidation via hydroxyl radicals.
Water 17 03028 g016
Table 1. Conditions to identify and quantify Metformin (MET) and cyanoguanidine by UHPLC.
ParametersConditions
MethodReversed-phase Ultra-High-Performance Liquid Chromatograph (UHPLC)
Mobile phaseWater/H3PO4 (pH 3.0) and acetonitrile (95:5, v/v)
ColumnDiscovery C18 (Supelco) column (150 mm × 4.6 mm and 5 µm)
Flow rate0.5 mL/min
DetectionUV-Vis and PDA detector, λ = 233 nm
Column temperature40 °C
Injection volume20 μL
Run time 10 min
Table 2. Conditions to identify and quantify carboxylic acids via HPLC.
ParametersConditions
MethodReversed-phase Ultra-High-Performance Liquid Chromatograph (UHPLC)
Mobile phaseH2SO4 (3 mM)
ColumnAminex HPX-87H column (Bio-Rad) (300 × 7.8 mm)
Flow rate0.6 mL/min
DetectionUV-Vis and PDA detector, λ = 205 nm
Column temperature35 °C
Injection volume20 μL
Run time 20 min
Table 3. Textural properties and iron (Fe) content of parent clay (bentonite) and pillared clay (Fe-PILC).
Sample Surface Area
(m2/g)
Micropore Area
(m2/g)
Pore Volume
(cm3/g)
Micropore Volume
(cm3/g)
Iron
(wt. %)
Bentonite35140.0580.00282.7
Fe-PILC246125.60.1330.05211.0
Table 4. Reaction parameters and percentage of metformin degradation using various photochemical methods.
MethodMaterialInitial ConcentrationReaction ConditionsMET Degradation (%)k
NP = Not Provided
References
Photo-FentonUV (254 nm)
0.5 g/L Fe-pillared clays
0.02 mg L−1pH = 6.2
T = 25 °C
V = 1 L
H2O2 = 7.3 × 10⁻² µL/L
Reaction time: 10 min
100NP[59]
PhotocatalysisVisible light (254 mW/cm2)

6 mg TiO2/Bi2WO6
5 mg L−1pH = 7.4
V = 30 mL
Reaction time = 180 min
90NP[11]
PhotocatalysisUV (246 nm)
30 mg/L TiO2
320 mg L−1pH = 7
H2O2: 137.5 mg/L
Reaction time: 120 min
 
97NP[60]
Photo-Fenton30 mg Fe3+ L−1 (FeCl3)pH = 5.5
H2O2: 250 mg/L
Reaction time: 90 min
 
66NP
Photo-ferrioxalate50 mgL−1 Na3[Fe(C2O4)3]pH = 4
H2O2: 137 mg/L
Reaction time: 120 min
41NP
PhotocatalysisUVC (253.7)1 mg L−1V = 0.024 L
Flow rate = 0.05 mL/min
Reaction time = 9 h
92NP[61]
TiO2-coated quartz tubeTOCremoval: 70%
PhotocatalysisUV (227 nm)
75 mg/L Fe3+/TiO2
35 mg L−1pH = 11
T = 20 ± 5 °C
Reaction time = 90 min
93.8NP[13]
PhotocatalysisUV (233 nm)
1.0 g/L TiO2/ZrO2 (95-5)
10 mg L−1pH = 8
T = 25 °C
V = 0.5 L
Reaction time: 30 min
550.0050 min−1[3]
Photo-Fenton UVUV-254 nm
0.5 g/L Fe-pillared clays
13,000 ng L−1pH = 6.2
T = 25 °C
V = 0.1 L
H2O2 = 11.2 mg L−1
100% (9 min) TOCremoval: 83% (90 min)0.545 min−1This work
Photo-Catalysis UVUV-254 nm
0.5 g/L Fe-pillared clays
13,000 ng L−1pH = 6.2
T = 25 °C
V = 0.1 L
98% (30 min) TOCremoval: 65% (90 min) 0.103 min−1This work
Photo-Fenton VisVis light
0.5 g/L Fe Pillared clays
13,000 ng L−1pH = 6.2
T = 25 °C
V = 0.1 L
H2O2 = 11.2 mg L−1
100%
(30 min) TOCremoval: 75% (90 min)
0.406 min−1This work
Photo-Catalysis VisVis light
0.5 g/L Fe-pillared clays
13,000 ng L−1pH = 6.2
T = 25 °C
V = 0.1 L
Reaction time: 90 min
95%
TOCremoval: 42%
0.055 min−1This work
Disclaimer/Publisher’s Note: The statements, opinions and data contained in all publications are solely those of the individual author(s) and contributor(s) and not of MDPI and/or the editor(s). MDPI and/or the editor(s) disclaim responsibility for any injury to people or property resulting from any ideas, methods, instructions or products referred to in the content.