Article

A Geoinformation-Based Approach for Mapping Coastal Vulnerability in Sweden

by
Eleni Achmakidou
1,2,
George P. Petropoulos
3,*,
Anna Karkani
2,
Niki Evelpidou
2,
Spyridon E. Detsikas
3 and
Georgios Nektarios Tselos
3
1
ALTUS Land Sea Air (LSA) Ltd., Thesi Oasi Agias, 73100 Chania, Crete, Greece
2
Faculty of Geology and Geoenvironment, National and Kapodistrian University of Athens, Panepistimiopolis, Zografou, 15784 Athens, Greece
3
Department of Geography, Harokopio University of Athens, El. Venizelou St., 70, 17671 Athens, Greece
*
Author to whom correspondence should be addressed.
Water 2025, 17(20), 3027; https://doi.org/10.3390/w17203027
Submission received: 28 August 2025 / Revised: 13 October 2025 / Accepted: 16 October 2025 / Published: 21 October 2025

Abstract

Coastal areas in Arctic and sub-Arctic regions are getting increasingly vulnerable to climate change, particularly due to sea-level rise and changing wave dynamics. This study assesses the coastal vulnerability of Sweden using the Coastal Vulnerability Index (CVI), based on a GIS-based, semi-quantitative approach integrating Earth Observation (EO) and geoinformatics. Six physical parameters were used: coastal geomorphology, coastal slope, shoreline change rate, relative sea-level change, mean tidal range, and significant wave height. CVI scores were derived from openly available national and international datasets, including satellite imagery and historical records. Mean tidal range and relative sea-level change were the most influential variables. The results indicate significant spatial variability: 36.5% of the coastline is classified as having “High” or “Very High” vulnerability, mainly in the south, while over 41% is “Low” or “Very Low,” especially in the Gulf of Bothnia. This assessment offers a harmonized spatial baseline to support sustainable coastal planning and adaptation efforts in Sweden and provides a comparative framework for coastal vulnerability studies across northern Europe.

1. Introduction

The shoreline represents the dynamic interface between land and sea, constantly reshaped by waves, tides, currents, and sediment transport [1]. While coastal erosion, defined as the landward retreat of the shoreline due to sediment loss, has always been part of natural coastal evolution [2], it poses a growing risk when it outpaces deposition. This is leading to irreversible land loss that threatens ecosystems, infrastructure, and human settlements. Monitoring coastlines and understanding shoreline behavior are therefore critical for effective coastal risk assessment and long-term planning [3,4]. This is especially urgent in Arctic and sub-Arctic regions, where climate change is accelerating coastal change through rising air and sea temperatures, declining sea ice cover, permafrost thaw, and increasingly frequent and intense storms [5,6]. These combined drivers are causing Arctic coastlines to retreat at rates of several meters per year [7], reshaping landscapes and increasing hazards for local communities [8]. In this context, systematic mapping and monitoring of coastal change are essential for identifying vulnerability hotspots, guiding adaptation efforts, and informing spatial planning in these rapidly evolving environments.
Sweden’s extensive and ecologically diverse coastline is also experiencing growing climate-related pressures. These include sea-level rise, intensified storm surges, coastal erosion, and saltwater intrusion [9,10,11]. Beyond gradual and climate-driven processes, coasts may also be affected by more sudden coastal hazards. Examples include tsunamis generated by submarine landslides [12], or by atmospheric pressure shocks [13] that can amplify wave impacts in semi-enclosed coastlines [14]. Rip currents can intensify under specific wave conditions [15] as well as extreme wave events [16], posing risks to both beach safety and sediment transport. The soft-soil coasts of southern Sweden already face significant erosion, while sub-Arctic and temperate regions show environmental changes comparable to those observed in higher latitudes [17].
In response, several municipalities in southern Sweden have implemented both hard-engineering solutions, like sea walls and groynes, and softer, nature-based measures such as dune stabilization and coastal zoning (Figure 1) [18,19]. The importance of coastal monitoring has grown significantly as local governments and the European Union prioritize climate adaptation and risk mitigation. At the policy level, both the United Nations Sustainable Development Goals (SDGs) and the EU Adaptation Strategy emphasize the need for inclusive, data-driven, and forward-looking planning to enhance climate resilience, particularly in vulnerable coastal zones [10,20].
Το this end, the wide spectrum of geoinformation technologies provide an effective and efficient approach to assessing risks across large regions [21]. In particular, On the one hand, Earth Observation (EO) enables reliable and continuous monitoring of shoreline changes, making it possible to detect rates of coastal change and emerging trends with consistency. When this information is combined with complementary geospatial data, such as elevation, bathymetry, or population density, it becomes possible to conduct more in-depth and accurate assessments of coastal vulnerability. On the other hand, Geographic Information Systems (GIS) serve as an ideal tool for integrating these datasets and producing visual outputs that both enhance analysis and improve communication. By converting complex geospatial information into clear and accessible maps, GIS supports decision-making and stakeholder engagement, especially in remote and data-scarce areas like the Arctic [22]. Overall, the combined use of EO and GIS enables precise and cost-effective vulnerability assessments, presenting important observations into the dynamics of Arctic coastal systems [23].
Among the most widely applied geoinformation-based methods for coastal risk assessment is the Coastal Vulnerability Index (CVI) [24]. First developed by [25] and later refined by [26], the CVI is a semi-quantitative approach that integrates multiple physical parameters. Specifically, coastal slope, geomorphology, relative sea-level change, shoreline change rates, mean tidal range and mean significant wave height are each evaluated and assigned a vulnerability score. These scores are then combined into an overall index classification. The CVI provides a simple numerical basis for evaluating and comparing different coastline segments based on their potential for physical change and can be effectively visualized through maps. The method has been extensively applied in diverse geographical contexts, including the United States, Europe, and Asia [27,28,29,30].
Given the growing concerns about coastal vulnerability and the threats associated with climate change, this study contributes to advancing the understanding of shoreline sensitivity in high-latitude regions such as Sweden. The analysis is based on standardized physical parameters within a GIS-based framework and integrates EO (see Section 2.2) and other geospatial datasets to enhance the resolution and accuracy of coastal risk mapping. A further aim of this study is to identify the physical parameters most strongly associated with high vulnerability along Sweden’s coastline. By applying an internationally recognized method, the results offer a consistent spatial overview that can inform adaptation planning and support cautious comparisons with other Arctic and sub-Arctic coastal regions.

2. Experimental Setup

2.1. Study Area

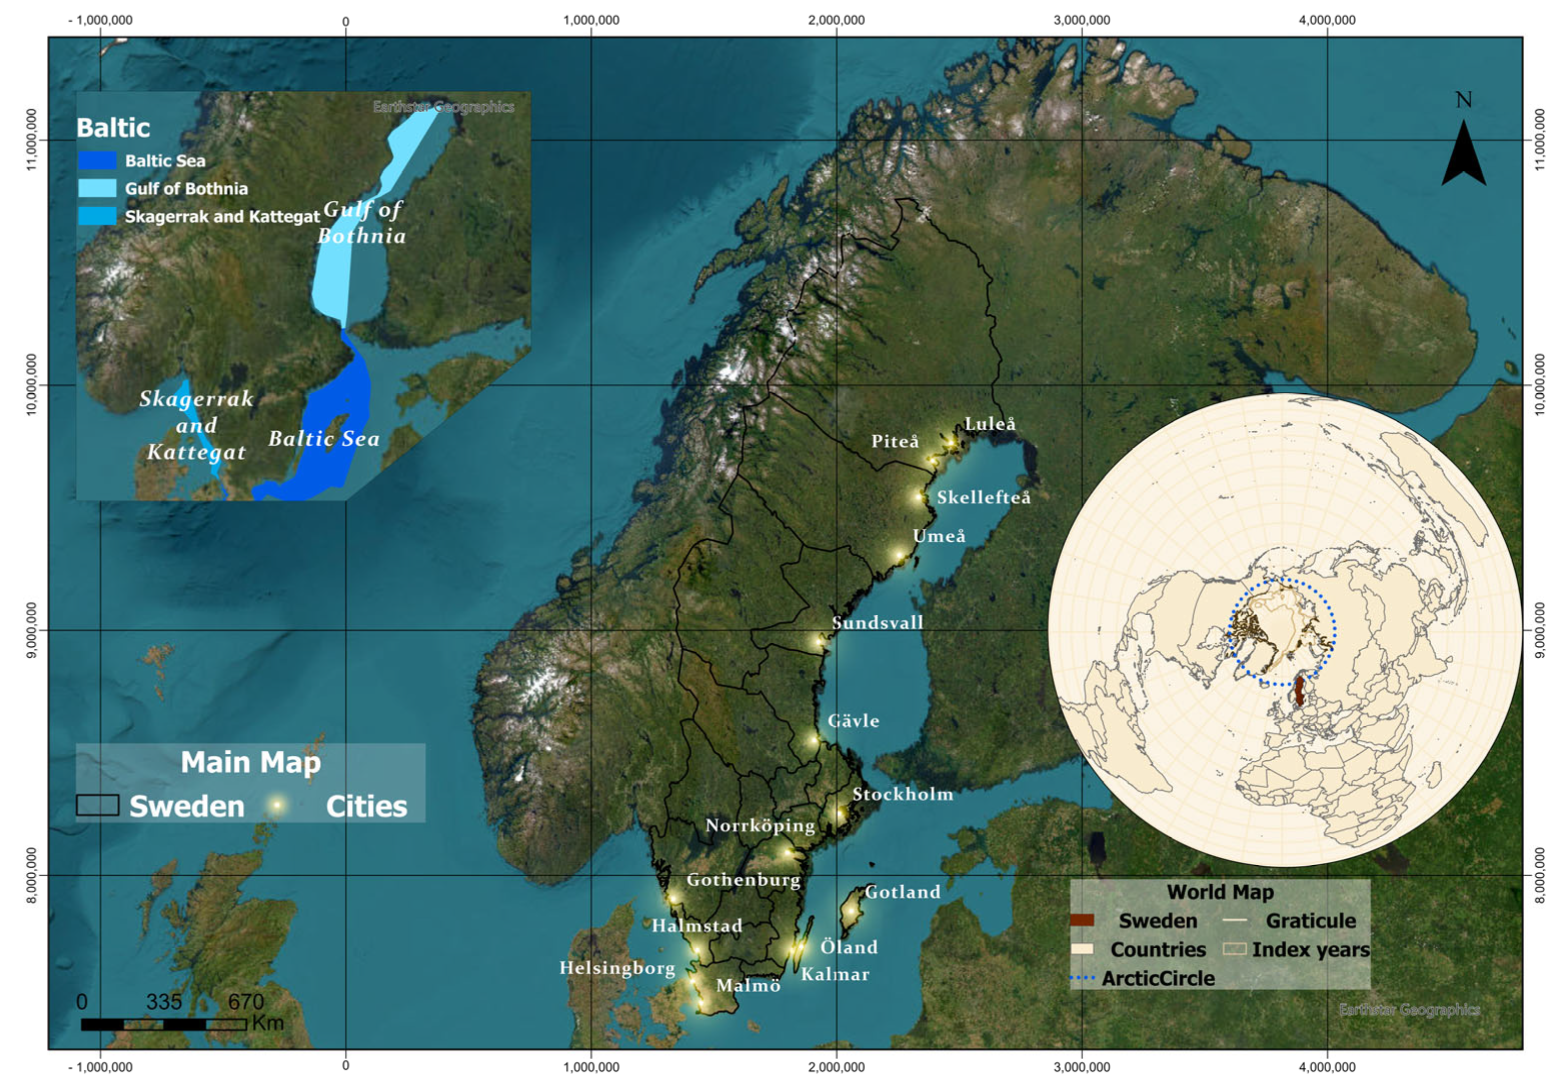
Sweden was selected as the study area for three main reasons. First, parts of its coastline face growing environmental pressures, including sea-level rise and erosion, which have already led to measurable shoreline retreat. In certain locations, particularly in low-lying soft-sediment shoreline recession has reached up to 200 m over the past 35 years, posing increasing risks to infrastructure and natural systems [10]. Geographically, Sweden is located in Northern Europe and extends from temperate zones in the south to sub-Arctic and Arctic conditions in the far north, sharing land borders with Norway and Finland. Its coastline spans more than 44,000 km, including islands [31], and borders the Gulf of Bothnia, the Baltic Sea, the Kattegat, and a portion of the Skagerrak, providing an indirect connection to the North Sea (Figure 2). The coastal landscape is highly varied: the southern shores are generally low-lying and erosion-prone, composed of unconsolidated glacial and post-glacial sediments, whereas the northern coasts are more rugged and underlain by resistant crystalline bedrock [31,32].
Combined with a well-documented history of coastal change, these stressors make this area an ideal setting for coastal vulnerability assessment. Second, the country’s coastline is highly diverse and geomorphologically complex, stretching from temperate to sub-Arctic zones and encompassing nearly 100,000 islands [33]. This geomorphological variability enables the application of the CVI across different types of coastal environments. Third, the region benefits from long-term, high-quality geospatial and environmental datasets, as well as active climate adaptation policies, all of which support integrated, large-scale assessments. Furthermore, Sweden’s inclusion in the ongoing EU-funded EO-PERSIST project (https://eo-persist.eu/, accessed on 25 May 2025) enabled field-based research and facilitated strong institutional collaboration. This combination enhanced both the analytical depth of the study and the broader dissemination and awareness of coastal vulnerability challenges. Given its exposure to the early effects of global change, the Baltic Sea coasts serve as valuable reference point for assessing coastal vulnerability in comparable Arctic and sub-Arctic regions [34].

2.2. CVI Variables

To assess Sweden’s coastal vulnerability, the CVI approach brings together multiple physical variables, including geomorphology, coastal slope, hydrodynamic parameters, and shoreline change rates. In order to generate detailed vulnerability profiles for Sweden’s diverse coastal regions, data were sourced from the national institutions Swedish Meteorological and Hydrological Institute (SMHI), the Geological Survey of Sweden (SGU), the Swedish Maritime Administration (SMA), as well as from the European platform, EMODnet. These data sources were selected based on their reliability, recent updates, and the availability of long-term time series, as required for the Coastal Vulnerability Index assessment [35]. Table 1 summarizes the dataset, with the following sections elaborating on each parameter.

2.2.1. Geomorphology

The geology, geomorphology, and presence of coastal defenses largely determine how resilient or vulnerable a coast is to erosion and flooding integrates information on geological structure, lithological composition, morphodynamics, and the coastal zone’s historical evolution. It largely determines the natural resistance of coastlines to erosion processes and long-term geomorphological changes [35]. At the same time, it remains one of the most challenging variables to verify without field measurements or the use of aerial photogrammetry, due to the complexity and variability of coastal landforms [36]. In this study, geomorphological classification was achieved primarily through EMODnet, an initiative involving over 160 organizations that collectively compile, harmonize, and disseminate marine geoscience datasets. Specifically, the “coastal type” layer from the EMODnet geology map was utilized to categorize shoreline features. To validate and enhance the accuracy of this classification, high-resolution satellite imagery from Google Earth Pro was analyzed, allowing for visual confirmation of landform features such as cliffs, beaches, estuaries, and rocky shores. Additionally, geological data from the SGU were consulted to support the identification of underlying lithological formations and assess material erodibility.

2.2.2. Coastal Slope

Coastal slope plays a critical role in shaping nearshore wave behavior by determining how wave energy is dissipated and how sediments are transported and redistributed along the coast [37]. In this study, slope values were calculated using a 32-m resolution Digital Elevation Model (DEM) from OpenTopography, based on ArcticDEM Version 4 mosaics released in July 2023. This source was chosen for its consistent elevation coverage across the region, high spatial resolution, and open access, making it suitable for large-scale coastal analysis. Slope (%) was computed by dividing the vertical rise of 30 m by the horizontal distance between the 0 m shoreline and the inland 30 m contour (Equation (1)):
S l o p e   % = R i s e   30   m R u n   D i s t a n c e     100
Variations in the coastal slope strongly influences how much wave energy reaches the base of the coast, especially during storm events. Slopes below 2.5% are generally more vulnerable, as they allow storm surges and wave energy to penetrate further inland. Slopes above 20% contribute to enhanced energy dissipation and resilience against erosion [38].

2.2.3. Hydrodynamic Parameters

To assess the hydrodynamic contribution to coastal vulnerability, three key parameters were incorporated into the CVI framework: Relative Sea-Level Change (RSLC), Mean Significant Wave Height and Tidal Range. Each was derived from national datasets and previous scientific studies, and selected for their direct influence on coastal inundation, erosion, and sediment dynamics [39].
RSLC was calculated using projections from SMA and SMHI, based on the IPCC SSP5-8.5 scenario for 2100 [40]. These projections were already locally adjusted for post-glacial land uplift using the NKG2016LU geodetic model [41] and referenced to Sweden’s official vertical datum, RH 2000. RSLC rates (in mm/year) were estimated from 86 tide gauge stations by calculating the difference in projected mean sea level between 2025 and 2100 [41].
Tidal range is defined as the difference in height between the highest and lowest tides [42]. Mean tidal range was derived from SMHI tide gauge records [43], which document Sweden’s characteristically low tidal amplitudes. Semi-diurnal tidal ranges vary from approximately 10 cm in the Skagerrak to less than 5 cm in the Baltic Sea. These values were classified uniformly due to minimal spatial variation, recognizing that low tidal range can amplify erosion by focusing wave energy over a narrower vertical profile [39].
Significant wave height, defined as the mean of the highest one-third of waves, is a key control on coastal evolution [43]. Wave energy is directly related to wave height, governing processes such as sediment transport and erosion. Mean significant wave height data were obtained from SGU’s numerical wave model outputs [44], covering the western and southern coasts of Sweden, and from long-term Baltic Sea wave records [45], covering the northern coastline. Together, these datasets provide consistent, model-based nearshore wave information along the entire Swedish coastline for the period 1979–2018.

2.2.4. Shoreline Change

Shoreline change is also an important parameter in the CVI, as it shows whether coasts are gradually eroding or gaining land over time, which is a key factor for understanding how stable a coastal area is. These long-term trends can have serious consequences for infrastructure, ecosystems, and coastal communities. As climate change increases pressure on coastlines, shoreline change becomes even more relevant [46,47]. For this study, shoreline change data from the EMODnet Coastal Migration dataset were used, which combines satellite imagery from ESA Sentinel-2 and NASA’s Landsat missions (5, 7, and 8). These satellites provide spatial resolutions between 10 and 30 m, with image updates every 1–2 weeks. The EMODnet team processed this imagery (2007–2017) using tools such as Google Earth Engine to extract long-term shoreline trends. Using this dataset allowed for consistent and well-documented shoreline change estimates across Sweden’s coast, which helped improve the reliability of our CVI analysis.

3. Methodology

3.1. Pre-Processing

For the CVI estimation, the Swedish coastline was segmented into more than 2000 units in the GIS environment, allowing the index to be calculated separately for each individual stretch of coast. A key focus during this stage was on the geomorphological classification, particularly addressing unique features of the Swedish coastline such as “green beaches”, low-lying, vegetated zones with partial marsh characteristics. These areas pose classification challenges due to their hybrid nature, however while vegetation provides stabilizing functions similar to dune systems, their elevation and sediment type often increase vulnerability. To resolve this, updated geomorphological data were integrated from EMODnet and high-resolution imagery (Google Earth Pro), capturing the dual ecological and physical nature of these areas.
Future sea-level projections were derived from SMA and SMHI datasets, based on IPCC SSP5-8.5 median scenarios. These projections were adjusted using the NKG2016LU model to incorporate local glacial isostatic adjustment (GIA). RSLC was calculated for 86 tide gauge stations using the formula (Equation (2)):
R S L C   m m y e a r   =   M S L 2100     M S L 2025 75
where MSL2100 and MSL2025 are the calculated mean sea level of each tide gauge for the year 2100 and 2025 relatively [41]. The denominator of the fraction is derived from the time difference 2100–2025.
Mean significant wave height data were sourced from SGU model and Baltic Sea records and interpolated via Thiessen polygons. The analysis was conducted using long-term datasets (3-hourly, 1979–2018), which inherently include seasonal variability and storm events, capturing overall wave exposure rather than short-term extremes. The protective role of archipelagos and offshore islands was integrated into exposure assessments, as these features can significantly attenuate wave energy. Each coastal segment’s wave height was then scored from 1 (low exposure) to 5 (high exposure), based on adjusted regional mean significant wave height values.

3.2. CVI Calculation

Once the preprocessing stage was completed, the CVI was calculated using ArcGIS Pro (v. 3.4.3). The methodology requires that each parameter is individually scored on a scale from 1 (very low) to 5 (very high) to reflect increasing levels of vulnerability. Specifically, higher values indicate greater susceptibility to that particular factor. The classification criteria used for scoring are presented in Table 2, while Equation (3) shows the formula used to compute the final index.
C V I = a b c d e f 6
where a = geomorphology, b = coastal slope, c = relative sea-level change, d = shoreline displacement rate, e = mean tidal range and f = mean significant wave height. Finally, the resulting CVI map was exported in GeoTIFF format for further visualization and analysis.

4. Results

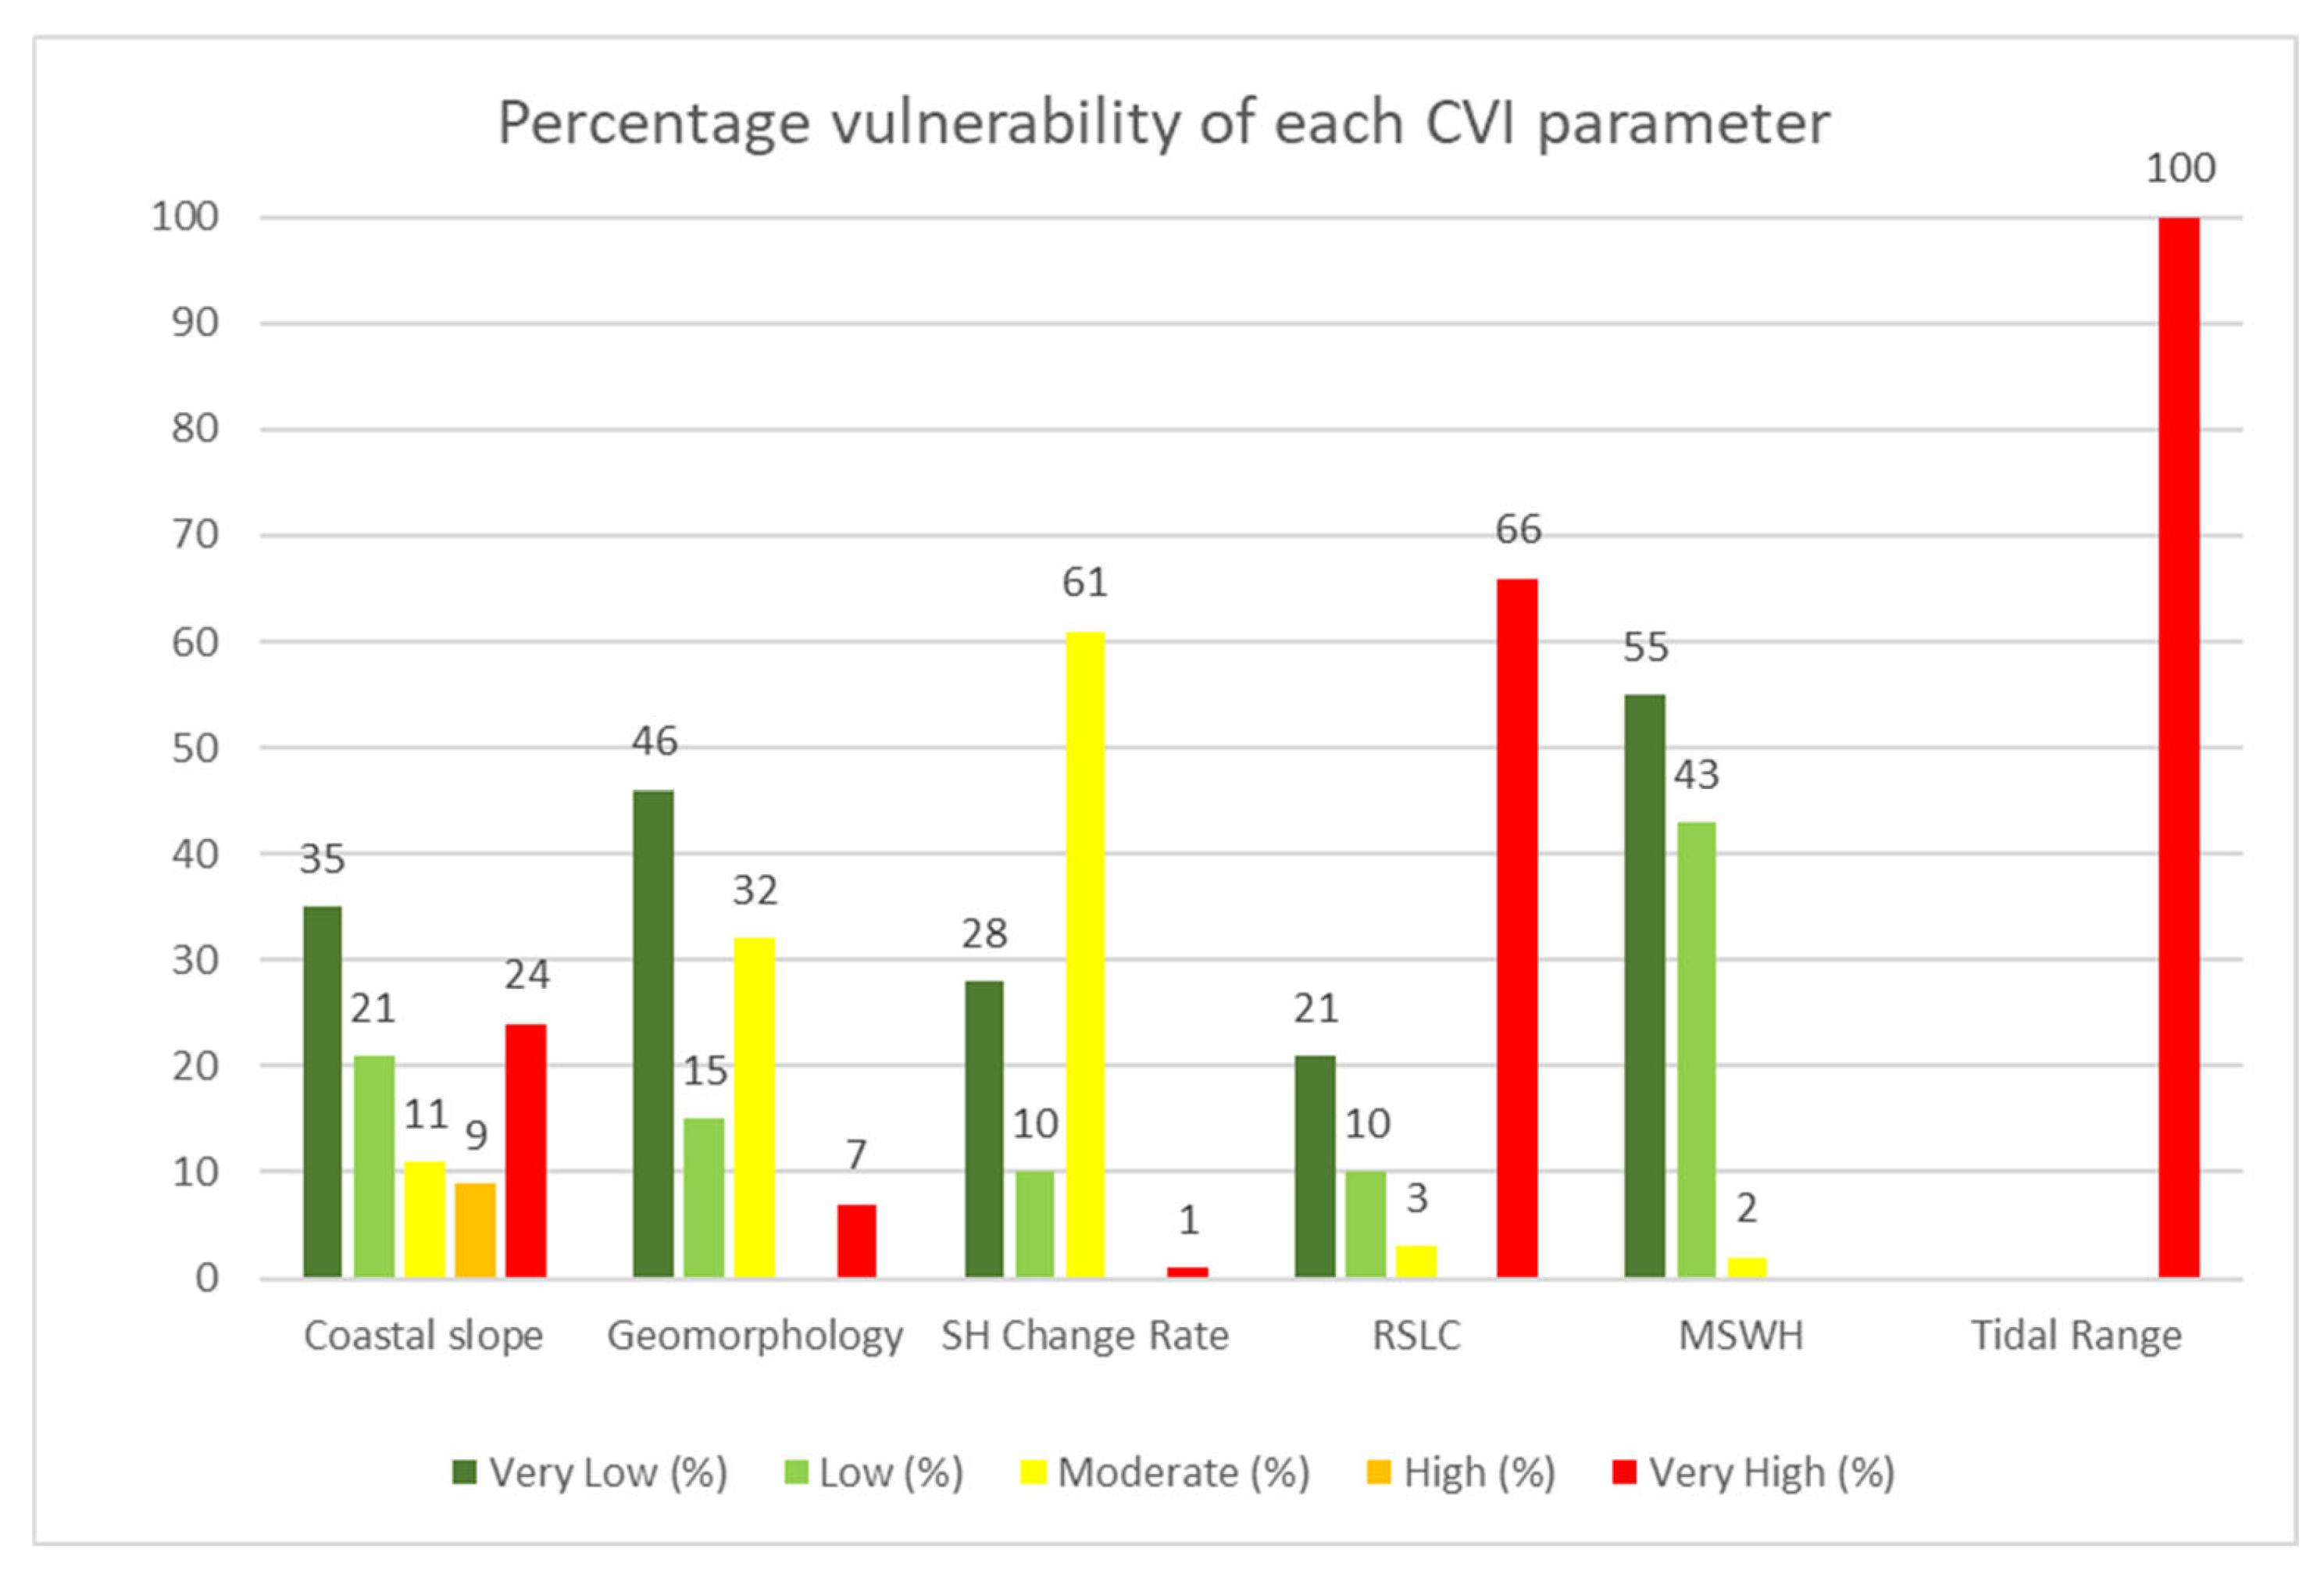
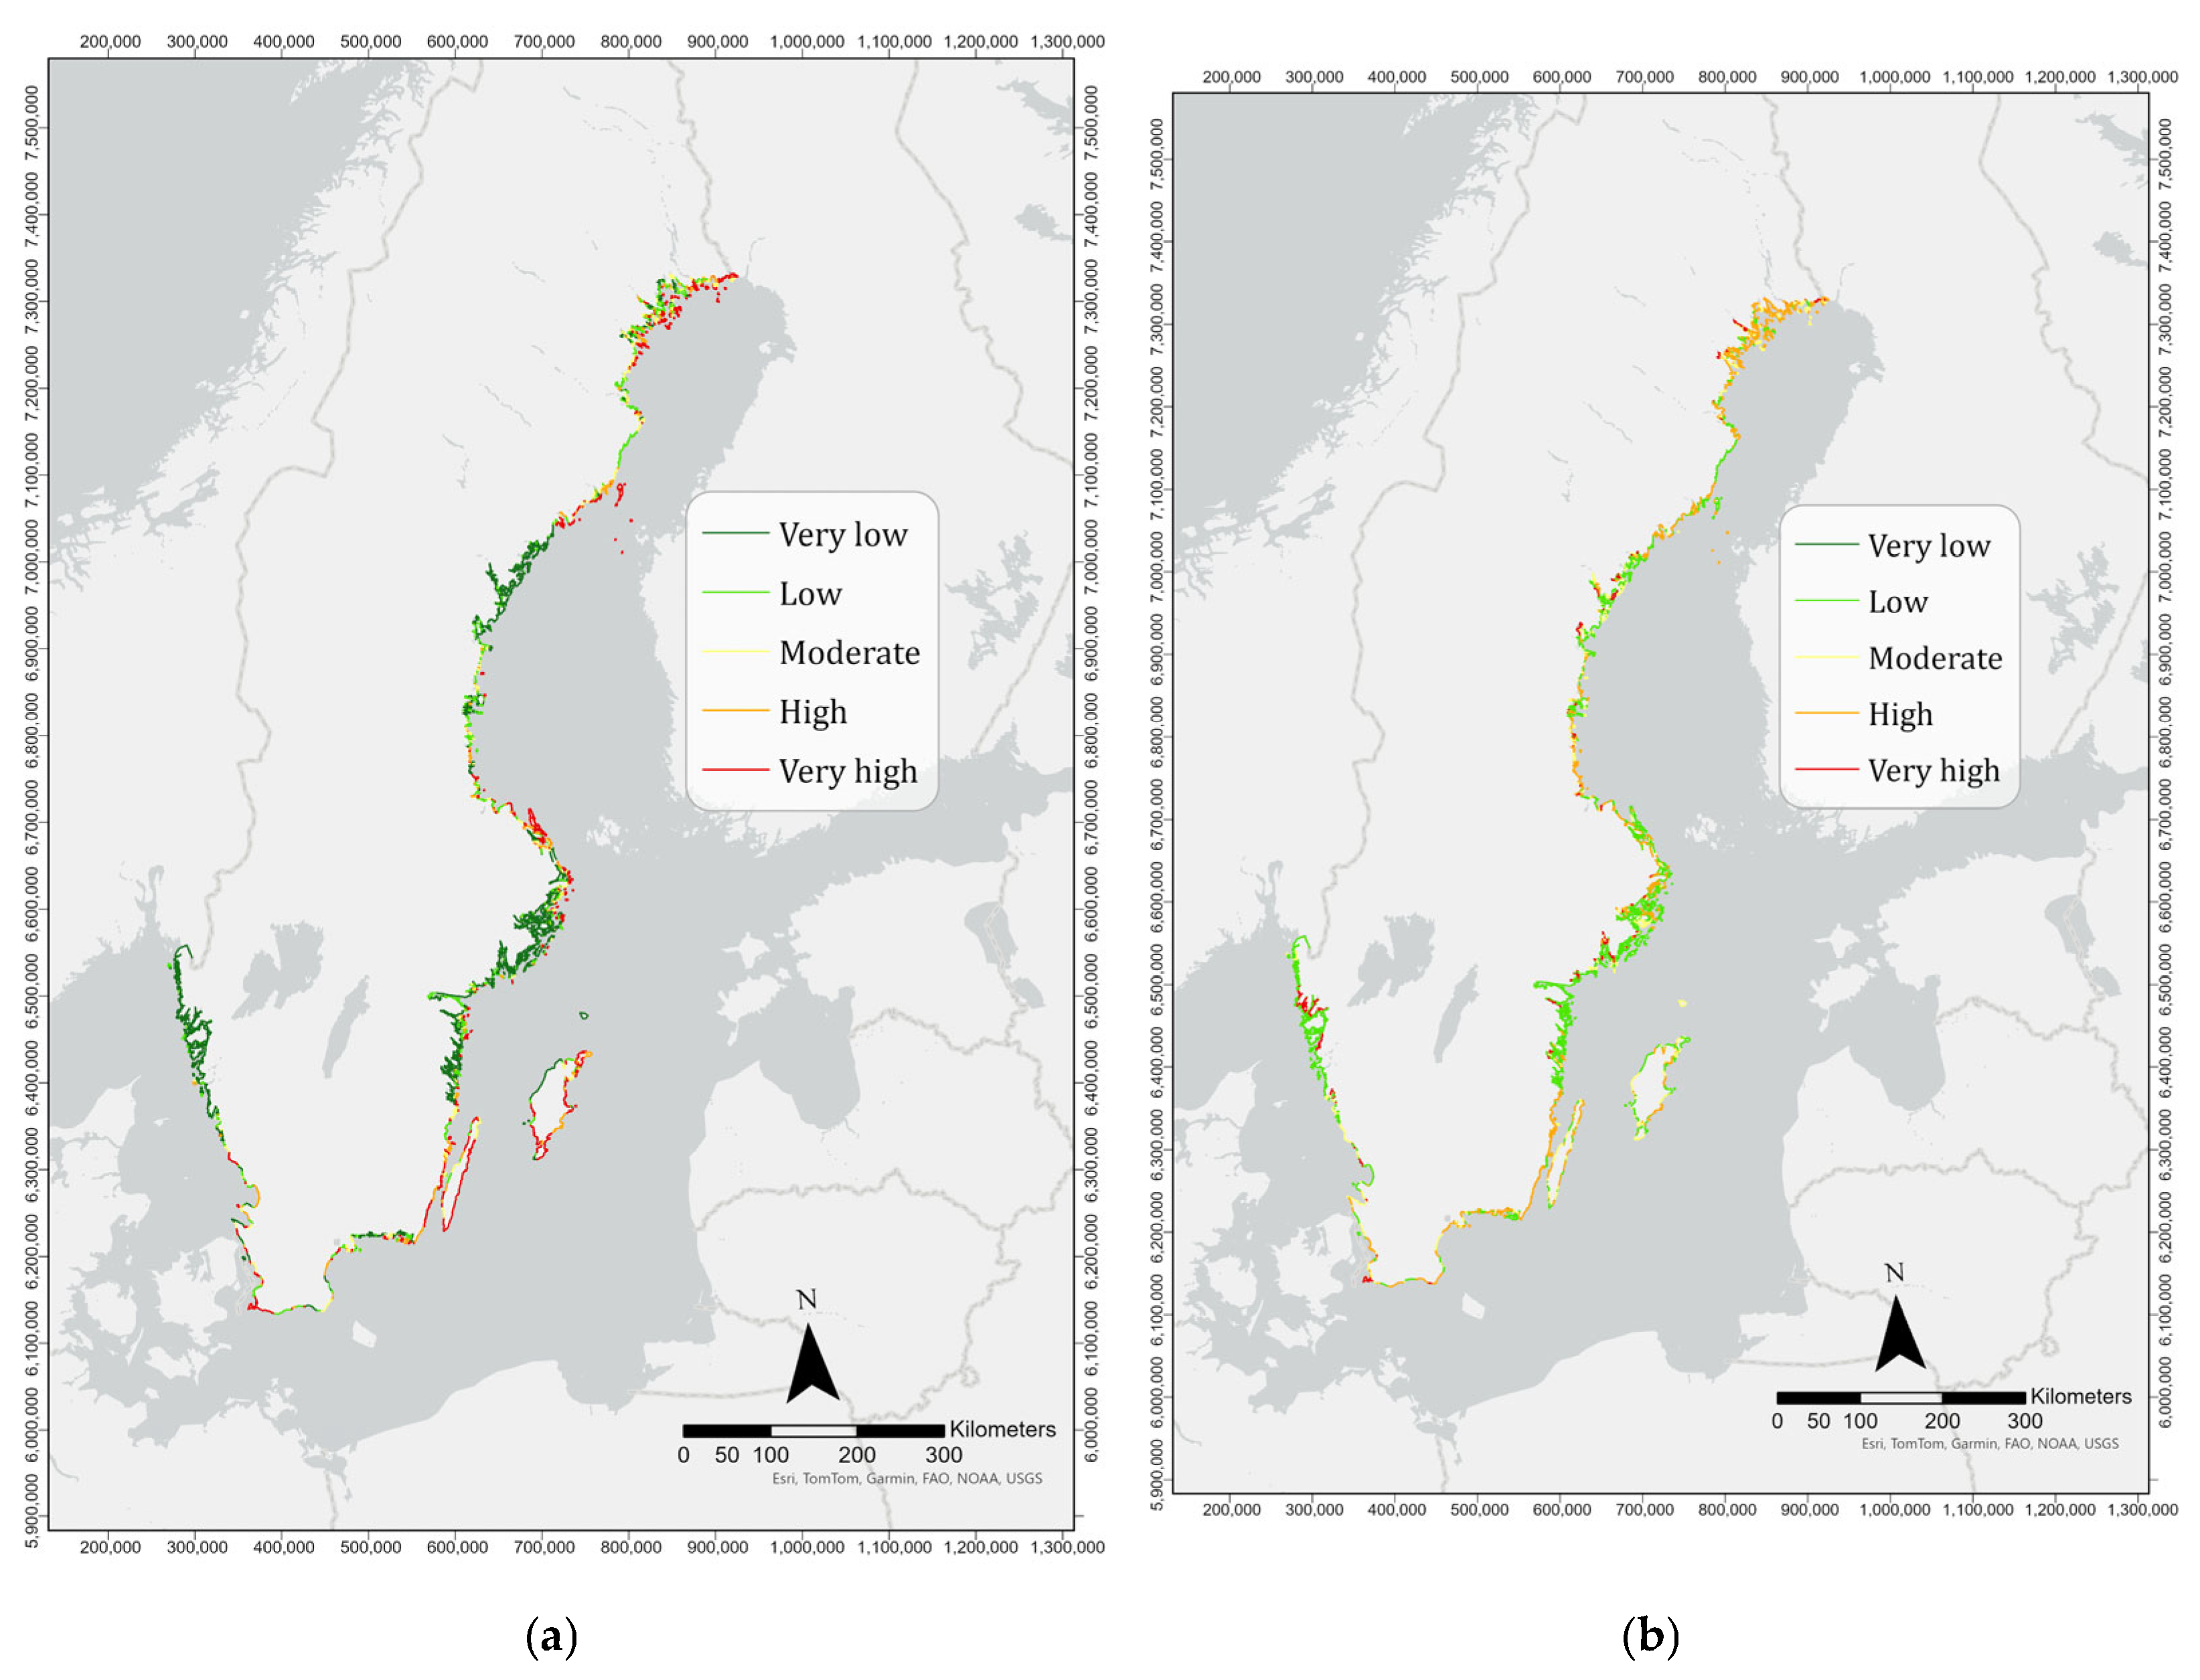
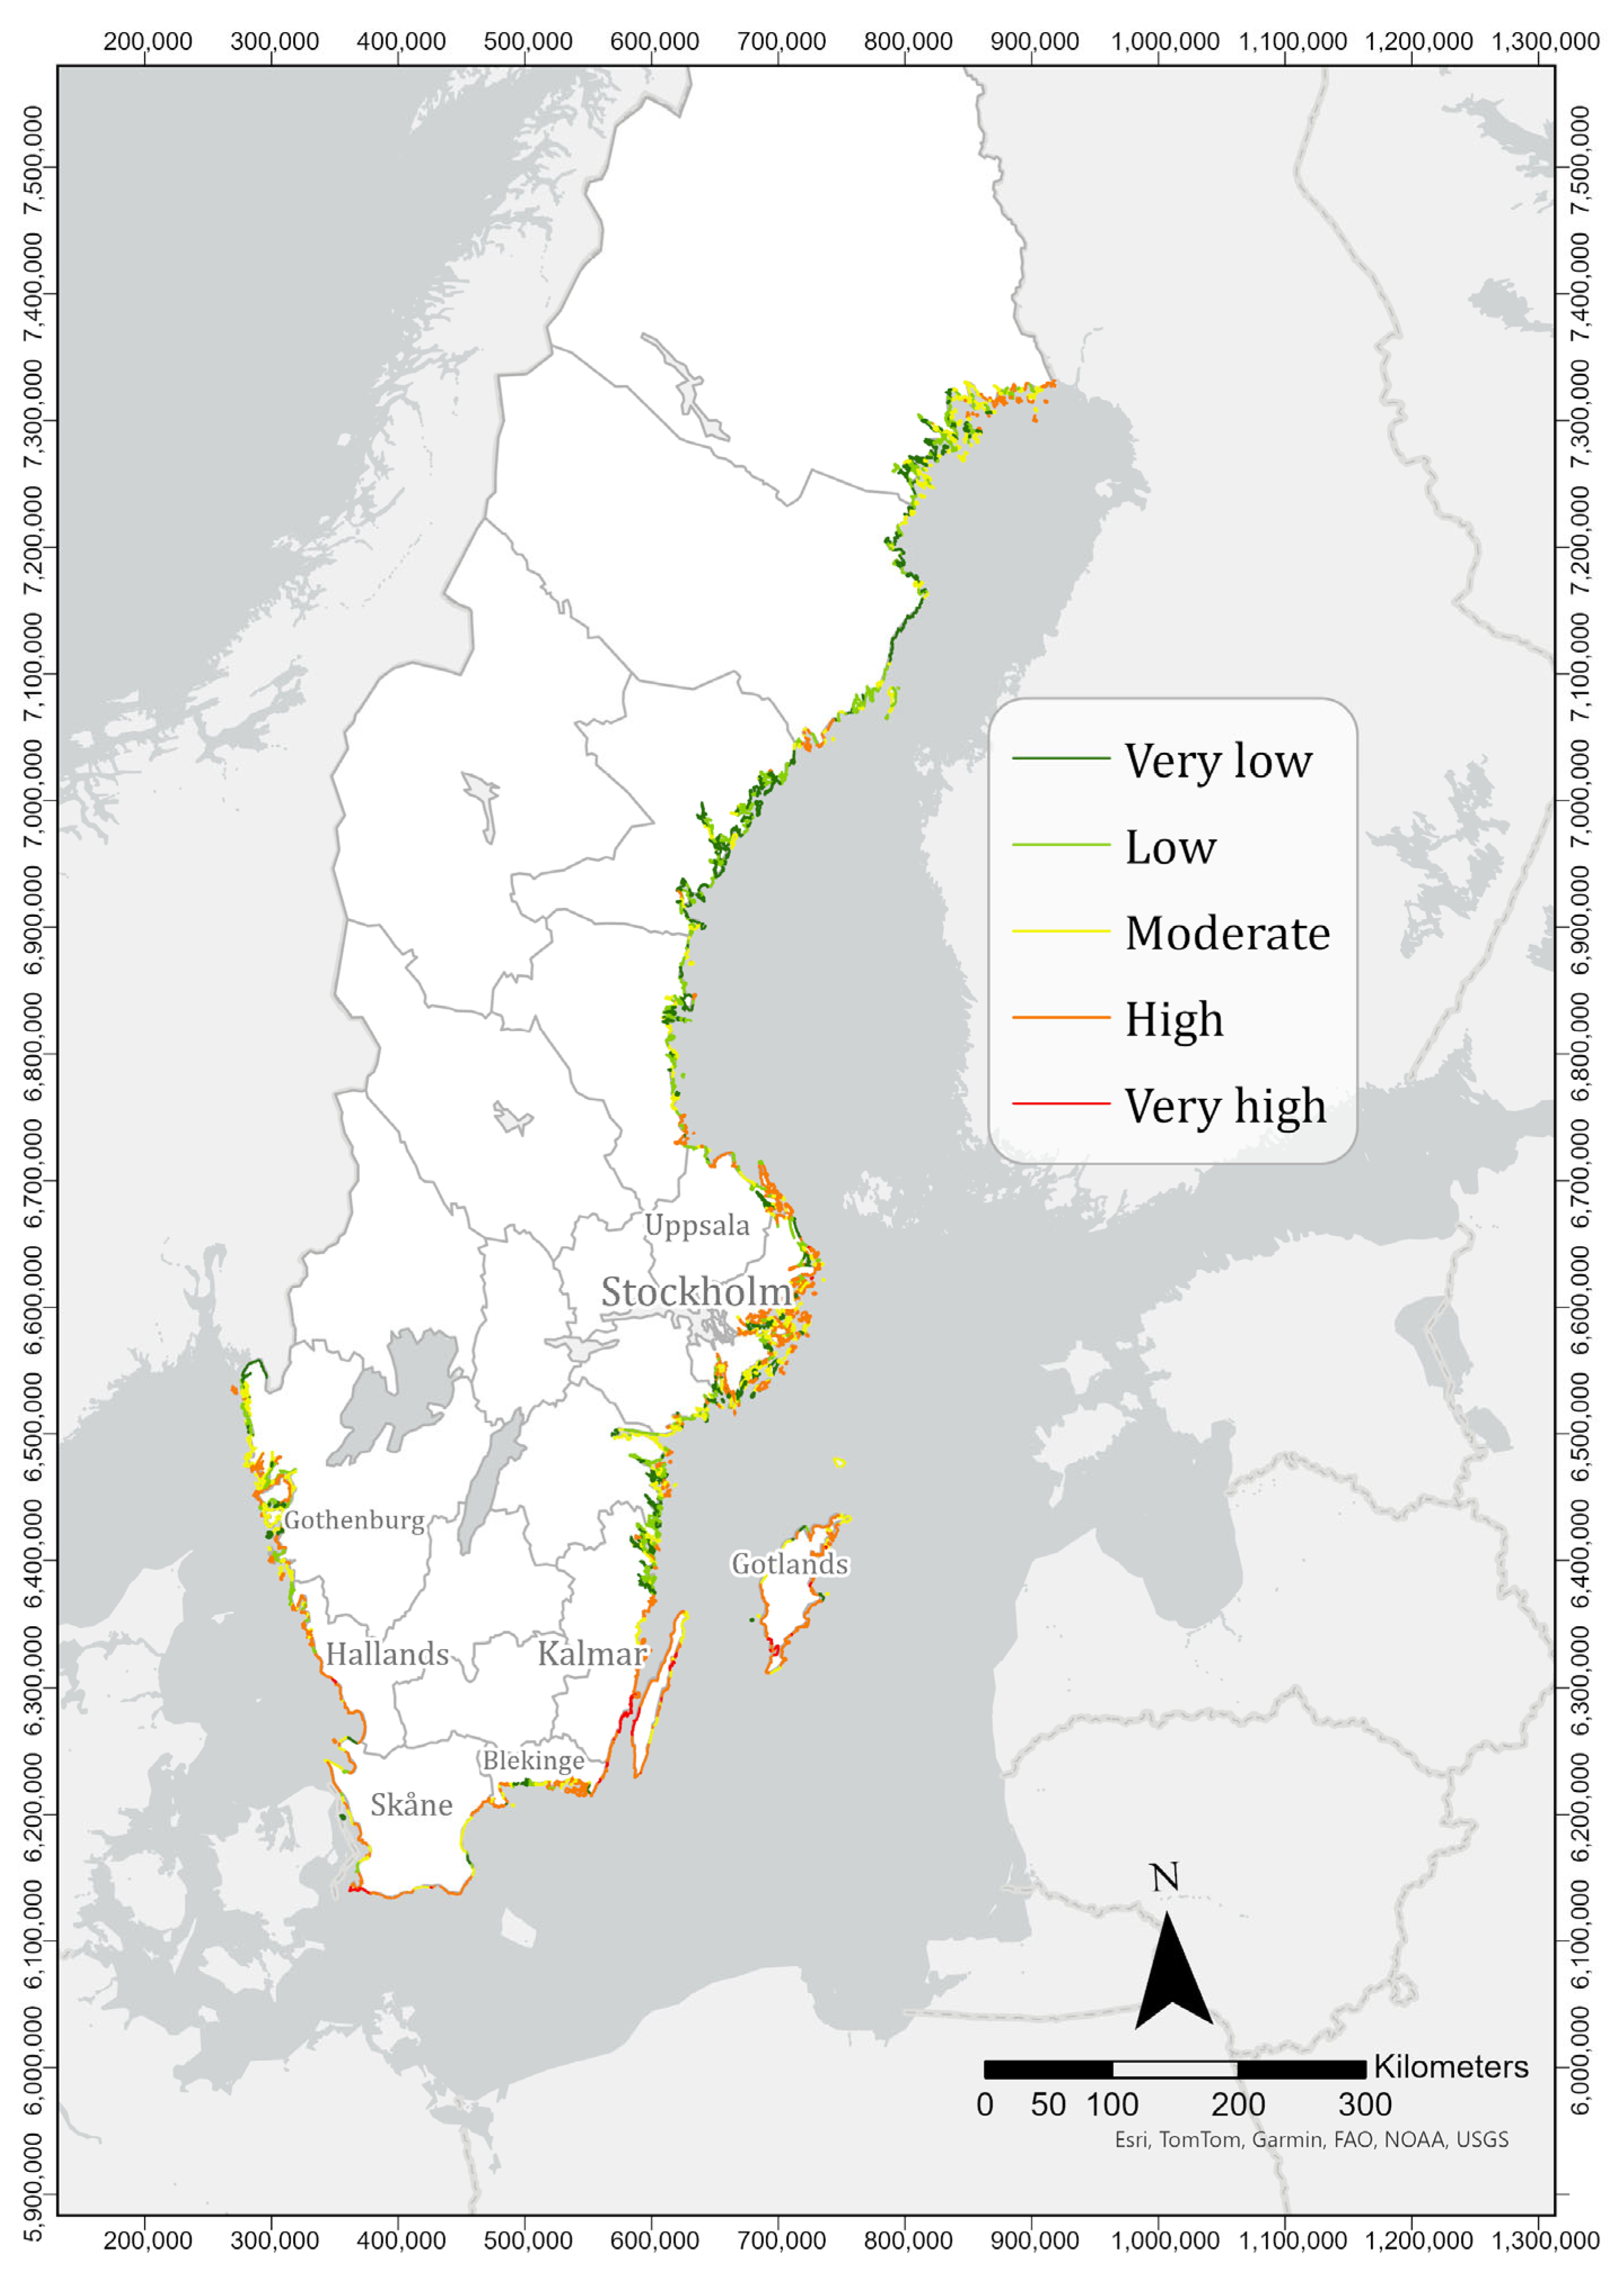
The results of the CVI assessment reveal substantial spatial variation in the vulnerability of Sweden’s coastline, both in the overall index and across the six contributing parameters. Figure 3 shows the percentage distribution of vulnerability classes for each individual CVI variable, highlighting which parameters contribute most to overall coastal vulnerability. Figure 3 maps the spatial distribution of the six variables used in the CVI calculation: geomorphology, coastal slope, shoreline change rate, mean significant wave height, mean tidal range, and relative sea-level change. Figure 4 presents the final CVI classification of the Swedish coastline, divided into five levels of vulnerability ranging from very low to very high, and also includes a pie chart summarizing the proportion of coastline falling into each category. A detailed analysis each parameter and its spatial distribution is presented in the following sections.
Beginning with coastal slope, approximately 35% of the coastline falls within the steepest slope class (slope > 20%), which is generally associated with very low vulnerability (Figure 3, Table 2). Areas with high slope values (>7%), representing 21% of the coastline, are particularly concentrated along the Bothnian Sea and in the surroundings of major urban centers such as Gothenburg and Stockholm, which lie along the Skagerrak and the Baltic Sea, respectively. In contrast, 24% of the Swedish coastline is classified as highly vulnerable with respect to slope. These segments are primarily located in southern coastal zones exposed to the Baltic Sea, especially in Gotland, Kalmar, Sandviken, and Skanör (Figure 4a). These areas exhibit low slope angles, often below 2.5%.
The geomorphology variable in the CVI analysis shows a distribution comparable to that of coastal slope. Segments classified as having very low vulnerability account for 46% of the total coastline and are primarily located near Gothenburg and Stockholm. The moderate vulnerability class accounts for 32%, while 15% of the coastline falls under the low vulnerability category. Finally, 7% of the coastline is classified as very highly vulnerable based on geomorphological characteristics (Figure 3 and Figure 4b).
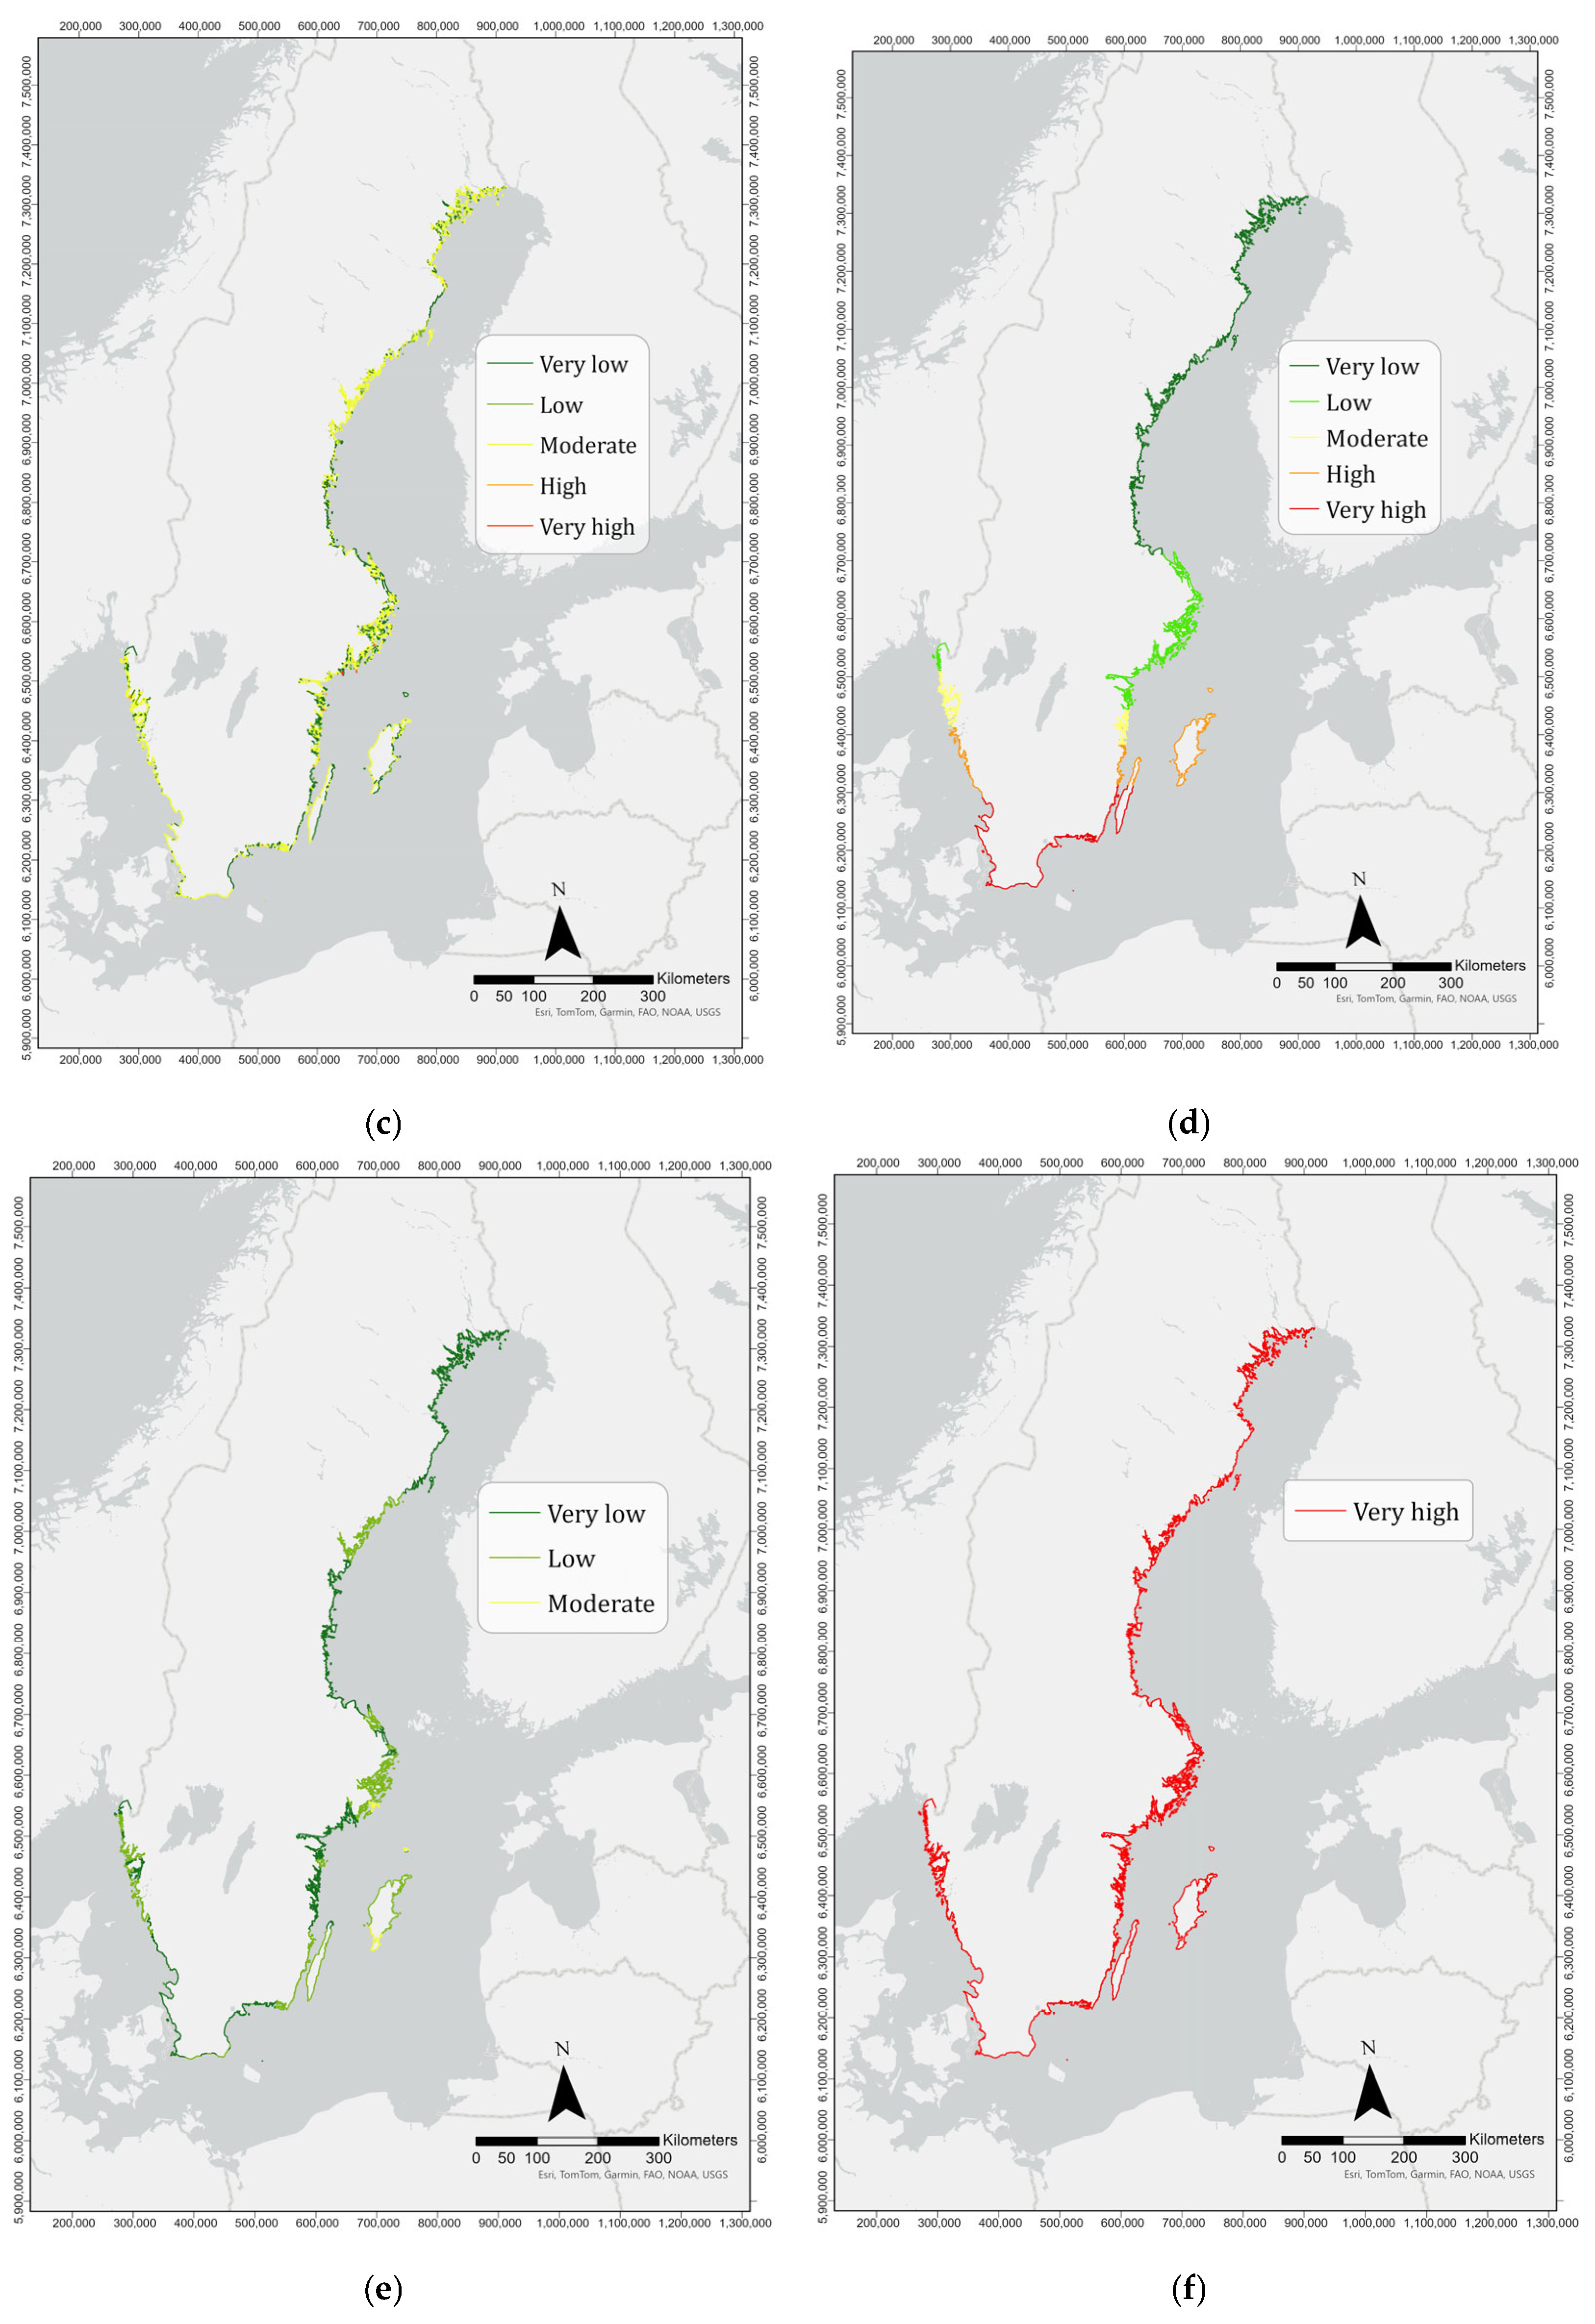
When examining shoreline change rates, more than half of the Swedish coastline (61%) falls into the moderate vulnerability class (Figure 3), with the majority of changes ranging between −1 and +1 m per year (Table 2). This is followed by segments classified as exhibiting low vulnerability (10%) with change rates between 1–2 m per year, and very low vulnerability (28%) where rates exceed 2 m per year (Figure 4, Table 2). A small portion of the coastline, less than 1%, exhibits very high vulnerability, while there is no segment characterized as highly vulnerable in terms of shoreline change rate. This corresponds to areas with localized erosion hotspots where shoreline change exceeds these typical ranges.
RSLC emerges as the dominant factor driving coastal vulnerability. Approximately 66% of the coastline is categorized under the very high vulnerability class in this component alone (Figure 3). The spatial distribution of sea-level trends reveals a distinct gradient: southern coastal zones experience the most rapid relative sea-level rise, while northern Baltic regions show reduced or even negative trends. (Figure 4d). This gradient highlights the importance of regional differences in glacio-isostatic adjustment, although the protective effect of land uplift appears insufficient in southern and low-lying areas.
Wave exposure, as measured by MSWH, showed relatively low contributions to overall vulnerability. No regions were classified as having high or very high vulnerability under this factor, with wave heights remaining below 1.05 m along the entire coast (Figure 4). Finally, the tidal range across Sweden is not exceeding 0.55 m. As a result, the entire coastline is classified under very high vulnerability in terms of tidal influence, based on the CVI ranking system, which considers low tidal amplitude a contributing factor to coastal erosion (Table 2, Figure 3).
The spatial distribution of vulnerability reveals distinct regional contrasts (Figure 5). The southern coast of Sweden, particularly the Kattegat region and Gotland, Kalmar, Sandviken, and Skanör, exhibits higher vulnerability, indicated by the red and orange segments on the map. These areas are likely influenced by low-lying terrain and more vulnerable geomorphological features, such as sandy beaches. In contrast, the northern coastline, including the Bay of Bothnia and the Bothnian Sea (Figure 2), shows very low to low vulnerability, which can be attributed to higher coastal elevations, vegetated shorelines, and reduced wave energy exposure.
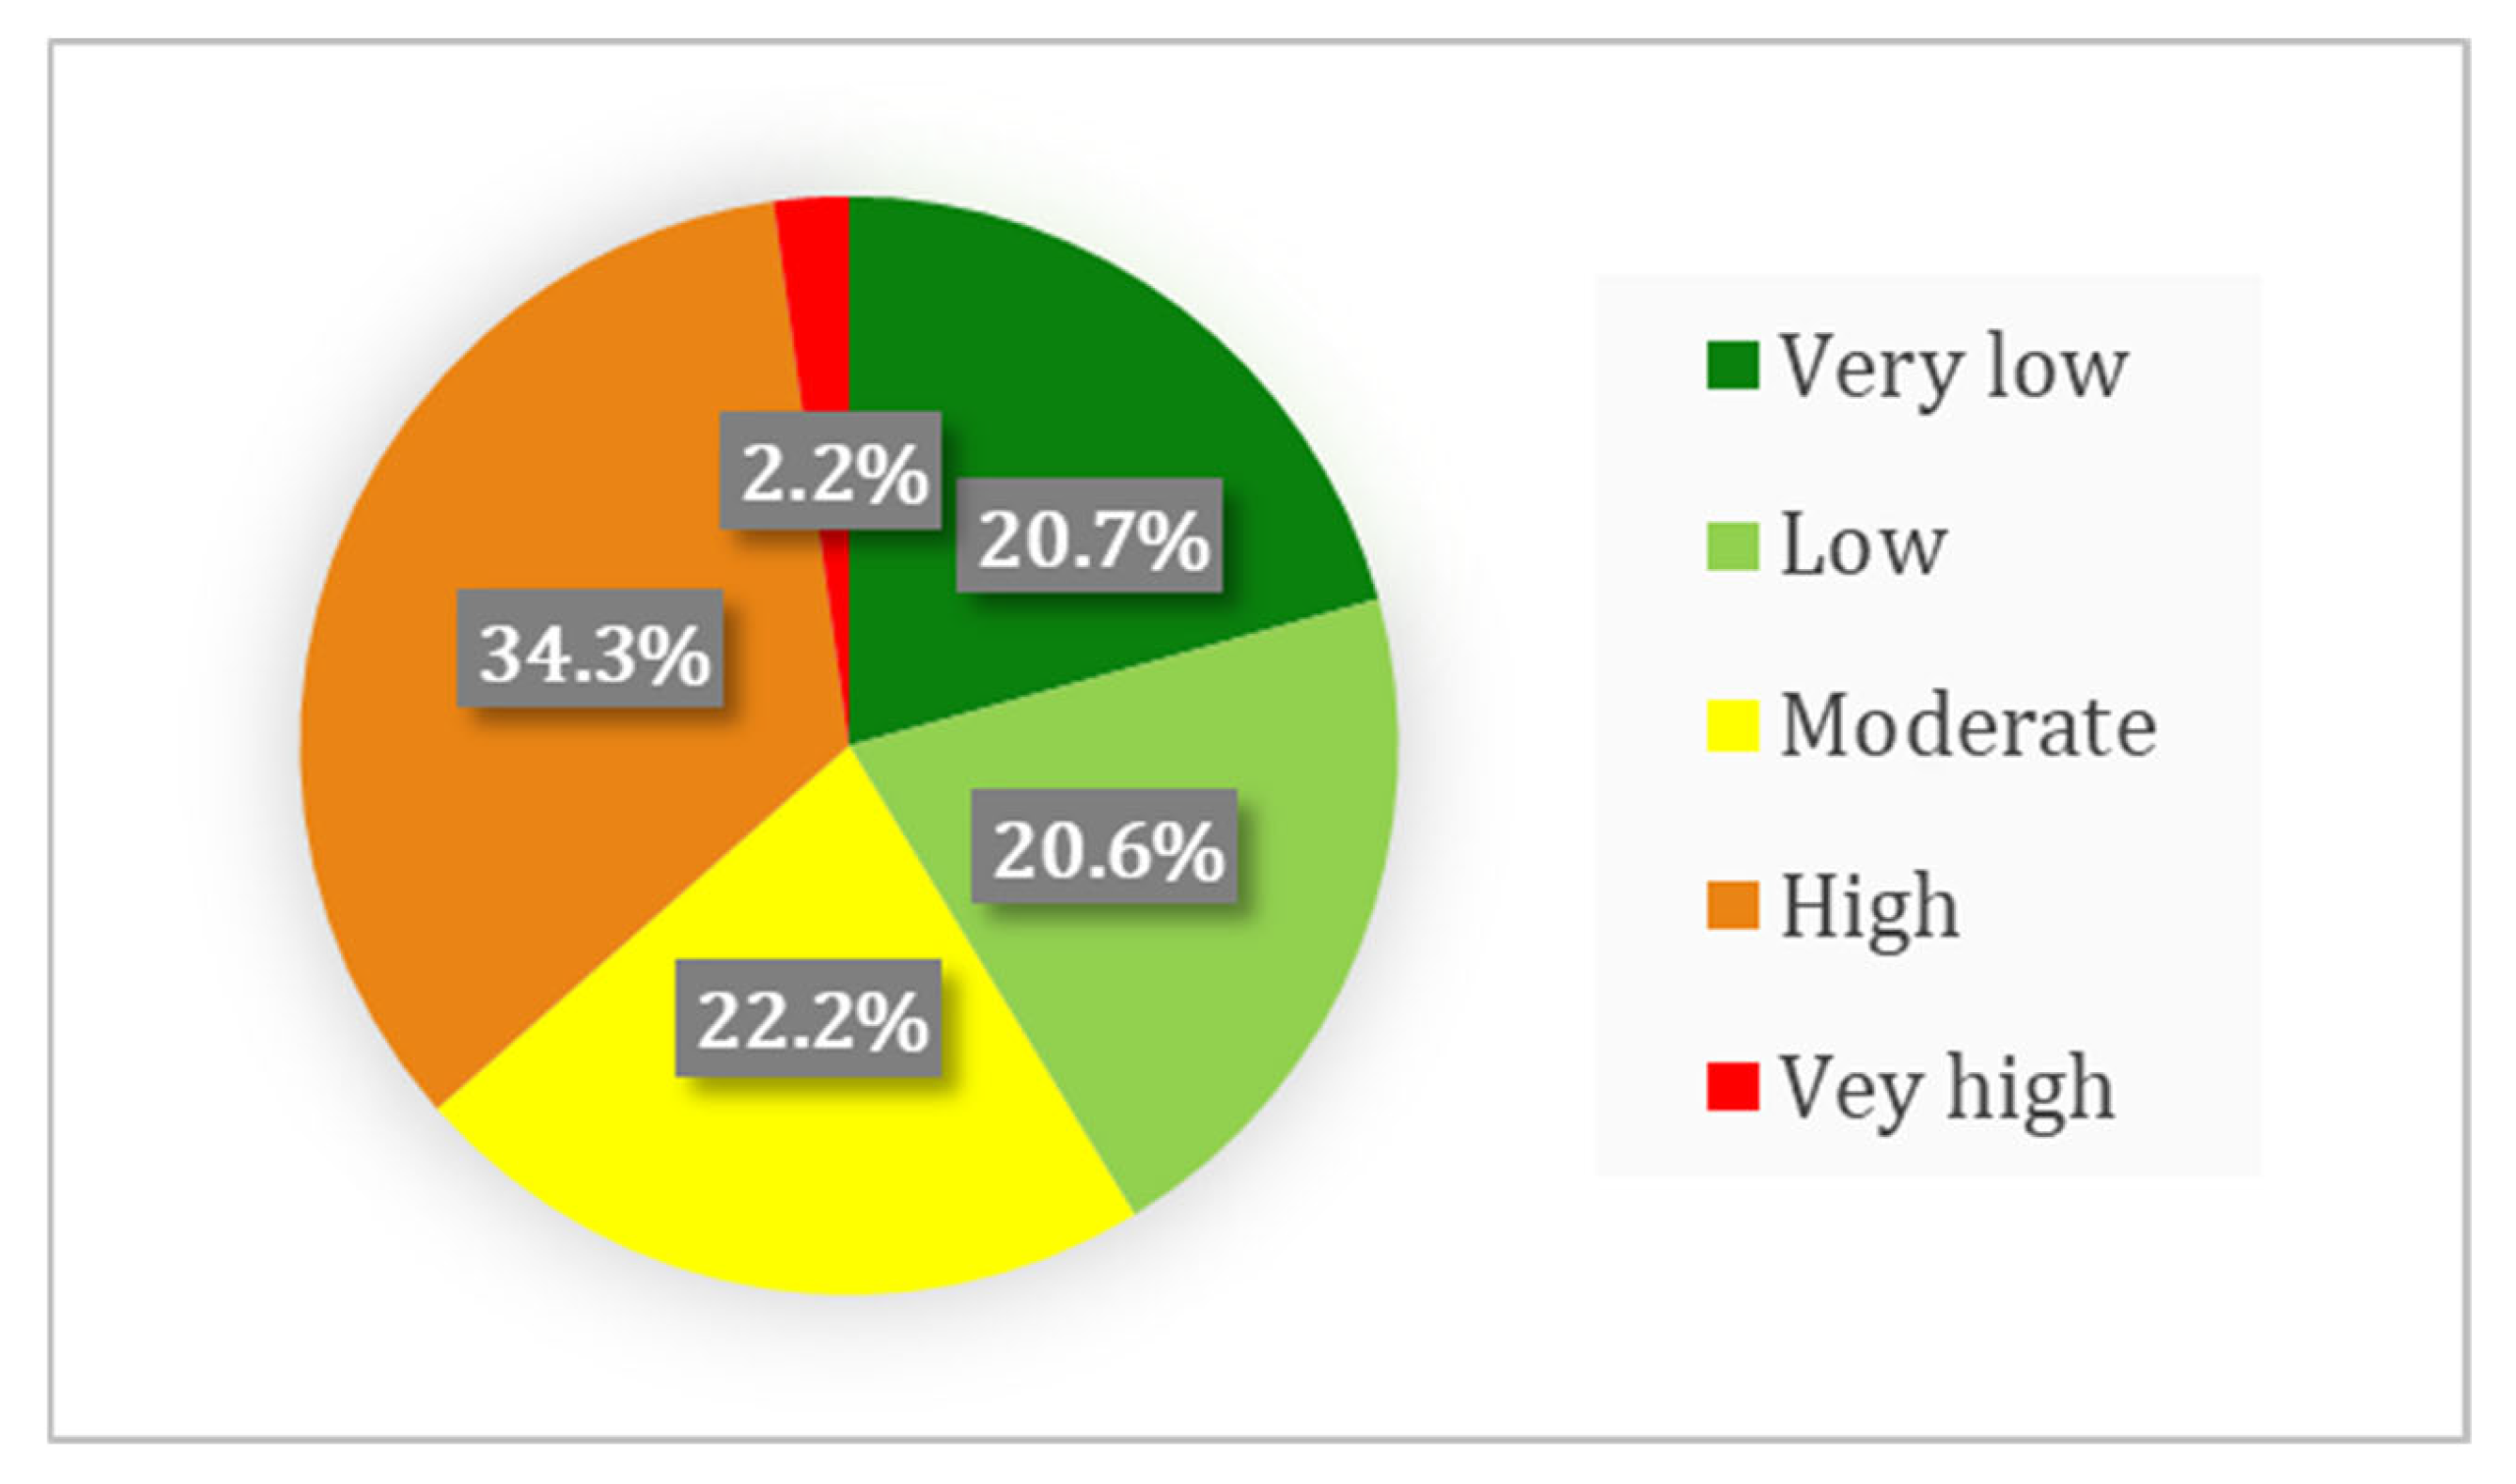
Overall, CVI results (Figure 6) indicate that the most prevalent vulnerability class is “High”, accounting for 34.3% of the Swedish coastline. This is followed by “Moderate” (22.2%) and nearly equal proportions of “Very Low” (20.7%) and “Low” (20.6%). Only a small fraction (2.2%) of the coastline is classified with “Very High” vulnerability. These findings suggest that, while certain regions face considerable risk, a substantial portion of the coastline demonstrates moderate to low susceptibility, likely due to favorable topographic and oceanographic conditions.

5. Discussion

The present study applied the CVI to evaluate spatial patterns of physical coastal risk along the Swedish shoreline, aiming to identify areas most prone to sea-level rise and erosion. Areas classified as highly vulnerable are predominantly located in the southern regions, particularly along the Baltic Sea, Skagerrak, and Kattegat, while the Gulf of Bothnia shows consistently lower vulnerability. This section discusses these findings in more detail, examining the contribution of each CVI parameter, comparing the results to those of related studies in the Baltic and Arctic regions as well as with other international coastal areas. Finally, it also considers the methodological limitations of the approach.
Regarding coastal slope, about 35% of the Swedish coastline features steep gradients (>20%) and is thus considered less susceptible to wave impact and flooding. These areas are especially concentrated around the Bothnian Sea and urban centers like Stockholm and Gothenburg. On the contrary, 24% of the coast, particularly in Gotland, Kalmar, Sandviken, and Skanör, exhibits gentle slopes and is classified as highly vulnerable (Figure 4a). This spatial pattern is consistent with the distribution of sedimentary and marshy landforms in southern Sweden, indicating areas of reduced natural resilience to coastal hazards.
The geomorphology of the region closely aligns with the spatial patterns observed in coastal slope vulnerability. Areas with low vulnerability in terms of slope are often characterized by erosion-resistant rocky shorelines or artificial coastlines such as harbors and engineered structures, features commonly observed around Gothenburg, Stockholm, and much of the Bothnian Sea coastline (Figure 4b). These regions are typically more resilient to erosion and sea-level rise due to their geomorphological characteristics and the human interventions. Conversely, southern parts of the country, especially around Skåne, show a predominance of sandy, vegetated, or marshy coastal types, associated with softer sediment composition and greater exposure. Approximately 46% of the Swedish coastline falls into the very low vulnerability category based on geomorphology, primarily reflecting the dominance of hard substrates or reinforced shores in the urbanized and glacially uplifted zones. In contrast, about 7% of the coast is classified as very highly vulnerable due to soft sediment environments, emphasizing the necessity for tailored coastal protection in those areas.
Shoreline change rates further illustrate the dynamics of coastal vulnerability. Approximately 61% of the Swedish coastline falls under the moderate vulnerability class, with shoreline changes ranging between −1 to +1 m per year. The remaining segments are characterized as having low (10%) and very low (28%) vulnerability, corresponding to shoreline progradation exceeding 1 m per year, often driven by anthropogenic activities such as land reclamation or coastal development. Although localized erosion hotspots represent less than 1% of the total coastline, they exceed typical erosion thresholds and are of critical importance, as they coincide with areas of minimal natural resistance and pose a significant threat to nearby infrastructure.
Among all factors, RSLC is the most significant contributor to overall vulnerability. Approximately 66% of the coastline is categorized as very highly vulnerable, underscoring the impact of glacio-isostatic differences across the country. While northern regions still benefit from land uplift, southern areas face compounded threats from ongoing subsidence and accelerated sea-level rise. These findings are consistent with previous studies [33,48], which emphasize the diminishing protective effect of land uplift in southern Sweden.
MSWH had only a minor influence on the final vulnerability classification of the Swedish coastline, as values remain consistently below 1.05 m. This limited wave action is largely due to the protective role of the Gulf of Bothnia and the numerous islands, which restrict wave fetch and reduce overall wave energy along the coast.
Tidal range, which remains uniformly low across Sweden (generally below 0.55 m), results in the entire coastline being classified as very highly vulnerable under the CVI framework. This classification reflects the broader understanding that waves remain in continuous contact with the dune foot or coastal base for extended periods, especially during storm surges, thereby increasing the shoreline’s exposure to erosion [48].
The spatial patterns of coastal vulnerability identified in this study generally align with previous research on Sweden’s southern coastline, particularly in regions such as Gotland, Kalmar, and Skåne. In Gotland, past investigations have emphasized the erosional susceptibility of the island due to its geological composition, especially the presence of marlstone formations, as well as the increasing impact of frost weathering and sea-level rise [49]. These observations are consistent with the present CVI results, which classify much of Gotland’s coastline as highly vulnerable. Similarly, Kalmar and the adjacent island of Öland have been repeatedly cited in national assessments [50,51] as erosion-prone areas, largely due to their low topographic relief and sensitivity to storm surges. The CVI mapping confirms these findings (Figure 6), with high vulnerability scores attributed to their gentle slopes and ongoing shoreline retreat. In the Skåne region, coastal sites such as Ystad, Bjärred, Lomma, and Ängelholm also display high erosion potential, driven by easily erodible coastal geomorphology, sea-level rise, and intense wave activity during storm events [52,53]. These patterns mirror the current study’s classification of these localities within the high to very high vulnerability categories, reinforcing the role of RSLC, shoreline change rates, slope, and coastal geomorphology as critical drivers of coastal risk. Despite regional variations, the results of this study broadly validate the trends reported in previous research while offering updated spatial insights into areas of emerging concern.
To place these findings in a broader international context, post-glacial North American coasts offer a useful comparison. The uplift rate there exceeds contemporary sea-level rise, leading to long-term negative relative sea-level trends [54]. Such uplift rates are comparable to, or in some cases greater than, those typically reported along the Swedish coast. This suggests that certain coastal margins can be classified as uplift-dominated systems, where vertical land motion is the primary determinant of shoreline evolution rather than eustatic forcing [55].
A similar comparison applies to tidal influence. In macrotidal environments such as the Bay of Fundy in Canada, tidal oscillations can exceed several meters. This, results in buffering storm-surge impacts by distributing water levels across a wider vertical range [56]. By contrast, microtidal coasts, where tidal amplitudes are only a few centimeters, result in persistent wave impact at a fixed shoreline level. The exposure becomes a threat when it is consistent across shallow lagoonal and insular coasts, where tidal ranges typically below one meter [57]. Given that tidal amplitudes along the Swedish coast remain below 0.5 m, the study area aligns more closely with other microtidal margins than with macrotidal ones.
The influence of small islands on coastal exposure has been documented across several archipelagic regions. In the Scottish Hebrides, wave models indicate that islands reduce and redirect energy [58]. A similar contrast has been reported in southern Finland, where wave energy dissipates before it reaches the coast [59]. A comparable mechanism is likely present along the Swedish archipelago, where island formations may effectively act as natural buffers. This study provides a spatial overview of coastal vulnerability in Sweden using the CVI framework; however, several limitations should be acknowledged. The use of medium-resolution datasets, such as 32-m elevation model and EMODnet-derived geomorphology, reduces spatial precision, especially in areas with abrupt terrain changes [29]. Moreover, the CVI assigns equal weights to all parameters and uses fixed classification thresholds. While this promotes comparability, many researchers have noted, this lack of weighting may oversimplify the influence of dominant factors and overlook localized or site-specific vulnerability factors [60]. In the Swedish context, this may underrepresent key processes such as post-glacial rebound and low wave energy. Furthermore, the CVI framework inherently classifies microtidal coasts as highly vulnerable, which in this study resulted in 100% of the Swedish coastline being scored as very high risk with respect to tidal range. This outcome reflects a methodological limitation of the CVI and should be considered with caution, while also indicating the potential value of future refinements tailored to microtidal settings. Lastly, the static nature of CVI does not reflect dynamic processes like storm surges, ice melt, or short-term erosional cycles [61].
Although this study focuses on physical drivers, the approach can complement broader assessments that include socio-economic factors. Future research could integrate data on population density, infrastructure, land use, and adaptive capacity to support more locally tailored planning strategies [62]. Additionally, conducting a sensitivity analysis would clarify how variability in input parameters influences CVI results, improving methodological robustness [63]. Finally, using higher-resolution datasets and performing targeted ground-truthing would enhance spatial precision [36] and increase the decision-making value of coastal vulnerability assessments in Sweden. Given the uneven global distribution of monitoring capacity, a pragmatic next step is to account explicitly for data availability and quality in CVI applications so that outcomes remain comparable between data-rich regions and island-dominated coasts where reanalysis and satellite proxies are often the only viable inputs.
Beyond the spatial assessment itself, this study also offers a useful dataset for the wider coastal research community, especially for those working on high-latitude regions. The full CVI output is openly available and can be reused in other studies that investigate shoreline change or sea-level rise impacts. The method applied is fully reproducible and can be adjusted depending on the needs of each study area, for example, by changing the spatial resolution, the weighting of parameters or the classification thresholds. This makes it possible to apply the same approach to other high-latitude coasts in order to study spatial or temporal variations in vulnerability. Another advantage is that the results are easy to understand and can therefore be used not only by researchers but also by planners and stakeholders. This helps connect the physical processes with their social and economic consequences, and supports more informed decision making.

6. Closing Remarks

This study aimed to assess the physical vulnerability of Sweden’s coastline through the first nationwide application of the CVI. To our knowledge, this is the first study of its kind in Sweden, offering a spatially consistent and scalable method for identifying areas most at risk from sea-level rise, erosion, and land subsidence. By integrating six standardized geophysical parameters into a GIS-based framework, it provides new insights into Sweden’s exposure patterns and contributes a robust decision-support tool for national and regional coastal management.
The results show that relative sea-level rise is the most influential driver of coastal vulnerability in Sweden. Approximately 66% of the coastline is classified as highly vulnerable under this parameter, particularly in the southern regions, where ongoing land uplift is no longer sufficient to offset rising sea levels. Additionally, the uniformly low tidal range across the country amplifies vulnerability by allowing persistent wave energy to act directly on the coastline, especially during storm surges, increasing erosion risks. In contrast, about 41% of the coastline is classified as having low to very low vulnerability, primarily along the northern coast, including the Bay of Bothnia and the Bothnian Sea. In these areas, wave energy is limited, and geomorphological characteristics, such as rocky or glacially uplifted shorelines, contribute significantly to reducing exposure and maintaining natural resilience. These patterns highlight the pressing need for site-specific monitoring and the integration of socio-economic and cultural indicators in future assessments to support targeted adaptation and management strategies.
Importantly, this study demonstrates that positive glacial isostatic adjustment (GIA) does not automatically guarantee long-term coastal stability. While uplift acts as a natural buffer in northern Sweden, the CVI results reveal ‘threshold zones’ in southern and central regions where uplift and eustatic sea-level rise are approaching equilibrium. These transition areas, represent emerging hotspots of future submergence and could serve as early-warning indicators for other Arctic and sub-Arctic coastlines.
Furthermore, by disentangling the relative influence of uplift, tidal amplitude, and wave energy within the CVI framework, this study offers a methodological guidance for adapting coastal indices to high-latitude environments dominated by vertical land motion rather than hydrodynamic forcing. This approach may be transferable to uplift-dominated regions.
Beyond the physical assessment, the openly available CVI dataset and reproducible workflow provide an operational foundation for integrating socio-economic indicators—such as population density, infrastructure exposure, and adaptive capacity—into future risk-oriented assessments. Rather than treating physical and social vulnerability separately, this framework allows planners in uplift-dominated regions to distinguish between coastlines where GIA still acts as a protective buffer and those where human assets are already exposed despite ongoing uplift. Future research should build on this work by integrating social vulnerability indicators, such as population density, infrastructure exposure, and adaptive capacity, for a more comprehensive understanding of coastal risk. Incorporating sensitivity analyses, higher-resolution EO data, and localized field observations would further enhance the reliability and policy relevance of CVI-based assessments in Sweden. Together, these steps will strengthen the foundation for climate adaptation planning and ensure more targeted, locally informed responses to coastal hazards.

Author Contributions

Conceptualization, E.A., N.E. and G.P.P.; methodology, E.A., N.E. and A.K.; formal analysis, E.A.; writing—original draft preparation, E.A.; writing—review and editing, E.A., G.P.P., A.K., N.E., G.N.T. and S.E.D.; visualization, E.A.; supervision, G.P.P. and N.E. All authors have read and agreed to the published version of the manuscript.

Funding

This research was financially supported by the project “EO-PERSIST”, funded through the European Union’s Horizon Europe Research and Innovation Programme (HORIZON-MSCA-2021-SE-01-01) under grant agreement No. 101086386.

Data Availability Statement

The data presented in this study are derived from the following resources available in the public domain The data used in this study are derived from publicly available resources: EMODnet: https://emodnet.ec.europa.eu/geoviewer/#!/ (accessed on 25 May 2025); ArcticDEM (OpenTopography): https://portal.opentopography.org/arcticDem?opentopoID=OTSDEM.112018.3413.3 (accessed on 25 May 2025); Swedish Coastline Data Portal: https://gis.sgi.se/kustdataportal/# (accessed on 25 May 2025); Future Sea Levels Report (BSHC): https://www.bshc.pro/wp-content/uploads/Future_sea_levels.pdf (accessed on 25 May 2025); SMHI: https://www.smhi.se/vader/vader-till-havs/vattenstand-och-vagor (accessed on 25 May 2025).

Conflicts of Interest

Author Eleni Achmakidou was employed by the company ALTUS LSA. The remaining authors declare that the research was conducted in the absence of any commercial or financial relationships that could be construed as a potential conflict of interest.

References

  1. Short, A.D. Coastal Processes and Beaches. Nat. Educ. Knowl. 2012, 3, 15. [Google Scholar]
  2. Mörner, N.A.; Finkl, C.W. Coastal Erosion. In Encyclopedia of Coastal Science; Encyclopedia of Earth Sciences Series; Finkl, C.W., Makowski, C., Eds.; Springer: Cham, Switzerland, 2019. [Google Scholar] [CrossRef]
  3. Alessa, L.; Valentine, J.; Moon, S.; McComb, C.; Hicks, S.; Romanovsky, V.; Xiao, M.; Kliskey, A. Toward a Permafrost Vulnerability Index for Critical Infrastructure, Community Resilience and National Security. Geographies 2023, 3, 522–542. [Google Scholar] [CrossRef]
  4. Toumasi, P.; Petropoulos, G.P.; Detsikas, S.E.; Kalogeropoulos, K.; Tselos, N.G. Coastal Vulnerability Impact Assessment under Climate Change in the Arctic Coasts of Tromsø, Norway. Earth 2024, 5, 640–653. [Google Scholar] [CrossRef]
  5. Casas-Prat, M.; Wang, X.L. Projections of Extreme Ocean Waves in the Arctic and Potential Implications for Coastal Inundation and Erosion. J. Geophys. Res. Ocean. 2020, 125, e2019JC015745. [Google Scholar] [CrossRef]
  6. Nielsen, D.M.; Pieper, P.; Barkhordarian, A.; Overduin, P.; Ilyina, T.; Brovkin, V.; Dobrynin, M. Increase in Arctic Coastal Erosion and Its Sensitivity to Warming in the Twenty-First Century. Nat. Clim. Chang. 2022, 12, 263–270. [Google Scholar] [CrossRef]
  7. Tanguy, R.; Bartsch, A.; Nitze, I.; Irrgang, A.; Petzold, P.; Widhalm, B.; von Baeckmann, C.; Boike, J.; Martin, J.; Efimova, A.; et al. Pan-Arctic assessment of coastal settlements and infrastructure vulnerable to coastal erosion, sea-level rise, and permafrost thaw. Earth’s Future 2024, 12, e2024EF005013. [Google Scholar] [CrossRef]
  8. Whalen, D.; Forbes, D.L.; Kostylev, V.; Lim, M.; Fraser, P.; Nedimović, M.R.; Stuckey, S. Mechanisms, Volumetric Assessment, and Prognosis for Rapid Coastal Erosion of Tuktoyaktuk Island, an Important Natural Barrier for the Harbour and Community. Can. J. Earth Sci. 2022, 59, 945–960. [Google Scholar] [CrossRef]
  9. Ebert, K.; Ekstedt, K.; Jarsjö, J. GIS Analysis of Effects of Future Baltic Sea Level Rise on the Island of Gotland, Sweden. Nat. Hazards Earth Syst. Sci. 2016, 16, 1571–1582. [Google Scholar] [CrossRef]
  10. Swedish Ministry of the Environment. Sweden’s Adaptation Communication—A Report to the United Nations Framework Convention; Government Offices of Sweden: Stockholm, Sweden, 2022; Available online: https://unfccc.int/sites/default/files/ACR/2022-11/ADCOM_Sweden_November_221114.pdf (accessed on 1 October 2025).
  11. Leszczyńska, K.; Alexanderson, H.; Clemmensen, L.B.; Giza, A.; Lorenz, S.; Moskalewicz, D.; Oliński, P.; Paprotny, D.; Rosentau, A.; Rutgersson, A.; et al. A Review of Storms and Marine Coastal Flooding in the Baltic Sea—Insights from Instrumental, Historical and Sedimentary Record. Earth-Sci. Rev. 2025, 266, 105137. [Google Scholar] [CrossRef]
  12. Kopp, H.; Chiocci, F.L.; Berndt, C.; Çağatay, M.N.; Ferreira, T.; Fortes, C.J.E.M.; Gràcia, E.; González Vega, A.; Kopf, A.J.; Yeo, I.A. Marine Geohazards: Safeguarding Society and the Blue Economy; Position Paper 26 of the European Marine Board; European Marine Board: Ostend, Belgium, 2021; Volume 26, 100p. [Google Scholar] [CrossRef]
  13. Ren, Z.; Higuera, P.; Liu, P.L.-F. On Tsunami Waves Induced by Atmospheric Pressure Shock Waves after the 2022 Hunga Tonga-Hunga Ha’apai Volcano Eruption. J. Geophys. Res. Ocean. 2023, 128, e2022JC019166. [Google Scholar] [CrossRef]
  14. Wang, Y.; Zamora, N.; Quiroz, M.; Satake, K.; Cienfuegos, R. Tsunami Resonance Characterization in Japan due to Trans-Pacific Sources: Response on the Bay and Continental Shelf. J. Geophys. Res. Ocean. 2021, 126, e2020JC017037. [Google Scholar] [CrossRef]
  15. Xu, I.; Xu, C.; Ren, Z.; Wang, D. Numerical Investigation of Rip Currents near a Barred Beach Induced by Irregular Waves. Proc. Inst. Mech. Eng. Part M J. Eng. Marit. Environ. 2024, 239, 418–434. [Google Scholar] [CrossRef]
  16. Ji, X.; Wang, H.; Lu, X.; Wang, D.; Zou, L.; Ren, Z. Hydrodynamic Performance of Riprap Structures in Reef Lagoon under Extreme Wave Loading: Insights from Porous Media Simulations. Phys. Fluids 2025, 37, 051702. [Google Scholar] [CrossRef]
  17. Sugiyama, S.; Yamaguchi, A.; Watanabe, T.; Tojo, Y.; Hayashi, N.; Thiebot, J.-B.; Tomiyasu, M.; Hasegawa, K.; Mitani, Y.; Otsuki, M.; et al. Changes in the Coastal Environments and Their Impact on Society in the Qaanaaq Region, Northwestern Greenland. Polar Sci. 2025, 101206. [Google Scholar] [CrossRef]
  18. LIFE Coast Adapt. Protection of Coastal Values. 2024. Available online: https://utveckling.skane.se/siteassets/publikationer/life-coast-adapt-engelska.pdf (accessed on 25 May 2025).
  19. Donatus, B.; Angnuureng, B.; Charuka, B.; Almar, R.; Dada, O.A.; Asumadu, R. Challenges and Lessons Learned from Global Coastal Erosion Protection Strategies. iScience 2025, 28, 112055. [Google Scholar] [CrossRef]
  20. Fuldauer, L.I.; Adshead, D.; Thacker, S.; Gall, S.; Hall, J.W. Evaluating the Benefits of National Adaptation to Reduce Climate Risks and Contribute to the Sustainable Development Goals. Glob. Environ. Change 2022, 76, 102575. [Google Scholar] [CrossRef]
  21. Tsatsaris, A.; Kalogeropoulos, K.; Stathopoulos, N.; Louka, P.; Tsanakas, K.; Tsesmelis, D.E.; Krassanakis, V.; Petropoulos, G.P.; Pappas, V.; Chalkias, C. Geoinformation Technologies in Support of Environmental Hazards Monitoring under Climate Change: An Extensive Review. ISPRS Int. J. Geo-Inf. 2021, 10, 94. [Google Scholar] [CrossRef]
  22. Kim, J.-I.; Hyun, C.-U.; Han, H.; Kim, H.-C. Digital Surface Model Generation for Drifting Arctic Sea Ice with Low-Textured Surfaces Based on Drone Images. ISPRS J. Photogramm. Remote Sens. 2021, 172, 147–159. [Google Scholar] [CrossRef]
  23. Petropoulos, G.P.; Petsini, T.; Detsikas, S.E. Geoinformation Technology in Support of Arctic Coastal Properties Characterization: State of the Art, Challenges, and Future Outlook. Land 2024, 13, 776. [Google Scholar] [CrossRef]
  24. Azlan, A.; Sahat, S.; Daud, M.E.; Kaamin, M.; Sultan, Z. Assessing Coastal Erosion Risks: A Comparative Study of Coastal Vulnerability Index and Coastal Erosion Risk Assessment Methods. J. Adv. Res. Des. 2025, 132, 91–102. [Google Scholar] [CrossRef]
  25. Gornitz, V.; White, T.; Cushman, R. Vulnerability of the U.S. to Future Sea Level Rise; Oak Ridge National Laboratory: Oak Ridge, TN, USA, 1991. [Google Scholar]
  26. Thieler, E.R.; Hammar-Klose, E.S. National Assessment of Coastal Vulnerability to Future Sea-Level Rise: Preliminary Results for the U.S. Pacific Coast. In U.S. Geological Survey Open-File Report; U.S. Geological Survey: Woods Hole, MA, USA, 2000. Available online: http://pubs.usgs.gov/of/2000/of00-178/ (accessed on 1 October 2025).
  27. Pendleton, E.A.; Hammer-Klose, E.S.; Thieler, E.R.; Williams, S.J. Coastal Vulnerability Assessment of Gulf Islands National Seashore (GUIS) to Sea Level Rise; U.S. Geological Survey Open-File Report 03-108; U.S. Geological Survey: Woods Hole, MA, USA, 2004; 18p. Available online: http://pubs.usgs.gov/of/2003/of03-108/ (accessed on 1 October 2025).
  28. Noor, N.M.; Abdul Maulud, K.N. Coastal Vulnerability: A Brief Review on Integrated Assessment in Southeast Asia. J. Mar. Sci. Eng. 2022, 10, 595. [Google Scholar] [CrossRef]
  29. Rocha, C.; Antunes, C.; Catita, C. Coastal Indices to Assess Sea-Level Rise Impacts—A Brief Review of the Last Decade. Ocean Coast. Manag. 2023, 237, 106536. [Google Scholar] [CrossRef]
  30. Theocharidis, C.; Doukanari, M.; Kalogirou, E.; Christofi, D.; Mettas, C.; Kontoes, C.; Hadjimitsis, D.; Argyriou, A.V.; Eliades, M. Coastal Vulnerability Index (CVI) Assessment: Evaluating Risks Associated with Human-Made Activities along the Limassol Coastline, Cyprus. Remote Sens. 2024, 16, 3688. [Google Scholar] [CrossRef]
  31. Statistics Sweden (SCB). 2024. Available online: https://www.statistikdatabasen.scb.se/ (accessed on 1 October 2025).
  32. Łabuz, T.A. Environmental Impacts—Coastal Erosion and Coastline Changes. In Second Assessment of Climate Change for the Baltic Sea Basin; The BACC II Author Team, Ed.; Regional Climate Studies; Springer: Cham, Switzerland, 2015. [Google Scholar] [CrossRef]
  33. SGU Geology of Sweden. 2020. Available online: https://www.sgu.se/en/geology-of-sweden/ (accessed on 1 October 2025).
  34. Hieronymus, M.; Kalén, O. Sea-Level Rise Projections for Sweden Based on the New IPCC Special Report: The Ocean and Cryosphere in a Changing Climate. Ambio 2020, 49, 1587–1600. [Google Scholar] [CrossRef] [PubMed]
  35. SCB Islands in Sweden. Number, Area and Perimeter by Region. 2013. Available online: https://www.statistikdatabasen.scb.se/pxweb/en/ssd/START__MI__MI0812__MI0812T/OarArealOmk/ (accessed on 1 October 2025).
  36. Reusch, T.B.H.; Dierking, J.; Andersson, H.C.; Bonsdorff, E.; Carstensen, J.; Casini, M.; Zandersen, M. The Baltic Sea as a Time Machine for the Future Coastal Ocean. Sci. Adv. 2018, 4, eaar8195. [Google Scholar] [CrossRef]
  37. Komi, A.; Petropoulos, A.; Evelpidou, N.; Poulos, S.; Kapsimalis, V. Coastal Vulnerability Assessment for Future Sea Level Rise and a Comparative Study of Two Pocket Beaches in Seasonal Scale, Ios Island, Cyclades, Greece. J. Mar. Sci. Eng. 2022, 10, 1673. [Google Scholar] [CrossRef]
  38. Pantusa, D.; D’Alessandro, F.; Riefolo, L.; Principato, F.; Tomasicchio, G.R. Application of a Coastal Vulnerability Index. A Case Study along the Apulian Coastline, Italy. Water 2018, 10, 1218. [Google Scholar] [CrossRef]
  39. Xu, H.; Xu, N.; Zhang, C.; Chi, S.; Li, Y.; Li, W.; Lu, H. A Machine Learning Based Estimation Method of Beach Slopes at a National Scale: A Case Study of New Zealand. Geo-Spat. Inf. Sci. 2025, 1–20. [Google Scholar] [CrossRef]
  40. Manno, G.; Azzara, G.; Lo Re, C.; Martinello, C.; Basile, M.; Rotigliano, E.; Ciraolo, G. An Approach for the Validation of a Coastal Erosion Vulnerability Index: An Application in Sicily. J. Mar. Sci. Eng. 2023, 11, 23. [Google Scholar] [CrossRef]
  41. Intergovernmental Panel on Climate Change (IPCC). Climate Change 2021—The Physical Science Basis: Working Group I Contribution to the Sixth Assessment Report of the Intergovernmental Panel on Climate Change. 2021. Available online: https://www.ipcc.ch/report/ar6/wg1/ (accessed on 1 October 2025).
  42. SMA Future Sea Levels in Sweden. 2025. Thomas Hammarklint Published 2019-11-30. Available online: https://www.bshc.pro/wp-content/uploads/Future_sea_levels.pdf (accessed on 1 October 2025).
  43. Beluru, J.; Akshaya, H.; Hegde, A.V. GIS Based Approach for Vulnerability Assessment of the Karnataka Coast, India. Adv. Civ. Eng. 2016, 2016, 5642523. [Google Scholar] [CrossRef]
  44. SMHI. Ocean Waves 2016. 2024. Available online: https://www.smhi.se/klimat/klimatet-da-och-nu/arets-vatten/vattenaret/2017-03-31-havsvagor-2016?utm (accessed on 1 October 2025).
  45. Adell, A.; Nunes De Brito Junior, A.; Almström, B.; Goodfellow, B.; Bokhari Irminger, S.; Hallin, C.; Nyberg, J. Open-Access Portal with Hindcast Wave Data for Skåne and Halland. Vatten Tidskr. Vattenvård/J. Water Manag. Res. 2021, 77, 81–90. Available online: https://www.tidskriftenvatten.se/wp-content/uploads/2021/06/VATTEN_21_2_81-90.pdf (accessed on 1 October 2025).
  46. Sokolov, A.; Chubarenko, B. Baltic Sea Wave Climate in 1979–2018: Numerical Modelling Results. Ocean Eng. 2024, 320, 117088. [Google Scholar] [CrossRef]
  47. Luijendijk, A.; Hagenaars, G.; Ranasinghe, R.; Baart, F.; Donchyts, G.; Aarninkhof, S. The State of the World’s Beaches. Sci. Rep. 2018, 8, 6641. [Google Scholar] [CrossRef]
  48. Vousdoukas, M.I.; Ranasinghe, R.; Mentaschi, L.; Plomaritis, T.A.; Athanasiou, P.; Luijendijk, A.; Feyen, L. Sandy Coastlines under Threat of Erosion. Nat. Clim. Change 2020, 10, 260–263. [Google Scholar] [CrossRef]
  49. Różyński, G. Coastal Protection Challenges after Heavy Storms on the Polish Coast. Cont. Shelf Res. 2023, 266, 104997. [Google Scholar] [CrossRef]
  50. Glansholm, H. Coastal Erosion on Högklint, Gotland: Processes, Rate, and Future Implications. Master’s Thesis, Uppsala University, Department of Earth Sciences, Uppsala, Sweden, 2015. Available online: https://uu.diva-portal.org/smash/record.jsf?pid=diva2%3A856411&dswid=6354 (accessed on 1 October 2025).
  51. Þórisdóttir, V. Future Challenges of Kalmar City: Coastal Adaptation Strategies Design in Relation to Sea Level Rise. Master’s Thesis, Swedish University of Agricultural Sciences (SLU), Department of Urban and Rural Development, Uppsala, Sweden, 2023. Available online: http://urn.kb.se/resolve?urn=urn:nbn:se:slu:epsilon-s-500682 (accessed on 1 October 2025).
  52. SGU Kartvisaren: Erosionsförhållanden på Stranden. 2023. Available online: https://apps.sgu.se/kartvisare/kartvisare-skanestrand.html (accessed on 1 October 2025).
  53. Hamilton, A. Coastal Erosion in Ängelholm: A Case Study Tracking Recent and Historical Changes to Vejbystrand. Bachelor’s Thesis, Lund University, Lund, Sweden, 2019. [Google Scholar] [CrossRef]
  54. Engström, S.; Olsson, E. Coastal Response to Sea Level Rise in Ystad Municipality: Development, Comparison and Application of Bruun Rule-Based Methods. Master’s Thesis, Lund University, Division of Water Resources Engineering, Department of Building & Environmental Technology, Lund, Sweden, 2021. Available online: https://lup.lub.lu.se/luur/download?func=downloadFile&recordOId=9060526&fileOId=9060529 (accessed on 1 October 2025).
  55. Shugar, D.H.; Walker, I.J.; Lian, O.B.; Eamer, J.B.R.; Neudorf, C.; McLaren, D.; Fedje, D. Post-Glacial Sea-Level Change along the Pacific Coast of North America. Quat. Sci. Rev. 2014, 97, 170–192. [Google Scholar] [CrossRef]
  56. Greenberg, D.A.; Blanchard, W.; Smith, B.; Barrow, E. Climate Change, Mean Sea Level and High Tides in the Bay of Fundy. Atmos.-Ocean. 2012, 50, 261–276. [Google Scholar] [CrossRef]
  57. Tosi, L.; Da Lio, C.; Cosma, M.; Donnici, S. Vulnerability of Tidal Morphologies to Relative Sea-Level Rise in the Venice Lagoon. Sci. Total Environ. 2024, 905, 173006. [Google Scholar] [CrossRef]
  58. Gleizon, P.; Woolf, D. Wave Energy Assessment in Scottish Seas. In Proceedings of the 10th European Wave and Tidal Energy Conference (EWTEC), Aalborg, Denmark, 2–5 September 2013; Available online: https://www.researchgate.net/publication/263279982_Wave_Energy_Assessment_in_Scottish_Seas (accessed on 1 October 2025).
  59. Björkqvist, J.-V.; Tuomi, L.; Fortelius, C.; Pettersson, H.; Tikka, K.; Kahma, K.K. Improved Estimates of Nearshore Wave Conditions in the Gulf of Finland. J. Mar. Syst. 2017, 171, 43–53. [Google Scholar] [CrossRef]
  60. Sekovski, I.; Del Río, L.; Armaroli, C. Development of a Coastal Vulnerability Index Using Analytical Hierarchy Process and Application to Ravenna Province (Italy). Ocean Coast. Manag. 2020, 183, 104982. [Google Scholar] [CrossRef]
  61. Barzehkar, M.K.; Parnell, K.; Soomere, T. Extending Multi-Criteria Coastal Vulnerability Assessment to Low-Lying Inland Areas: Examples from Estonia, Eastern Baltic Sea. Estuar. Coast. Shelf Sci. 2024, 311, 109014. [Google Scholar] [CrossRef]
  62. Tita, E.P.; Petropoulos, G.P.; Varvatsouli, D. Exploring the Relationships between Coastal Vulnerability and Socio-Economic Variables in the Context of Climate Change Using Geoinformatics for the Region of Longyearbyen, Svalbard. Remote Sens. Appl. Soc. Environ. 2025, 30, 101642. [Google Scholar] [CrossRef]
  63. Boumpoulis, V.D.; Depountis, N.; Dimas, A.; Grivas, E.; Karymbalis, E. Presentation and Analysis of the Geotechnical Coastal Vulnerability Index and Validation of Its Application to Coastal Erosion Problems. Sci. Rep. 2025, 15, 1424. [Google Scholar] [CrossRef] [PubMed]
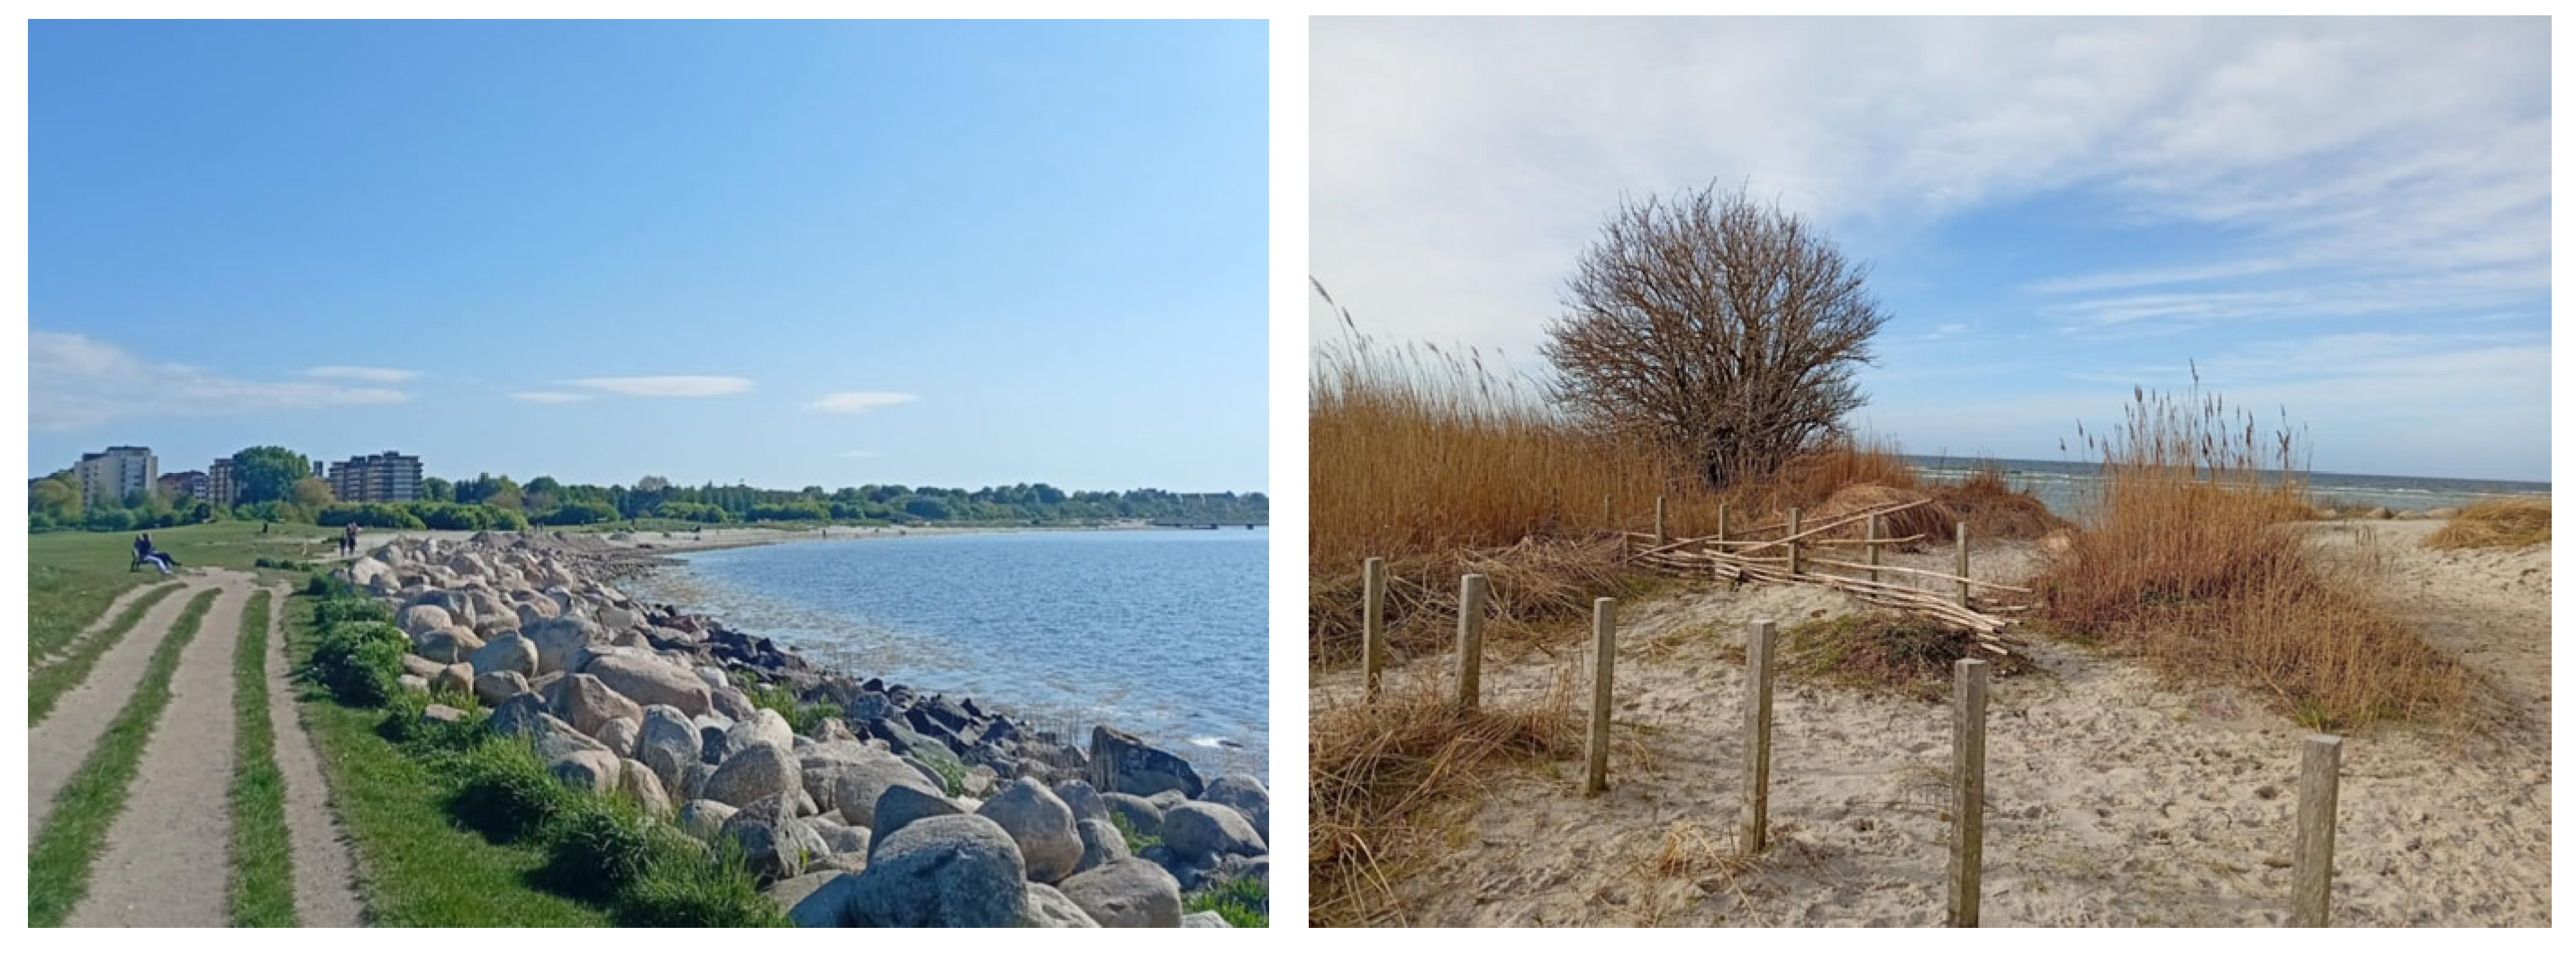
Figure 1. Examples of coastal management interventions in southern Sweden: (left) hard protection using rock revetments in the Malmö region; (right) soft, nature-based dune stabilization in Lomma.
Water 17 03027 g001
Figure 2. The Baltic Sea area within a broader European or global framework Sweden’s three marine planning areas (Baltic Sea, Gulf of Bothnia, Kattegat-Skagerrak), as defined by the Swedish Agency for Marine and Water Management used as a geographic basis for interpreting the results.
Water 17 03027 g002
Figure 3. Percentage vulnerability of each CVI variable. Vulnerability is shown using a color scale, where red indicates high vulnerability and green indicates low vulnerability. Parameters include: SH Change Rate = Shoreline Change Rate, RSLC = Relative Sea-Level Change, and MSWH = Mean Significant Wave Height and Tidal Range.
Water 17 03027 g003
Figure 4. Spatial distribution of individual physical variables used in the CVI along the Swedish coastline. Maps (af) displays the relative vulnerability classification for each of the six physical parameters included in the CVI calculation: (a) coastal slope, (b) geomorphology, (c) shoreline change rate, (d) relative Sea-level change), (e) mean significant wave height, and (f) tidal range. The maps use a gradient color scheme, where green hues indicate low vulnerability and red hues indicate high vulnerability. These classifications allow for the identification of spatial trends and high-risk coastal segments based on individual variable contributions.
Water 17 03027 g004aWater 17 03027 g004b
Figure 5. CVI classification of the Swedish coastline.
Water 17 03027 g005
Figure 6. CVI Results Pie chart for coastline vulnerability in percentage (%).
Water 17 03027 g006
Table 1. Data sources used in CVI calculations in this study. All sources are open access.
VariableSourceReference PeriodResolution/AccuracyFormat
GeomorphologyEMODnet Geology/coastal type
https://emodnet.ec.europa.eu/geoviewer/#!/ (accessed on 25 May 2025)
-~1:250,000 scale (vector shoreline classification)Shapefile/WebGIS
Coastal Slopehttps://portal.opentopography.org/arcticDem?opentopoID=OTSDEM.112018.3413.3 (accessed on 25 May 2025)-~32 m horizontal resolutionRaster (GeoTIFF)
Mean wave height (m)Wave model data (SGI, LTH, SGU) https://gis.sgi.se/kustdataportal/#
(accessed on 25 May 2025)
1979–20183-hourly temporal resolution; ~3–5 km spatial resolutionModel output (Time series (CSV))
Relative Sea-level change (mm/y)SMA 2025 https://www.bshc.pro/wp-content/uploads/Future_sea_levels.pdf
(Accessed on 25 May 2025)
IPCC 2100Tide gauge network (86 stations); vertical datum RH2000 Report (PDF), Tables
Shoreline erosion/accretion (m/y)EMODnet Geology/coastal migration
https://emodnet.ec.europa.eu/geoviewer/#!/
(accessed on 25 May 2025)
-~1:250,000 scale, regional compilationsShapefile/WebGIS
Tidal range (m)Swedish Meteorological and Hydrological Institute (SMHI) https://www.smhi.se/vader/vader-till-havs/vattenstand-och-vagor (accessed on 25 May 2025)---
Table 2. Classification criteria and numerical ranking used in the Coastal Vulnerability Index (CVI) following the methodology of [26].
VulnerabilityVery LowLowModerateHighVery High
Variables12345
Coastal slope (%)>207.0–204.0–7.02.5–4<2.5
GeomorphologyRocky, cliffed coasts, Fjords, Fiards, Artif. Constructions Medium Cliffs, Indented coasts Low cliffs, Glacial drift, Alluvial plains, Beachrocks, Dunes, Mixed material Cobble beaches, Estuaries, LagoonsBarrier beaches, Sand beaches, Salt marshes, Mud flats, Deltas, Mangrove, Coral reefs
Shoreline erosion/accretion (m/yr)>2.01.0–2.0−1.0–+1.0−1.0–−2.0<−2.0
Relative sea-level change (mm/yr)<1.81.8–2.52.5–3.03.0–3.2>3.2
Mean Wave Height (m)<0.550.55–0.850.85–1.051.05–1.25>1.25
Mean Tide range(m)>6.04.1–6.02.0–4.01.0–1.9<1.0
Disclaimer/Publisher’s Note: The statements, opinions and data contained in all publications are solely those of the individual author(s) and contributor(s) and not of MDPI and/or the editor(s). MDPI and/or the editor(s) disclaim responsibility for any injury to people or property resulting from any ideas, methods, instructions or products referred to in the content.