


Abstract
Accurate characterization of vineyard-scale climate is essential for understanding grapevine development, yield formation, and wine quality. However, climate analyses in viticulture are still largely based on interpolated macroclimate datasets, which may not adequately represent local conditions. This study evaluated the ability of commonly used interpolation methods to reproduce microclimatic conditions across vineyards, focusing on key meteorological variables and spatial resolutions. Daily values extracted from macroclimate grids (1/6° and 0.1°) and high-resolution (1 km) interpolated datasets were compared with in situ microclimate observations. The analysis covered temperature (minimum, mean, and maximum), vapor pressure deficit (VPD), and global radiation, using statistical metrics including correlation (r), root mean square error (RMSE), bias, and distribution-based error characteristics. The results reveal a strong variable-dependent performance of interpolation methods. Global radiation showed moderate to strong agreement between macro- and microclimate datasets, whereas temperature—particularly minimum temperature—exhibited substantial discrepancies. These differences are primarily attributed to local processes such as cold air pooling, topographic effects, and canopy-level interactions, which are not resolved by coarse-scale datasets. An exploratory Mean Topographic Association Score (MTAS) analysis further identified the Topographic Position Index (TPI) as the terrain descriptor showing the strongest overall association with interpolation errors across the investigated meteorological variables. Among the evaluated approaches, the 0.1° climate product generally provided the best overall agreement with vineyard observations for temperature-related variables, substantially reducing interpolation errors compared with the original 1/6° dataset. For example, the RMSE of Tmin decreased from 3.85 °C to 2.41 °C. Nevertheless, considerable residual errors remained, indicating persistent limitations of interpolation approaches in complex terrain. VPD deviations reflected the combined influence of temperature- and humidity-related uncertainties, highlighting the sensitivity of derived variables to local climatic conditions. The findings demonstrate that interpolated macroclimate datasets should be applied with caution in vineyard-scale analyses, especially for variables sensitive to local processes. For applications such as phenological modelling, climate suitability assessment, and precision viticulture, the integration of high-resolution data sources or direct microclimate measurements is essential. This study highlights the limitations of interpolated climate products in complex vineyard terrain and demonstrates that consideration of local terrain configuration, particularly relative topographic position, together with vineyard-scale observations and high-resolution climate information, is essential for reliable viticultural climate assessments.
1. Introduction
Grapevine development and berry composition are strongly controlled by microclimatic conditions within the vineyard canopy, particularly in the bunch zone where temperature, radiation, and atmospheric moisture directly influence physiological processes. It has long been established that grapevine phenology and fruit composition are highly sensitive to temperature conditions [1], while radiation and canopy microclimate play a key role in determining berry development and wine quality [2,3]. Temperature-driven processes regulate key phenological stages, sugar accumulation, and acid metabolism, making climate one of the most important determinants of viticultural suitability, terroir expression, and wine style [4]. More broadly, climate variability has been identified as a key driver of viticultural zoning and wine typicity under both current and future conditions [5,6,7,8,9].
Classical microclimatological studies have demonstrated that near-surface climate conditions can differ substantially from standard meteorological observations, especially in complex terrain and vegetated environments [10]. In vineyards, these differences are further amplified by topography, canopy structure, and local airflow patterns, leading to pronounced spatial variability even within short distances [11,12]. Such fine-scale climatic variability influences grapevine performance, grape quality, and may ultimately affect the economic value of vineyard sites [13]. As a result, vineyard climates are inherently heterogeneous, and conditions measured at standard meteorological stations may not adequately reflect the microenvironment experienced by the grapevine.
Recent studies have reinforced the importance of vineyard-scale microclimate, showing that even small variations in canopy temperature and radiation can significantly influence sugar accumulation, acid degradation, and the timing of phenological stages [14,15,16]. Elevated temperatures have been associated with accelerated sugar accumulation and reduced titratable acidity, potentially leading to imbalanced grape composition under changing climatic conditions [16,17,18,19]. In addition, spatial variability in microclimate has been linked to intra-vineyard differences in grape composition and wine sensory attributes, further highlighting the importance of local-scale climatic characterization [20].
Despite this strong dependence on microclimate, most climate–viticulture studies rely on interpolated macroclimate datasets derived from meteorological station networks or downscaled climate models. These datasets provide spatially continuous coverage and are widely used for climate zoning, suitability assessments, and climate change impact studies [7,8,9]. However, their applicability at fine spatial scales, such as individual vineyards, remains uncertain. Vineyard environments are characterized by complex terrain, heterogeneous canopy structure, and local atmospheric processes, including cold air drainage and radiation-driven energy balance, which are often not resolved by coarse-resolution datasets.
Previous studies have shown that differences between macroclimate datasets and local measurements can be significant, particularly for temperature-related variables. These discrepancies are especially pronounced for minimum temperature, which is strongly influenced by local topographic and atmospheric conditions, and may therefore be poorly represented in interpolated datasets [21,22,23]. As a consequence, the use of such datasets may introduce substantial uncertainty into climate-based analyses in viticulture, including phenological modelling, yield prediction, and assessment of climatic risks.
Interpolated climate products used in viticultural studies encompass a wide range of spatial resolutions, from coarse regional datasets (typically 0.1–0.25°) to high-resolution products generated through statistical downscaling and terrain-informed interpolation approaches. The relevance of selecting an appropriate spatial scale has been increasingly recognized in viticulture, where different climatic processes operate across multiple interacting scales ranging from regional climate to within-vineyard microclimate [24]. While increasing spatial resolution is generally expected to improve the representation of local climatic conditions, climatic variability in vineyards is inherently scale-dependent, and the extent to which finer-scale products capture vineyard microclimates remains uncertain. Systematic comparisons across multiple spatial resolutions and interpolation approaches are therefore needed to evaluate their representativeness at the vineyard scale.
This issue is particularly relevant in regions characterized by complex terrain. Vineyard microclimates are strongly influenced by local topographic processes, including nocturnal cold-air drainage, cold-air pooling in valley bottoms, slope exposure effects, and terrain-induced modification of incoming solar radiation. These processes can generate substantial spatial heterogeneity over short distances and are often partially smoothed or omitted in gridded climate products. Consequently, interpolation errors may differ among climatic variables. Temperature, particularly minimum temperature, is highly sensitive to local topographic effects, whereas radiation may be represented more consistently because of its stronger dependence on broader atmospheric conditions. In contrast, vapour pressure deficit (VPD), as a derived variable, may amplify uncertainties inherited from temperature and humidity estimates.
Accurate characterization of vineyard microclimate is therefore essential for reliable assessment of grapevine phenology and key quality parameters, including sugar concentration and titratable acidity. However, direct microclimate measurements are often limited due to logistical and financial constraints, leading to increasing reliance on interpolated datasets whose performance at the vineyard scale remains insufficiently validated.
In this context, several important research gaps remain. First, vineyard-scale validation studies simultaneously evaluating temperature, radiation, and atmospheric moisture-related variables remain relatively limited. Second, the extent to which interpolation errors persist after increasing spatial resolution from coarse regional products to finer-scale datasets has not been systematically assessed. Third, the influence of local terrain-driven processes on residual interpolation errors remains insufficiently quantified. Addressing these gaps is essential for improving the reliability of climate-based viticultural analyses and climate impact assessments. In particular, the comparison of different interpolation approaches can provide insights into their relative performance, strengths, and limitations, especially under heterogeneous topographic conditions [25,26,27,28].
The selected Hungarian wine regions represent typical examples of Central European viticultural landscapes characterized by complex terrain, making them particularly suitable for evaluating the vineyard-scale representativeness of interpolated climate products. Therefore, the aim of this study is to assess the accuracy of several widely used interpolation methods by comparing gridded climate data with in situ vineyard measurements across representative sites in two Hungarian wine regions. The analysis focuses on key meteorological variables, including temperature, vapour pressure deficit, and global radiation, and examines the extent to which interpolated datasets can reproduce observed vineyard-scale conditions. By quantifying discrepancies between interpolated and observed data, this study provides a methodological basis for improving climate-based viticultural analyses and supports more robust assessment of climate impacts on grapevine development and composition.
2. Materials and Methods
2.1. Study Area
The study was conducted in two major Hungarian wine regions, Eger and Tokaj, located in northern Hungary (Figure 1).
Figure 1.
Location of the six vineyard monitoring sites in the Eger and Tokaj wine regions (Hungary), showing the digital elevation model and the topographic characteristics of the study areas.
These regions are characterized by complex topography, including steep slopes, diverse aspects, valley systems, and highly heterogeneous terrain conditions. Both regions belong to the temperate continental climate zone and are increasingly affected by climate variability and extreme weather events [5,6,7,8,9]. The combination of complex terrain and diverse vineyard structures makes these regions particularly suitable for evaluating the representativeness of gridded macroclimate datasets at the vineyard scale.
Microclimate measurements were carried out at six representative vineyard sites covering a range of elevations, slope positions and aspects across the two regions (Table 1). This spatial diversity allows for a robust assessment of the performance of interpolation methods under heterogeneous environmental conditions.
Table 1.
Geographic coordinates (EOV and WGS84) and elevation of vineyard monitoring sites in the Eger and Tokaj wine regions.
2.2. Microclimate Measurements
2.2.1. Vineyard Monitoring Network
Microclimate observations were collected using a dedicated vineyard monitoring network consisting of six automatic Boreas microclimate stations (Boreas Ltd., Érd, Hungary) installed at representative vineyard sites in the Eger and Tokaj wine regions (Figure 2, Table 1). The monitoring sites were selected to represent the wide range of topographic conditions characteristic of the two wine regions, including differences in elevation, slope position, and aspect. The network spans elevations from 148.9 to 347.1 m a.s.l., thereby capturing the pronounced spatial variability of vineyard microclimates associated with complex terrain.
Figure 2.
Standard configuration of the Boreas vineyard microclimate monitoring stations used at all six study sites. The schematic illustrates the position of atmospheric, canopy, radiation, precipitation, and soil sensors installed above, within, and below the grapevine bunch zone and within the soil profile. Sensor positions are shown schematically and are not drawn to scale.
The monitoring campaign covered the period from September 2019 to June 2021. All stations operated continuously throughout the study period using identical sensor configurations and measurement protocols. Measurements were automatically recorded by Boreas EcoLogger data loggers (Boreas Ltd., Érd, Hungary) at 10-min intervals, providing a high-resolution record of atmospheric, radiation, canopy, and soil conditions.
Each monitoring station was equipped with approximately 30 environmental sensors, allowing simultaneous observation of atmospheric, canopy, radiation, and soil conditions. Particular emphasis was placed on characterizing the grapevine bunch zone, where berry development and composition are directly influenced by the surrounding microclimate. Accordingly, air temperature and relative humidity sensors were installed at multiple canopy levels to characterize the vertical structure of the vineyard microclimate. This sensor configuration is consistent with measurement approaches commonly applied in vineyard-scale microclimate studies using automatic monitoring systems [20,29]. The standard configuration of the Boreas monitoring stations is illustrated in Figure 2, while the complete list of measured variables is presented in Table 2.
Table 2.
Environmental variables measured by the Boreas vineyard microclimate monitoring network and their corresponding units.
2.2.2. Instrumentation and Sensor Specifications
Each Boreas monitoring station was equipped with an integrated environmental monitoring system designed for continuous observation of vineyard microclimate conditions. The stations simultaneously measured approximately 30 atmospheric, radiation, canopy and soil variables, including air temperature, relative humidity, precipitation, wind speed and direction, global radiation, photosynthetically active radiation (PAR), leaf wetness, soil temperature, soil moisture and soil heat flux (Table 2). The complete list of monitored variables and their corresponding units is presented in Table 2, while detailed technical specifications of all sensors are provided in Supplementary Table S1A,B.
Air temperature and relative humidity were measured using naturally ventilated, radiation-shielded digital sensors installed at multiple canopy levels. According to the manufacturer’s specifications, the temperature sensors have a nominal accuracy of ±0.1 °C, while the relative humidity sensors have a nominal accuracy of ±1% RH. Global solar radiation was measured using Boreas BISL-06 pyranometers, and precipitation was recorded using tipping-bucket rain gauges with a resolution of 0.1 mm. All sensors were connected to Boreas EcoLogger data loggers, enabling synchronized automatic data acquisition and storage throughout the monitoring period.
To ensure measurement consistency across the monitoring network, all instruments underwent factory calibration prior to deployment following the manufacturer’s quality assurance procedures. Before installation in the vineyards, the six monitoring stations were operated simultaneously under identical environmental conditions to verify inter-station consistency. The comparison confirmed close agreement among the instruments before field deployment. The Boreas monitoring system is manufactured under ISO 9001 and ISO 14001 certified quality management procedures. Representative factory calibration certificates for the temperature–humidity sensor, tipping-bucket rain gauge and global solar radiation sensor, documenting the manufacturer’s calibration procedures and quality assurance system for the principal sensor types used in the vineyard monitoring network, are provided in Supplementary Figure S1A–C. Additional technical specifications, including measurement heights, measurement ranges, resolutions and nominal accuracies, are summarized in Supplementary Table S1A,B. The manufacturers’ technical manuals for the principal sensor types are provided as Supplementary Files A–C.
The present study focused on variables directly comparable with the macroclimate datasets, namely daily minimum, mean and maximum air temperature (Tmin, Tmean and Tmax), precipitation, global solar radiation and the derived vapour pressure deficit (VPD).
2.2.3. Data Acquisition and Processing
All sensors recorded measurements automatically at 10-min intervals throughout the monitoring period. The raw observations were stored by the Boreas EcoLogger data loggers and subsequently subjected to quality control prior to aggregation. Quality control procedures included the identification and removal of physically unrealistic observations, consistency checks of automatically recorded data, and exclusion of days affected by missing measurements around the occurrence of daily minimum or maximum temperatures. No temporal interpolation was applied to replace missing observations, thereby ensuring that only directly measured values were used in the subsequent analyses.
For comparison with the macroclimate datasets, the 10-min observations were aggregated to hourly and subsequently to daily values. Daily minimum (Tmin), mean (Tmean), and maximum (Tmax) air temperatures were calculated from the aggregated temperature observations. Daily precipitation totals were obtained by summing the 10-min precipitation measurements, while daily global solar radiation was calculated by integrating the corresponding radiation observations over each day.
In addition to the directly measured variables, vapour pressure deficit (VPD) was calculated from air temperature and relative humidity measured within the grapevine bunch zone, representing the microenvironment most directly affecting grape berry development. Saturation vapour pressure and actual vapour pressure were calculated from the measured air temperature and relative humidity, and daily VPD values were subsequently derived from the aggregated observations.
To ensure direct comparability with the gridded macroclimate datasets, all analyses presented in this study were performed using daily microclimate variables. The primary variables considered in the comparison were daily minimum, mean and maximum air temperature (Tmin, Tmean and Tmax), precipitation, global solar radiation and the derived VPD.
2.3. Macroclimate Data and Interpolation Methods
2.3.1. Source Macroclimate Datasets
Macroclimate data used in this study originated from the FORESEE climate database and its Hungarian extension, FORESEE-HUN, which were developed to support climate change impact studies in Central Europe [30,31]. Gridded climate datasets and interpolation-based climate surfaces are widely used in climate impact assessments because they provide spatially continuous meteorological information suitable for environmental and agricultural applications [25,26,27,28]. Accordingly, four macroclimate datasets representing different spatial resolutions and interpolation approaches were evaluated in this study.
The FORESEE-HUN v1.0 dataset is based on the HUCLIM gridded observational database and EURO-CORDEX climate projections. The construction of the dataset, including bias correction, discontinuity correction, spatial interpolation, and the derivation of additional climate variables, has been described previously [31].
The characteristics of the four macroclimate datasets evaluated in this study are summarized in Table 3.
Table 3.
Characteristics of the macroclimate datasets used in the study.
The datasets included the original FORESEE and FORESEE-HUN databases, as well as two high-resolution products generated from FORESEE-HUN using alternative spatial interpolation methods. Figure 3 summarizes the overall workflow applied for the preparation of the macroclimate datasets and their subsequent comparison with the vineyard-scale observations.
Figure 3.
Framework for Evaluating the Representativeness of Interpolated Climate Data in Complex Terrain. The conceptual framework illustrates how in situ observations, interpolated climate products, statistical performance metrics, and terrain characteristics are integrated to evaluate climate data representativeness. The Mean Topographic Association Score (MTAS) provides an exploratory link between interpolation errors and topographic controls, supporting scientific interpretation and transferability to other environmental applications.
The original FORESEE dataset provides daily gridded meteorological variables for Central Europe on a spatial resolution of 1/6° (approximately 18 km), combining quality-controlled station observations with the E-OBS gridded database [12,34]. For Hungary, a higher-resolution national product, FORESEE-HUN, was developed using the same observational framework but at a spatial resolution of 0.1° (approximately 10–11 km), providing improved representation of regional climatic variability [34].
To investigate whether finer spatial resolution improves the representation of vineyard microclimate, two additional high-resolution products were generated from the FORESEE-HUN dataset. The first product was produced by bilinear interpolation to a 1 km grid, whereas the second incorporated a digital elevation model (DEM)-based downscaling procedure to account for terrain-induced temperature and precipitation gradients. The methodology used to generate these products is described in detail in Section 2.3.2.
Daily minimum, mean and maximum air temperature, precipitation and global solar radiation were extracted from each dataset for the six vineyard locations. These variables were subsequently compared with the corresponding microclimate observations described in Section 2.2.
2.3.2. Generation of High-Resolution Climate Products
To investigate the influence of spatial resolution and topographic correction on the representation of vineyard-scale climatic conditions, two additional high-resolution climate products were generated from the original FORESEE-HUN database. The first product was generated by bilinearly interpolating the original 0.1° gridded fields to a spatial resolution of 1 km without applying terrain correction. This dataset was used to evaluate the effect of increasing spatial resolution alone.
The second product was generated using a digital elevation model (DEM)-based downscaling procedure following the methodology previously developed within the FORESEE framework [30,31,32]. The approach incorporates the influence of topography by adjusting temperature and precipitation fields according to differences between the mean elevations of the original and target grid cells. Mean elevation values for the target grid were derived from the Shuttle Radar Topography Mission (SRTM Version 4.1) digital elevation model [33].
For air temperature, elevation correction was performed using a standard environmental lapse rate of 0.0065 °C m−1, assuming a linear relationship between air temperature and elevation. Precipitation was corrected using locally derived elevation–precipitation regression relationships calculated within moving 5 × 5 grid-cell neighbourhoods. Where local regression coefficients were not statistically robust (absolute slope < 0.001), precipitation correction was based on regression parameters calculated for the entire study domain. The interpolation and terrain-correction procedures were implemented using Interactive Data Language (IDL).
Although the interpolation and downscaling methodology has been described previously within the FORESEE framework [30,31,32], the present manuscript provides a substantially expanded description of the workflow and implementation details to ensure methodological transparency and reproducibility.
2.3.3. Extraction of Vineyard-Scale Climate Data
Daily macroclimate data were extracted from each of the four gridded climate datasets for the six vineyard monitoring sites described in Section 2.2. For each vineyard location, the corresponding value of each gridded climate product was identified and extracted for the entire study period.
The comparison between macroclimate and microclimate observations focused on the variables available in both datasets, namely daily minimum air temperature (Tmin), daily mean air temperature (Tmean), daily maximum air temperature (Tmax), precipitation, global solar radiation, and vapour pressure deficit (VPD). These variables were selected because of their direct relevance to vineyard climate characterization and grapevine development.
To ensure direct comparability, macroclimate and microclimate observations were matched on a daily basis. Daily values derived from the vineyard monitoring network (Section 2.2.3) were paired with the corresponding daily values extracted from each gridded climate product, resulting in four independent macroclimate–microclimate comparison datasets.
The extracted datasets formed the basis for the statistical analyses described in Section 2.4, enabling the performance of the different interpolation approaches to be evaluated under contrasting vineyard topographic conditions.
2.4. Evaluation of Interpolation Accuracy
The paired macroclimate–microclimate datasets described in Section 2.3.3 were evaluated using a series of statistical analyses designed to quantify the agreement between interpolated climate products and vineyard-scale observations. The analysis focused on daily minimum (Tmin), mean (Tmean), and maximum (Tmax) air temperature, precipitation, as well as the derived variables vapour pressure deficit (VPD) and global radiation. All statistical analyses were performed using daily paired observations from the six vineyard monitoring sites, thereby covering the full range of climatic conditions represented during the study period.
Within the FORESEE framework, vapour pressure deficit (VPD) was calculated using the Mountain Microclimate Simulation Model (MTCLIM) [30,31,32]. The MTCLIM estimates daily atmospheric humidity conditions from temperature and precipitation data and subsequently derives daily VPD values according to the original MTCLIM methodology [35]. For microclimate analyses, vapour pressure deficit (VPD) was calculated from bunch-zone air temperature and relative humidity measurements according to:
where RH is relative humidity (%) measured within the grapevine bunch zone and es(T) is the saturation vapour pressure (kPa), calculated according to the FAO-56 formulation [36] as:
where T is air temperature (°C).
Because DEM-based VPD products were not available within the FORESEE framework, VPD evaluation was restricted to the original 1/6° and 0.1° climate products. Unlike temperature variables, DEM-based VPD products were not available within the FORESEE datasets used in this study. For each interpolation method, all available daily observations from the six vineyard monitoring sites were pooled into a single dataset prior to statistical evaluation. Consequently, the reported performance metrics (MB, MAE, RMSE, and Pearson correlation coefficient) characterize the overall agreement between macroclimate and microclimate observations across the entire monitoring network rather than individual sites. Pooling observations from all sites enabled an overall assessment of interpolation performance across the monitoring network. Model performance was evaluated using standard statistical metrics, including mean bias (MB), mean absolute error (MAE), root mean square error (RMSE), and Pearson correlation coefficient (r). In addition, linear regression analyses were performed between microclimate observations and the corresponding macroclimate datasets. The resulting regression parameters (slope, intercept, and coefficient of determination, R2) are summarized in Supplementary Table S2a–d. Bias was calculated as the signed difference between macroclimate estimates and microclimate observations (Macro − Micro), providing information on systematic over- or underestimation. Absolute error was calculated as the absolute value of this difference and was used to quantify the magnitude of deviations irrespective of their direction. These statistical metrics are widely used in climate model evaluation and interpolation validation studies [25,26,27]. In addition, distribution-based analyses, including boxplots of bias and absolute errors, were used to assess the variability and robustness of the different interpolation approaches.
2.5. Exploratory Assessment of Terrain Controls on Interpolation Accuracy Using the Mean Topographic Association Score (MTAS)
To investigate how terrain characteristics influence interpolation accuracy, an exploratory topographic analysis was conducted using four terrain descriptors derived from the Shuttle Radar Topography Mission (SRTM) Digital Elevation Model. Rather than analysing terrain effects separately for each meteorological variable, the aim was to provide an integrated assessment of the overall strength of association between topographic characteristics and interpolation errors.
The primary objective of this analysis was to answer the following research question: Which of the investigated topographic variables shows the strongest overall association with interpolation errors across multiple meteorological variables?
Based on the importance of local terrain configuration for cold-air drainage, airflow patterns and microclimatic heterogeneity in vineyards, we hypothesized the following:
H1.
Topographic variables describing the relative position of a site within the surrounding terrain (e.g., Topographic Position Index, TPI) are expected to exhibit stronger overall associations with interpolation errors than the other investigated topographic variables.
Four terrain descriptors were extracted using QGIS (version 3.40) from the SRTM Digital Elevation Model. Elevation represents the absolute altitude above sea level and primarily reflects the large-scale thermal lapse-rate effect. Slope describes terrain steepness, influencing solar radiation receipt, runoff processes and local energy exchange. Aspect characterizes the orientation of slopes relative to the cardinal directions and therefore affects incoming solar radiation and local microclimatic conditions. Topographic Position Index (TPI) quantifies the relative topographic position of a location with respect to its surrounding terrain, allowing differentiation between ridge tops, hillslopes and valley bottoms where airflow and cold-air drainage processes differ substantially.
Elevation, slope and aspect were derived using the Terrain Analysis tools available in QGIS, whereas TPI was calculated using the Topographic Position Index algorithm. Raster values corresponding to the six vineyard monitoring sites were extracted using the Raster Values to Points tool.
Because aspect is a circular variable, it was decomposed into its northness and eastness components prior to statistical analysis according to:
where θ is the aspect angle expressed in degrees.
Pearson correlation coefficients were then calculated between each terrain descriptor and the corresponding RMSE values across the six vineyard monitoring sites. Because aspect had been decomposed into northness and eastness, correlation coefficients were computed separately for both components according to:
where:
denotes the monitoring sites, with in the present study;
denotes the terrain descriptor (elevation, slope, northness, eastness and TPI);
denotes the meteorological variable;
denotes the interpolation method;
is the value of the j-th terrain descriptor at the -th monitoring site;
is the root mean square error corresponding to the -th monitoring site, the -th meteorological variable, and the -th interpolation method.
Statistical significance was not evaluated because the objective of the analysis was to develop an exploratory comparative indicator rather than to infer population-level relationships.
The absolute values of the Pearson correlation coefficients were used in the MTAS calculation to quantify the strength of the association irrespective of its direction.
To provide an integrated comparison of terrain effects, we introduce the Mean Topographic Association Score (MTAS), defined as:
where:
is the number of investigated meteorological variables
is the Pearson correlation coefficient between the -th terrain descriptor and the RMSE values of the -th meteorological variable for interpolation method , calculated across the six vineyard monitoring sites.
To the best of our knowledge, no comparable composite indicator has previously been proposed for summarizing the overall influence of terrain descriptors on interpolation errors across multiple meteorological variables.
Because aspect was decomposed into northness and eastness, separate MTAS values were calculated for each component as follows:
where and are the Pearson correlation coefficients calculated for the northness and eastness components, respectively.
For graphical presentation, the final Aspect score was calculated as:*
The MTAS provides an integrated measure of the overall association between topographic characteristics and interpolation errors, thereby facilitating direct comparison of their relative importance. The metric is intended solely as an exploratory comparative indicator and should not be interpreted as a predictive or causal model.
Although developed for vineyard microclimate interpolation, the proposed MTAS framework may also facilitate comparison of terrain controls on interpolation accuracy in other complex landscapes.
The results of this exploratory analysis are presented in Section 3.6, where the relative importance of the investigated topographic variables is evaluated using the proposed MTAS framework.
3. Results
3.1. Differences Between Macroclimate and Microclimate Temperature
Significant differences were observed between macroclimate data and in situ microclimate measurements across all interpolation methods (Figure 4). The magnitude and direction of these discrepancies varied depending on the temperature variable and interpolation approach.
Figure 4.
Relationship between macroclimate estimates and vineyard-scale microclimate measurements for daily temperature variables across four interpolation approaches. Panels (a–d) show minimum temperature (Tmin), panels (e–h) show mean temperature (Tmean), and panels (i–l) show maximum temperature (Tmax). Columns represent the evaluated climate products: original 1/6° grid, 0.1° grid, 1 km DEM-based interpolation, and 1 km interpolation without DEM. The x-axis represents the macroclimate temperature estimate derived from the gridded climate dataset, whereas the y-axis represents the corresponding in situ vineyard microclimate measurement. The dashed line indicates the 1:1 relationship. Statistical metrics (Pearson correlation coefficient, r; root mean square error, RMSE; and bias) are reported in each panel. Each point represents a paired daily observation between the gridded climate product and the corresponding vineyard microclimate measurement.
Macroclimate data show systematic deviations from in situ microclimate observations, particularly for Tmin, where consistent overestimation is evident across all interpolation methods. Agreement improves for Tmean and Tmax, although method-dependent differences remain visible.
Daily minimum temperature (Tmin) exhibited the most pronounced deviations, with macroclimate datasets consistently overestimating microclimate conditions across all methods (Figure 4a–d). This systematic bias suggests that gridded climate datasets are unable to fully capture local nighttime cooling processes within vineyard environments. The larger discrepancies observed for minimum temperature are likely related to local terrain-driven processes that operate at spatial scales smaller than those resolved by the gridded climate products. In vineyard environments, nocturnal cold-air drainage, cold-air pooling in depressions and valley bottoms, and temperature inversions may generate substantial local variability in minimum temperature. Consequently, even high-resolution interpolation approaches may not fully reproduce the microclimatic conditions experienced at individual vineyard sites.
In contrast, daily mean temperature (Tmean) showed improved agreement between macro- and microclimate data, although deviations remained evident (Figure 4e–h). Daily maximum temperature (Tmax) demonstrated the highest level of agreement, with values generally distributed closer to the 1:1 line (Figure 4i–l), suggesting that daytime temperature conditions are better represented by interpolated datasets. Detailed linear regression statistics (slope, intercept, and coefficient of determination, R2) for Tmin, Tmean, and Tmax are provided in Supplementary Table S2a.
The distribution of absolute errors further confirms these patterns, with the largest errors observed for Tmin and progressively smaller errors for Tmean and Tmax (Figure 5).
Figure 5.
Distribution of absolute errors in daily temperature estimates for Tmin, Tmean, and Tmax across interpolation methods. Boxplots represent the variability of absolute differences between macroclimate and microclimate observations.
Absolute errors are largest for Tmin, indicating greater uncertainty in representing nocturnal conditions. Errors decrease for Tmean and Tmax, although variability remains substantial across interpolation methods.
Bias analysis reveals a generally negative bias for Tmin across all interpolation methods, whereas biases for Tmean and Tmax were smaller and less systematic (Figure 6).
Figure 6.
Distribution of bias in daily temperature estimates for Tmin, Tmean, and Tmax across interpolation methods. Bias is defined as the difference between macroclimate and microclimate values.
Temperature bias is predominantly positive for Tmin, confirming systematic overestimation by macroclimate datasets. In contrast, biases for Tmean and Tmax are smaller and less consistent across methods.
3.2. Performance of Interpolation Methods
Clear differences were identified among the evaluated interpolation approaches in their ability to reproduce vineyard-scale temperature conditions (Figure 4).
The highest agreement with microclimate observations was obtained for the 0.1° gridded dataset. In contrast, the 1 km interpolation products, including both DEM-based and non-DEM approaches, did not consistently improve model performance relative to the coarser-resolution datasets. The DEM-based correction produced only minor differences compared with the corresponding non-DEM interpolation product. However, even the most advanced methods exhibited non-negligible deviations, particularly for Tmin.
The 0.1° gridded dataset generally provided the best overall agreement with vineyard observations. These results indicate that increasing spatial resolution alone is not sufficient to improve representativeness at the vineyard scale. The relatively small differences observed between the DEM-based and non-DEM interpolation products suggest that topographic corrections alone are insufficient to fully capture local microclimatic variability. Despite these differences, none of the interpolation methods fully captured the variability observed in the microclimate measurements, indicating inherent limitations of gridded datasets at the vineyard scale. A synthesis of interpolation performance across all evaluated variables and climate products, expressed as RMSE values, is presented in Supplementary Figure S3.
3.3. Precipitation Variability and Uncertainty
Precipitation showed substantially weaker agreement between macroclimate and microclimate observations than temperature-related variables (Figure 7).
Figure 7.
Comparison of macroclimate and in situ microclimate daily precipitation across four interpolation approaches. Panels (a–d) show daily precipitation comparisons for the original 1/6° grid, 0.1° grid, 1 km DEM-based interpolation, and 1 km interpolation without DEM, respectively. The x-axis represents the macroclimate precipitation estimate derived from each climate product, whereas the y-axis represents the corresponding in situ vineyard precipitation measurement. The dashed line indicates the 1:1 relationship. Statistical metrics (Pearson correlation coefficient, r; root mean square error, RMSE; and bias) are reported in each panel. Each point represents a paired daily observation between the gridded climate product and the corresponding vineyard precipitation measurement.The large scatter around the 1:1 relationship and the comparatively high RMSE values indicate considerable spatial variability and limited predictability at vineyard scale.
Absolute error distributions (Figure 8) reveal substantial variability among precipitation events, including occasional large deviations between observed and interpolated values.
Figure 8.
Distribution of absolute errors in daily precipitation across interpolation methods. Boxplots summarize the median, interquartile range, and overall spread of absolute precipitation errors, illustrating the variability and robustness of each interpolation approach.
Bias distributions (Figure 9) indicate the absence of a consistent systematic pattern, as both overestimation and underestimation occur across interpolation methods.
Figure 9.
Distribution of bias in daily precipitation across interpolation methods. Positive values indicate overestimation, whereas negative values indicate underestimation of daily precipitation relative to vineyard observations. Boxplots illustrate the magnitude and variability of systematic errors among interpolation approaches.
These findings suggest that precipitation remains considerably more difficult to represent using interpolated climate datasets than temperature-related variables. Detailed regression statistics are provided in Supplementary Table S2b.
3.4. Vapor Pressure Deficit (Vpd)
Moderate agreement was observed between macroclimate and vineyard microclimate VPD estimates (Figure 10), although substantial dispersion remained, particularly under high atmospheric moisture deficit conditions.
Figure 10.
Comparison of macroclimate and in situ microclimate daily vapor pressure deficit (VPD) for (a) 1/6° grid and (b) 0.1° grid interpolation methods. The dashed line indicates the 1:1 relationship. Statistical metrics (r, RMSE, bias) are shown in each panel.
Deviations were particularly evident under higher VPD conditions, suggesting that interpolation methods may struggle to accurately represent atmospheric moisture deficits at the canopy scale.
VPD shows moderate agreement between macro- and microclimate data, with noticeable dispersion and systematic deviations, particularly under higher VPD conditions. Detailed linear regression statistics for vapour pressure deficit are provided in Supplementary Table S2c.
Absolute error distributions confirm moderate discrepancies between datasets (Figure 11), while bias analysis indicates relatively small but variable systematic differences (Figure 12).
Figure 11.
Distribution of absolute errors in daily vapor pressure deficit (VPD) across interpolation methods.
Figure 12.
Distribution of bias in daily vapor pressure deficit (VPD) across interpolation methods.
The lack of DEM-based VPD estimation limits the potential for improved accuracy through topographic correction.
Absolute errors in VPD indicate moderate discrepancies between datasets, with variability increasing under more extreme atmospheric conditions.
Bias patterns suggest slight systematic differences between macro- and microclimate VPD estimates, although no consistent directional bias is observed across all cases.
3.5. Global Radiation
Global radiation showed moderate to strong agreement between macroclimate and microclimate datasets (Figure 13), with values generally following the 1:1 relationship. Although radiation was represented more consistently than precipitation, the overall agreement was lower than that observed for mean and maximum temperature variables.
Figure 13.
Comparison of macroclimate and in situ microclimate daily global radiation for (a) 1/6° grid and (b) 0.1° grid interpolation methods. The dashed line indicates the 1:1 relationship. Statistical metrics (r, RMSE, bias) are shown in each panel.
Global radiation showed moderate to strong agreement between macro- and microclimate datasets, with correlation coefficients ranging between 0.79 and 0.84. However, the agreement was generally lower than that observed for mean and maximum temperature variables. Detailed linear regression statistics for global radiation are provided in Supplementary Table S2d. Absolute errors were generally smaller (Figure 14), and bias values were centered around zero (Figure 15), indicating limited systematic deviation. These results reflect the more spatially coherent nature of radiation compared to other meteorological variables.
Figure 14.
Distribution of absolute errors in daily global radiation across interpolation methods.
Figure 15.
Distribution of bias in daily global radiation across interpolation methods.
Absolute errors in radiation are generally smaller compared to other variables, suggesting better consistency between interpolated and observed values.
Radiation bias is relatively limited, although a moderate positive bias is evident for the 0.1° dataset. Nevertheless, the observed bias remains substantially smaller than the overall range of measured radiation values and does not affect the strong correlation between macroclimate estimates and vineyard observations. The comparatively strong agreement observed for global radiation is likely related to the fact that incoming solar radiation is primarily controlled by large-scale atmospheric conditions and solar geometry. Although local terrain may influence radiation through slope orientation and topographic shading, radiation is generally less affected by small-scale microclimatic processes than near-surface temperature. Consequently, radiation tends to exhibit lower spatial variability at vineyard scale, resulting in better agreement between macroclimate datasets and vineyard observations.
3.6. Topographic Controls on Interpolation Accuracy Using the Mean Topographic Association Score (MTAS)
To provide an integrated assessment of terrain effects across multiple meteorological variables, the Mean Topographic Association Score (MTAS) was applied to the 0.1° interpolation dataset. The resulting MTAS values revealed clear differences in the overall association between the investigated terrain descriptors and interpolation errors (Figure 16a).
Figure 16.
Exploratory assessment of terrain controls on interpolation accuracy using the Mean Topographic Association Score (MTAS). (a) Mean Topographic Association Score (MTAS) for the investigated terrain descriptors, calculated as the arithmetic mean of the absolute Pearson correlation coefficients across the six investigated meteorological variables. Higher MTAS values indicate stronger overall associations with interpolation errors. (b) Pearson correlation coefficients between terrain descriptors and interpolation errors for the six investigated meteorological variables. Positive and negative values indicate the direction of the relationship, whereas colour intensity represents its strength. Aspect values were calculated as the mean of the northness- and eastness-based correlations (panel b) and the corresponding MTAS values (panel a).
Topographic Position Index (TPI) exhibited the highest MTAS value (0.569), indicating the strongest overall association with interpolation errors across the six investigated meteorological variables. Elevation ranked second (0.530), followed by Aspect* (0.481) and slope (0.419). These results suggest that the relative topographic position of a vineyard exerts a stronger influence on interpolation accuracy than absolute elevation, slope steepness or slope orientation. These results support the proposed hypothesis (H1), indicating that terrain descriptors representing the relative topographic position of a site provide stronger overall associations with interpolation errors than conventional topographic variables. MTAS values calculated for all evaluated interpolation methods are provided in Supplementary Table S5.
The Pearson correlation matrix (Figure 16b) further demonstrated that the magnitude and direction of terrain–error relationships varied considerably among meteorological variables. Elevation showed very strong positive correlations with interpolation errors for Tmin (r = 0.90) and Tmean (r = 0.96), whereas a strong negative relationship was observed for VPD (r = −0.89). Similarly, slope was positively associated with Tmin (r = 0.73) and Tmean (r = 0.58), but negatively associated with precipitation (r = −0.61) and VPD (r = −0.43). In contrast, TPI exhibited strong positive correlations with Tmin (r = 0.65) and moderate positive correlations with Tmean (r = 0.41), while strong negative associations were observed for precipitation (r = −0.90), Tmax (r = −0.54) and VPD (r = −0.57). Aspect* generally showed weaker and less consistent relationships with interpolation errors than the other terrain descriptors. The complete set of Pearson correlation coefficients used in the MTAS calculations is provided in Supplementary Table S6.
Overall, these findings indicate that the influence of terrain on interpolation accuracy is variable-specific and cannot be adequately described by a single topographic characteristic. Nevertheless, the consistently highest MTAS value obtained for TPI demonstrates that the relative topographic position of vineyard sites provides the most informative descriptor for explaining interpolation errors across multiple meteorological variables. This highlights the importance of terrain configuration and cold-air drainage processes when evaluating the representativeness of interpolated climate datasets in complex vineyard landscapes.
3.7. Overall Evaluation of Interpolation Performance
Across all investigated meteorological variables, substantial differences emerged in the ability of the evaluated macroclimate datasets to represent vineyard-scale conditions. Temperature variables, particularly daily minimum temperature (Tmin), exhibited the largest systematic discrepancies, highlighting the importance of local terrain-induced microclimatic processes, including radiative cooling and cold-air drainage. In contrast, daily mean (Tmean) and maximum temperature (Tmax) generally showed stronger agreement with vineyard observations across the evaluated interpolation methods.
Precipitation exhibited the greatest variability and the weakest overall agreement among the investigated variables, reflecting the spatial heterogeneity and localized nature of rainfall events. Vapour pressure deficit (VPD) showed moderate agreement despite being derived from model-based estimates, whereas global radiation generally exhibited moderate to strong agreement with vineyard observations.
The exploratory MTAS analysis also demonstrated that interpolation accuracy is influenced not only by the meteorological variable considered but also by local terrain characteristics. Among the investigated terrain descriptors, the Topographic Position Index (TPI) consistently exhibited the strongest overall association with interpolation errors, indicating that the relative topographic position of vineyard sites plays a greater role in determining interpolation performance than absolute elevation, slope steepness, or slope orientation.
Taken together, these findings demonstrate that the reliability of interpolated climate datasets depends on both the meteorological variable and the surrounding terrain. Consequently, the suitability of interpolated climate datasets for vineyard-scale climate analyses should be evaluated on both a variable-specific and terrain-specific basis rather than assuming uniform performance across different climatic variables and landscape settings. A comprehensive summary of interpolation performance metrics (Bias, MAE, RMSE, and Pearson correlation coefficients) for all evaluated variables and interpolation methods is provided in Supplementary Table S3.
4. Discussion
4.1. Microclimate vs. Macroclimate: Fundamental Limitations
The present results clearly confirm that macroclimate datasets cannot adequately represent vineyard-scale climatic conditions, particularly for minimum temperature. This is strongly supported by previous studies showing that interpolated or grid-based datasets may fail to capture fine-scale variability, especially under complex topographic conditions [23,25,26,27,28]. For instance, high-resolution climate surfaces and interpolation approaches may not fully reproduce local temperature patterns because terrain-driven processes operate at spatial scales below the resolution of gridded datasets [23,25,26,27,28]. Similarly, the use of a single weather station to represent an entire wine region has been shown to be insufficient, as temperature variability within vineyards can exceed several degrees Celsius even over short distances [37]. These findings are consistent with the challenges of representing vineyard-scale minimum temperature conditions using gridded climate datasets, particularly under complex topographic settings.
4.2. Role of Spatial Scale and Measurement Strategy
The results highlight the importance of measurement scale. Meteorological variability exists across multiple spatial levels, from macroclimate to canopy-level microclimate, each influencing grapevine processes differently. Field experiments using wireless sensor networks have demonstrated that temperature, radiation, and humidity vary significantly not only between vineyards but also within them, depending on canopy structure and management practices [20,29]. These findings reinforce the need for site-specific measurements when evaluating vineyard conditions. Moreover, studies comparing interpolated and in situ measurements conclude that interpolated datasets can be reliable for some variables (e.g., Tmax), but not for others such as Tmin, especially in complex terrain [23].
4.3. Topography and Local Controls of Climate Variability
Topography emerges as one of the dominant drivers of microclimate variability. Elevation, slope, and aspect influence radiation balance, air drainage, and heat accumulation, leading to strong spatial heterogeneity. Large sensor network studies have shown that minimum temperature variability within vineyards can reach up to 10 °C on a single day, emphasizing the magnitude of local effects [21]. These variations are primarily driven by terrain-induced processes such as cold air drainage and differential radiation exposure. In addition, the interaction between topography and atmospheric conditions (e.g., wind, cloud cover) determines whether local variability is amplified or suppressed [21]. This explains why errors are particularly pronounced under stable nocturnal conditions. The larger discrepancies observed for minimum temperature in the present study are consistent with the influence of local terrain-driven processes operating at spatial scales smaller than those resolved by gridded climate products. Cold-air drainage, cold-air pooling in depressions and valley bottoms, and nocturnal temperature inversions can generate substantial microclimatic variability among vineyard sites, even within relatively small geographic areas. As a result, interpolation approaches based primarily on regional-scale climatic gradients may fail to fully reproduce local minimum temperature conditions, particularly during stable nighttime situations. This limitation was also reflected in the present results, where minimum temperature exhibited substantially larger discrepancies than the other evaluated variables. To further explore the influence of terrain characteristics on interpolation performance, an exploratory topographic analysis was conducted using the Mean Topographic Association Score (MTAS).
The exploratory MTAS analysis supported our hypothesis (H1), demonstrating that the Topographic Position Index (TPI) exhibited the strongest overall association with interpolation errors among the investigated terrain descriptors. Unlike elevation, which primarily represents absolute altitude, TPI characterizes the relative topographic position of a site within the surrounding landscape and therefore better reflects terrain-induced processes such as cold-air drainage, cold-air pooling and local airflow pathways. Although elevation showed strong associations with interpolation errors for minimum and mean air temperature, the MTAS analysis suggests that relative terrain position provides a more comprehensive explanation of interpolation performance across multiple meteorological variables. These findings indicate that improving vineyard-scale climate interpolation requires consideration not only of elevation but also of local terrain configuration.
Overall, the present findings demonstrate that terrain-related processes exert a substantially stronger influence on interpolation accuracy for temperature—particularly minimum temperature—than for variables such as global radiation. Together with the MTAS analysis, these results emphasize that the relative topographic position of vineyard sites should be considered alongside elevation when evaluating and improving vineyard-scale climate interpolation.
4.4. Limits of Interpolation and Downscaling Approaches
Although spatial interpolation and downscaling techniques improve the resolution of climate data, they remain insufficient for capturing vineyard-scale variability. The DEM-based downscaling procedure applied in the present study accounts for the average influence of topography through elevation correction but cannot explicitly represent fine-scale processes such as cold-air drainage, nocturnal temperature inversions, or local airflow patterns. Consequently, even DEM-corrected climate products are expected to exhibit residual discrepancies when compared with vineyard-scale observations collected in complex terrain. Climate downscaling studies indicate that even high-resolution datasets (e.g., 1 km grids) cannot fully represent intra-regional heterogeneity due to unresolved local factors such as soil properties, slope, and aspect [18,25,26,27,28,38,39]. This limitation is clearly reflected in the present results. For example, the RMSE of Tmin decreased from 3.85 °C for the original 1/6° dataset to 2.41 °C for the 0.1° product, representing a substantial improvement in interpolation performance. Nevertheless, considerable residual errors remained even after resolution enhancement. Similar patterns were observed for other variables, indicating that increasing spatial resolution alone is insufficient to fully capture vineyard-scale climatic variability. These findings suggest that local terrain effects and microclimatic processes continue to contribute substantially to interpolation uncertainty, even when higher-resolution climate products are used. Furthermore, statistical models based on topographic predictors improve performance but still rely on simplifying assumptions (e.g., linear relationships), which may limit their ability to capture complex microclimatic processes [37].
4.5. Variable-Specific Performance
A key outcome of this study is that model performance is highly variable-dependent. Global radiation showed moderate to strong agreement between macro- and microclimate datasets, although overall agreement was generally lower than that observed for mean and maximum temperature. This is consistent with its dependence on large-scale atmospheric forcing, while still being influenced by local topographic conditions.
The comparatively strong agreement observed for global radiation is likely related to the fact that incoming solar radiation is primarily controlled by large-scale atmospheric conditions and solar geometry. Although local terrain may influence radiation through slope orientation, aspect, and topographic shading, radiation is generally less affected by small-scale microclimatic processes than near-surface temperature. Vineyard-scale studies have demonstrated that local topographic conditions can modify radiation receipt, but these effects are typically smaller than the terrain-driven influences observed for minimum temperature [29]. Consequently, radiation tends to exhibit lower spatial variability at vineyard scale, resulting in better agreement between interpolated climate products and vineyard observations.
In contrast, temperature—especially Tmin—showed substantial discrepancies. This aligns with previous findings that minimum temperature is particularly sensitive to local processes such as cold air accumulation and thermal stratification [21].
Precipitation exhibited substantially weaker agreement between macroclimate and vineyard observations than the temperature-related variables. This result is consistent with the inherently high spatial and temporal variability of precipitation, which is strongly influenced by localized atmospheric processes that are difficult to capture using interpolated climate datasets [25,26,38]. The large spread of precipitation errors observed in the present study further highlights the limitations of gridded climate products at vineyard scale. Although precipitation was not a primary focus of this work, its comparatively low predictability provides additional evidence that interpolation performance is highly variable-dependent and that caution is required when applying macroclimate datasets to local-scale viticultural assessments.
Because VPD depends on both temperature and atmospheric humidity conditions, deviations in VPD may arise from multiple sources of uncertainty rather than from temperature-related errors alone. Consequently, uncertainties in VPD estimates may reflect the combined effects of errors in both temperature and humidity fields. In addition, global radiation was evaluated only for the original 1/6° and 0.1° climate products. Therefore, the performance of high-resolution (1 km) interpolated radiation datasets could not be assessed in the present study and requires further investigation.
4.6. Implications for Viticulture and Grape Quality
The observed differences between macro- and microclimate data have direct implications for viticulture. Temperature, radiation, and humidity are key drivers of grapevine phenology and berry composition [1,2,3,19,40]. Spatial variability in these variables can lead to differences in ripening dynamics, sugar accumulation, acidity, and aroma compounds. Microclimate variability has been shown to significantly influence grape quality and phenological development, particularly through its effect on temperature and radiation regimes [29]. Moreover, inaccurate representation of temperature—especially Tmin—can lead to errors in phenological modelling and climate suitability assessments [23].
4.7. Practical Implications for Vineyard Management
From a practical perspective, the results emphasize the importance of microclimate-aware approaches in viticulture. The integration of in-vineyard sensors, high-resolution modelling, and spatial analysis enables more precise vineyard management, including optimized site selection, irrigation, and canopy management strategies. Microclimate characterization has been identified as a key factor in improving decision-making and adapting viticulture to climate variability and change [7,8,9,29].
4.8. Limitations and Future Research Directions
The present study focuses on the observational validation of gridded climate products against vineyard-scale measurements, whereas the approach described in [41] applied terrain-based temperature corrections to improve the representation of vineyard microclimates in climate analogue analyses. The two approaches are complementary, with the former providing an empirical assessment of interpolation accuracy and the latter aiming to improve the spatial representation of local climatic conditions.
Future climate change may further increase the importance of accurately representing vineyard-scale microclimates. Rising temperatures are expected to alter the frequency and intensity of local temperature gradients, cold-air drainage processes, and nocturnal temperature inversions, potentially increasing uncertainties associated with the representation of minimum temperature in interpolated climate datasets. In addition, projected increases in drought frequency and atmospheric evaporative demand may enhance the importance of VPD as a viticultural indicator. Under such conditions, uncertainties in temperature and humidity estimates may propagate more strongly into VPD calculations, particularly during extreme drought and high-radiation events. These considerations highlight the need for future studies that explicitly evaluate interpolation performance under changing climatic conditions.
Although a formal uncertainty propagation analysis was beyond the scope of the present study, the principal sources of uncertainty associated with interpolation procedures, sensor measurements and MTCLIM-derived VPD estimates are explicitly discussed to facilitate the interpretation of the results.
Additional limitations should also be acknowledged. The analysis was based on six vineyard monitoring sites, which, although representing contrasting environmental settings, may not capture the full range of vineyard microclimatic variability. Furthermore, interpolation performance was evaluated using the available September 2019–June 2021 observational dataset and was not independently assessed across different years or seasonal subsets. Consequently, the temporal stability of interpolation performance under varying climatic conditions remains uncertain and should be investigated in future studies. Finally, the present study focused on the climate products available within the FORESEE framework and did not evaluate alternative interpolation algorithms, such as kriging- or spline-based approaches. Comparative assessments of different interpolation techniques may provide additional insight into the sources of interpolation uncertainty.
Future research should also investigate the relationship between interpolation errors and specific terrain characteristics, such as elevation, slope position, topographic exposure, and cold-air accumulation potential. Such analyses could help identify the terrain conditions under which gridded climate datasets are most likely to deviate from vineyard-scale observations and improve the interpretation of interpolation uncertainties.
Additional site-specific analyses (Supplementary Table S4A–F and Figure S2) revealed substantial variability in interpolation performance among vineyard locations. The magnitude of interpolation errors differed considerably across sites, indicating that local environmental conditions influence the agreement between interpolated climate estimates and vineyard-scale observations. The largest errors were generally observed at the Nagy-Eged vineyard, characterized by steep slopes, pronounced elevation gradients, and relatively dry conditions. Although the limited number of monitoring sites does not allow a formal statistical assessment of individual topographic controls, the observed site-to-site differences are consistent with the interpretation that terrain complexity and associated microclimatic heterogeneity contribute to local interpolation uncertainties.
The primary objective of the present study was to evaluate the practical representativeness of different interpolated climate datasets across vineyard sites rather than to perform formal statistical inference on population-level effects. Consequently, the comparison focused on widely accepted performance metrics (MB, MAE, RMSE and Pearson’s correlation coefficient), which are commonly used in climate dataset validation studies. Future investigations based on larger monitoring networks and longer observational records could further strengthen these evaluations through mixed-effects modelling and confidence interval estimation.
Future studies based on larger monitoring networks and longer observational periods may further strengthen representativeness assessments through advanced statistical approaches, including mixed-effects modelling, confidence interval estimation and comprehensive uncertainty propagation analyses.
5. Conclusions
This study evaluated the ability of macroclimate-based climate products with different spatial resolutions to represent vineyard-scale microclimatic conditions across multiple climatic variables. The results demonstrated that interpolation performance is strongly variable-dependent. Minimum temperature exhibited the largest discrepancies between macroclimate and vineyard observations, reflecting the influence of local processes such as cold-air drainage, cold-air pooling, and nocturnal temperature inversions. In contrast, global radiation showed moderate to strong agreement with observations, likely because it is primarily controlled by large-scale atmospheric conditions and solar geometry, although local topographic effects remain important.
Increasing spatial resolution improved interpolation performance for several variables. For example, the RMSE of Tmin decreased from 3.85 °C for the original 1/6° dataset to 2.41 °C for the 0.1° product. Nevertheless, substantial residual errors remained, indicating that increasing spatial resolution alone is insufficient to fully capture vineyard-scale climatic variability. These persistent discrepancies highlight the continuing influence of local terrain effects and microclimatic processes that are not fully represented in gridded climate datasets. The exploratory Mean Topographic Association Score (MTAS) analysis further identified the Topographic Position Index (TPI) as the terrain descriptor showing the strongest overall association with interpolation errors, emphasizing the importance of relative terrain position for vineyard-scale climate characterization.
The results further indicate that uncertainties in derived variables such as vapour pressure deficit (VPD) may arise from the combined effects of temperature- and humidity-related uncertainties. Together with the comparatively weak performance observed for precipitation, these findings emphasize that the reliability of interpolated climate products depends strongly on the climatic variable under consideration.
From a practical perspective, the results suggest that macroclimate datasets should be applied with caution in vineyard-scale studies, particularly when assessing climate-sensitive processes, phenology, climate suitability, and adaptation strategies. The integration of vineyard observations, high-resolution climate information, and microclimate-aware approaches is therefore essential for improving local-scale climate assessments in viticultural regions.
Future research should focus on evaluating interpolation performance under different climatic conditions, extending the MTAS approach to a wider range of landscapes and climatic regions, and improving the representation of vineyard microclimates through high-resolution and process-based modelling approaches. Beyond viticulture, the proposed MTAS framework may also provide a useful exploratory tool for identifying terrain controls on interpolation accuracy in other topographically complex environments, including forestry, ecology, environmental monitoring, and precision agriculture.
Supplementary Materials
The following supporting information can be downloaded at: https://www.mdpi.com/article/10.3390/atmos17080759/s1.
Funding
This research was supported by the EFOP-3.6.2-16-2017-00001 project, “Research on complex rural economic and sustainability development and the development of its service network in the Carpathian Basin”, co-financed by the European Union.
Institutional Review Board Statement
Not applicable.
Informed Consent Statement
Not applicable.
Data Availability Statement
The data presented in this study are available on request from the corresponding author.
Conflicts of Interest
The author declares no conflicts of interest.
References
- Jones, G.V.; White, M.A.; Cooper, O.R.; Storchmann, K. Climate change and global wine quality. Clim. Change 2005, 73, 319–343. [Google Scholar] [CrossRef] [Scilit]
- Keller, M. The Science of Grapevines: Anatomy and Physiology, 2nd ed.; Academic Press: London, UK, 2015. [Google Scholar]
- van Leeuwen, C.; Darriet, P. The impact of climate change on viticulture and wine quality. J. Wine Econ. 2016, 11, 150–167. [Google Scholar] [CrossRef] [Scilit]
- Jones, G.V. The Climate Component of Terroir. Elements 2018, 14, 167–172. [Google Scholar] [CrossRef] [Scilit]
- Jones, G.V. Climate, grapes, and wine: Structure and suitability in a changing climate. Acta Hortic. 2012, 931, 19–28. [Google Scholar] [CrossRef] [Scilit]
- Hannah, L.; Roehrdanz, P.R.; Ikegami, M.; Shepard, A.V.; Shaw, M.R.; Tabor, G.; Zhi, L.; Marquet, P.A.; Hijmans, R.J. Climate change, wine, and conservation. Proc. Natl. Acad. Sci. USA 2013, 110, 6907–6912. [Google Scholar] [CrossRef] [Scilit] [PubMed]
- Fraga, H.; Malheiro, A.C.; Moutinho-Pereira, J.; Santos, J.A. An overview of climate change impacts on European viticulture. Food Energy Secur. 2012, 1, 94–110. [Google Scholar] [CrossRef] [Scilit]
- Santos, J.A.; Fraga, H.; Malheiro, A.C.; Moutinho-Pereira, J.; Dinis, L.T.; Correia, C.; Moriondo, M.; Leolini, L.; Dibari, C.; Costafreda-Aumedes, S.; et al. A review of the potential climate change impacts and adaptation options for European viticulture. Appl. Sci. 2020, 10, 3092. [Google Scholar] [CrossRef] [Scilit]
- Santos, J.A.; Malheiro, A.C.; Pinto, J.G.; Jones, G.V. Macroclimate and viticultural zoning in Europe: Observed trends and atmospheric forcing. Clim. Res. 2012, 51, 89–103. [Google Scholar] [CrossRef] [Scilit]
- Geiger, R.; Aron, R.H.; Todhunter, P. The Climate Near the Ground, 7th ed.; Rowman & Littlefield: Lanham, MD, USA, 2009. [Google Scholar]
- Quénol, H.; Garcia de Cortázar-Atauri, I.; Bois, B.; Sturman, A.; Bonnardot, V.; Le Roux, R. Which climatic modeling to assess climate change impacts on vineyards? OENO ONE 2017, 51, 91–97. [Google Scholar] [CrossRef] [Scilit]
- van Leeuwen, C.; Friant, P.; Choné, X.; Tregoat, O.; Koundouras, S.; Dubourdieu, D. Influence of climate, soil, and cultivar on terroir. Am. J. Enol. Vitic. 2004, 55, 207–217. [Google Scholar] [CrossRef] [Scilit]
- Ashenfelter, O.; Storchmann, K. Using Hedonic Models of Solar Radiation and Weather to Assess the Economic Effect of Climate Change: The Case of Mosel Valley Vineyards. Rev. Econ. Stat. 2010, 92, 333–349. [Google Scholar] [CrossRef] [Scilit]
- Bonada, M.; Sadras, V.O. Critical appraisal of methods to investigate the effect of temperature on grapevine phenology. Aust. J. Grape Wine Res. 2015, 21, 1–17. [Google Scholar] [CrossRef] [Scilit]
- van Leeuwen, C.; Destrac-Irvine, A. Modified grape composition under climate change conditions requires adaptation of viticultural practices. OENO One 2017, 51, 147–154. [Google Scholar] [CrossRef] [Scilit]
- Greer, D.H.; Weedon, M.M. Modelling photosynthetic responses to temperature of grapevine (Vitis vinifera cv. Semillon) leaves on vines grown in a hot climate. Plant Cell Environ. 2012, 35, 1050–1064. [Google Scholar] [CrossRef] [Scilit] [PubMed]
- Parker, A.K.; Garcia de Cortázar-Atauri, I.; van Leeuwen, C.; Chuine, I. General phenological model to characterize the timing of flowering and veraison of Vitis vinifera L. Aust. J. Grape Wine Res. 2011, 17, 206–216. [Google Scholar] [CrossRef] [Scilit]
- Fonseca, A.; Cruz, J.; Fraga, H.; Andrade, C.; Valente, J.; Alves, F.; Neto, C.; Flores, R.; Santos, J.A. Enhancing climate change impact assessment in viticulture by resolving microclimates. Eur. J. Agron. 2025, 170, 127740. [Google Scholar] [CrossRef] [Scilit]
- Faralli, M.; Mallucci, S.; Bignardi, A.; Varner, M.; Bertamini, M. Four decades in the vineyard: The impact of climate change on grapevine phenology and wine quality in northern Italy. OENO One 2024, 58, 1–21. [Google Scholar] [CrossRef] [Scilit]
- Jones, H.G.; Tardieu, F. Modelling water relations of horticultural crops: A review. Sci. Hortic. 1998, 74, 21–46. [Google Scholar] [CrossRef] [Scilit]
- de Rességuier, L.; Le Roux, R.; Quénol, H.; van Leeuwen, C.; Pieri, P.; Petitjean, T.; Madelin, M. Temperature variability at local scale in the Bordeaux area: Relations with environmental factors and impact on vine phenology. Front. Plant Sci. 2020, 11, 515. [Google Scholar] [CrossRef] [Scilit] [PubMed]
- Beck, H.E.; Zimmermann, N.E.; McVicar, T.R.; Vergopolan, N.; Berg, A.; Wood, E.F. Present and future Köppen–Geiger climate classification maps at 1-km resolution. Sci. Data 2018, 5, 180214. [Google Scholar] [CrossRef] [Scilit] [PubMed]
- Fick, S.E.; Hijmans, R.J. WorldClim 2: New 1-km spatial resolution climate surfaces for global land areas. Int. J. Climatol. 2017, 37, 4302–4315. [Google Scholar] [CrossRef] [Scilit]
- Neethling, E.; Barbeau, G.; Coulon-Leroy, C.; Quénol, H. Spatial Complexity and Temporal Dynamics in Viticulture: A Review of Climate-Driven Scales. Agric. For. Meteorol. 2019, 276–277, 107618. [Google Scholar] [CrossRef] [Scilit]
- Daly, C.; Halbleib, M.; Smith, J.I.; Gibson, W.P.; Doggett, M.K.; Taylor, G.H.; Curtis, J.; Pasteris, P.P. Physiographically sensitive mapping of climatological temperature and precipitation across the conterminous United States. Int. J. Climatol. 2008, 28, 2031–2064. [Google Scholar] [CrossRef] [Scilit]
- Thornton, P.E.; Running, S.W.; White, M.A. Generating surfaces of daily meteorological variables over large regions of complex terrain. J. Hydrol. 1997, 190, 214–251. [Google Scholar] [CrossRef] [Scilit]
- Hijmans, R.J.; Cameron, S.E.; Parra, J.L.; Jones, P.G.; Jarvis, A. Very high resolution interpolated climate surfaces for global land areas. Int. J. Climatol. 2005, 25, 1965–1978. [Google Scholar] [CrossRef] [Scilit]
- Harris, I.; Jones, P.D.; Osborn, T.J.; Lister, D.H. Updated high-resolution grids of monthly climatic observations—The CRU TS 3.10 dataset. Int. J. Climatol. 2014, 34, 623–642. [Google Scholar] [CrossRef] [Scilit]
- Matese, A.; Di Gennaro, S.F.; Zaldei, A.; Genesio, L.; Vaccari, F.P. A wireless sensor network for precision viticulture: The NAV system. Comput. Electron. Agric. 2009, 69, 51–58. [Google Scholar] [CrossRef] [Scilit]
- Dobor, L.; Barcza, Z.; Havasi, Á.; Hlasny, T.; Horváth, F.; Ittzés, P.; Bartholy, J. Bridging the Gap between Climate Models and Impact Studies: The FORESEE Database. Geosci. Data J. 2015, 2, 1–11. [Google Scholar] [CrossRef] [Scilit] [PubMed]
- Kern, A.; Dobor, L.; Hollós, R.; Marjanovic, H.; Torma, C.Z.; Kis, A.; Fodor, N.; Barcza, Z. Seamlessly Combined Historical and Projected Daily Meteorological Datasets for Impact Studies in Central Europe: The FORESEE v4.0 and the FORESEE-HUN v1.0 Climate Services. Clim. Serv. 2024, 33, 100443. [Google Scholar] [CrossRef] [Scilit]
- Kern, A.; Marjanović, H.; Barcza, Z. Evaluation of the Quality of NDVI3g Dataset against Collection 6 MODIS NDVI in Central Europe between 2000 and 2013. Remote Sens. 2016, 8, 955. [Google Scholar] [CrossRef] [Scilit]
- Jarvis, A.; Reuter, H.I.; Nelson, A.; Guevara, E. Hole-Filled SRTM for the Globe Version 4. CGIAR-CSI SRTM 90m Database. 2008. Available online: http://srtm.csi.cgiar.org (accessed on 1 March 2026).
- Webb, L.B.; Whetton, P.H.; Barlow, E.W.R. Climate change and winegrape quality in Australia. Clim. Res. 2008, 36, 99–111. [Google Scholar] [CrossRef] [Scilit]
- Thornton, P.E.; Hasenauer, H.; White, M.A. Simultaneous estimation of daily solar radiation and humidity from observed temperature and precipitation: An application over complex terrain in Austria. Agric. For. Meteorol. 2000, 104, 255–271. [Google Scholar] [CrossRef] [Scilit]
- Allen, R.G.; Pereira, L.S.; Raes, D.; Smith, M. Crop Evapotranspiration: Guidelines for Computing Crop Water Requirements; FAO Irrigation and Drainage Paper No. 56; FAO: Rome, Italy, 1998. [Google Scholar]
- Bois, B.; Joly, D.; Quénol, H.; Pieri, P.; Gaudillière, J.P.; Guyon, D.; Saur, E.; van Leeuwen, C. Temperature-based zoning of the Bordeaux wine region. OENO One 2018, 52, 291–306. [Google Scholar] [CrossRef] [Scilit]
- Maraun, D.; Widmann, M.; Gutiérrez, J.M.; Kotlarski, S.; Chandler, R.E.; Hertig, E.; Wibig, J.; Huth, R.; Wilcke, R.A.I. VALUE: A framework to validate downscaling approaches for climate change studies. Earth’s Future 2015, 3, 1–14. [Google Scholar] [CrossRef] [Scilit]
- Fonseca, A.; Cruz, J.; Fraga, H.; Andrade, C.; Valente, J.; Alves, F.; Neto, A.C.; Flores, R.; Santos, J.A. Vineyard Microclimatic Zoning as a Tool to Promote Sustainable Viticulture under Climate Change. Sustainability 2024, 16, 3477. [Google Scholar] [CrossRef] [Scilit]
- Tscholl, S.; Egarter Vigl, L. The changing geography of wine climates and its implications on adaptation in the Italian Alps. Clim. Resil. Sustain. 2024, 3, e70000. [Google Scholar] [CrossRef] [Scilit]
- Allaman, H.; Goyette, S.; Dubuis, P.H.; Kasparian, J. Future viability of European vineyards using bioclimatic indices and climate analogues. Agric. For. Meteorol. 2025, 378, 110978. [Google Scholar] [CrossRef] [Scilit]
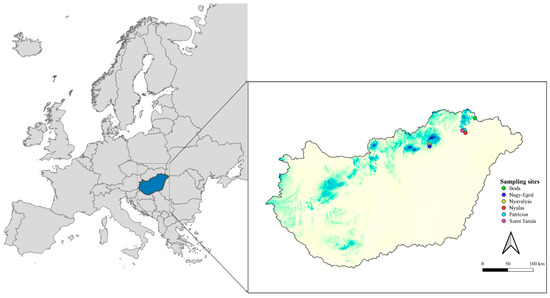
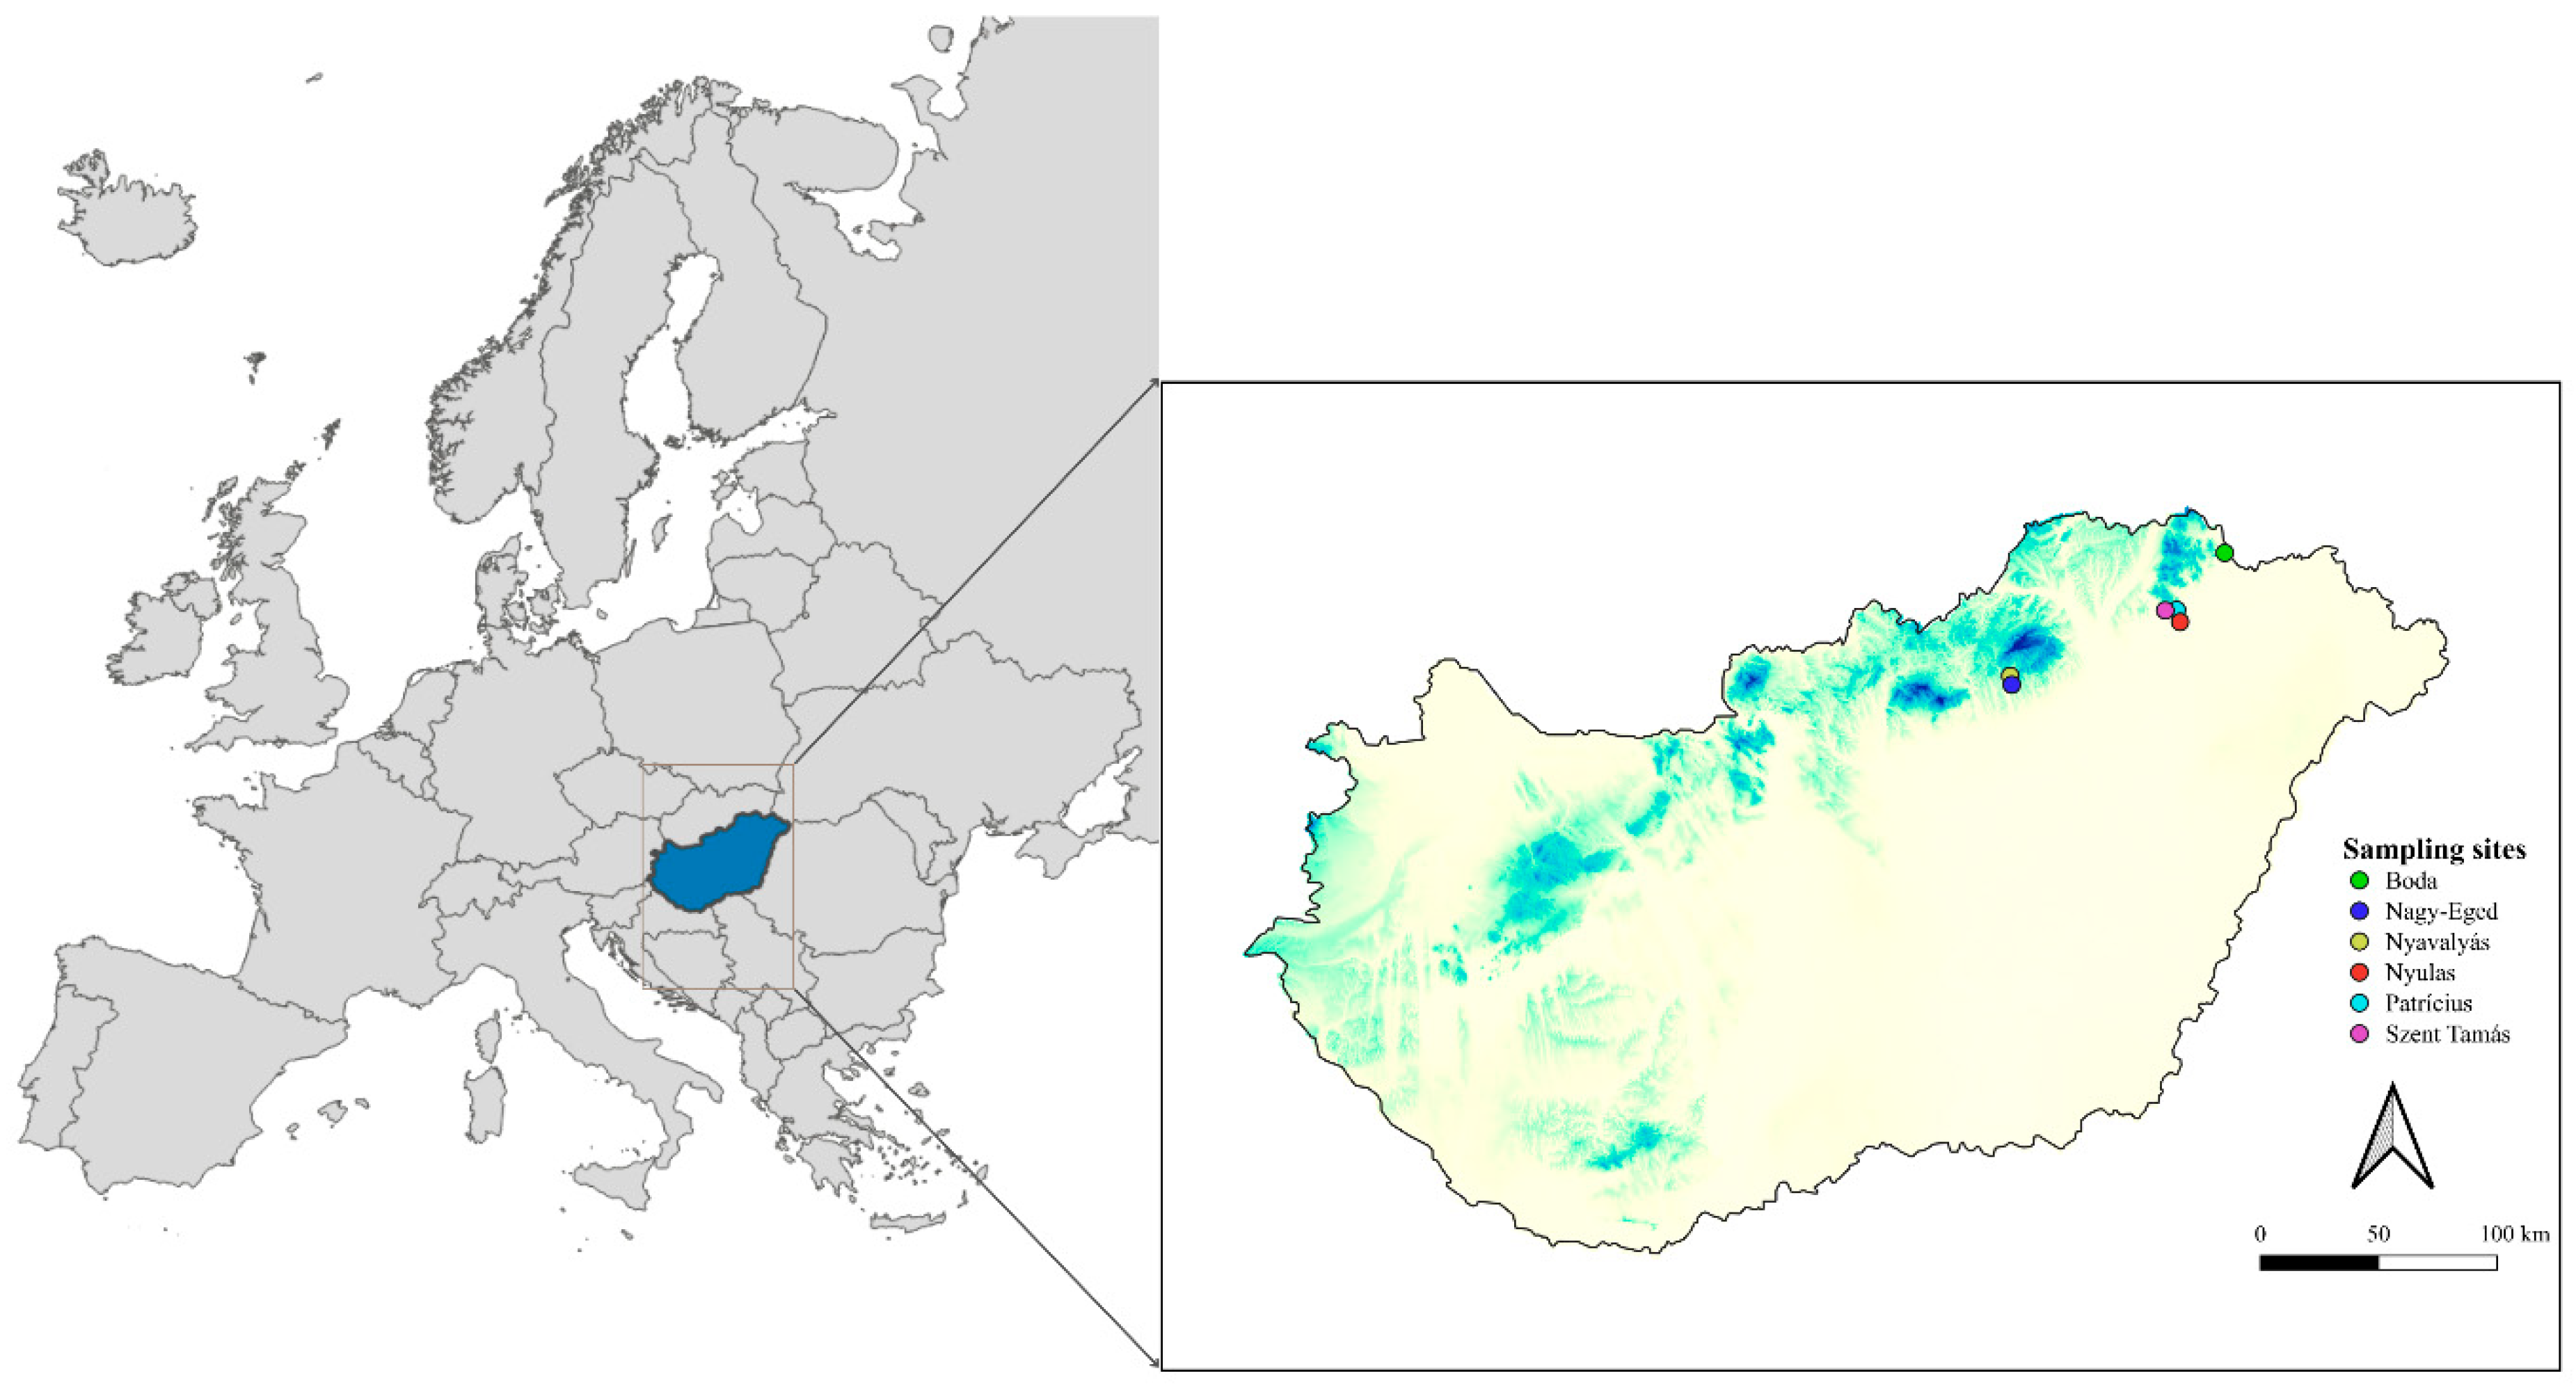
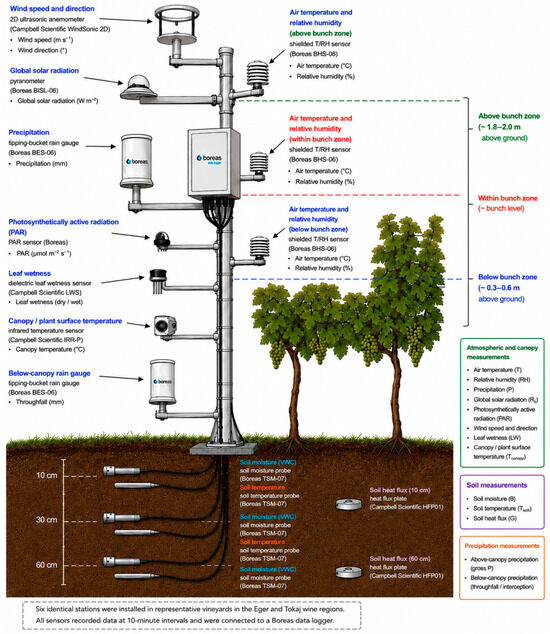
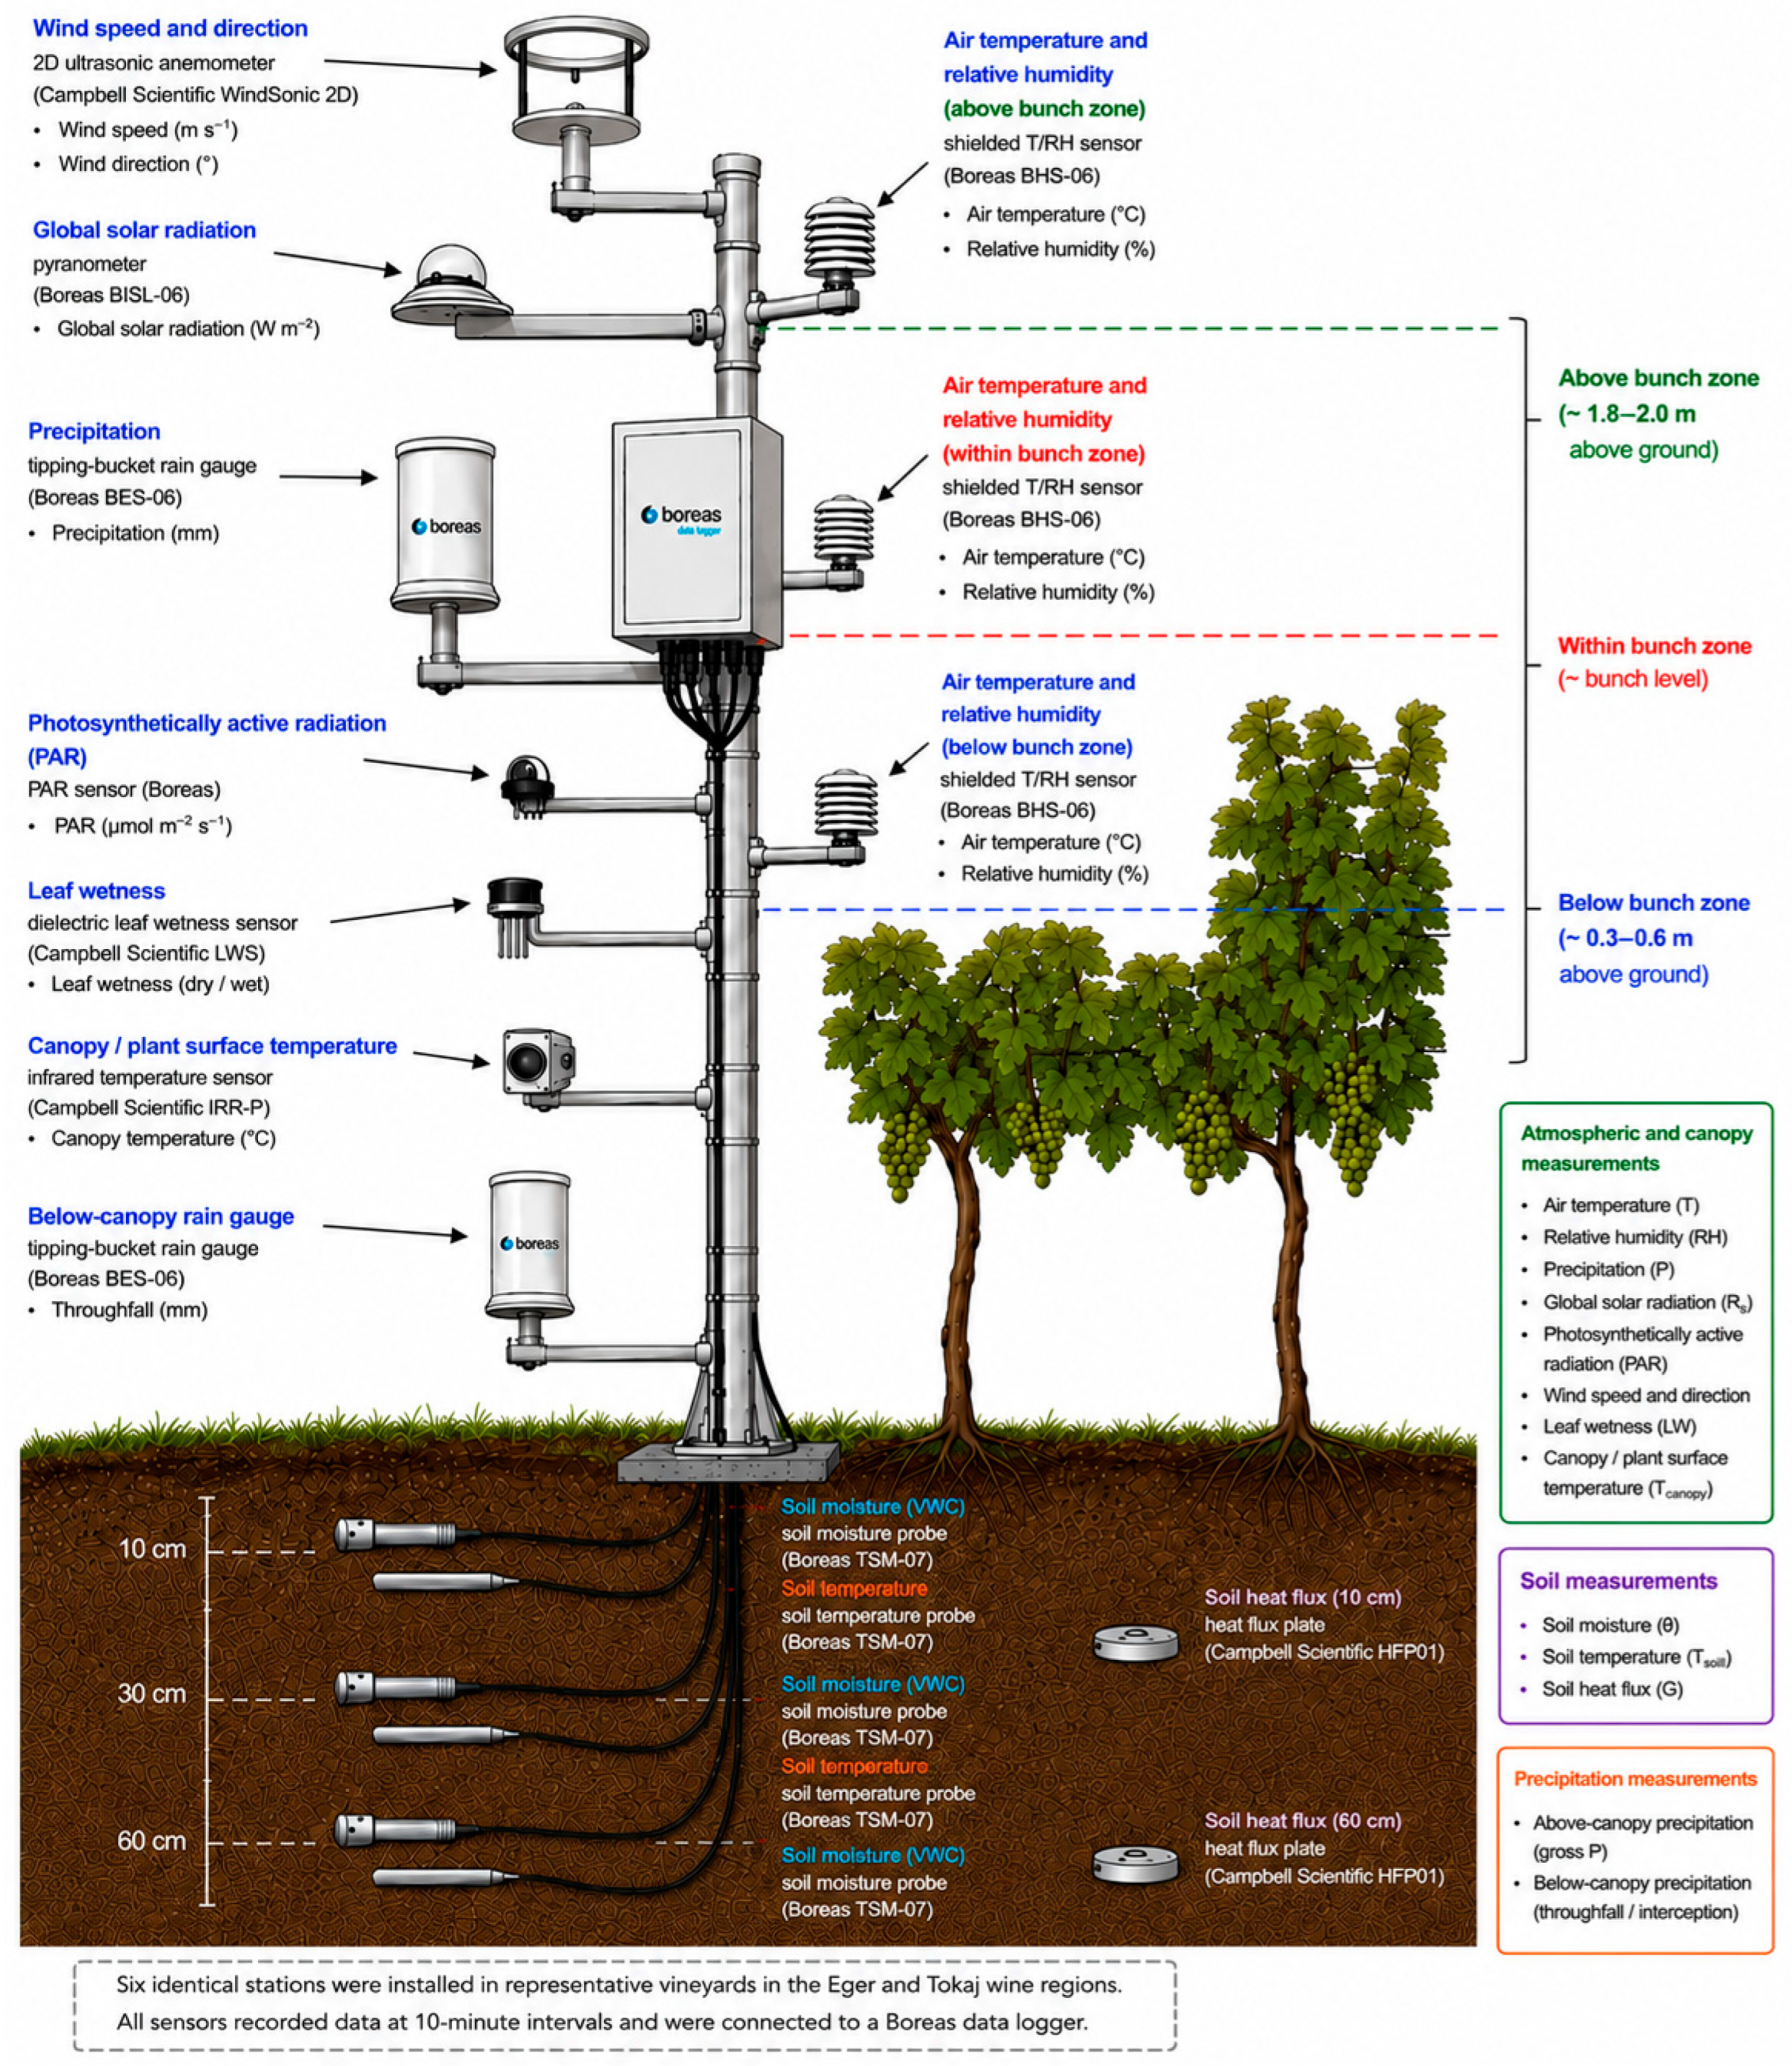
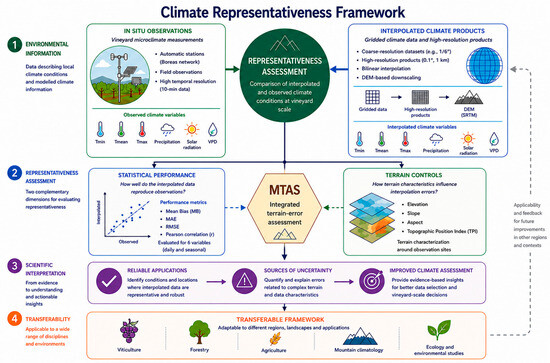
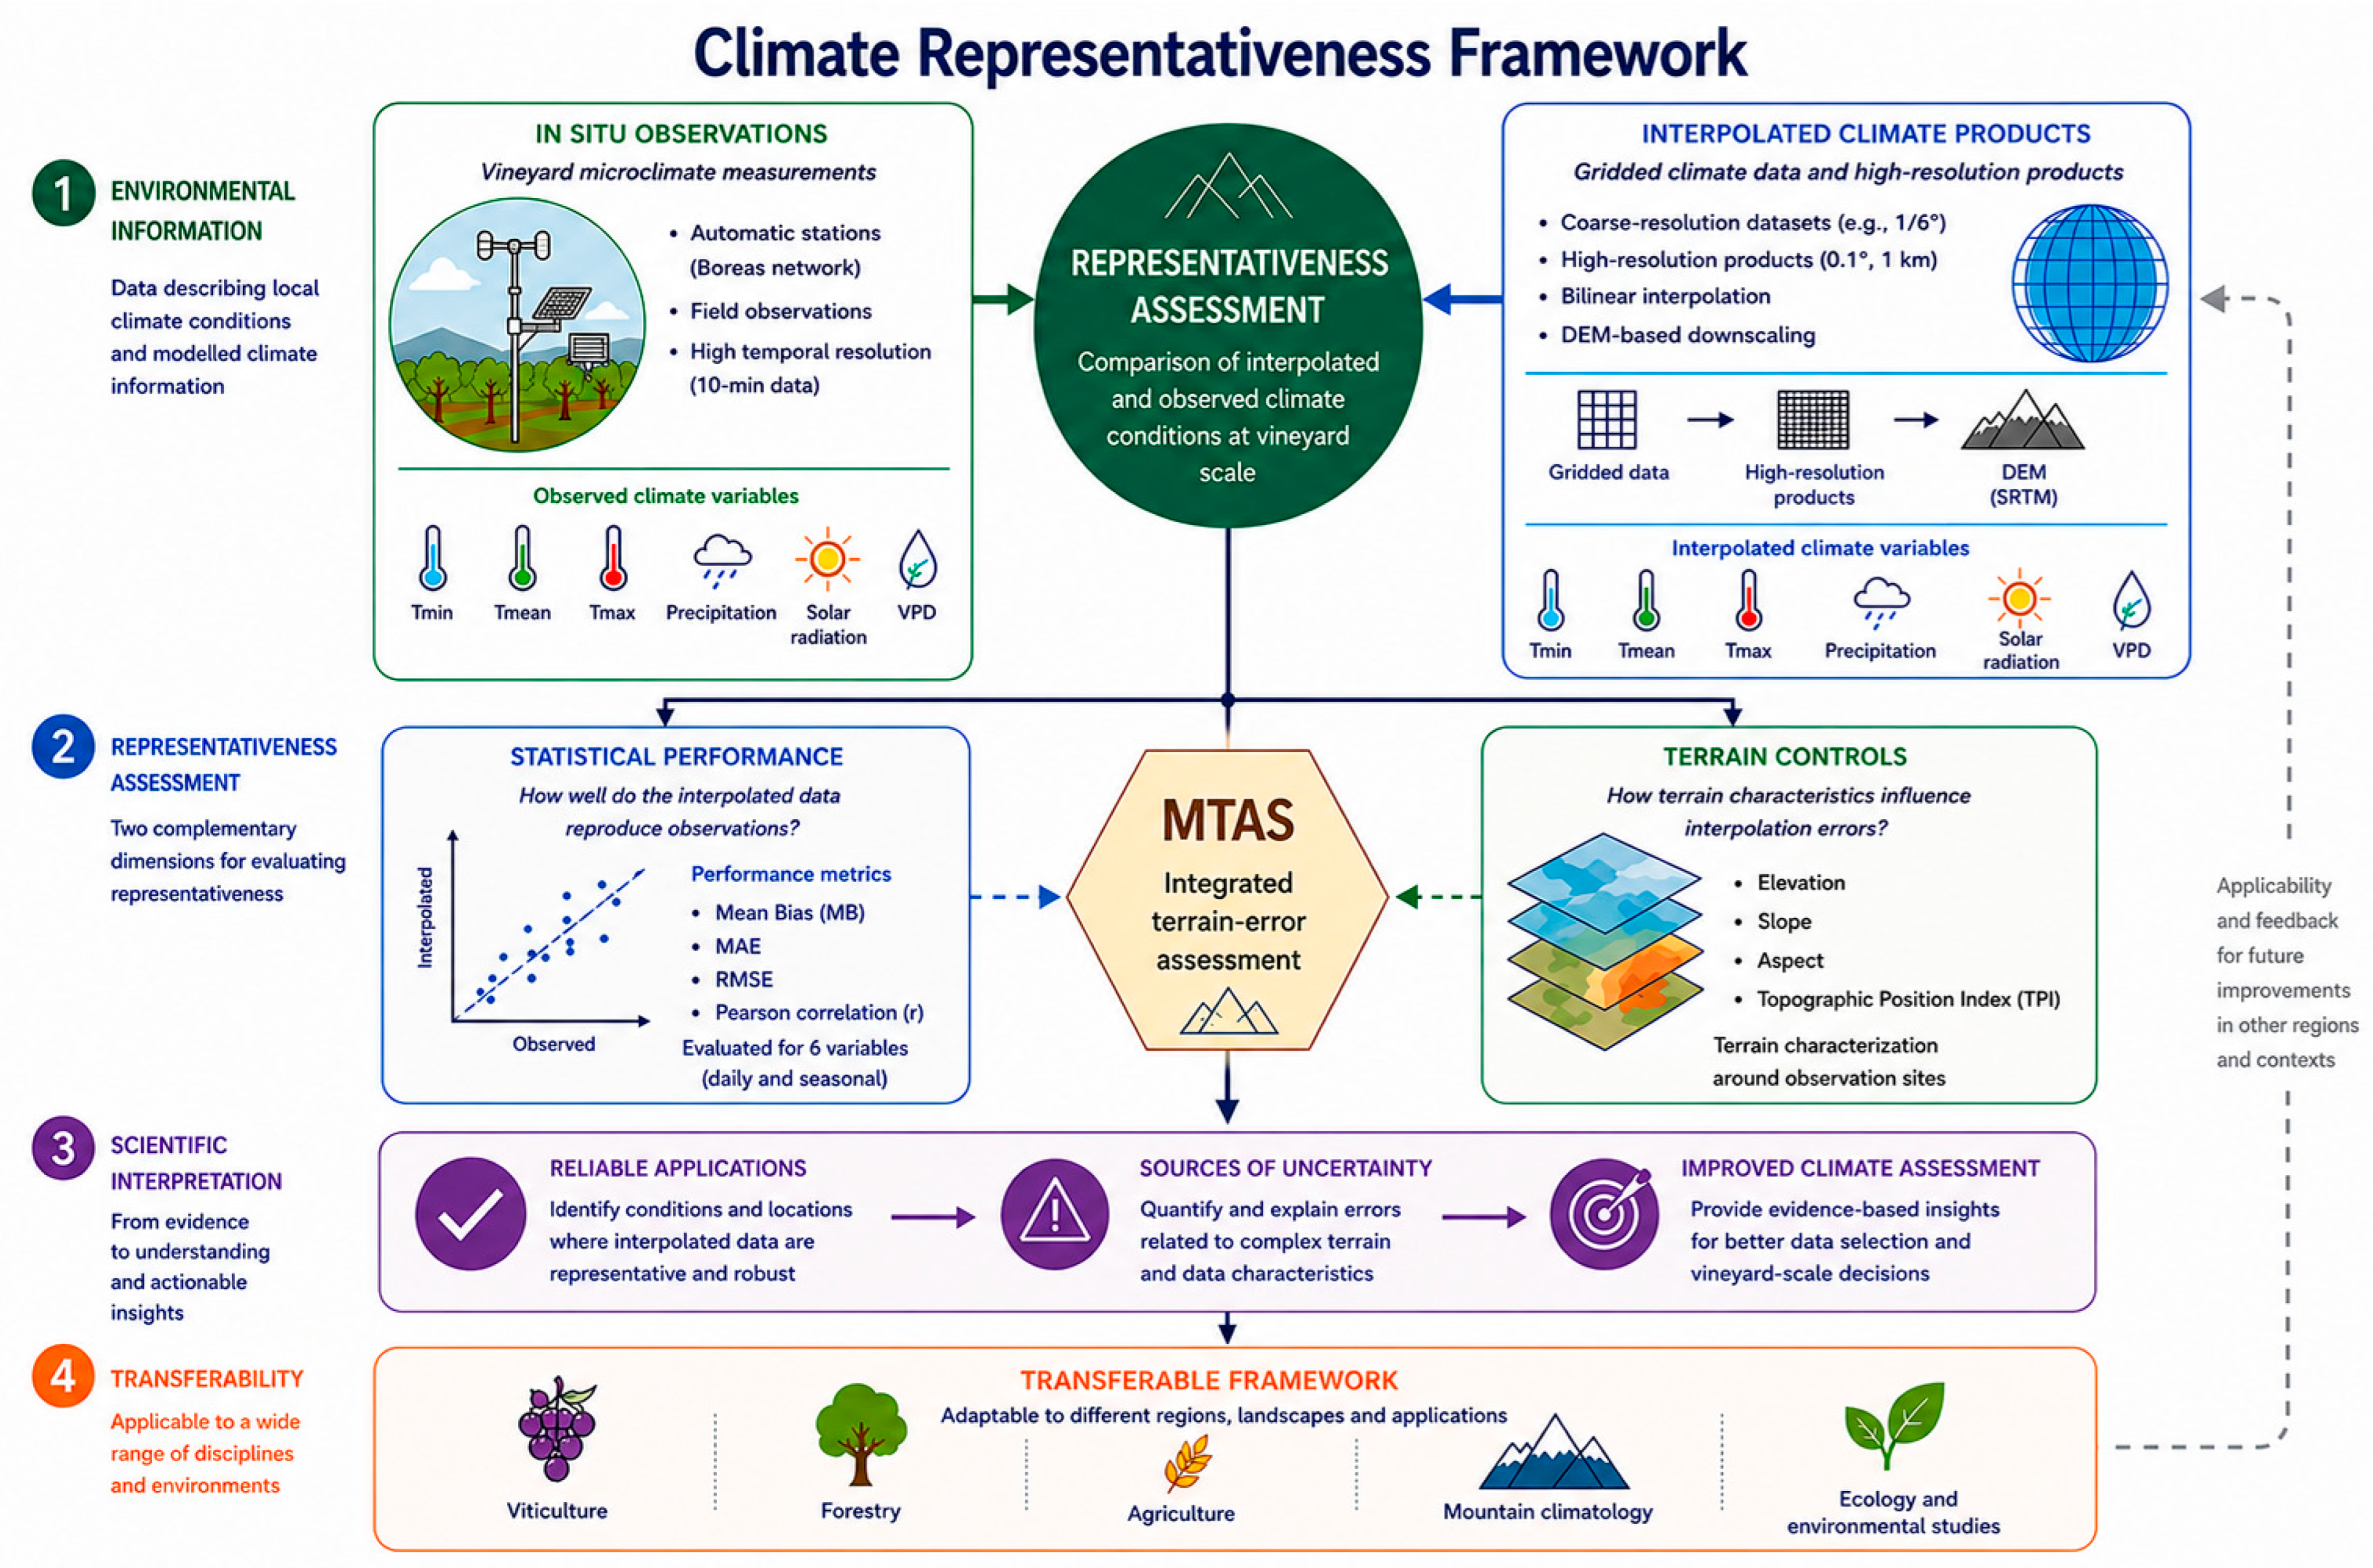
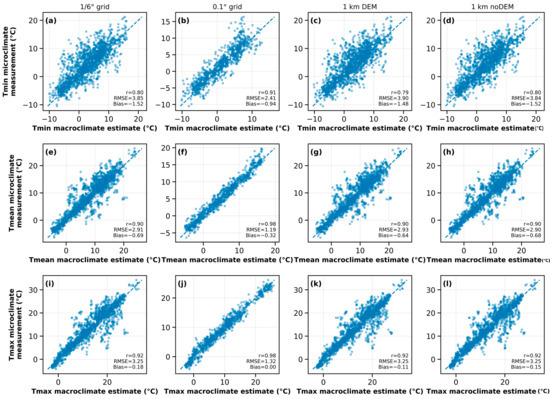
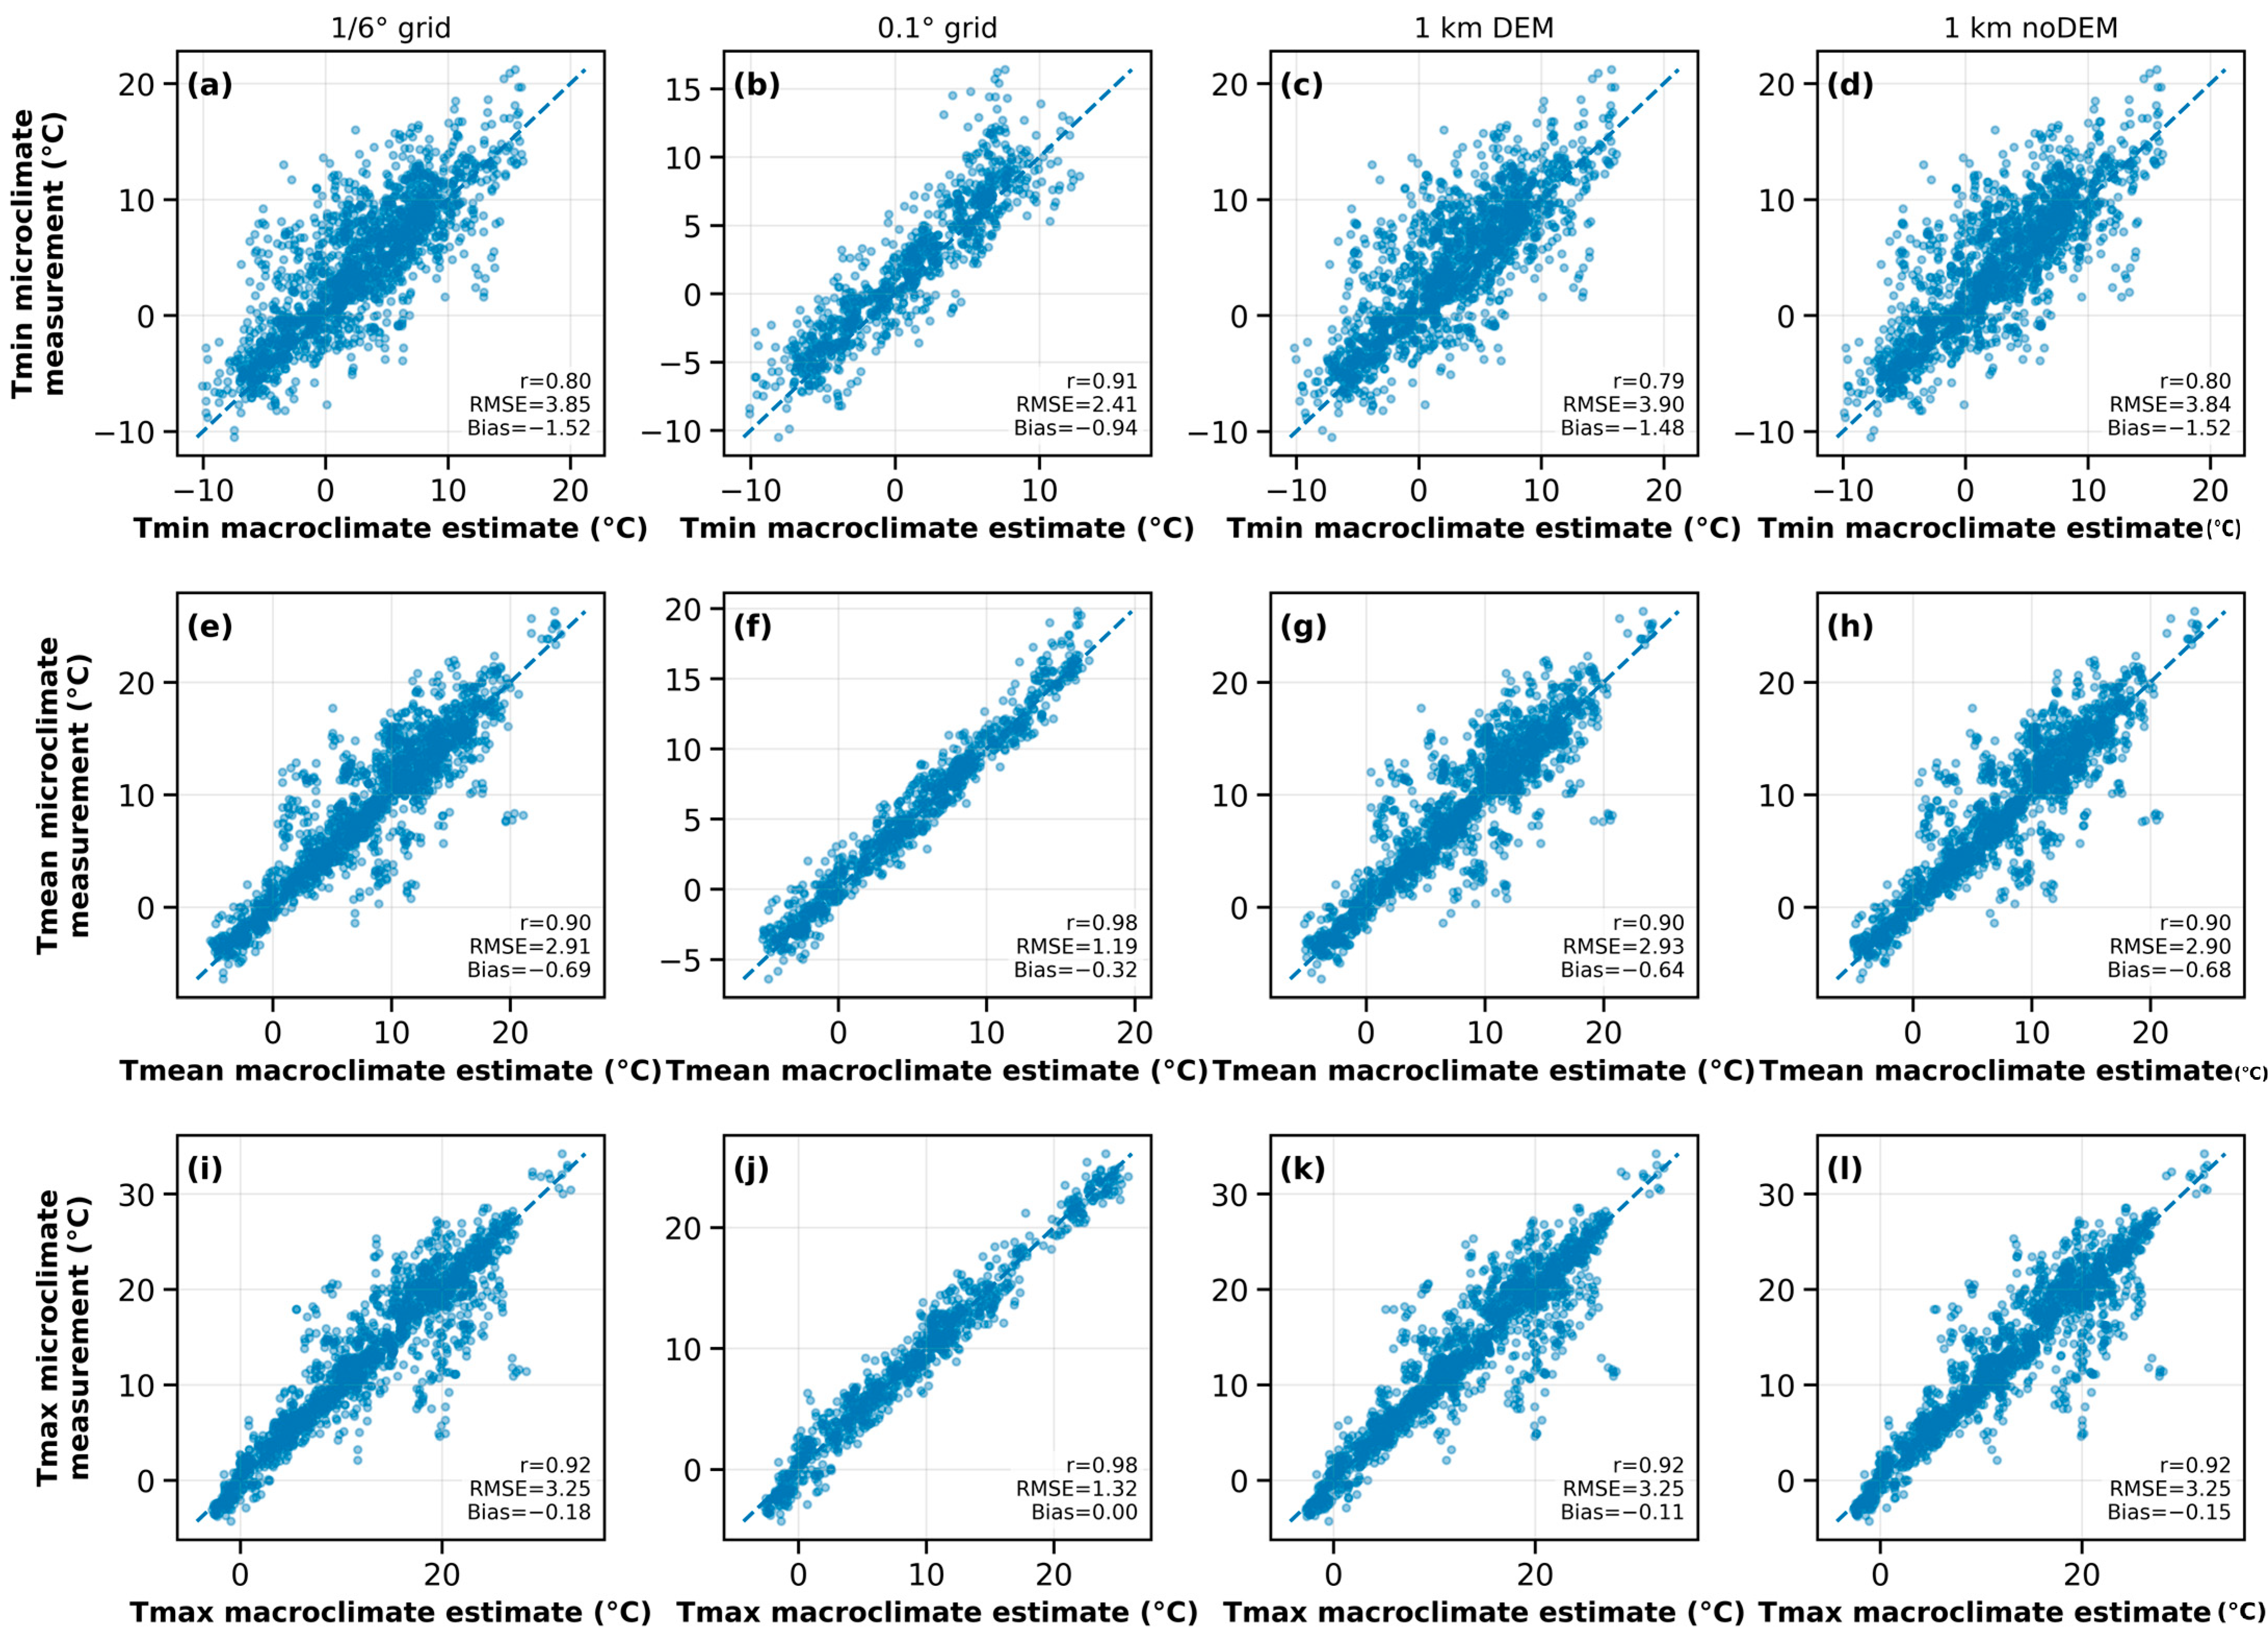
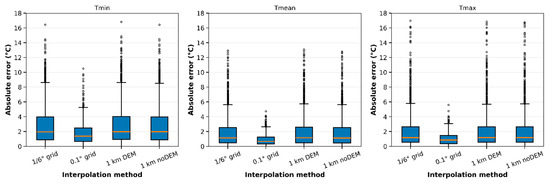
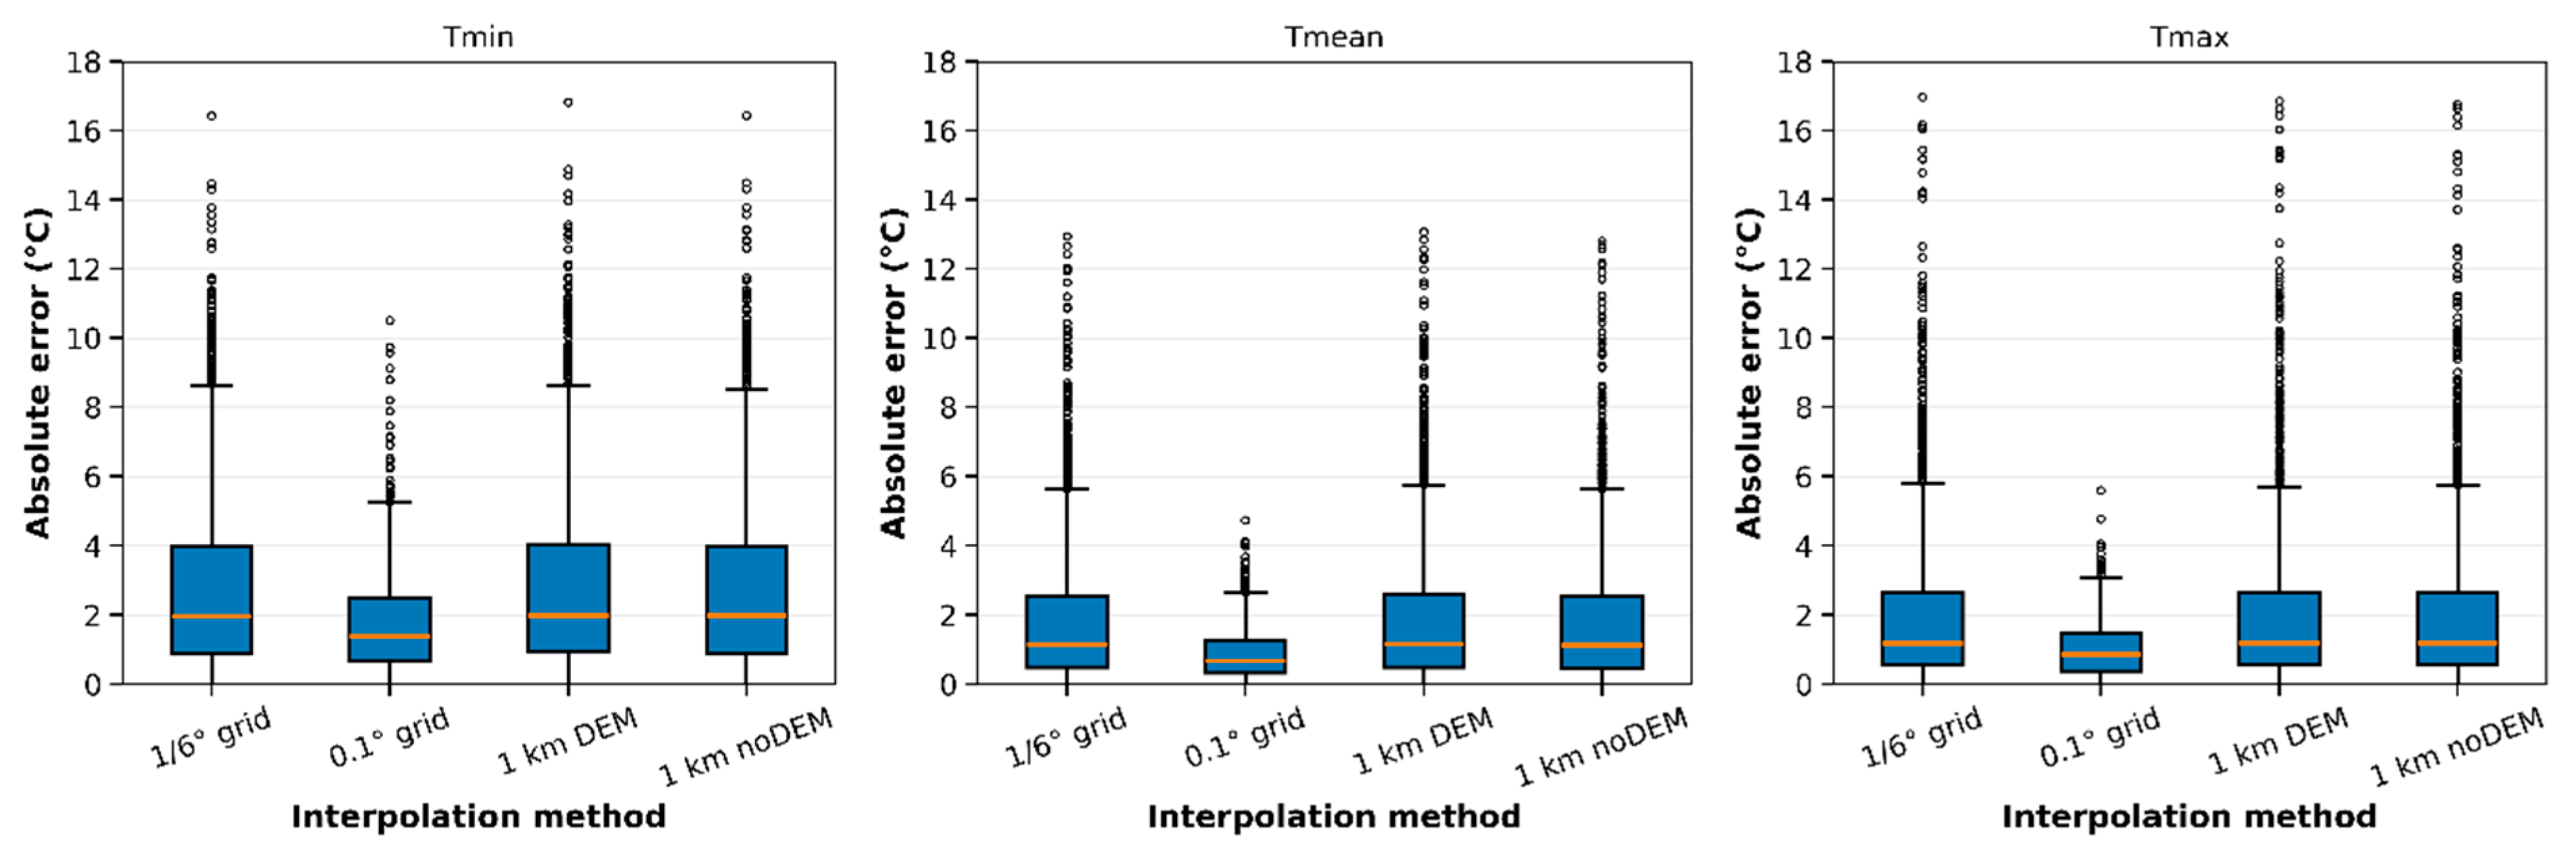
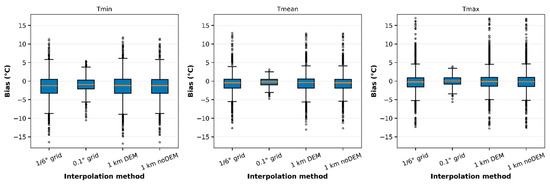
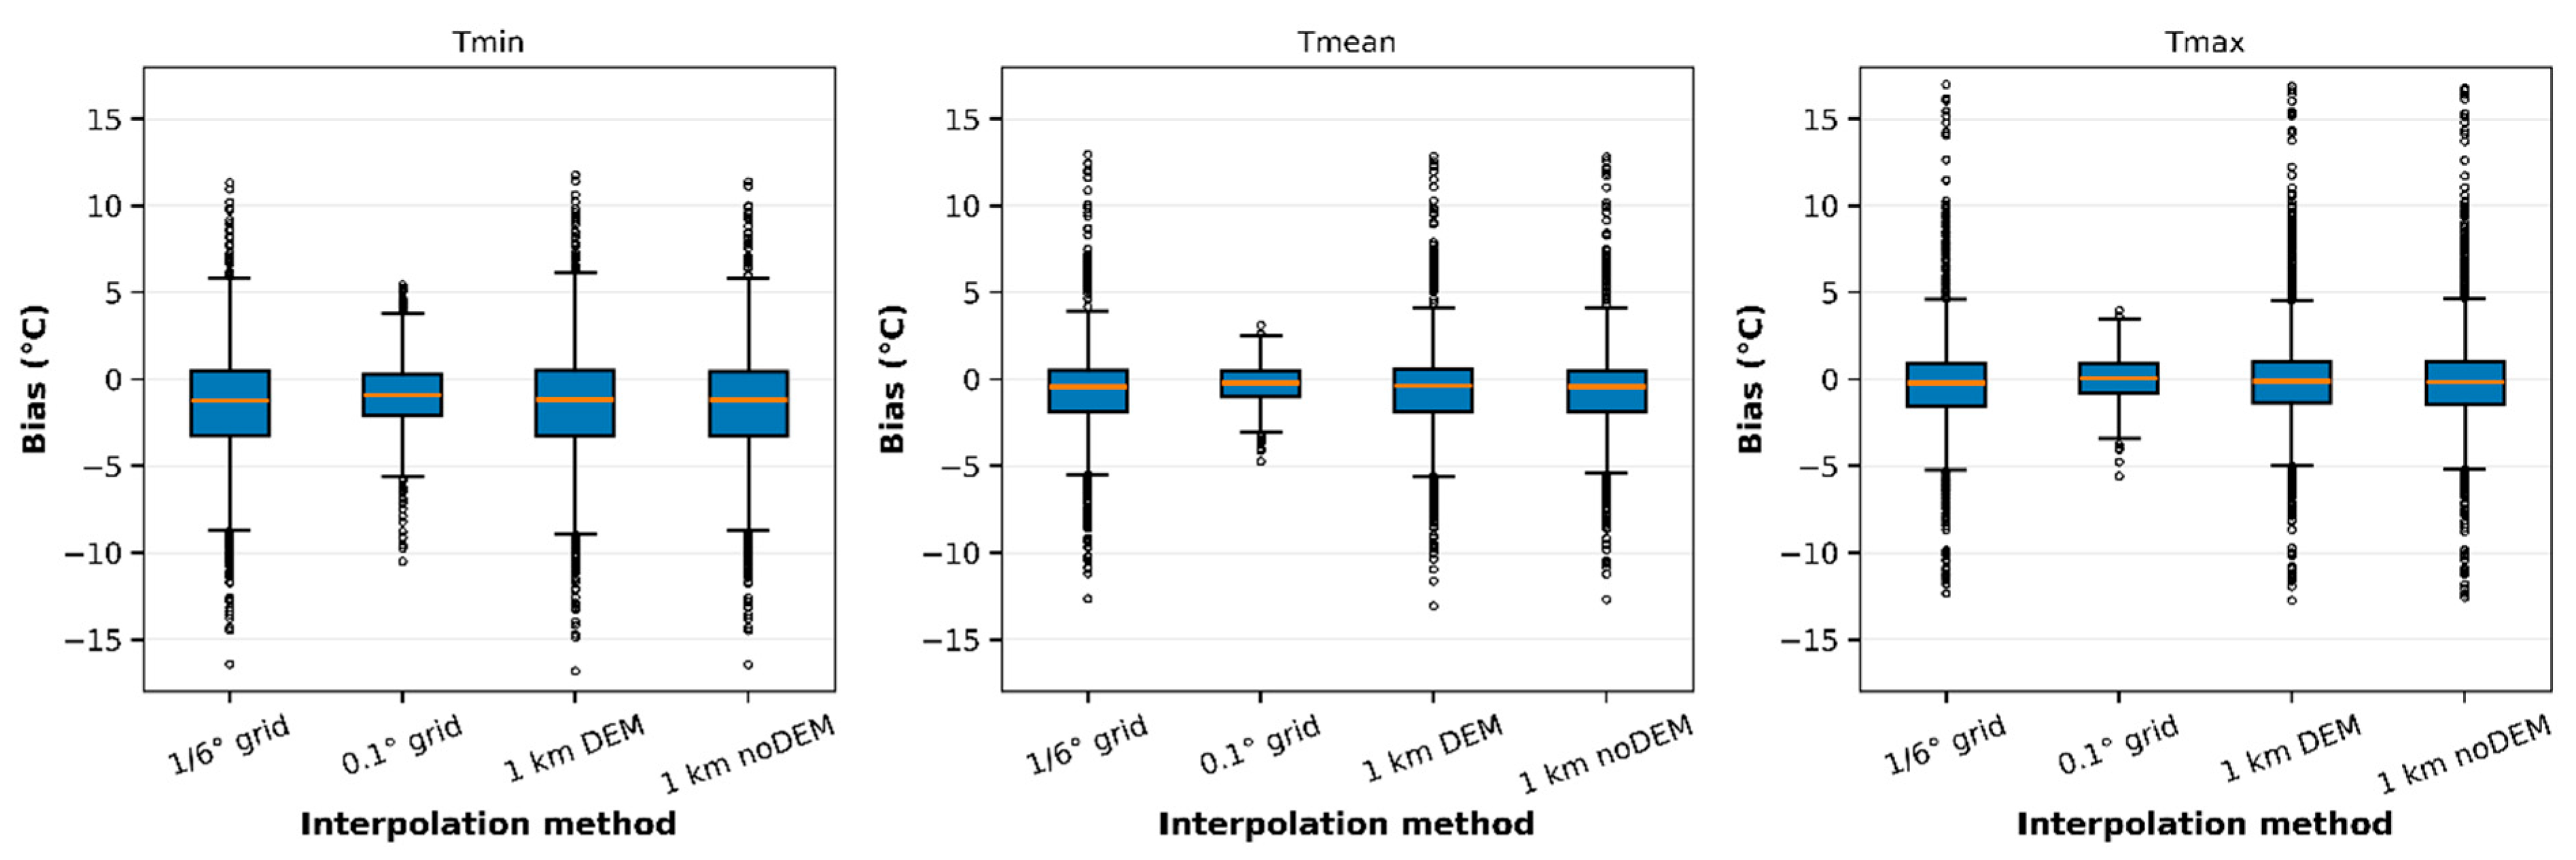
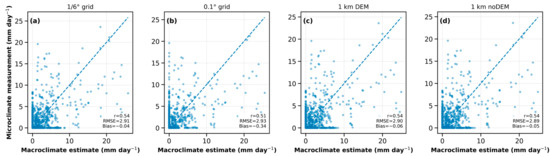
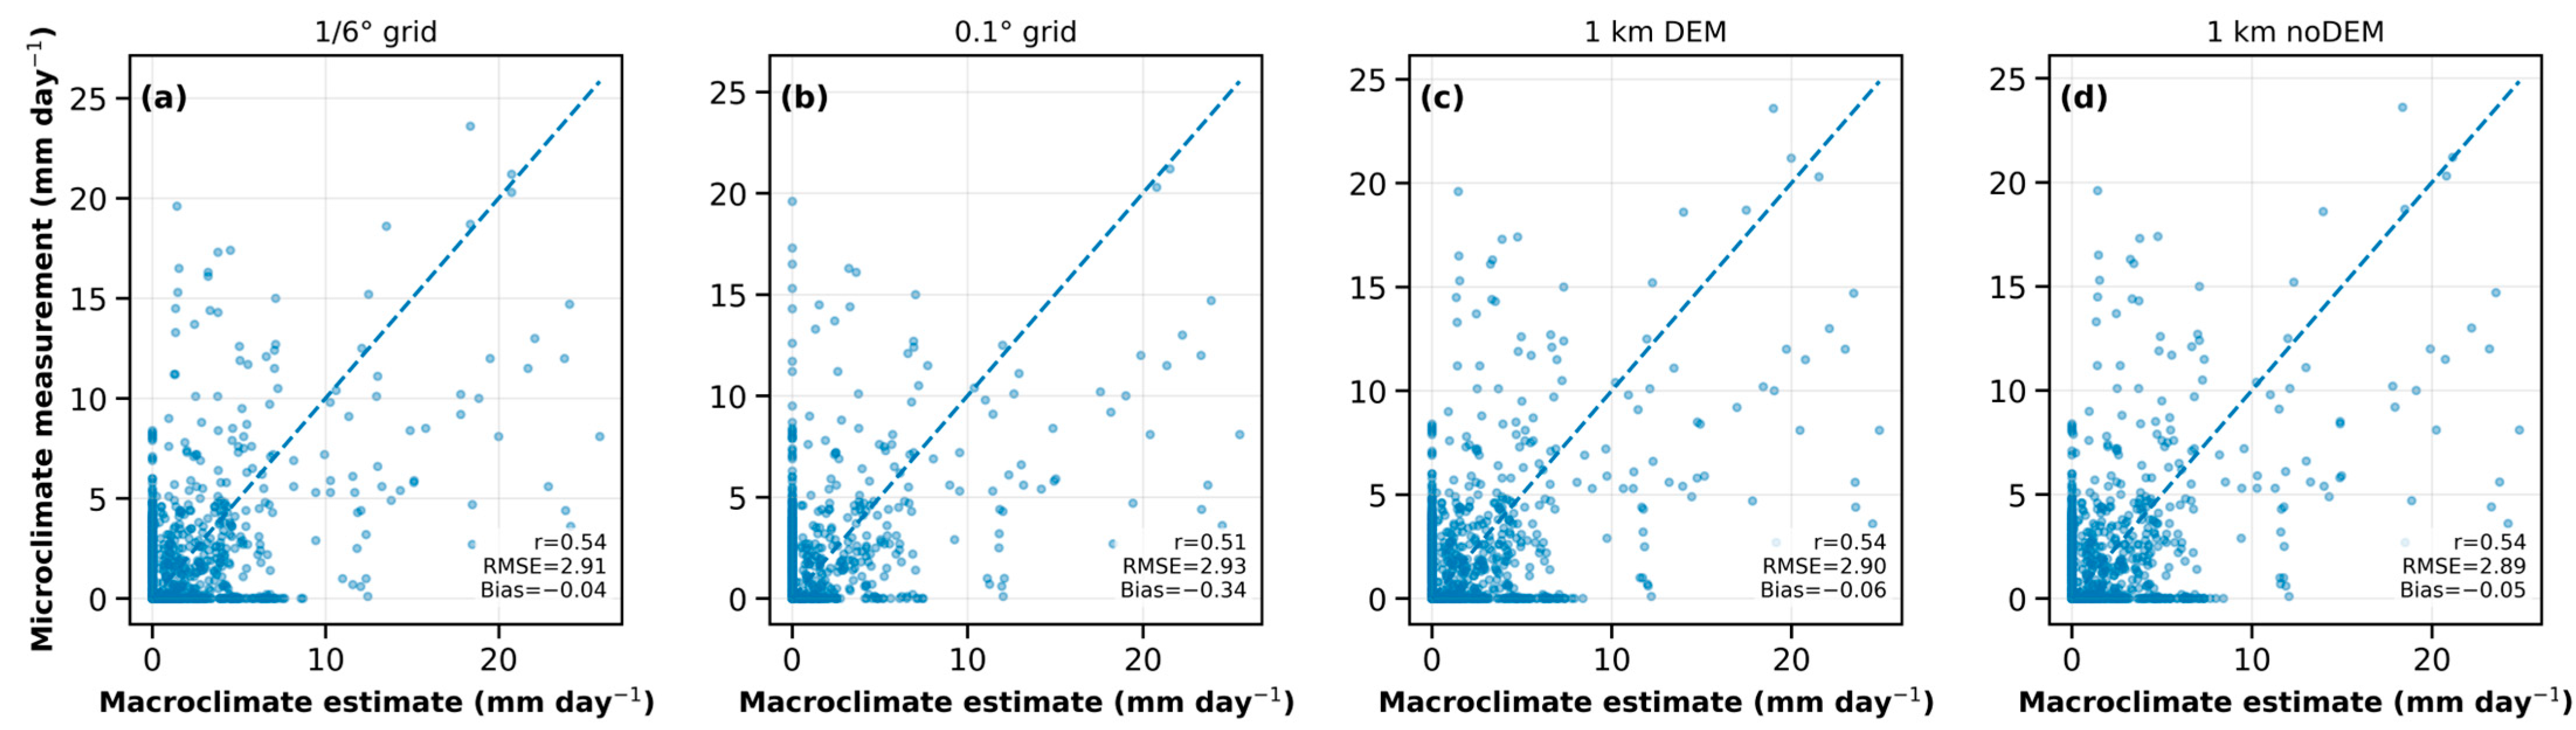
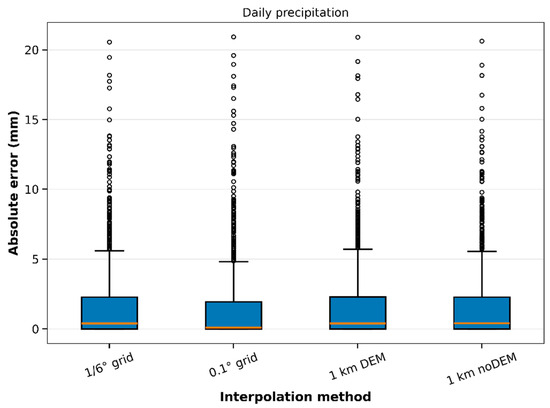
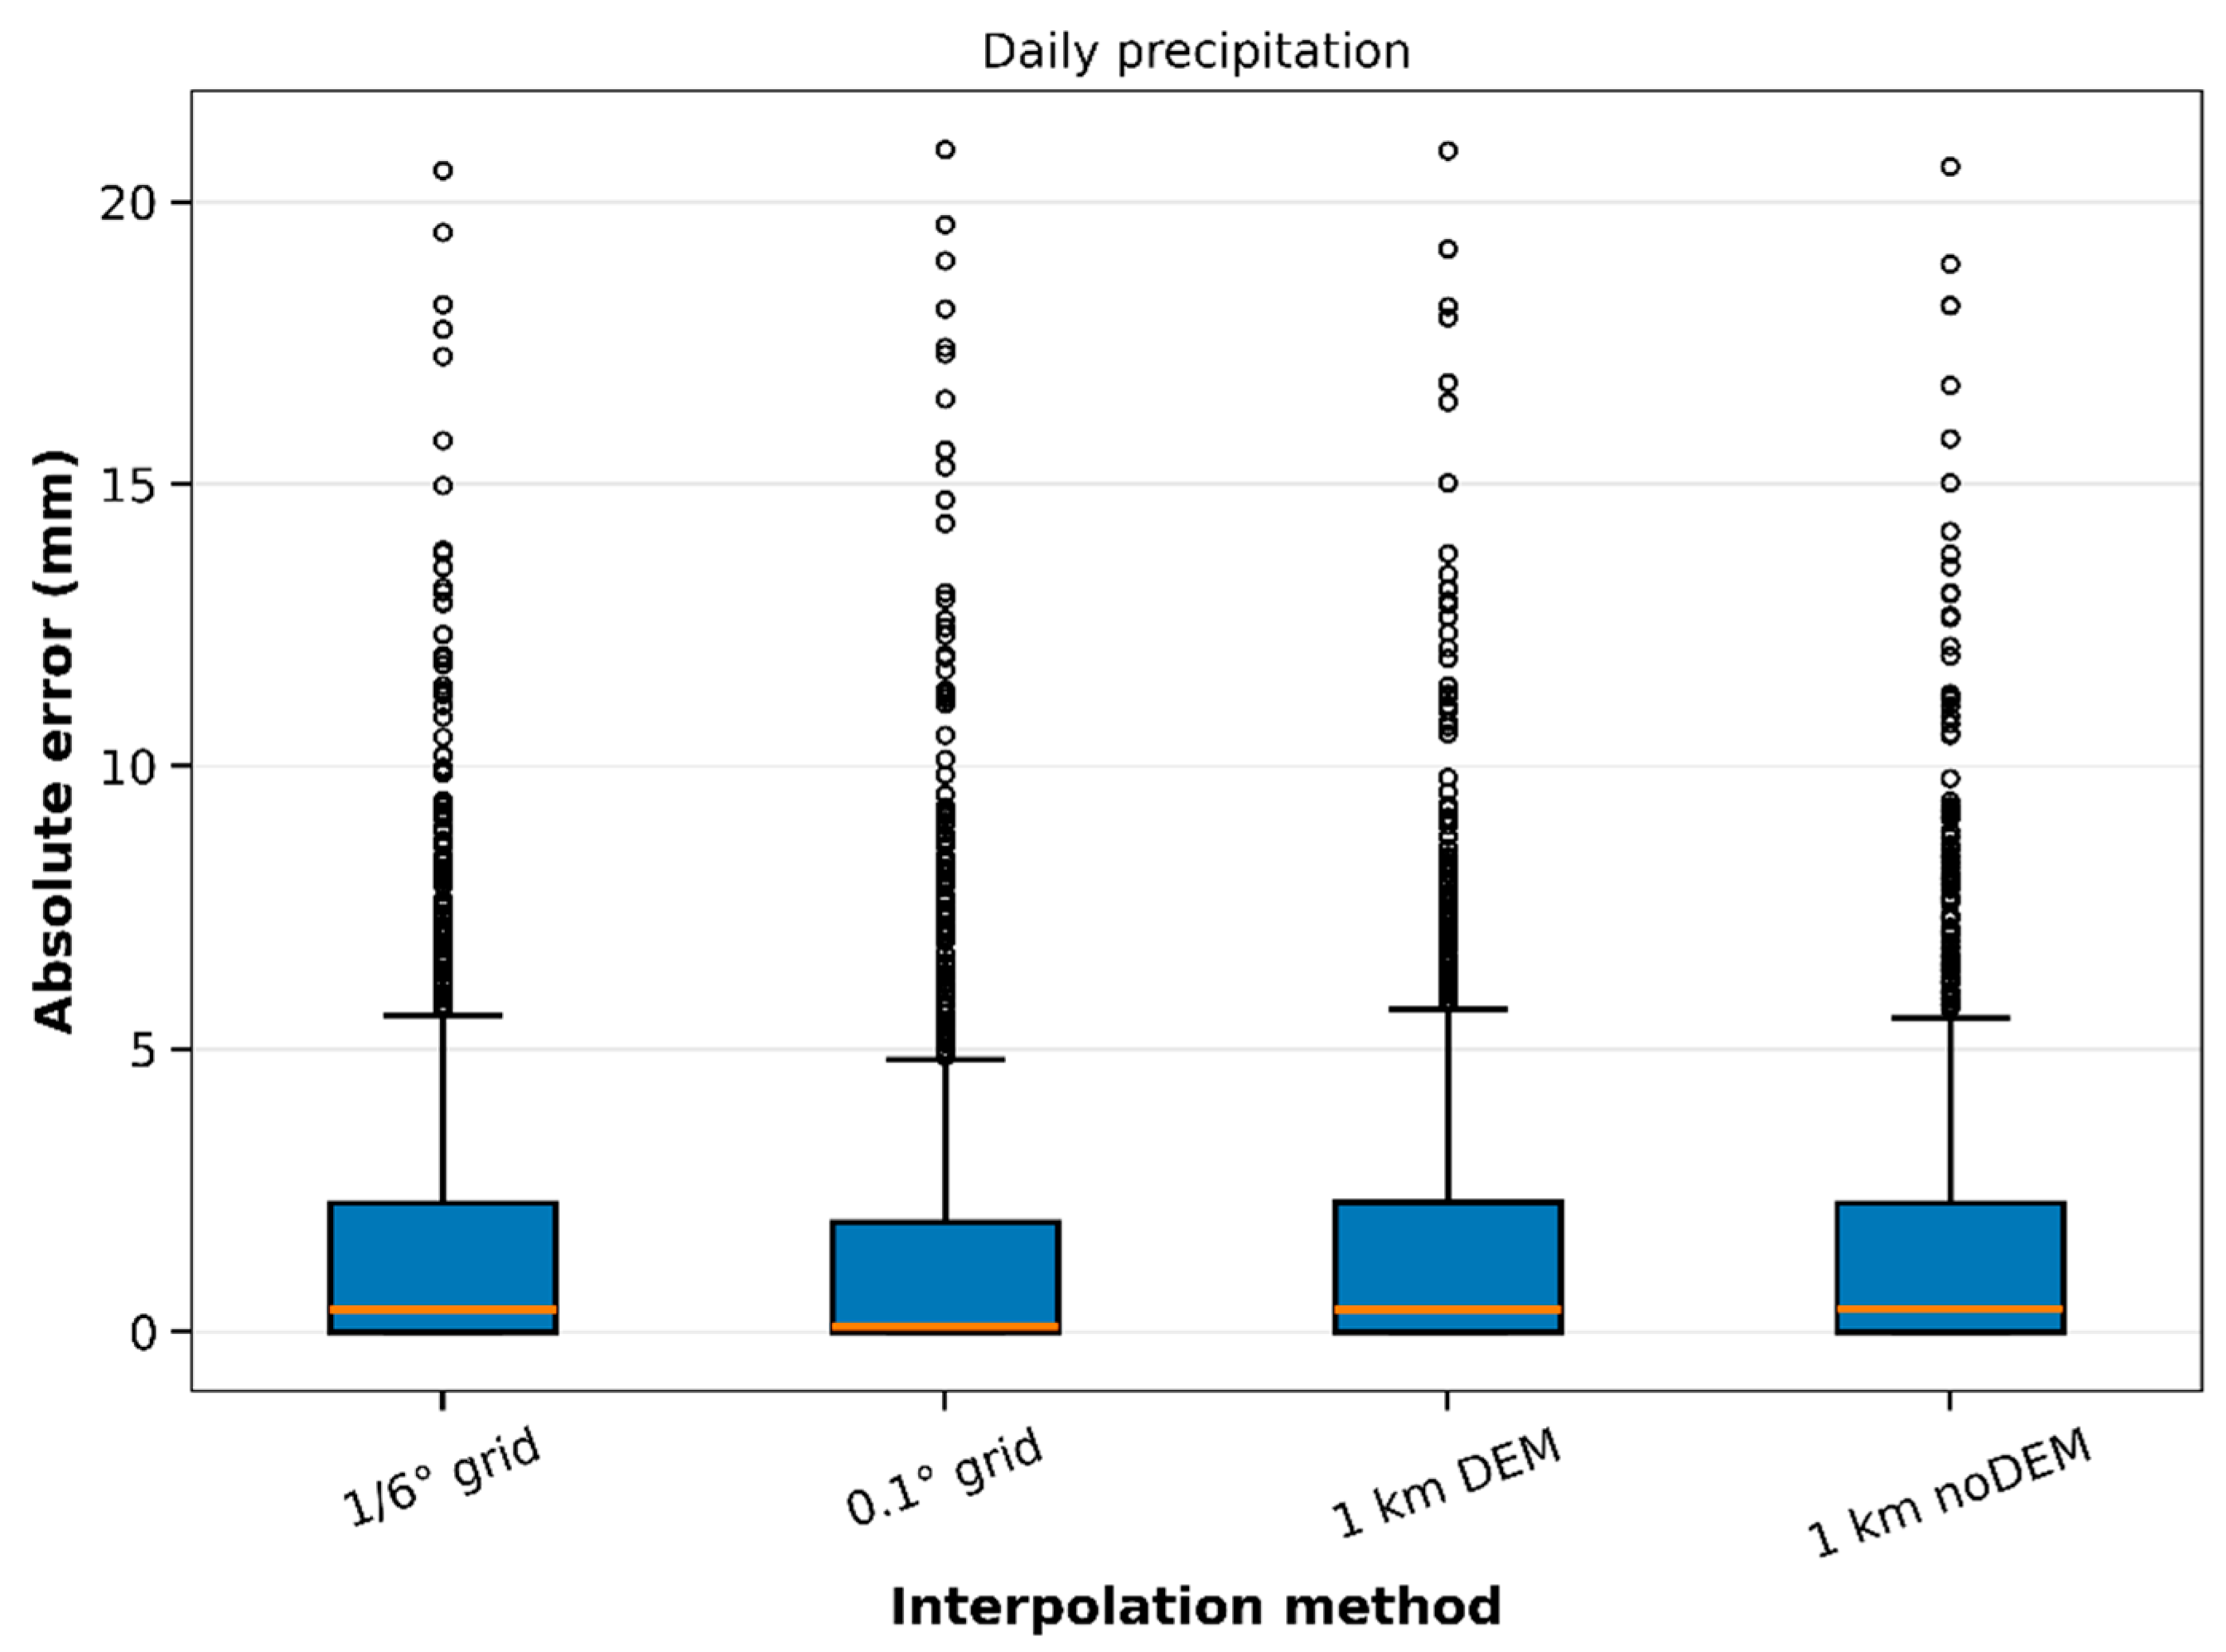
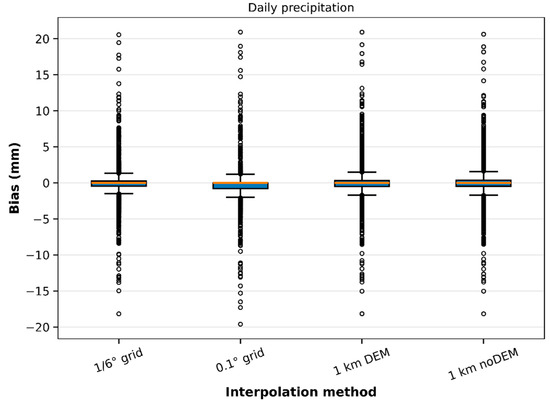
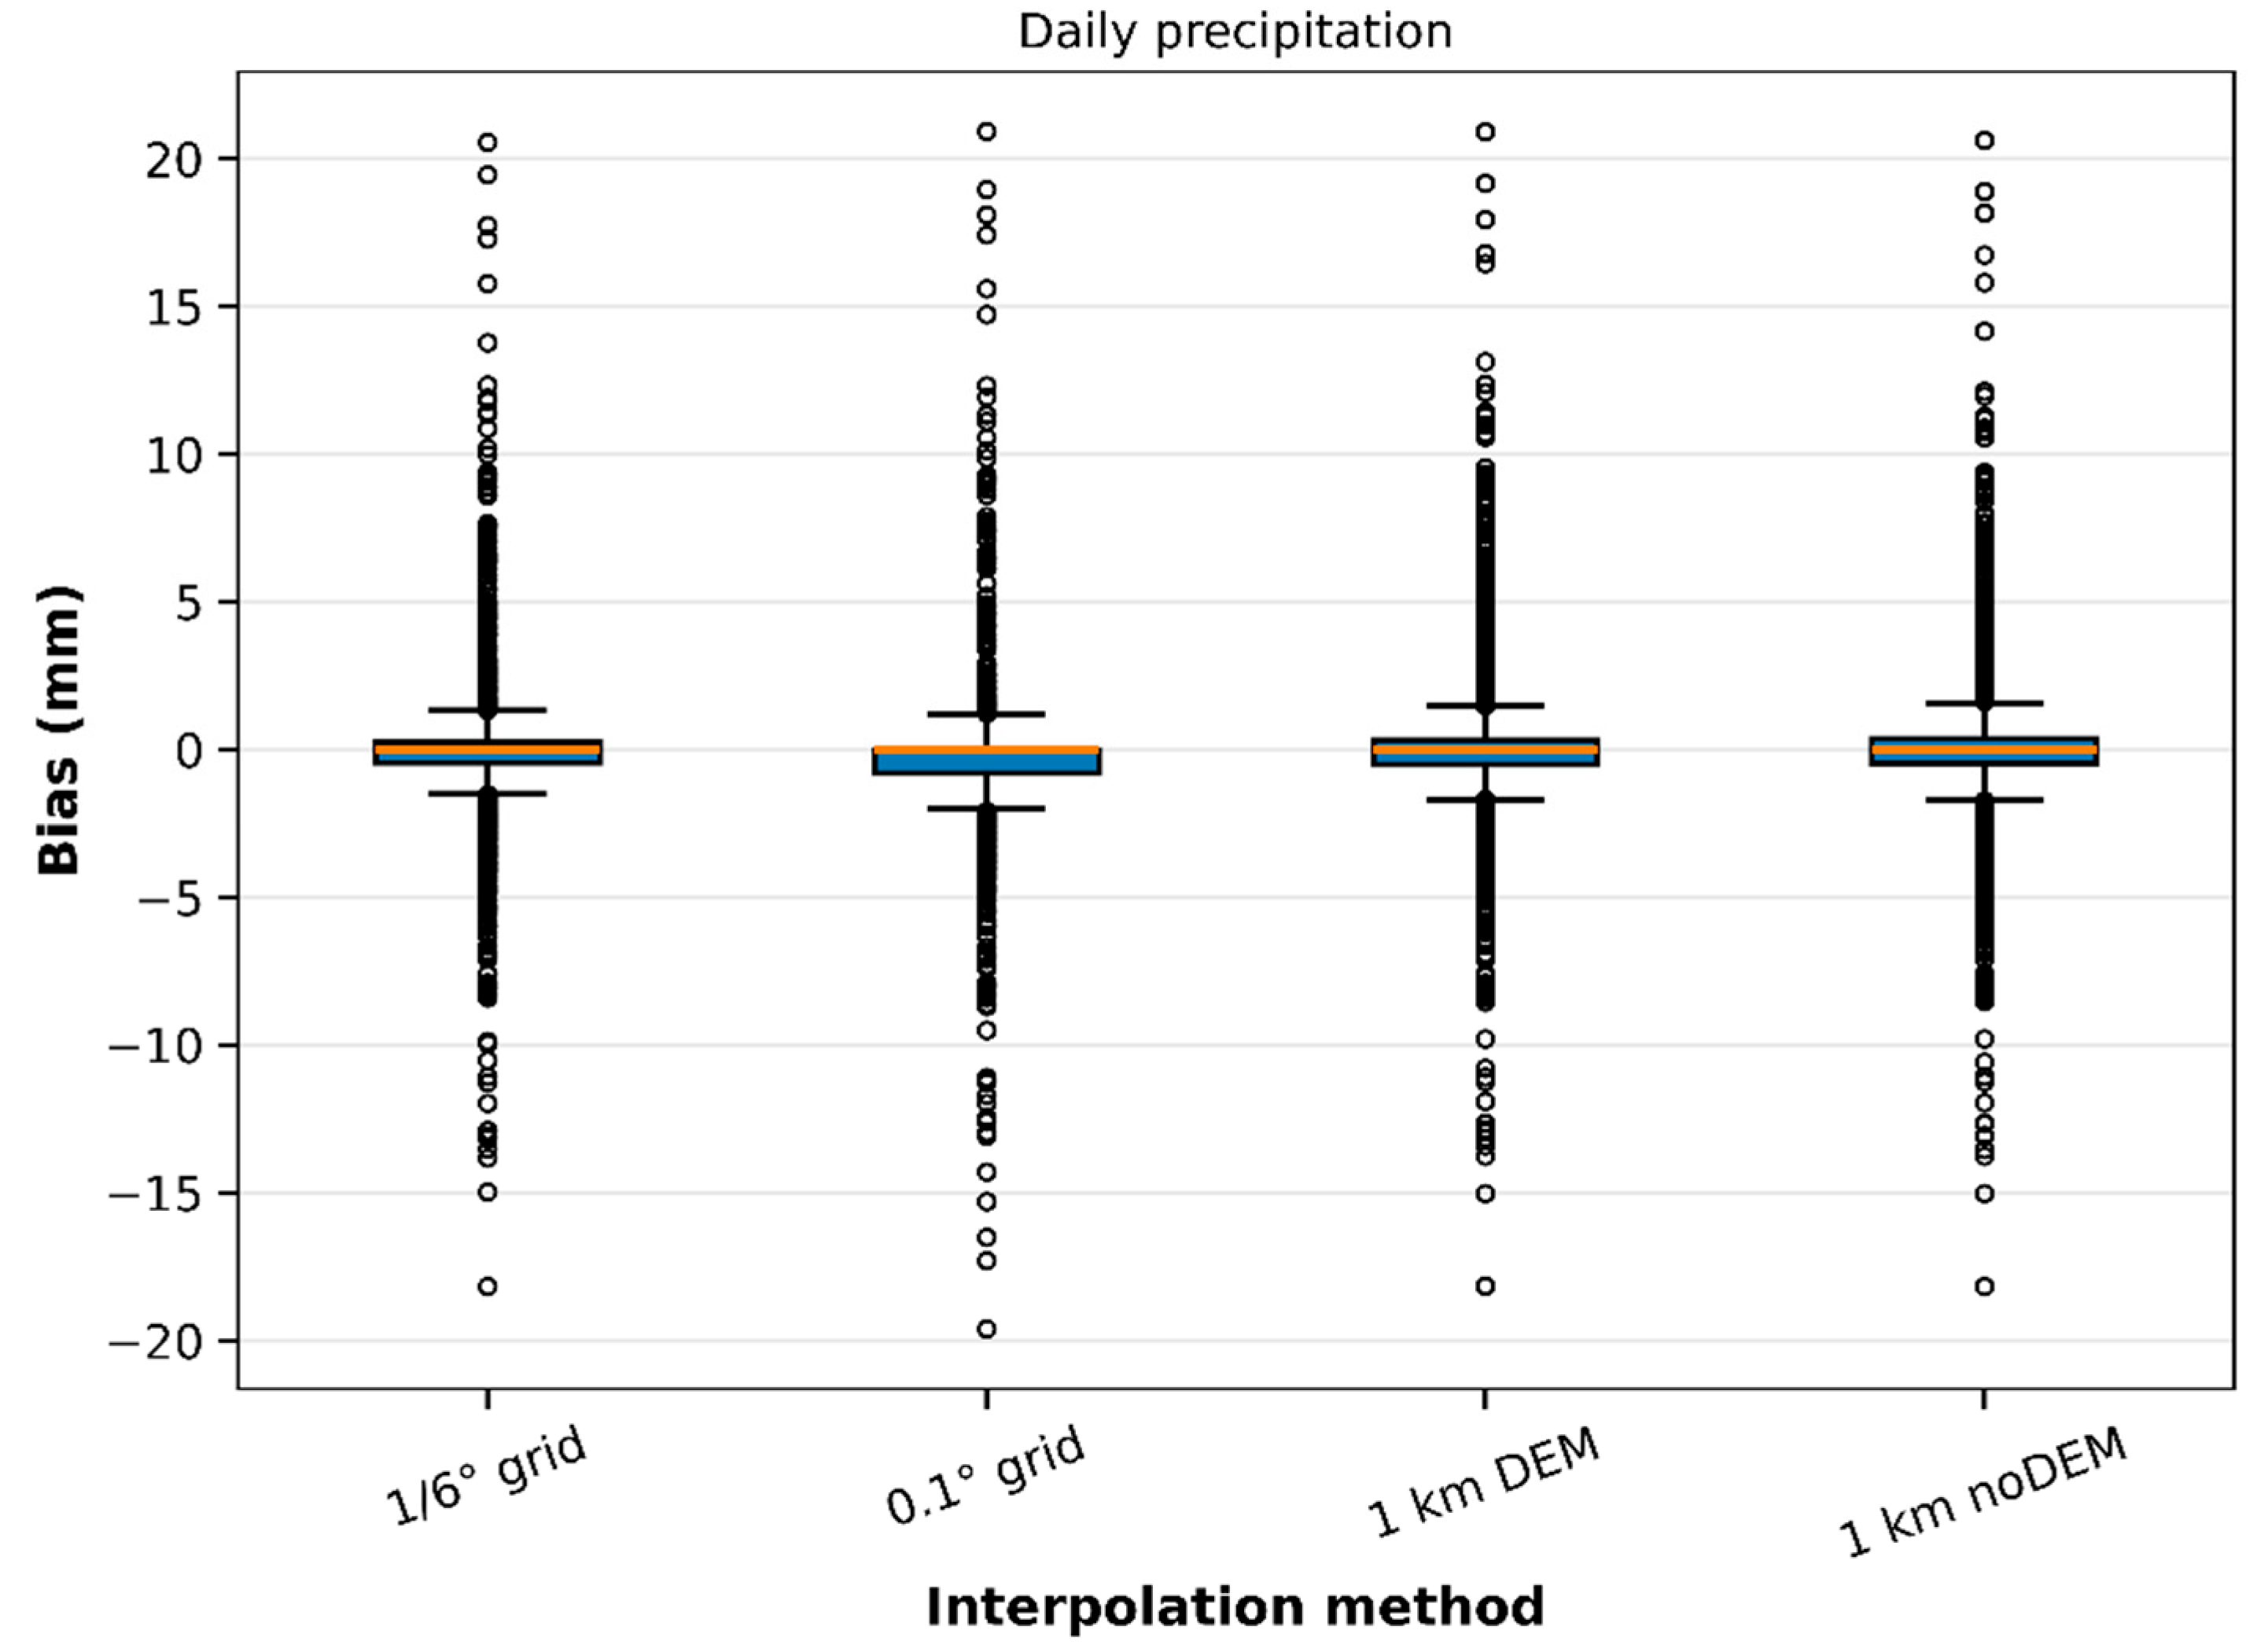
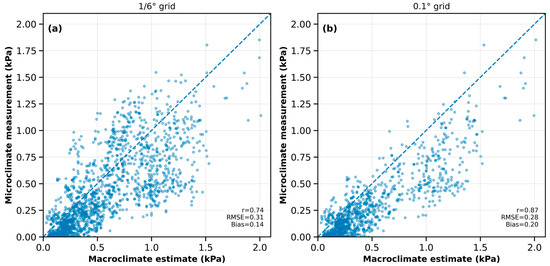
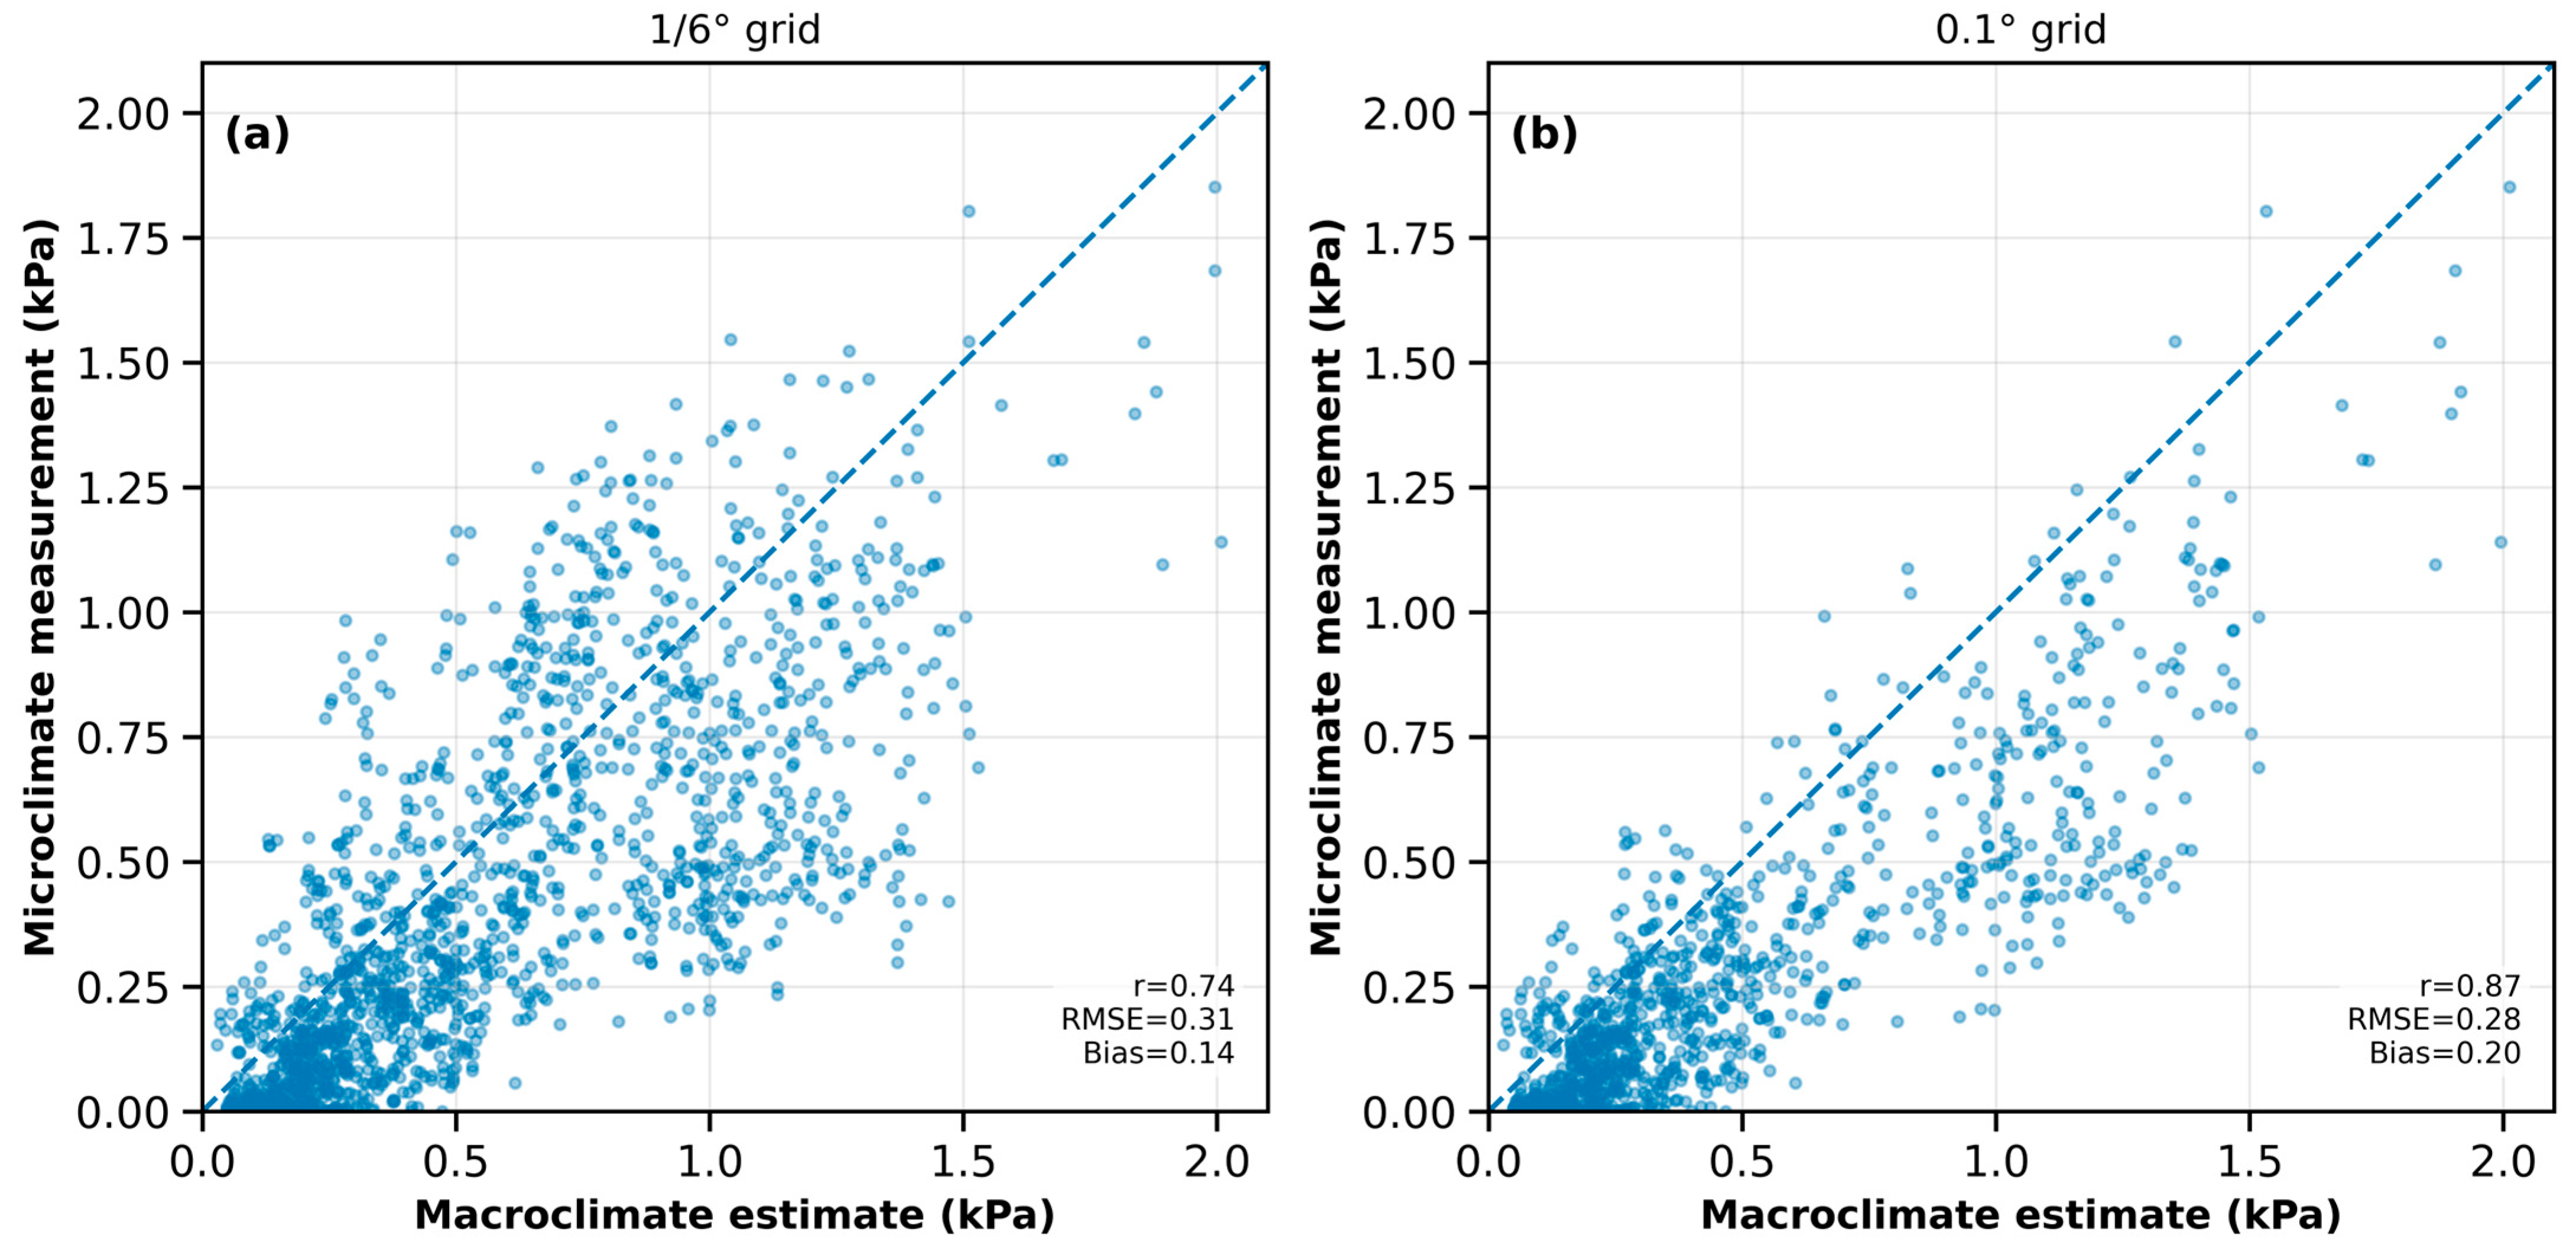
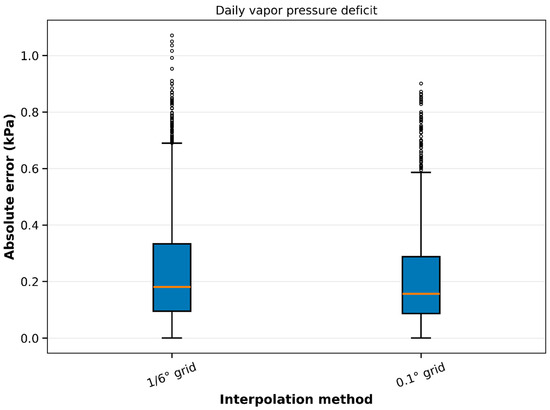
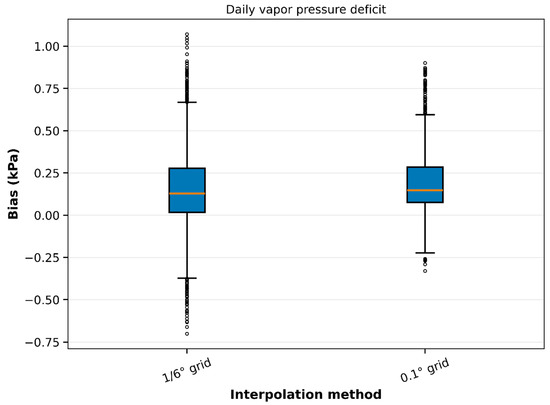
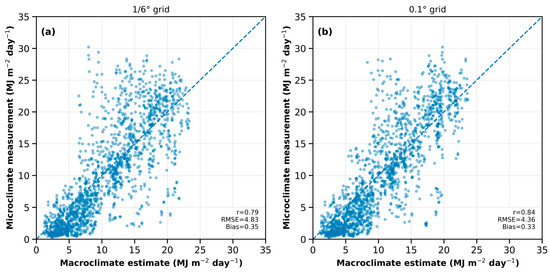
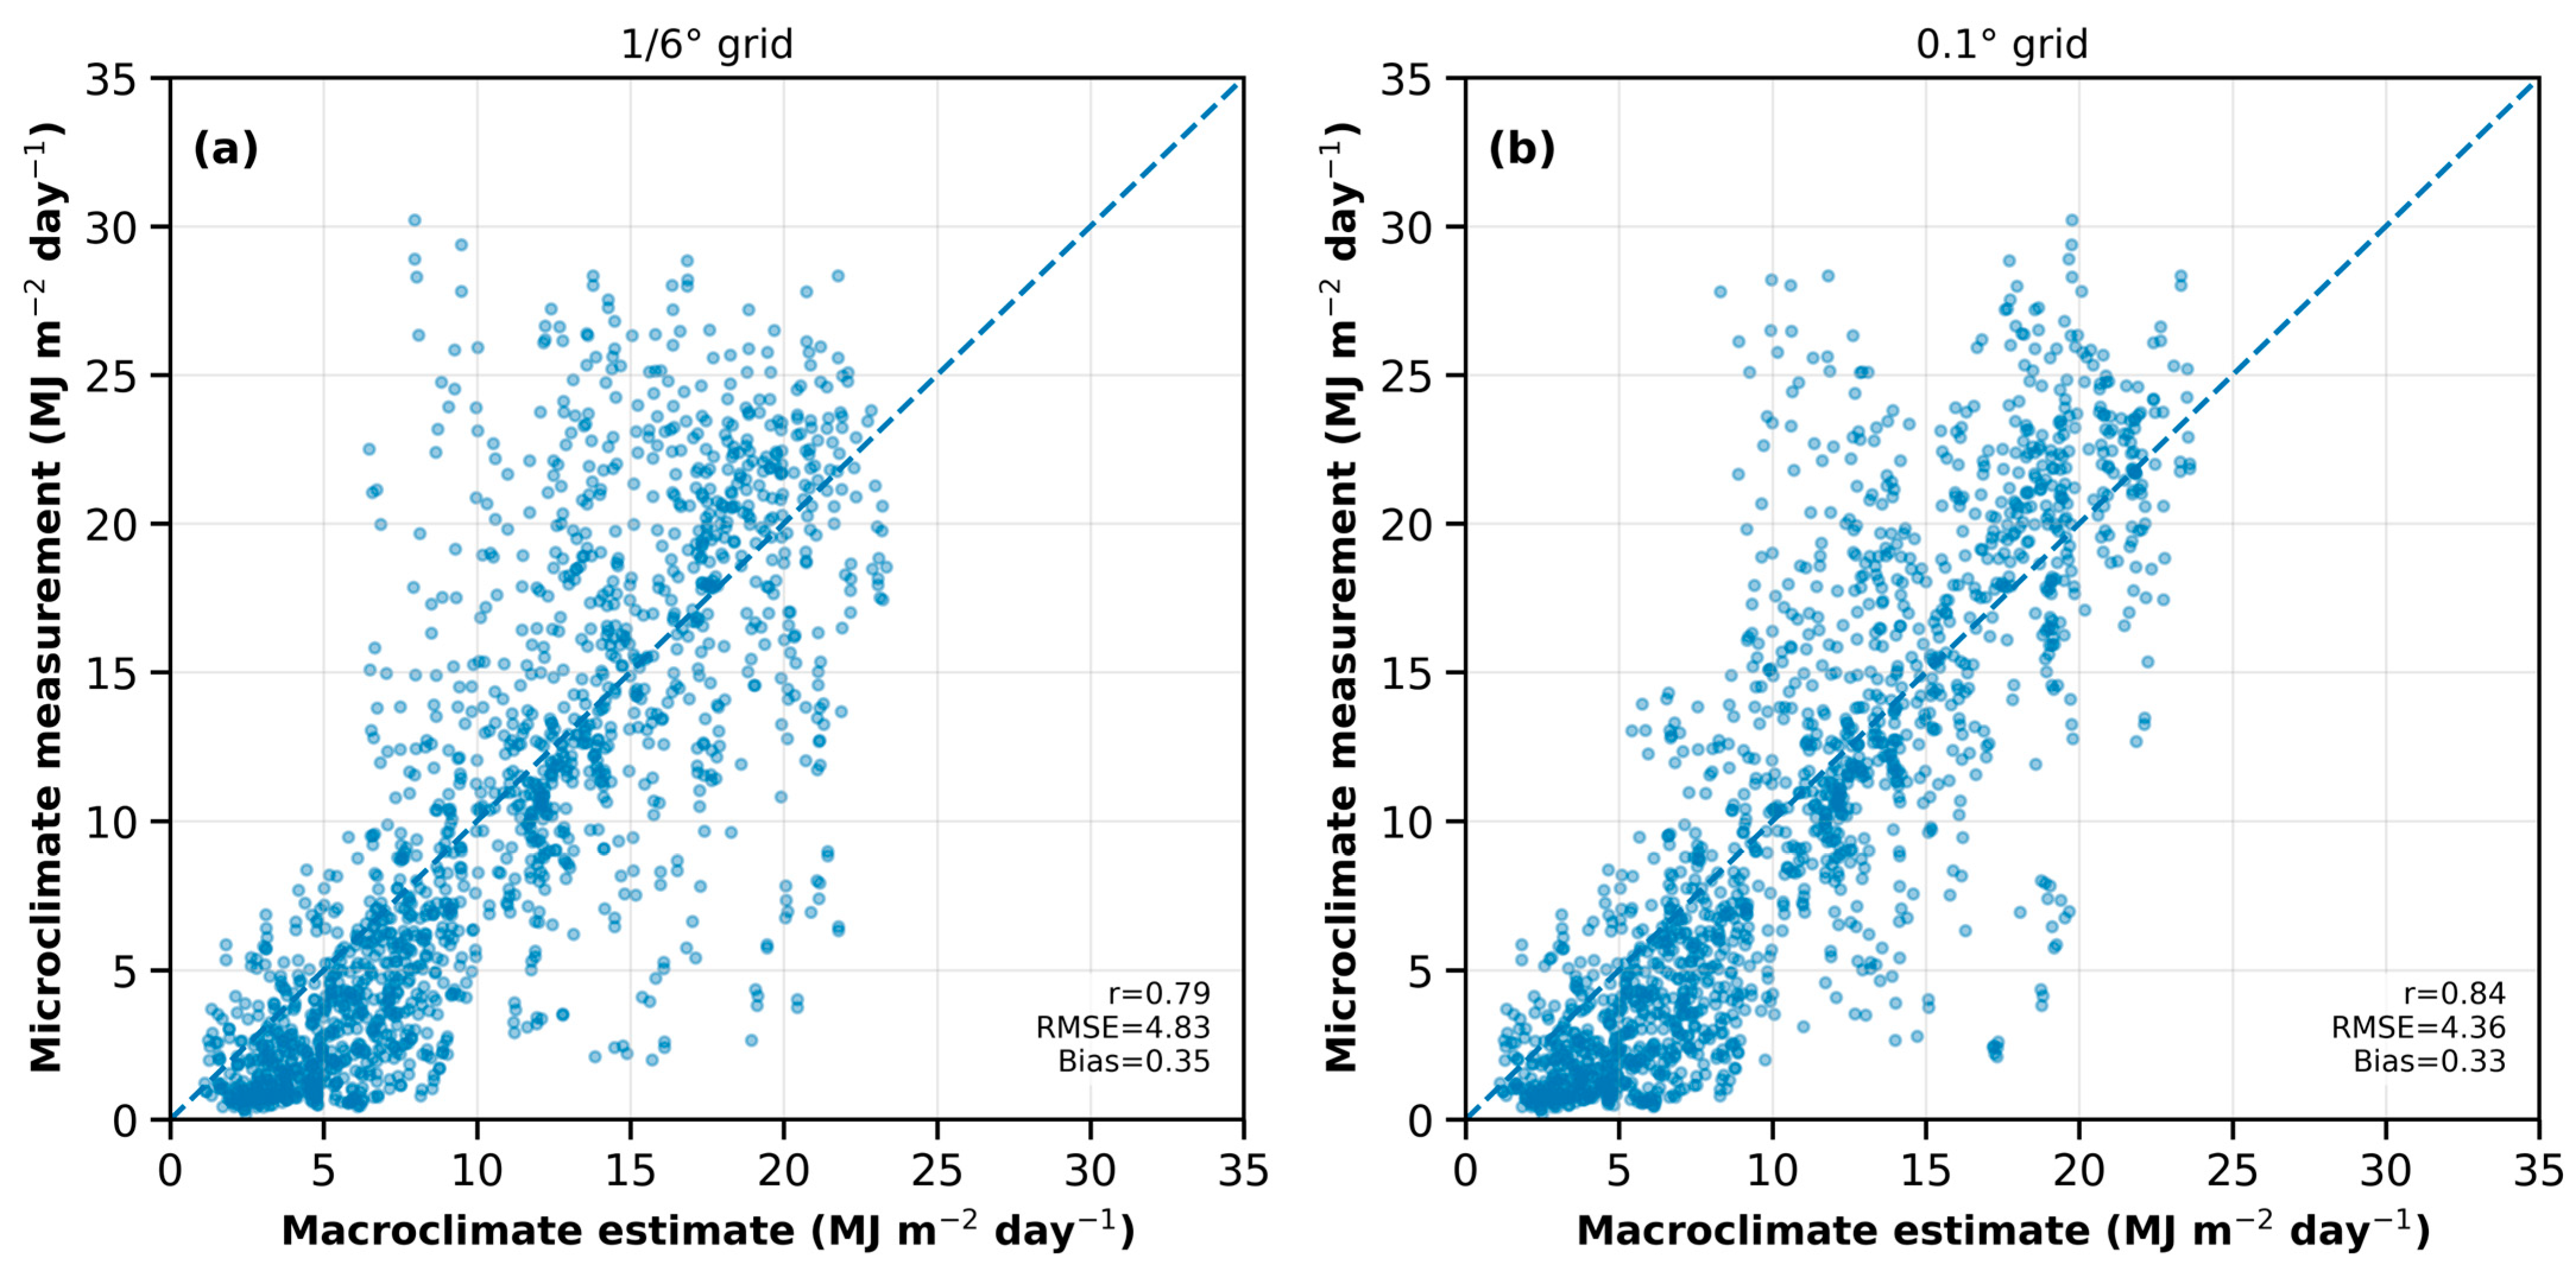
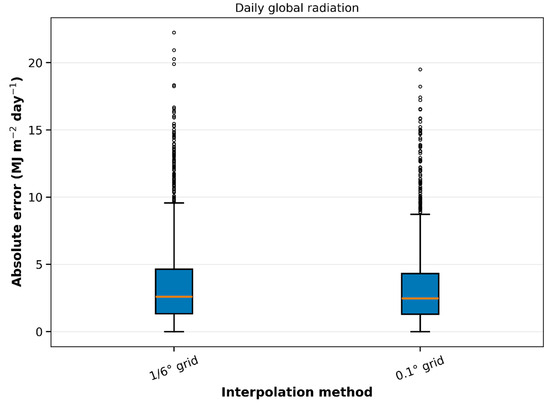
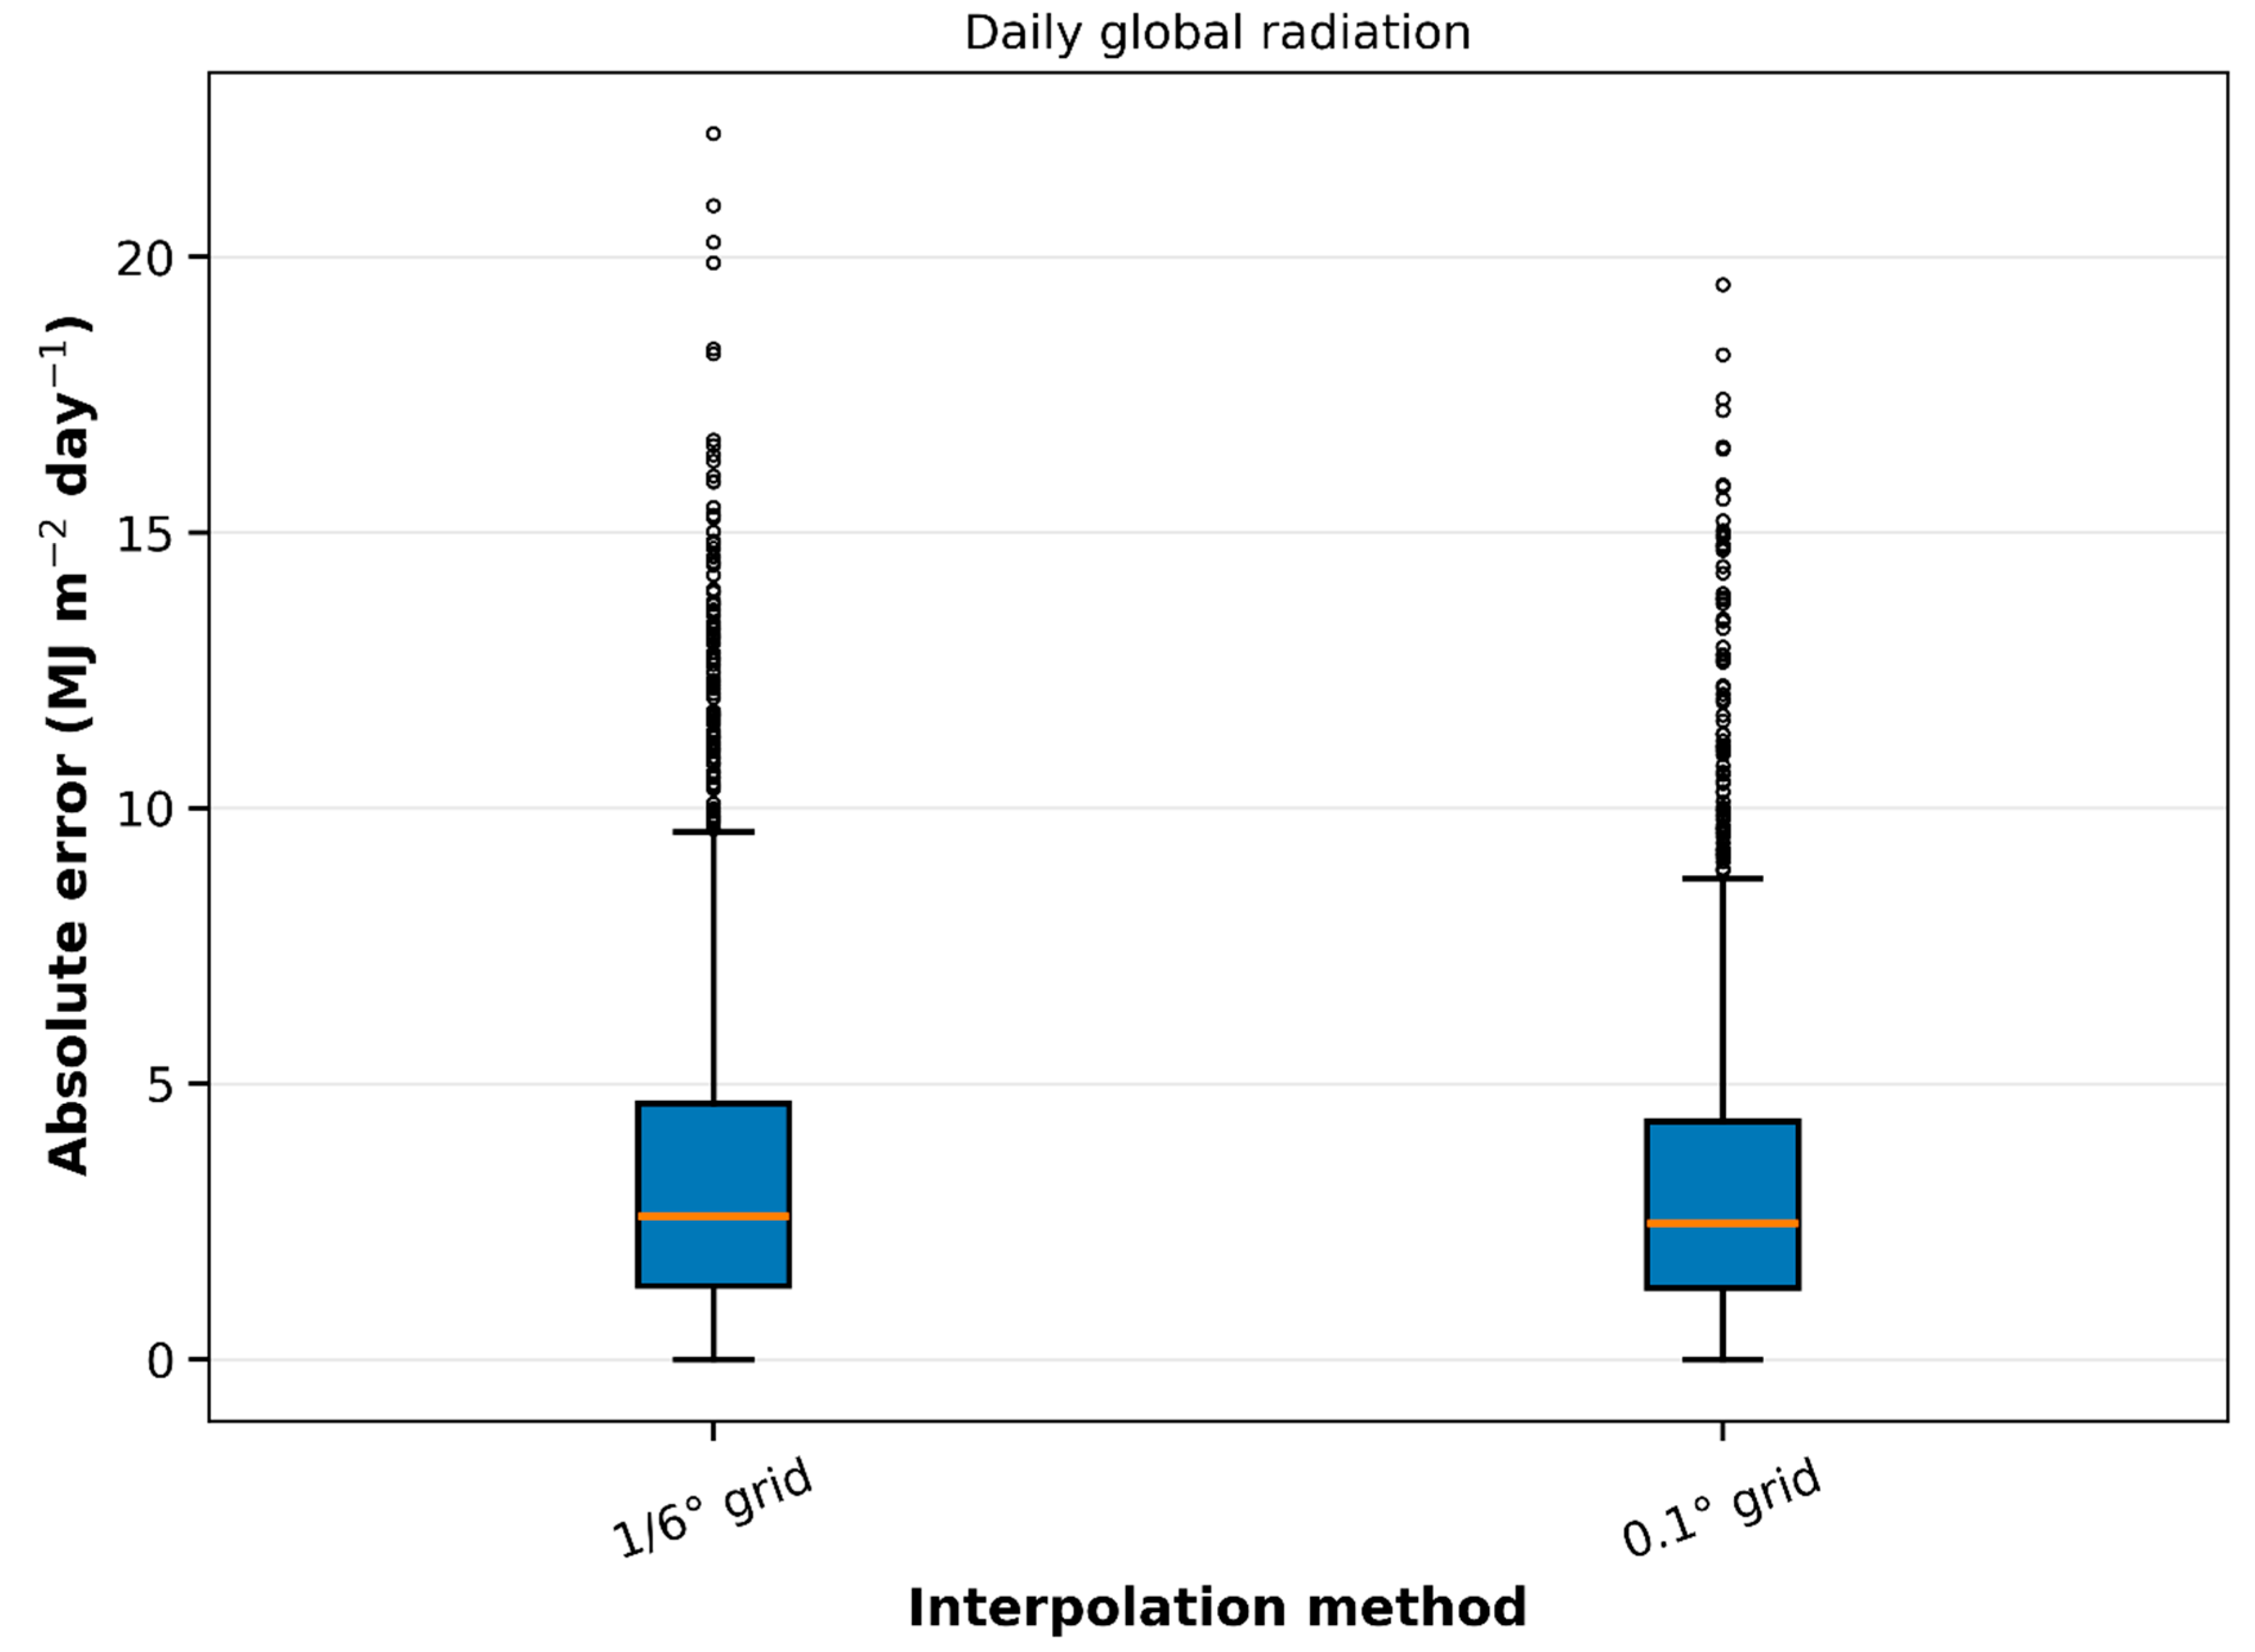
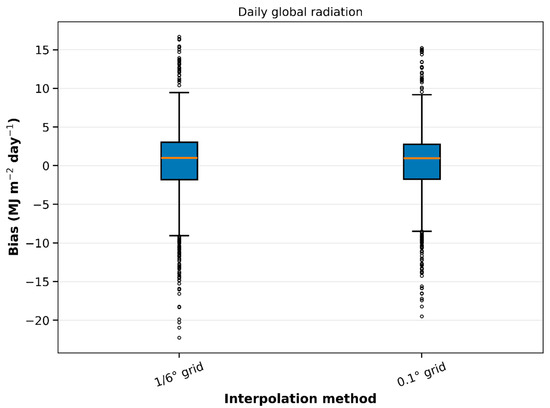
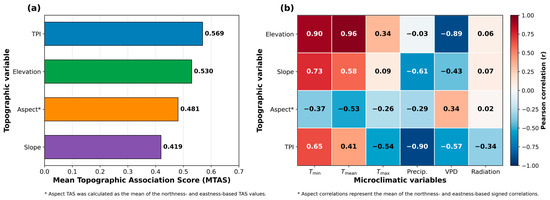

Disclaimer/Publisher’s Note: The statements, opinions and data contained in all publications are solely those of the individual author(s) and contributor(s) and not of MDPI and/or the editor(s). MDPI and/or the editor(s) disclaim responsibility for any injury to people or property resulting from any ideas, methods, instructions or products referred to in the content. |
© 2026 by the author. Licensee MDPI, Basel, Switzerland. This article is an open access article distributed under the terms and conditions of the Creative Commons Attribution (CC BY) license.