


Abstract
The Western Balkans (Serbia, Croatia, Bosnia and Herzegovina, and Montenegro) occupy a transitional climatic position between the Mediterranean hotspot and the continental Balkan interior within Southeast Europe, yet multi-country, multi-model, station-resolved assessments of regional aridification remain scarce. We combined quality-controlled monthly temperature and precipitation records from 100 stations across Serbia, Croatia, Bosnia and Herzegovina, and Montenegro (1961–2020) with bias-corrected projections from a five-member CMIP6 ensemble (EC-Earth3, MPI-ESM1-2-HR, CNRM-CM6-1, MRI-ESM2-0, IPSL-CM6A-LR) under four SSP scenarios to 2100 and benchmarked these projections against five short-term forecasting baselines on a held-out 2019–2020 period. Aridity was quantified using the Ellenberg Climate Quotient (EQ) and De Martonne Index. Results: Ninety-eight of 100 stations showed significant warming (1961–2020, p < 0.05), and 26 showed significant aridification. Ensemble mean end-of-century EQ change ranged from −6.9% (SSP1-2.6) to +44.6% (SSP5-8.5, Montenegro), with the largest absolute increases in the Pannonian lowlands; inter-model uncertainty exceeded inter-scenario uncertainty by roughly a factor of two. Deep learning forecasters (TFT, N-HiTS) outperformed bias-corrected CMIP6 output for short-term, station-scale temperature forecasting, while a simple climatological baseline remained competitive for precipitation. CMIP6 projections and AI forecasting are complementary: multi-model ensembles remain indispensable for long-term, scenario-conditioned planning, while AI offers superior near-term predictive skill for operational decisions.
1. Introduction
A decade-long sequence of record-breaking annual temperatures, both globally and across Southeast Europe, has coincided with an increasing frequency of forest dieback, crop water stress, and hydrological extremes [1,2]. Alterations in the seasonal distribution of temperature and precipitation are now recognised as a primary driver of agro-ecological disturbance across the Mediterranean and sub-Mediterranean climatic zones, through mechanisms including drought stress, reduced soil moisture availability, and shifts in the timing of the growing season. The European Environment Agency’s first European Climate Risk Assessment identified drought and water scarcity among the most severe climate risks facing European agriculture and forestry, with policy readiness assessed as currently insufficient relative to risk severity in several member states [3].
Southeast Europe occupies a transitional biogeographical position between the Mediterranean Basin—identified as one of the world’s most prominent climate change hotspots, where projected warming and drying trends exceed the global average [4,5,6]—and the more continental climatic regime of the Pannonian and Balkan interior. This transitional character makes the Western Balkans (here defined as Serbia, Croatia, Bosnia and Herzegovina, and Montenegro) a region of particular interest for detecting and projecting aridification trends, yet it remains comparatively under-represented in the high-resolution, station-based climate change literature relative to Western and Northern Europe.
1.1. Climate Change and Aridity in the Western Balkans: State of Knowledge
National-scale assessments have documented a warming trend across Serbia and the wider region over the past six decades, accompanied by increasing variability in precipitation extremes [7]. Independent station- and tree-ring-based evidence of progressive aridification has been reported for Vojvodina in northern Serbia [8,9], for the Mačva district [10], for central Serbia [11], and for Mediterranean Croatia [12], using Mann–Kendall and De Martonne-based approaches broadly consistent with those adopted here, though each confined to a single sub-region rather than a harmonised, multi-country network. At a finer ecological resolution, a recent assessment of eight forest tree species across six protected mountainous areas in Serbia projected widespread contraction of cold-adapted conifers (Silver fir, Norway spruce) and mesophilous broadleaves (European beech) under all four SSP scenarios by the 2090s, with the most pronounced overall habitat losses concentrated in Stara Planina, Fruška Gora, and Đerdap National Parks [13]. That SDM framework is geographically and methodologically distinct: it characterises habitat suitability within protected mountainous ecosystems in Serbia, rather than quantifying climatic aridity at the station level across the four-country lowland and agricultural landscape addressed here.
Despite this body of work, three clear research gaps remain. First, no study has provided a jointly harmonised, multi-country aridity assessment covering all four Western Balkan countries simultaneously using a consistent station network, index set, and bias-correction protocol. Second, no study in this region has quantified how inter-model (structural) uncertainty in CMIP6 projections compares with inter-scenario uncertainty across a multi-model ensemble, leaving a critical gap for robust adaptation planning. Third, the operational boundary between process-based GCM projections and data-driven AI forecasting—specifically, the temporal scale at which each provides reliable station-level guidance—has not been empirically established for this region. The novelty of this study lies in addressing all three gaps simultaneously: (i) providing the first four-country, 100-station, five-model CMIP6 aridity projection ensemble for the Western Balkans; (ii) demonstrating that inter-model uncertainty substantially exceeds inter-scenario uncertainty in this region, a finding with direct implications for ensemble design in future assessments; and (iii) empirically establishing, for the first time in this region, that AI-based short-term forecasters consistently outperform bias-corrected GCM output at the individual station scale for temperature, thereby clarifying the complementary operational domains of the two tool classes. The present study is conceived as a complementary, not a duplicative, contribution. Where Stojanović et al. [13] address species-level habitat suitability within six Serbian protected areas, we address direct climatic aridity—using two independent, widely used aridity indices—across a 100-station, four-country network spanning the full elevational and climatic gradient of the Western Balkans, from the Pannonian lowlands to the Dinaric and Adriatic margins. We additionally apply this dual-source (observational and GCM-projected) framework to benchmark, for the first time in this region to our knowledge, the relative skill of physically based climate projections against data-driven short-term forecasting at the individual station scale—a methodological question that this study addresses empirically. The AI benchmarking component is integral to this study, not a separate exercise. CMIP6 projections address what the climate will look like at multi-decadal horizons (2050–2100) and support strategic, long-term planning. AI-based short-term forecasters address what temperature and precipitation will be at an individual station over the next 1–2 years, supporting within-season operational decisions. These tools operate at different temporal scales and serve different decision contexts; they are complements. By directly comparing GCM output against AI baselines on a held-out period, this study empirically delineates the operational boundary between the two tool classes for agricultural and forestry practitioners in the region.
1.2. Aridity Indices as Agroclimatic Indicators
Among the many indices proposed to quantify climatic aridity, the Ellenberg Climate Quotient (EQ) and the De Martonne Aridity Index (DMI) have been particularly widely adopted in European forest and agro-ecological research owing to their parsimony—both require only monthly temperature and precipitation—and their demonstrated capacity to extrapolate into novel climate states without producing the artificially extreme values that can affect indices based on shorter sub-annual accumulation windows [13,14]. An alternative, more data-intensive index widely used in the broader drought literature is the multiscalar Standardised Precipitation Evapotranspiration Index (SPEI) [15], which requires a full potential-evapotranspiration calculation and is typically applied at sub-annual (1–24 month) accumulation scales; EQ and DMI were preferred here for their direct comparability with the only available regional baseline study [13] and their established robustness under GCM-projected, rather than purely observational, climate data. Both indices were therefore adopted here, computed identically from observational station records and from bias-corrected General Circulation Model (GCM) output, enabling direct, like-for-like comparison between the historical and projected climate states.
1.3. Aims
The overarching objective of this study was to provide the first comprehensive, multi-country assessment of historical and projected aridity dynamics across the Western Balkans, and to empirically delineate the complementary roles of process-based CMIP6 projections and data-driven AI forecasting for regional adaptation planning. Three specific objectives were defined: (1) to quantify observed (1961–2020) temperature, precipitation, and aridity trends across a 100-station, four-country network using Mann–Kendall and Sen’s slope; (2) to project station-level aridity to 2100 under four SSP scenarios using a five-member CMIP6 ensemble, decompose projection uncertainty into inter-scenario and inter-model components, and attribute projected change to its principal drivers via SHAP; and (3) to empirically benchmark bias-corrected GCM output against AI and statistical short-term forecasters at the station scale, establishing the complementary operational domains of each tool class.
2. Materials and Methods
2.1. Study Area and Station Network
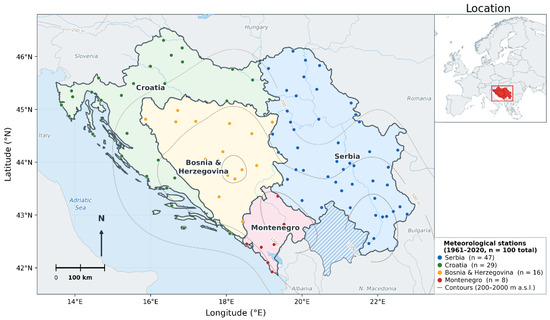
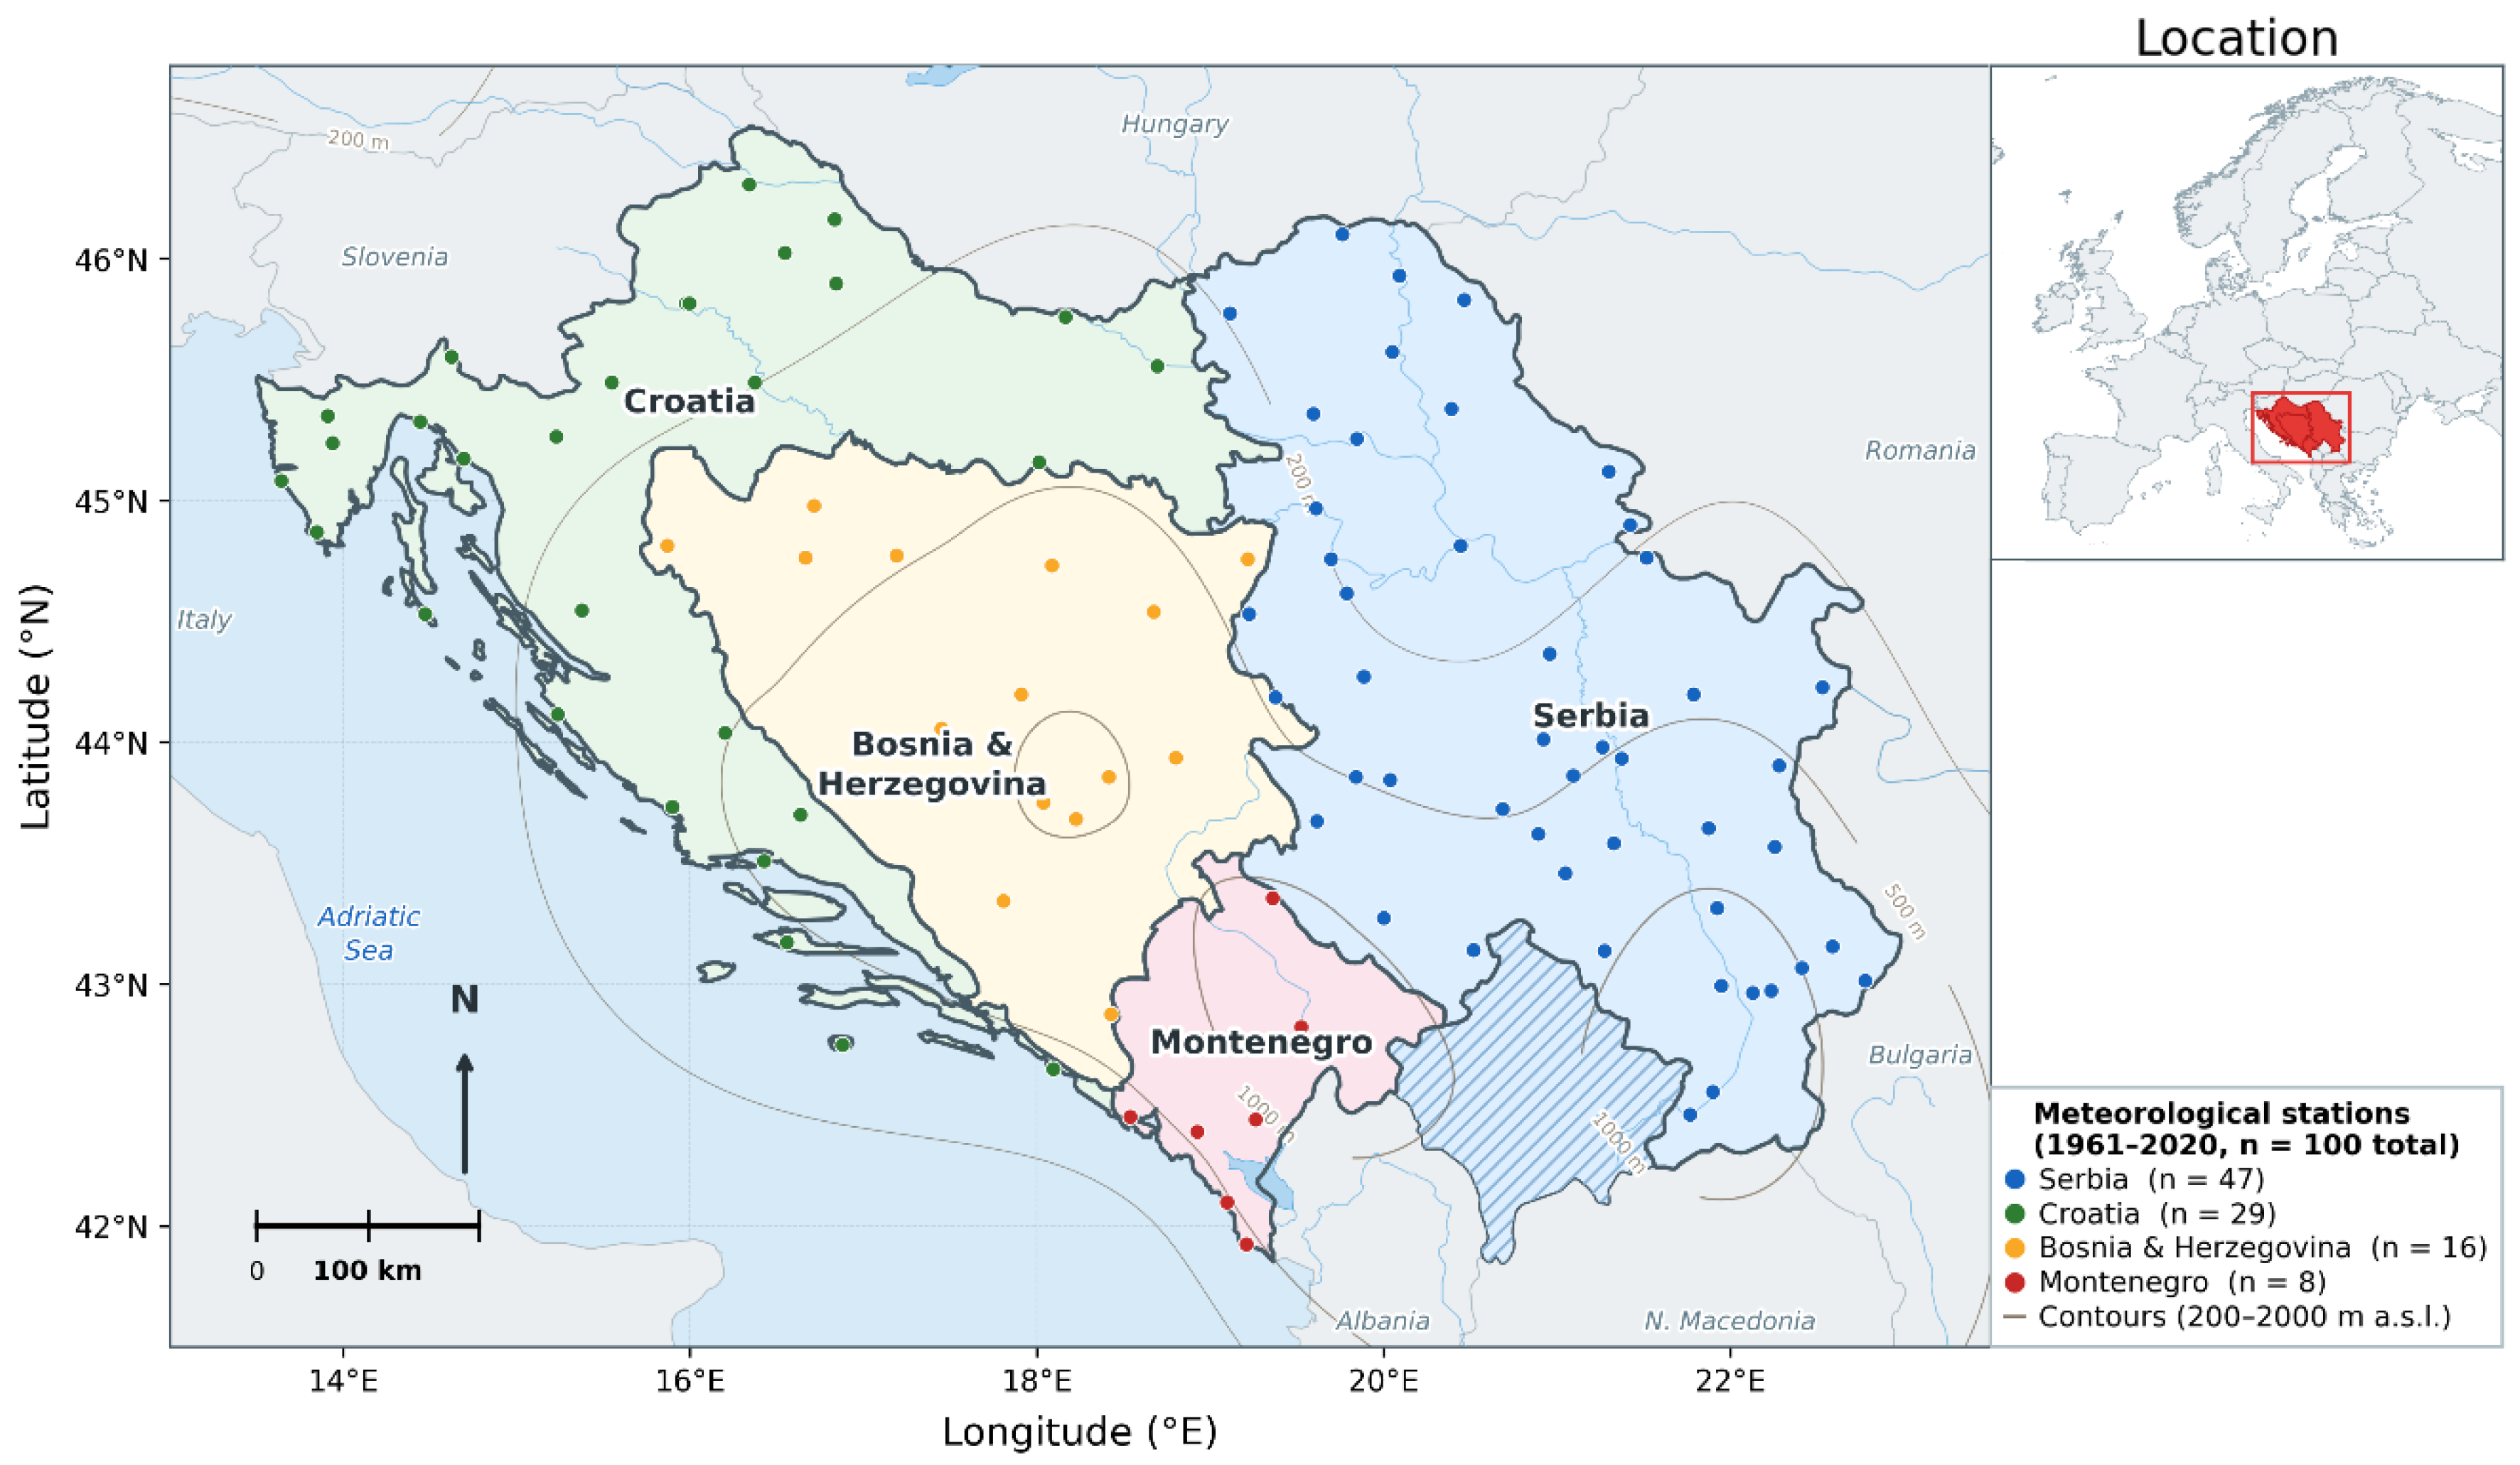
The study area comprised the territories of Serbia, Croatia, Bosnia and Herzegovina, and Montenegro, spanning approximately 13.5° E to 23° E and 41.9° N to 46.3° N. Monthly mean air temperature and total precipitation records were compiled for 171 raw station-variable series (94 from Serbia, 32 from Bosnia and Herzegovina, 29 from Croatia, and 16 from Montenegro), corresponding to 100 unique geographic locations after reconciling paired temperature and precipitation series recorded under the same place name, for the period 1961–2020 (60 years). The observational record was bounded at 2020 because this represents the most recent year for which quality-controlled, homogenised monthly data were available from all four national sources via the ECA&D archive at the time of data acquisition; post-2020 data were not yet included in the publicly available ECA&D dataset for the majority of stations in this network. While the period 2021–2025 includes several exceptionally warm and drought-prone years of scientific interest, extending the analysis through to 2025 was not feasible within the constraints of the current study; this is acknowledged as a limitation in Section 4.4, and updating the observational baseline through to 2025 is identified as a priority for follow-up work. Reconciliation reduced the raw count differentially by country, reflecting differences in how each national archive structured its source files: Croatian records were supplied as single, already-combined temperature-and-precipitation files per station (29 raw series, 29 unique stations), whereas Serbian, Bosnian, and Montenegrin records were supplied as separate per-variable files for the same station (94, 32, and 16 raw series reconciling to 47, 16, and 8 unique stations, respectively). The final station network therefore comprised 47 stations in Serbia, 29 in Croatia, 16 in Bosnia and Herzegovina, and 8 in Montenegro (total n = 100; Figure 1).
Figure 1.
Study domain and meteorological station network. Coloured circles indicate the 100 quality-controlled stations (1961–2020), grouped by country: Serbia (blue, n = 47), Croatia (green, n = 29), Bosnia and Herzegovina (amber, n = 16), and Montenegro (red, n = 8). Contour lines show elevation at 200, 500, 1000, 1500, and 2000 m a.s.l. National boundaries and topographic data from Natural Earth (1:10 m). Inset: study region within Europe.
Station coordinates were obtained from the European Climate Assessment & Dataset (ECA&D) [16] metadata files where available (n = 108 of 171 raw series); for the remaining stations, coordinates were derived by geocoding the cleaned station place name against OpenStreetMap Nominatim, with manual verification against the European Climate Assessment & Dataset station list for ambiguous or orographically distinctive locations (e.g., mountain stations).
2.2. Observational Data Quality Control
Prior to analysis, all monthly records were screened for physically implausible values. Nine temperature values exceeding 50 °C were identified across eight stations; comparison against the corresponding monthly and station-specific climatological context indicated that all nine were consistent with a decimal-point transcription error (e.g., a recorded value of 189.1 °C for Sjenica, July 2012, against a station mean July temperature of approximately 16–18 °C) and were corrected by a factor of 10. A second, spatially localised data quality issue was identified at the Sjenica station, where all twelve monthly temperature values were found to be numerically identical within each of nine consecutive years (2002–2010), a pattern that cannot reflect genuine intra-annual climatic variability at any station and most likely reflects an upstream data-processing artefact in which a single annual value was propagated across all twelve calendar months. These 108 station-months were treated as missing data and excluded from all subsequent trend and aridity calculations; no other station or variable exhibited this signature when the full dataset was systematically screened for runs of within-year constant values. Across the full network, the total proportion of missing or quality-control-excluded monthly values was low: fewer than 0.4% of all station-month pairs (approximately 280 of ~72,000 station-months) were flagged as missing or excluded, comprising the Sjenica constant-value window (108 months), the nine corrected implausible temperature values, and a small number of pre-existing gaps in the raw national archive files. Missing values were not imputed; instead, aridity indices and trend statistics were computed directly from available observations, and stations with fewer than 15 valid annual observations were excluded from trend testing (Section 2.6). The impact of missing data on network-level results is therefore considered negligible. Regarding measurement methodology: standard WMO-compliant mercury and, later, digital thermometry and rain-gauge protocols have been used consistently across the national networks supplying data to ECA&D throughout the 1961–2020 period. Instrument transitions (e.g., from mercury to platinum resistance thermometers at some stations) may introduce minor systematic offsets; however, the national archives from which ECA&D data derive apply station-level homogenisation procedures to minimise such artefacts, and we rely on these homogenised series throughout. Any residual inhomogeneity would be expected to produce non-systematic noise rather than a directional bias and is unlikely to alter the direction or statistical significance of the widespread warming and aridification signals reported in Section 3.1.
2.3. CMIP6 Climate Projection Data
Future climate projections were obtained from five CMIP6 Earth System Models, selected on the basis of full, consistent data availability across the historical experiment (1850–2014) and all four ScenarioMIP experiments (SSP1-2.6, SSP2-4.5, SSP3-7.0, SSP5-8.5; 2015–2100) for a single realisation, run under the CMIP6 experimental protocol [17]: EC-Earth3 [18], realisation r11i1p1f1; MPI-ESM1-2-HR [19], CNRM-CM6-1 [20], MRI-ESM2-0 [21], and IPSL-CM6A-LR [22], each at realisation r1i1p1f1, retrieved via the Earth System Grid Federation (ESGF). This five-model selection spans a representative range of modelling centres (European, Japanese, French) and horizontal resolutions, providing a basis for assessing structural (inter-model) projection uncertainty alongside inter-scenario uncertainty (Section Multi-Model Ensemble and Uncertainty Decomposition). Monthly near-surface air temperature (tas) and precipitation flux (pr) were retrieved on each model’s native atmospheric grid; for IPSL-CM6A-LR, which provides an extended ScenarioMIP simulation beyond 2100 for some experiments, only years up to 2100 were retained for consistency with the other four models. Grid-cell values nearest to each of the 100 station coordinates were extracted using nearest-neighbour selection; temperature was converted from Kelvin to degrees Celsius, and precipitation flux (kg m−2 s−1) was converted to monthly accumulated precipitation (mm) by multiplying by the number of seconds in the corresponding calendar month, accounting for leap years. Projected change throughout this study (Section 3.2, Section 3.3 and Section 3.6) is reported relative to a 1985–2014 baseline rather than a standard 30-year WMO climatological normal period (e.g., 1961–1990 or 1991–2020); this choice follows the convention widely adopted in the CMIP6/IPCC AR6 impact literature [2], in which 1985–2014 (sometimes also written as the most recent 30-year period ending at the close of the historical experiment) is the standard baseline against which CMIP6-based future projections are expressed, because it represents the final, most contemporaneous 30-year segment common to the historical experiment across all participating models. This CMIP6-standard baseline is retained throughout to ensure comparability with the wider projection literature; observational trend analysis (Section 2.6 and Section 3.1) uses the full 1961–2020 record independently of this convention.
2.4. Aridity Indices
Two indices were calculated for each station-year, from both the observational and the bias-corrected GCM data, using identical formulae. The Ellenberg Climate Quotient [23] was calculated as:
where T_July is the mean temperature (°C) of the warmest month (July, Northern Hemisphere) and P_annual is total annual precipitation (mm). EQ was selected as the primary aridity metric on the basis of its demonstrated capacity to extrapolate reliably into novel climate states, in contrast to indices based on sub-annual (e.g., growing-season) accumulation windows, which can produce artificially extreme values when individual months are projected toward very low precipitation totals [13]. The De Martonne Aridity Index (DMI) [24] was calculated as a secondary, corroborating metric:
where T_mean is mean annual temperature (°C). Unlike EQ, higher DMI values indicate wetter (less arid) conditions; the two indices were therefore expected, and found, to respond in opposite directions to projected warming and drying.
2.5. Bias Correction
Bias correction was applied independently for each of the five GCMs, at the level of individual stations and calendar months, using the 1961–2014 overlap period between the observational record and each model’s historical experiment, following the general delta-change and ratio-correction approach reviewed and benchmarked by Teutschbein and Seibert [25] and consistent with the validation principles established by the VALUE framework for downscaling and bias-adjustment intercomparison [26]. For temperature, an additive monthly bias was calculated as the difference between the observed and modelled climatological mean for each station-month combination and applied uniformly across the historical and all four SSP experiments for that model. For precipitation, a multiplicative bias factor was calculated as the ratio of observed to modelled climatological mean precipitation for each station-month combination, with the resulting ratios constrained to the range 0.2–5.0 to prevent unrealistic amplification of projected precipitation at stations or months where the raw GCM climatology was very low. Mean station-month bias varied considerably across the five models—temperature bias ranged from −0.04 °C (MPI-ESM1-2-HR, i.e., negligible systematic offset) to +1.55 °C (EC-Earth3), and the mean precipitation ratio ranged from 1.01 (MRI-ESM2-0, i.e., negligible systematic offset) to 1.46 (MPI-ESM1-2-HR)—illustrating substantial structural diversity among the five models even prior to any consideration of their projected future change (Section 3.3). We note that this delta-change and ratio approach corrects only the climatological mean (first moment) of the simulated distribution at each station and calendar month and does not adjust higher-order moments such as variance or skewness; consequently, it does not correct for potential GCM misrepresentation of the full distribution of monthly values, including the frequency and magnitude of extremes. More sophisticated distribution-wide approaches, most notably quantile mapping and its variants (e.g., empirical or parametric quantile delta mapping), explicitly correct the entire cumulative distribution function and are increasingly preferred in the bias-correction literature where extreme-value fidelity is important [25]. The mean-based approach is appropriate here because EQ and DMI are functions of monthly and annual means rather than distributional extremes; the limitation for secondary applications requiring higher-order distributional fidelity is revisited in Section 4.4.
Multi-Model Ensemble and Uncertainty Decomposition
For each station, year, and SSP experiment, the ensemble mean EQ was calculated as the arithmetic mean of the bias-corrected EQ across all five models, and the ensemble spread was characterised by the standard deviation and the min-max range across models. To provide a simple, descriptive decomposition of projection uncertainty into its inter-scenario and inter-model (structural) components for the end-of-century period (2081–2100), we calculated, per station: (i) the inter-scenario standard deviation, taken as the standard deviation of the ensemble mean EQ across the four SSP experiments; and (ii) the inter-model standard deviation, taken as the across-model standard deviation of EQ within each experiment, averaged over the four experiments. This descriptive approach provides a transparent, station-level comparison of the two uncertainty sources; formal ANOVA-based variance partitioning [27] is identified as a refinement for future work.
2.6. Trend Analysis
Monotonic trends in annual mean temperature, annual total precipitation, EQ, and the De Martonne Index over 1961–2020 were assessed at each station using the non-parametric Mann–Kendall test [28,29], with trend magnitude quantified using Sen’s slope estimator. This combination is widely used in regional climate trend studies, including prior work in Serbia [7,30], owing to its robustness to non-normality and to the presence of outliers in hydroclimatic time series. Stations with fewer than 15 valid years of data were excluded from trend testing. The Pettitt test—a non-parametric rank-based test for detection of abrupt change-points (shifts in the median) in a time series—was not applied in the primary analysis, as the central objective of this study is quantification of long-term monotonic trends, for which Mann–Kendall and Sen’s slope are the methodologically appropriate and widely adopted standard [7,30]. Change-point detection addresses a complementary but distinct question—the timing of potential regime shifts—and is identified as a valuable direction for future work, particularly in the context of the post-1980 acceleration of Mediterranean drying. Visual inspection of the temperature series at all 100 stations is consistent with broadly monotonic warming rather than single abrupt shifts, supporting the trend-based approach adopted here.
Because trend significance was tested independently at 100 stations, applying a nominal p < 0.05 threshold at each station without correction inflates the expected number of false positives across the network (the multiple-comparisons problem); in addition, annual hydroclimatic series can exhibit positive autocorrelation, which is known to inflate the apparent significance of the standard Mann–Kendall test if left uncorrected. We addressed both issues as follows. First, prior to testing, each station-variable series was screened for statistically significant lag-1 autocorrelation, and where present, a trend-free pre-whitening procedure was applied before the Mann–Kendall test, following standard practice for autocorrelated hydroclimatic series. Second, station-level p-values for each variable were adjusted for multiple comparisons across the 100-station network using the Benjamini–Hochberg false discovery rate (FDR) procedure, controlling the expected proportion of false positives among all stations declared significant at a target FDR of 5%. We report results under this FDR-corrected criterion throughout Section 3.1, in preference to uncorrected per-station p-values; the field-significance implications of this correction are discussed in Section 4.4.
2.7. Short-Term AI Forecast Validation
To characterise the operational range of validity of GCM-based projections at the station scale—that is, to clarify whether a bias-corrected GCM should be expected to outperform simpler approaches when the question of interest is the near-term state of an individual station, as opposed to the multi-decadal, scenario-conditioned climatic trend—we benchmarked the bias-corrected CMIP6 SSP2-4.5 output against five alternative short-term forecasting approaches over a held-out 2019–2020 evaluation period, with all models trained or fitted exclusively on data preceding 2019: (i) a climatological mean baseline; (ii) SARIMA(1,0,0)(1,0,0)12, fitted independently per station; (iii) a Random Forest regressor using lagged and rolling-mean features; (iv) a Temporal Fusion Transformer (TFT) [31]; and (v) N-HiTS [32], a hierarchical-interpolation architecture that extends the original N-BEATS basis-expansion approach [33] with multi-rate signal sampling for improved long-horizon efficiency; the latter two trained globally across all 100 station series with GPU acceleration and validation-based early stopping. TFT and N-HiTS were selected as structurally distinct representatives of two major deep learning forecasting families: TFT is attention-based with built-in variable-importance interpretability; N-HiTS is an MLP-based hierarchical interpolation architecture optimised for long-horizon efficiency. Their structural diversity allows the benchmarking to test whether the AI advantage is architecture-specific or general. Additional architectures (PatchTST [34], TiDE [35], xLSTMTime [36]) are identified as candidates for future extension. Full architectural specifications and hyperparameters are provided in Supplementary Materials (Section S1); here, and in Section 3.5, we report the headline mean absolute error (MAE) and root-mean-square error (RMSE) for temperature and precipitation.
2.7.1. Statistical Significance of Forecast Differences
To assess whether the pairwise differences in forecast accuracy among the six benchmarked approaches (Section 2.7) were statistically significant, rather than attributable to sampling variability across the 100-station, 24-month evaluation panel, a Friedman test was applied to the station-level mean absolute errors of each model, followed by pairwise Diebold-Mariano tests [37] comparing the two leading deep learning architectures (TFT, N-HiTS) against each remaining benchmark. Full test statistics, p-values, and a monthly/seasonal breakdown of forecast error (to assess whether AI-based forecast skill is concentrated in particular seasons, including drought-prone summer months) are reported in Supplementary Materials (Tables S2 and S3).
2.7.2. Multi-GCM Robustness Check
To assess whether the station-scale AI advantage reported in Section 3.5 was contingent on the specific choice of EC-Earth3 as the GCM comparator, the bias-correction and 2019–2020 validation procedure (Section 2.5 and Section 2.7) was repeated for all five ensemble members under SSP2-4.5, yielding five independent bias-corrected GCM forecasts for direct comparison against the fixed (already-trained) TFT and N-HiTS forecasts over the same held-out period. This robustness check required no re-training of the AI models, only repetition of the deterministic bias-correction and extraction pipeline for each additional GCM.
2.8. SHAP Attribution of Projected Aridity Change
To attribute the principal drivers of projected EQ across the full historical-to-2100 bias-corrected dataset, a gradient-boosted regression model (XGBoost 2.1.4) [38] was trained to predict station-year EQ from calendar year, SSP experiment, station latitude, longitude, elevation, and country, with SHAP (SHapley Additive exPlanations) [39] values computed via TreeExplainer to provide global feature importance and the direction of each feature’s marginal contribution. Full model specification, validation performance, and SHAP summary and dependence plots are provided in Supplementary Materials (Figures S1 and S2); the headline finding—a strictly monotonic, physically consistent relationship between emission-scenario intensity and projected aridity contribution—is summarised in Section 3.6.
2.9. Software and Computational Environment
All data acquisition, processing, statistical analysis, and machine learning model development were implemented in Python (version 3.12). The core scientific computing stack comprised pandas and NumPy 1.24 for tabular data handling; xarray 2024.1, netCDF4 1.6, and dask for CMIP6 NetCDF 1.6 data extraction and lazy-loaded multi-file concatenation; geopy 2.4 for station geocoding; pymannkendall 1.4.3 for non-parametric trend testing; scikit-learn 1.3 (Random Forest) and XGBoost 2.14 for tree-based machine learning; statsmodels 0.14 for SARIMA modelling; neuralforecast 3.0, built on a PyTorch 2.1 backend, for the Temporal Fusion Transformer and N-HiTS architectures; and the shap package (TreeExplainer) for model attribution. Figures were produced with Matplotlib 3.7.
Deep learning model training was performed on local hardware (Intel Core i9, 96 GB RAM, NVIDIA RTX 5090 GPU, 32 GB VRAM) using PyTorch CUDA 2.1 acceleration. Both TFT and N-HiTS were trained globally across all 100 station series with hidden dimensionality of 128 units, up to 2000 training steps, and validation-based early stopping (patience = 5 checkpoints). All other models (climatological baseline, SARIMA, Random Forest, XGBoost 2.14) were executed on the same machine without GPU acceleration. The scale of this task is modest, and all models could be reproduced on standard consumer hardware with longer wall-clock time but identical accuracy; no cloud infrastructure was used.
3. Results
3.1. Observed Climate Trends, 1961–2020
Ninety-eight of the 100 stations exhibited an increasing trend in annual mean temperature over 1961–2020 that was statistically significant at the nominal p < 0.05 level prior to multiple-comparisons correction, with no station exhibiting a significant cooling trend. The two stations that did not reach the nominal significance threshold—two stations in the mountainous interior of the network—are characterised by comparatively shorter effective record lengths after quality-control exclusions and/or above-average interannual temperature variability, both of which reduce statistical power for trend detection. Neither station exhibited a negative Sen’s slope; both showed positive (warming) slope estimates that fell below the nominal significance threshold, consistent with the regional warming pattern rather than a genuine absence of warming. Their non-significance is therefore attributable to reduced statistical power rather than to a physical anomaly and does not alter the network-level conclusion of near-universal regional warming. Ten stations exhibited a trend in the De Martonne Index significant at the uncorrected level, of which eight indicated decreasing (drying) and two indicated increasing (wetting) conditions, consistent in direction with the EQ results. Eight stations exhibited a significant increasing trend in annual precipitation at the uncorrected level.
The strongest observed aridification signal, by Sen’s slope of EQ, was concentrated at Adriatic coastal stations in Croatia (Lastovo, Split-Marjan, Dubrovnik, Rovinj) and at continental stations in eastern Serbia in the vicinity of the Stara Planina massif (Pirot, Knjaževac, Zaječar), as summarised in Table 1.
Table 1.
Ten stations with the strongest statistically significant increasing trend in the Ellenberg Climate Quotient (EQ), 1961–2020. Station latitude (°N), longitude (°E), and elevation (m a.s.l.) are listed in the table. Coordinates (latitude, longitude) and elevation (m a.s.l.) for each station are provided in the station network map (Figure 1) and in the full metadata table (available from the corresponding author upon request).
3.2. Projected Climate Change and Aridity by Country and Scenario
Across all four countries, the bias-corrected, five-model ensemble mean indicated increases in EQ by 2081–2100 relative to a 1985–2014 baseline under the three higher-emission scenarios, with the magnitude of increase varying by country (Table 2). Under SSP1-2.6, all four countries showed a small decrease (−6.4% to −7.6%) rather than an increase, indicating that under a strong-mitigation pathway the five-model ensemble does not project a robust aridification signal for this region. Under the three higher-emission scenarios, Bosnia and Herzegovina and Montenegro showed the largest projected increases (up to +44.4% and +44.6%, respectively, under SSP5-8.5), with Serbia and Croatia showing somewhat smaller increases (+38.3% and +32.2%, respectively, under SSP5-8.5). Projected change is presented at the country level (Table 2) and individual-station level (Figure 2) rather than as a single pooled statistic, as neither a simple cross-country mean nor a station-count-weighted mean provides a clearly superior summary for a four-country network with unequal station densities. The decadal EQ trajectory by country and scenario (Figure 3) shows that scenario divergence remains modest until approximately 2050, after which the four emission pathways separate markedly, consistent with the ensemble spread in Figure 4.
Table 2.
Ensemble mean (5 models) projected EQ change by country and SSP scenario, 2081–2100 relative to 1985–2014 baseline.
Figure 2.
Projected absolute change in the Ellenberg Climate Quotient (EQ), 5-model ensemble mean, across 100 Western Balkan stations, 2081–2100 relative to a 1985–2014 baseline, under four SSP scenarios.
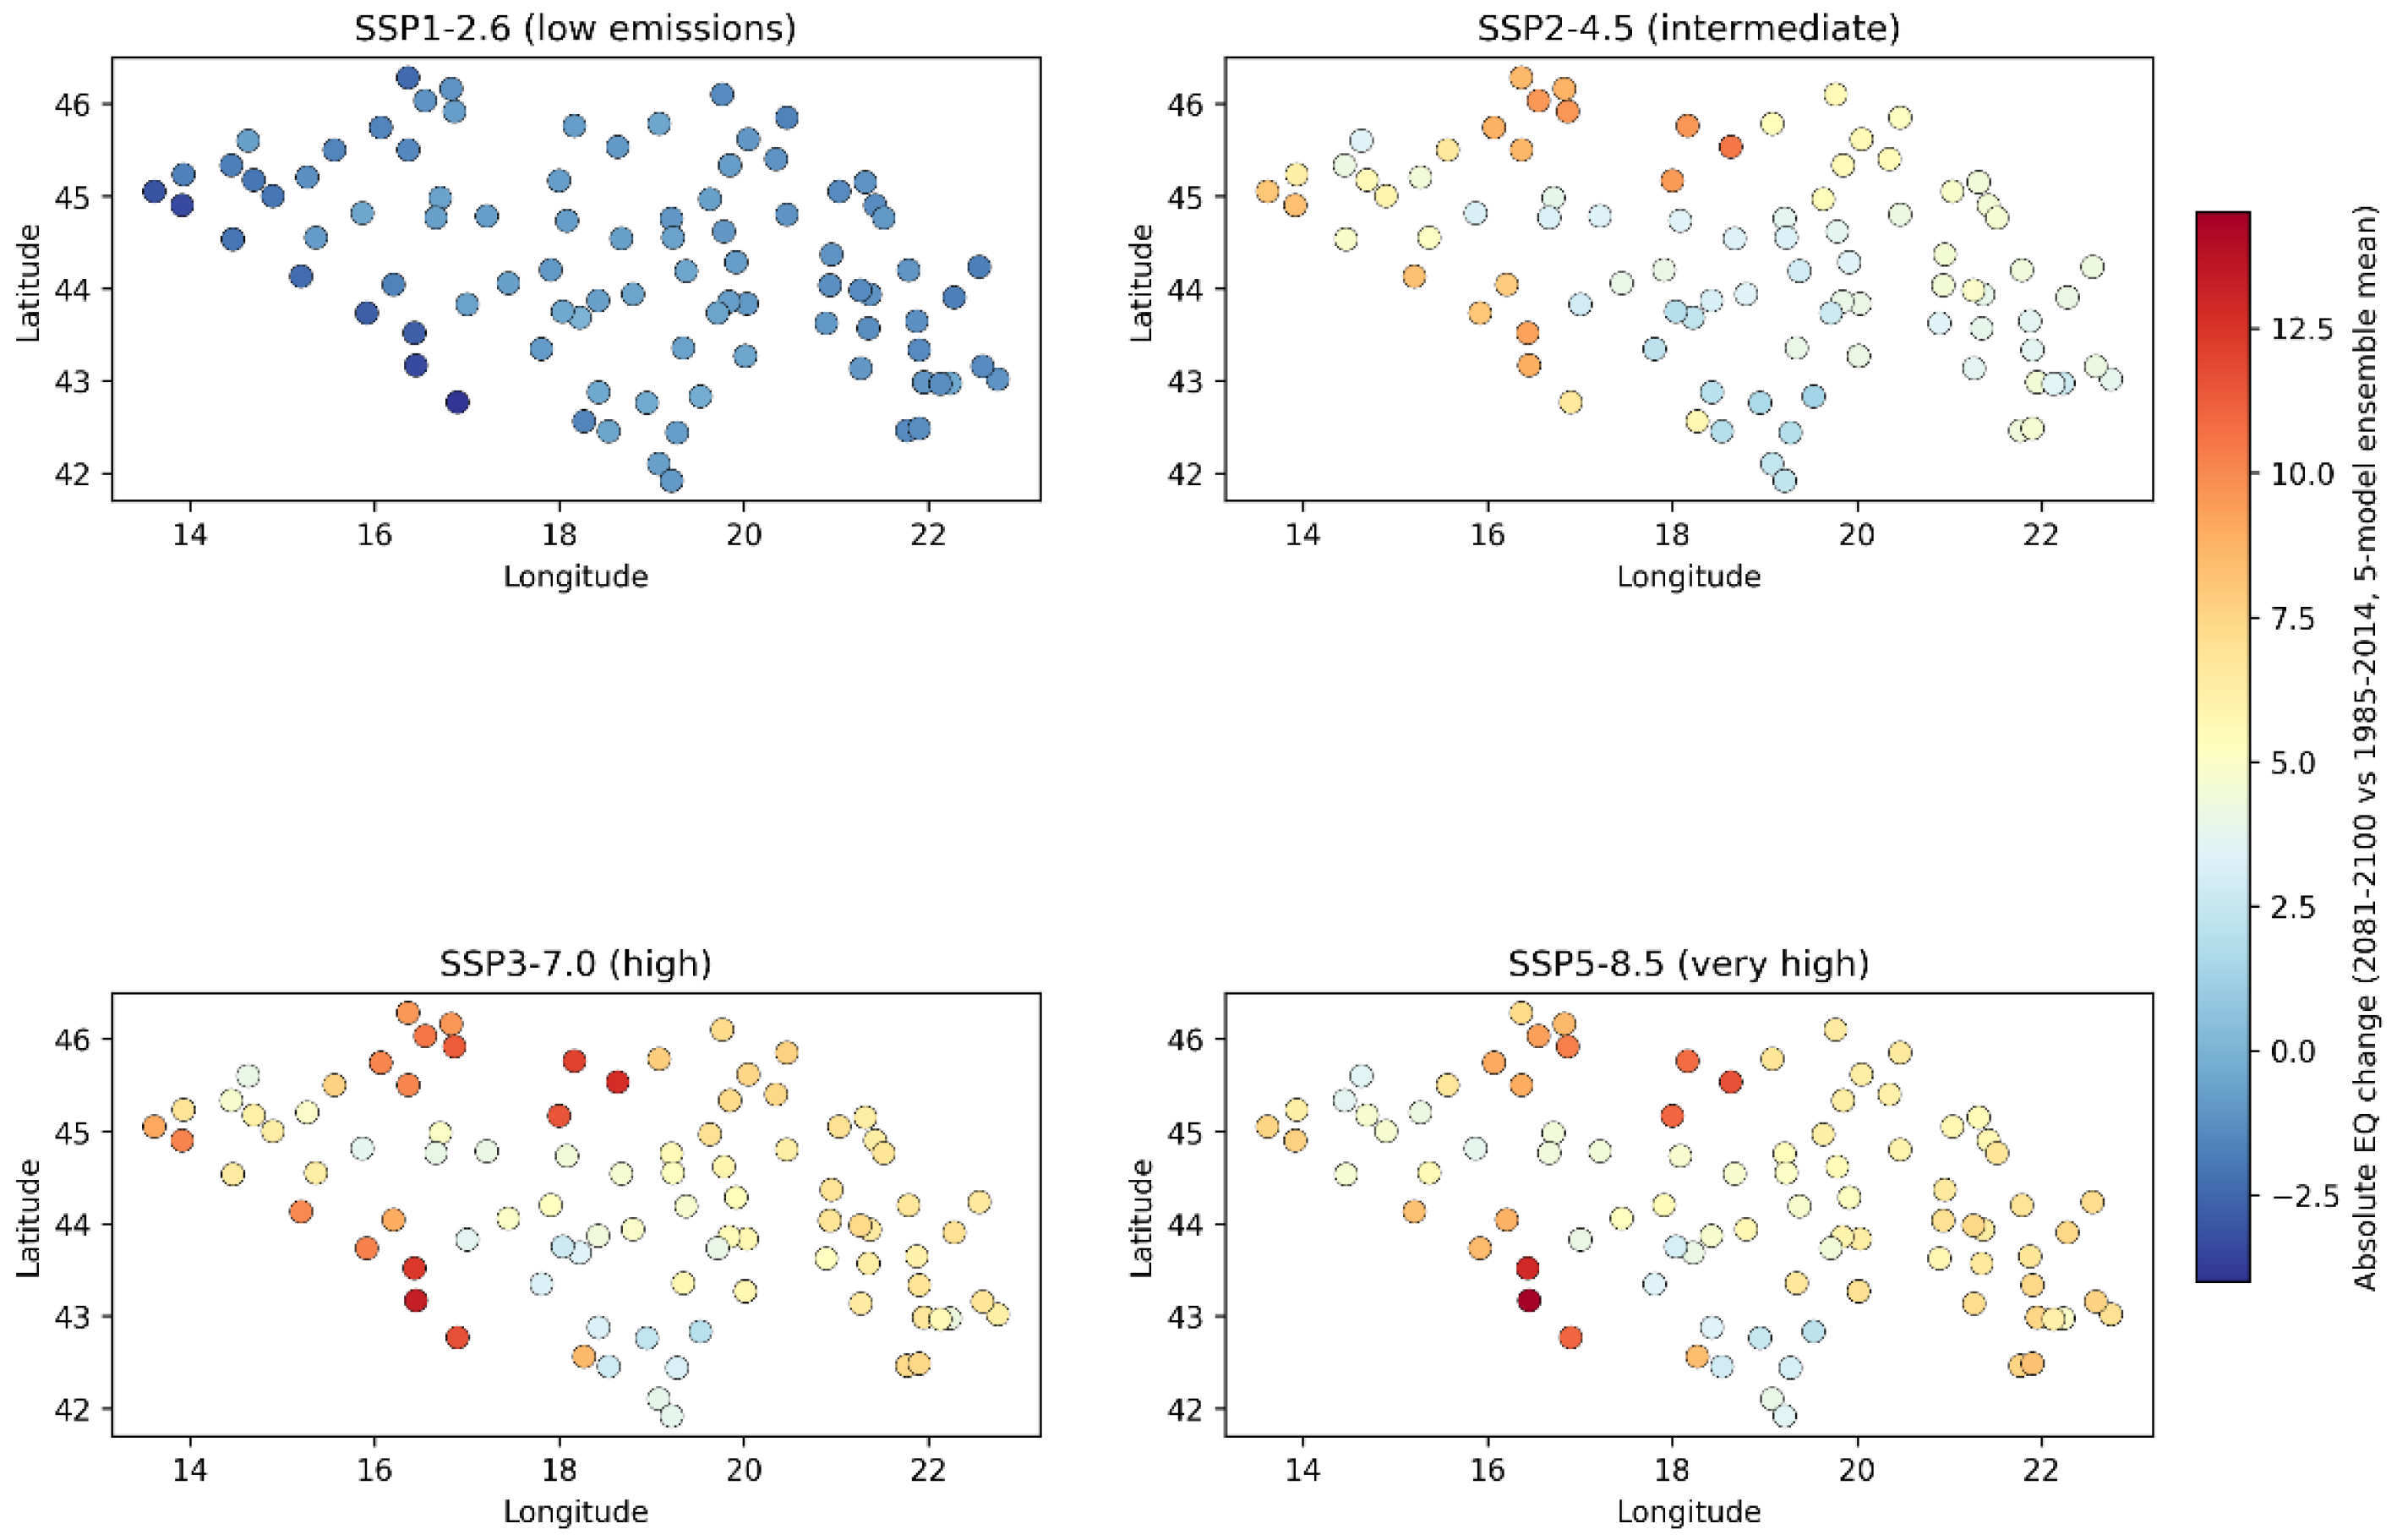
Figure 3.
Decadal mean EQ trajectory by country and scenario, 1850–2100 (single-model, EC-Earth3, retained for continuity with the temporal-trajectory visualisation; ensemble spread is shown in Figure 4).
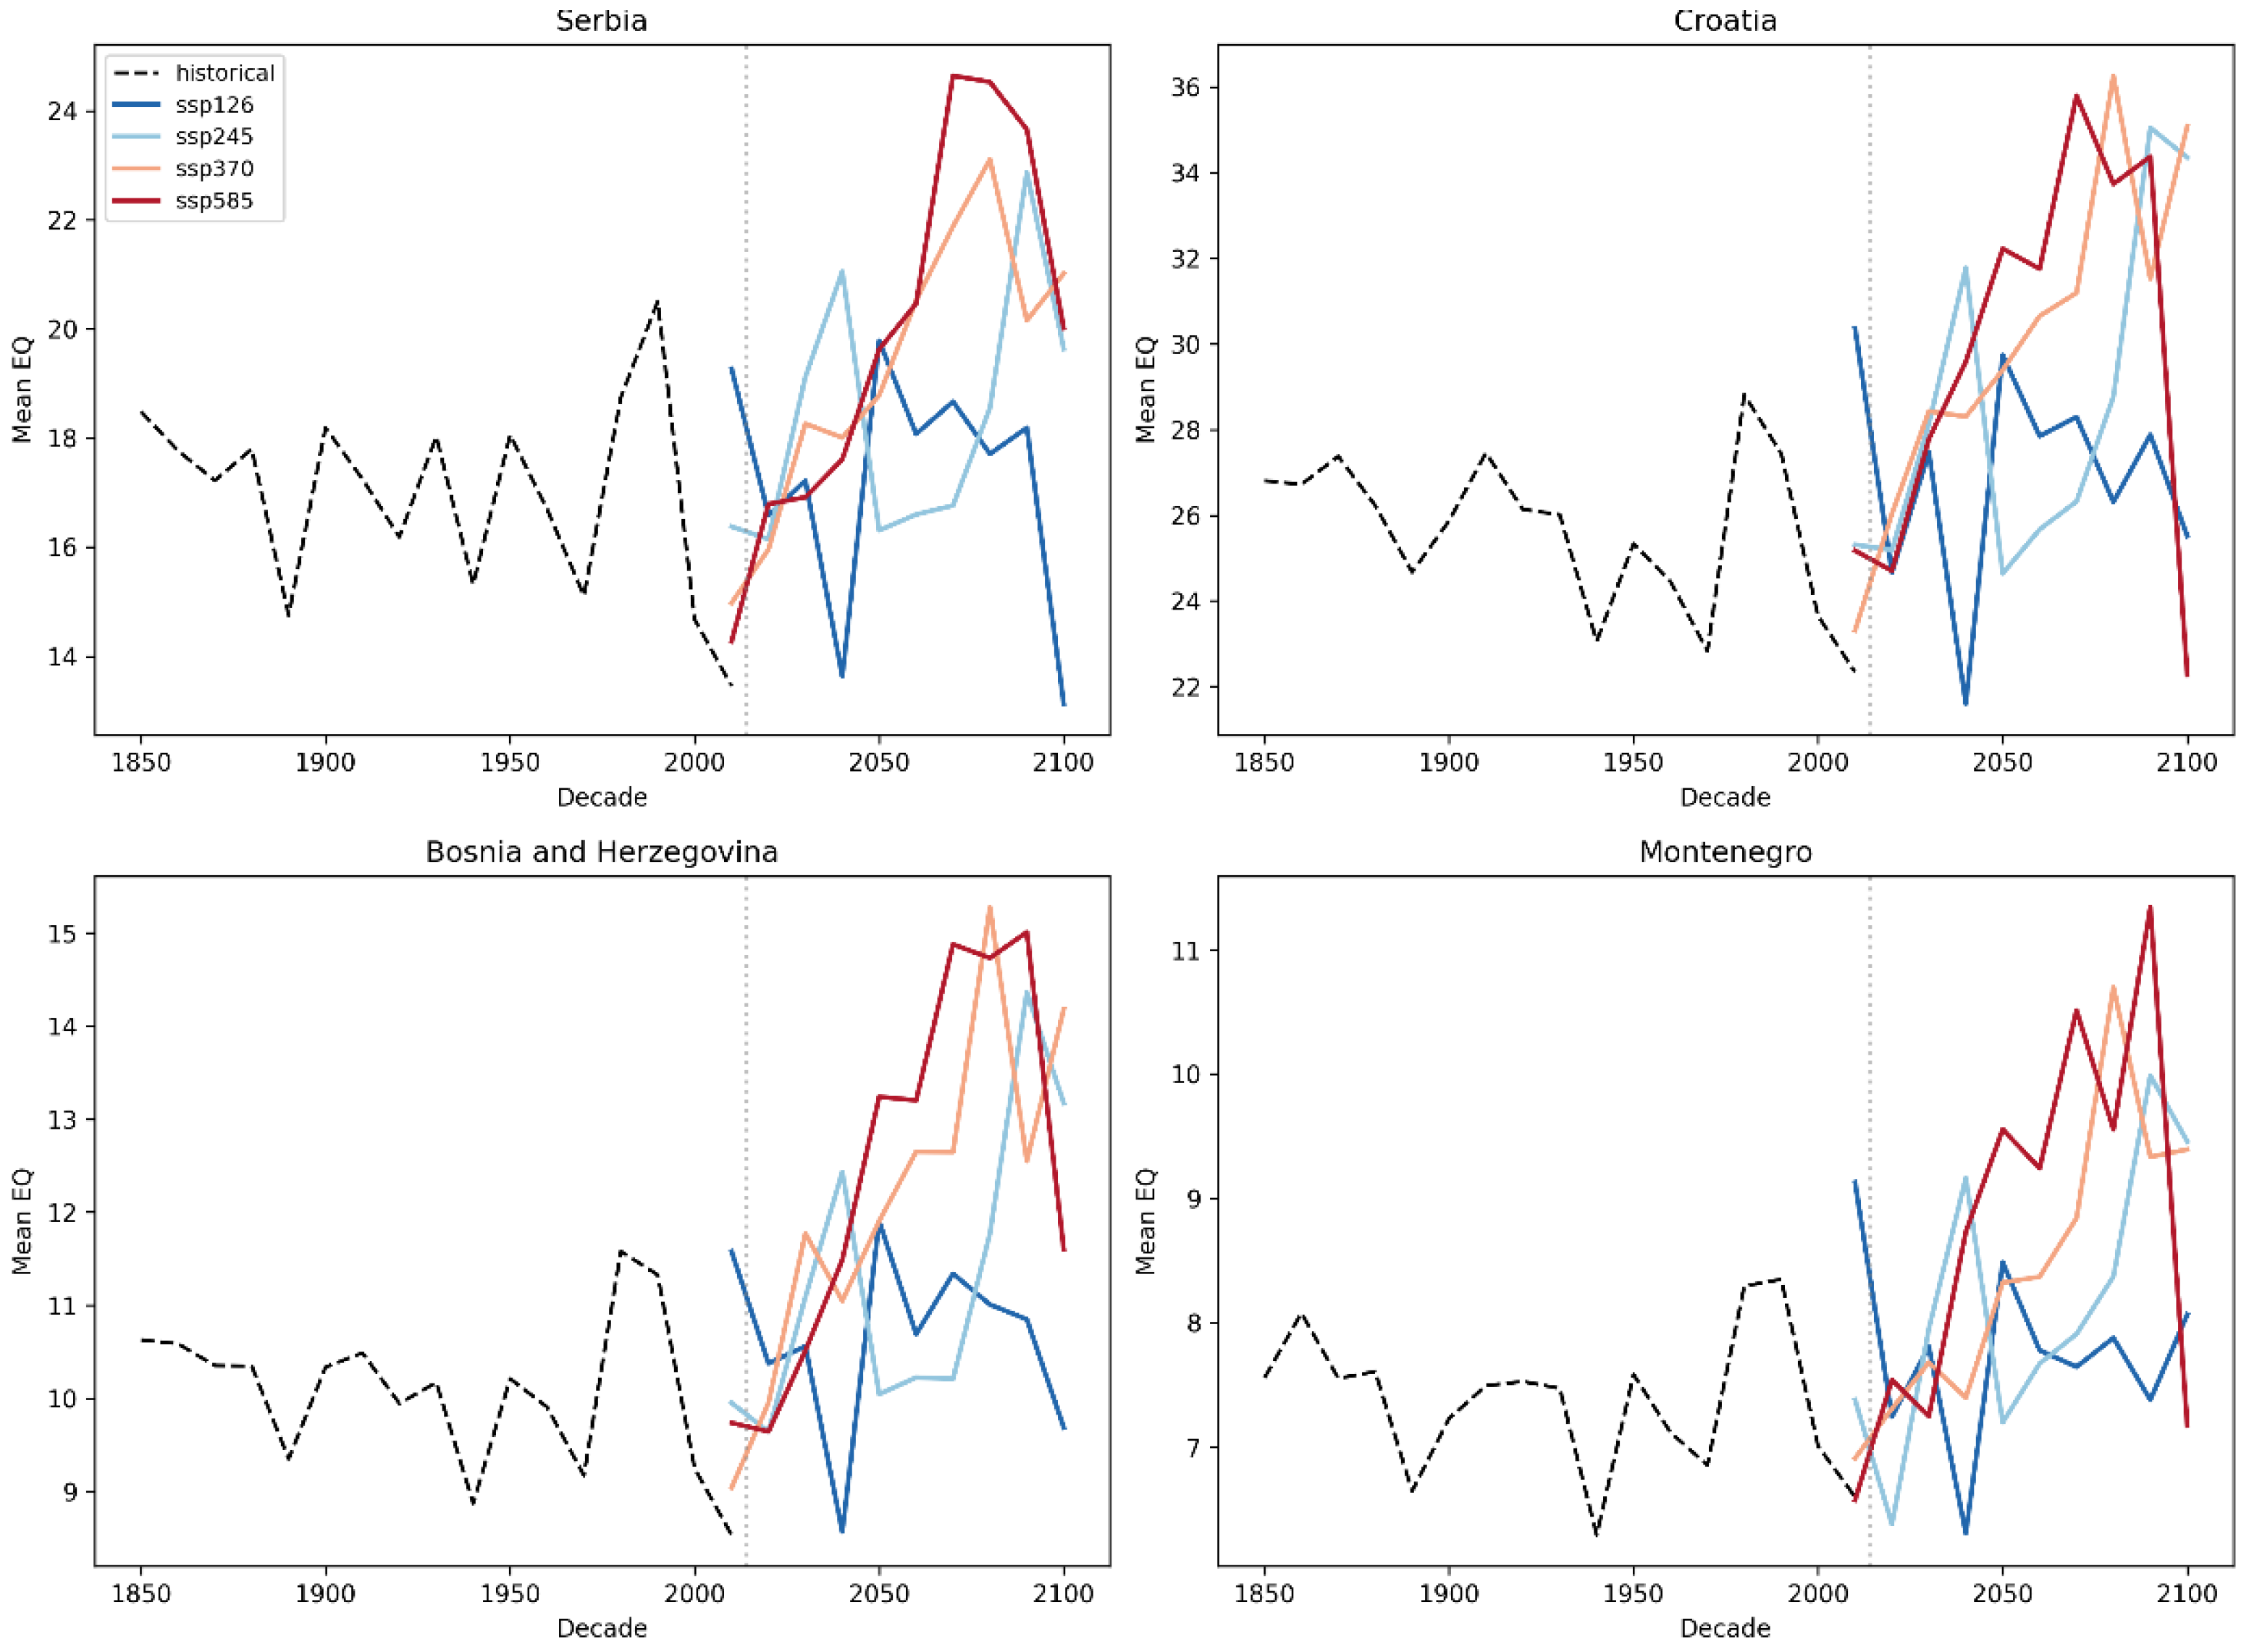
Figure 4.
Five-model CMIP6 ensemble: decadal mean EQ (regional average across all 100 stations) with inter-model 95% bootstrap confidence interval shading (1000 resamples across five GCMs), by SSP scenario, 1850–2100. The substantial overlap among scenario-specific shaded bands, particularly from the mid-21st century onward, illustrates the dominance of inter-model over inter-scenario uncertainty quantified in Table 3.
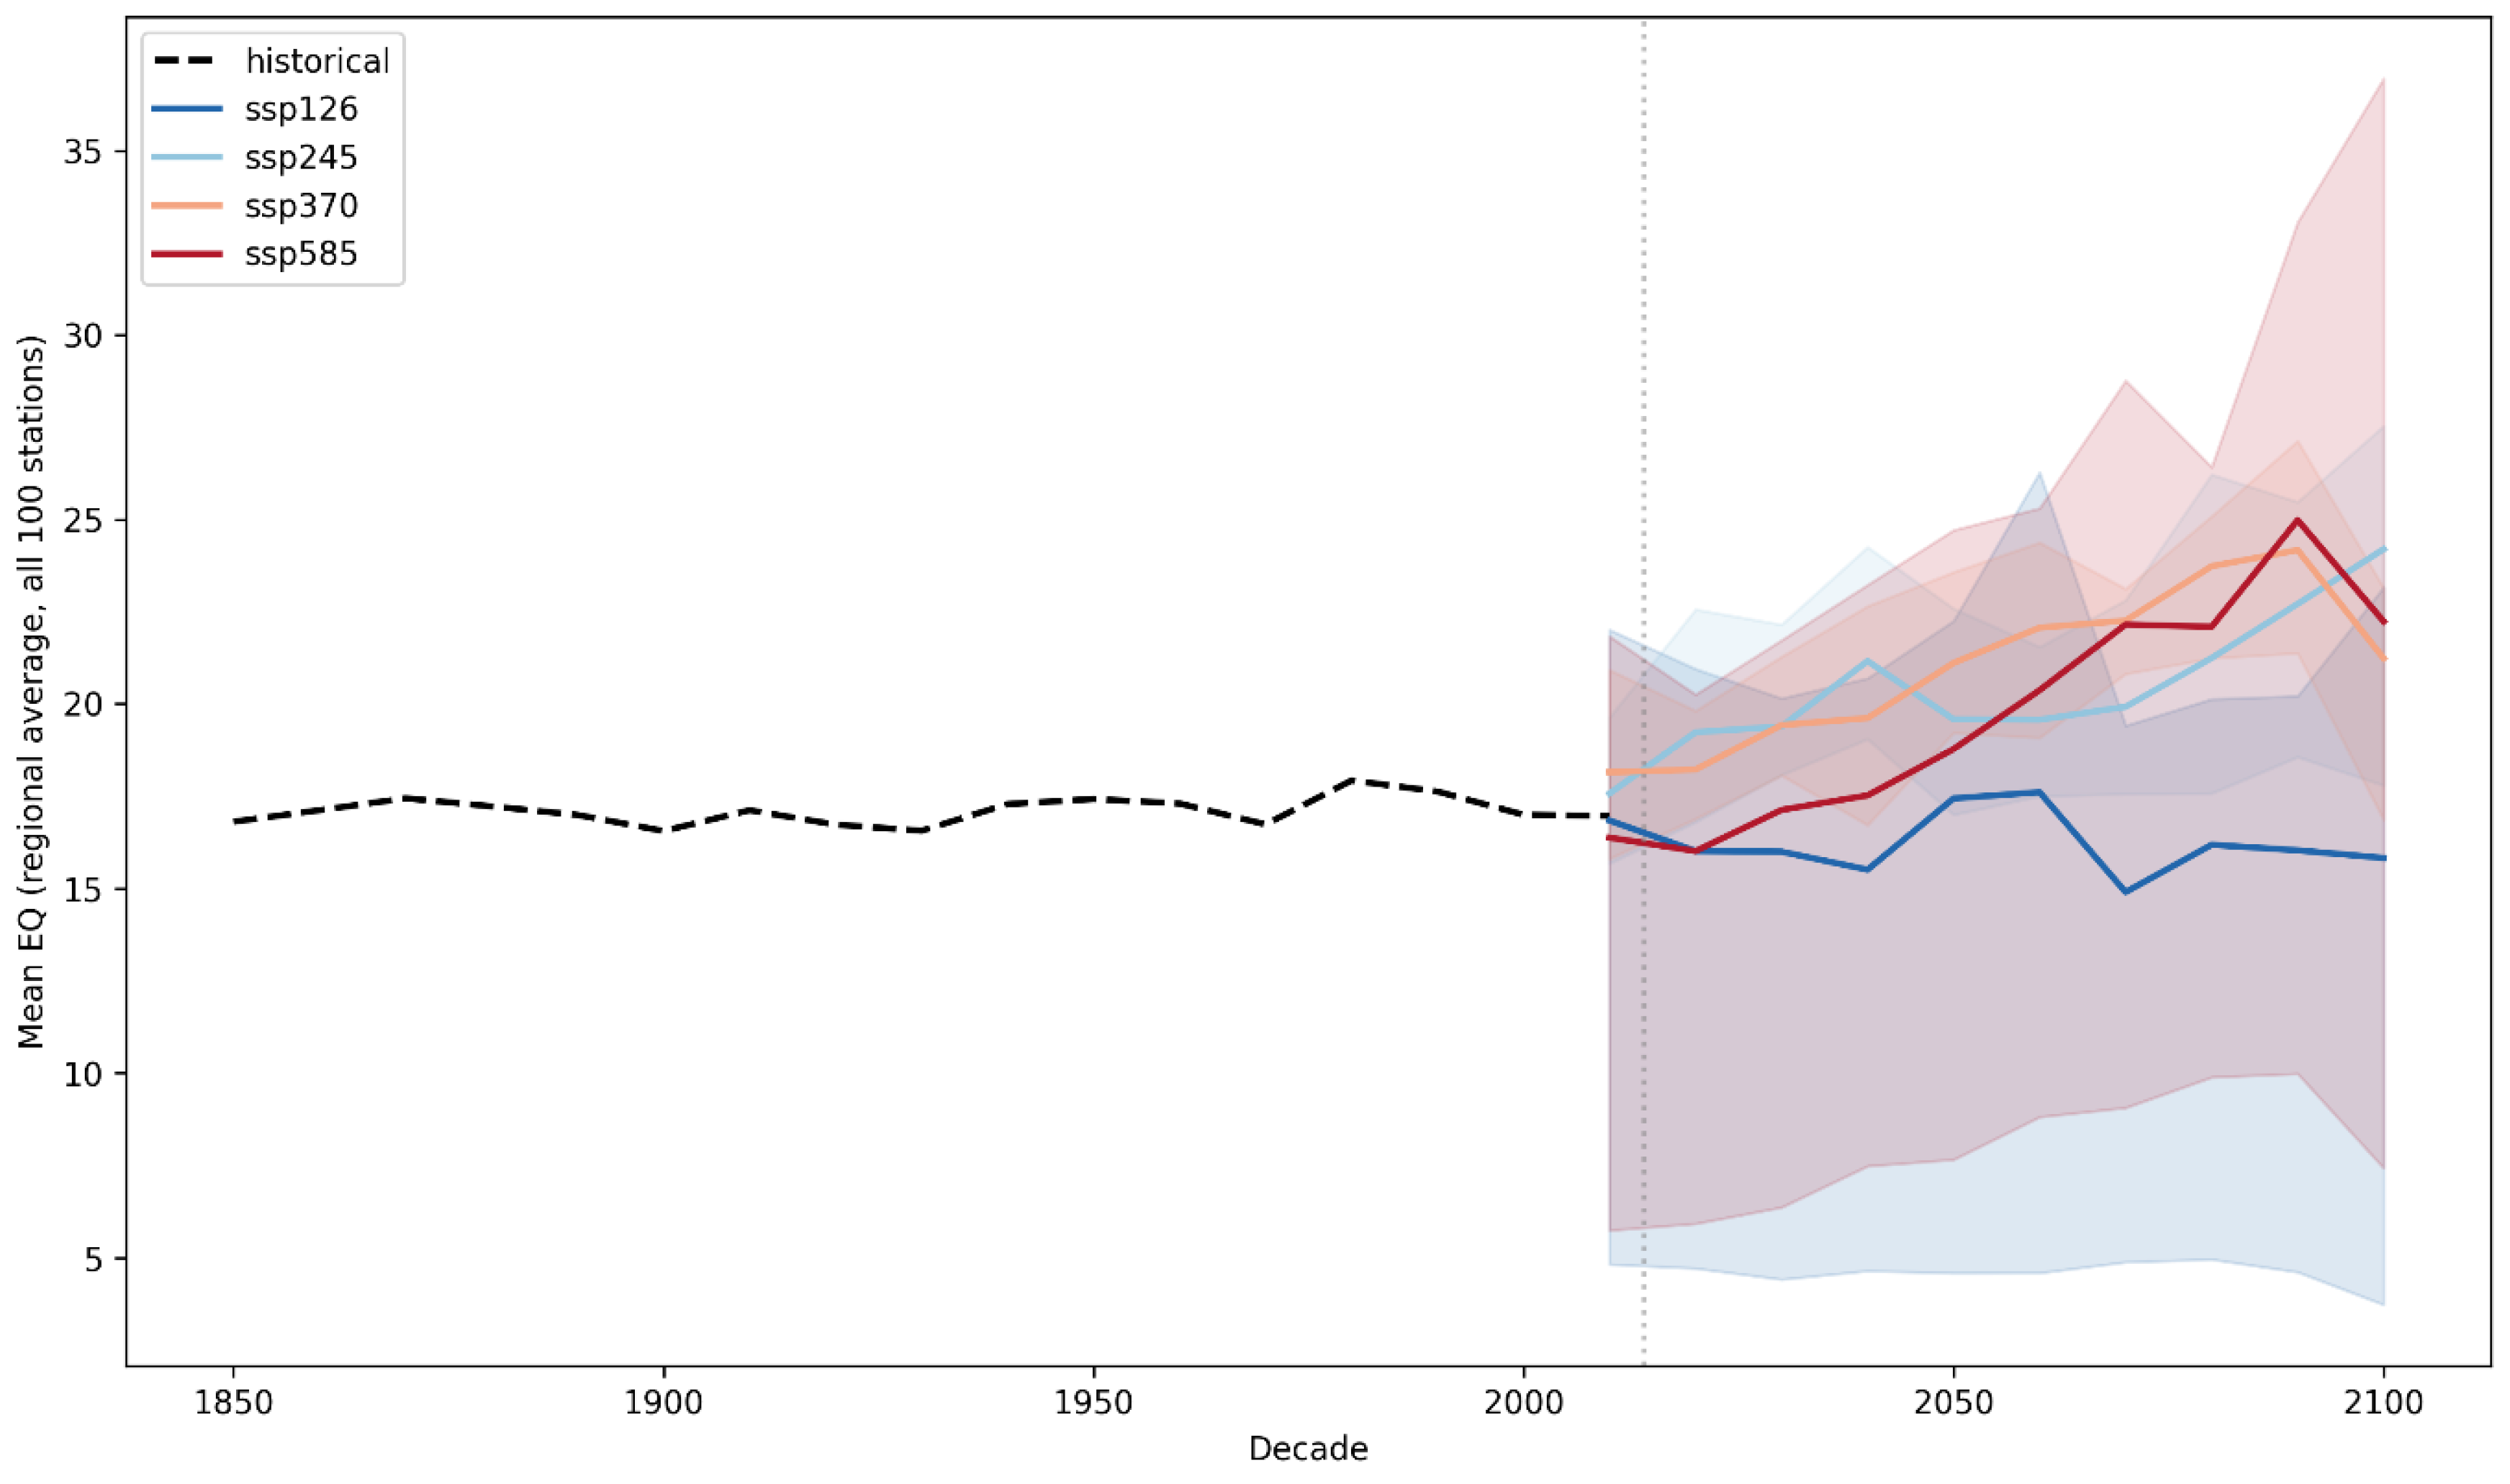
Table 3.
Decomposition of end-of-century (2081–2100) EQ projection uncertainty: inter-scenario vs. inter-model standard deviation, averaged across 100 stations.
Notably, the ensemble mean increase under SSP3-7.0 slightly exceeds that under SSP5-8.5 for Croatia (+36.4% vs. +32.2%)—a non-monotonic ordering with respect to nominal emission intensity that would not be apparent from a single-model analysis and that directly reflects the substantial inter-model structural uncertainty quantified in Section 3.3. For the remaining three countries (Serbia, Bosnia and Herzegovina, Montenegro), the ordering across scenarios remains monotonic, with SSP5-8.5 producing the largest projected increase, as would be expected given its higher nominal radiative forcing. This finding does not indicate that SSP3-7.0 represents a more severe forcing pathway than SSP5-8.5 in general; rather, it illustrates that, for Croatia specifically within this particular five-model ensemble, inter-model differences in regional climate sensitivity are large enough to occasionally outweigh the difference in forcing between these two adjacent high-emission scenarios, underscoring the value of a multi-model rather than single-model ensemble for this kind of regional assessment.
When expressed as absolute EQ change rather than percentage change, the spatial pattern (Figure 2) showed the largest increases concentrated in the Pannonian lowlands of northern Croatia and at several continental stations in Bosnia and Herzegovina, broadly consistent with the single-model pattern reported in our earlier analysis and with the independent, observationally derived trend results in Section 3.1. Under SSP1-2.6, the ensemble mean projected widespread, spatially consistent EQ decreases (i.e., slight wetting) across virtually the entire station network, a markedly different spatial signature from the higher-emission scenarios.
3.3. Inter-Model and Inter-Scenario Uncertainty
Inter-model (structural) and inter-scenario uncertainty were compared using the descriptive decomposition described in Section Multi-Model Ensemble and Uncertainty Decomposition. Averaged across all 100 stations for the 2081–2100 period, the inter-model standard deviation of EQ (7.47 EQ units) exceeded the inter-scenario standard deviation (3.68 EQ units) by a factor of approximately two (Table 3; Figure 4). This indicates that, for this region and metric, structural differences among the five GCMs contribute more to overall projection uncertainty than the choice of emission scenario—a finding that contrasts with the two-model sensitivity analysis of Stojanović et al. [13], who reported greater than 97% spatial agreement between two GCMs for their study region and variable, and is discussed further in Section 4.1.
3.4. Bias Correction Performance
Bias correction was applied independently to each of the five GCMs (Section 2.5), with mean station-month temperature bias ranging from −0.04 °C (MPI-ESM1-2-HR) to +1.55 °C (EC-Earth3) and mean precipitation ratio ranging from 1.01 (MRI-ESM2-0) to 1.46 (MPI-ESM1-2-HR) across the ensemble (full per-model detail in Supplementary Table S3), indicating that the uncorrected models were, on average, cooler and drier than observations across the study domain, to varying degrees. Following bias correction, the corrected historical EQ correlated with observed EQ over the 1961–2014 overlap period at r = 0.33–0.44 across the five models (CNRM-CM6-1 lowest at r = 0.33; EC-Earth3 highest at r = 0.44). This moderate, rather than near-unity, correlation—consistent across all five models—is in line with the expectation that a single GCM realisation’s internal year-to-year variability is not synchronised with the observed historical record, and that bias correction addresses the systematic (climatological) component of model error rather than its internal stochastic variability.
3.5. Short-Term Forecasting Performance
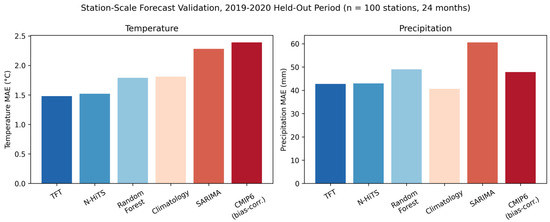
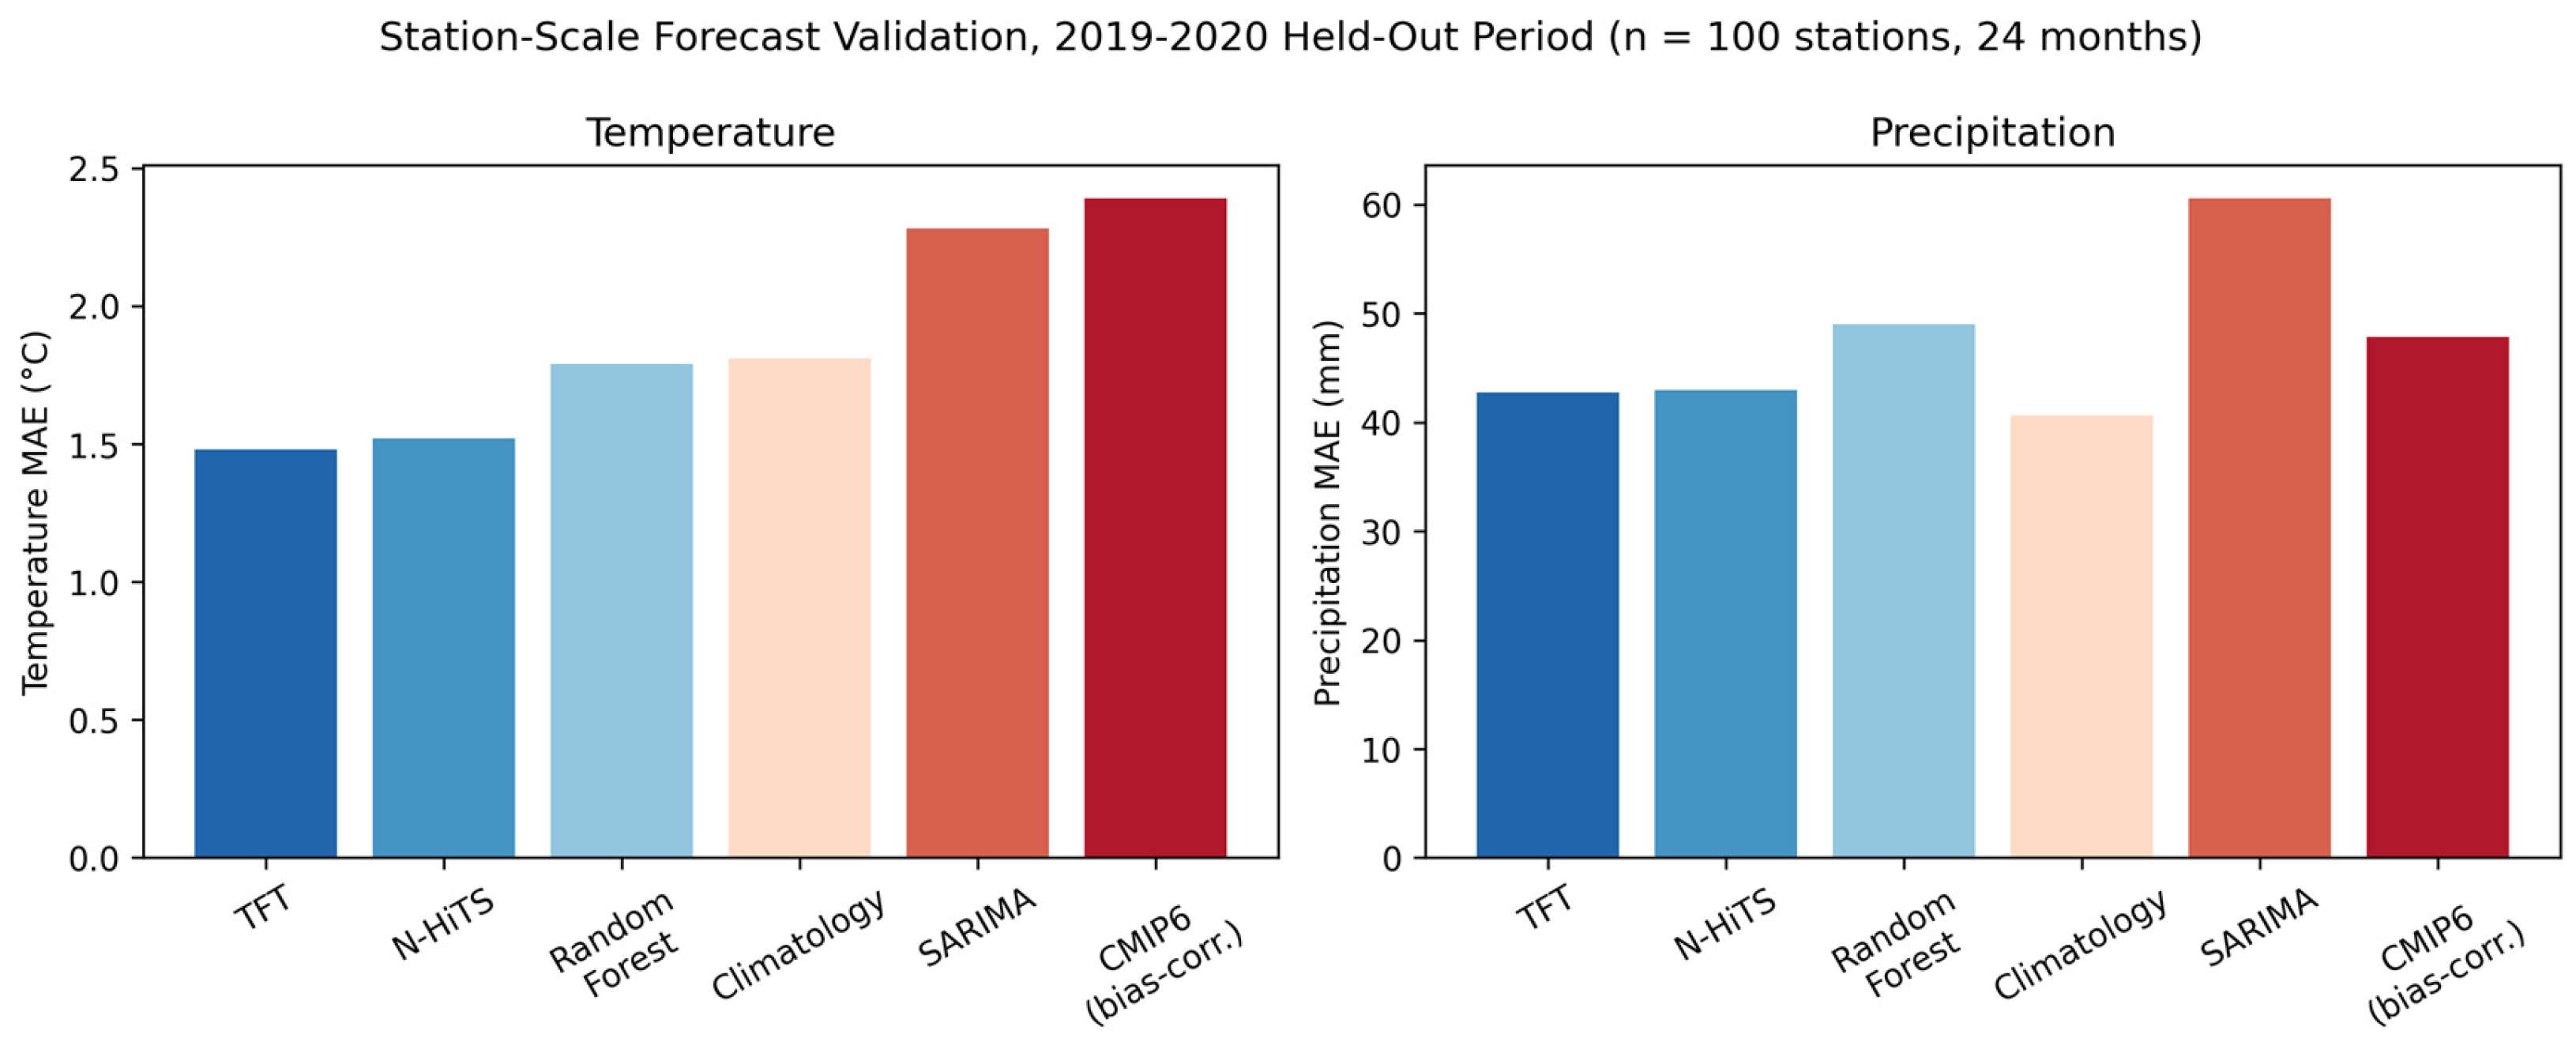
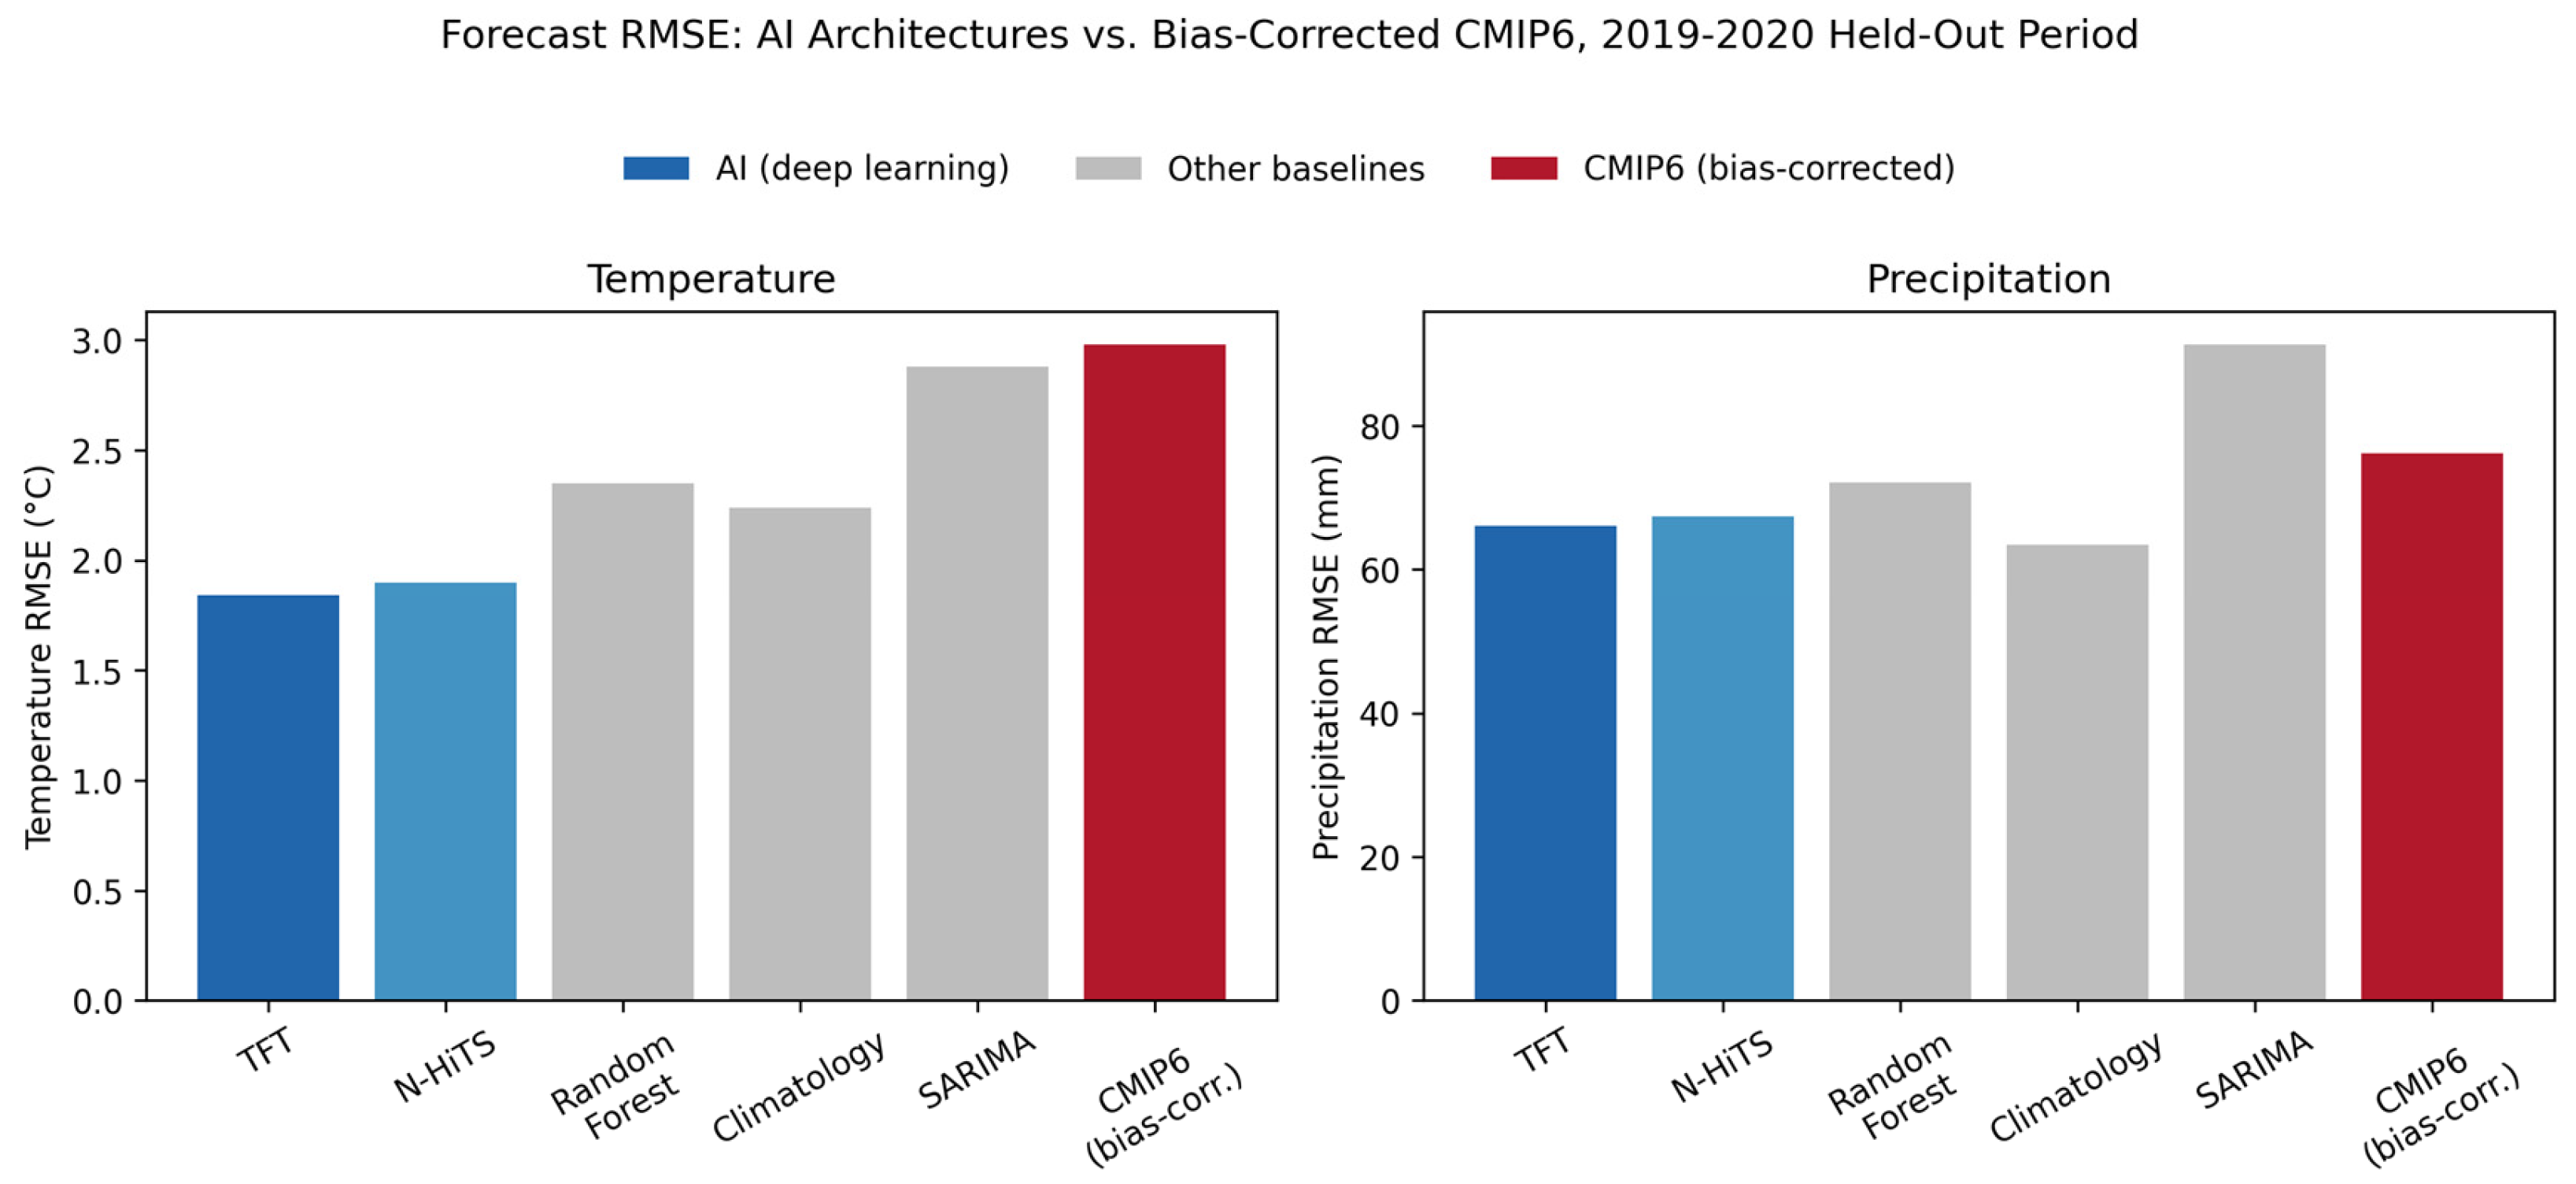
Benchmarking results for the 2019–2020 held-out period (Table 4) showed that, for temperature, both deep learning approaches (TFT, N-HiTS) outperformed the climatological baseline, Random Forest, SARIMA, and the bias-corrected GCM, with the bias-corrected GCM recording the highest (worst) error of all six approaches by both MAE and RMSE. For precipitation, the climatological baseline achieved the lowest error, with TFT and N-HiTS the closest competitors; the bias-corrected GCM ranked fourth of six by MAE—worse than the climatological baseline, TFT, and N-HiTS, but better than Random Forest and SARIMA—and fifth of six by RMSE, ahead of only SARIMA. The bias-corrected GCM (SSP2-4.5) therefore ranked last among all six approaches for temperature, but only mid-to-lower-table, rather than last, for precipitation; we revise our interpretation accordingly: the GCM’s short-term forecasting disadvantage relative to the AI architectures (Section 4.2 and Section 4.3) is clear and consistent for temperature, but more nuanced for precipitation, where it remains a weaker comparator than climatology and the two AI architectures while still outperforming two of the three remaining classical/ML baselines.
Table 4.
Station-scale forecast validation, 2019–2020 held-out period (n = 100 stations, 24 months).
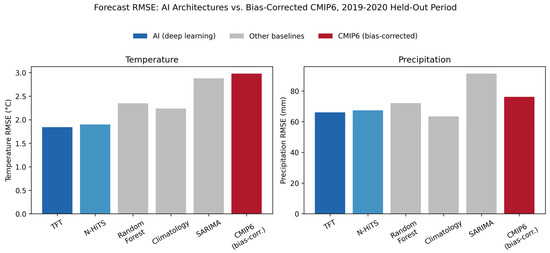
These results indicate that, at the scale of an individual station and over a near-term (one- to two-year) horizon, the bias-corrected GCM output does not provide a competitive forecast relative to either simple statistical baselines or modern deep learning forecasters. Both deep learning architectures (TFT, N-HiTS) were trained with GPU acceleration, a hidden dimensionality of 128 units, and validation-based early stopping (Section 2.9). Station-level Friedman and Diebold-Mariano testing (Supplementary Materials, Section S2) confirmed that these differences are statistically robust rather than attributable to sampling variability, with TFT and N-HiTS showing a significant, essentially one-sided advantage over SARIMA and Random Forest, and a more moderate but still asymmetric advantage over the climatological baseline for temperature; for precipitation, the climatological baseline retained a significant station-level advantage over both AI architectures at a non-trivial minority of stations (16–20%), reinforcing the aggregate pattern in Table 4. A seasonal breakdown (Section S3) further showed that the AI temperature forecasting advantage over climatology was largest during the drought-relevant summer months, whereas no comparable seasonal enhancement was observed for precipitation. The bias-corrected GCM comparator in Table 4 and Figure 5 is EC-Earth3 (SSP2-4.5) specifically. RMSE results (Figure 6) are consistent with the MAE pattern described above. To assess whether this finding was contingent on the choice of GCM, the same bias-correction and validation procedure was repeated for all five ensemble members (Section 2.7.2; full results in Supplementary Table S4). Across the five GCMs, station-scale temperature MAE for 2019–2020 ranged from 1.61 °C (CNRM-CM6-1, the best-performing GCM) to 2.50 °C (MRI-ESM2-0), and precipitation MAE ranged from 47.48 mm (IPSL-CM6A-LR) to 55.24 mm (MPI-ESM1-2-HR). Critically, even the best-performing GCM for each variable remained less accurate than both AI architectures (TFT: 1.48 °C/42.73 mm; N-HiTS: 1.52 °C/42.96 mm), indicating that the station-scale AI advantage reported here is robust to the choice of GCM comparator and is not an artefact of having selected an atypically weak single model. This finding does not call into question the validity of the multi-decadal, scenario-conditioned projections presented in Section 3.2 and Section 3.6, which depend on the GCM’s representation of the forced climate response to differing emission pathways—a property no purely data-driven, historically trained forecaster can be expected to capture—but it clarifies that GCM output should not be interpreted, or benchmarked, as a short-term station-level forecasting product.
Figure 5.
Station-scale forecast validation MAE by model, 2019–2020 held-out period: temperature (left) and precipitation (right). Models ordered by increasing temperature MAE.
Figure 6.
Station-scale forecast validation RMSE, highlighting the contrast between the two AI architectures [TFT (dark blue), N-HiTS (light blue)], other statistical/ML baselines (grey), and the bias-corrected CMIP6 comparator (red). For temperature, both AI architectures achieve the lowest RMSE of all six approaches, with CMIP6 the highest; for precipitation, the AI architectures occupy an intermediate position, with the climatological baseline lowest and SARIMA highest.
3.6. SHAP Attribution of Projected EQ
The XGBoost attribution model achieved a held-out R2 of 0.83, confirming that the selected predictors (year, SSP experiment, latitude, longitude, elevation, country) capture the great majority of variance in projected station-year EQ. SHAP analysis (Supplementary Materials, Figures S1 and S2) confirmed a strictly monotonic, physically consistent relationship between emission scenario intensity and projected aridity contribution—mean SHAP contribution to EQ increased monotonically from −0.95 under SSP1-2.6 to +1.28 under SSP5-8.5—and an accelerating, rather than linear, year effect concentrated after 2050 (mean SHAP rising from near-zero across 1850–2050 to +1.60 in 2050–2100). Geographic location (country, latitude, longitude) was the dominant determinant of a station’s absolute aridity level, consistent with the well-established climatic gradients of the study region, while year and scenario jointly encoded the magnitude of climate-change-driven departure from that baseline.
4. Discussion
4.1. Comparison with Prior Regional Findings
Our station-based results converge with the species distribution modelling findings of Stojanović et al. [13] in identifying the Stara Planina region of eastern Serbia as exhibiting an unusually strong aridification or vulnerability signal, despite the two studies employing entirely independent data sources (direct station observation versus a National Forest Inventory-based SDM ensemble), independent time periods and baselines, and independent climatic variables (direct aridity indices versus species habitat suitability). Stojanović et al. [13] identified Stara Planina as the most climatically vulnerable of six protected mountainous ecosystems under all four SSP scenarios by the 2090s; we find that the same general region exhibits one of the strongest statistically significant observed (1961–2020) aridification trends in our entire 100-station network. This convergence across independent methodologies strengthens confidence that the eastern Serbian Stara Planina region constitutes a genuine regional hotspot of aridification, rather than an artefact specific to either study’s modelling choices.
More broadly, our finding that station-level percentage change in EQ is strongly, negatively confounded by baseline aridity (low-baseline, high-elevation continental stations showing inflated percentage change) is a methodological observation with direct relevance to the broader aridity and species distribution modelling literature, where percentage-based vulnerability rankings are common. We recommend that future regional assessments report absolute, alongside or in preference to percentage, change in aridity indices, particularly when comparing across stations or protected areas with markedly different baseline climates.
A second methodological point of comparison concerns inter-model structural uncertainty. Stojanović et al. [13] conducted a two-GCM sensitivity analysis (CMCC-ESM2 and MPI-ESM1-2-HR) for their study region and reported greater than 97% spatial agreement, concluding that inter-model uncertainty was negligible relative to inter-scenario uncertainty. Our five-model ensemble (Section 3.3) reaches a different conclusion: averaged across our station network, inter-model standard deviation in projected end-of-century EQ (7.47 units) exceeded inter-scenario standard deviation (3.68 units) by a factor of approximately two, and the ensemble mean projected change under SSP3-7.0 slightly exceeded that under the nominally more severe SSP5-8.5 for Croatia specifically (Section 3.2)—an ordering that a two-model comparison would be unlikely to reveal, and that would not arise for the other three countries in our network, where the scenario ordering remained monotonic. This apparent discrepancy is plausibly explained by sample size: a two-model comparison can by chance select a pair of models with unusually similar regional sensitivities, while a five-model ensemble is more likely to capture the genuine range of structural responses found across the CMIP6 multi-model archive. This pattern is consistent with the broader climate science literature on uncertainty decomposition, which has long established that model (structural) uncertainty is frequently comparable to or larger than scenario uncertainty for regional climate variables at multi-decadal lead times [40]. We therefore suggest that two-model sensitivity checks, while a useful and common practical compromise, should be interpreted as a lower bound on—rather than a comprehensive characterisation of—inter-model structural uncertainty, and we recommend that future regional aridity and species distribution modelling studies in this region incorporate ensembles of at least four to five structurally independent GCMs where computationally feasible.
4.2. Why GCM Output Underperforms at the Station Scale: Implications for Projection Interpretation
The GCM underperformance at the station scale over the 2019–2020 hold-out period (Section 3.5) is physically expected and does not undermine the validity of the long-term projections. Single-realisation GCM output is not designed to reproduce the specific year-to-year sequence of observed weather; bias correction removes only systematic (climatological mean) error, leaving internal stochastic variability unsynchronised with observations [40]. This is precisely why the historical EQ correlation is moderate (r = 0.33–0.44) rather than near-unity (Section 3.4). These findings are consistent with the broader literature on the distinction between climate projections and weather or seasonal forecasts [27,41] and reinforce the operational framing of Section 4.3 and Section 4.5: GCM projections are indispensable for multi-decadal strategic planning, while AI-based approaches provide superior near-term station-level skill for operational decisions. To our knowledge, this is the first study to empirically demonstrate this complementarity at the station scale for the Western Balkans.
4.3. Implications for Agriculture and Forestry
The projected EQ increases of 32.2–44.6% by 2081–2100 under SSP5-8.5 across the four study countries (five-model ensemble mean) imply substantially intensified water deficit during the growing season, with direct relevance to rainfed agriculture, which remains dominant across large parts of the Pannonian lowlands of Serbia and Croatia. This pattern is consistent with the broader Mediterranean and sub-Mediterranean literature, where intensifying drought severity has been documented in forest ecosystems under comparable climatic regimes [42], and where projected increases in fire risk under future climate scenarios have long been anticipated across Mediterranean Europe, including the Balkan Mountains [43]. The Mediterranean forestry sector more broadly faces compounding pressures from climate change and population growth, as documented in the most recent State of Mediterranean Forests assessment [44], reinforcing that the Western Balkan aridification signal identified here is part of a wider, well-documented regional climate trajectory rather than an isolated local artefact. The concentration of the strongest absolute aridity increase in precisely the lowland agricultural belt—rather than in the higher-elevation, currently more humid mountain regions—suggests that adaptation planning should prioritise these intensively cultivated lowland areas, including consideration of drought-tolerant cultivar selection, irrigation infrastructure investment, and soil moisture conservation practices, alongside the forest-focused adaptation measures (assisted migration, species composition transition toward thermophilous oaks) recommended for protected mountain ecosystems by Stojanović et al. [13]. Consistent with the complementary-tools framing developed throughout this study, we envisage CMIP6-based scenario projections informing strategic, multi-year adaptation investment (e.g., irrigation infrastructure siting), while AI-based short-term forecasts of the kind benchmarked in Section 3.5 support within-season operational decisions such as planting date selection and irrigation scheduling [45,46].
4.4. Limitations
Several limitations should be considered when interpreting these results. In addition to the methodological limitations described below, the observational record is bounded at 2020 (Section 2.1); the most recent five years (2021–2025), which include record-breaking temperatures and drought events across the region, are therefore not captured in the historical trend analysis and represent a priority for future extension of this work. First, although the five-model ensemble employed here (Section 2.3) substantially improves on a single-GCM analysis and reveals a non-trivial degree of inter-model structural uncertainty (Section 3.3), it remains a single realisation per model; internal (initial-condition) variability, which would require multiple realisations per model to characterise, was not separately assessed and may contribute additional, currently unquantified uncertainty alongside the structural component reported here. Future work should evaluate larger CMIP6 ensembles and multiple realisations per GCM to quantify internal variability separately from structural uncertainty, rather than conflating the two, as the present single-realisation, five-model design does. Second, the descriptive uncertainty decomposition in Section 3.3 is a simplified, station-level comparison of standard deviations rather than a formal ANOVA-based variance partition [27]; it does not account for possible interaction effects between model and scenario and should be interpreted as indicative rather than definitive. Third, the short-term AI forecast validation (Section 3.5) was conducted over a single 24-month held-out window (2019–2020). The use of a single 24-month hold-out window (2019–2020) rather than a rolling-origin cross-validation scheme is a recognised limitation; rolling-origin evaluation across multiple independent windows would provide a more comprehensive characterisation of forecast skill across diverse climatic conditions. However, the consistent performance of both TFT and N-HiTS across all five GCM comparators (Section 2.7.2), together with the statistically confirmed Friedman and Diebold-Mariano results (Supplementary Section S2), suggests that the principal conclusions are unlikely to depend on the specific validation split. Fourth, the percentage-versus-absolute-change artefact described in Section 4.1 affects the interpretation, though not the underlying validity, of station rankings by projected aridity change. Fifth, station coordinate precision varied by data source: 108 of 171 raw series were geolocated from official ECA&D metadata, while the remainder were geocoded from place names, with corresponding precision sufficient for extraction from the comparatively coarse native GCM grids but less precise than would be required for, e.g., extraction from a fine-resolution downscaled product. Sixth, the systematic Sjenica data quality issue identified in Section 2.2, while successfully isolated to a single station and a nine-year window, reduced the effective observational sample size for that station and serves as a reminder of the importance of systematic, automated quality screening—including for within-year constant-value runs—in long, multi-source historical meteorological archives. Seventh, our bias correction approach (Section 2.5) adjusts only the climatological mean of the simulated temperature and precipitation distributions and does not correct higher-order moments (variance, skewness) or the frequency and magnitude of extremes; distribution-wide approaches such as quantile mapping would be required for any secondary application of the bias-corrected output to extreme-value indices, though we consider mean-based correction methodologically adequate for the mean-based aridity indices (EQ, DMI) used throughout this study. Eighth, the station-level trend significance testing in Section 2.6 and Section 3.1 addresses the multiple-comparisons problem across 100 simultaneously tested stations via Benjamini–Hochberg FDR correction and pre-whitens for lag-1 autocorrelation prior to Mann–Kendall testing, but we did not additionally apply a formal field-significance (Monte Carlo spatial-resampling) test, which would provide a complementary, fully spatially aware check on whether the overall number of significant stations exceeds what would be expected under network-wide spatial dependence by chance alone; this is identified as a refinement for future work. Finally, the short-term AI forecast validation in Section 3.5 benchmarked AI models against only two deep learning architectures (TFT, N-HiTS) from a rapidly expanding field. A robustness check repeating the GCM comparison across all five ensemble members (Section 2.7.2; Supplementary Table S4) confirmed that the AI advantage holds regardless of which GCM is used as comparator—the best-performing GCM for each variable remained less accurate than either AI architecture—mitigating the concern that EC-Earth3 might have been an atypically weak benchmark; however, the AI architecture set itself remains limited to two models, and extending this comparison to include PatchTST, TiDE, or xLSTMTime (Section 2.7) is identified as a direction for future work.
4.5. Recommendations for Adaptive Management
Building on the regional conservation and management recommendations of Stojanović et al. [13] for protected forest ecosystems, we recommend, for the predominantly agricultural and lower-elevation landscapes assessed in this study: (i) prioritised drought-risk monitoring and adaptive cultivar/crop selection in the Pannonian lowlands of northern Croatia and Vojvodina, identified here as the zone of greatest absolute projected aridity increase; (ii) continued and expanded station-density monitoring in the eastern Serbian Stara Planina region, identified by both this study and Stojanović et al. [13] as a convergent regional vulnerability hotspot; (iii) explicit recognition, in the design of climate services for agricultural stakeholders, of the distinct and complementary roles of GCM-based scenario projections (appropriate for multi-decadal planning) and data-driven short-term forecasting (appropriate for within-season operational decisions); and (iv) systematic, automated quality control of historical station archives, including screening for the type of within-year constant-value artefact identified at Sjenica, prior to their use in climate trend or impact assessment.
5. Conclusions
This study provides a comprehensive assessment of historical and future aridity dynamics across the Western Balkans by integrating long-term, multi-model climate projections with short-term AI-based forecasting approaches. Historical observations revealed widespread warming across the region, accompanied by significant aridification trends, particularly along the Adriatic coast and in eastern Serbia near the Stara Planina massif. A five-model bias-corrected CMIP6 ensemble consistently indicated further aridification under the three higher-emission scenarios, with the Pannonian lowlands of northern Croatia and Bosnia and Herzegovina identified as the zones of greatest absolute and relative projected change, respectively; under the strong-mitigation SSP1-2.6 pathway, the ensemble mean instead indicated a slight regional wetting trend.
A key methodological finding of this study is that inter-model (structural) uncertainty in projected aridity exceeded inter-scenario uncertainty by approximately a factor of two when assessed across a five-model ensemble—a substantially larger structural uncertainty than would be inferred from a two-model comparison, and consistent with the broader climate science literature on the relative magnitude of model versus scenario uncertainty at regional scales. This finding underscores the importance of multi-model ensembles, rather than single- or dual-model analyses, for robustly characterising regional climate projection uncertainty, and should inform the design of future climate impact assessments in this and comparable regions.
Importantly, the benchmarking analysis demonstrated that modern deep learning architectures, particularly the Temporal Fusion Transformer and N-HiTS models, substantially and statistically robustly outperformed both classical statistical approaches and bias-corrected GCM output for short-term, station-scale temperature forecasting; the bias-corrected GCM recorded the highest error of all six benchmarked approaches for this variable. For precipitation, by contrast, the AI architectures’ advantage over the GCM was more limited: the bias-corrected GCM remained a weaker comparator than climatology and the two AI architectures, though not the weakest baseline overall, while climatology itself remained a genuinely competitive benchmark for the AI models (Section 3.5). These results confirm that AI-based forecasting can already provide actionable climate intelligence for operational agricultural decision-making in the Western Balkans, with the AI advantage over GCM output robust across all five ensemble members.
The findings further demonstrate that physically based climate projections and AI forecasting should be viewed as complementary rather than competing sources of climate information. While multi-model CMIP6 ensembles remain indispensable for assessing long-term climate trajectories and supporting strategic adaptation planning—with explicit attention to structural uncertainty—AI models offer superior predictive skill at the shorter time horizons relevant to operational management.
In summary, this study makes three principal scientific contributions: (i) the first multi-country, five-model CMIP6 aridity projection for the Western Balkans, showing ensemble mean EQ increases of up to +44.6% by 2081–2100 under SSP5-8.5; (ii) the first regional demonstration that inter-model structural uncertainty substantially exceeds inter-scenario uncertainty (factor of ~2), with direct implications for ensemble design in future impact assessments; and (iii) the first empirical delineation of the complementary operational domains of process-based GCM projections (multi-decadal strategic planning) and AI-based forecasting (near-term operational decisions) for the Western Balkans, confirmed robust across all five GCM ensemble members. The Stara Planina region and the Pannonian agricultural lowlands emerge as convergent priority areas for adaptive monitoring and targeted climate services, identified independently by both station-based trend analysis and species distribution modelling [13]. In this region, where climate risks are intensifying and adaptation capacity remains under-resourced relative to projected exposure, the integration of long-term GCM scenario information with near-term AI-based forecasting offers a practical pathway toward evidence-based, climate-smart agricultural and forest management.
Supplementary Materials
The following supporting information can be downloaded at: https://www.mdpi.com/article/10.3390/atmos17080712/s1, Table S1: Station-level Diebold-Mariano test summary: TFT and N-HiTS vs. each benchmark (n = 100 stations, 24-month test window); Table S2: Mean absolute error by season, all five station-level models; Table S3: Mean temperature bias (additive, °C) and precipitation ratio (multiplicative) by GCM, derived from the 1961–2014 observational overlap period.; Table S4: Station-scale forecast validation, all five bias-corrected GCMs (SSP2-4.5) vs. the two AI architectures, 2019–2020 held-out period; Figure S1: SHAP summary (beeswarm) plot for the XGBoost EQ attribution model. Each point represents one station-year-experiment record; horizontal position indicates the SHAP value (impact on predicted EQ), colour indicates the relative magnitude of the underlying feature value (numeric features only; categorical features Country and SSP experiment are shown in grey); Figure S2: SHAP dependence plot for calendar year, coloured by SSP experiment. The near-zero, noisy SHAP contribution throughout the historical period (1850–2014, blue) gives way to a clear positive, scenario-proportional trend after 2015, with the steepest increases under SSP5-8.5 (red) concentrated after approximately 2050.
Author Contributions
Conceptualization, I.D. and D.N.; methodology, D.N.; software, D.N.; validation, I.D., R.S., M.J. and D.N.; investigation, I.D. and D.B.S.; resources, I.D. and D.B.S.; data curation, D.N. and M.J.; writing—original draft preparation, D.N.; writing—review and editing, I.D., D.B.S. and R.S.; visualization, D.N.; supervision, I.D.; project administration, D.B.S. All authors have read and agreed to the published version of the manuscript.
Funding
This research was funded by the Ministry of Science, Technological Development and Innovation of the Republic of Serbia under grant numbers 451-03-33/2026-03/200378, 451-03-33/2026-03/200197 and 451-03-33/2026-03/200032. This research was also funded by the Provincial Secretariat for Higher Education and Scientific Research of AP Vojvodina through the programmes “Long-Term Projects of Importance for the Development of Science and Research in AP Vojvodina (2025–2028)”, within the project “InnoStraMaize—Innovative Strategies for Improving Maize Production in AP Vojvodina” (Grant No. 003870611 2025 09418 003 000 000 001), and “Integrated Projects of Importance for the Development of Scientific Research Activity in AP Vojvodina (2026)”, within the project “Integration of Artificial Intelligence and Digital Humanities in the Development of Social Sciences, Humanities and Education in AP Vojvodina” (Grant No. 002494997 2026 09418 002 000 000 001).
Institutional Review Board Statement
Not applicable. This study is a computational simulation and does not involve human subjects, animals, or any interventional procedures requiring ethical approval.
Informed Consent Statement
Not applicable. This study is a computational simulation study and did not involve human subjects or animals.
Data Availability Statement
The observational meteorological datasets used in this study were obtained from national hydrometeorological archives and publicly available sources (Earth System Grid Federation CMIP6 output; European Climate Assessment & Dataset station metadata). Derived datasets (station-year aridity indices, trend statistics, bias-corrected CMIP6 station-level extractions) and analysis scripts are available from the corresponding author upon reasonable request, subject to the approval of the Institute for Information Technologies, University of Kragujevac and applicable institutional data-sharing regulations. Raw CMIP6 model output is publicly available via the Earth System Grid Federation (https://esgf-node.ornl.gov (accessed on 21 June 2026)).
Acknowledgments
During the preparation of this manuscript, the authors used Claude (Claude Sonnet 5, Anthropic, San Francisco, CA, USA) for code generation and debugging assistance. The authors have reviewed and edited the output and take full responsibility for the content of this publication.
Conflicts of Interest
The authors declare no conflicts of interest.
Abbreviations
The following abbreviations are used in this manuscript:
| EQ | Ellenberg Climate Quotient |
| DMI | De Martonne Aridity Index |
| CMIP6 | Coupled Model Intercomparison Project, Phase 6 |
| SSP | Shared Socioeconomic Pathway |
| GCM | General Circulation Model (Global Climate Model) |
| ESGF | Earth System Grid Federation |
| ECA&D | European Climate Assessment & Dataset |
| AI | Artificial Intelligence |
| ML | Machine Learning |
| TFT | Temporal Fusion Transformer |
| N-HiTS | Neural Hierarchical Interpolation for Time Series Forecasting |
| SARIMA | Seasonal Autoregressive Integrated Moving Average |
| XGBoost | Extreme Gradient Boosting |
| SHAP | SHapley Additive exPlanations |
| MAE | Mean Absolute Error |
| RMSE | Root Mean Square Error |
| R2 | Coefficient of Determination |
| IPCC | Intergovernmental Panel on Climate Change |
References
- IPCC. Climate Change 2022: Impacts, Adaptation and Vulnerability; Contribution of Working Group II to the Sixth Assessment Report of the Intergovernmental Panel on Climate Change; Cambridge University Press: Cambridge, UK, 2022. [Google Scholar]
- Masson-Delmotte, V.; Zhai, P.; Pirani, A.; Connors, S.L.; Péan, C.; Berger, S.; Caud, N.; Chen, Y.; Goldfarb, L.; Gomis, M.I.; et al. (Eds.) Climate Change 2021: The Physical Science Basis. In Contribution of Working Group I to the Sixth Assessment Report of the Intergovernmental Panel on Climate Change; Cambridge University Press: Cambridge, UK, 2021. [Google Scholar]
- European Environment Agency. European Climate Risk Assessment (EUCRA); EEA Report No 1/2024; EEA: Copenhagen, Denmark, 2024. [Google Scholar]
- Cos, J.; Doblas-Reyes, F.; Jury, M.; Marcos, R.; Bretonnière, P.A.; Samsó, M. The Mediterranean climate change hotspot in the CMIP5 and CMIP6 projections. Earth Syst. Dyn. 2022, 13, 321–340. [Google Scholar] [CrossRef] [Scilit]
- Giorgi, F. Climate change hot-spots. Geophys. Res. Lett. 2006, 33, L08707. [Google Scholar] [CrossRef] [Scilit]
- Giorgi, F.; Lionello, P. Climate change projections for the Mediterranean region. Glob. Planet. Change 2008, 63, 90–104. [Google Scholar] [CrossRef] [Scilit]
- Tošić, I.; Unkašević, M.; Putniković, S. Observed changes in precipitation extremes in Serbia under recent climate variability. Atmosphere 2025, 16, 436. [Google Scholar] [CrossRef] [Scilit]
- Hrnjak, I.; Lukić, T.; Gavrilov, M.B.; Marković, S.B.; Unkašević, M.; Tošić, I. Aridity in Vojvodina, Serbia. Theor. Appl. Climatol. 2014, 115, 323–332. [Google Scholar]
- Gavrilov, M.B.; An, W.; Xu, C.; Radaković, M.G.; Hao, Q.; Yang, F.; Guo, Z.; Perić, Z.; Gavrilov, G.; Marković, S.B. Independent aridity and drought pieces of evidence based on meteorological data and tree ring data in Southeast Banat, Vojvodina, Serbia. Atmosphere 2019, 10, 586. [Google Scholar] [CrossRef] [Scilit]
- Milentijević, N.; Bačević, N.; Ristić, D.; Valjarević, A.; Pantelić, M.; Kićović, D. Application of Mann-Kendall (MK) test in trend analysis of air temperature and precipitation: Case of Mačva district (Serbia). Univ. Thought Publ. Nat. Sci. 2020, 10, 37–43. [Google Scholar] [CrossRef] [Scilit]
- Radaković, G.M.; Tošić, A.I.; Bačević, R.N.; Mlađan, D.; Marković, S.B.; Gavrilov, M.B. The analysis of aridity in Central Serbia from 1949–2015. Theor. Appl. Climatol. 2018, 133, 887–898. [Google Scholar]
- Ugarković, D.; Ugarković, N.K. Changes and trends of climate elements and indices in the region of Mediterranean Croatia. J. Cent. Eur. Agric. 2013, 14, 236–249. [Google Scholar] [CrossRef] [Scilit]
- Stojanović, D.B.; Stojsavljević, R.; Pavkov, S.D.; Tenji, D.; Djalović, I.; Vidović, D.; Simović, S.; Radaković, N.; Višacki, V. Impact of Climate Change on Tree Species Distribution and Vulnerability in Key Protected Forest Ecosystems in Serbia. Forests 2026, 17, 469. [Google Scholar] [CrossRef] [Scilit]
- Stojanović, D.B.; Kržič, A.; Matović, B.; Orlović, S.; Duputie, A.; Djurdjević, V.; Galić, Z.; Stojnić, S. Prediction of the European beech (Fagus sylvatica L.) xeric limit using a regional climate model: An example from southeast Europe. Agric. For. Meteorol. 2013, 176, 94–103. [Google Scholar] [CrossRef] [Scilit]
- Vicente-Serrano, S.M.; Beguîría, S.; López-Moreno, J.I. A multiscalar drought index sensitive to global warming: The Standardized Precipitation Evapotranspiration Index. J. Clim. 2010, 23, 1696–1718. [Google Scholar] [CrossRef] [Scilit]
- Klein Tank, A.M.G.; Wijngaard, J.B.; Können, G.P.; Böhm, R.; Demarée, G.; Gocheva, A.; Mileta, M.; Pashiardis, S.; Hejkrlik, L.; Kern-Hansen, C.; et al. Daily dataset of 20th-century surface air temperature and precipitation series for the European Climate Assessment. Int. J. Climatol. 2002, 22, 1441–1453. [Google Scholar] [CrossRef] [Scilit]
- Eyring, V.; Bony, S.; Meehl, G.A.; Senior, C.A.; Stevens, B.; Stouffer, R.J.; Taylor, K.E. Overview of the Coupled Model Intercomparison Project Phase 6 (CMIP6) experimental design and organization. Geosci. Model Dev. 2016, 9, 1937–1958. [Google Scholar] [CrossRef] [Scilit]
- Döscher, R.; Acosta, M.; Alessandri, A.; Anthoni, P.; Arsouze, T.; Bergman, T.; Bernardello, R.; Boussetta, S.; Caron, L.-P.; Carver, G.; et al. The EC-Earth3 Earth system model for the Coupled Model Intercomparison Project 6. Geosci. Model Dev. 2022, 15, 2973–3020. [Google Scholar] [CrossRef] [Scilit]
- Müller, W.A.; Jungclaus, J.H.; Mauritsen, T.; Baehr, J.; Bittner, M.; Budich, R.; Bunzel, F.; Esch, M.; Ghosh, R.; Haak, H.; et al. A higher-resolution version of the Max Planck Institute Earth System Model (MPI-ESM1.2-HR). J. Adv. Model. Earth Syst. 2018, 10, 1383–1413. [Google Scholar] [CrossRef] [Scilit]
- Voldoire, A.; Saint-Martin, D.; Sénési, S.; Decharme, B.; Alias, A.; Chevallier, M.; Colin, J.; Guérémy, J.; Michou, M.; Moine, M.; et al. Evaluation of CMIP6 DECK experiments with CNRM-CM6-1. J. Adv. Model. Earth Syst. 2019, 11, 2177–2213. [Google Scholar] [CrossRef] [Scilit]
- Yukimoto, S.; Kawai, H.; Koshiro, T.; Oshima, N.; Yoshida, K.; Urakawa, S.; Tsujino, H.; Deushi, M.; Tanaka, T.; Hosaka, M.; et al. The Meteorological Research Institute Earth System Model version 2.0, MRI-ESM2.0: Description and basic evaluation of the physical component. J. Meteorol. Soc. Jpn. 2019, 97, 931–965. [Google Scholar] [CrossRef] [Scilit]
- Boucher, O.; Servonnat, J.; Albright, A.L.; Aumont, O.; Balkanski, Y.; Bastrikov, V.; Bekki, S.; Bonnet, R.; Bony, S.; Bopp, L.; et al. Presentation and evaluation of the IPSL-CM6A-LR climate model. J. Adv. Model. Earth Syst. 2020, 12, e2019MS002010. [Google Scholar] [CrossRef] [Scilit]
- Ellenberg, H. Vegetation Ecology of Central Europe, 4th ed.; Cambridge University Press: Cambridge, UK, 1988. [Google Scholar]
- De Martonne, E. Une nouvelle fonction climatologique: L’indice d’aridité. Meteorologie 1926, 2, 449–458. [Google Scholar]
- Teutschbein, C.; Seibert, J. Bias correction of regional climate model simulations for hydrological climate-change impact studies: Review and evaluation of different methods. J. Hydrol. 2012, 456–457, 12–29. [Google Scholar] [CrossRef] [Scilit]
- Maraun, D.; Widmann, M.; Gutiérrez, J.M.; Kotlarski, S.; Chandler, R.E.; Hertig, E.; Wibig, J.; Huth, R.; Wilcke, R.A.I. VALUE: A framework to validate downscaling approaches for climate change studies. Earth’s Future 2015, 3, 1–14. [Google Scholar] [CrossRef] [Scilit]
- Hawkins, E.; Sutton, R. The potential to narrow uncertainty in regional climate predictions. Bull. Am. Meteorol. Soc. 2009, 90, 1095–1107. [Google Scholar] [CrossRef] [Scilit]
- Kendall, M.G. Rank Correlation Methods; Griffin: London, UK, 1957. [Google Scholar]
- Mann, H.B. Nonparametric tests against trend. Econometrica 1945, 13, 245–259. [Google Scholar] [CrossRef] [Scilit]
- Gocic, M.; Trajkovic, S. Analysis of changes in meteorological variables using Mann-Kendall and Sen’s slope estimator statistical tests in Serbia. Glob. Planet. Change 2013, 100, 172–182. [Google Scholar] [CrossRef] [Scilit]
- Lim, B.; Arik, S.O.; Loeff, N.; Pfister, T. Temporal Fusion Transformers for interpretable multi-horizon time series forecasting. Int. J. Forecast. 2021, 37, 1748–1764. [Google Scholar] [CrossRef] [Scilit]
- Challu, C.; Olivares, K.G.; Oreshkin, B.N.; Garza, F.; Mergenthaler-Canseco, M.; Dubrawski, A. N-HiTS: Neural Hierarchical Interpolation for Time Series Forecasting. Proc. AAAI Conf. Artif. Intell. 2023, 37, 6989–6997. [Google Scholar] [CrossRef] [Scilit]
- Oreshkin, B.N.; Carpov, D.; Chapados, N.; Bengio, Y. N-BEATS: Neural basis expansion analysis for interpretable time series forecasting. In Proceedings of the International Conference on Learning Representations (ICLR), Addis Ababa, Ethiopia, 26–30 April 2020. [Google Scholar]
- Nie, Y.; Nguyen, N.H.; Sinthong, P.; Kalagnanam, J. A time series is worth 64 words: Long-term forecasting with transformers. In Proceedings of the International Conference on Learning Representations (ICLR), Kigali, Rwanda, 1–5 May 2023. [Google Scholar]
- Das, A.; Kong, W.; Leach, A.; Mathur, S.; Sen, R.; Yu, R. Long-term forecasting with TiDE: Time-series dense encoder. arXiv 2023, arXiv:2304.08424. [Google Scholar]
- Alharthi, M.; Mahmood, A. xLSTMTime: Long-Term Time Series Forecasting with xLSTM. AI 2024, 5, 1482–1495. [Google Scholar] [CrossRef] [Scilit]
- Diebold, F.X.; Mariano, R.S. Comparing predictive accuracy. J. Bus. Econ. Stat. 1995, 13, 253–263. [Google Scholar] [CrossRef] [Scilit]
- Chen, T.; Guestrin, C. XGBoost: A scalable tree boosting system. In Proceedings of the 22nd ACM SIGKDD International Conference on Knowledge Discovery and Data Mining, San Francisco, CA, USA, 13–17 August 2016; pp. 785–794. [Google Scholar]
- Lundberg, S.M.; Lee, S.I. A unified approach to interpreting model predictions. Adv. Neural Inf. Process. Syst. 2017, 30, 4768–4777. [Google Scholar]
- Deser, C.; Phillips, A.; Bourdette, V.; Teng, H. Uncertainty in climate change projections: The role of internal variability. Clim. Dyn. 2012, 38, 527–546. [Google Scholar]
- Maraun, D. Bias correcting climate change simulations—A critical review. Curr. Clim. Change Rep. 2016, 2, 211–220. [Google Scholar] [CrossRef] [Scilit]
- Stefanidis, S.; Rossiou, D.; Proutsos, N. Drought Severity and Trends in a Mediterranean Oak Forest. Hydrology 2023, 10, 167. [Google Scholar] [CrossRef] [Scilit]
- Moriondo, M.; Good, P.; Durao, R.; Bindi, M.; Giannakopoulos, C.; Corte-Real, J. Potential impact of climate change on fire risk in the Mediterranean area. Clim. Res. 2006, 31, 85–95. [Google Scholar] [CrossRef] [Scilit]
- FAO; Plan Bleu. State of Mediterranean Forests 2018; FAO: Rome, Italy, 2018. [Google Scholar]
- Munir, A. Artificial Intelligence and Machine Learning for Smart and Sustainable Agriculture. AI 2026, 7, 12. [Google Scholar] [CrossRef] [Scilit]
- Wolfert, S.; Ge, L.; Verdouw, C.; Bogaardt, M.J. Big Data in Smart Farming—A review. Agric. Syst. 2017, 153, 69–80. [Google Scholar] [CrossRef] [Scilit]

Disclaimer/Publisher’s Note: The statements, opinions and data contained in all publications are solely those of the individual author(s) and contributor(s) and not of MDPI and/or the editor(s). MDPI and/or the editor(s) disclaim responsibility for any injury to people or property resulting from any ideas, methods, instructions or products referred to in the content. |
© 2026 by the authors. Licensee MDPI, Basel, Switzerland. This article is an open access article distributed under the terms and conditions of the Creative Commons Attribution (CC BY) license.