


Abstract
Surface soil grain-size distribution (GSD) is a fundamental terminal record of aeolian processes and land-surface erodibility. However, a macro-scale understanding of GSD spatial heterogeneity and its quantitative coupling with seasonal atmospheric circulation dynamics in Central Asia remains insufficient. Based on an extensive dataset of 325 surface soil samples across Kazakhstan, Uzbekistan, Kyrgyzstan, and Tajikistan, this study systematically investigates the GSD patterns and their climatic drivers. Our results reveal a pronounced spatial gradient: coarse-textured soils dominate the northwestern and eastern desert plains, whereas fine-grained sediments are sequestered in the southeastern mountain-basin systems. We demonstrate that this heterogeneity is rigorously governed by seasonal wind regimes: the Siberian High directs coarse particle entrainment and transport during spring, while the mid-latitude westerlies and local topographic modulation (e.g., the Tian Shan and Pamir barriers) control the fine-grained sorting continuum. Furthermore, the desiccated Aral Sea bed serves as a distinctive anthropogenic dust source, perturbing regional natural sorting patterns. These findings provide critical empirical constraints for dust emission modeling and underscore the sensitivity of Central Asian land surfaces to shifting atmospheric circulation patterns.
1. Introduction
Global dust emissions primarily originate from arid and semi-arid regions [1,2,3,4]. As a core component of the global dust belt—alongside the deserts of North Africa and the Arabian Peninsula—Central Asia is located in the interior of the Eurasian continent and features a typical temperate continental arid and semi-arid climate, driven by atmospheric circulation systems such as the westerlies, polar air masses, and the Siberian High—a semi-permanent cold anticyclone that forms over Siberia and the Mongolian Plateau during winter as a result of intense radiative cooling of continental air masses [5,6,7,8,9] (see Section 2.2 for a detailed description). It exhibits significant continentality and aridity, marked by pronounced seasonal and diurnal temperature fluctuations [1,10]. Severe aridity and low precipitation results in sparse vegetation and loose surface soils, providing the essential material basis for aeolian processes. This climatic regime directly shapes the surface landscape in Central Asia, which is dominated by deserts and grasslands, and is characterized by intense wind erosion–deposition processes [11,12], Surface soil acts as the direct “source area” and “transfer station” for aeolian dust emission [13]. While surface soil grain-size distribution serves as a fundamental terminal record of regional wind erodibility, selective transport, and sorting history [14], existing sedimentological observations in this region remain largely localized, point-like, or fragmented [15,16,17]. More importantly, there remains a critical knowledge gap in quantitatively coupling these land-surface sedimentary archives with long-term, multi-decadal seasonal wind vector dynamics.
Extensive research conducted in the Chinese Loess Plateau, the North American Great Plains, and the Sahara Desert has established intrinsic relationships between grain-size parameters and impact factors such as provenance, transport distance, and sedimentary environment [18,19,20,21]. In particular, studies on Chinese loess have demonstrated that the grain-size variability is an indicator of East Asian monsoon intensity, providing critical insights into paleoclimate reconstruction. For Central Asia, although existing studies have preliminarily investigated the grain-size characteristics of surface soil or loess in mountainous regions such as the Tian Shan and Pamir Plateau [15,16,17], these observations are mostly constrained to “point-like” or “belt-like” patterns, leaving the broad-scale spatial heterogeneity across the vast arid interior largely unexplored.
To interpret wind fields and dust transport pathways, methods such as resultant drift potential (RDP) [22] and HYSPLIT-based backward trajectory analysis [23] have been widely employed to quantify net wind direction and link dust deposition areas with potential sources, such as the Aral Sea and the Karakum Desert. However, these climatological studies have mostly focused on the macro-scale identification of dust source–sink relationships or the reconstruction of specific dust storm events [8,16]. A significant knowledge gap persists regarding the in-depth, quantitative correlation analysis on how surface soil grain size as a “terminal record” and the complex seasonal wind dynamics vary across different directions. Therefore, this study integrates a transnational dataset of 325 surface soil samples collected through six comprehensive field campaigns across Kazakhstan, Uzbekistan, Kyrgyzstan, and Tajikistan with a 75-year (1950–2025) high-resolution ERA5 reanalysis wind field database. Our objective is to reveal the macroscopic differentiation patterns of surface soil grain size and their quantitative responses to dominant seasonal wind regimes, systematically revealing the grain-size differentiation patterns and their controlling mechanisms across different geomorphological units (deserts, basins, and piedmonts). These results not only advance the theoretical understanding of regional dust source–sink dynamics but also provide essential empirical parameters for optimizing global dust emission budget models and assessing regional ecological security.
2. Study Area and Atmospheric Circulation
2.1. Study Area
Characterized by extensive desert archipelagos and severe aridity, Central Asia stands as one of the most significant global dust source regions [1,2]. Under strong wind conditions, these vast arid tracts continuously release large amounts of mineral dust into the atmosphere [13,24]. This large-scale aeolian activity not only profoundly shapes the regional surface landscape and ecosystems, but also modulates the composition of surface sediments [25,26]. Furthermore, through complex physical, chemical, and biogeochemical processes, dust aerosols exert far-reaching impacts on the regional and even global climate systems, environmental quality, and human health [27].
The topography of Central Asia is highly heterogeneous. Kazakhstan, Uzbekistan, and Turkmenistan are primarily defined by lowland deserts, while Kyrgyzstan and Tajikistan are predominantly mountainous. The regional physiography exhibits a stark contrast between lowland deserts in the west and north and high mountains in the east and south, creating a distinctive elevation gradient from the southwestern lowlands to the northeastern highlands (Figure 1). Most of Kazakhstan and the central-western parts of Uzbekistan consist of vast plains, lowlands, and deserts, encompassing the Turan Lowland, the Caspian coastal plain, and expansive deserts such as the Kyzylkum and Karakum, with elevations predominantly ranging from 100 to 300 m. The low-relief, open terrain facilitates unobstructed airflow. In contrast, Kyrgyzstan and Tajikistan comprise the formidable Tian Shan Mountains and the Pamir Plateau, with average elevations of 3000–4500 m and peaks exceeding 7000 m, forming a critical orographic barrier in Central Asia. Nested between the Tian Shan and the Pamir Plateau lie several intermountain basins, such as the Chu River, Fergana, and Tajik basins. Discontinuous loess deposits are sequestered along the margins of these basins and the piedmont areas on the windward slopes [28].
Figure 1.
Atmospheric circulation, loess and desert distribution [28], and surface soil samples in Central Asia. (The black rectangular area denotes the study domain for Figure 2).
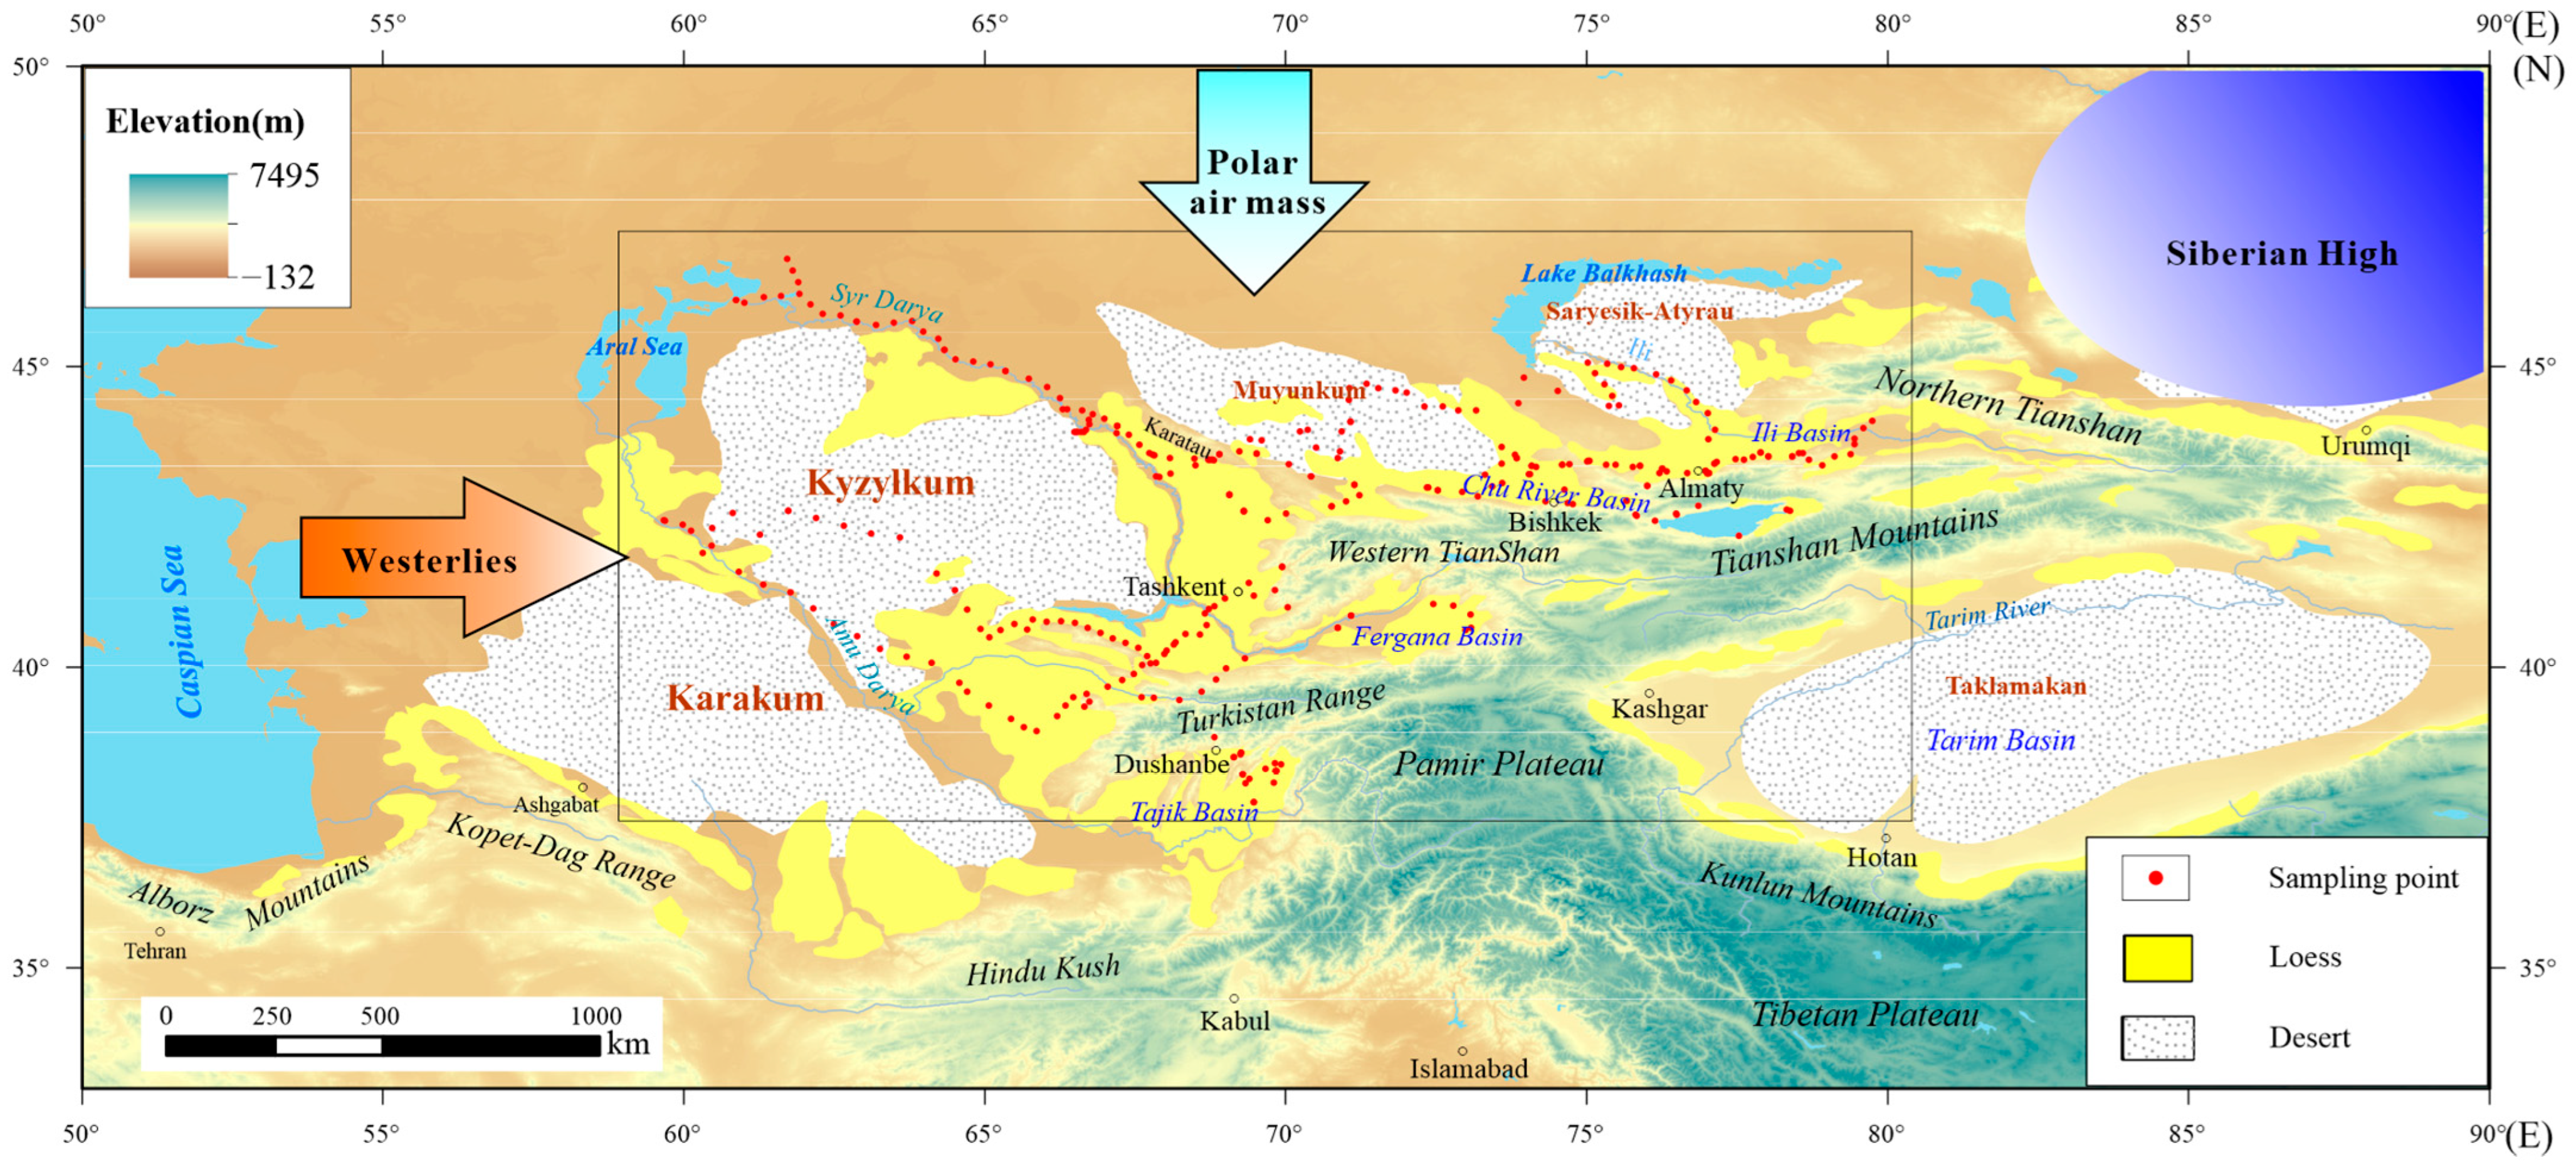
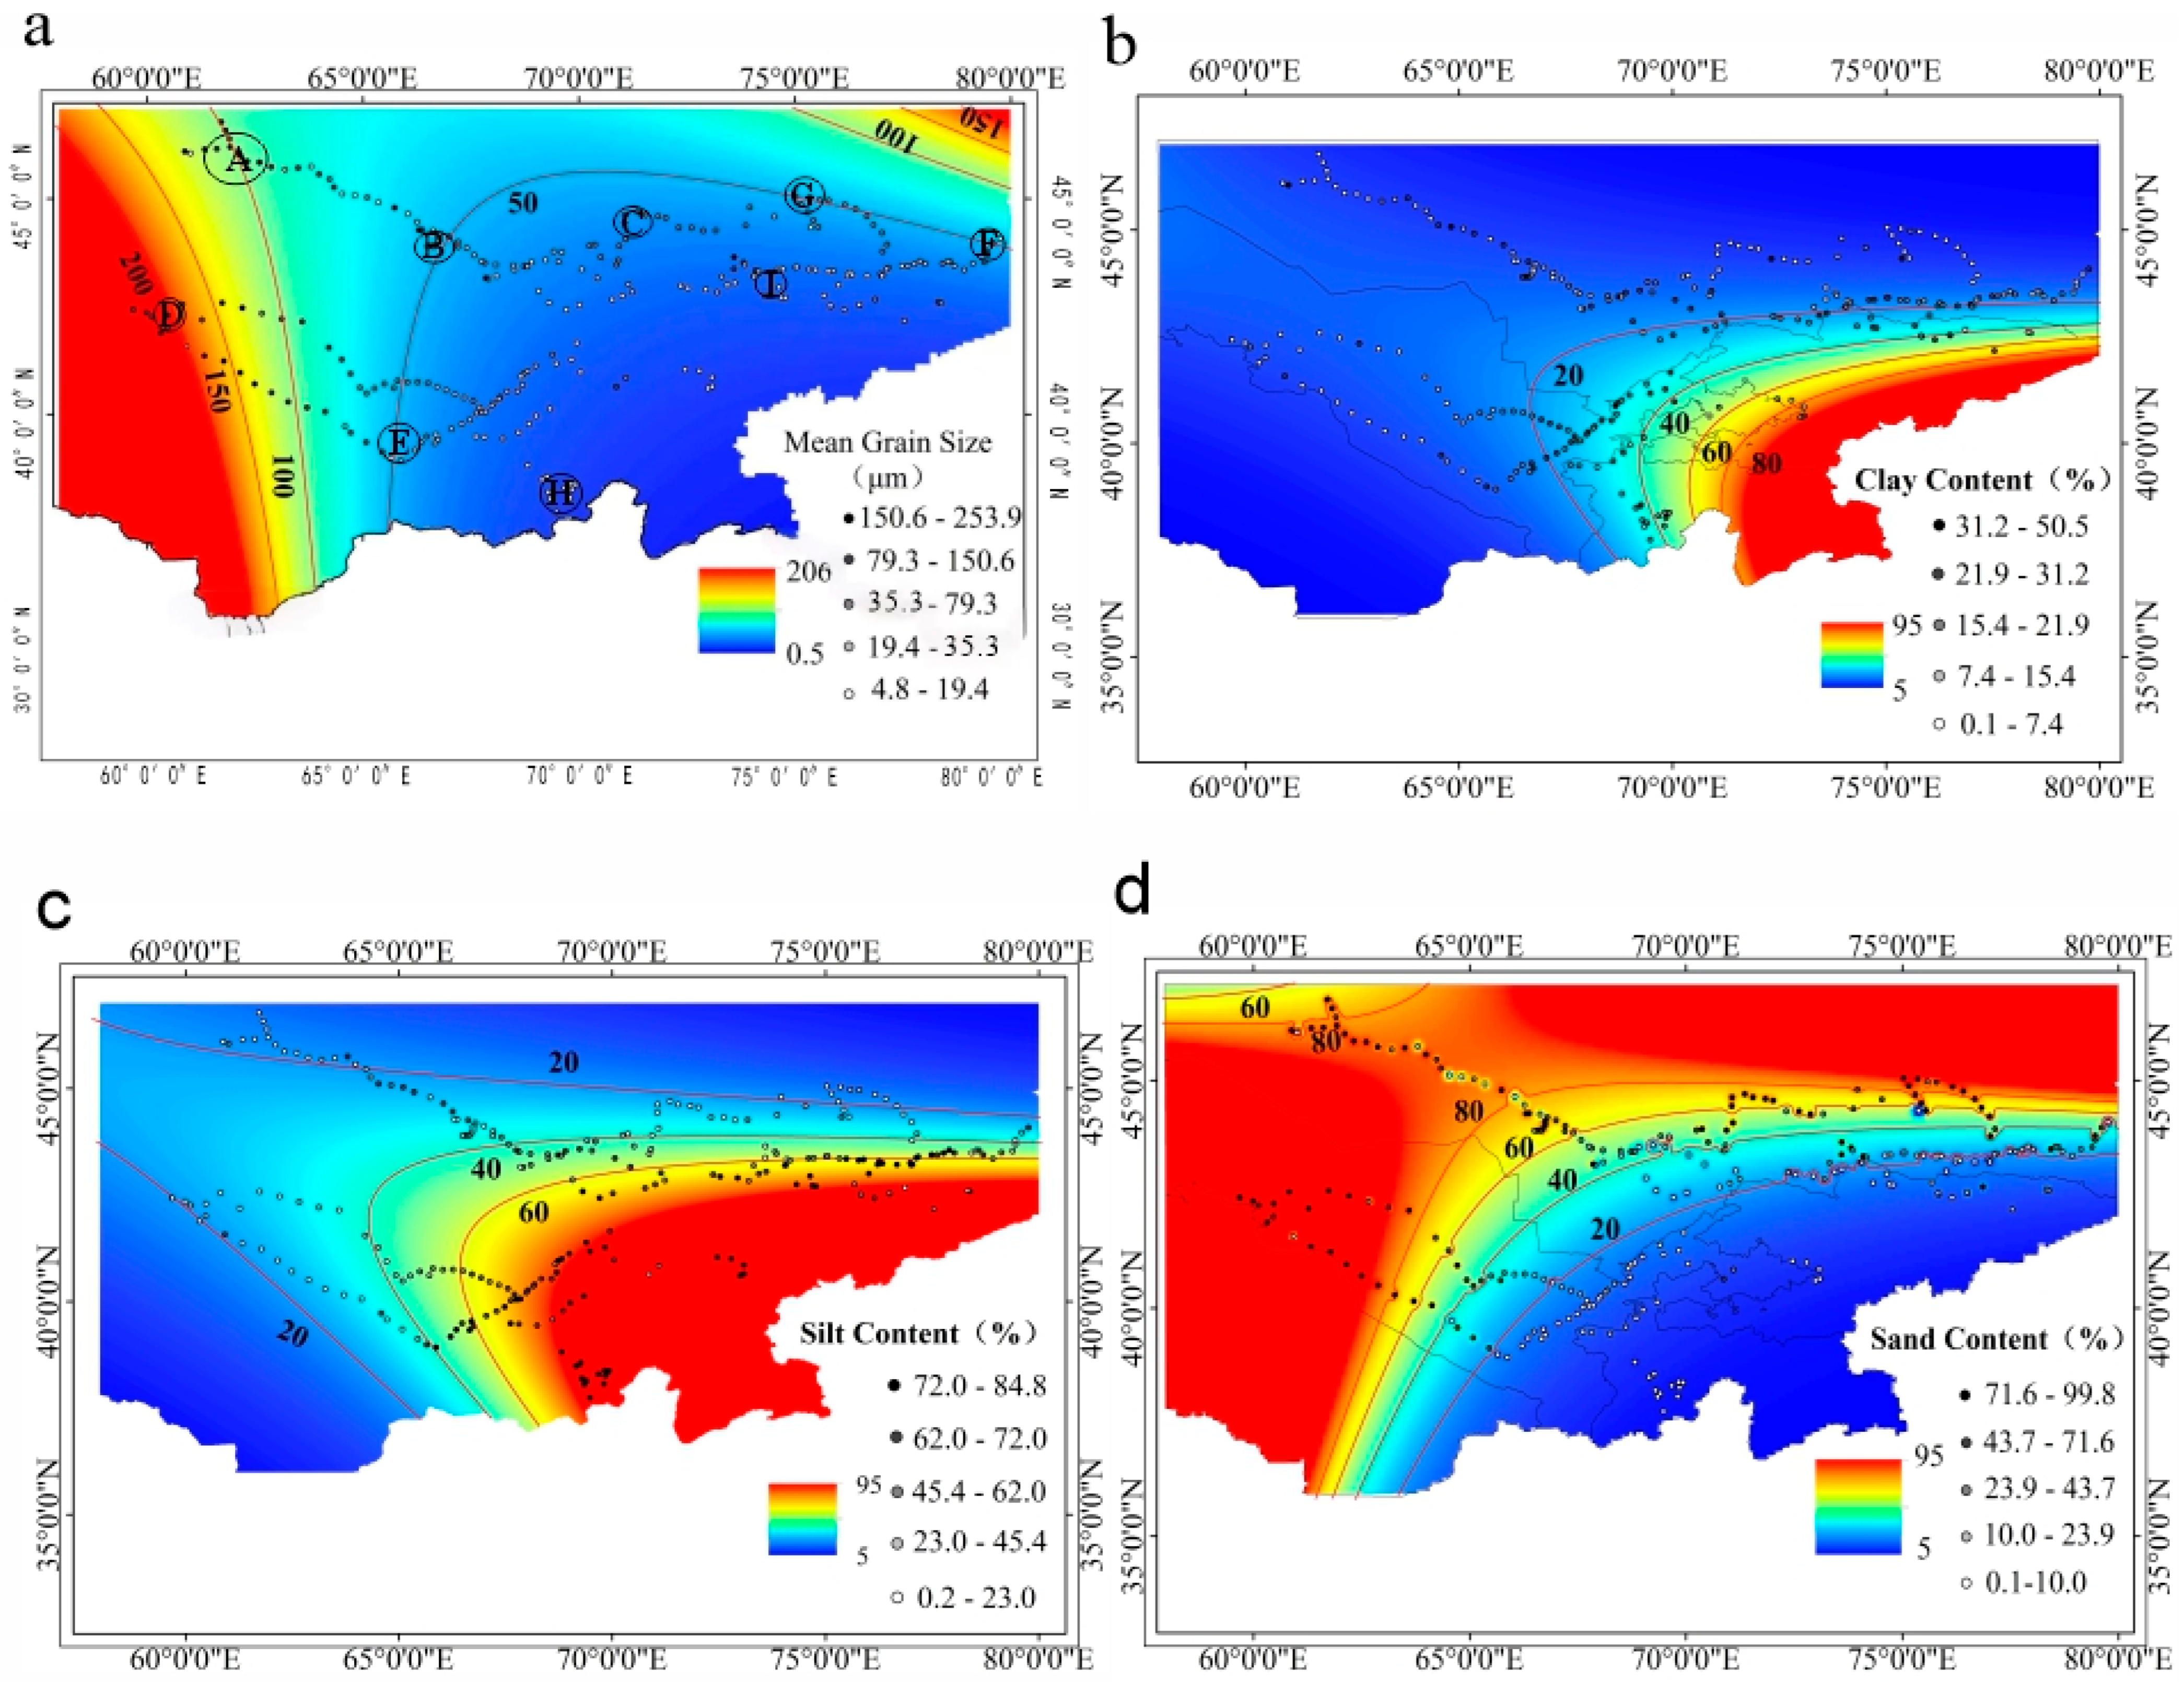
Figure 2.
Spatial distribution of grain-size components of surface sediments in Central Asia. The base maps show kriging interpolation results, with the 325 original sampling points overlaid as colored circles: (a) mean grain size, (b) clay (<4 μm), (c) silt (4-63 μm), (d) sand (>63 μm). A–I denote key regions discussed in the text. Note: Interpolation in data-sparse regions (e.g., border areas and high-altitude uninhabited zones) is associated with high uncertainty; the primary data underlying this figure are the 325 measured point values.
2.2. Atmospheric Circulation and Climatic Characteristics
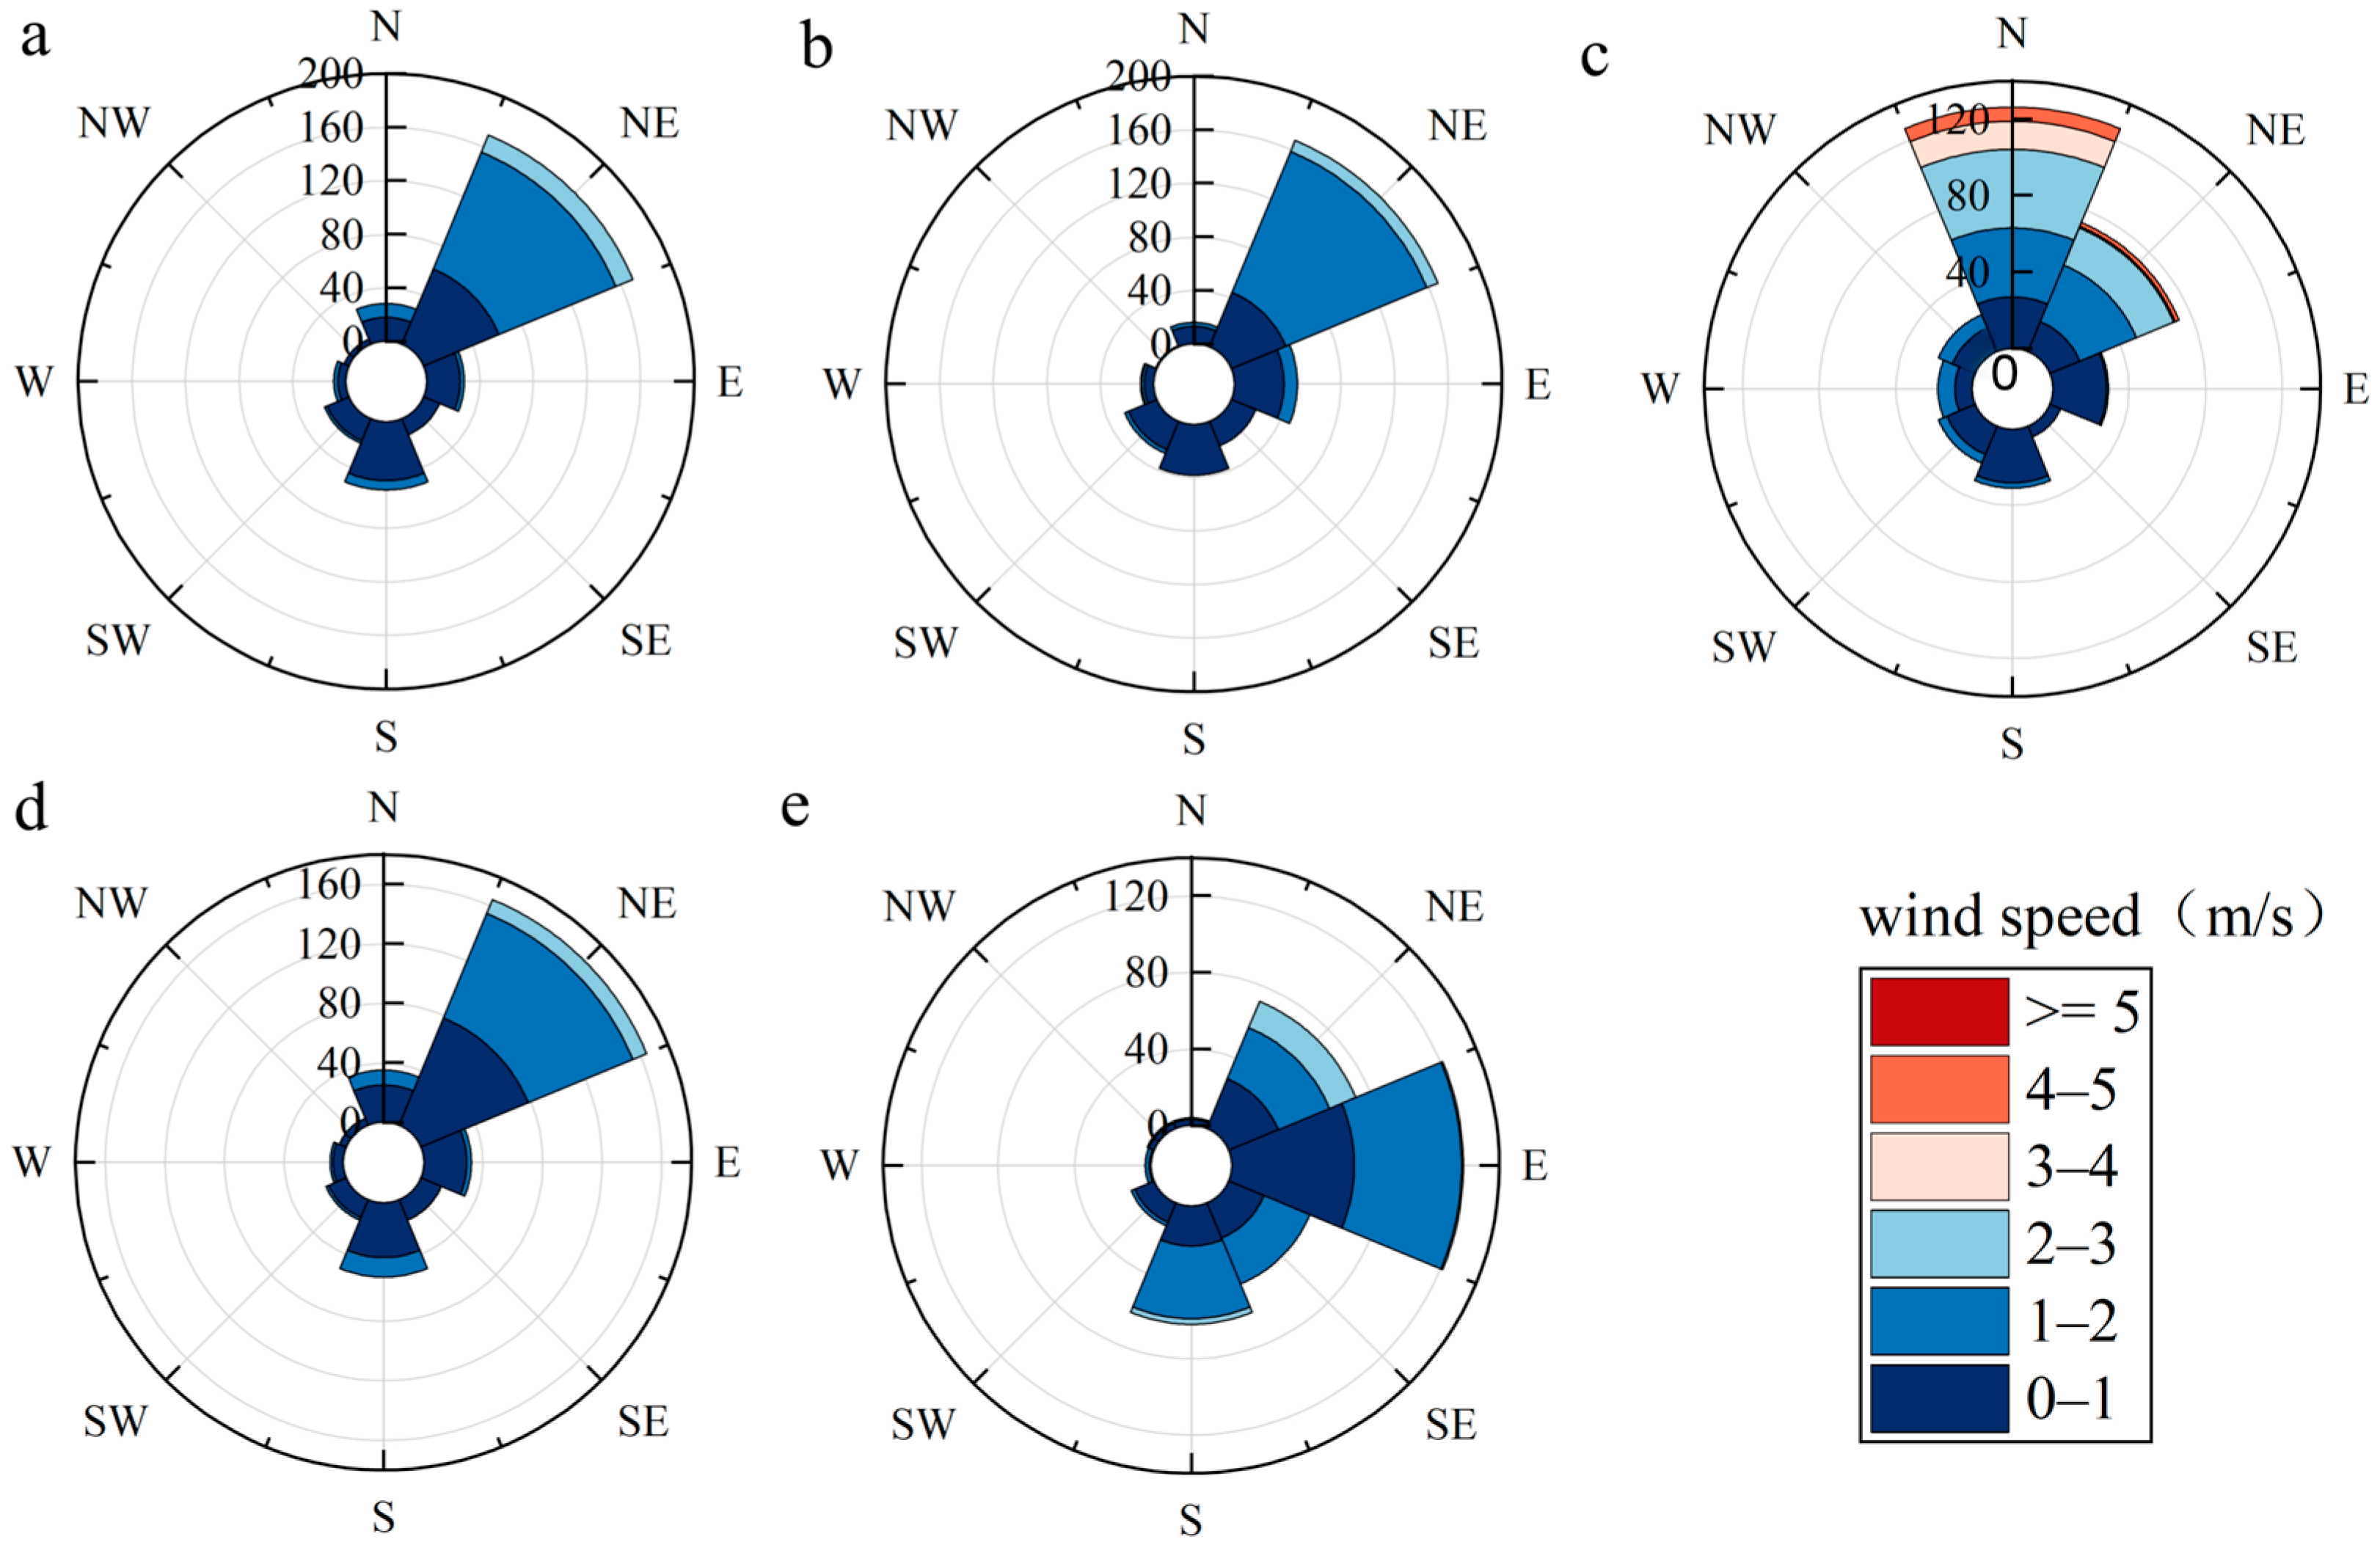
The atmospheric circulation in Central Asia is primarily modulated by the mid-latitude westerlies, polar air masses, and the Siberian High. The westerlies constitute the perennial dominant circulation, governing regional tropospheric water vapor transport, the trajectories of synoptic-scale weather systems, and dust long-range transport pathways [4]. However, at the near-surface level (10 m), the wind field is significantly modulated by seasonal pressure systems, particularly the Siberian High, which drives prevailing northeasterly winds during the winter-half year (Figure 3). This vertical decoupling between the planetary-scale westerlies aloft and the boundary-layer northeasterlies near the surface creates a distinctive “upper-level westerly transport–lower-level northeasterly entrainment” coupling mechanism for dust dynamics in Central Asia. The intensity and meridional shift of the westerlies largely dictate the spatiotemporal variability in precipitation and the seasonal wind field oscillations [29]. The Siberian High, a powerful cold anticyclone centered over Siberia and Mongolia in the winter-half year, commands the near-surface wind field over most of Central Asia, where stable northerly and northwesterly winds prevail [30]. The polar air masses originating from the Arctic Ocean and adjacent high-latitude regions are characterized by high density and cold. In winter, their southward incursion contributes to the development and intensification of the Siberian High [30], inducing severe cooling and desiccation in Central Asia. In spring, frequent frontal instabilities between warm and cold air masses generate pronounced wind speed maxima. Coupled with desiccated surface conditions and sparse vegetation, this period (March to May) constitutes the peak season for regional dust storm activity [31].
Figure 3.
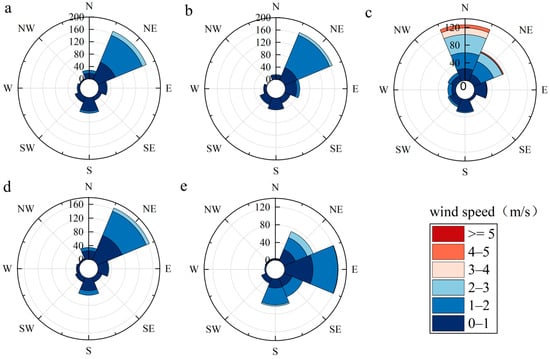
Annual and seasonal wind direction and wind speed rose diagrams for Central Asia: (a) annual, (b) spring, (c) summer, (d) autumn, (e) winter.
The spatial differentiation of annual precipitation in the region is significant, generally exhibiting a pattern of decreasing from north to south and from west to east [32]. In the lowland-plain desert areas, precipitation is generally less than 100 mm, while in the northern steppes and southern high-altitude mountain ranges, it can reach 200–500 mm. Pluvial peaks are typically concentrated from late spring to summer [33]. The region lacks a typical monsoon system, and instead displays a pronounced continental climate characterized by cold winters, hot summers, and substantial annual and diurnal temperature variability. In desert and plateau areas, the diurnal temperature range frequently exceeds 20 °C. Wind regimes exhibit strong seasonality: in winter, northerly to northwesterly flow dominates under the influence of the Siberian High and polar air masses; in summer, notwithstanding the northward migration of the westerly jet, mid-latitude westerlies continue to exert a primary control. Vegetation is dominated by arid steppe and desert-shrub communities. In the mountainous terrains, distinctive, vertical zonation occurs with increasing altitude, transitioning from montane steppe to coniferous forest and alpine meadow [34]. Collectively, these dynamic wind field characteristics, precipitation gradients, and diverse underlying surface conditions define the boundary conditions for the spatial differentiation of surface soil grain size.
3. Materials and Methods
3.1. Sample and Data Sources
3.1.1. Surface Soil Sample Collection
In this study, a total of 325 surface soil samples were collected during six comprehensive field campaigns across four Central Asian countries (Kazakhstan, Uzbekistan, Kyrgyzstan, and Tajikistan) (Figure 1). To ensure the integrity of the aeolian terminal record and minimize anthropogenic interference, all samples were taken from the uppermost 2–5 cm of the natural land surface. In this study, the term “modern surface” refers to the present-day surficial sediment layer (uppermost 2–5 cm) that has not undergone deep burial, lithification, or diagenetic alteration. These loose, unconsolidated sediments directly reflect contemporary depositional environments and active aeolian transport processes, and are distinct from ancient sedimentary strata or paleosols buried at depth, strictly avoiding vicinities of roads, settlements, and cultivated fields. The sampling strategy was designed to achieve balanced spatial coverage across the major geomorphological units of Central Asia. The typical spacing between sampling points ranged from 20 to 50 km, depending on terrain accessibility and geomorphological heterogeneity. A minimum of 5 samples was collected from each major geomorphological unit to ensure statistical representativeness. The elevation range of sampling sites spanned from ~150 m to ~2500 m.
The 325 samples were distributed across the following major regions and sediment types: 75 samples from loess deposits, 2 samples from saline-alkali soils, 47 samples from desert surfaces, 16 samples from Gobi surface soils, 68 samples from fluvial–lacustrine facies, 10 samples from alluvial deposits, and the remaining 57 samples were collected from transitional zones and miscellaneous geomorphological settings during the 2020 Uzbekistan field campaign.
Strategically considering regional geomorphological representativeness and logistical accessibility, sampling was prioritized in the western Tian Shan piedmont as well as the Kyzylkum and Karakum desert complexes. Furthermore, representative surface soil samples were also collected from key intermontane basins of the Tian Shan, including the Chu River, Fergana, and Tajik basin, to capture the fine-grained sediment characteristics in regional depositional sinks.
3.1.2. Reanalysis Wind Field Data Source
To quantitatively evaluate the nexus between surface soil grain size, surface wind regimes and atmospheric circulation, this study utilizes high-resolution wind field data from the ERA5 reanalysis database. The ERA5, developed by the European Centre for Medium-Range Weather Forecasts (ECMWF), represents the fifth generation of global atmospheric reanalysis, covering the period from January 1940 to the present. This dataset uses a four-dimensional variational assimilation method to generate high-resolution hourly atmospheric reanalysis globally, with a horizontal resolution of approximately 31 km and 137 vertical levels extending from the surface to 0.01 hPa (~80 km). The dataset is available for download at: https://cds.climate.copernicus.eu/datasets (accessed on 9 April 2026). As the flagship product of the Copernicus Climate Change Service (C3S), ERA5 offers significant advancements over earlier versions in spatial resolution, vertical stratification, and the diversity of meteorological variables. By providing a physically consistent and comprehensive representation of the coupled atmosphere–land–ocean system, this dataset enables a robust spatiotemporal correlation analysis between long-term aeolian dynamics and the regional differentiation of surface sediments across Central Asia.
3.2. Grain-Size Measurement and Data Processing
3.2.1. Grain-Size Measurement
The grain-size characteristics of aeolian sediments serve as robust proxies for reconstructing dust activity and climatic evolution. Prior to analysis, the samples underwent a rigorous multi-step pretreatment protocol to isolate the terrigenous silicate fraction. During sample preparation, 0.2–0.5 g of air-dried sample was first weighed out, and 10–20 mL of 30% H2O2 in a heating bath was added to remove organic matter; 10 mL of 10% HCl was then added to remove carbonates. The treated residue was dispersed with 10 mL of 0.05 mol/L (NaPO3)6 and subjected to ultrasonic bath for 10 min to ensure complete particle de-aggregation. Grain-size measurement was completed using a Malvern Mastersizer 3000 laser (Mastersizer 3000, Malvern Panalytical, Malvern, UK) diffraction grain-size analyzer, which provides a detection range of 0.01–3500 μm and a measurement error of less than 2% [35]. To ensure complete particle dispersion, the pretreatment procedure in this study strictly follows the recommendations of ISO 13320:2020 [36] (Particle size analysis—Laser diffraction methods). The Malvern Mastersizer 3000 employed in this study features an integrated obscuration monitoring module, which provides real-time feedback on sample concentration and dispersion stability during measurement. In this study, the obscuration was maintained within the optimal range of 10–15% throughout all analyses, indicating adequate dispersion and appropriate particle concentration in the circulating medium. Additionally, replicate measurements (n = 5) were performed on representative samples, yielding coefficient of variation (CV) values of <2% for all grain-size fractions and statistical parameters, further confirming the stability and reproducibility of the dispersion state.
3.2.2. Grain-Size Data Calculation
The sorting coefficient (S0), a fundamental parameter in sedimentology quantifying the degree of grain-size sorting and reflecting the uniformity of sediment particles, was calculated using the Trask sorting coefficient formula [35,37]:
where Q1 and Q3 represent the grain sizes at the 25th and 75th percentiles on the cumulative grain-size distribution curve, respectively. A lower S0 value indicates better sorting with more uniform grain sizes, whereas a higher S0 value signifies poorer sorting with greater grain-size variability. The classification follows standard sedimentological criteria: S0 < 2.5 indicates well-sorted sediments (mature aeolian deposits), 2.5 ≤ S0 ≤ 4.5 indicates moderately sorted sediments (active sand seas), and S0 > 4.5 indicates poorly sorted sediments (complex mixed origins or relict deposits).
S0 = √(Q3/Q1)
The mean grain size (Mz) represents the arithmetic average of all particle diameters in a sediment sample and serves as a robust proxy for aeolian transport energy and sediment sorting maturity [13,35]. In this study, the volume-weighted mean diameter D[4, 3] was adopted as the mean grain-size indicator, which is directly output by the Malvern Mastersizer 3000 laser diffraction analyzer. The D[4, 3] is calculated as: D[4, 3] = Σ(nidi4)/Σ(nidi3) where ni is the number of particles in the i-th size interval, and di is the mean diameter of that interval. The D[4, 3] parameter is particularly sensitive to coarse-grained fractions and is widely used in aeolian sedimentology to characterize the dominant transport mode [17,37]. All grain-size statistical parameters, including Mz, were computed using the GRADISTAT Version 8.0 software [38]. The grain-size measurements were conducted at the Environmental Mineralogy Laboratory, within the State Key Laboratory of Loess Sciences, Institute of Earth Environment, Chinese Academy of Sciences.
3.2.3. Meteorological Data Processing
To characterize the regional near-surface airflow dynamics, the zonal (U) and meridional (V) wind components at 10 m above the surface were extracted from the ERA5-Land reanalysis dataset, spanning the multi-decadal period January 1950–August 2025. The dataset is available for download at: https://cds.climate.copernicus.eu/datasets (accessed on 9 April 2026). The raw geophysical fields were retrieved via the Climate Data Store (CDS) API and systematically processed using VSCodeSetup-x64-1.105.1 based geospatial analysis libraries. To establish a robust technical linkage between the ERA5 reanalysis wind fields and the 325 site-specific soil samples, the following procedure was adopted. For each sampling location, the nearest ERA5-Land grid point (horizontal resolution ~0.1° × 0.1°) was first identified, and the 10 m wind components (U and V) were extracted. To account for local topographic effects and reduce small-scale noise, a spatial averaging over a 3 × 3 grid-point window centered on the nearest grid point was applied for each sampling site. This approach balances spatial representativeness with the preservation of regional wind characteristics. Seasonal wind statistics (including wind rose diagrams; Figure 3) and correlation analyses with grain-size parameters (Figure 4) were subsequently computed based on the 75-year (1950–2025) monthly mean time series derived from these spatially averaged grid-point values. The dataset is available for download at: https://cds.climate.copernicus.eu/datasets/reanalysis-era5-land-monthly-means?tab=overview (accessed on 9 April 2026). Consistent with standard climatological definitions, seasonal means were calculated as follows: spring (March–May), summer (June–August), autumn (September–November), and winter (December–February). The long-term dataset, sourced from the ECMWF C3S data portal, ensures the statistical robustness of the coupled analysis between seasonal wind regimes and the spatial heterogeneity of surface soil grain size.
Figure 4.
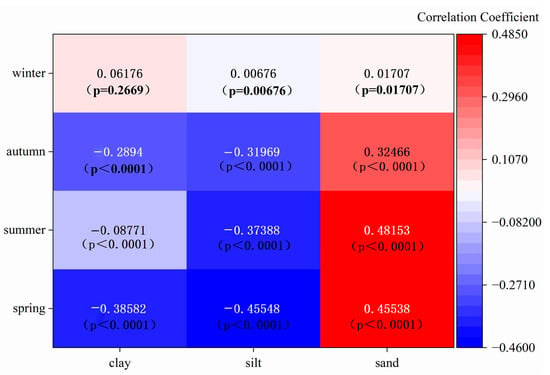
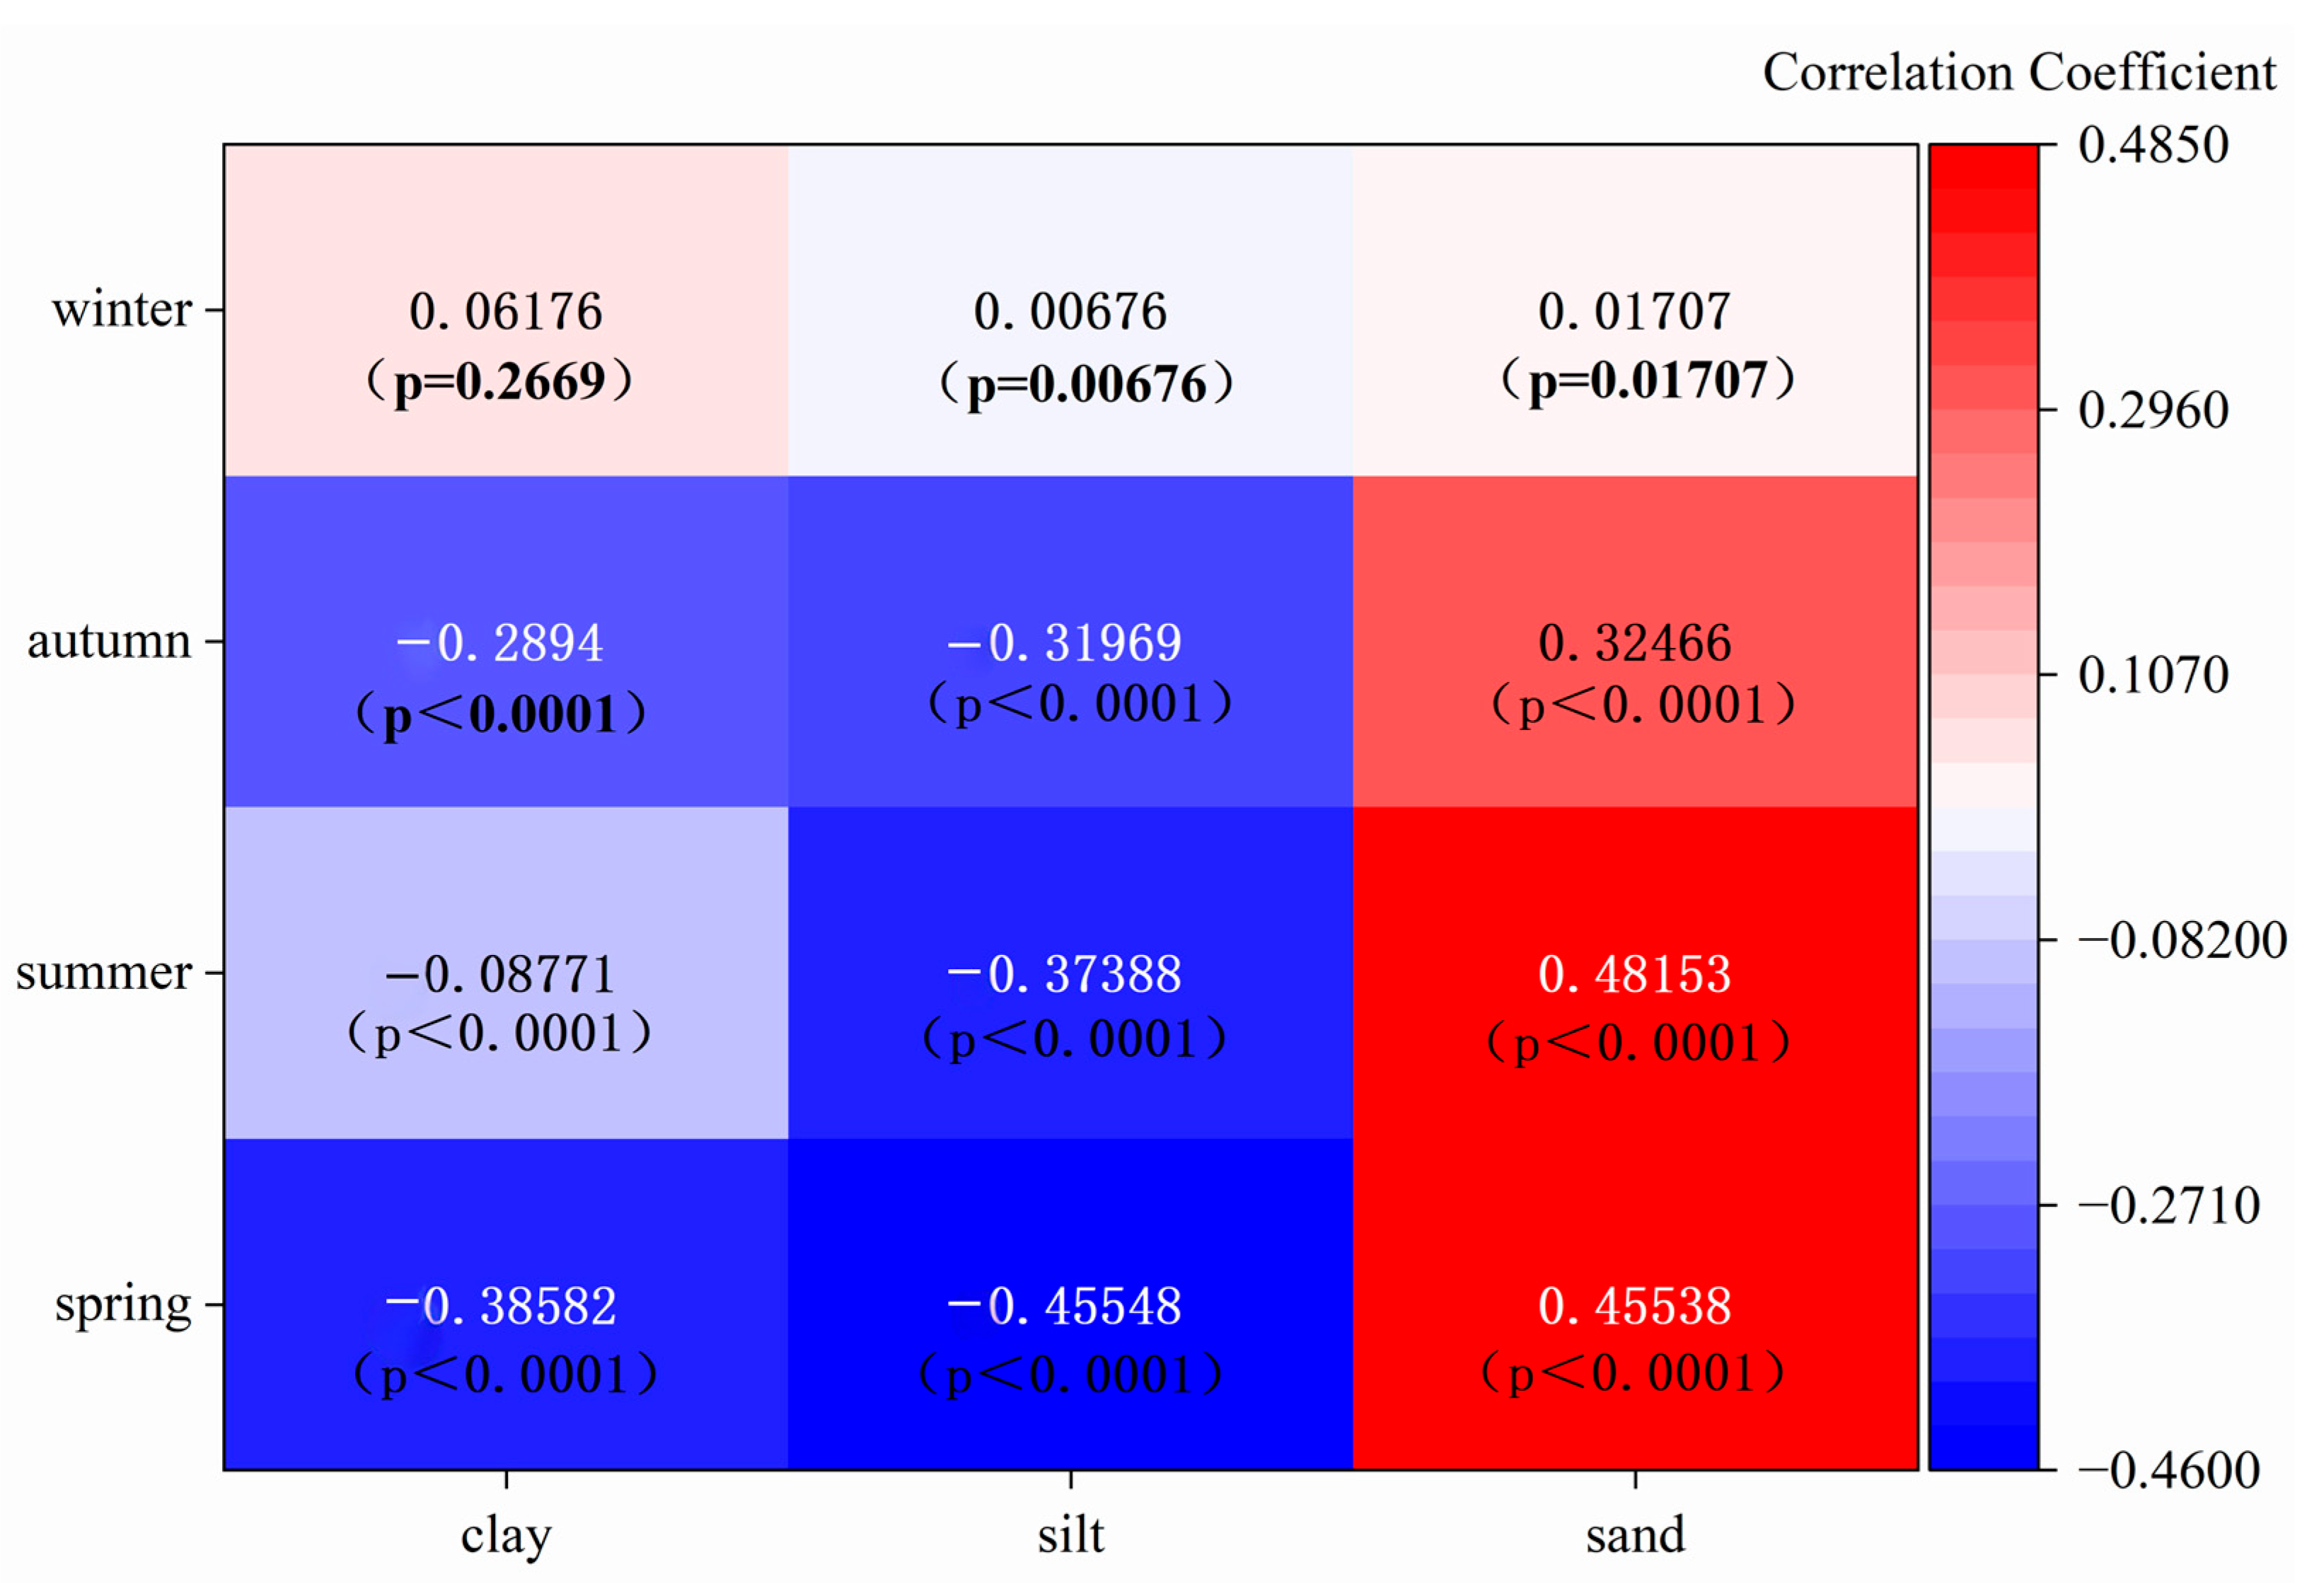
Heatmap of correlation between seasonal wind speed and grain size.
3.2.4. Kriging Interpolation Method
Kriging interpolation is a geostatistics-based spatial optimal unbiased linear estimation method that quantifies spatial autocorrelation among sample points through variogram modeling and assigns adaptive weights to estimated points. In this study, this method was employed to process the spatial distribution of grain-size components from the 325 surface soil samples (Figure 2), generating continuous spatial distribution maps of mean grain size, clay, silt, and sand contents across Central Asia. Its core advantages are threefold: First, it minimizes estimation variance, achieving the highest accuracy among linear estimators and enabling precise characterization of the spatial gradient from coarse-textured soils in the northwestern deserts to fine-grained sediments in the southeastern piedmont basins. Second, it quantifies estimation uncertainty through kriging variance, which is particularly critical for assessing interpolation reliability in sparsely sampled regions. Third, its anisotropic modeling capability accommodates the modulation of sediment spatial patterns by orographic barriers such as the Tian Shan and Pamir mountains. However, this method also has limitations: (1) high computational complexity, with significant costs associated with solving large covariance matrices across a transnational, extensive study area; (2) sensitivity to variogram fitting, where the complex geomorphological differentiation of Central Asia (coexisting deserts, mountains, and basins) may lead to unstable model parameters; (3) smoothing effects that dampen extreme values, potentially underestimating peak sand contents (>80%) in the core areas of the Kyzylkum and Karakum deserts; and (4) the requirement of adequate samples to support variogram fitting, yet the 325 samples in this study remain limited across the vast Central Asian arid zone, particularly sparse in border areas and high-altitude uninhabited regions, thereby constraining interpolation reliability. Therefore, in this study, kriging interpolation results were compared with ERA5 reanalysis wind field data and topographic factors as independent environmental covariates to contextualize the spatial distribution patterns. It should be emphasized that ERA5 wind data and topographic factors were not used to validate the accuracy of soil interpolation (as they represent different physical variables), but rather to interpret the environmental drivers that may influence soil particle distribution.
3.2.5. Correlation Analysis
To quantitatively assess the relationship between seasonal wind dynamics and surface soil grain-size parameters, Pearson correlation analyses were performed between the 75-year (1950–2025) ERA5-Land 10 m wind-speed time series and the measured grain-size components (clay, silt, and sand contents; mean grain size) at each sampling site. For each of the 325 sampling points, the seasonal mean wind speed (spring: March–May; summer: June–August; autumn: September–November; winter: December–February) was extracted and paired with the corresponding grain-size parameter. The correlation coefficient (r) and its two-tailed significance level (p-value) were computed using Origin 2023 software (OriginLab Corporation, Northampton, MA, USA).
4. Results
4.1. Spatial Distribution Characteristics of Surface Soil Grain Size in Central Asia
The grain size of surface soil in Central Asia exhibits pronounced spatial heterogeneity across the 325 sampling sites (Figure 2). The regional average mean grain size (Mz) is 47.50 μm, where local Mz values exceed 100 μm (Figure 2a, sites A, D) and sand predominate (Figure 2d). Within the Tian Shan piedmont and the Fergana Basin, the Mz decreases to approximately 50 μm (Figure 2a, sites B, C, and I). Clay-sized fractions exceed 30% in the Fergana Basin, the Tajik Basin, the western piedmont of the Tian Shan, and the Chu River Basin (Figure 2b). Silt content reaches its maximum in the southeastern region, exceeding 60% (Figure 2c). Concurrently, sand content is exceptionally high in the central and southwestern desert areas. For instance, it exceeds 60% in the Muyunkum Desert and the Saryesik–Atyrau Desert, and surpasses 80% in the Karakum and Kyzylkum deserts, while dropping below 20% in the far northwest and southeast (Figure 2d).
4.2. Characteristics of the Near-Surface Wind Field in Central Asia
To show the dynamic coupling between seasonal wind regimes and surface soil GSD, this study identifies prevailing seasonal wind vectors associated with regional sediment-sorting patterns. The characteristics of the near-surface wind field across Central Asia were systematically examined through the synthesis of seasonal wind rose diagrams (Figure 3). These directional frequency distributions provide a quantitative basis for assessing the kinetic energy available for sediment entrainment and transport across the varying geomorphological units of the region.
The annual near-surface wind regime is primarily governed by northeasterly winds (Figure 3a), with an annual average velocity of 1.06 m/s. A secondary southerly component is also observed, with speeds generally remaining below 2 m/s. Although seasonal mean wind speeds typically hover below 3 m/s, velocities within the northeasterly to easterly sector frequently surpass this threshold, particularly during the summer months. In spring (March–May), northeasterly winds prevail (Figure 3b), with a mean speed of 1.31 m/s. Wind velocities of 1–2 m/s exhibit the highest frequency (48.61%), followed by 0–1 m/s (13.54%). Critically, this dominant northeasterly orientation coincides with a distinctive peak in mean grain size (~80 μm), suggesting that spring northeasterlies possess significant kinetic energy for sediment entrainment. In summer (June–August), the prevailing winds shift toward northerly and northeasterly directions (Figure 3c), with a mean wind speed increasing to 1.55 m/s and peaking at 5 m/s. Despite these higher velocities, the incursion of relatively warm, humid air masses during this season enhances surface soil moisture [39], which exerts a stabilizing effect on the land surface and effectively suppresses the saltation and transport of coarse particles.
In autumn (September–November), the surface wind direction reverts to northeasterly (Figure 3d), with a mean wind speed of 1.15 m/s. while speeds are lower than in summer, the persistence of these northeasterly flows promotes a significant coarsening of surface sediments, with both mean and median grain sizes exceeding 80 μm. This underscores the efficacy of persistent, moderate-intensity winds in shaping the sedimentary record under desiccated autumn conditions. In winter (December–February), wind patterns exhibit maximum variability, with northeasterly and easterly winds co-dominating (Figure 3e), with a mean wind speed of 1.34 m/s. The intermittent occurrence of southerly winds reflects the intrinsic instability of the winter atmospheric circulation over Central Asia. The seasonal phenology of dust storms closely aligns with these wind field characteristics; activity peaks in April, followed by March and May, while reaching a minimum in July–August. Consistent with regional climatological assessments, wind speed remains the decisive driver for dust emission events [40].
To further quantify the relationship between wind energy and sedimentary texture, correlation analyses were performed between near-surface wind speed and grain-size parameters (Figure 4). In spring, wind speed exhibited a moderate positive correlation with sand content (r = 0.46) and a corresponding negative correlation with silt content (r = −0.46). Similar coupling patterns were observed in summer, with r = 0.48 for sand content and r = −0.37 for silt content. In contrast, autumn wind speeds show only weak correlations with grain-size parameters, and no statistically significant correlations were identified in winter months. These results highlight that the modern surface soil texture in Central Asia is most sensitive to the wind dynamics during the spring and summer seasons.
5. Discussion
5.1. Sorting Effect of Wind Dynamics on Surface Soil Grain Size
The spatial heterogeneity of surface soil grain-size distribution (GSD) serves as an important sedimentological archive for deciphering regional aeolian transport and depositional dynamics [37,41]. Our results suggest a pronounced kinetic energy gradient along the primary pathways. In proximal source areas, such as the northwestern and eastern desert sectors, high wind velocities and associated kinetic energy facilitate the entrainment and short-distance saltation of coarse fragments (sand, >63 μm), resulting in the coarse-grained deposits observed at sampling sites in these regions (Figure 2). Conversely, as transport distance increases downwind, surface friction, atmospheric stability, and orographic impediments collectively induce wind energy dissipation, leading to a progressive reduction in sediment-carrying capacity (Figure 2). In the southeastern distal areas, Mz progressively fines, and loess deposits sequester in the piedmont and intermountain basins of the Tian Shan and Pamir Plateau. Notably, the southwestern piedmont of the Tian Shan (e.g., the Ili Basin) exhibits anomalously coarse grain sizes (Mz up to ~224 μm) due to the superimposed fluvial influence of the Ili River, which introduces coarse alluvial sediments distinct from the typical aeolian loess. In contrast, the northern and central Tian Shan piedmonts and intermountain basins (e.g., Chu River, Fergana, and Tajik basin) are characterized by fine-grained, well-sorted loess deposits (Mz ~22–40 μm), reflecting the classic low-energy aeolian depositional regime. This process facilitates the preferential fallout of coarser fractions and the long-range suspension of fine-grained particles [4,42].
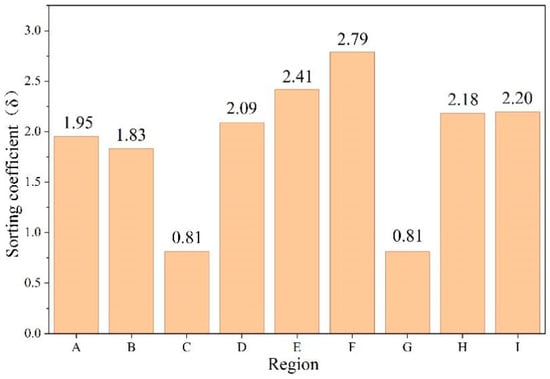
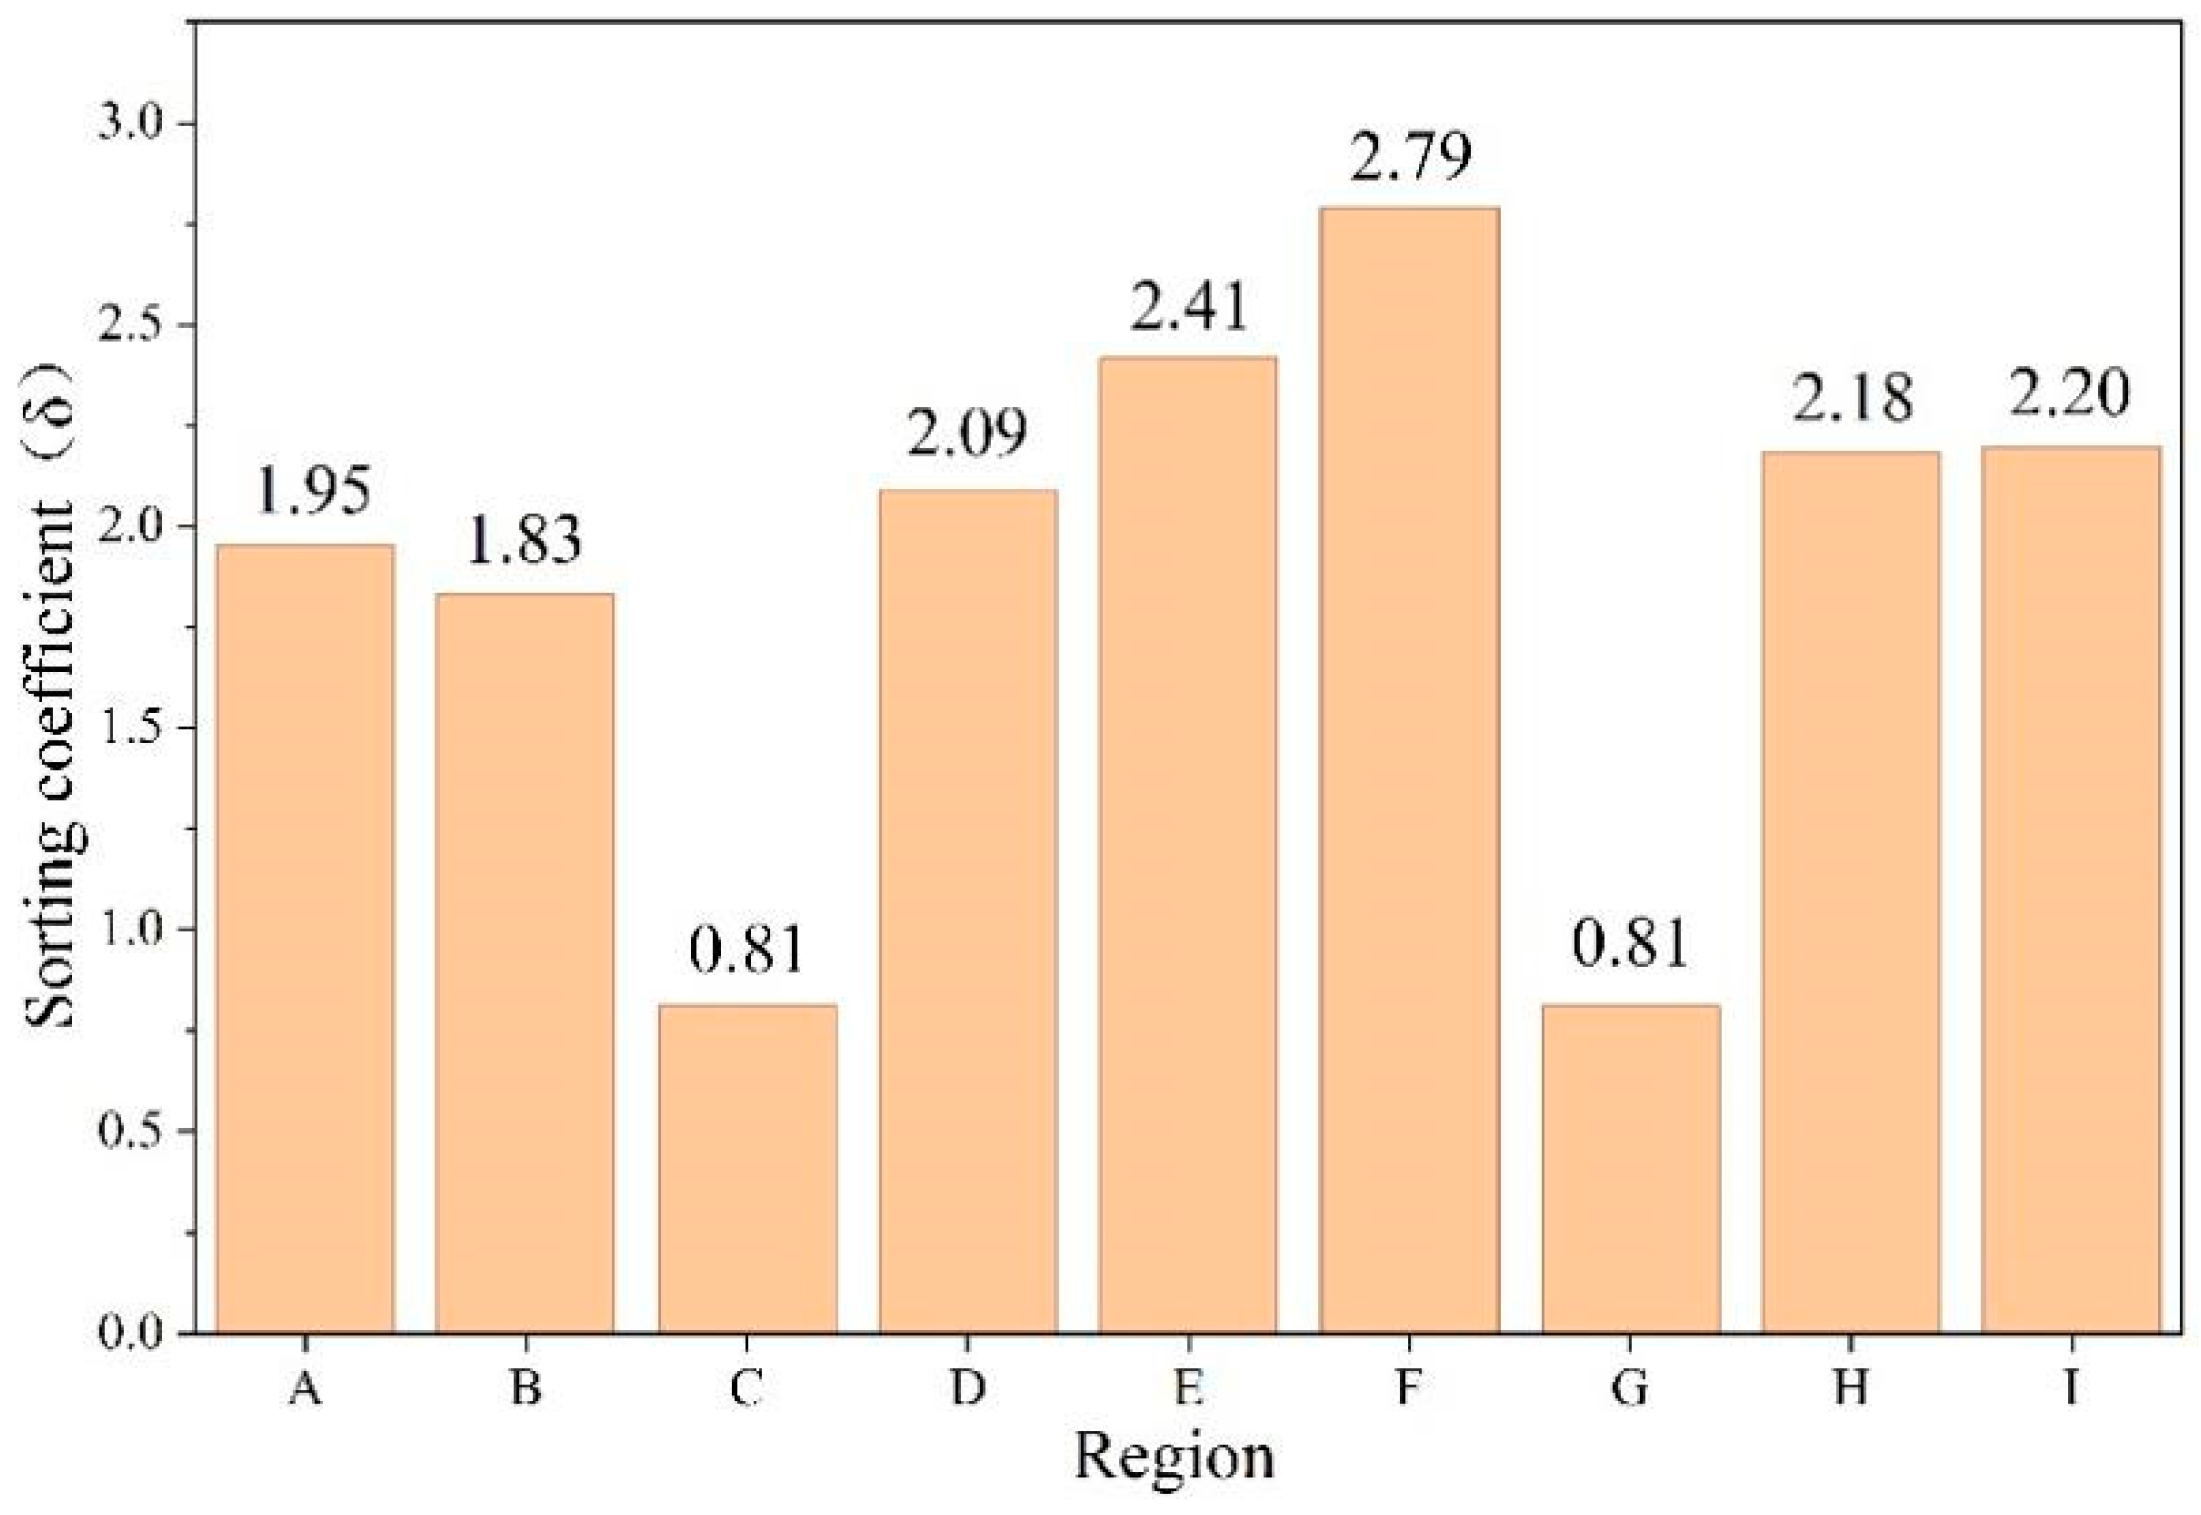
This “coarse-to-fine” textural gradation represents a classic aeolian sorting continuum. Sorting coefficients further validate this spatial partitioning: samples from the loess-dominated Chu River Basin and the Tajik Basin exhibit sorting coefficients values < 2.5, indicating a highly mature sorting process. In contrast, the Karakum and Kyzylkum deserts, characterized by active sand movement, show sorting coefficients ranges from 2.5 to 4.5. Notably, the desiccated Aral Sea bed exhibits the poorest sorting, with some samples exceeding 4.5, reflecting the complex mixing of modern aeolian sands with relict lacustrine sediments (Figure 5).
Figure 5.
Variations in the sorting coefficient parameters of surface sediment grain size in different regions of Central Asia. The detailed locations and names of A–I regions in the figure are shown in Figure 2. A: Aral Sea region, B: Northeastern Kyzylkum Desert, C: Muyunkum Desert, D: Southwestern Kyzylkum Desert, E: Northeastern Karakum Desert, F: Southwestern Tian Shan, G: Central Saryesik–Atyrau Desert, H: Tajik Basin, I: Chu River Basin (see their locations in Figure 1).
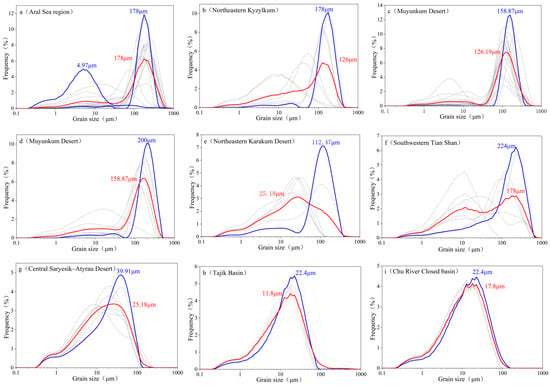
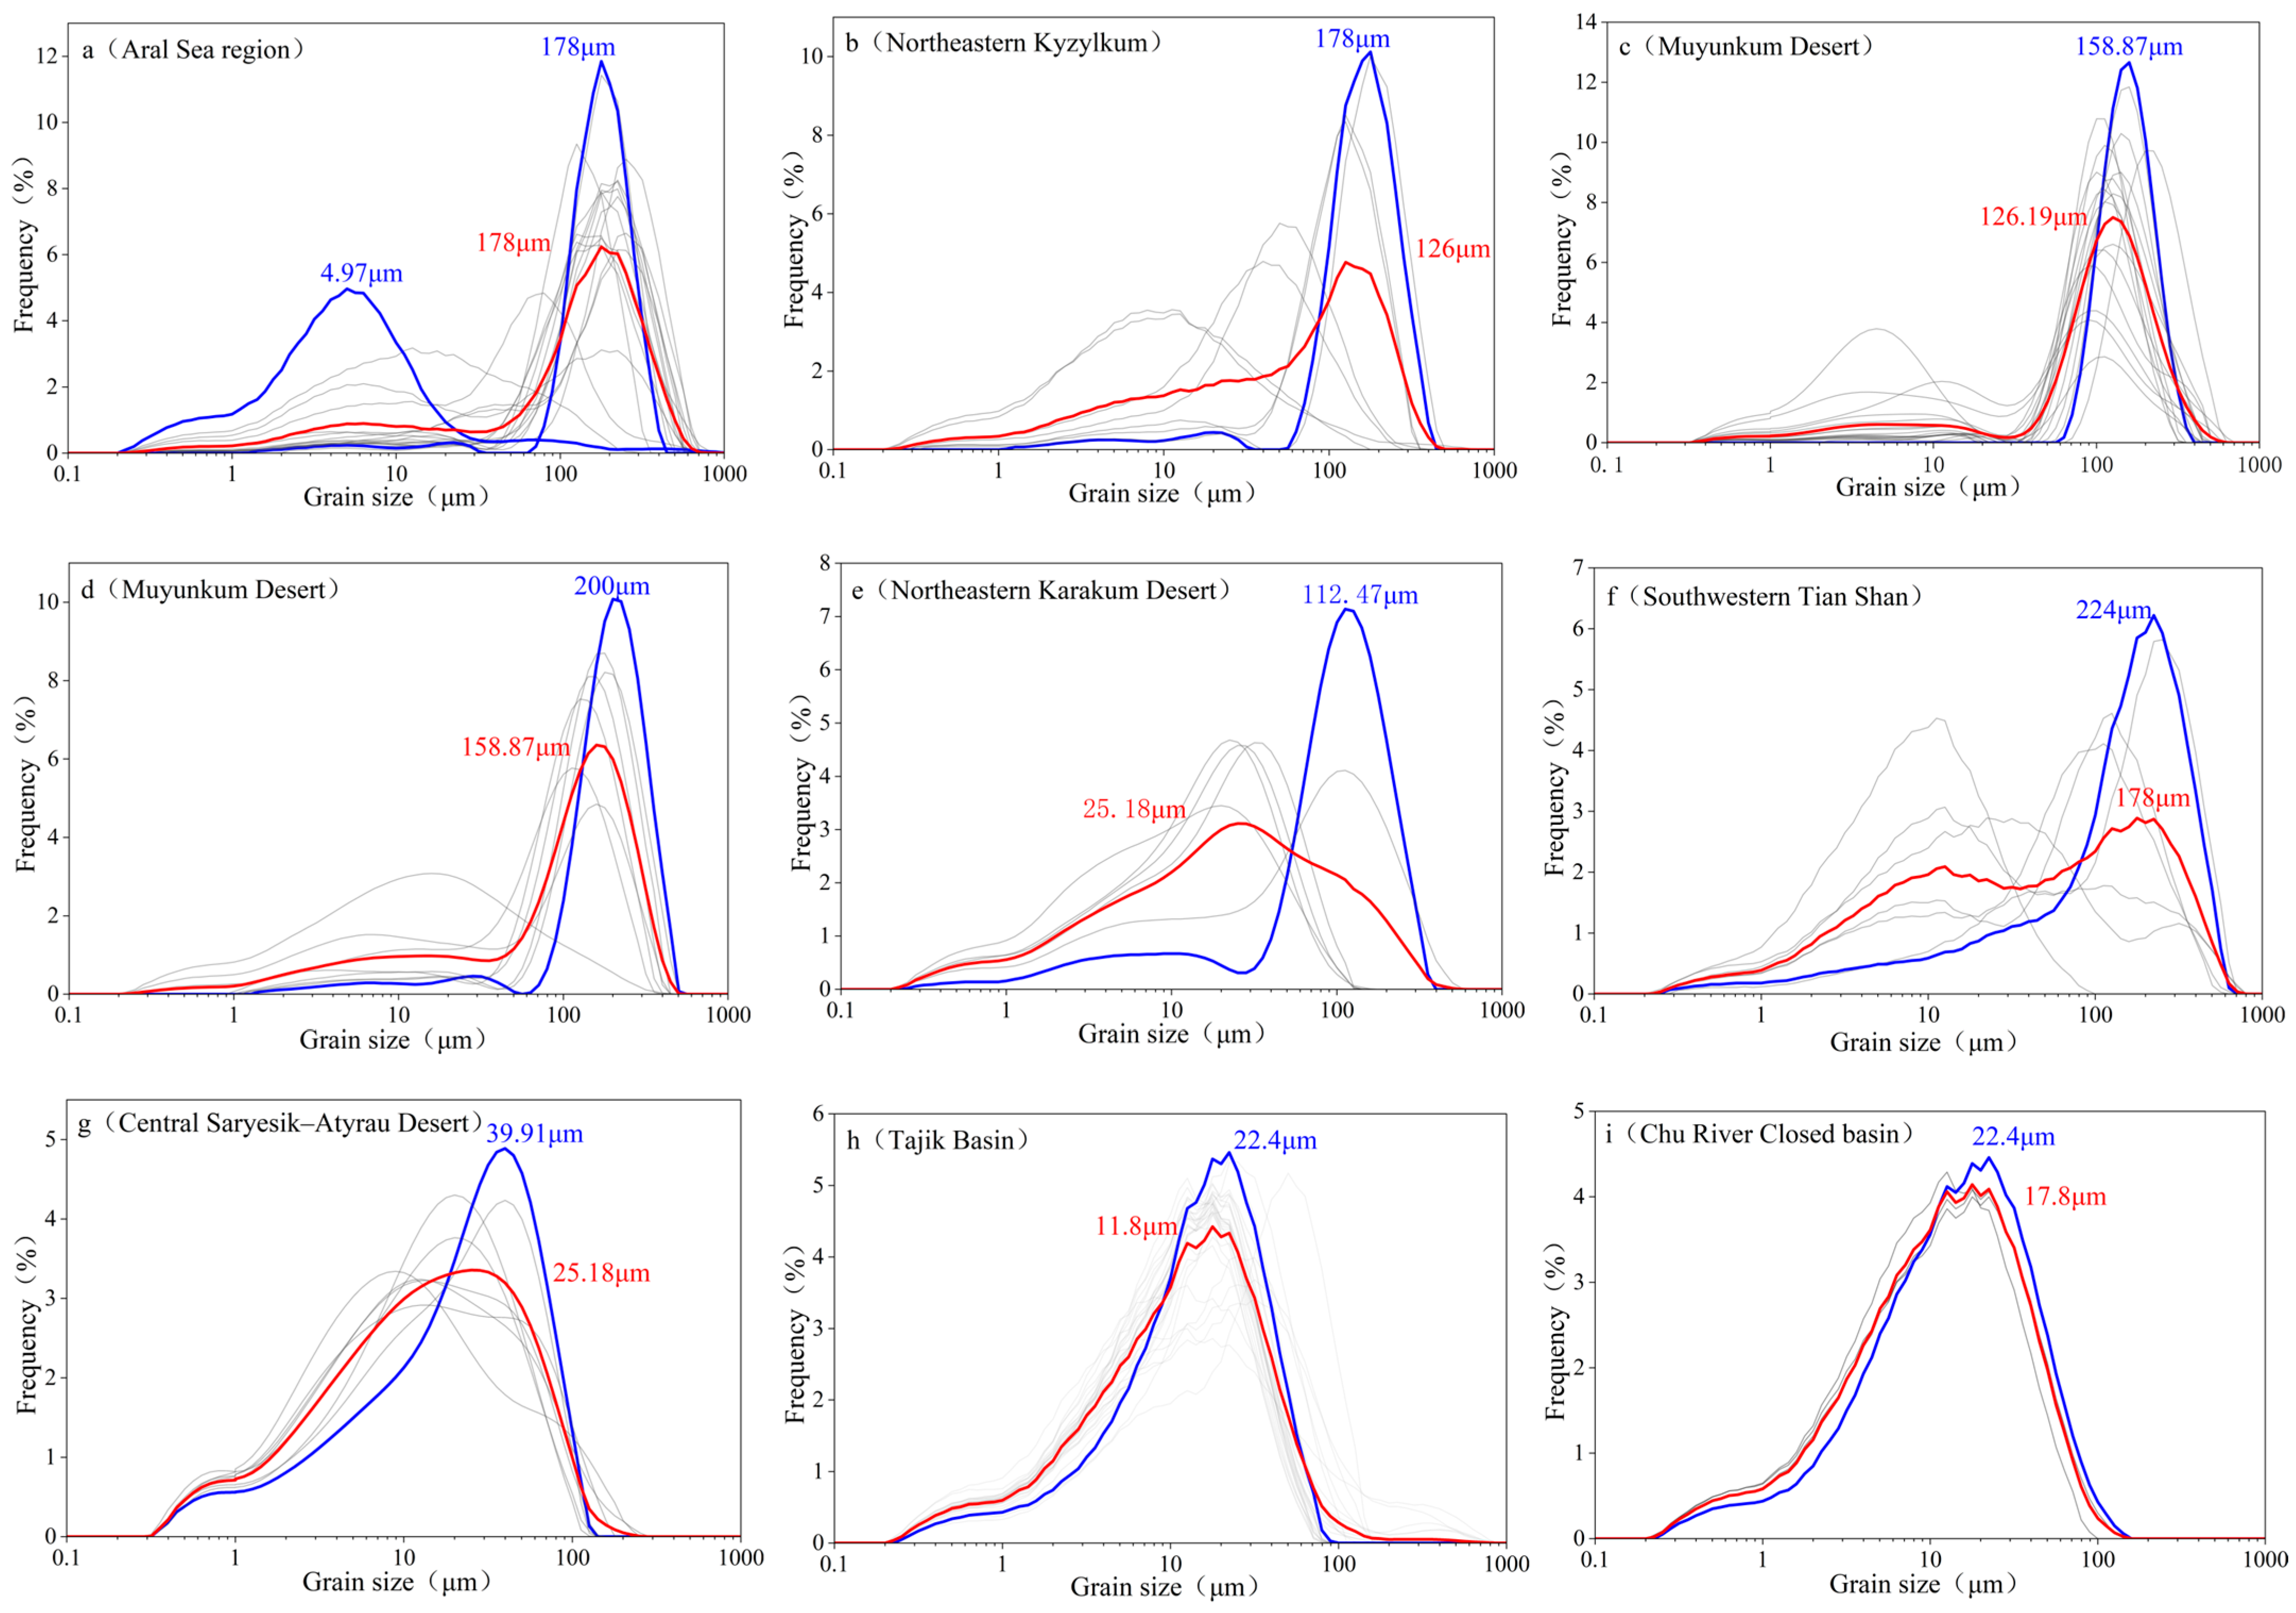
The frequency distribution curves (Figure 6) further support this: the Aral Sea region (site A) displays a distinctive bimodal signature with a primary peak at ~178 μm, while the southeastern basins (sites G, H, I) transition to fine-grained unimodal distributions signifying a shift from high-energy transport to low-energy depositional regimes. The Aral Sea region, due to the presence of desiccated lakebed sediments, exhibits a bimodal GSD, with fine and coarse modes at approximately 5 μm and 178 μm, respectively (Figure 6a), the latter being dominant. This indicates that the area is dominated by coarse particles transported by strong winds, with a minor contribution from desiccated lakebed sediments. The southwestern Kyzylkum Desert is dominated by coarse particles, with a principal peak at approximately 178 μm (Figure 5), indicating strong wind energy. In contrast, the southwestern margin of the Saryesik–Atyrau Desert, the Tajik Basin, and the Chu River Basin are characterized by fine-grained, unimodal distributions (Figure 6g–i), suggesting a dominant sediment source and weaker wind energy.
Figure 6.
Frequency distribution of surface soil grain size in different regions of Central Asia. (red: mean, blue: maximum peak of grain size, gray: other sample).
The seasonal interplay of atmospheric circulations exerts a fundamental control on aeolian sorting in Central Asia [29]. The Siberian High dominates dust emission dynamics during winter and early spring. Although winter winds can be strong, sediment entrainment is largely suppressed by frozen ground. In contrast, the retreat of the Siberian High in spring (March–May) coincides with surface thawing, minimal vegetation cover, and abundant loose material, creating optimal conditions for effective sand entrainment and transport.
This seasonal asymmetry [43,44,45] explains why maximum dust activity does not coincide with peak wind speeds. Although summer wind speeds are higher (1.55 m/s), the synchronous incursion of warm, humid air masses increases land-surface cohesiveness via soil moisture, thereby effectively suppressing aeolian erosion. Consequently, the modern surface GSD in Central Asia is primarily an integrated sedimentary record reflecting high-frequency, moderate-intensity spring northeasterlies rather than the absolute maximum wind speeds of summer. Spring is therefore the critical season for dust emission and transport. Under the influence of the retreating Siberian High, persistent northeasterly winds drive intense aeolian activity and frequent dust storms, promoting the entrainment and short- to medium-distance transport of coarse particles [4]. This process leads to coarse-grained enrichment in desert cores (e.g., Karakum and Kyzylkum), reflecting strong local sourcing and limited transport distance.
In addition, the coupling between low-level anticyclonic flow and upper-level westerlies facilitates vertical dust uplift and long-range transport, allowing material from major source regions to be injected into the mid-troposphere. Consequently, the observed spatial grain-size pattern across Central Asia reflects the combined effects of seasonal wind direction, surface conditions, and transport pathways, with spring northeasterlies playing a dominant role. Overall, only when sufficient wind strength coincides with dry, erodible surface conditions can coarse particles be effectively entrained and redistributed, producing the strong wind direction–grain size relationship observed across the region.
5.2. Synergistic Control of Topography and Provenance
The unique topographic configuration of Central Asia significantly modulates the spatial pattern of surface soil grain size. Beyond the primary role of wind dynamics, the regional mountain–basin system serves as a critical boundary condition for sediment sorting. While wind regimes determine potential dust transport capacity and distance, orographic blocking and deposition caused by high mountain ranges further modify the accumulation processes. Based on the grain-size frequency distributions (Figure 6) sites a–f are dominated by coarse-grained fractions, representing proximal transport zones under high-energy conditions. In contrast, sites g–i are characterized by fine-grained populations, indicating distal depositional environments where wind energy has effectively dissipated. Overall, these GSD characteristics reveal a spatial continuum transitioning from high-energy aeolian transport to low-energy terminal deposition.
The grain-size distributions at the sampling sites exhibit distinct spatial variability, typically featuring bimodal or multimodal patterns. Coarse-grained peaks are primarily concentrated between 100 and 200 μm, while fine-grained peaks cluster at 10–40 μm (Figure 6), reflecting the interplay between proximal coarse-material sources and topographic modulation. From the desert sources to the downwind basins, the systematic fining trend confirms that deposition is rigorously controlled by wind energy attenuation. The open, low-relief deserts in the northwest act as the primary coarse-grained source areas. Here, northeasterly winds in spring and autumn transport sand-sized particles southwestward unimpeded by topography, resulting in the exceptionally high sand content (>80%) observed in the Karakum and Kyzylkum deserts (Figure 2d).
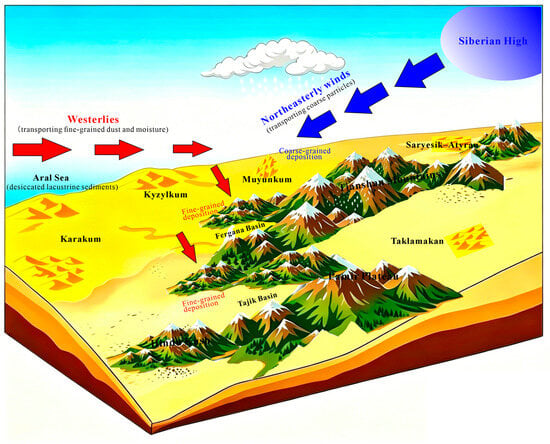
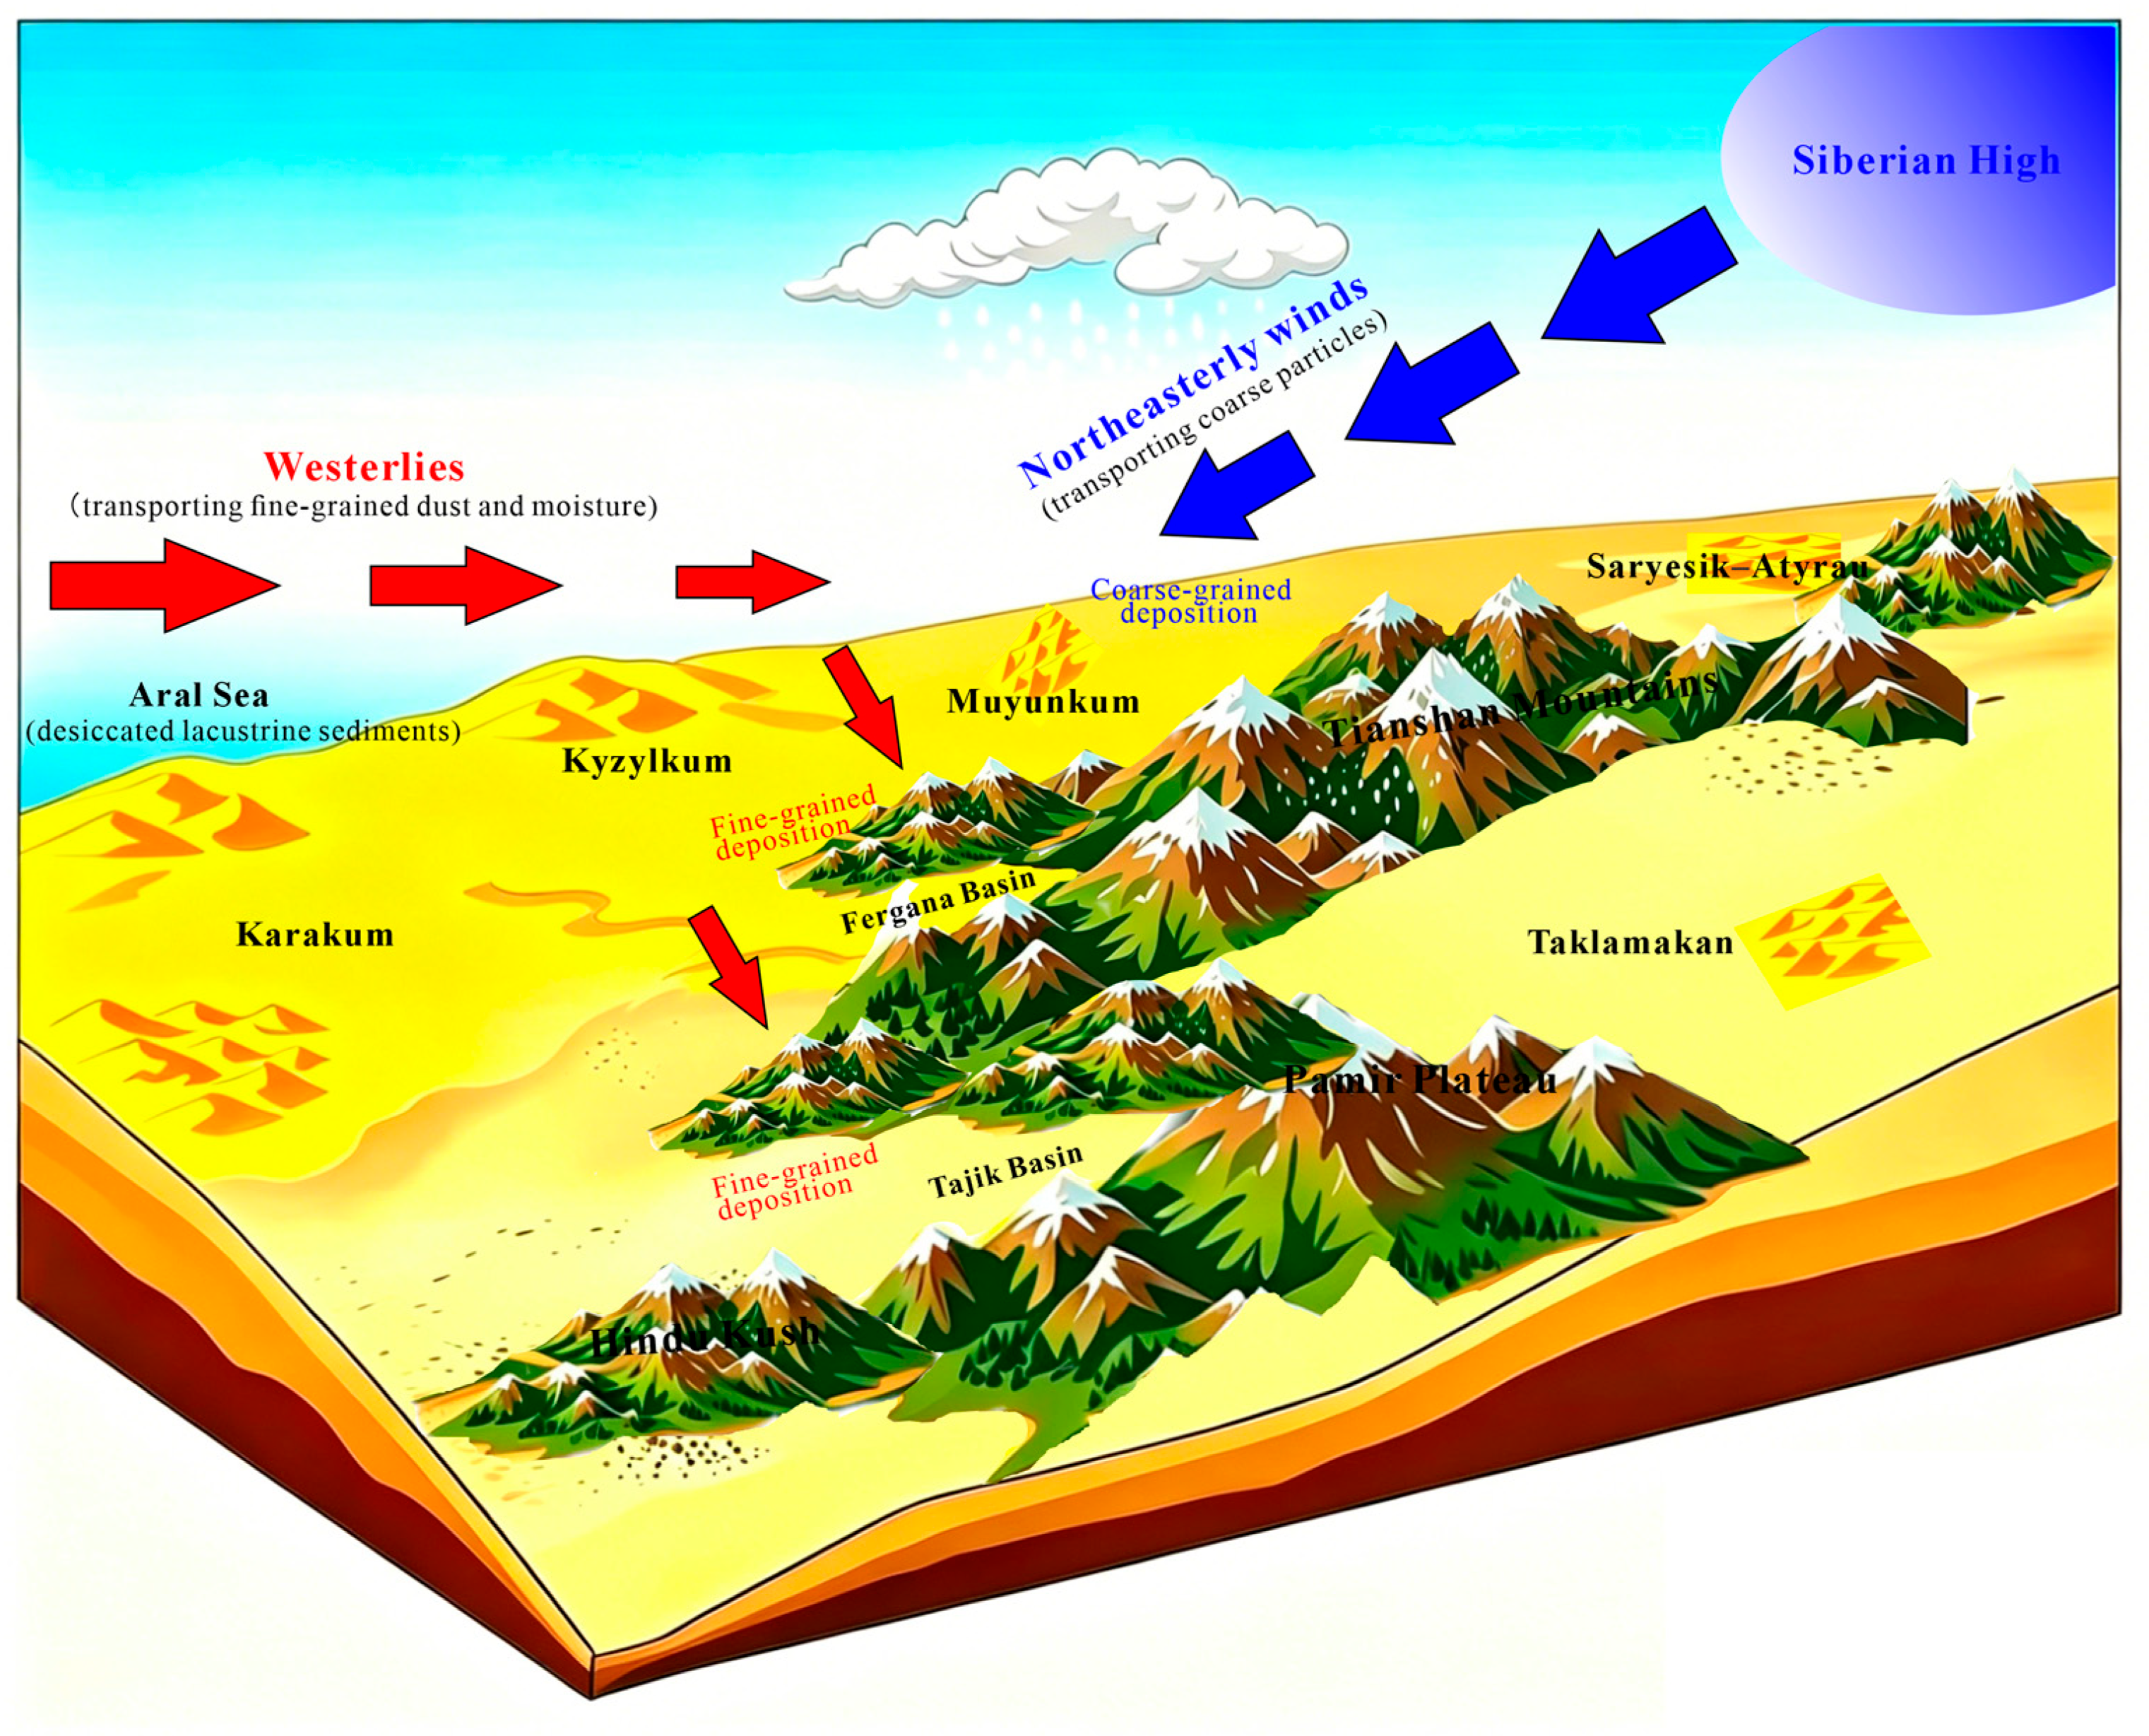
As a prevailing planetary wind system, the mid-latitude westerlies serve as the primary conduit for both moisture and fine-grained dust transport in Central Asia [46]. While providing critical precipitation for the arid interior, the westerlies facilitate the long-range tropospheric transport of fine dust from northwestern source regions to southeastern sinks (Figure 7) [4]. Topographically sheltered areas, such as the southeastern Tian Shan piedmont and the Fergana Basin, function as terminal sinks where silt and clay have accumulated over geological timescales, forming extensive loess belts (>60% silt/clay). Furthermore, the high mountain ranges (e.g., Tian Shan, Pamir) act as physical barriers that force a sharp reduction in wind velocity on windward slopes, thereby promoting dust fallout. In contrast, the Aral Sea region exhibits anomalous clay enrichment due to the relict lacustrine sediments from its desiccated lakebed, highlighting the secondary influence of localized provenance.
Figure 7.
Diagram showing the conceptual model of dust accumulation in Central Asia.
In summary, the spatial pattern of surface soil GSD in Central Asia exhibits strong consistency with seasonal wind dynamics and the regional geomorphological framework. The “source-to-sink” process is driven by northeasterly winds (Siberian High) and the westerlies, but its final architecture is dictated by the northwest-low/southeast-high topography. Downwind of major desert sources, grain size systematically fines in accordance with classical energy-decay theory. The Fergana, Tajik, and Chu River basins, situated at the terminus of major transport pathways, provide the stable depositional conditions necessary for the long-term sequestration of fine particles. Thus, wind direction, topography, and provenance jointly constrain the spatial heterogeneity of the surface sedimentary record in Central Asia.
The validation of spatial interpolation through independent soil measurements represents a critical next step for refining the regional patterns identified in this study. While historical Soviet-era soil surveys offer a potentially valuable source of comparative data, their integration is currently constrained by archival accessibility, data format compatibility, and methodological standardization challenges. We encourage future collaborative efforts to digitize and harmonize these historical archives, which would enable robust cross-validation and significantly advance our understanding of regional soil spatial patterns.
6. Conclusions
This study integrated a 75-year (1950–2025) ERA5-Land wind field dataset with grain-size analysis of 325 surface soil samples to elucidate the aeolian dynamics and sedimentary patterns across Central Asia. The main conclusions are as follows:
- (1)
- The surface soil grain size in Central Asia exhibits a general coarse-to-fine transition from the northwestern/central deserts (e.g., Karakum, Kyzylkum) toward the southeastern intermontane basins and piedmonts (e.g., Fergana, Chu River, and Tajik basins). An exception occurs in the Ili Basin on the southwestern Tian Shan piedmont (Figure 6f), where fluvial–aeolian interaction produces anomalously coarse sediments, highlighting the secondary influence of local provenance on the regional sorting pattern. This spatial heterogeneity reflects a complete “source-to-sink” continuum, transitioning from proximal sand-dominated saltation to distal silt-clay suspension.
- (2)
- Seasonal wind direction significantly controls surface soil grain size. The northeasterly winds driven by the retreating Siberian High in spring are the decisive drivers of coarse particle entrainment and regional transport. Although summer wind speeds are higher, increased soil moisture effectively suppresses aeolian activity, making the spring wind field the dominant sculptor of the modern land-surface sedimentary record.
- (3)
- The regional-scale grain-size pattern is a terminal record of the coupled influence of the westerlies, the Siberian High, and orographic modulation. The Tian Shan and Pamir mountains act as formidable physical barriers, forcing aerodynamic deceleration and promoting the long-term sequestration of fine-grained dust into loess belts. Localized provenance, such as the desiccated Aral Sea bed, further perturbs these patterns by introducing unique fine-grained lacustrine signatures.
Surface soil textures in Central Asia encapsulate the complex interactions between planetary wind systems and regional topography. These findings provide critical empirical constraints for optimizing global dust emission models and assessing aeolian erosion susceptibility. Future research should prioritize multi-proxy integration—including high-resolution remote sensing and isotopic tracing—to further resolve dust dynamics under intensifying climate variability.
Author Contributions
C.Q.: conceptualization, writing-original draft, curation, and visualization; Y.S.: conceptualization, supervision, investigation, funding acquisition, and writing—review and editing; H.W. and M.Z.: validation, method, and discussion; H.G., S.G., S.S., Y.M., N.S., and R.O.: resources, investigation, and discussion. All authors have read and agreed to the published version of the manuscript.
Funding
This research was funded by the National Natural Science Foundation of China (No. 42372220), China–Iran Silk Road Science Fund Project (SRSF) under the CAS International Partnership Program (No: 175GJHZ2025056MI), and Iran National Science Foundation (INSF No: 4049173).
Institutional Review Board Statement
Not applicable.
Informed Consent Statement
Not applicable.
Data Availability Statement
The ERA5 reanalysis wind field data can be downloaded from https://cds.climate.copernicus.eu/datasets (accessed on 9 April 2026). The surface soil grain-size data from Central Asia are available from the corresponding author upon request.
Acknowledgments
We thank Yun Li, Tao Chen, Yanping Wang, Yudong Li, and Junchao Dong for their assistance with field sampling. We also express our sincere gratitude to Yaoming Li and Xi Chen from the Research Center for Ecology and Environment of Central Asia, Chinese Academy of Sciences, for their kind support.
Conflicts of Interest
The authors declare no conflicts of interest.
References
- Gao, X.; Zhao, D. Impacts of climate change on vegetation phenology over the Great Lakes Region of Central Asia from 1982 to 2014. Sci. Total. Environ. 2022, 845, 157227. [Google Scholar] [CrossRef] [Scilit] [PubMed]
- Shen, H.; Abuduwaili, J.; Samat, A.; Ma, L. A review on the research of modern aeolian dust in Central Asia. Arab. J. Geosci. 2016, 9, 625. [Google Scholar] [CrossRef] [Scilit]
- Indoitu, R.; Orlovsky, L.; Orlovsky, N. Dust storms in Central Asia: Spatial and temporal variations. J. Arid Environ. 2012, 85, 62–70. [Google Scholar] [CrossRef] [Scilit]
- Vandenberghe, J.; Renssen, H.; van Huissteden, K.; Nugteren, G.; Konert, M.; Lu, H.; Dodonov, A.; Buylaert, J.-P. Penetration of Atlantic westerly winds into Central and East Asia. Quat. Sci. Rev. 2006, 25, 2380–2389. [Google Scholar] [CrossRef] [Scilit]
- Li, Y.; Li, Y.; Song, Y.; Wei, H.; Wang, Y.; Shukurov, N. Effective Moisture Evolution since the Last Glacial Maximum Revealed by a Loess Record from the Westerlies-Dominated Ili Basin, NW China. Atmosphere 2022, 13, 1931. [Google Scholar] [CrossRef] [Scilit]
- Li, Y.; Song, Y.; Fitzsimmons, K.E.; Chang, H.; Orozbaev, R.; Li, X. Eolian dust dispersal patterns since the last glacial period in eastern Central Asia: Insights from a loess-paleosol sequence in the Ili Basin. Clim. Past. 2018, 14, 271–286. [Google Scholar] [CrossRef] [Scilit]
- Li, Y.; Song, Y.; Kaskaoutis, D.G.; Zan, J.; Orozbaev, R.; Tan, L.; Chen, X. Aeolian dust dynamics in the Fergana Valley, Central Asia, since ~30 ka inferred from loess deposits. Geosci. Front. 2021, 12, 101180. [Google Scholar] [CrossRef] [Scilit]
- Kang, S.; Wang, X.; Wang, N.; Song, Y.; Liu, W.; Wang, D.; Peng, J. Siberian High Modulated Suborbital-Scale Dust Accumulation Changes Over the Past 30 ka in the Eastern Yili Basin, Central Asia. Paleocean. Palaeoclim. 2022, 37, e2021PA004360. [Google Scholar] [CrossRef] [Scilit]
- Zhang, B.; Zhang, Z.; Meng, X.; Liu, J.; Xia, T.; Guo, B.; Zhou, B.; Ji, J. Holocene synchronous evolution of precipitation and soil moisture as evidenced by paleosol deposits in the Ili Basin, Central Asia. Palaeogeog. Palaeoclim. Palaeoecol. 2023, 615, 111466. [Google Scholar] [CrossRef] [Scilit]
- Zhang, G.; Biradar, C.M.; Xiao, X.; Dong, J.; Zhou, Y.; Qin, Y.; Zhang, Y.; Liu, F.; Ding, M.; Thomas, R.J. Exacerbated grassland degradation and desertification in Central Asia during 2000–2014. Ecol. Appl. 2018, 28, 442–456. [Google Scholar] [CrossRef] [Scilit] [PubMed]
- Li, C.; Fu, B.; Wang, S.; Stringer, L.C.; Wang, Y.; Li, Z.; Liu, Y.; Zhou, W. Drivers and impacts of changes in China’s drylands. Nat. Rev. Earth Environ. 2021, 2, 858–873. [Google Scholar] [CrossRef] [Scilit]
- Sun, R.; He, H.; Jing, Y.; Leng, S.; Yang, G.; Lü, Y.; Borrelli, P.; Chen, L.; Fu, B. Global Wind Erosion Reduction Driven by Changing Climate and Land Use. Earth’s Future 2024, 12, e2024EF004930. [Google Scholar] [CrossRef] [Scilit]
- Ginoux, P.; Prospero, J.M.; Gill, T.E.; Hsu, N.C.; Zhao, M. Global-scale attribution of anthropogenic and natural dust sources and their emission rates based on MODIS Deep Blue aerosol products. Rev. Geophys. 2012, 50, RG3005. [Google Scholar] [CrossRef] [Scilit]
- An, Z.; Kukla, G.J.; Porter, S.C.; Xiao, J. Magnetic Susceptibility Evidence of Monsoon Variation on the Loess Plateau of Central China during the Last 130,000 Years. Quat. Res. 1991, 36, 29–36. [Google Scholar] [CrossRef] [Scilit]
- Fitzsimmons, K.E.; Nowatzki, M.; Dave, A.K.; Harder, H. Intersections between wind regimes, topography and sediment supply: Perspectives from aeolian landforms in Central Asia. Palaeogeog. Palaeoclim. Palaeoecol. 2020, 540, 109531. [Google Scholar] [CrossRef] [Scilit]
- Machalett, B.; Oches, E.A.; Frechen, M.; Zöller, L.; Hambach, U.; Mavlyanova, N.G.; Marković, S.B.; Endlicher, W. Aeolian dust dynamics in central Asia during the Pleistocene: Driven by the long-term migration, seasonality, and permanency of the Asiatic polar front. Geochem. Geophys. Geosyst. 2008, 9, Q08Q09. [Google Scholar] [CrossRef] [Scilit]
- Kang, J.; Zan, J.; Fang, X.; Zhang, W.; Azamdzhon, M. Amplified dust cycle in Central Asia linked to desert expansion and environmental transformations since 1980. Catena 2025, 260, 109421. [Google Scholar] [CrossRef] [Scilit]
- Karen, E.; Kohfeld, S.P.H. DIRTMAP: The geological record of dust. Earth-Sci. Rev. 2001, 54, 81–114. [Google Scholar] [CrossRef] [Scilit]
- Maher, B.A.; Prospero, J.M.; Mackie, D.; Gaiero, D.; Hesse, P.P.; Balkanski, Y. Global connections between aeolian dust, climate and ocean biogeochemistry at the present day and at the last glacial maximum. Earth-Sci. Rev. 2010, 99, 61–97. [Google Scholar] [CrossRef] [Scilit]
- Ujvari, G.; Stevens, T.; Molnar, M.; Demeny, A.; Lambert, F.; Varga, G.; Jull, A.J.T.; Pall-Gergely, B.; Buylaert, J.P.; Kovacs, J. Coupled European and Greenland last glacial dust activity driven by North Atlantic climate. Proc. Natl. Acad. Sci. USA 2017, 114, E10632–E10638. [Google Scholar] [CrossRef] [Scilit] [PubMed]
- Mayaud, J.R.; Wiggs, G.F.S.; Bailey, R.M. Characterizing turbulent wind flow around dryland vegetation. Earth Surf. Process. Landf. 2016, 41, 1421–1436. [Google Scholar] [CrossRef] [Scilit]
- Al-Awadhi, J.M.; Al-Helal, A.; Al-Enezi, A. Sand drift potential in the desert of Kuwait. J. Arid Environ. 2005, 63, 425–438. [Google Scholar] [CrossRef] [Scilit]
- Ashrafi, K.; Shafiepour-Motlagh, M.; Aslemand, A.; Ghader, S. Dust storm simulation over Iran using HYSPLIT. J. Environ. Health Sci. Eng. 2014, 12, 9. [Google Scholar] [CrossRef] [Scilit] [PubMed]
- Prospero, J.M.; Ginoux, P.; Torres, O.; Nicholson, S.E.; Gill, T.E. Environmental Characterization of Global Sources of Atmospheric Soil Dust Identified with the Nimbus 7 Total Ozone Mapping Spectrometer (Toms) Absorbing Aerosol Product. Rev. Geophys. 2002, 40, 2-1–2-31. [Google Scholar] [CrossRef] [Scilit]
- Smalley, I.J.; Mavlyanova, N.G.; Rakhmatullaev, K.L.; Shermatov, M.S.; Machalett, B.; O’Hara Dhand, K.; Jefferson, I.F. The formation of loess deposits in the Tashkent region and parts of Central Asia; and problems with irrigation, hydrocollapse and soil erosion. Quat. Int. 2006, 152–153, 59–69. [Google Scholar] [CrossRef] [Scilit]
- Zan, J.; Ning, W.; Heller, F.; Fang, X.; Zhang, W.; Kang, J. Intensified Northern Hemisphere Glaciation Facilitates Continuous Accumulation of Late Pliocene Loess on the Western Margin of the Pamir. Geophys. Res. Lett. 2022, 49, e2022GL099629. [Google Scholar] [CrossRef] [Scilit]
- Zhang, C.; Yan, M.; Du, H.; Ban, J.; Chen, C.; Liu, Y.; Li, T. Mortality risks from a spectrum of causes associated with sand and dust storms in China. Nat. Commun. 2023, 14, 6867. [Google Scholar] [CrossRef] [Scilit] [PubMed]
- Song, Y.; Li, Y.; Cheng, L.; Zong, X.; Kang, S.; Ghafarpour, A.; Li, X.; Sun, H.; Fu, X.; Dong, J.; et al. Spatio-temporal distribution of Quaternary loess across Central Asia. Palaeogeog. Palaeoclim. Palaeoecol. 2021, 567, 110279. [Google Scholar] [CrossRef] [Scilit]
- Shi, Z.; Zhou, P.; Li, X.; Cheng, H.; Sha, Y.; Xie, X.; Liu, H.; Wu, J.; Liu, X. Distinct Holocene precipitation trends over arid Central Asia and linkages to westerlies and Asian monsoon. Quat. Sci. Rev. 2021, 266, 107055. [Google Scholar] [CrossRef] [Scilit]
- Wu, B.; Wang, J. Winter Arctic Oscillation, Siberian High and East Asian Winter Monsoon. Geophys. Res. Lett. 2002, 29, 3-1–3-4. [Google Scholar] [CrossRef] [Scilit]
- Issanova, G.; Kaldybayev, A.; Ge, Y.; Abuduwaili, J.; Ma, L. Spatial and Temporal Characteristics of Dust Storms and Aeolian Processes in the Southern Balkash Deserts in Kazakhstan, Central Asia. Land 2023, 12, 668. [Google Scholar] [CrossRef] [Scilit]
- Hu, Z.; Zhou, Q.; Chen, X.; Qian, C.; Wang, S.; Li, J. Variations and changes of annual precipitation in Central Asia over the last century. Int. J. Climatol. 2017, 37, 157–170. [Google Scholar] [CrossRef] [Scilit]
- Chen, F.; Huang, W.; Jin, L.; Chen, J.; Wang, J. Spatiotemporal precipitation variations in the arid Central Asia in the context of global warming. Sci. China Earth Sci. 2011, 54, 1812–1821. [Google Scholar] [CrossRef] [Scilit]
- Yu, F.; Price, K.P.; Ellis, J.; Shi, P. Response of seasonal vegetation development to climatic variations in eastern central Asia. Remote Sens. Environ. 2003, 87, 42–54. [Google Scholar] [CrossRef] [Scilit]
- Lu, H.; An, Z. Pretreated methods on loess-palaeosol samples granulometry. Chin. Sci. Bull. 1998, 43, 237–240. [Google Scholar] [CrossRef] [Scilit]
- ISO 13320; Particle Size Analysis—Laser Diffraction Methods. ISO: Geneva, Switzerland, 2020.
- Bokhorst, M.P.; Vandenberghe, J.; Sümegi, P.; Łanczont, M.; Gerasimenko, N.P.; Matviishina, Z.N.; Marković, S.B.; Frechen, M. Atmospheric circulation patterns in central and eastern Europe during the Weichselian Pleniglacial inferred from loess grain-size records. Quat. Int. 2011, 234, 62–74. [Google Scholar] [CrossRef] [Scilit]
- Blott, S.J.; Pye, K. GRADISTAT: A grain size distribution and statistics package for the analysis of unconsolidated sediments. Earth Surf. Process. Landf. 2001, 26, 1237–1248. [Google Scholar] [CrossRef] [Scilit]
- Wang, B.; Linho. Rainy Season of the Asian–Pacific Summer Monsoon. J. Clim. 2021, 15, 386–398. [Google Scholar]
- Wang, W.; Samat, A.; Abuduwaili, J.; Ge, Y.; De Maeyer, P.; Van de Voorde, T. Temporal characterization of sand and dust storm activity and its climatic and terrestrial drivers in the Aral Sea region. Atmos. Res. 2022, 275, 106242. [Google Scholar] [CrossRef] [Scilit]
- Obreht, I.; Zeeden, C.; Schulte, P.; Hambach, U.; Eckmeier, E.; Timar-Gabor, A.; Lehmkuhl, F. Aeolian dynamics at the Orlovat loess–paleosol sequence, northern Serbia, based on detailed textural and geochemical evidence. Aeolian Res. 2015, 18, 69–81. [Google Scholar] [CrossRef] [Scilit]
- Vandenberghe, J. Grain size of fine-grained windblown sediment: A powerful proxy for process identification. Earth-Sci. Rev. 2013, 121, 18–30. [Google Scholar] [CrossRef] [Scilit]
- Friese, C.A.; van der Does, M.; Merkel, U.; Iversen, M.H.; Fischer, G.; Stuut, J.-B.W. Environmental factors controlling the seasonal variability in particle size distribution of modern Saharan dust deposited off Cape Blanc. Aeolian Res. 2016, 22, 165–179. [Google Scholar] [CrossRef] [Scilit]
- Ratmeyer, V.; Balzer, W.; Bergametti, G.; Chiapello, I.; Fischer, G.; Wyputta, U. Seasonal impact of mineral dust on deep-ocean particle flux in the eastern subtropical Atlantic Ocean. Mar. Geol. 1999, 151, 241–252. [Google Scholar] [CrossRef] [Scilit]
- Skonieczny, C.; Bory, A.; Bout-Roumazeilles, V.; Abouchami, W.; Galer, S.J.G.; Crosta, X.; Diallo, A.; Ndiaye, T. A three-year time series of mineral dust deposits on the West African margin: Sedimentological and geochemical signatures and implications for interpretation of marine paleo-dust records. Earth Planet. Sci. Lett. 2013, 364, 145–156. [Google Scholar] [CrossRef] [Scilit]
- Chen, F.; Chen, J.; Huang, W.; Chen, S.; Huang, X.; Jin, L.; Jia, J.; Zhang, X.; An, C.; Zhang, J.; et al. Westerlies Asia and monsoonal Asia: Spatiotemporal differences in climate change and possible mechanisms on decadal to sub-orbital timescales. Earth-Sci. Rev. 2019, 192, 337–354. [Google Scholar] [CrossRef] [Scilit]
Disclaimer/Publisher’s Note: The statements, opinions and data contained in all publications are solely those of the individual author(s) and contributor(s) and not of MDPI and/or the editor(s). MDPI and/or the editor(s) disclaim responsibility for any injury to people or property resulting from any ideas, methods, instructions or products referred to in the content. |
© 2026 by the authors. Licensee MDPI, Basel, Switzerland. This article is an open access article distributed under the terms and conditions of the Creative Commons Attribution (CC BY) license.