


Abstract
Lubricant oils emit strongly volatile organic compounds (VOCs) in industrial settings. The oil–gas interface concentration is a key parameter to drive the emission process. In this study, a dynamic headspace sampling method was proposed to characterize the interface concentration with the advantage of being simple and low cost. A critical sampling flow rate was theoretically derived as DA/L, where D (m2/s) is the diffusion coefficient of VOCs in the air, A (m2) is the surface area of the oil–gas interface, and L (m) is the height of the headspace. Experimental results prove that oil–gas equilibrium can be readily maintained by a sampling flow rate lower than the critical one. Four lubricant oils were characterized by the proposed method. The results indicate that the top five species accounted for 64–85% of the total VOC concentrations. Butylhydroxytoluene, an antioxidant additive, is the only compound among the top five species for all four lubricant oils. A V-shaped volatility distribution pattern was consistently observed. The vaporization enthalpies of VOCs for lubricant oils are smaller than those for pure substances, indicating weaker molecular interactions. The method offers a new powerful tool to characterize VOC pollution and consequently prioritize source control.
1. Introduction
Lubricant oils are indispensable in industrial operations, serving critical roles in reducing friction, preventing equipment wear, and enhancing energy efficiency across sectors such as manufacturing, automotive, and petrochemicals [1,2,3,4]. However, these oils emit volatile organic compounds (VOCs) heavily [5,6] and their extensive use leads to severe health risks to workers and surrounding communities [7,8,9,10,11]. Similarly, short-chain alkanes and oxygenated VOCs contribute to photochemical ozone formation, exacerbating air pollution and indirect health impacts [12,13,14].
Historically, research on lubricant emissions has predominantly focused on particulate matter generated during mechanical processes such as grinding, tempering, turning, cleaning, and thread cutting [15,16]. In contrast, investigations into gaseous VOCs from lubricants have been relatively sparse. This knowledge gap probably stems from the complex chemical composition of lubricant-derived VOCs (alkanes, aromatics, and oxygenated compounds) and/or methodological challenges in measurement. Emission of VOCs from lubricant oils is driven by the oil–gas interface concentration (designated as Cs0), which is similar to emissions from wet building materials such as paint [17,18,19,20]. Methodological advances in measurement of the interface concentration is critical for better emission control and exposure mitigation.
Chamber testing is the most widely used method to quantify pollutant emission from source materials [21,22]. Materials are put in a ventilated chamber where environmental conditions such as temperature and humidity are controlled [23,24,25]. As a significant amount of air travels through the chamber, the pollutant concentration cannot reach equilibrium with the material–gas interface concentration. Therefore, the interface concentration cannot be directly measured by this type of method and an additional model fitting process is usually needed [26,27,28].
Another mainstream measurement technique is the headspace method [29,30]. Materials are put in an airtight vessel and the space above the material in the vessel is empty. After equilibrium is established between gas-phase concentration in the headspace and the material phase, passive sampling is usually used to sorb pollutants in the headspace, which is consequently used to determine gas-phase concentration [31,32]. While this method minimizes operational complexity and energy consumption, passive sampling rates and their accuracy are inherently sensitive to the physicochemical properties of the target VOCs such as molecular weight, polarity, and vapor pressure of VOCs [32,33,34], necessitating rigorous pre-calibration for reliable results.
In this study, we propose a dynamic headspace sampling framework that integrates precision-controlled gas circulation with sorbent trapping to quantify oil–gas interfacial VOC concentrations (Cs0). The critical sampling flow rate was theoretically determined based on a mass balance model. The dynamic headspace sampling technique was realized by using a low-flow-rate pump our group developed before. Then the framework was verified by experimental tests and used to characterize VOC emission of four lubricant oils. By bridging the gap between laboratory precision and field operational demands, this methodology advances the measurement of VOC emission characteristic parameters for occupational health and environmental compliance.
2. Materials and Methods
2.1. Theoretical Method Development
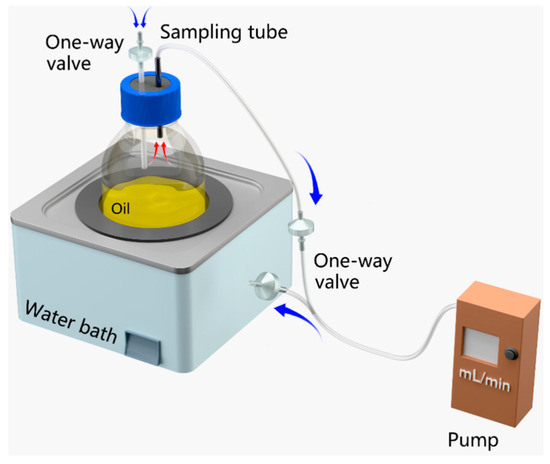
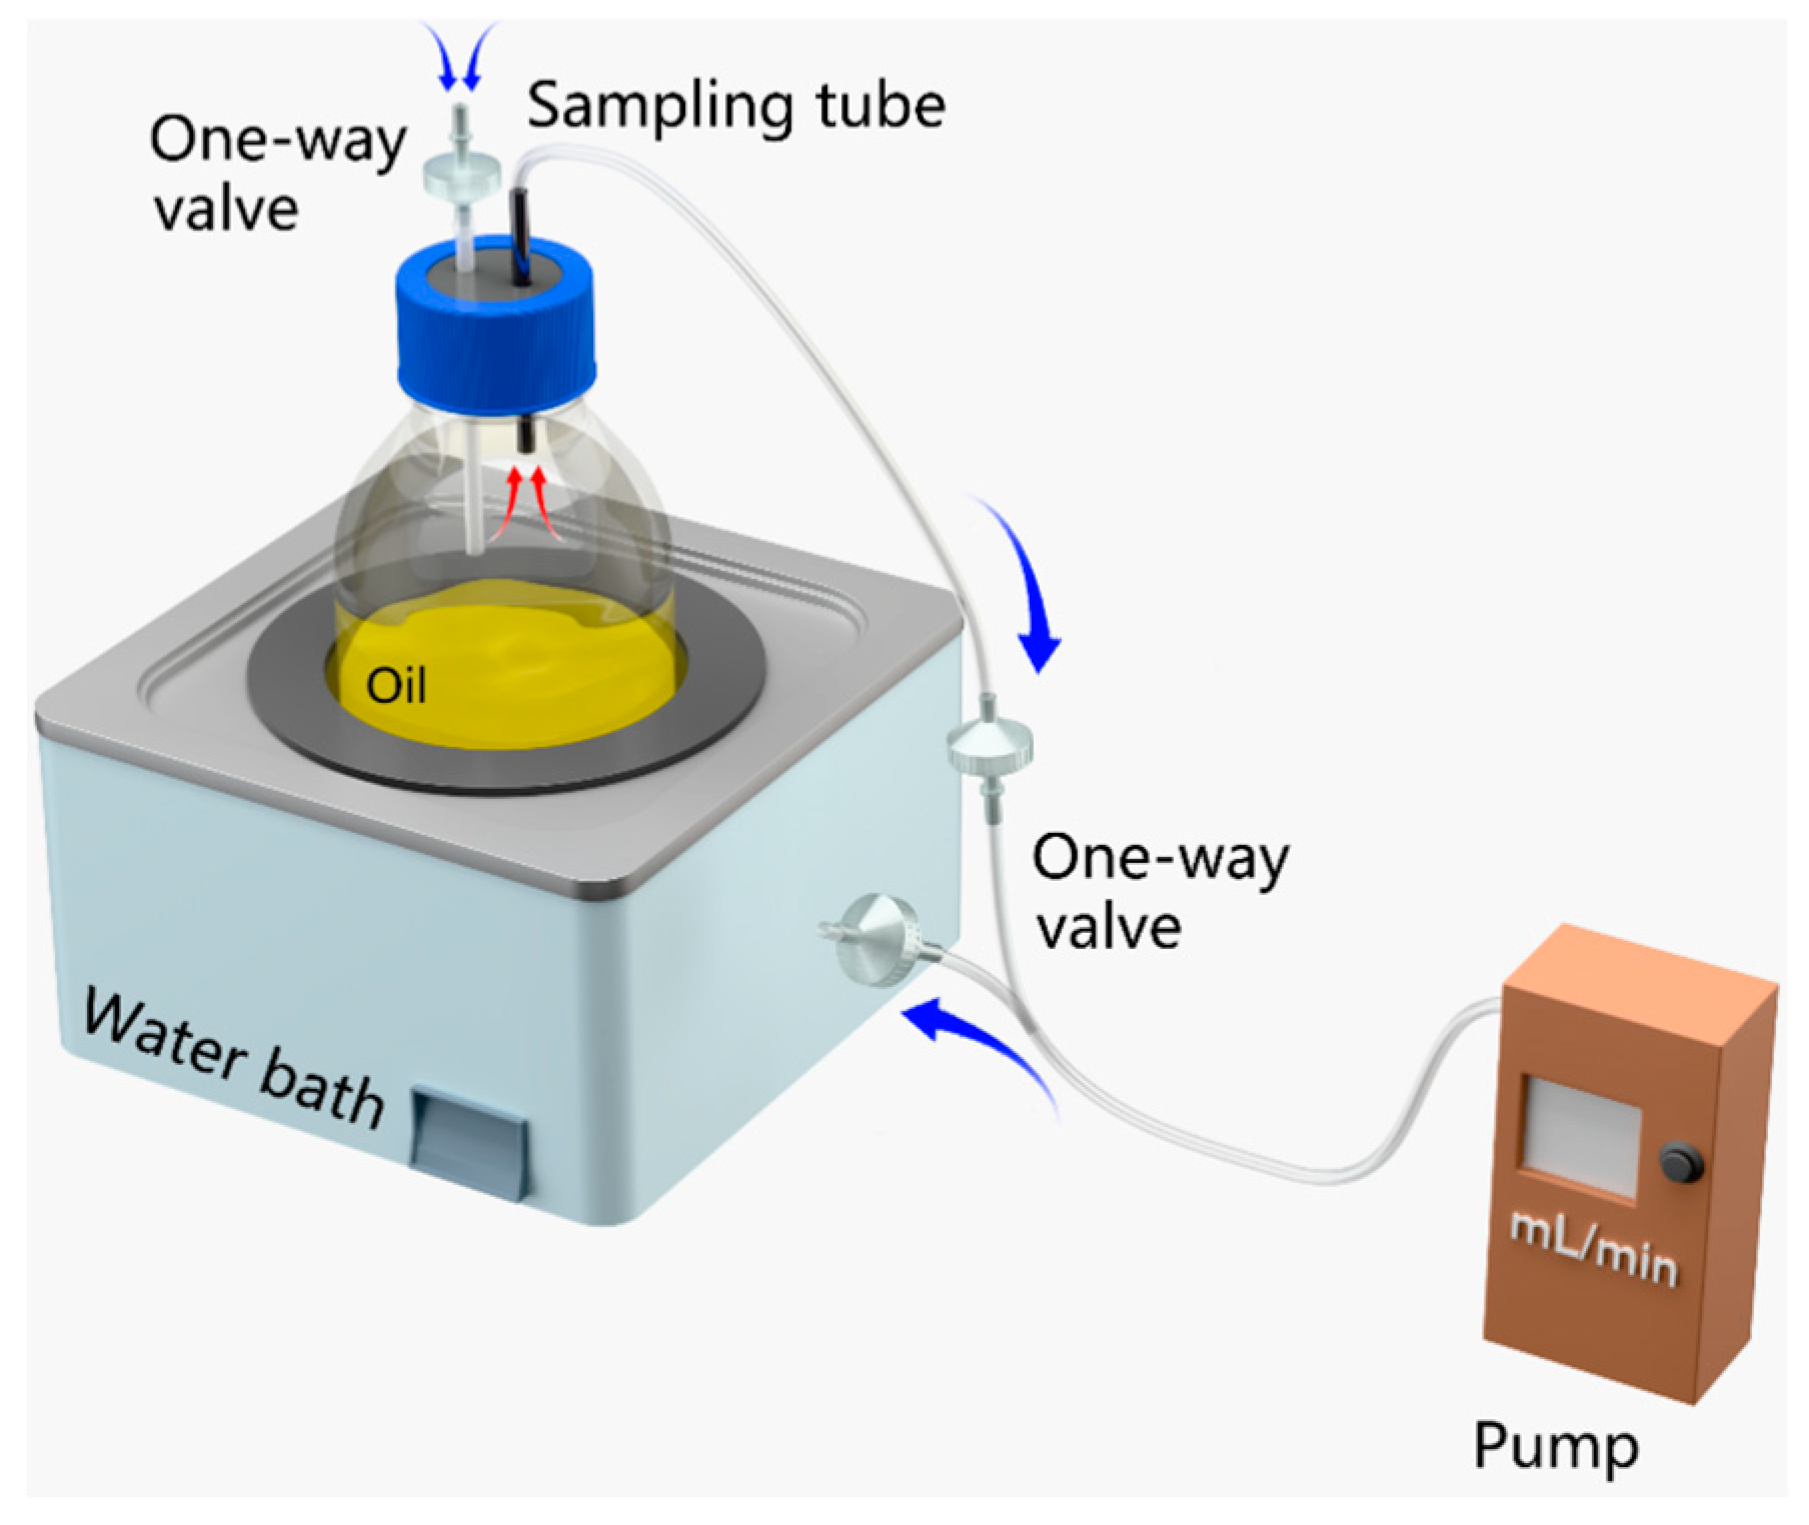
A dynamic headspace sampling method was conceptualized as illustrated in Figure 1. A glass bottle is put in a water bath to maintain the temperature. The tested oil is put into the bottle. The septum of the bottle has two openings. A tube (tube 1) is connected to one of the openings and further extended to about 1 cm above the oil surface. A sampling Tenax TA tube (CAMSCO, Houston, TX, USA) is connected to the other opening and further extended into the bottle by about 1 cm. A sampling pump is used to drive air to go into the bottle along another soft tube (tube 2). The air is saturated by the oil surface and then sampled through the Tenax TA tube, where VOCs in the air are captured. Several one-way valves are used in tubes 1 and 2 to regulate the air flow direction. A mass balance model is proposed to describe VOC emissions in the bottle:
where C (μg/m3) is the pollutant concentration in the chamber, V (m3) is the volume of the chamber, hm (m/s) is the mass transfer coefficient, A (m2) is the surface area, Cs0 (μg/m3) is the interface concentration, and Q (m3/s) is the sampling flow rate. At the steady state, the pollutant concentration in the chamber (Css) is:
Figure 1.
Test rig for the dynamic headspace sampling method. The arrows indicate the airflow direction.
If the sampling flow rate is significantly smaller than hmA (e.g., Q < 0.05hmA), then Css can be used to approximate Cs0 with an acceptable error in practice (5% for the example above). With such a small flow rate, mass transfer in the chamber could be subject to diffusion, and hm can be described as D/L, where D is the diffusion coefficient of a pollutant in the air and L is the height of the sampling chamber. For typical VOCs of concern, their diffusion coefficients are in the order of 10−5 m2/s and vary due to molecular weights and structures [32].
2.2. Test System
We used a bottle with a diameter of 8.3 cm and a height of 10 cm as an oil container. About 54 mL of lubricant oil was added, resulting in a headspace height of 9 cm. All of the connecting tubes were made of Teflon. Based on the parameterization above, DA/L is about 36 mL/min (D is 10−5 m2/s, A = 3.14 × 8.3 × 8.3/4 = 54 cm2, L = 9 cm), and 0.05DA/L (critical sampling flow rate, Qr) is 1.8 mL/min. It means that the sampling rate used should be around 1.8 mL/min to obtain the oil–air interface concentration. These low sampling flow rates were realized by a pump developed by our group [35]. One lubricant oil was used to verify the conceptual methodology at room temperature. Four sampling flow rates (0.9, 1.8, 3.2, and 6.9 mL/min) were used in the verification test, spanning across the critical value of 1.8 mL/min. The sampling time was 48 h for the first three flow rates and 24 h for the last one, which results in a sampling volume of 2.7–9.9 L and assures sufficient sampled mass for detection.
Once the methodology was verified, the VOC emissions of four lubricant oils (including the one used for the verification test) were characterized. The influence of temperature was examined at 20 °C, 35 °C, 50 °C, and 65 °C, which covers the typical working temperature range. We used Tenax TA tubes as sampling devices. The tubes have a diameter of 5 mm and a length of 89 mm, with 200 mg of 60–80 mesh Tenax TA as the filler material. Based on VOC pollution characteristics obtained before, we quantified concentrations for 24 target VOCs in this study and the sum of these VOCs was taken as total VOC (TVOC). All the tests were repeated three times and blank-corrected.
2.3. Chemical Analysis
After sampling, the Tenax TA tubes were sealed with bronze caps and transferred to the laboratory for analysis via thermal desorption–gas chromatography–mass spectrometry. The analytical system consists of a PerkinElmer ATD device (PerkinElmer, Shelton, CT, USA) and a 7890A/5975C gas chromatography–mass spectrometry (TD-GC/MS) instrument (Agilent, Santa Clara, CA, USA). The thermal desorption was conducted at 330 °C for 12 min. The helium flow rate was 56 mL/min, while the internal cold trap was −30 °C. The VOCs were desorbed from the cold trap and introduced into the GC column for 3 min at 320 °C with a helium flow of 16 mL/min. The desorbed VOCs were separated by a capillary gas chromatography column (DB-624, 60 m × 250 mm × 1.4 mm). The heating temperature of the gas chromatograph was 45 °C for the first 3 min, followed by a gradual increase to 180 °C at 6 °C/min, and finally reaching 250 °C at a rate of 30 °C/min. The temperature was kept at this level for 10 min. The MS operating parameters were as follows: a scanning range of 45–450 amu, an ion impact energy of 70 eV, and a mass spectrometer source temperature of 230 °C.
3. Results
3.1. Verification of Critical Sampling Flow Rate
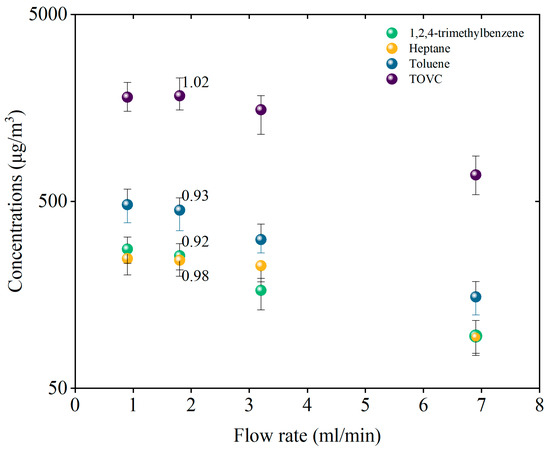
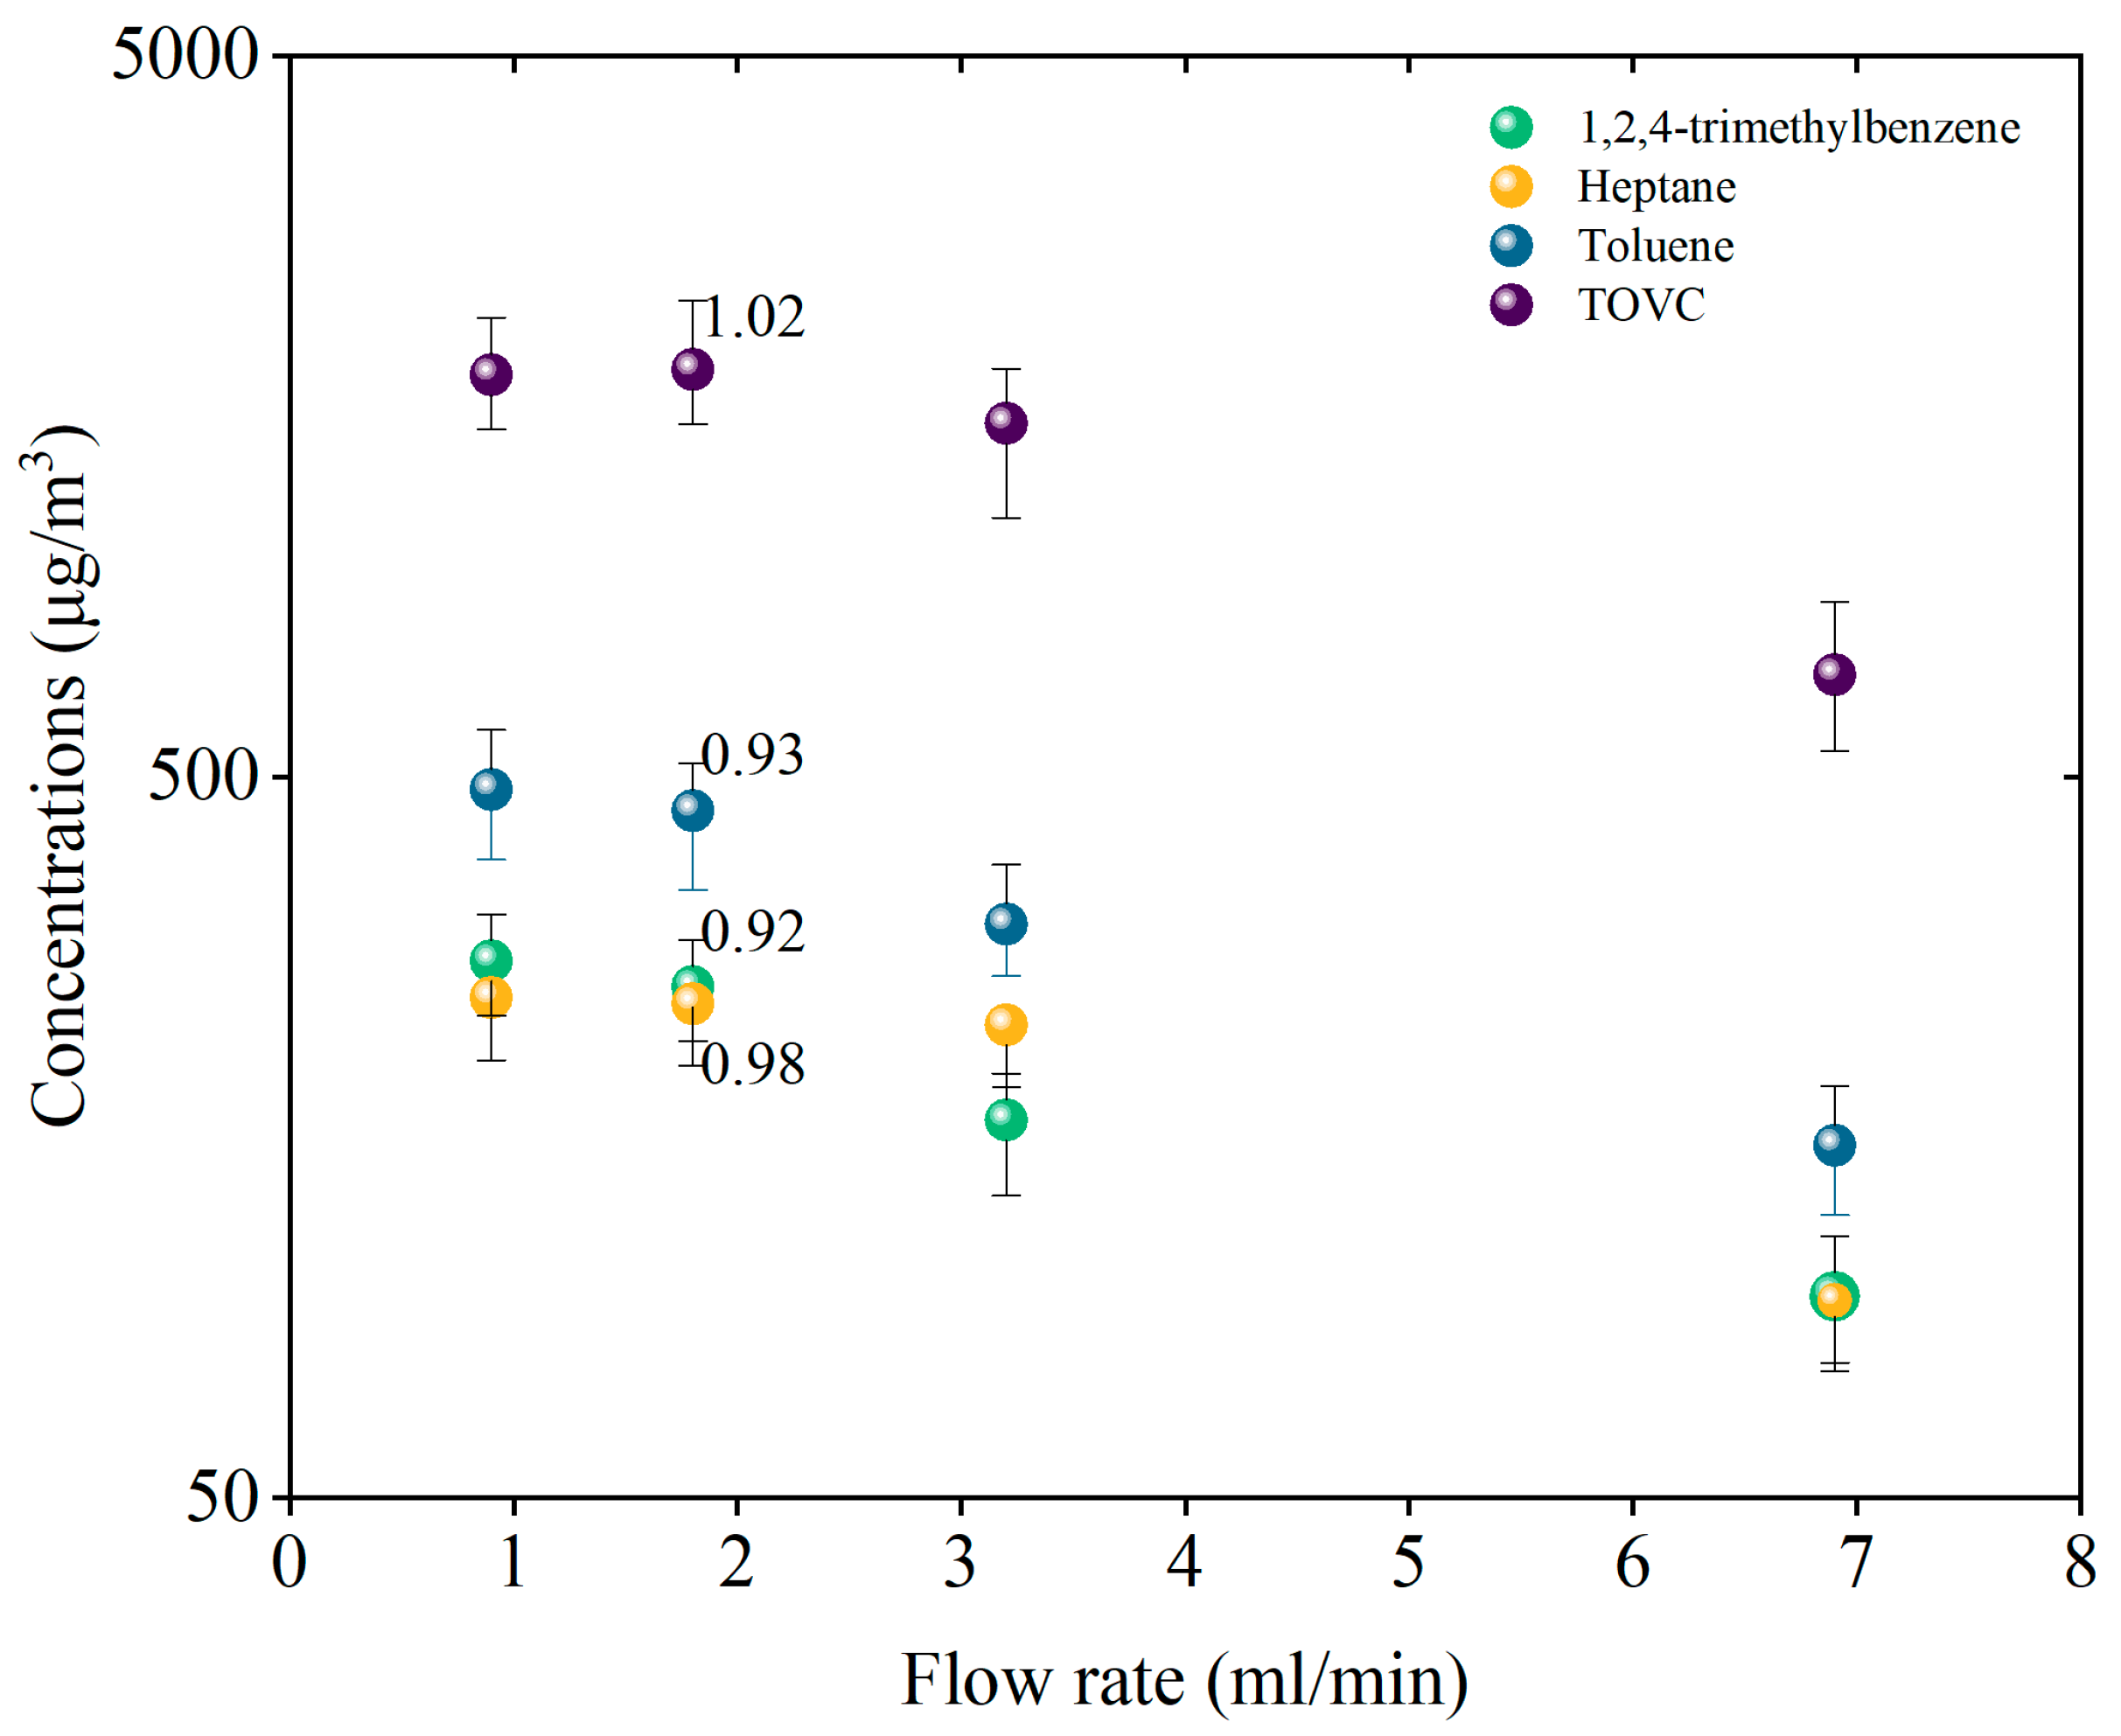
Concentrations of TVOC were determined under four sampling flow rates, as shown in Figure 2. It can be seen that as the sampling flow rate increases, TVOC concentration decreases. The depletion of TVOC by sampling cannot be adequately replenished by emission from the oil–air interface. As the sampling flow rate decreases, the depletion rate tends to be followed closer by the replenishing rate. The ratio of TVOC concentration at 1.8 mL/min (the critical sampling flow rate) to that at 0.9 mL/min is 1.02. It indicates that the equilibrium of chemical potential between oil and air in the bottle can be readily maintained under such sampling rates. We also examined the top three VOC species, which are toluene, 1,2,4-trimethylbenzene, and heptane. Their concentrations, taking more than half of TVOC, exhibited similar response trends against sampling flow rate. Concentration ratios at 1.8 mL/min to 0.9 mL/min are 0.93, 0.92, and 0.98, respectively, all close to unity.
Figure 2.
VOC concentrations at various sampling flow rates at 20 °C. The numbers next to data for a flow rate of 1.8 mL/min indicate the ratio of concentration at 1.8 mL/min to that at 0.9 mL/min for each species or TVOC.
3.2. Emission Levels of Lubricant Oils
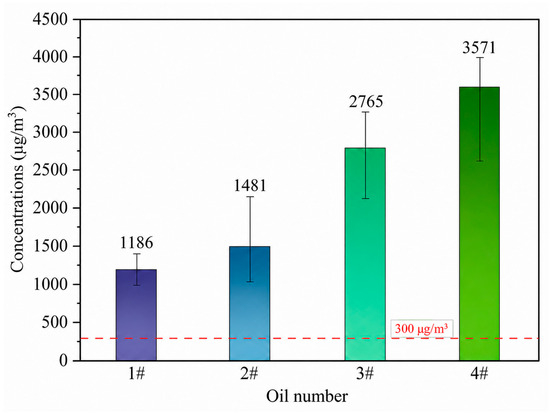
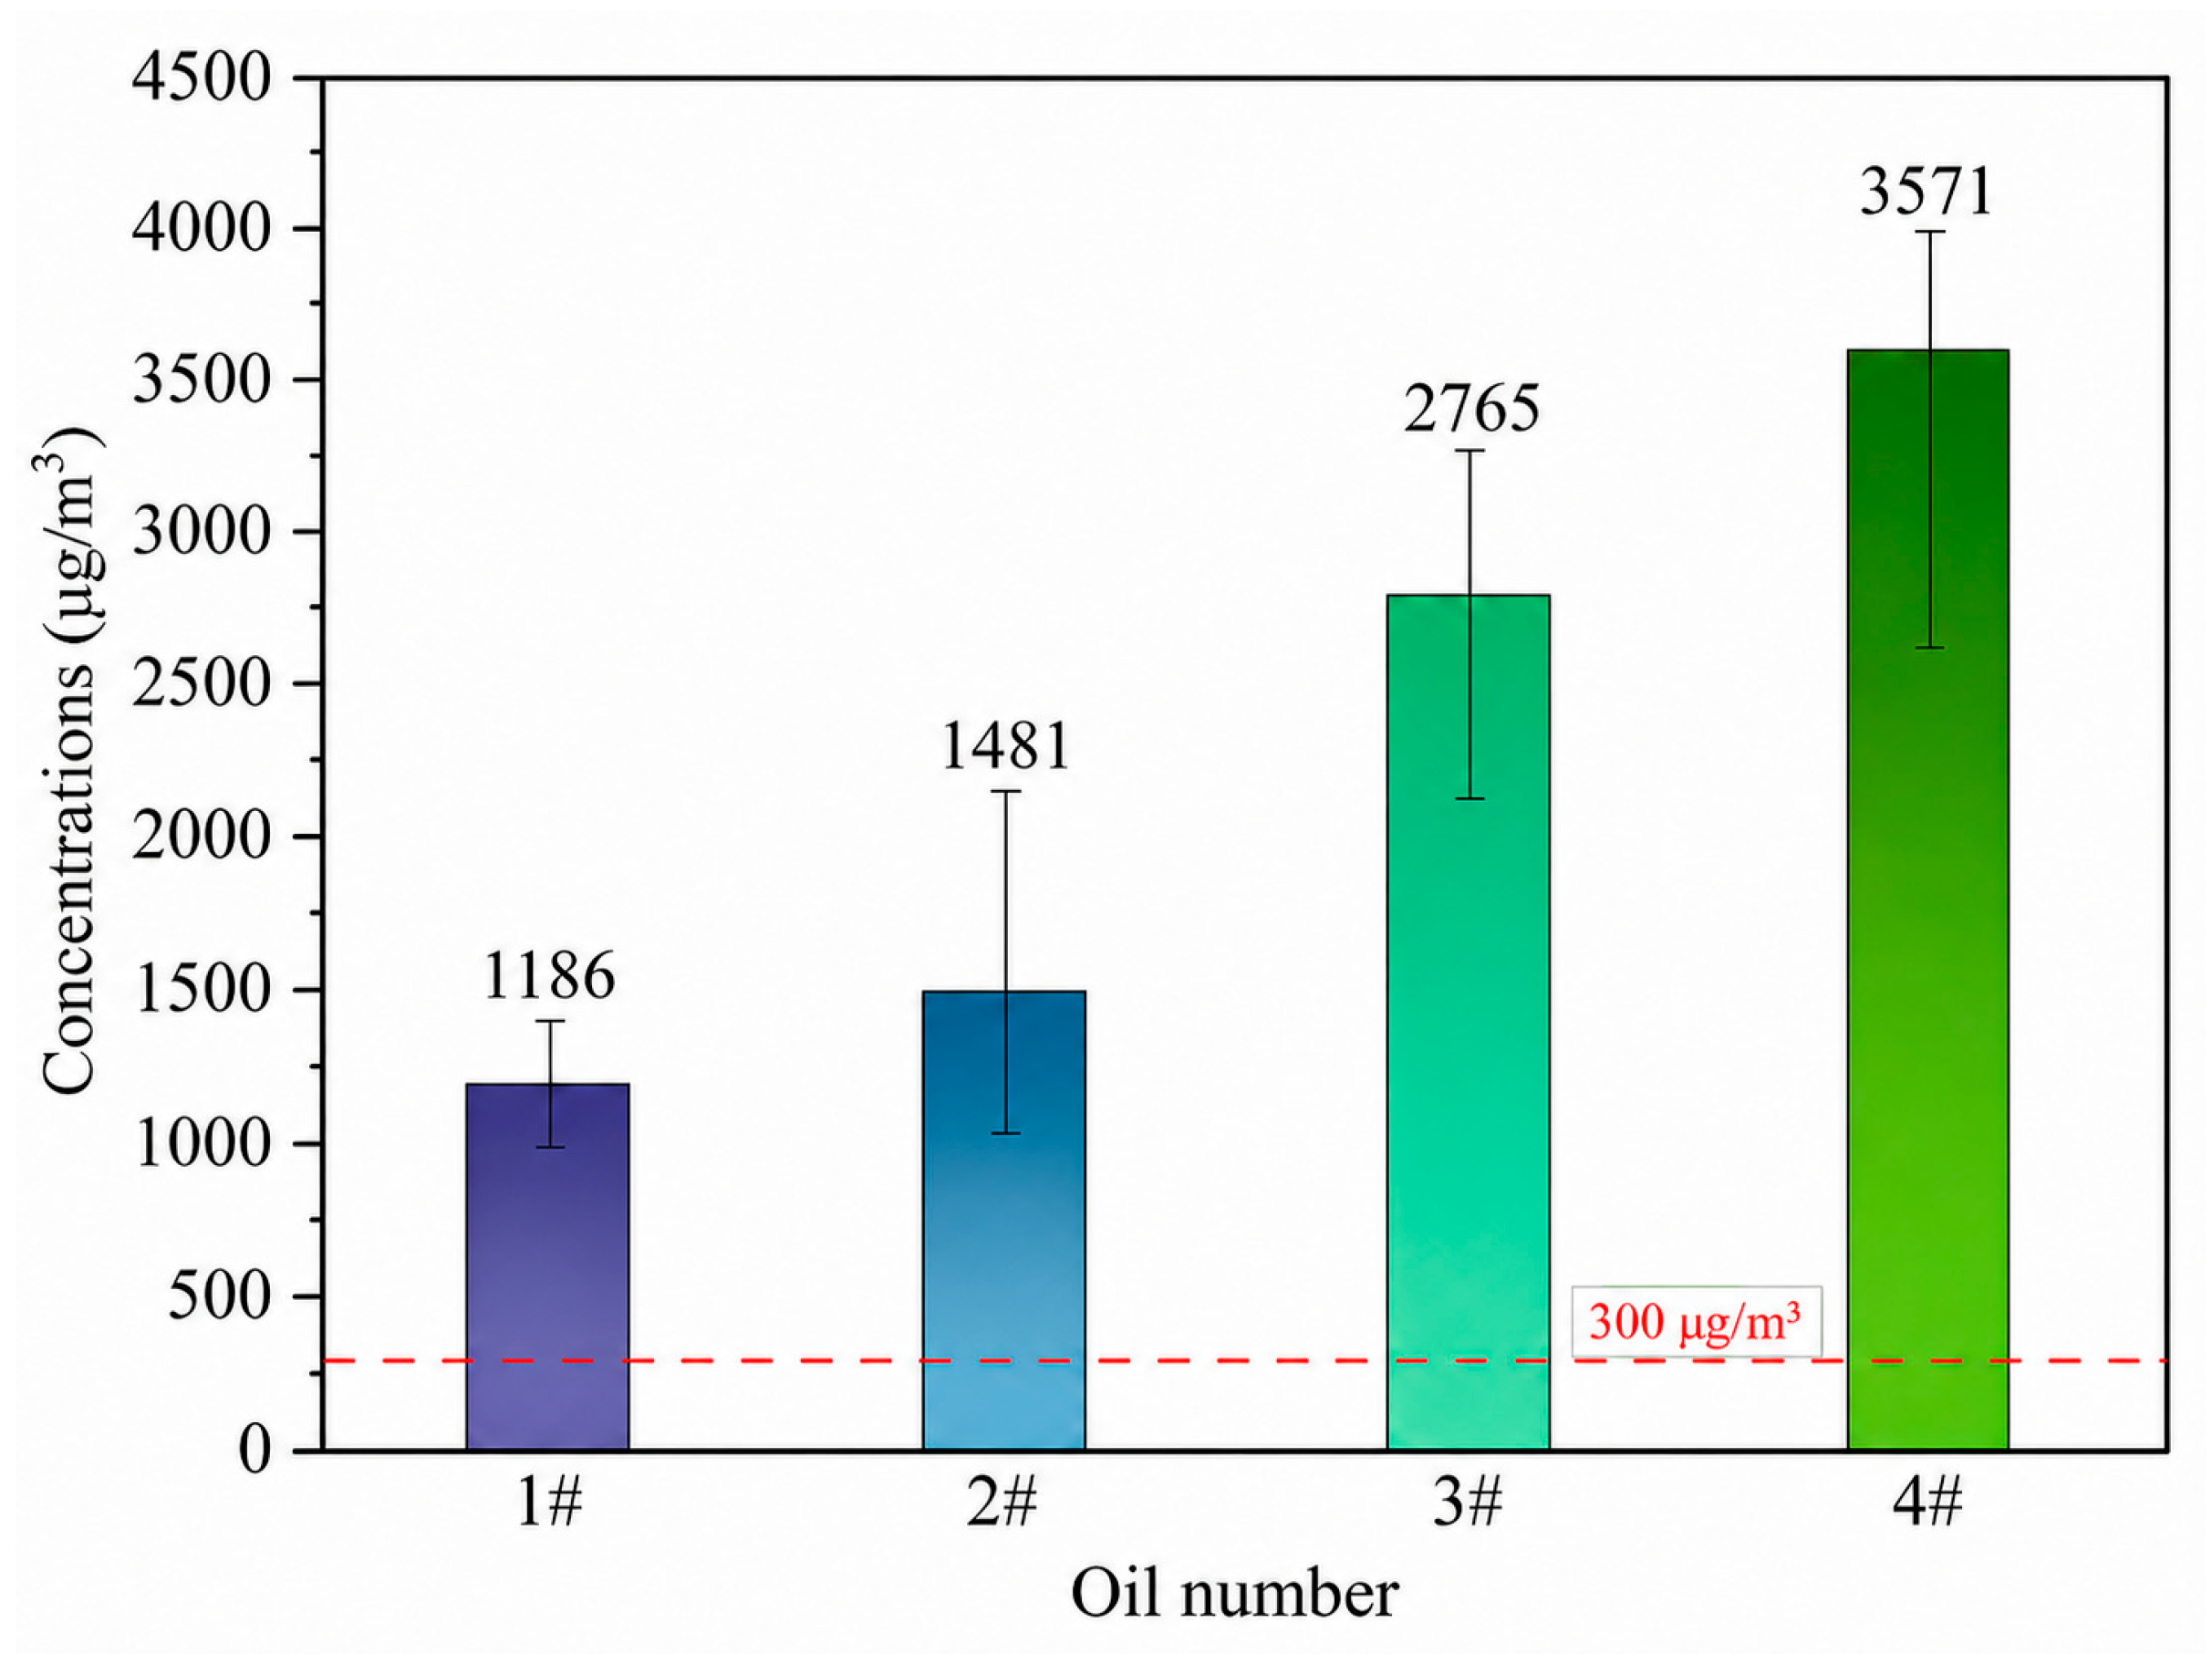
We used the dynamic headspace method to study the emission characteristics of four lubricant oils. These oils are used for hydraulic machines, steam turbines, diesel engines, and air compressors, respectively. TVOC concentrations of these four lubricant oils are in the range of 1186 μg/m3 to 3571 μg/m3 at 20 °C, as shown in Figure 3. These are much higher than the TVOC threshold limits for wood-based materials in China (200–400 μg/m3) [36]. This further confirms that lubricant oils are important sources of VOC pollution. In contrast, these TVOC levels are lower than those obtained for flammable oils such as gasoline and crude oils, which are typically in the range of several to several hundred mg/m3 [37]. Such a difference between lubricant oils and flammable oils is consistent with previous studies [29,38].
Figure 3.
TVOC concentrations in the headspace of the four lubricant oils at 20 °C. The red dotted line indicates the TVOC threshold of 300 μg/m3 for wood-based materials in China.
3.3. Emission Species Profiles of Lubricant Oils
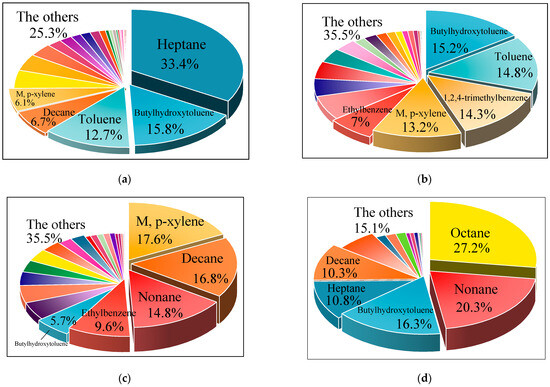
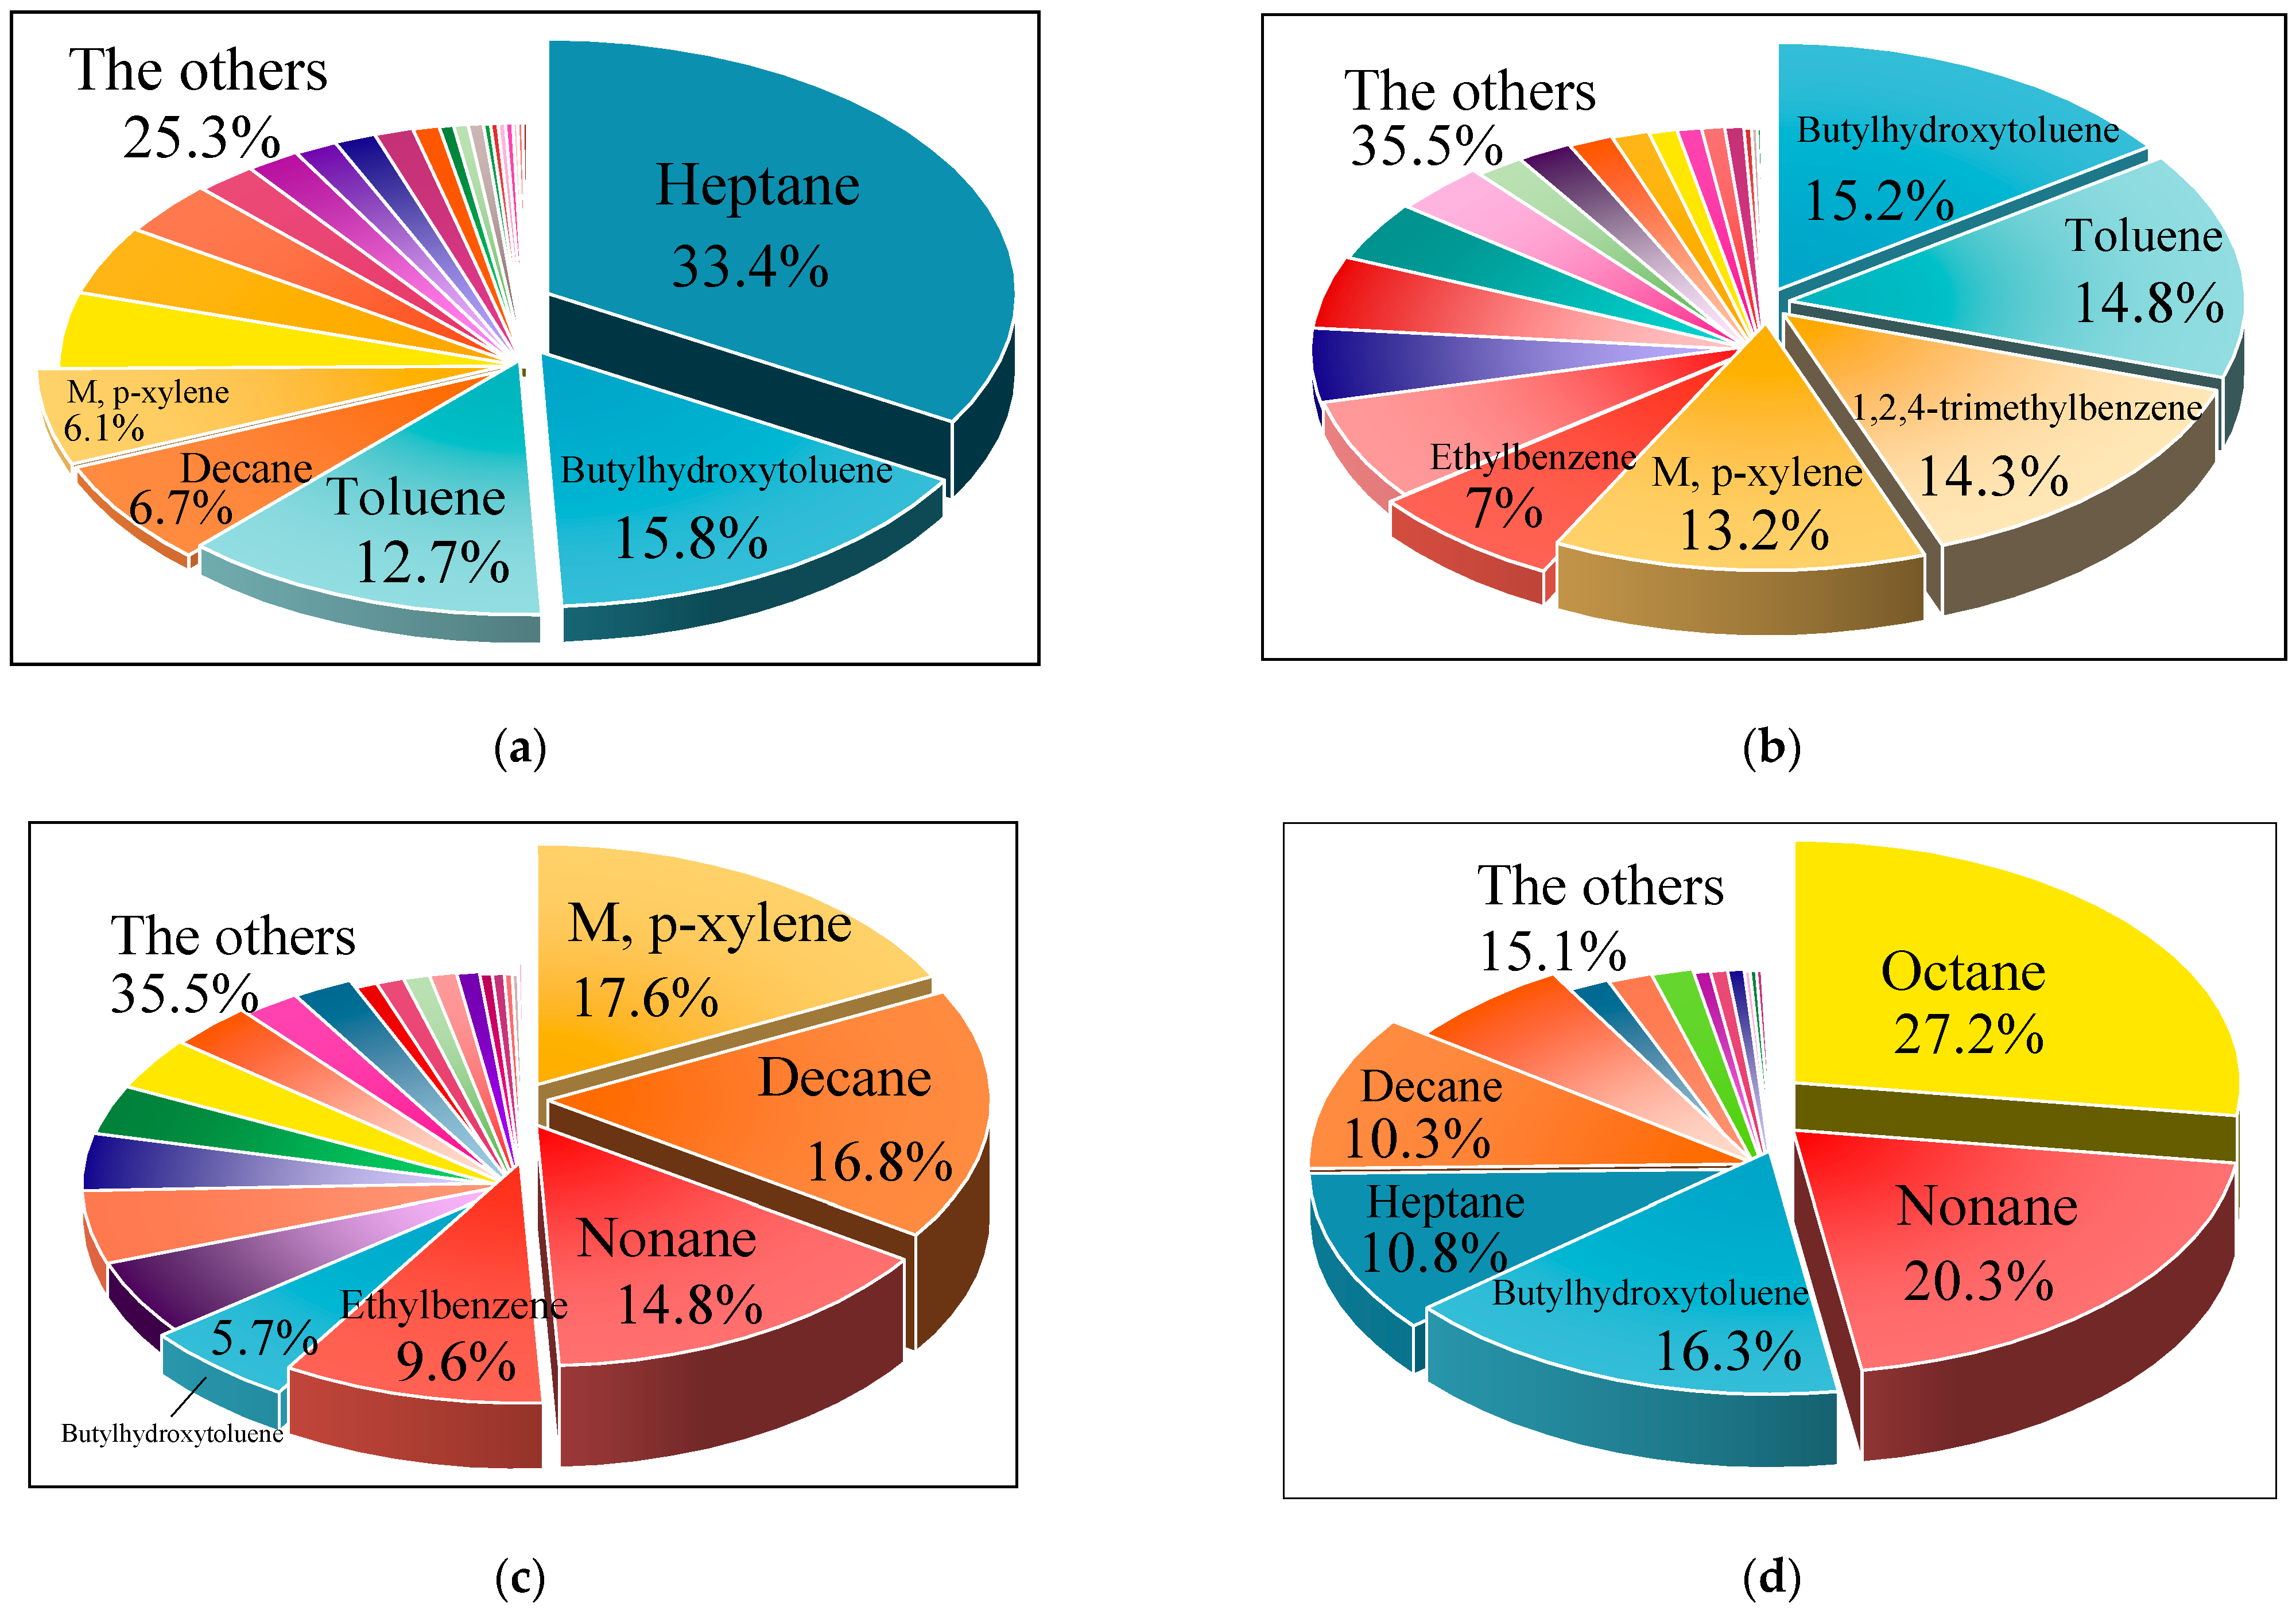
We examined the species profiles of VOCs in the headspace for the four lubricant oils at 20 °C, as shown in Figure 4. It can be seen that for lubricant oils 1# and 3#, alkanes and aromatics each take about half of the total concentrations (58% and 42% for 1#, 47% and 53% for 3#). For lubricant oil 2#, aromatics dominate headspace VOCs (90%). In contrast, alkanes overwhelm aromatics by 71% versus 39% for lubricant oil 4#. This suggests remarkable differences in species profiles between lubricant oils. It might provide the possibility to conduct source apportionment of VOC pollution based on these species profiles.
Figure 4.
Species profiles of the four lubricant oils. (a–d) for oils 1#–4#. Different colors distinguish different VOC species. The individually labeled slices represent the major VOC species, while “The others” represents the sum of the remaining quantified VOC species that were not individually labeled for clarity.
More specifically, the top five species were highlighted for these four lubricant oils, which take 64–85% of the total VOC concentrations. Butylhydroxytoluene (BHT), an antioxidant additive [39], is the only compound among the top five species for all four lubricant oils. It implies an important role of BHT for oil performance. Its concentration is relatively close for oils 1#, 2#, and 3# (157–225 μg/m3), but much higher in oil 4# (584 μg/m3). Oil 4# could be added with more BHT than the other three oils. Decane (C10) appears among the top five species for three of the lubricant oils (1#, 3#, and 4#), as well as m,p-xylene (1#, 2#, and 3#).
It is noted that a previous study investigated headspace VOCs for lubricant oils, and aromatics were not detected [38]. This might be due to the fact that they tested different lubricant oils. Another possible reason lies in the sampling procedure. In their study, a small amount of headspace air (100 μL) was sampled by a syringe and then analyzed. In the present dynamic headspace method, we sampled about 5 L of air and VOCs were concentrated in a sampling tube. It allows VOCs of concern (such as carcinogenic aromatics) to be detected.
3.4. Volatility Distribution of Headspace VOCs
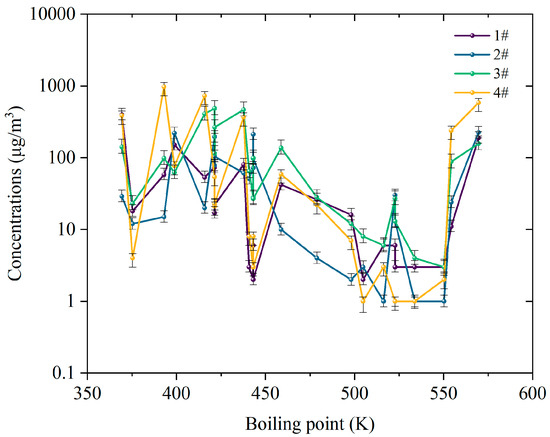
Despite differences in emission levels and species profiles (Bray–Curtis distances ranged from 0.386 to 0.697, indicating noticeable compositional differences in their VOC species profiles; see Supplementary Materials), we observed a similar volatility distribution of headspace VOCs for the four lubricant oils, as illustrated in Figure 5. Generally, for VOCs with boiling points below 550 K, their interface concentrations increase as boiling points decrease. It might be two possible reasons. One is that VOCs with lower boiling points have a stronger volatility. The other is that these VOCs could have a relatively high mass fraction in the oil phase in the first place. We did not measure the composition profile of the oil itself due to remarkable technique challenges. Distinguishing these two reasons is an important issue for future studies.
Figure 5.
Concentration distribution based on boiling points.
It is noticeable that VOCs with boiling points between 350 K and 450 K hold 74–83% for the four lubricant oils. It indicates that these VOCs are major contributors to TVOC pollution. It is of interest to see an upward tail of the volatility line above 550 K. This is driven by two antioxidants, BHT (188–584 μg/m3 for the four oils) and 2,6-di-tert-butylphenol (11–239 μg/m3 for the four oils). This V-shape of the volatility line reflects a unique composition feature of lubricant oils: the volatile species act as lubricants and the semi-volatile ones as anti-oxidant guards.
3.5. Influence of Temperature on Interface Concentrations
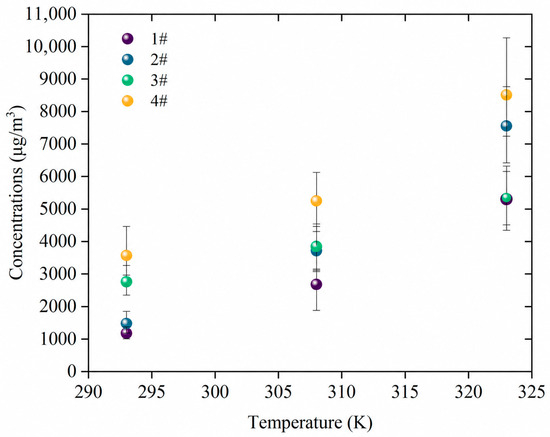
VOCs in the headspace were measured under 20 °C, 35 °C, and 50 °C, as shown in Figure 6. TVOC concentrations increased by a factor of 4.5, 5.1, 1.9, and 2.4, respectively for lubricant oils 1#–4#, as temperature increased from 20 °C to 50 °C. It indicates that the emissions of VOCs would be dramatically enhanced at high temperature, similar to other VOC sources [11,40,41]. The increasing extent varied across VOC species. For example, in lubricant oil 1#, BHT concentration increased by a factor of 12, while C7, another major component in the headspace, increased by only 2.
Figure 6.
Impact of temperature on TVOC concentrations in the headspace.
The increasing extent is mainly governed by the vaporization enthalpy in the lubricant oil (designated as ΔHoil, J/mol) [42]. We obtained ΔHoil by fitting ln(Cs0) to 1/T (the slope is equal to −ΔHoil/R, where R is the gas constant), as listed in Table 1. It is of interest to see that the vaporization enthalpy in the lubricant oil is positively correlated with the boiling point for each lubricant oil. Indeed, these two parameters both reflect the intensity of molecular interactions such as van der Waals interactions and hydrogen donor–acceptor interactions. We also notice that vaporization enthalpy in the lubricant oil is consistently smaller than the vaporization enthalpy of pure substances. It implies that molecular interactions between VOCs and bulk oils are weaker than those between the species themselves. It is unsurprising that the evaporation enthalpy of a specific VOC (e.g., light alkanes or aromatics) differs when dissolved in distinct lubricant matrices. This deviation arises from non-ideal molecular interactions between the VOC and the lubricant’s components. Lubricants comprise base oils (mineral/synthetic) and additive packages (e.g., antioxidants, anti-wear agents), creating a complex microenvironment that modulates VOC energetics.
Table 1.
Vaporization enthalpy of the top 5 VOCs in the lubricant oils.
4. Discussion
The present study introduced a dynamic headspace method to characterize emissions of VOCs from lubricant oils. This approach synergizes the operational simplicity of static headspace with the precision of dynamic sampling, addressing critical gaps in traditional techniques. Enrichment using a substantial amount of sampling volume amplifies trace but toxic VOC signals (such as aromatics) compared to one single sampling by a syringe. In addition, the total cost of the whole experimental setup is in the order of 10,000 yuan, which is quite affordable for lab analysis.
The VOC concentration profile of the oil–gas interface is unique for each lubricant oil. Some signature VOCs or their combinations represent fingerprint information about source contribution. For example, the top five VOCs for the four lubricant oils tested here are different from each other in both qualitative and quantitative terms. This information can help differentiate VOCs from various sources, as composition-based fingerprints have also been used for source interpretation of indoor organic pollutants [43]. The chemical mass balance model used for source apportionment of PM2.5 might be adaptive to VOCs. The results of source apportionment are needed to prioritize source control and improve the efficiency of intervention efforts [44].
Researchers have found that VOC features of the oil–gas interface also contain signature information about the health status of lubricant oils [30,45,46,47]. Antioxidants were tested in the headspace of engine oil at low mileage. In contrast, some degradation VOCs were identified in used oils. These results suggest that, like health diagnosis using VOCs in exhaled human breath [48,49,50], the VOC status of the oil–gas interface can reveal the status of lubricant oils. It might act as an alternative technique to perform multimodal conditional maintenance and/or fault diagnosis and detection for critical engines.
The present study is subject to several limitations which should be addressed in the future. Firstly, the sampling device could be improved to increase the critical sampling flow rate and thus reduce the sampling time. A shorter headspace height and a larger oil–gas surface area are beneficial. Secondly, we only tested new lubricant oils in the current study. Oils at different service lifetimes should be tested to elucidate any differences between them. Particularly, some lubricant oils could have more water in them as service time increases. The effect of water molecules on the headspace gas profile is unknown. Lastly, we did not measure oil phase components due to technique challenges. The oil–gas partition coefficient cannot be determined. This is an important issue for future studies.
5. Conclusions
This study offers a new dynamic headspace sampling method to quantify the lubricant oil–gas interface concentrations of volatile organic compounds. This method holds the advantages of being simple and low-cost. The VOC concentration characteristics of the oil–gas interface were obtained for four commonly used lubricant oils. A V-shape volatility distribution pattern was observed. The vaporization enthalpy was obtained by tests under three temperatures. This information is not only useful for source apportionment of VOC pollution, but also for condition maintenance such as oil change. The method works broadly for liquid–air systems, not just lubricant oils. It provides researchers with a powerful tool to obtain key liquid–air interface parameters.
Supplementary Materials
The following supporting information can be downloaded at: https://www.mdpi.com/article/10.3390/atmos17070632/s1, Table S1: Basic information and physicochemical specifications of the four lubricant oil samples used in this study; Table S2: Bray–Curtis distance matrix among the VOC profiles of the four lubricant oils.
Author Contributions
Conceptualization, C.L. and J.C.; methodology, J.C. and T.Y.; validation, W.L., M.M. and Z.W.; formal analysis, J.C.; investigation, J.C., L.L. and R.Z.; resources, J.Y., W.L., M.M. and Z.W.; data curation, J.C.; writing—original draft preparation, J.C.; writing—review and editing, C.L. and T.Y.; visualization, J.C.; supervision, C.L.; project administration, C.L.; funding acquisition, C.L. All authors have read and agreed to the published version of the manuscript.
Funding
This research was funded by the National Natural Science Foundation of China, grant number 52408112 and 52578116.
Institutional Review Board Statement
Not applicable.
Informed Consent Statement
Not applicable.
Data Availability Statement
The data presented in this study are available on request from the corresponding author.
Conflicts of Interest
The authors declare no conflicts of interest. The funders had no role in the design of the study; in the collection, analyses, or interpretation of data; in the writing of the manuscript; or in the decision to publish the results.
References
- Cao, Q.F.; Yang, Y.; Zhu, N.B.; Wang, Y.; Cui, Y.; Xiong, K.N.; Zhang, Y.M.; Li, S.K.; Wang, X.; Wang, F. Collision behaviors of binary charged oil droplets in agglomeration pretreatment for purification. Build. Simul. 2025, 18, 87–98. [Google Scholar] [CrossRef] [Scilit]
- Fan, J.N.; Yang, Y.; Wang, Y.; Qian, B.; Li, M.Y.; Zhou, Y. Emission and purification of evaporated-condensed oil droplets affected by condensation nuclei during machining. J. Hazard. Mater. 2023, 459, 132170. [Google Scholar] [CrossRef] [Scilit] [PubMed]
- Lee, H.E.; Lee, B.W.; Kim, J.H. Investigating VOCs Speciation Characteristics at the Fenceline of Synthetic Rubber Manufacturing Industries via Active and Passive Monitoring Techniques. Atmosphere 2023, 14, 1119. [Google Scholar] [CrossRef] [Scilit]
- Zadafiya, K.; Shah, P.S.; Shokrani, A.; Khanna, N. Recent advancements in nano-lubrication strategies for machining processes considering their health and environmental impacts. J. Manuf. Process. 2021, 68, 481–511. [Google Scholar] [CrossRef] [Scilit]
- Shah, P.; Gadkari, A.; Sharma, A.; Shokrani, A.; Khanna, N. Comparison of machining performance under MQL and ultra-high voltage EMQL conditions based on tribological properties. Tribol. Int. 2021, 153, 106595. [Google Scholar] [CrossRef] [Scilit]
- Wang, X.; Zhang, Q.; Zhang, T.; Yan, S.J.; Liu, L.; Yang, L.Y. Kinetic model of heterogeneous growth onto organic particles in supersaturated water environments. J. Aerosol. Sci. 2025, 185, 106541. [Google Scholar] [CrossRef] [Scilit]
- Liu, X.; Liu, H.L.; Nie, H.P.; Tian, L.; Shi, Y.; Lai, W.Q.; Xi, Z.G.; Lin, B.C. Oil mist particulate matter induces myocardial tissue injury by impairing fatty acid metabolism and mitochondrial bioenergetics function via inhibiting the PPAR alpha signaling pathway in rats. Environ. Pollut. 2025, 365, 125340. [Google Scholar] [CrossRef] [Scilit] [PubMed]
- Nie, H.P.; Liu, H.L.; Shi, Y.; Lai, W.Q.; Liu, X.; Xi, Z.G.; Lin, B.C. Effects of Different Concentrations of Oil Mist Particulate Matter on Pulmonary Fibrosis In Vivo and In Vitro. Toxics 2022, 10, 647. [Google Scholar] [CrossRef] [Scilit] [PubMed]
- Nie, H.P.; Liu, H.L.; Shi, Y.; Lai, W.Q.; Liu, X.; Xi, Z.G.; Lin, B.C. Combined multi-omics analysis reveals oil mist particulate matter-induced lung injury in rats: Pathological damage, proteomics, metabolic disturbances, and lung dysbiosis. Ecotoxicol. Environ. Saf. 2022, 241, 113759. [Google Scholar] [CrossRef] [Scilit] [PubMed]
- Shrestha, D.; Liu, S.; Hammond, S.K.; LaValley, M.P.; Weiner, D.E.; Eisen, E.A.; Applebaum, K.M. Risk of renal cell carcinoma following exposure to metalworking fluids among autoworkers. Occup. Environ. Med. 2016, 73, 656–662. [Google Scholar] [CrossRef] [Scilit] [PubMed]
- Wang, H.M.; Wei, W.J.; Wang, K.L.; Kong, H.; Vieira, C.L.Z.; Koutrakis, P.; Huang, S.D.; Xiong, J.Y.; Giorio, C. A global multidimensional analysis of air pollution in land, sea, and air transport cabins reveals substantial health risks. One Earth 2025, 8, 101156. [Google Scholar] [CrossRef] [Scilit]
- Henneman, L.R.F.; Shen, H.Z.; Liu, C.; Hu, Y.T.; Mulholland, J.A.; Russell, A.G. Responses in Ozone and Its Production Efficiency Attributable to Recent and Future Emissions Changes in the Eastern United States. Environ. Sci. Technol. 2017, 51, 13797–13805. [Google Scholar] [CrossRef] [Scilit] [PubMed]
- Qin, M.M.; Murphy, B.N.; Isaacs, K.K.; McDonald, B.C.; Lu, Q.Y.; McKeen, S.A.; Koval, L.; Robinson, A.L.; Efstathiou, C.; Allen, C.; et al. Criteria pollutant impacts of volatile chemical products informed by near-field modelling. Nat. Sustain. 2021, 4, 129–137. [Google Scholar] [CrossRef] [Scilit] [PubMed]
- Qin, M.M.; She, Y.L.; Wang, M.; Wang, H.L.; Chang, Y.H.; Tan, Z.F.; An, J.Y.; Huang, J.; Yuan, Z.B.; Lu, J.; et al. Increased urban ozone in heatwaves due to temperature-induced emissions of anthropogenic volatile organic compounds. Nat. Geosci. 2025, 18, 50–56. [Google Scholar] [CrossRef] [Scilit] [PubMed]
- Wang, Y.K.; Guo, Y.; Hao, W.J.; Liu, W.; Long, Z.W. Simulation study of the purification system for indoor oil mist control in machining factories. Build. Simul. 2023, 16, 1361–1374. [Google Scholar] [CrossRef] [Scilit]
- Yang, Y.; Chen, H.; Cao, Q.F.; Qiao, M.D.; Wang, Y.; Fan, J.N.; Yang, C.H.; Pan, B.; Wang, X.; Wang, F.; et al. Purification technology of oil mist in industrial buildings: A review. Build. Environ. 2023, 235, 110229. [Google Scholar] [CrossRef] [Scilit]
- Clausen, P.A. Emission of Volatile and Semivolatile Organic Compounds From Waterborne Paints—The Effect Of The Film Thickness. Indoor Air 1993, 3, 269–275. [Google Scholar] [CrossRef] [Scilit]
- Li, F.; Niu, J.L.; Zhang, L.Z. A physically-based model for prediction of VOCs emissions from paint applied to an absorptive substrate. Build. Environ. 2006, 41, 1317–1325. [Google Scholar] [CrossRef] [Scilit]
- Yang, X.; Chen, Q.; Zeng, J.; Zhang, J.S.; Shaw, C.Y. A mass transfer model for simulating volatile organic compound emissions from ‘wet’ coating materials applied to absorptive substrates. Int. J. Heat Mass Transf. 2001, 44, 1803–1815. [Google Scholar] [CrossRef] [Scilit]
- Zhou, X.J.; Gao, Z.; Wang, X.K.; Wang, F.H. Mathematical model for characterizing the full process of volatile organic compound emissions from paint film coating on porous substrates. Build. Environ. 2020, 182, 107062. [Google Scholar] [CrossRef] [Scilit]
- Liu, C.; Liu, Z.; Little, J.C.; Zhang, Y.P. Convenient, Rapid and Accurate Measurement of SVOC Emission Characteristics in Experimental Chambers. PLoS ONE 2013, 8, e72445. [Google Scholar] [CrossRef] [Scilit] [PubMed]
- Wei, G.Q.; Xiao, Y.M.; Wang, J.; Gao, K.; Gao, P.; Lu, C.Y.; Yang, X.D. Environmental chamber analysis of objective volatile organic compounds emissions and subjective olfactory perception from main automotive interior components. Build. Environ. 2024, 266, 112136. [Google Scholar] [CrossRef] [Scilit]
- EN717-1; Wood-Based Panels-Determination of Formaldehyde Release—Part 1: Formaldehyde Emission by the Chamber Method. European Committee for Standardization: Brussels, Belgium, 2004.
- GB 18580-2017; Indoor Decorating and Refurbishing Materials—Limit of Formaldehyde Emission of Wood-Based Panels and Finishing Products. General Administration of Quality Supervision: Beijing, China, 2017.
- ISO12460-1; Wood-Based Panels-Determination of Formaldehyde Release—Part 1: Formaldehyde Emission by the 1-Cubic-Metre Chamber Method. International Organization for Standardization: Geneva, Switzerland, 2007.
- Liang, Y.R.; Xu, Y. Improved Method for Measuring and Characterizing Phthalate Emissions from Building Materials and Its Application to Exposure Assessment. Environ. Sci. Technol. 2014, 48, 4475–4484. [Google Scholar] [CrossRef] [Scilit] [PubMed]
- Liu, C.; Kolarik, B.; Gunnarsen, L.; Zhang, Y.P. C-Depth Method to Determine Diffusion Coefficient and Partition Coefficient of PCB in Building Materials. Environ. Sci. Technol. 2015, 49, 12112–12119. [Google Scholar] [CrossRef] [Scilit] [PubMed]
- Xiong, J.Y.; Yao, Y.; Zhang, Y.P. C-History Method: Rapid Measurement of the Initial Emittable Concentration, Diffusion and Partition Coefficients for Formaldehyde and VOCs in Building Materials. Environ. Sci. Technol. 2011, 45, 3584–3590. [Google Scholar] [CrossRef] [Scilit] [PubMed]
- Dolatto, R.G.; Dal Pont, G.; Vela, H.S.; Camargo, M.D.; Neto, A.O.; Grassi, M.T. Aromatic hydrocarbons extracted by headspace and microextraction methods in water-soluble fractions from crude oil, fuels and lubricants. Anal. Sci. 2023, 39, 573–587. [Google Scholar] [CrossRef] [Scilit]
- Levermore, D.M.; Josowicz, M.; Rees, W.S., Jr.; Janata, J. Headspace analysis of engine oil by gas chromatography/mass spectrometry. Anal. Chem. 2001, 73, 1361–1365. [Google Scholar] [CrossRef] [Scilit] [PubMed]
- Liu, C.; Zhang, Y.P. Characterizing the equilibrium relationship between DEHP in PVC flooring and air using a closed-chamber SPME method. Build. Environ. 2016, 95, 283–290. [Google Scholar] [CrossRef] [Scilit]
- Yu, T.; Wang, Y.; Chen, L.F.; Leng, W.J.; Shi, Y.; Lin, B.C.; Zhao, J.T.; Wang, Z.Y.; Mo, J.H.; Liu, C. Determination of uptake rates of volatile organic compounds by 24-hour passive sampling and their application in enclosed ship cabin environments. Build. Environ. 2024, 248, 111068. [Google Scholar] [CrossRef] [Scilit]
- Wang, Y.; Yu, T.; Mo, J.H. Prediction and validation of diffusive uptake rates for indoor volatile organic compounds in axial passive samplers. Energy Built Environ. 2024, 5, 24–31. [Google Scholar] [CrossRef] [Scilit]
- Yang, Y.; Guo, Y.; Jia, X.C.; Zhang, Q.D.; Mao, J.; Feng, Y.M.; Yin, D.; Zhao, W.D.; Zhang, Y.H.; Ouyang, G.F.; et al. An ultrastable 2D covalent organic framework coating for headspace solid-phase microextraction of organochlorine pesticides in environmental water. J. Hazard. Mater. 2023, 452, 131228. [Google Scholar] [CrossRef] [Scilit] [PubMed]
- Wang, Z.Y.; Yu, T.; Ye, J.; Tian, L.; Lin, B.C.; Leng, W.J.; Liu, C. A novel low sampling rate and cost-efficient active sampler for medium/long-term monitoring of gaseous pollutants. J. Hazard. Mater. 2024, 461, 132583. [Google Scholar] [CrossRef] [Scilit] [PubMed]
- GB/T 44690-2024; Classification of Volatile Organic Compounds Emission from Wood-Based Panels and Their Products. General Administration of Quality Supervision: Beijing, China, 2024.
- Sun, Y.; Cao, J.H.; Wang, M.Y.; Yang, Z.J.; Wu, H.X.; Shang, J.B.; Ma, J. Chemical composition of headspace vapor from volatilization of ten petroleum samples. Fuel 2025, 396, 135299. [Google Scholar] [CrossRef] [Scilit]
- Sun, Y.; Guan, J.J.; Yue, G.S.; Xiu, Y.; Wang, H.J.; McHugh, T.; Ma, J. Chemical Composition and Fingerprints of Headspace Vapors of 37 Petroleum Products and Non-Aqueous Phase Liquid Samples. Environ. Forensics 2025, 26, 485–500. [Google Scholar] [CrossRef] [Scilit]
- Rohrbach, P.; Hamblin, P.; Reyes-Gavilan, J. The benefits of a high molecular weight phenolic antioxidant compared with BHT and 2,6-DTBP©. Tribol. Lubr. Technol. 2004, 60, 56–63. [Google Scholar]
- Xiong, J.Y.; Wei, W.J.; Huang, S.D.; Zhang, Y.P. Association between the Emission Rate and Temperature for Chemical Pollutants in Building Materials: General Correlation and Understanding. Environ. Sci. Technol. 2013, 47, 8540–8547. [Google Scholar] [CrossRef] [Scilit] [PubMed]
- Ye, J.; Wang, Z.Y.; Yu, T.; Zhuang, W.B.; Lai, W.Q.; Tian, L.; Leng, W.J.; Song, Y.; Huang, S.D.; Zhang, Y.P.; et al. Long-term characteristics of formaldehyde concentrations in four Chinese residences and estimation of annual average. Build. Environ. 2025, 278, 113024. [Google Scholar] [CrossRef] [Scilit]
- Schwarzenbach, R.P.; Gschwend, P.M.; Imboden, D.M. Air–Organic Solvent and Air–Water Partitioning. In Environmental Organic Chemistry; John Wiley & Sons, Inc.: Hoboken, NJ, USA, 2002; pp. 181–212. [Google Scholar]
- Bu, Z.M.; Mo, D.H.; Sun, Y.; Zhang, L.; Zhu, Y.Q.; Duan, X.Y.; Nian, L.Y.; Tang, Y.J.; Ye, C.; Cao, J.P. Dynamic accumulation and co-occurrence of phthalates and squalene in settled dust: Implications for assessing indoor phthalate homology and exposures. Environ. Sci.-Process Impacts 2026, 28, 1721–1732. [Google Scholar] [CrossRef] [Scilit] [PubMed]
- Tian, E.Z.; Gao, Y.L.; Mo, J.H. Experimental studies on electrostatic-force strengthened particulate matter filtration for built environments: Progress and perspectives. Build. Environ. 2023, 228, 109782. [Google Scholar] [CrossRef] [Scilit]
- Ahmad, I.; Ullah, J.; Ishaq, M.; Khan, H.; Khan, R.; Ahmad, W.; Gul, K. Oxidative Stability of the Plain and Additized Mineral Base Oil Samples Monitored through Gas Chromatography-Mass Spectrometry. Energ. Fuel 2015, 29, 6522–6528. [Google Scholar] [CrossRef] [Scilit]
- Mujahid, A.; Dickert, F.L. Monitoring automotive oil degradation: Analytical tools and onboard sensing technologies. Anal. Bioanal. Chem. 2012, 404, 1197–1209. [Google Scholar] [CrossRef] [Scilit] [PubMed]
- Wu, Y.X.; Li, W.M.; Zhang, M.; Wang, X.B. Oxidative degradation of synthetic ester and its influence on tribological behavior. Tribol. Int. 2013, 64, 16–23. [Google Scholar] [CrossRef] [Scilit]
- Buszewski, B.; Kesy, M.; Ligor, T.; Amann, A. Human exhaled air analytics: Biomarkers of diseases. Biomed. Chromatogr. 2007, 21, 553–566. [Google Scholar] [CrossRef] [Scilit] [PubMed]
- He, Y.H.; Su, Z.X.; Sha, T.N.; Yu, X.P.; Guo, H.; Tao, Y.J.; Liao, L.T.; Zhang, Y.Y.; Lu, G.T.; Lu, G.Y.; et al. Collection methods of exhaled volatile organic compounds for lung cancer screening and diagnosis: A systematic review. J. Thorac. Dis. 2024, 16, 7978–7998. [Google Scholar] [CrossRef] [Scilit] [PubMed]
- Shang, G.J.; Dinh, D.; Mercer, T.; Yan, S.; Wang, S.; Malaei, B.; Luo, J.; Lu, S.S.; Zhong, C.J. Chemiresistive Sensor Array with Nanostructured Interfaces for Detection of Human Breaths with Simulated Lung Cancer Breath VOCs. ACS Sens. 2023, 8, 1328–1338. [Google Scholar] [CrossRef] [Scilit] [PubMed]

Disclaimer/Publisher’s Note: The statements, opinions and data contained in all publications are solely those of the individual author(s) and contributor(s) and not of MDPI and/or the editor(s). MDPI and/or the editor(s) disclaim responsibility for any injury to people or property resulting from any ideas, methods, instructions or products referred to in the content. |
© 2026 by the authors. Licensee MDPI, Basel, Switzerland. This article is an open access article distributed under the terms and conditions of the Creative Commons Attribution (CC BY) license.