


Abstract
Sustainable aviation fuel (SAF) is widely recognized as a critical pathway for aviation decarbonization; however, its life-cycle carbon performance is highly sensitive to supply chain configurations. This study proposes a data-driven framework integrating life-cycle assessment (LCA) with a generative adversarial network (GAN) to model and optimize SAF supply chain pathways under structural constraints. A rule-constrained synthetic dataset comprising feasible pathways is constructed, incorporating feedstock sources, refinery locations, airport demand nodes, conversion technologies, transport modes, and distances. Each pathway is encoded into a numerical feature vector, and a GAN model is trained to learn the distribution of feasible configurations. Generated pathways are further validated through LCA-based post-processing to ensure physical feasibility and emission consistency. The results show that pathway-level carbon intensity varies significantly across configurations, with differences exceeding 30% under varying feedstock–transport combinations. The model successfully captures the multimodal distribution of carbon emissions and identifies structurally consistent low-carbon pathways. In particular, localized supply structures and reduced transport distances are found to play a dominant role in minimizing emissions. This study provides a scalable methodological framework for SAF pathway modeling and offers insights into supply chain design and spatial configuration for achieving aviation carbon reduction targets.
1. Introduction
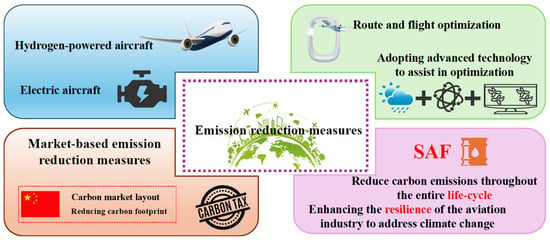
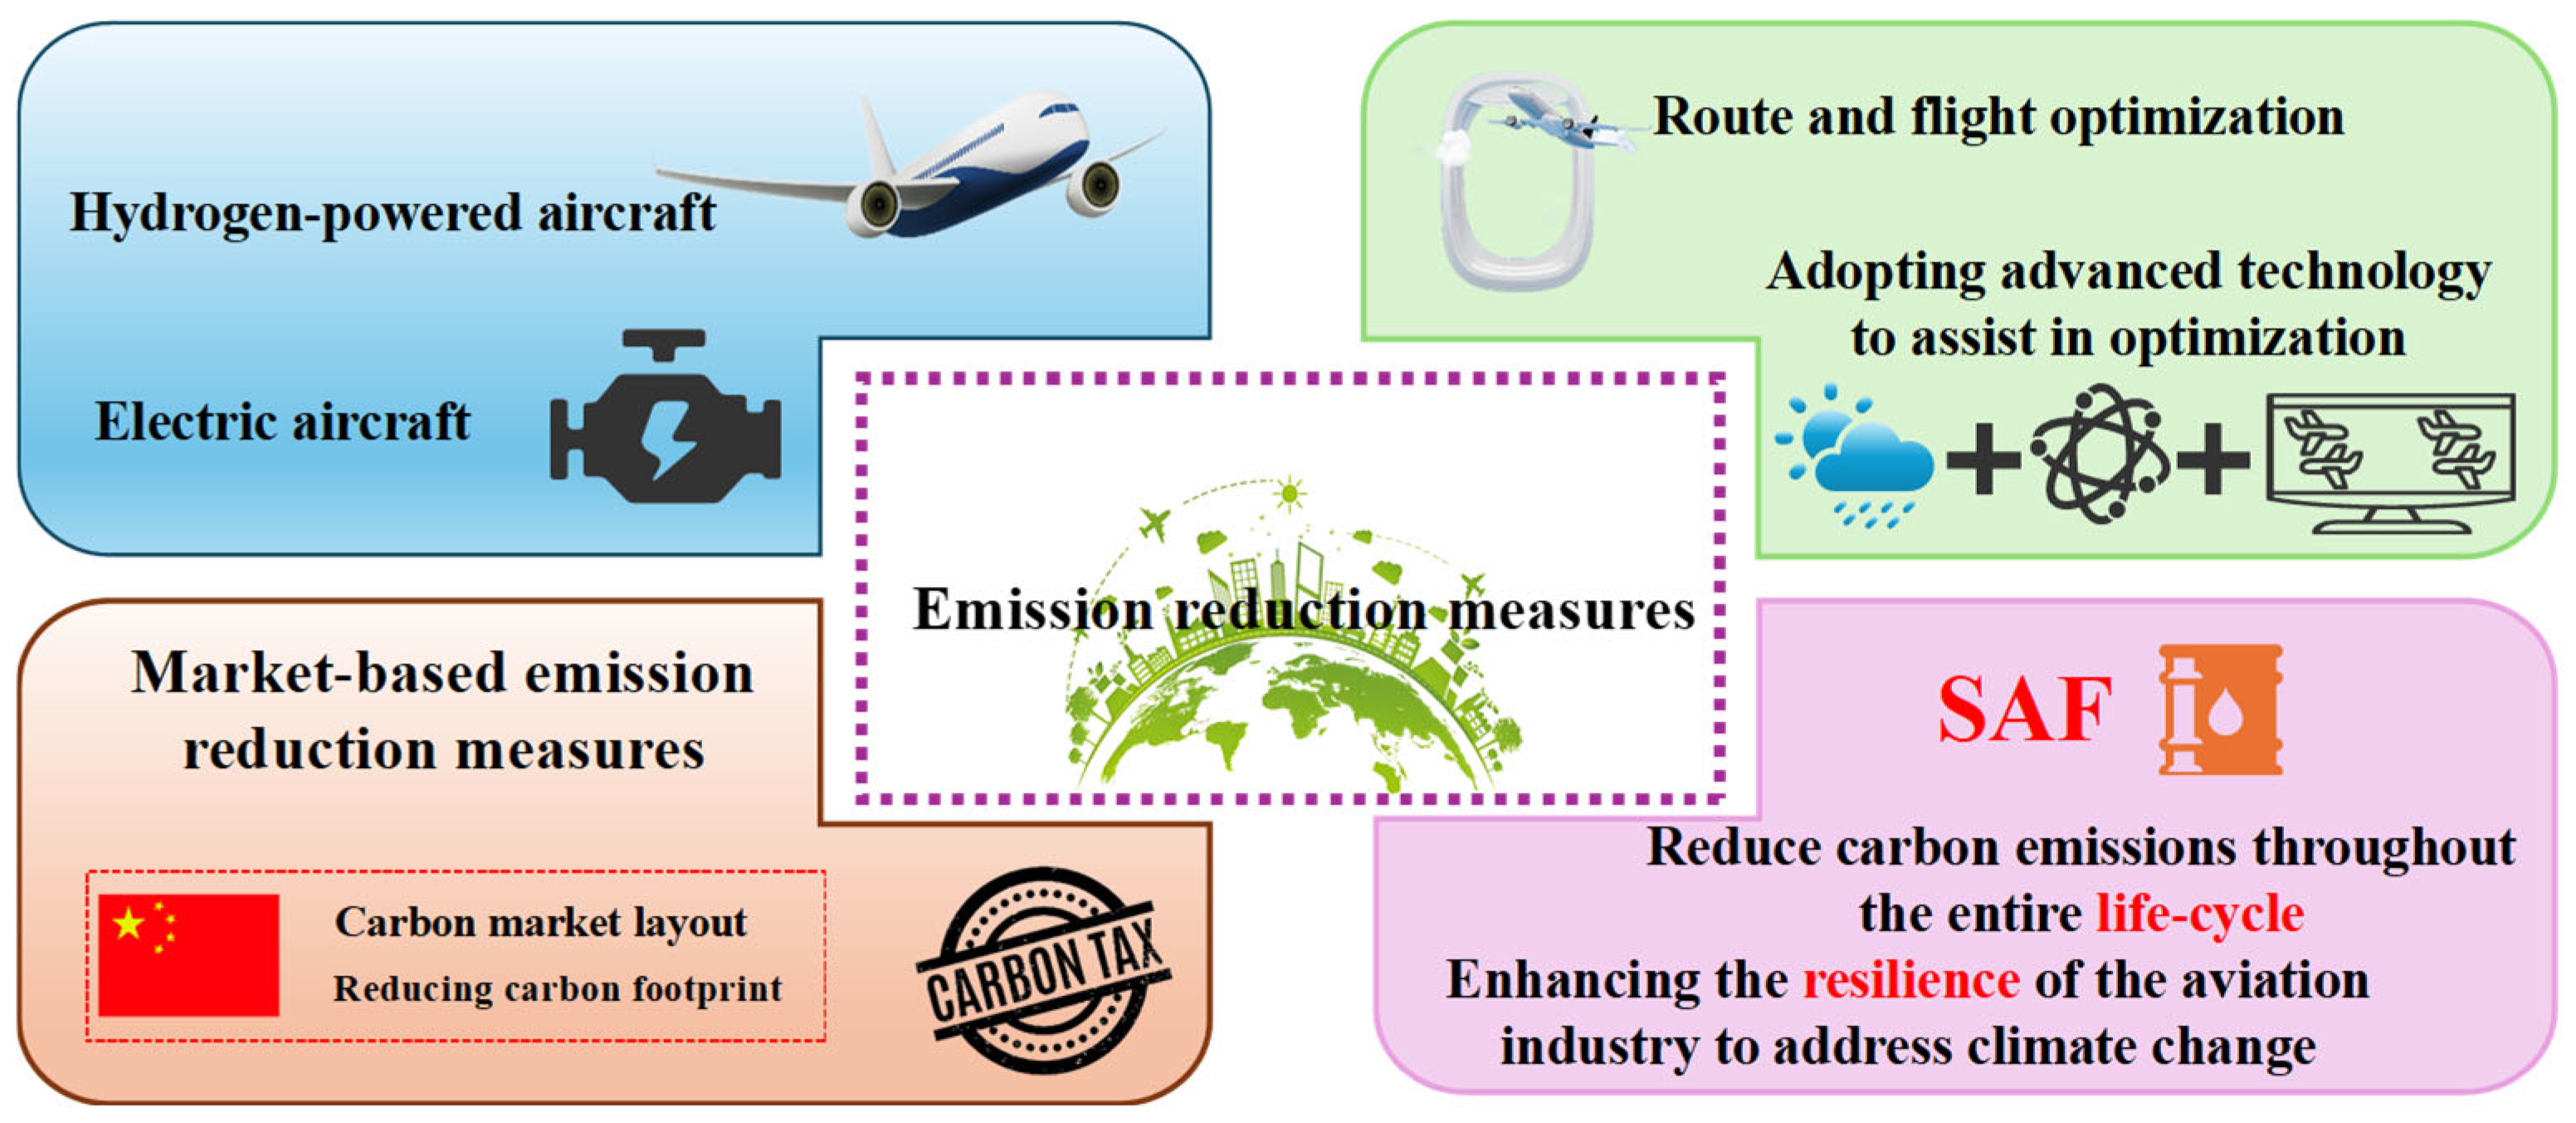
The decarbonization of the aviation sector remains one of the most challenging tasks in achieving global climate targets due to its reliance on energy-dense liquid fuels and the limited feasibility of alternative propulsion technologies [1]. China has established “green development and carbon emission control” as core tasks in the 14th Five-Year Plan for Civil Aviation Development, actively participating in international aviation climate governance [2]. Under increasingly stringent global carbon constraints, the aviation sector has explored multiple mitigation pathways, as shown in Figure 1, including technological innovation, operational optimization, market-based mechanisms, and alternative fuels. However, technological solutions such as hydrogen and electric aircraft remain constrained by energy density and infrastructure limitations [3], while operational improvements and market mechanisms provide limited and often uncertain emission reduction potential [4,5]. In this context, sustainable aviation fuel (SAF) has been widely recognized as a key solution, as it can be directly integrated into existing aircraft and infrastructure while offering substantial life-cycle carbon emission reductions compared to conventional jet fuel [6]. Compared with other mitigation options, SAF represents the most feasible pathway to achieve both near-term and long-term emission reductions in aviation.
Figure 1.
Existing means of reducing emissions in civil aviation.
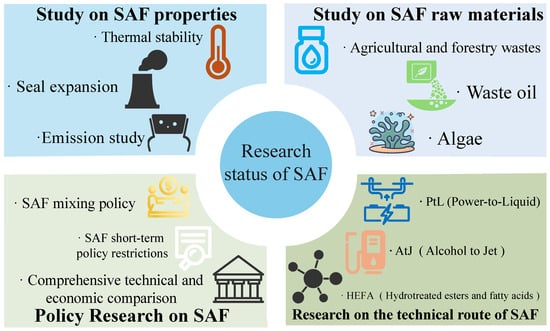
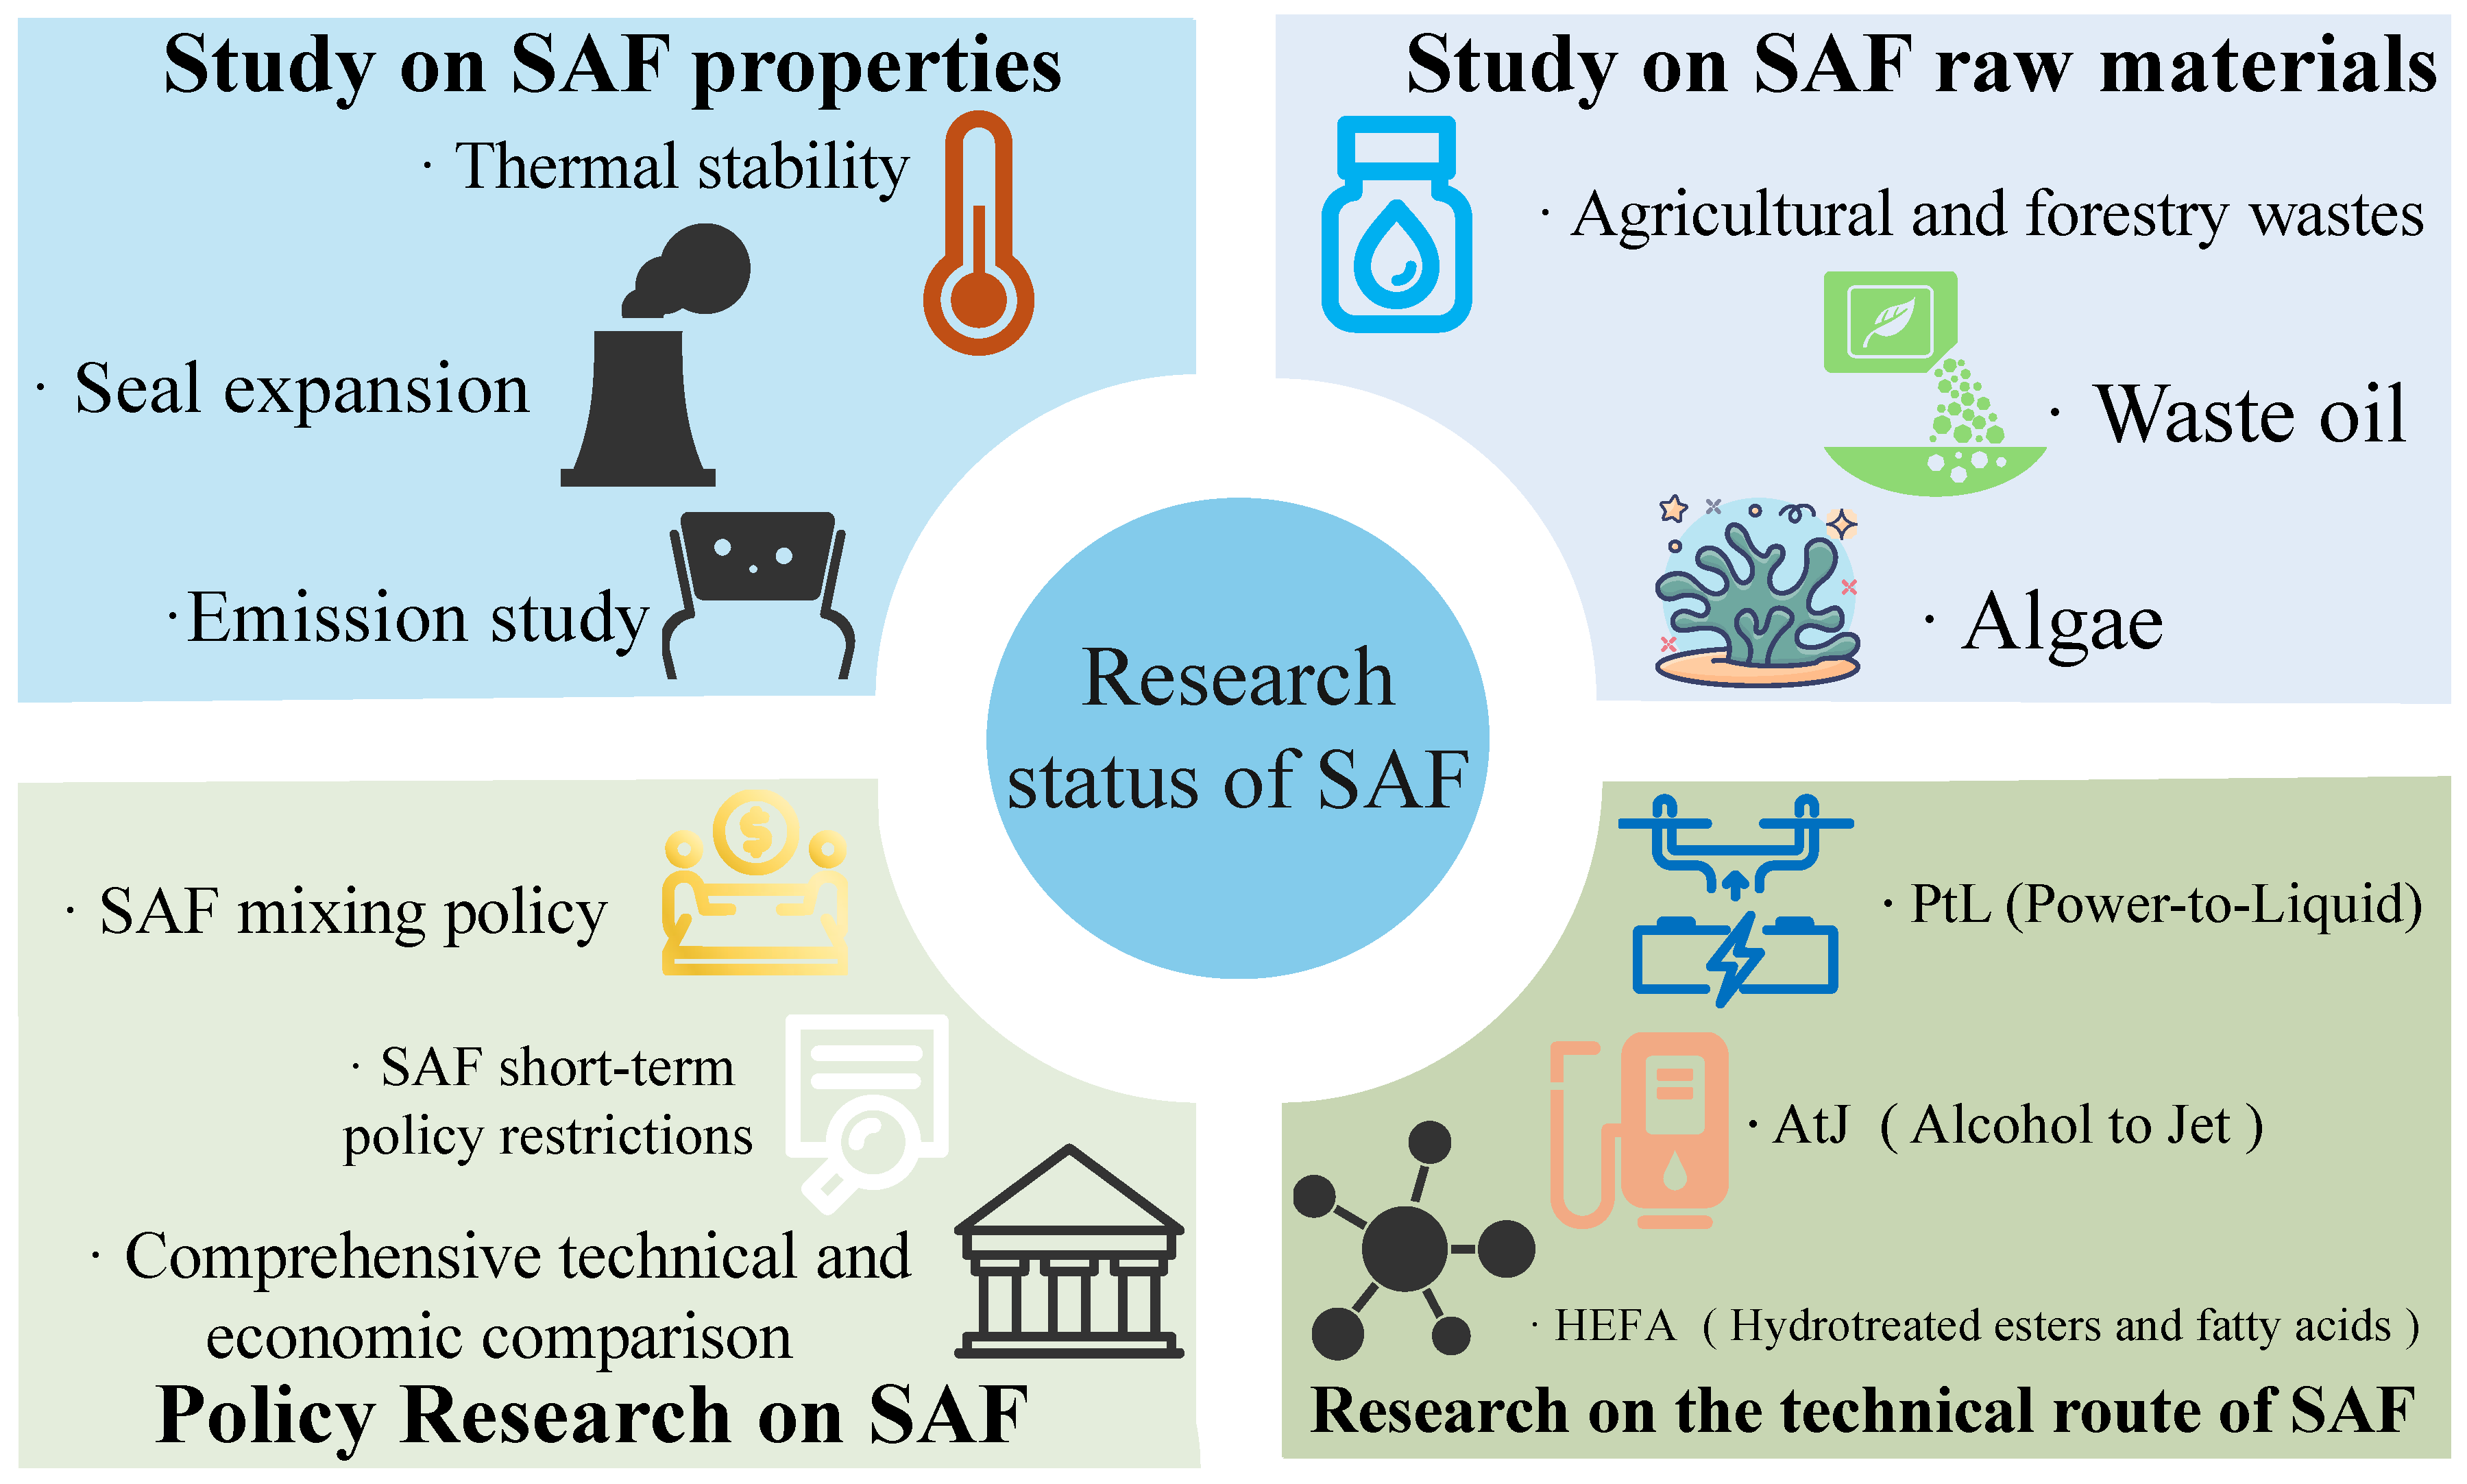
However, existing studies have primarily focused on individual components of the SAF system, as illustrated in Figure 2, including feedstock conversion technologies, fuel properties, and policy mechanisms [7,8,9]. While these studies provide valuable insights into technological feasibility and emission characteristics, they generally lack an integrated framework that links life-cycle carbon accounting with supply chain configuration and spatial optimization. In particular, the pathway-level carbon emission structure—defined by the combination of feedstock, processing, and logistics—remains insufficiently explored. Meanwhile, optimization approaches in the aviation domain have traditionally concentrated on operational efficiency, such as flight scheduling, airport capacity allocation, and air traffic management [10,11,12]. Although these methods are effective in reducing operational emissions, they do not address the structural characteristics of fuel supply chains. As a result, SAF deployment strategies often rely on simplified assumptions or limited datasets, making it difficult to identify optimal configurations under complex, multi-dimensional constraints.
Figure 2.
Research areas of existing SAF.
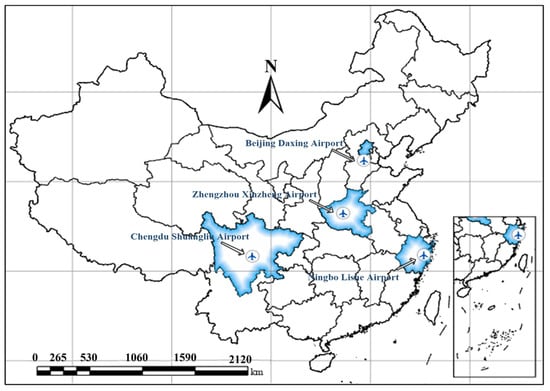
Consequently, the integration of carbon emission accounting with pathway optimization in the SAF domain should draw upon methodological advancements from other mature fields. For example, Natalia Liora et al. developed a comprehensive methodology for estimating the carbon footprint (CF) of research project activities and identifying best practices that project partners can follow during project implementation to reduce the project’s carbon footprint [13]. Nkosinathi Michael Manqele et al. utilized a mid-tier (activity-based) approach to estimate atmospheric emissions from ocean-going vessels (OGVs) in and around Durban Port during the period from 1 January 2018 to 31 December 2018, thereby supplementing the existing understandings of emissions from local industries [14]. Jenna A. Brown et al. evaluated the development of empirical estimates for midstream natural gas facilities using two top-down methods [15]. Agapol Junpen’s research evaluated the impact of measures to reduce sugarcane burning in Thailand on air pollutant emissions [16]. Carbon emission accounting coupled with pathway optimization has demonstrably facilitated industrial development in mature sectors. The critical challenge in SAF deployment lies in reducing its life-cycle carbon intensity, which necessitates optimizing complex supply chain pathways and implementing efficient spatial industrial cluster layouts. Consequently, civil aviation urgently requires a methodology capable of calculating SAF carbon emission structures from pathway data and identifying optimal supply configurations, thereby addressing the practical dilemma of “pathway opacity and performance ambiguity.” However, existing research has revealed that aviation fuel carbon emission data exhibit typical multimodal distributions, which conventional models fail to capture, necessitating adversarial learning for the precise reconstruction of authentic data distributions [17,18,19]. Meanwhile, as illustrated in Figure 3, the Civil Aviation Administration of China (CAAC), in accordance with pilot work arrangements, initiated SAF refueling operations on 19 September 2024 for twelve flights operated by Air China, China Eastern Airlines, and China Southern Airlines departing from Beijing Daxing, Chengdu Shuangliu, Zhengzhou Xinzheng, and Ningbo Lishe airports. While these initiatives aimed to coordinate and advance sustainable aviation fuel development in China, mandatory SAF blending ratio regulations remain unspecified, and explicit requirements regarding the life-cycle carbon intensity of SAF have yet to be established. These pilot operations have leaned more toward technical feasibility validation, proving insufficient to fully exert institutional effects in guiding low-carbon supply pathway selection and industrial cluster layout optimization. This further underscores the imperative of constructing a pathway-data-oriented methodology for SAF carbon emission structure identification and supply configuration optimization.
Figure 3.
Existing airports in China that are refilling with SAF.
To address these gaps, this study proposes a data-driven framework that integrates rule-constrained pathway construction, life-cycle carbon accounting, and generative modeling. Specifically, a generative adversarial network (GAN) is employed to learn the distribution of feasible SAF supply chain pathways from a synthetic yet physically constrained dataset. By combining engineering rules with adversarial learning, the proposed approach enables the identification of structural patterns and emission characteristics that are otherwise difficult to capture. Based on this framework, this study aims to make three main contributions. First, it constructs a pathway-level modeling approach that links supply chain structure with life-cycle carbon intensity, providing a systematic basis for analyzing SAF emission characteristics. Second, it applies generative modeling to capture the distributional features of feasible pathways, enabling the exploration of diverse supply chain configurations under realistic constraints. Third, it derives insights into spatial organization and pathway selection, offering guidance for low-carbon SAF supply chain design.
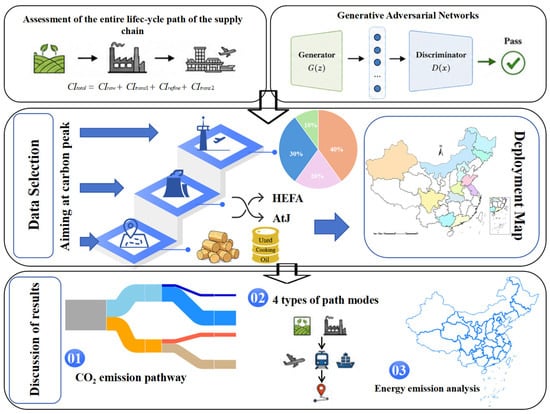
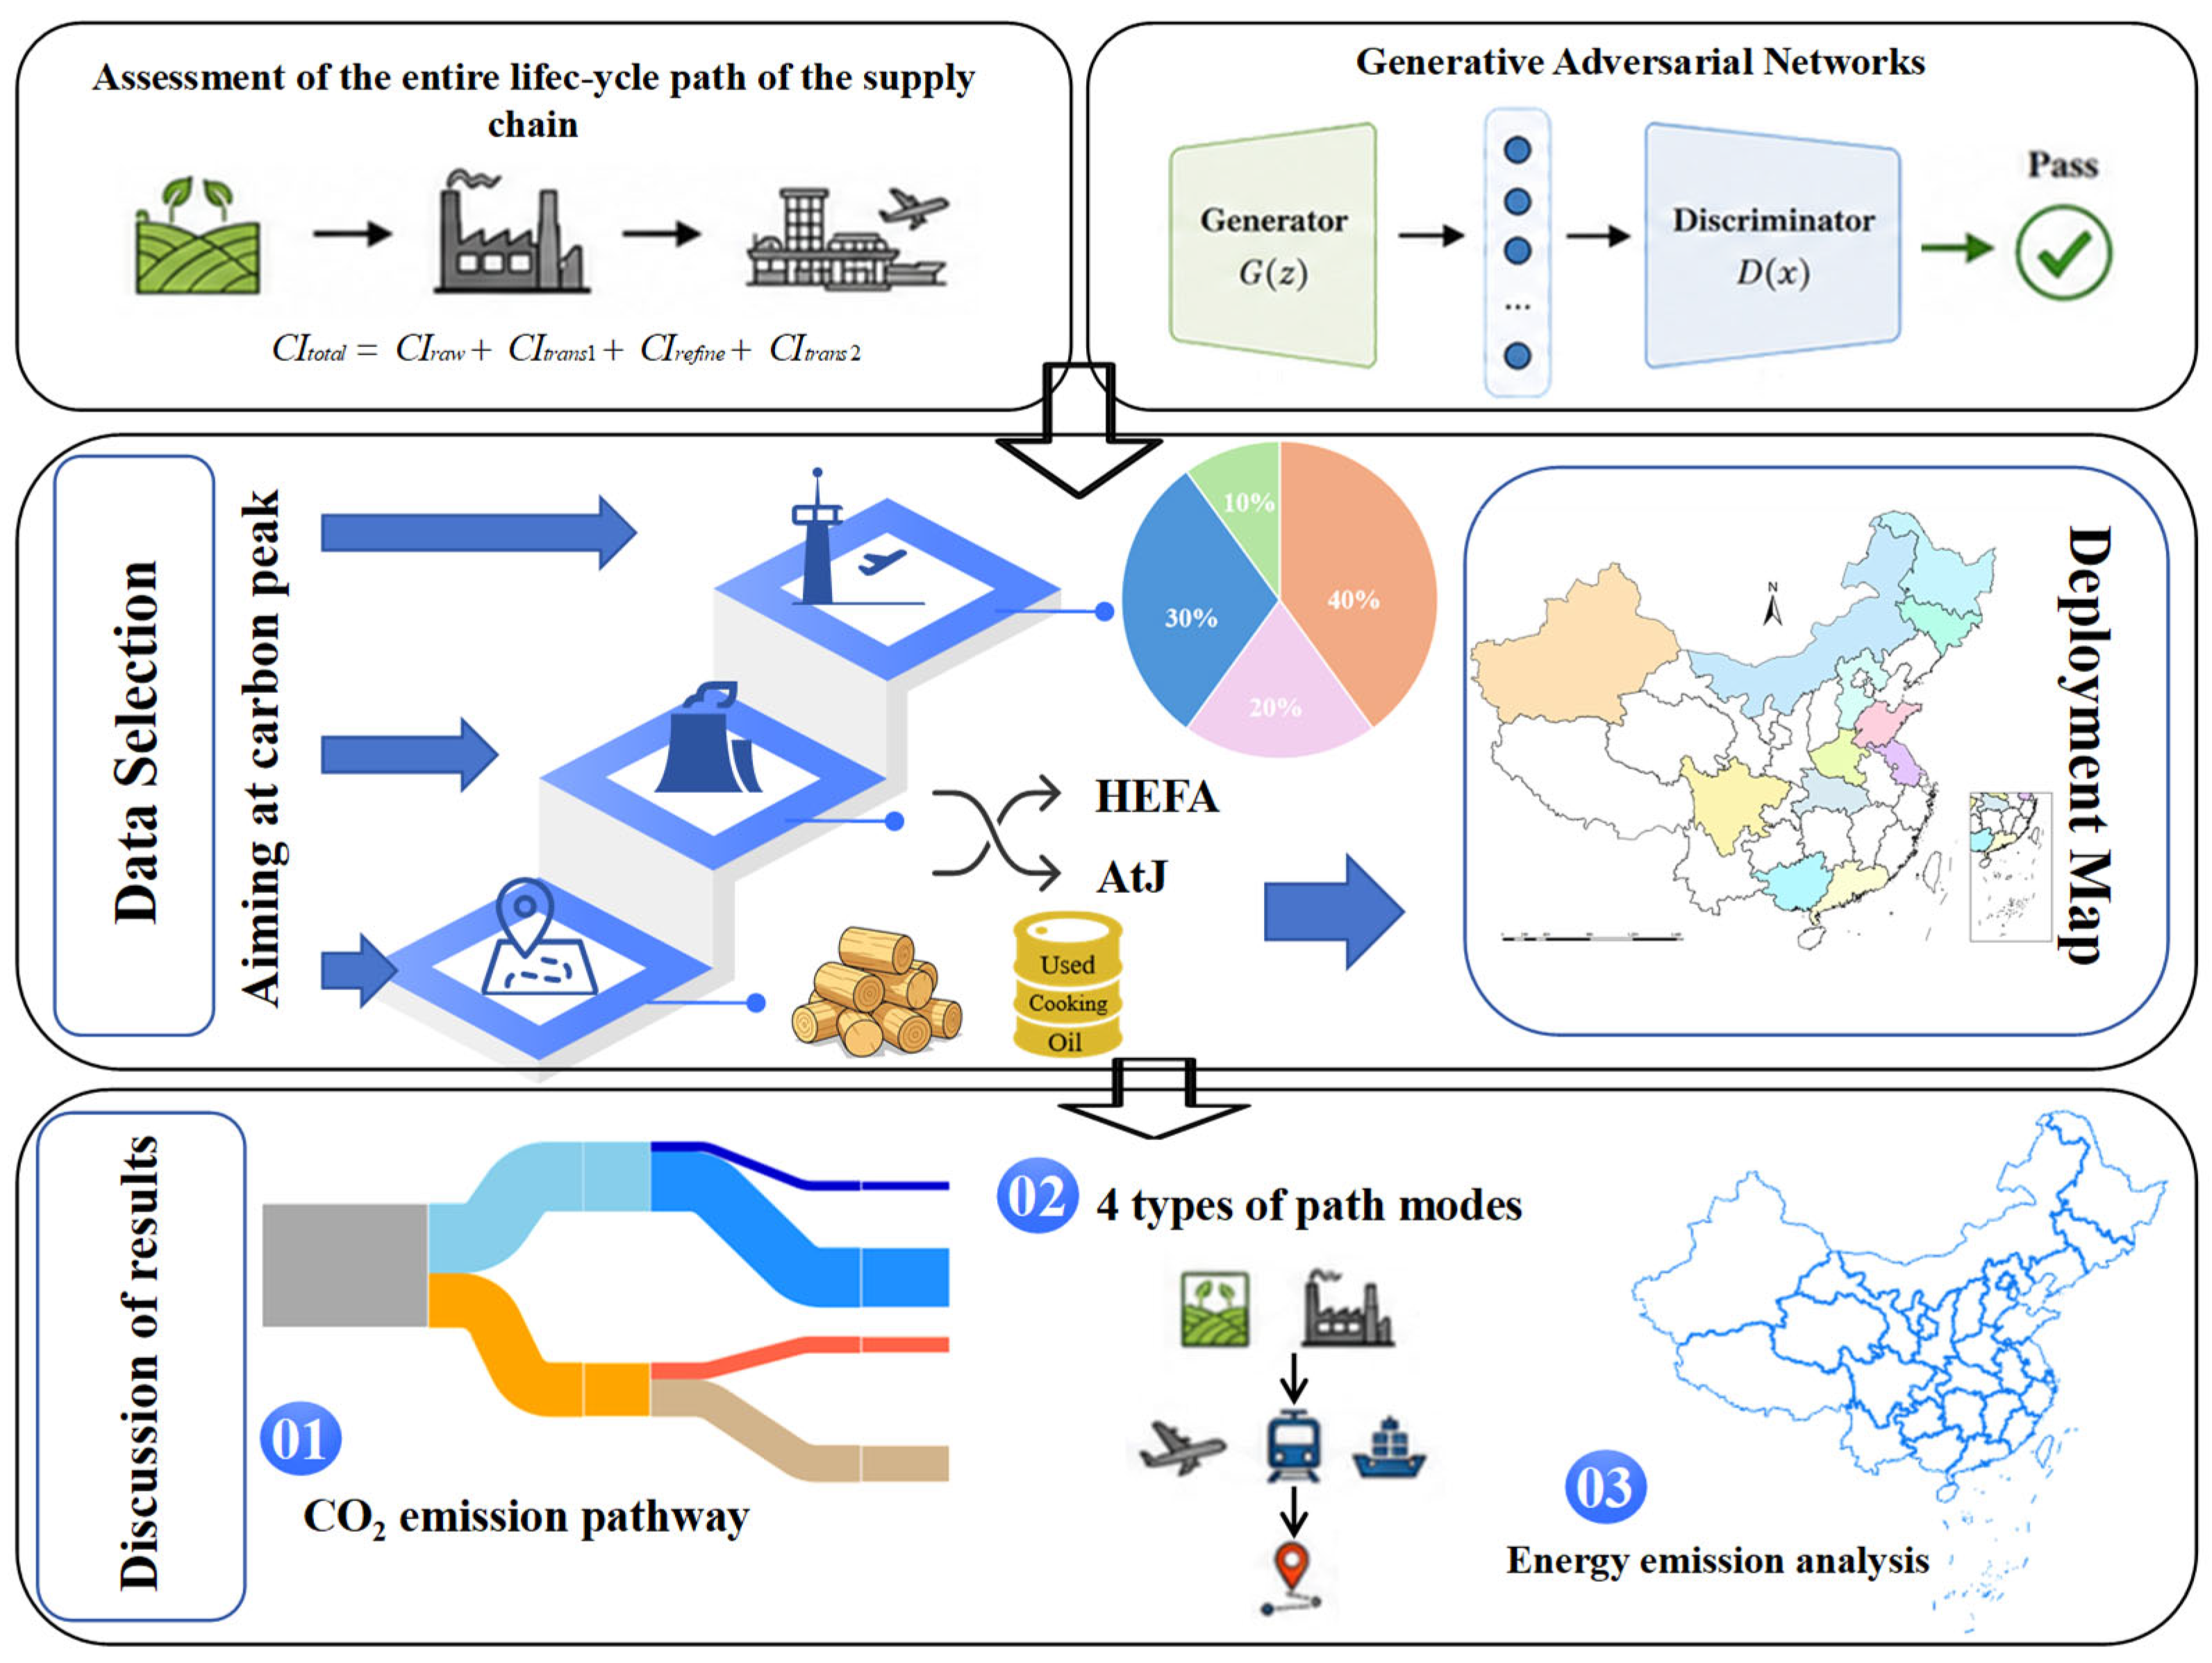
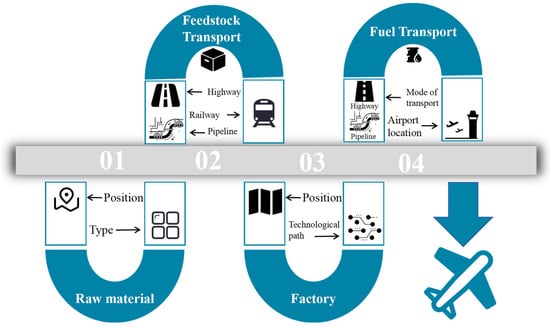
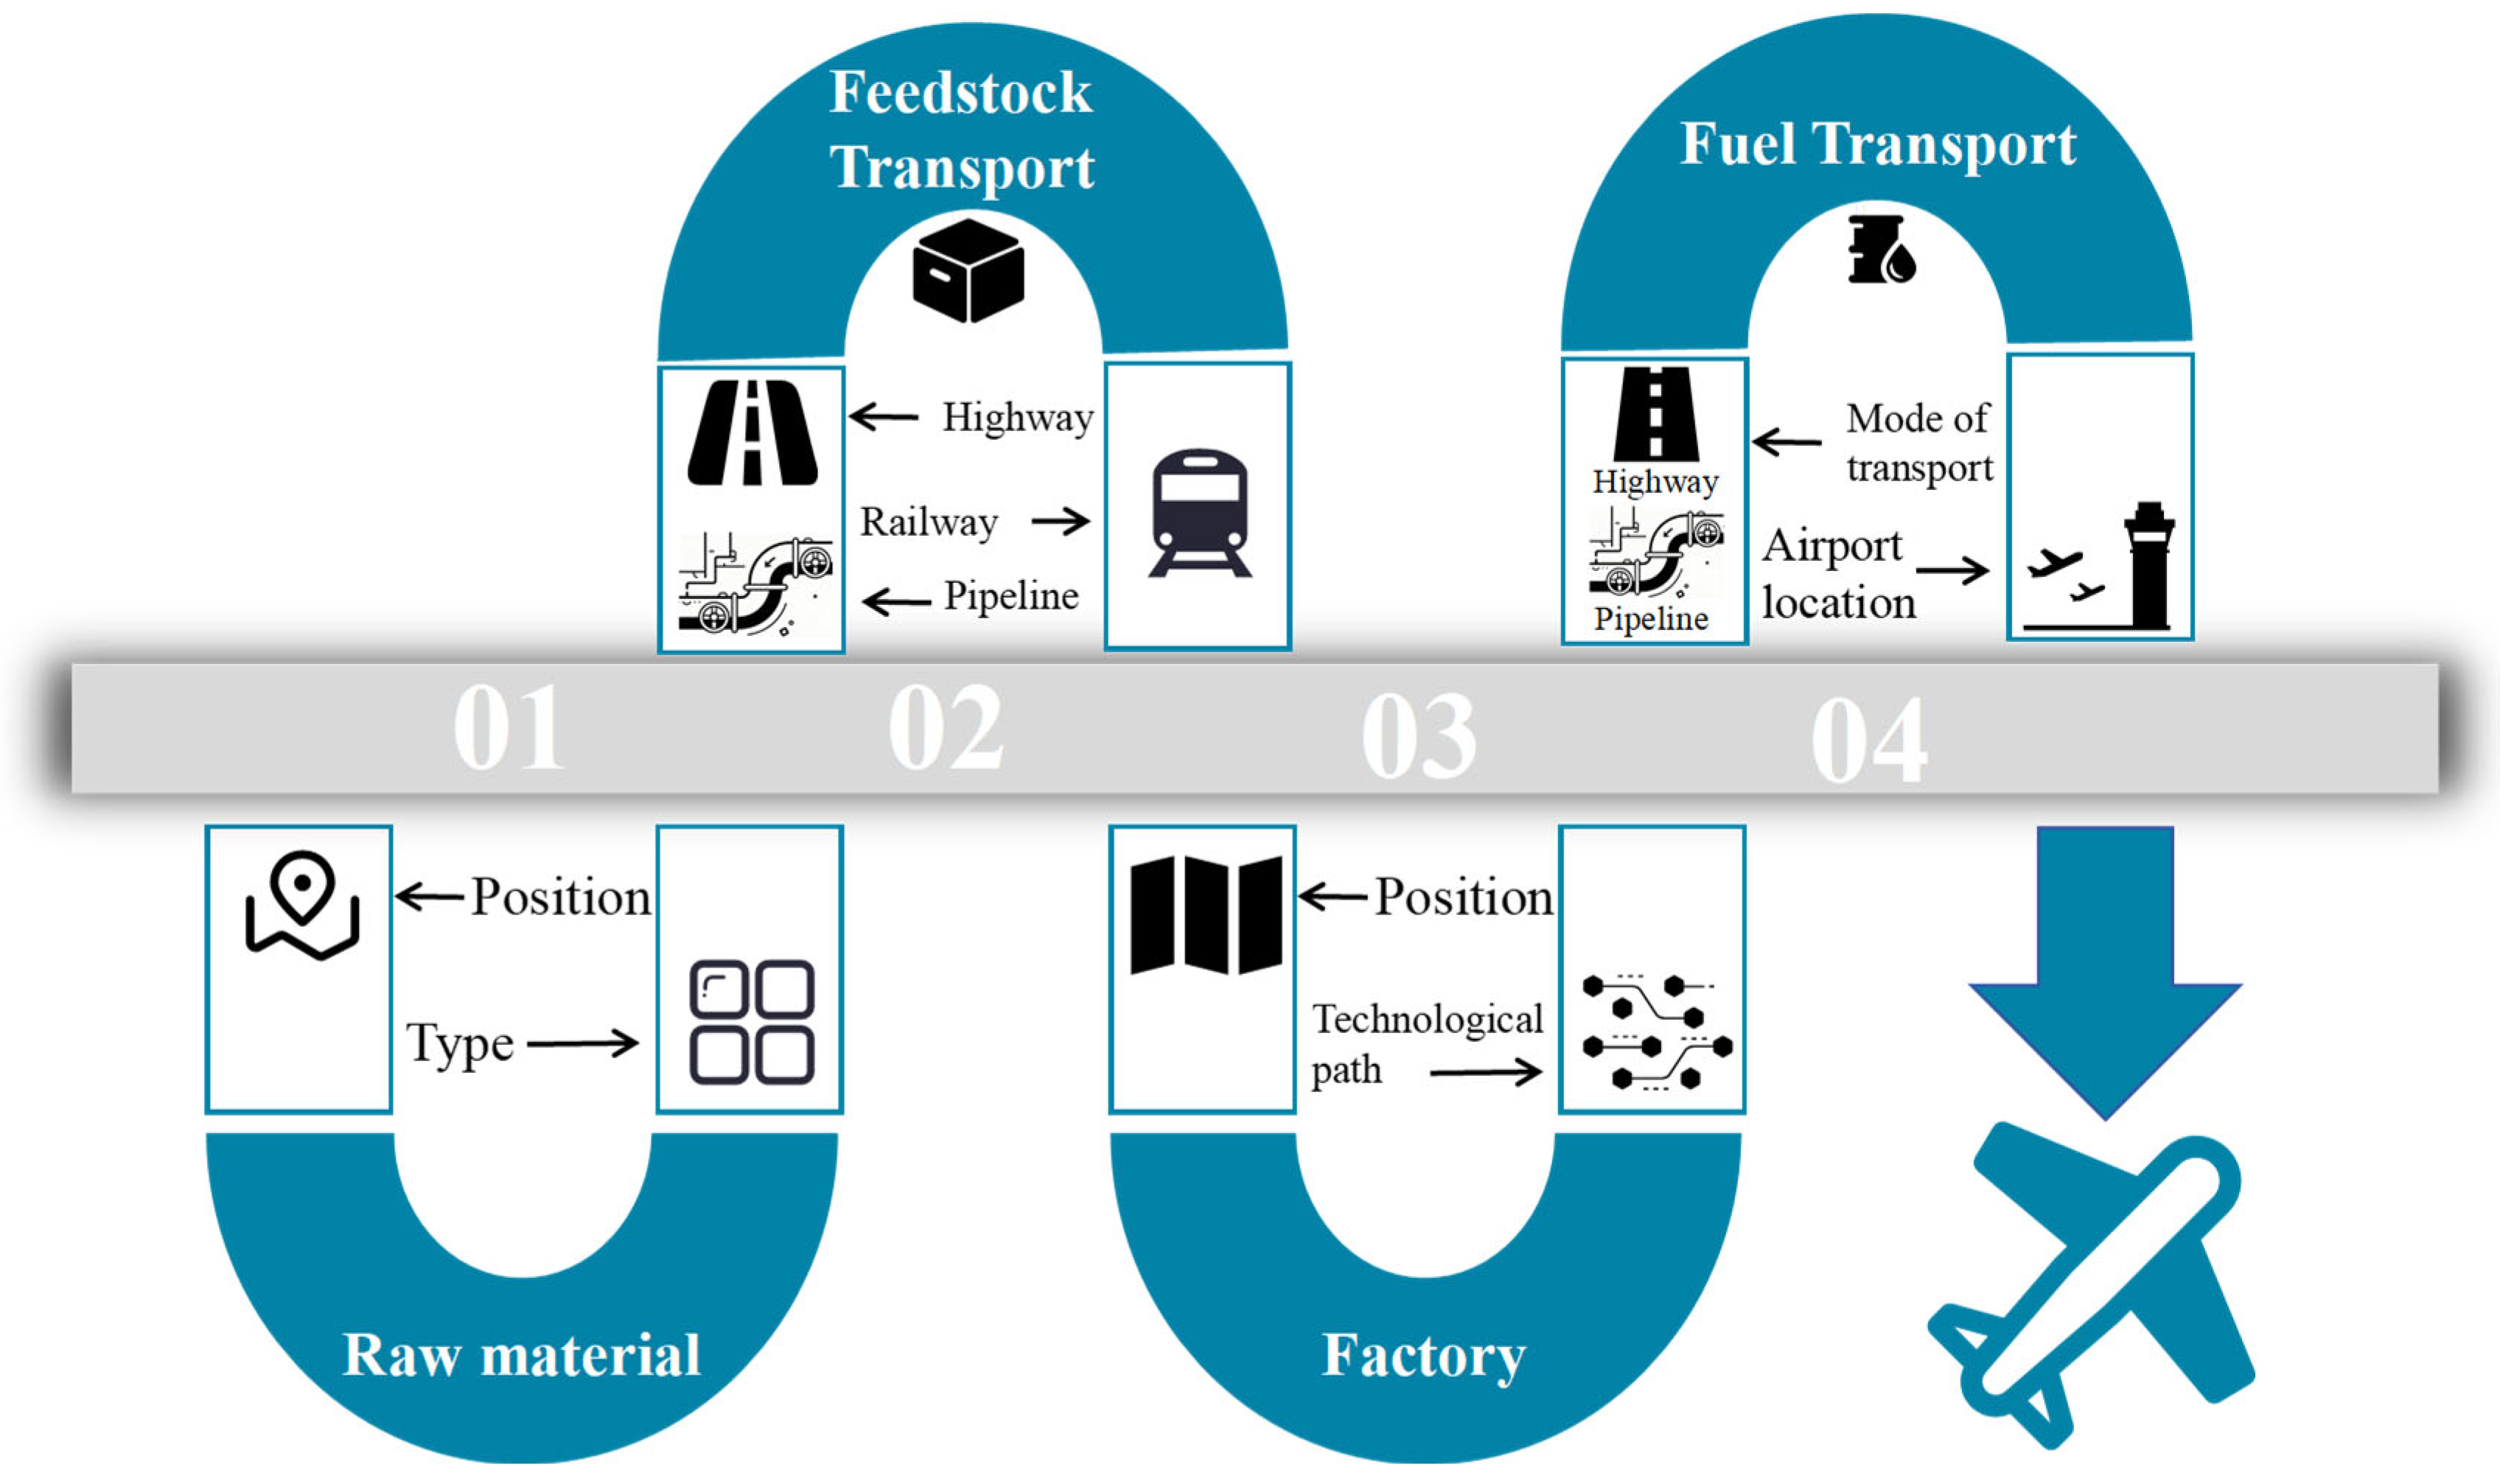
This research introduces machine learning into SAF supply chain carbon emission analysis methodologically while strategically proposing an industrial cluster pathway design balancing carbon emission reduction, resource distribution, and transportation efficiency. The overall analytical framework and technology roadmap of this study are illustrated in Figure 4. Given the complexity of the integrated GAN-LCA approach, this roadmap comprehensively delineates several key interconnected modules: starting from the boundary setting of life-cycle carbon footprint evaluation, progressing through large-scale pathway generation via parametric constraints, and concluding with multi-scenario spatial optimization for the four distinct supply chain paths and industrial cluster layouts. While Figure 4 presents the holistic structural relationships of these elements, the specific algorithmic settings, detailed data features, and deep interpretations of the visual components will be systematically unraveled and described more thoroughly in Section 2 and Section 4. The remainder of this paper is organized as follows: Section 2 presents the research methodology; Section 3 describes the case study and data; Section 4 presents the results and discussion; and Section 5 provides policy implications based on the conclusions.
Figure 4.
Technology roadmap.
2. Methodology
The methodology of this study follows a logical thread of generating SAF pathways to identify low-carbon structures, ultimately orienting toward an optimized cluster configuration while simultaneously addressing two major tasks: supply chain pathway simulation and spatial layout optimization.
2.1. Supply Chain Life-Cycle Pathway Assessment
To achieve the comprehensive carbon emission modeling of SAF from the feedstock origin to the combustion endpoint, this study references the ICAO CORSIA LCA Methodology Guidelines and life-cycle assessment frameworks established in the relevant literature, constructing a carbon footprint pathway model encompassing five critical stages [20]. As illustrated in Figure 5, the pathway commences with feedstock collection, sequentially progressing through feedstock pre-processing, refinery conversion, transportation and distribution, and fueling operations and ultimately reaching the flight combustion phase.
Figure 5.
Schematic diagram of SAF’s full life-cycle carbon emissions.
To address the life-cycle carbon emissions of SAF supply chain pathways in a transparent and reproducible manner, this study employed a hybrid life-cycle assessment methodology, integrating database-derived emission intensity values with process-based formula calculations.
Specifically, upstream stages encompassing feedstock collection and fuel conversion were quantified using default life-cycle emission intensities provided by the ICAO CORSIA framework and the peer-reviewed literature, rather than modeling each process directly within commercial LCA software such as GaBi or SimaPro. This approach ensured consistency with international aviation accounting standards while maintaining comparability across diverse supply chain configurations. In contrast, transportation-related emissions—highly sensitive to spatial configuration and logistical choices—were explicitly calculated using engineering formulas based on mass–distance relationships. Emissions for each transportation segment were computed as the product of transport mass, transport distance, and mode-specific emission coefficients (g CO2-eq/t·km), enabling the model to dynamically reflect variations in route length and transport modality. In the feedstock procurement stage, a multimodal transport network of pipelines, railways and highways is adopted to accommodate the large quantity and diverse forms of biomass residues. For the distribution of finished SAF to hub airports, only pipeline and highway transportation are primarily applied to ensure fuel purity and refueling efficiency. This hybrid framework achieved process-level interpretability alongside large-scale pathway simulation, proving particularly suitable for the data-driven generation and optimization of SAF supply chain pathways using generative adversarial networks.
2.2. Life-Cycle Carbon Intensity Modeling
To provide a quantitative basis for path optimization, a supply chain path-level carbon emission calculation model was constructed on the basis of life-cycle carbon footprint assessment, and the total carbon emission intensity of the four previously divided stages, raw material collection, raw material treatment, raw material transportation, and finished product transportation, and the path was calculated, as shown in Equation (1).
where denotes the carbon intensity of the feedstock collection stage, denotes the carbon emissions from the transportation of feedstock from the origin to the refinery, denotes the process carbon emissions from the SAF production chain, and denotes the carbon emissions from the transportation of finished fuel from the refinery to the airport.
2.3. Pathway Carbon Intensity Value Binding
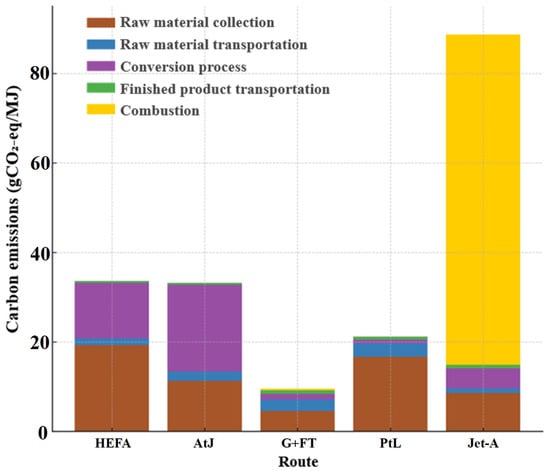
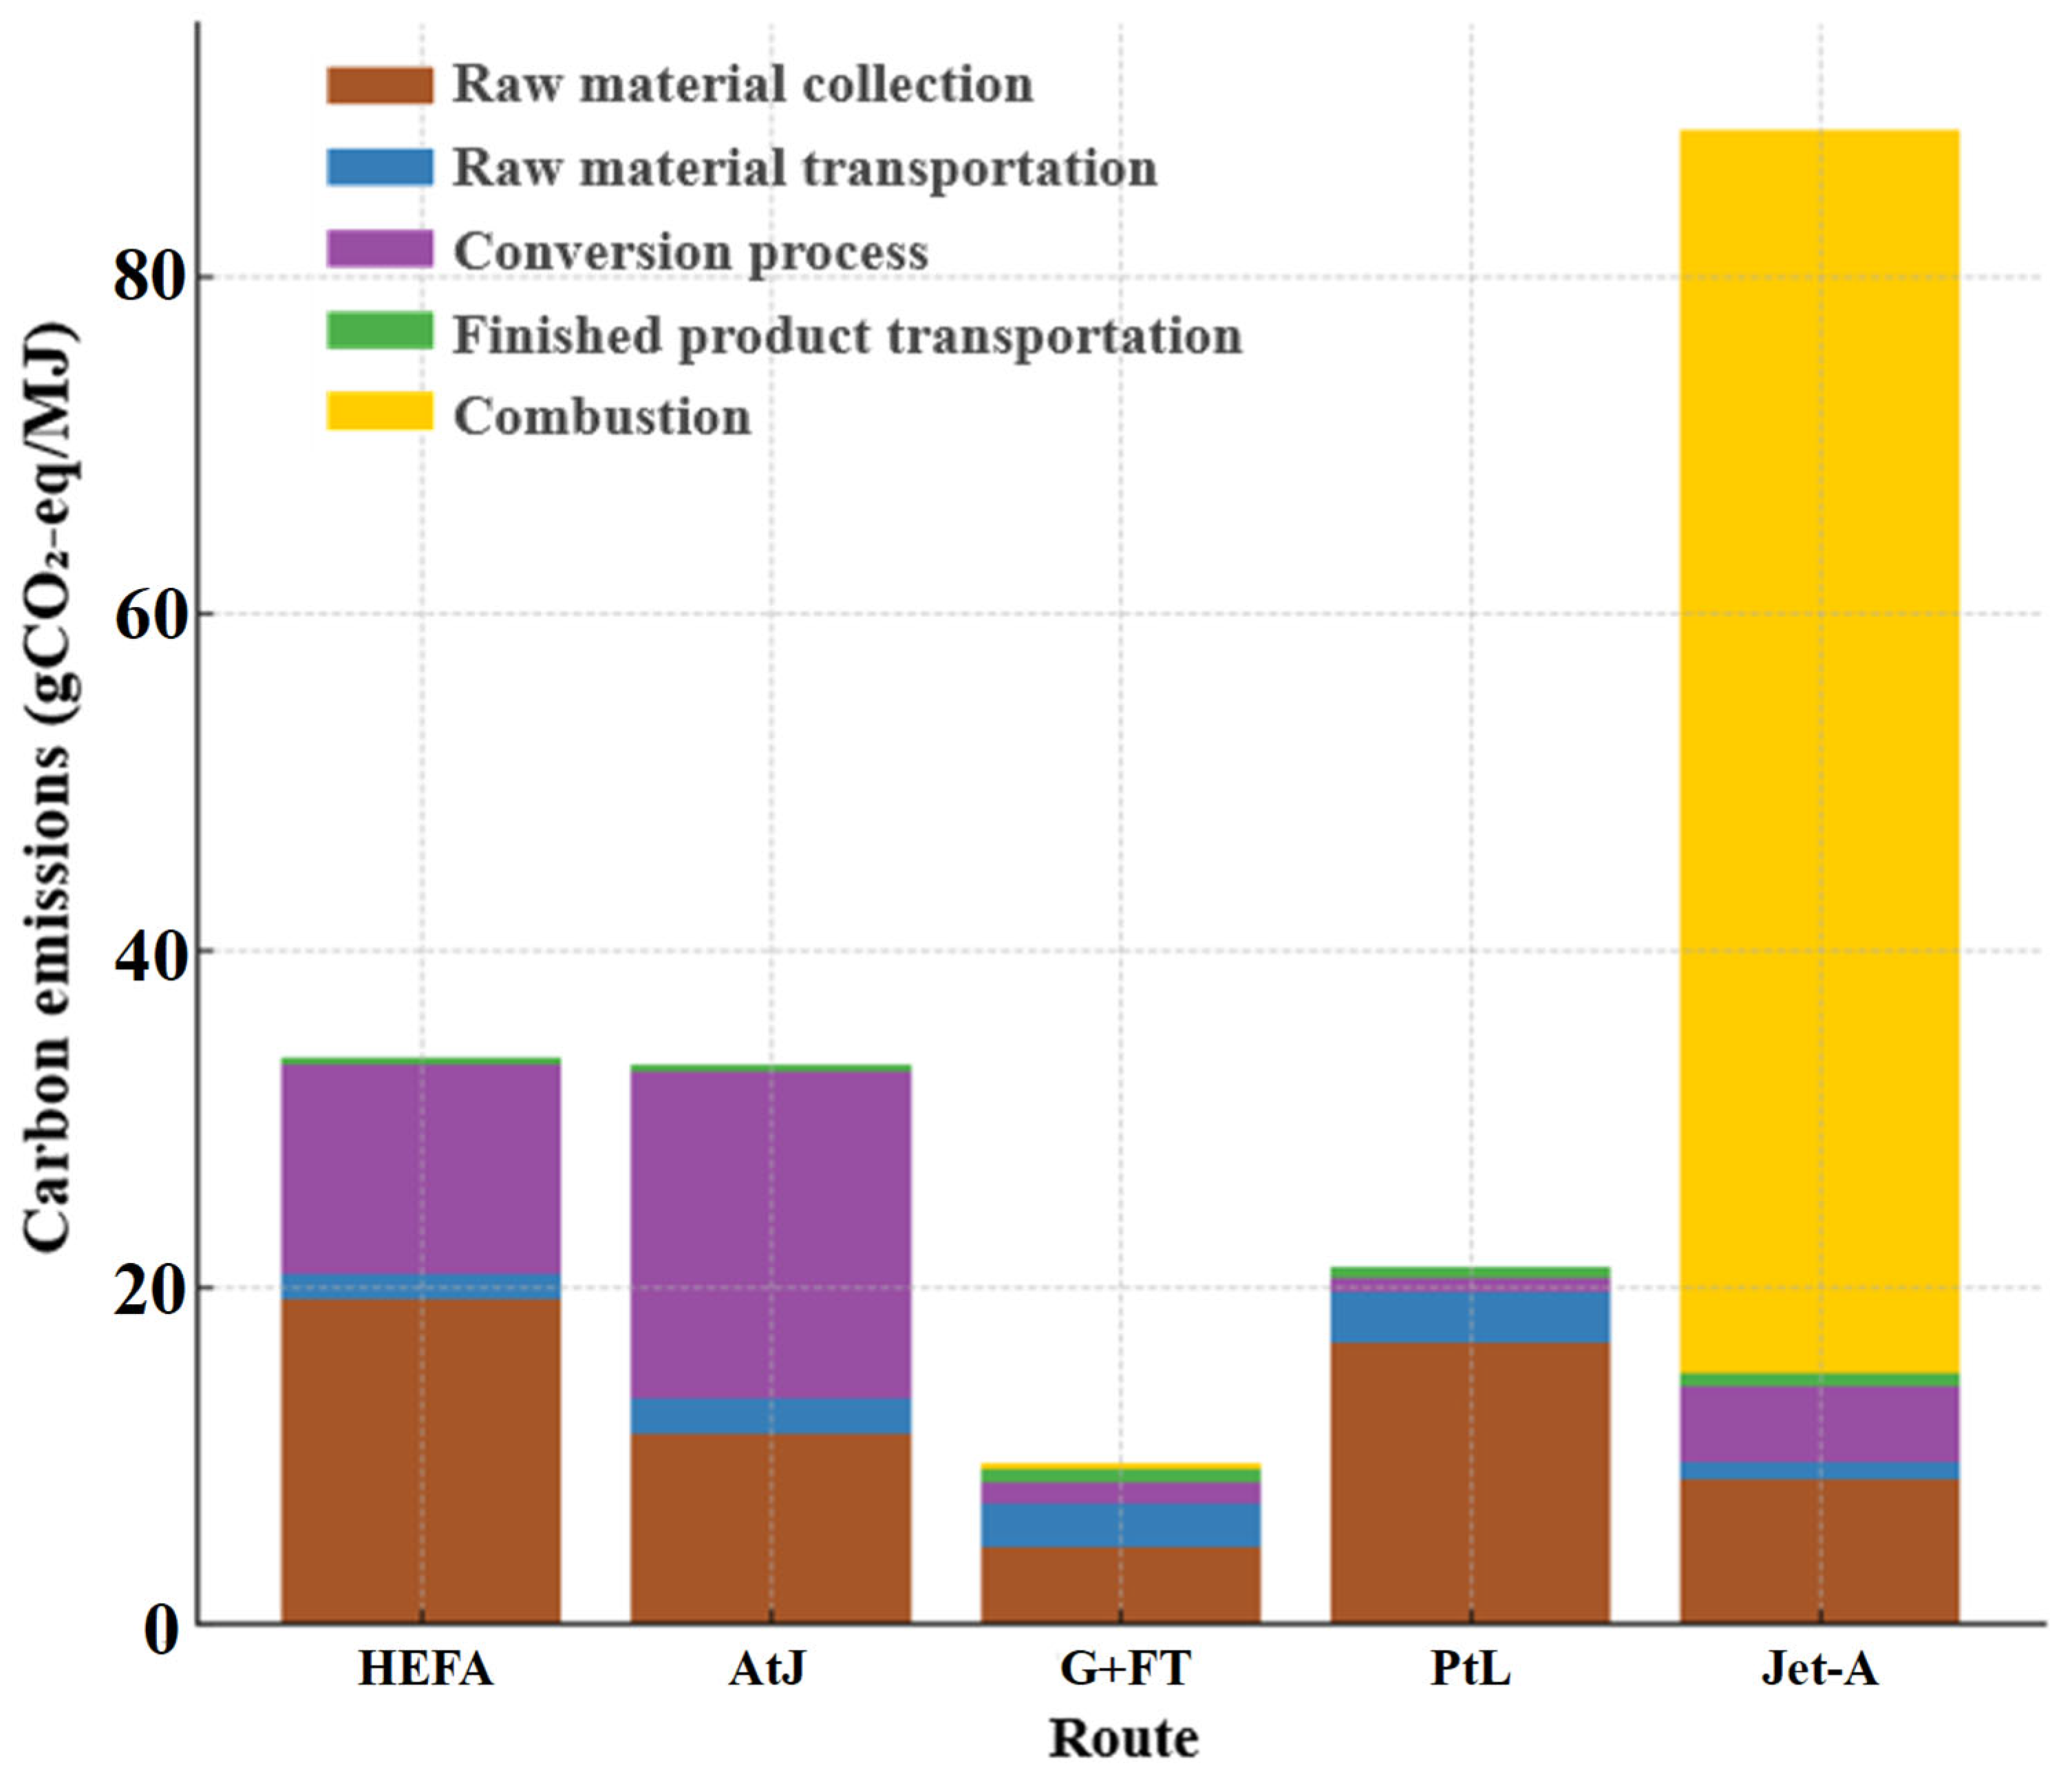
To ensure consistency between technology-specific parameters and transport-related emission modeling, the following assumptions are introduced. To ensure that the generative model possesses physical interpretability and life-cycle consistency, this study established literature-grounded carbon emission intensity benchmark values for diverse technological pathways and critical stages based on pathway modeling. The numerical binding of pathway carbon intensities not only provided reference labels for generator outputs but also constituted the error evaluation benchmark during GAN training. This research synthesized the life-cycle carbon emission levels of SAF under mainstream technological pathways by referencing ICAO’s CORSIA Default Life Cycle Emissions Values for CORSIA Eligible Fuels, ICAO’s CORSIA Supporting Document—Life Cycle Assessment Methodology, and other literature, encompassing five major stages: feedstock collection, feedstock transportation, conversion processes, product transportation, and combustion [5,21]. In the comparative analysis of full life-cycle greenhouse gas emission performance among Renewable Jet Fuel (RJF) technological pathways, Fischer–Tropsch (FT) synthesis demonstrated optimal emission reduction efficiency, followed by hydrothermal liquefaction [22]. As similarly illustrated in Figure 6, when electricity is sourced from renewable energy and CO2 is derived from capture sources, carbon intensity can be as low as 21.4 g CO2-eq/MJ, achieving the most favorable emission reduction outcome [21]. The full life-cycle carbon intensity of Hydro-processed Esters and Fatty Acids (HEFAs) is approximately 33.6 g CO2-eq/MJ, representing a 62% reduction compared to conventional jet fuel at 89 g CO2-eq/MJ [21].
Figure 6.
Comparison of carbon emissions from SAF production with aviation fuel in different technology paths.
In order to introduce the life-cycle carbon intensity indicator into the supply chain pathway simulation in a more intuitive way, this study converts the standard carbon emissions per unit of energy consumption (gCO2-eq/MJ) to the total emissions based on tons of fuel (gCO2-eq/ton). This conversion follows the logic in Equation (2).
where denotes the life-cycle carbon intensity per unit of energy consumed for a given pathway, and equal to 43,000 MJ/ton is the typical low-level calorific value of aviation fuels, with reference to the calorific value assumptions set by Carbon Offset and Reduction Scheme for International Aviation (CORSIA) in ICAO [5].
Through this method, this study completed ton-level carbon emission mapping for different technological pathways across various life-cycle stages, forming Table 1: Baseline life-cycle carbon emission factors for different SAF pathways (g CO2-eq/ton of fuel). This table provides structured ground-truth support for training data and serves as the reference standard for authenticity evaluation in the discriminator model.
Table 1.
Baseline life-cycle carbon emission factors for different SAF pathways (g CO2-eq/ton of fuel).
The HEFA pathway primarily utilizes waste cooking oil (UCO), animal fats, and similar lipid-based feedstocks. Previous studies indicate that its conversion efficiency typically ranges from 60% to 75%, corresponding to approximately 1.6 tons of feedstock per ton of SAF [5,22]. In contrast, the AtJ pathway, which relies on ethanol derived from sugarcane, lignocellulosic biomass, or other feedstocks, exhibits a lower conversion efficiency of approximately 25% to 35%, resulting in a feedstock demand of 2.5 to 3.5 tons per ton of SAF [23]. In this study, the feedstock-to-fuel conversion ratios are fixed at 1.6 ton of feedstock/ton of SAF for the HEFA pathway and 2.5 tons of feedstock/ton of SAF for the AtJ pathway, corresponding to the minimum conversion loss levels within the reported ranges. This assumption is adopted to establish a consistent and near-optimal technological baseline, allowing the analysis to focus on supply chain structural characteristics rather than process-level variability.
Also in life-cycle pathway modeling, carbon emissions from the transportation phase represent a “strongly mass–distance product-related” process, and its carbon intensity is calculated in a way that is very different from that of energy-value related processes, such as raw material collection and transformation. In order to ensure the physical consistency and comparability of carbon emission estimation, this study splits transportation carbon emissions into separate calculations and uses tonne-kilometer-based carbon emission factors for modeling. Unit emission intensity factors for transport processes are standardized to an internationally accepted standard in gCO2-eq/t·km. Carbon emissions at the transportation stage are calculated as shown in Equation (3).
where denotes the unit emission factor of different transportation modes, M denotes the mass of transportation fuel (ton), d denotes the transportation distance of the path (km), and denotes the total carbon emission of the transportation link (gCO2-eq). In order to further enhance the engineering appropriateness of carbon emission estimation in the transportation phase of the pathway simulation, we make the following assumptions and use scenario matching settings for the carbon factor settings of the three types of typical transportation modes:
Road Transport: The emission factor is assigned as 82 g CO2-eq/t·km, corresponding to measured values for 20-tonne diesel trucks under partial load conditions (50–75%) [24]. This mode is primarily applicable for the short-distance transfer of feedstock from distributed collection points to refineries or for the overland distribution of finished SAF from refineries to airports, with transport distances generally not exceeding 30 km. While offering substantial operational flexibility, this mode exhibits relatively high carbon emissions per unit.
Rail Transport: The emission factor is established at 28 g CO2-eq/t·km, representing the median value for mainline electrified railways under reasonable load ratios [25,26]. Rail transport is principally employed for bulk, inter-provincial allocation pathways between feedstock origins and refineries. In China’s existing crude oil transportation network, such routes include those from Jilin to Jiangsu and from Sichuan to Zhejiang, connecting major feedstock production regions with refining bases, with one-way distances typically ranging from 30 to 1500 km. This mode offers low carbon intensity per unit and substantial batch capacity.
Pipeline Transport: The emission factor is established at 10 g CO2-eq/t·km, derived from unit pumping energy consumption during the long-distance conveyance of crude oil and refined products through medium-pressure liquid pipelines [27]. This mode is suitable for direct supply systems between large integrated refining storage bases and airport clusters. In regions possessing oil pipeline infrastructure, such as Shandong Yulong Petrochemical and Guangdong Huizhou Petrochemical in China, transport distances typically exceed 500 km, and this mode may be preferentially selected where pipeline conditions permit.
In addition, in order to improve the automation ability of the model, this paper embeds the transportation mode recommendation mechanism in program implementation. In modeling, the system will be based on the path distance d. Regarding whether to connect it to the pipeline network infrastructure, as well as the length of the transportation distance section, the most matching transportation mode and emission factor are dynamically specified, and the specific rules are shown in Equation (4) below:
Meanwhile, the carbon emission factor for marine transportation is 16 g CO2-eq/t·km, which corresponds to the short-sea mode of transportation and is applicable to the transportation of ships in close proximity to coastal ports and international raw material/fuel supply ships [28]. However, aviation fuel is rarely transported by sea in China, so in this study, the scenario was set up so that sea transportation would take place only when it was necessary to transport the fuel to its destination.
By fixing the conversion efficiency in the life-cycle model, the model avoids introducing additional uncertainty and prevents its propagation into feedstock demand and transportation emissions. This ensures comparability across different pathways and isolates the impact of spatial configuration and transport structure on life-cycle carbon emissions. If higher or variable conversion losses were considered, feedstock requirements would increase accordingly, leading to greater transportation volumes and higher overall emissions, which could obscure the structural differences that this study aims to capture.
2.4. GAN-Based SAF Supply Chain Pathway Modeling Methodology
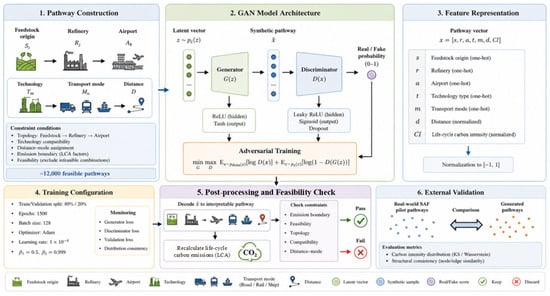
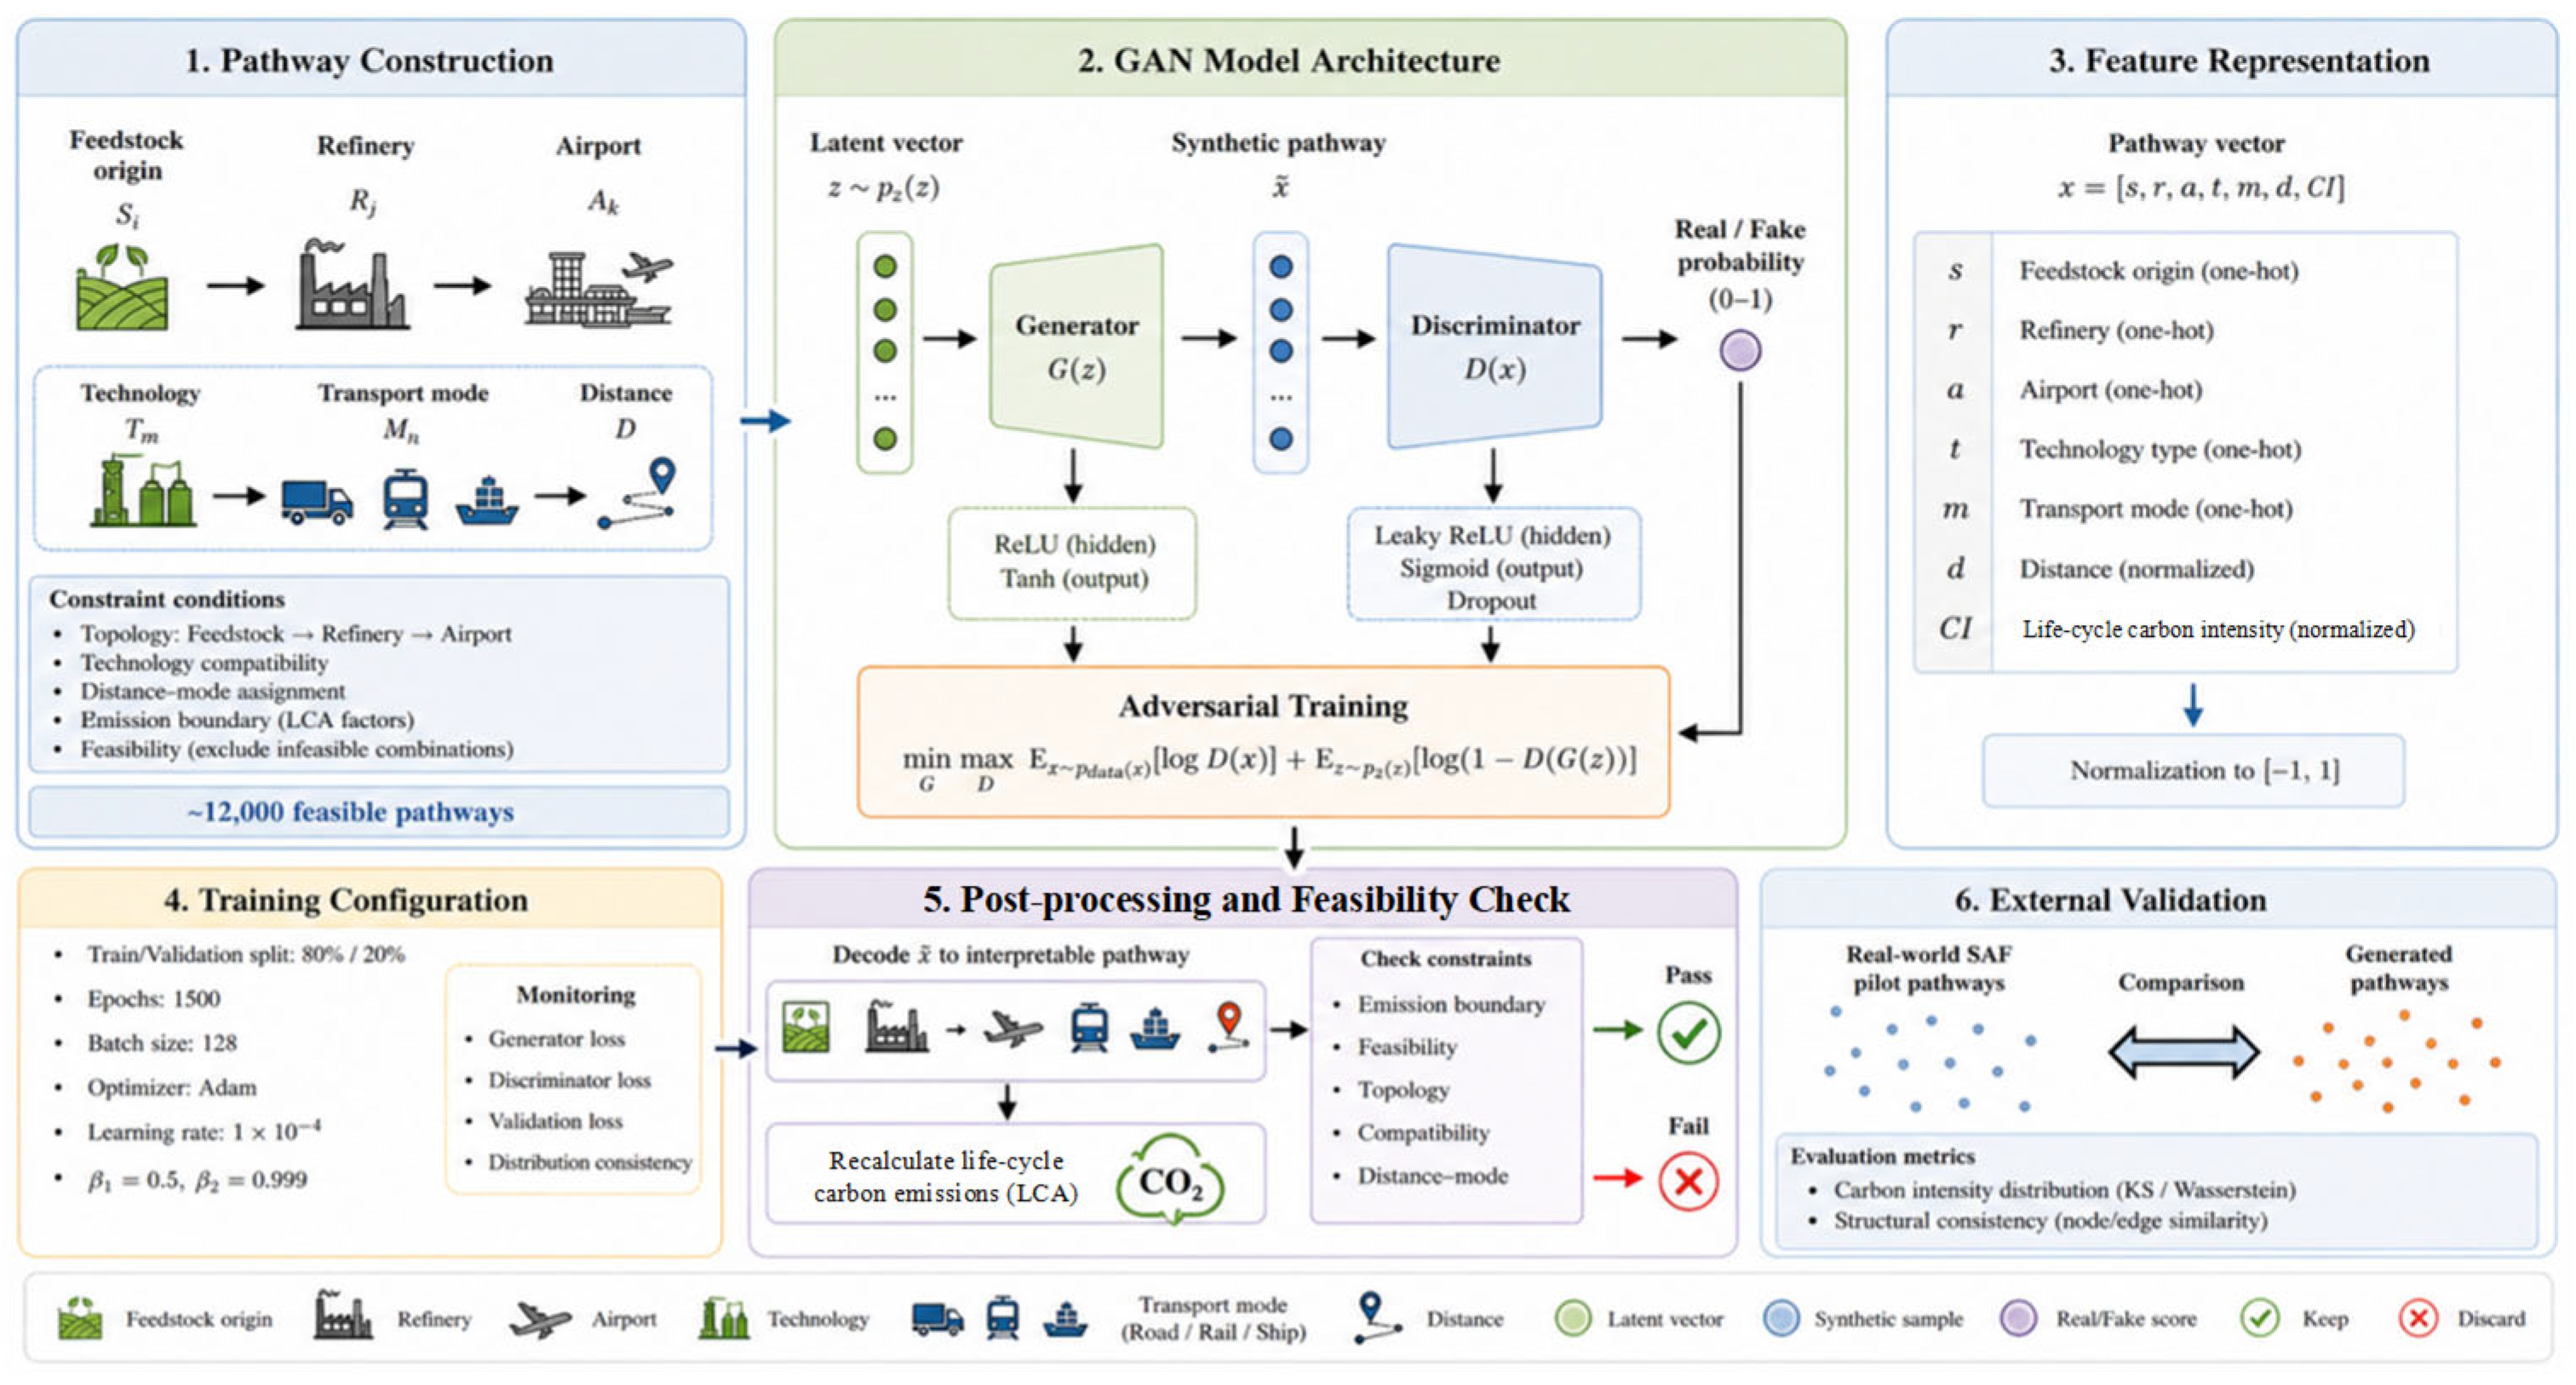
This study develops a hybrid GAN-based framework for SAF supply chain pathway modeling by integrating rule-constrained data synthesis, adversarial distribution learning, and post-generation physical validation. As illustrated in Figure 7, the framework is designed to address data sparsity while ensuring consistency with engineering constraints and life-cycle carbon accounting principles.
Figure 7.
Schematic diagram of GAN-based SAF supply chain pathway generation and distribution consistency validation.
2.4.1. Rule-Constrained Pathway Construction and Feature Representation
Due to the limited availability of large-scale, fully observable real-world SAF supply chain data, this study constructs a rule-constrained synthetic dataset to approximate realistic pathway configurations while preserving sufficient diversity for model training. Each SAF supply chain pathway is defined as an ordered set of nodes and attributes:
where , and denote the feedstock origin, refinery node, and airport demand node, respectively; Tm represents the conversion technology pathway; denotes the transport mode; and is the transport distance. To ensure physical feasibility and engineering consistency, pathway generation is governed by multiple constraints [29]. First, a topology constraint enforces the complete structure of “feedstock→refinery→airport” Second, a technology compatibility constraint ensures that feedstock types are matched with appropriate conversion technologies, consistent with established SAF production pathways. Third, a distance mode constraint assigns transport modes based on distance ranges and infrastructure conditions. Fourth, emission boundary constraints are applied using established LCA datasets. Finally, infeasible combinations are excluded.
Under these constraints, approximately 12,000 feasible pathway samples are generated, ensuring both structural diversity and practical plausibility. Each pathway is encoded into a fixed-dimensional feature vector:
where s, r, and a are one-hot-encoded vectors representing feedstock origin, refinery, and airport nodes; t and m denote technology type and transport mode; is transport distance; and represents life-cycle carbon intensity. All features are normalized to the range [−1,1] to ensure compatibility with the generator output.
2.4.2. GAN Training, Post-Processing, and Validation
A GAN is employed to learn the distribution of feasible SAF supply chain pathways. The generator maps a latent noise vector to a synthetic pathway x, while the discriminator estimates the probability that a sample originates from the training dataset [30,31]. The adversarial learning objective is defined as follows:
Both networks are implemented as fully connected neural networks. The generator uses ReLU activation functions in hidden layers and Tanh in the output layer, while the discriminator adopts Leaky RelU activation and a Sigmoid output [32]. Dropout is applied to the discriminator to reduce overfitting. The dataset is split into training and validation sets at a ratio of 80% and 20%. The model is trained for 1500 epochs with a batch size of 128 using the Adam optimizer (learning rate 1 × 10⁻⁴, β1 = 0.5, β2 = 0.999).
To ensure physical interpretability, a post-processing step is applied to generated samples. Synthetic pathways are decoded into interpretable attributes, and their life-cycle carbon emissions are recalculated using the LCA model. Samples that violate feasibility or emission constraints are discarded. In addition, an external validation step is conducted using a subset of publicly available SAF pilot pathways that are not included in the training dataset. The similarity between generated and real pathways is evaluated based on carbon intensity distribution and structural characteristics, ensuring that the model captures realistic system patterns.
Overall, this rule-constrained and physically grounded framework enables the GAN model to learn both the structural and emission-related characteristics of SAF supply chains, providing a data-driven basis for subsequent scenario analysis and optimization.
3. Case Study and Data
This research is positioned to serve “national low-carbon strategic infrastructure.” Data selection must therefore “balance future development prospects with Chinese actual conditions,” supporting the model’s transition from an academic tool to a strategic enabler. It addresses both immediate pilot pain points and long-term carbon peaking objectives. Consequently, data selection considers future development potential while emphasizing Chinese contextual realities.
3.1. Hub Airport Selection Criteria and List
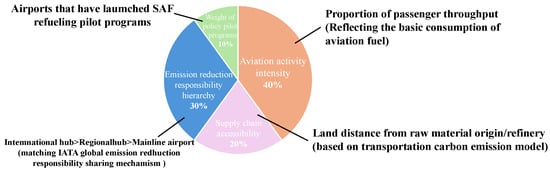
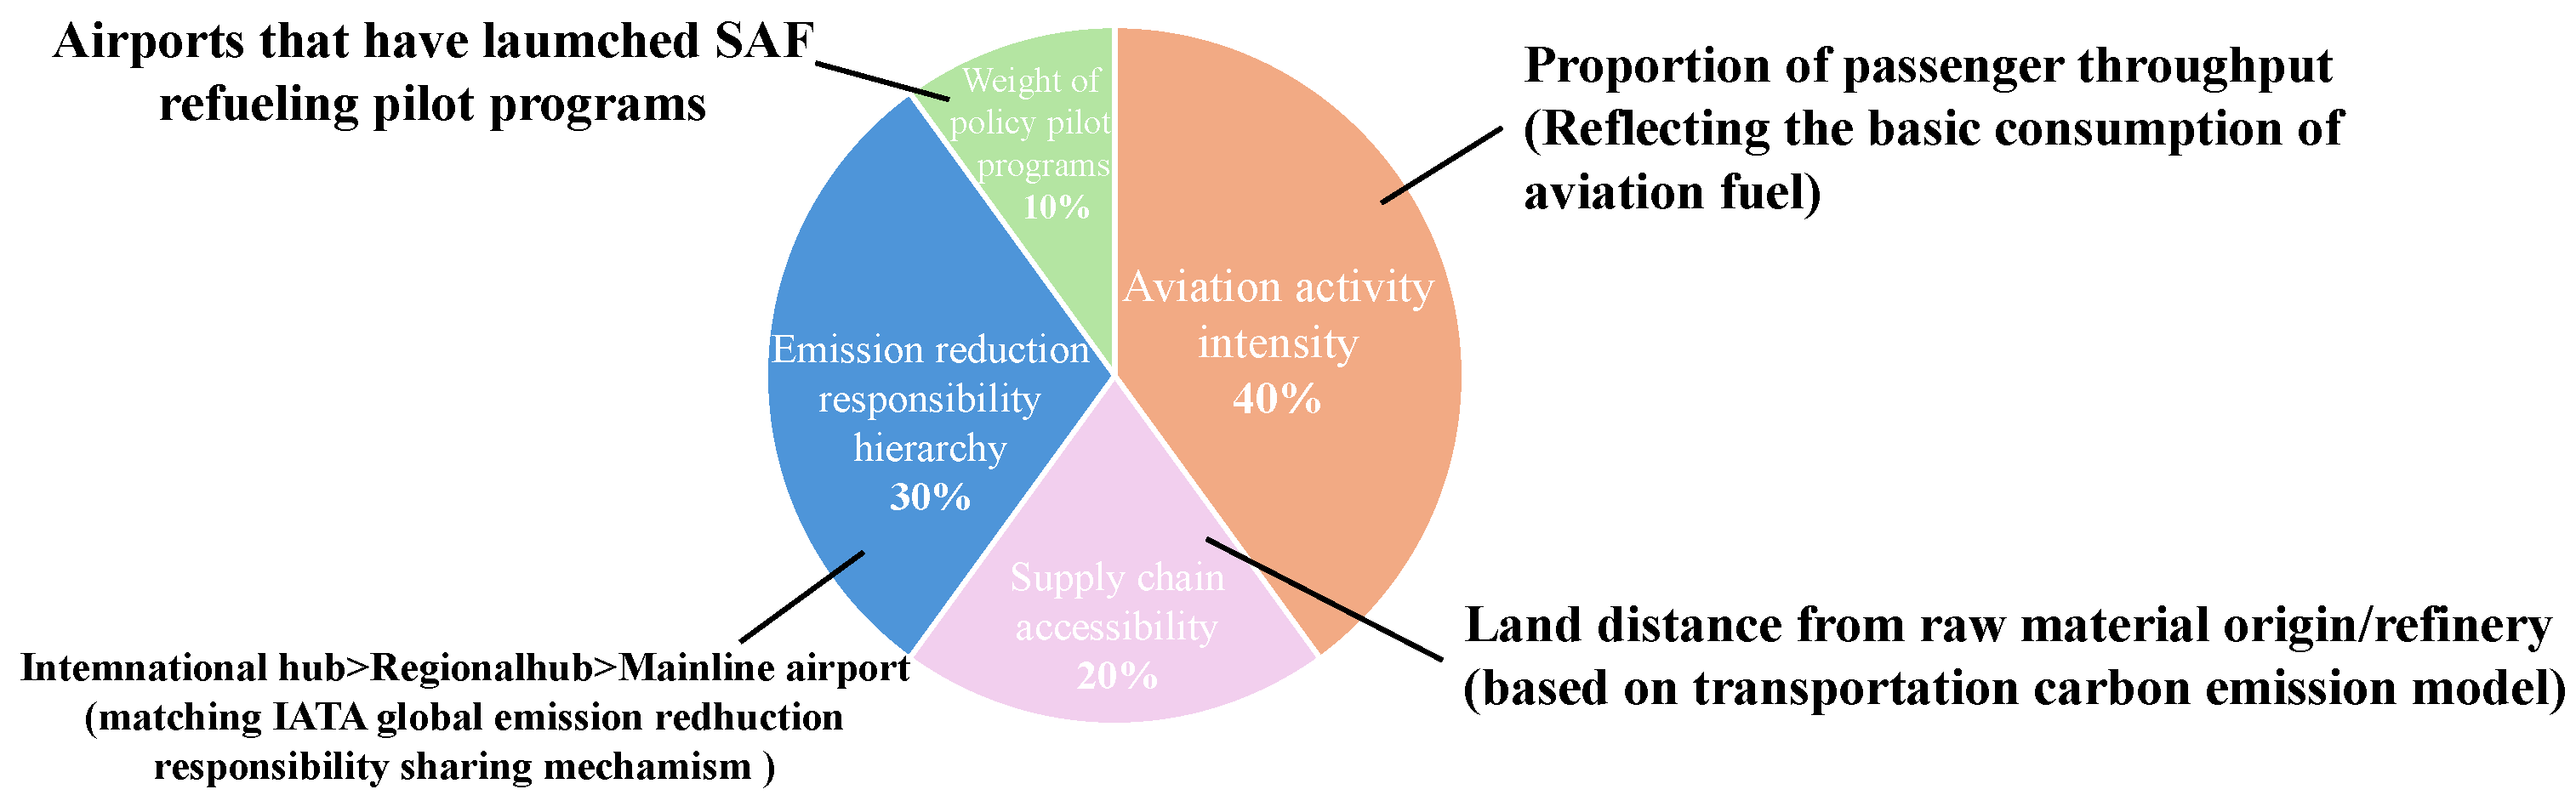
The selection of hub airports for SAF distribution is formulated as a multi-criteria decision problem, aiming to balance fuel demand, emission reduction potential, and supply chain feasibility within the national aviation network. A four-dimensional weighting framework is adopted to evaluate the relative importance of candidate airports, as shown in Figure 8.
Figure 8.
SAF allocation weight system.
The weighting scheme is determined based on a combination of policy relevance, industry practice, and expert judgment, rather than a single prescribed standard. Higher weights are assigned to aviation activity intensity and emission responsibility, as these factors directly influence fuel demand and carbon reduction impact [33]. In contrast, supply chain accessibility and policy support are treated as supporting criteria that enhance implementation feasibility. Specifically, aviation activity intensity is quantified using passenger throughput data, reflecting the fundamental demand for aviation fuel [34]. Emission reduction responsibility captures the strategic role of airports in achieving national and international decarbonization targets, particularly for major international and regional hubs. Supply chain accessibility evaluates the proximity of airports to feedstock production regions and refining facilities, as well as the availability of transportation infrastructure [35]. Policy support considers existing SAF pilot programs and the level of governmental or institutional commitment to sustainable aviation initiatives.
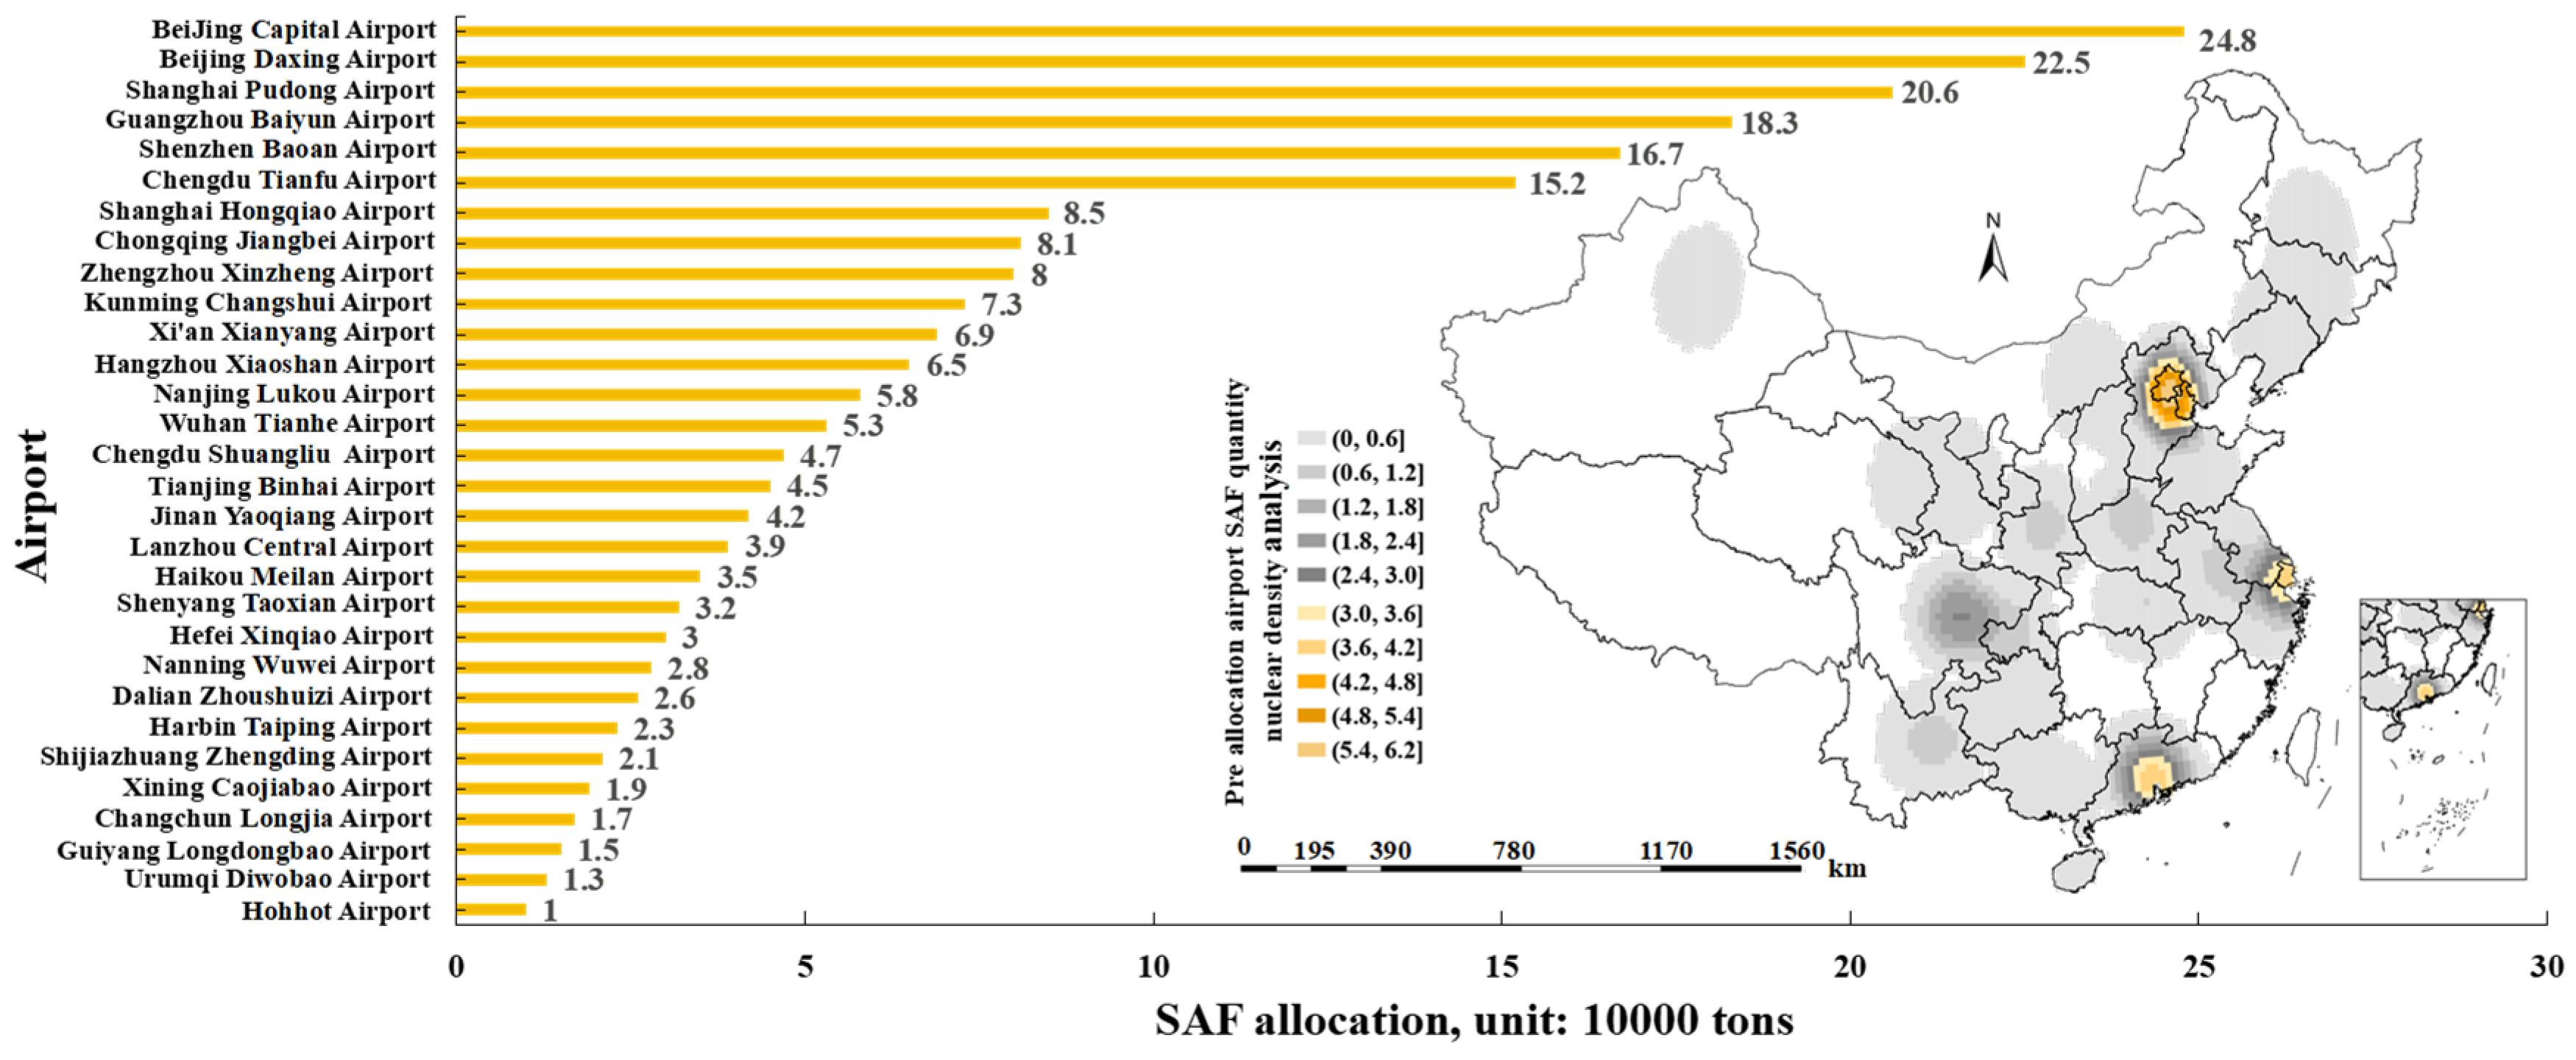
Based on these criteria, hub airports are selected across major regions of China to ensure both spatial representativeness and functional diversity within the aviation network. Representative large-scale hubs such as Beijing, Shanghai, Guangzhou, and Chengdu are included due to their high traffic volume and central role in the national aviation system, while regional hubs are incorporated to reflect geographic balance and supply chain connectivity. The allocation results are shown in Figure 9, with kernel density analysis conducted on SAF quantities distributed to individual airports. This selection framework ensures that SAF allocation is guided by both demand-driven and system-level considerations, providing a robust basis for subsequent pathway modeling and optimization.
Figure 9.
Total of 30 airports assigned SAF volume and kernel density analysis.
3.2. Criteria and Lists for Selection of Feedstock Locations
The feedstock location criteria were selected to cover the main biomass and resource-rich areas and to represent supply-side diversity. The core idea is to provide supply endpoints for “supply chain optimization” and to provide a basis for the positioning of “resource areas” in “cluster identification”. Feedstock location selection is mainly based on food production and crop structure, represented by soybeans, corn and other food crops that can be converted into ethanol, syngas or pyrolysis oil. Industrial raw materials and the by-product agglomeration area, along with sugar by-products and chemical by-products and other potential SAF pathway feedstocks, and the 12 selected feedstock provinces and their representative feedstock types and key support data are shown in Table 2.
Table 2.
Types of feedstock selection in selected provinces and their rationale.
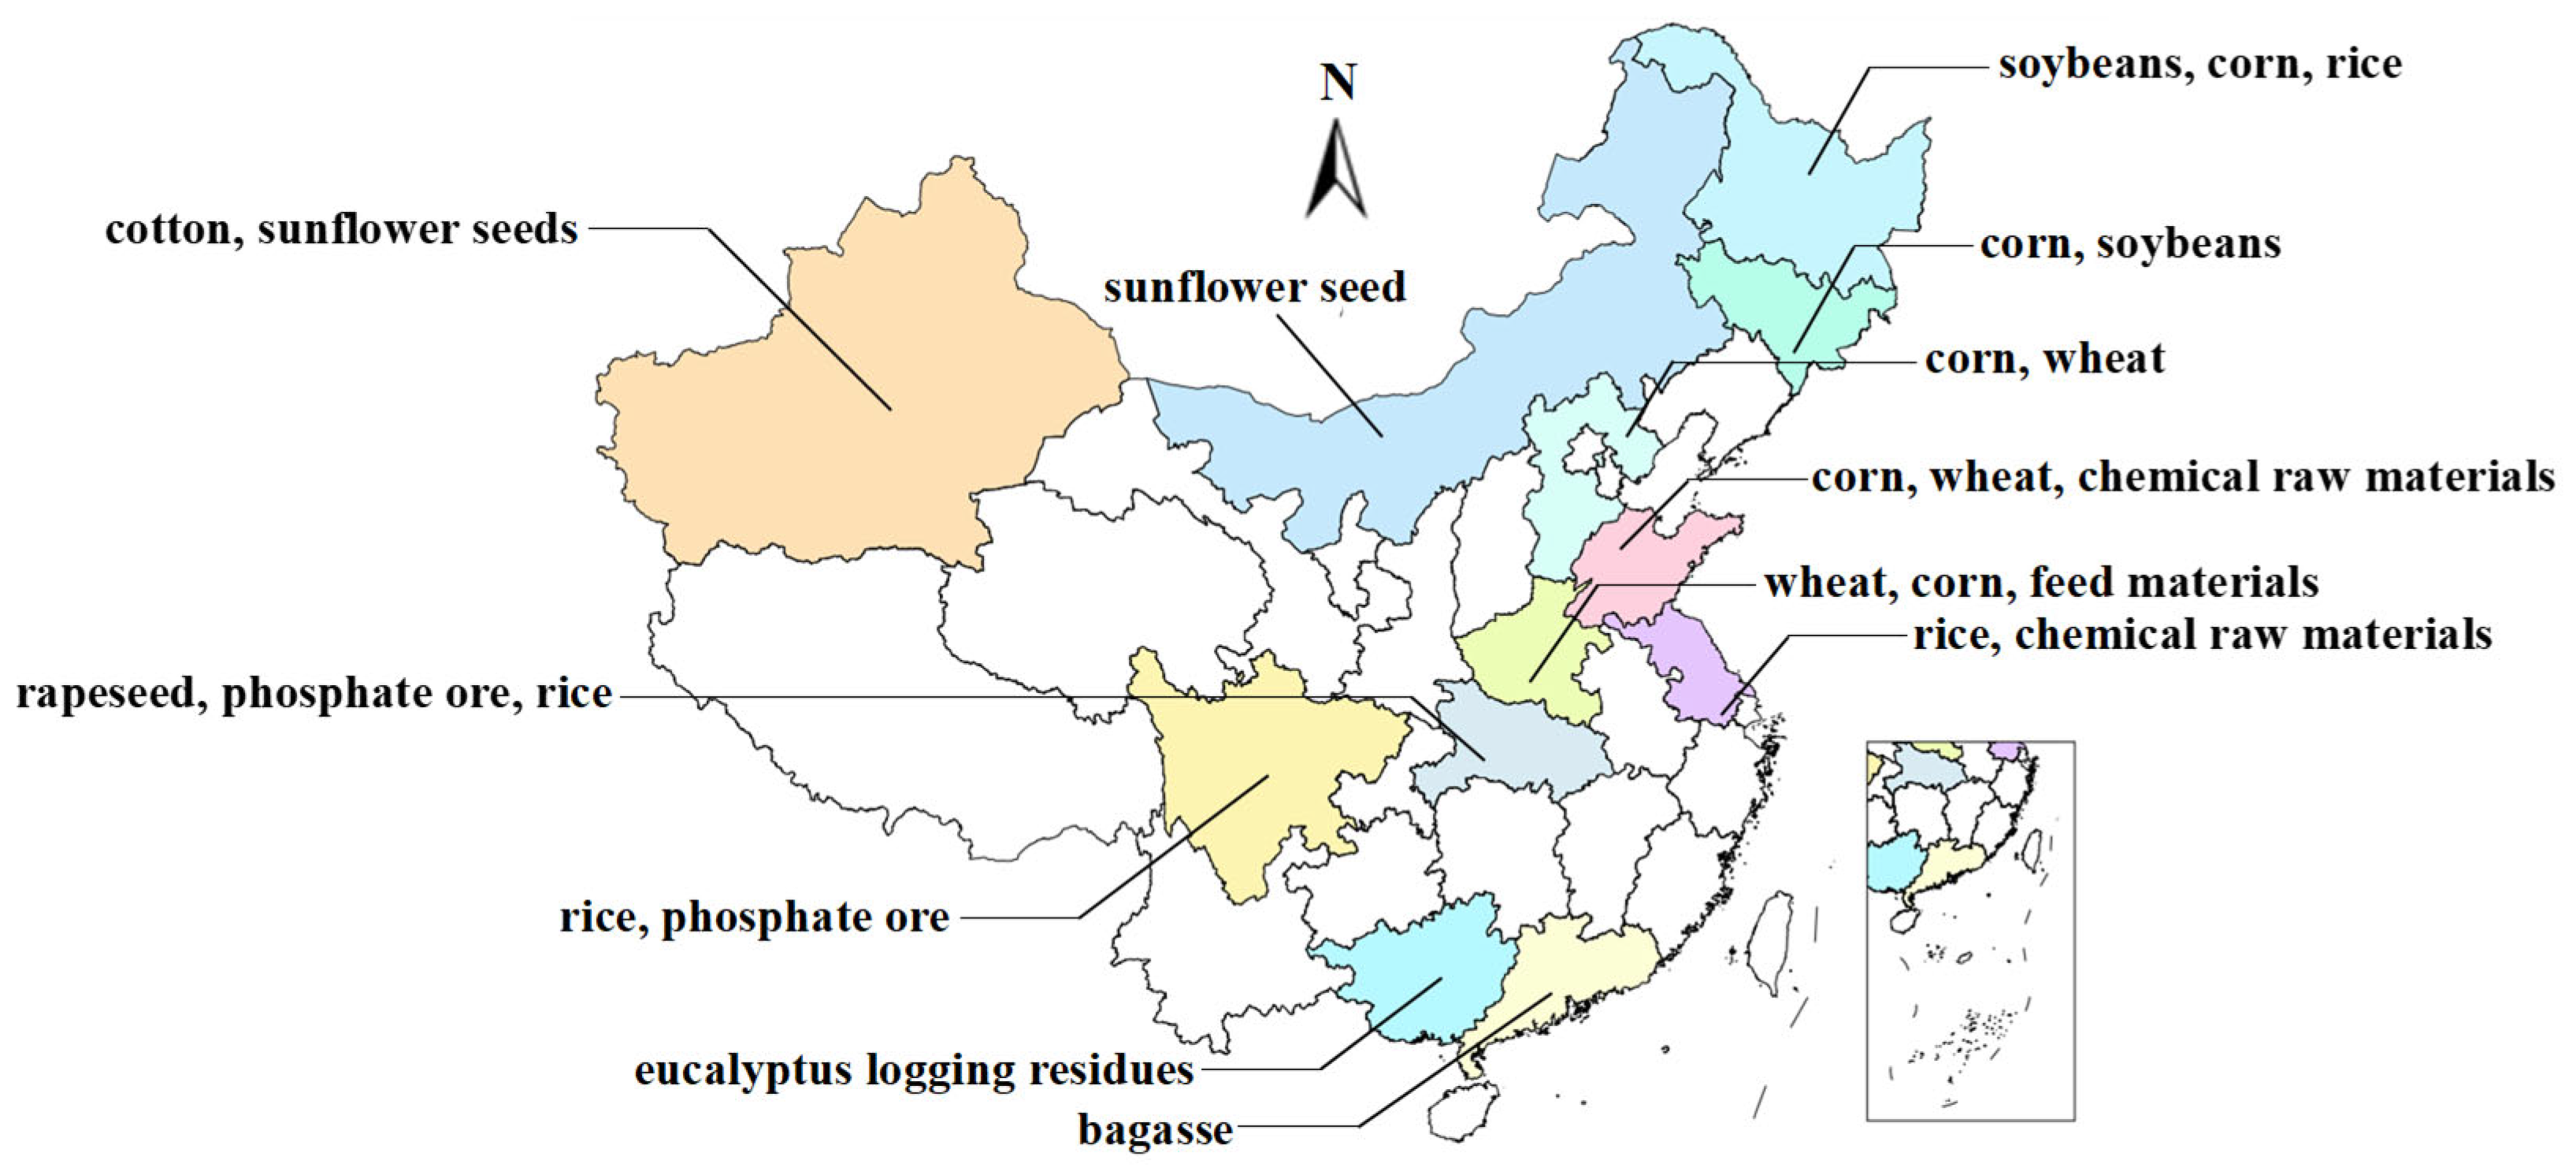
Ultimately, 12 representative provinces were strategically selected as feedstock supply nodes to ensure comprehensive geographical coverage across China’s major economic and ecological zones. As shown in Figure 10, the selection spans from the high-latitude grain belt in the northeast to the sugar and biomass hubs in the south and from the energy-rich frontier in the west to the industrial heartlands in the east. This ensures that the results of “supply chain optimization” and “cluster identification” are representative of China’s complex resource endowment, providing a robust empirical basis for national-scale SAF deployment.
Figure 10.
Distribution map of raw material collection provinces.
3.3. Criteria and List for Selection of Refinery Locations
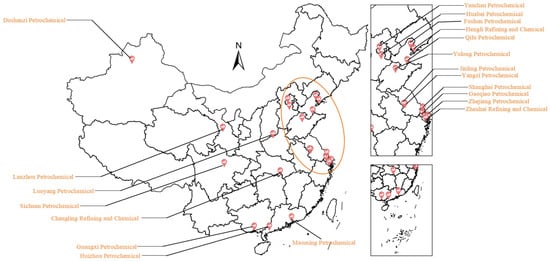
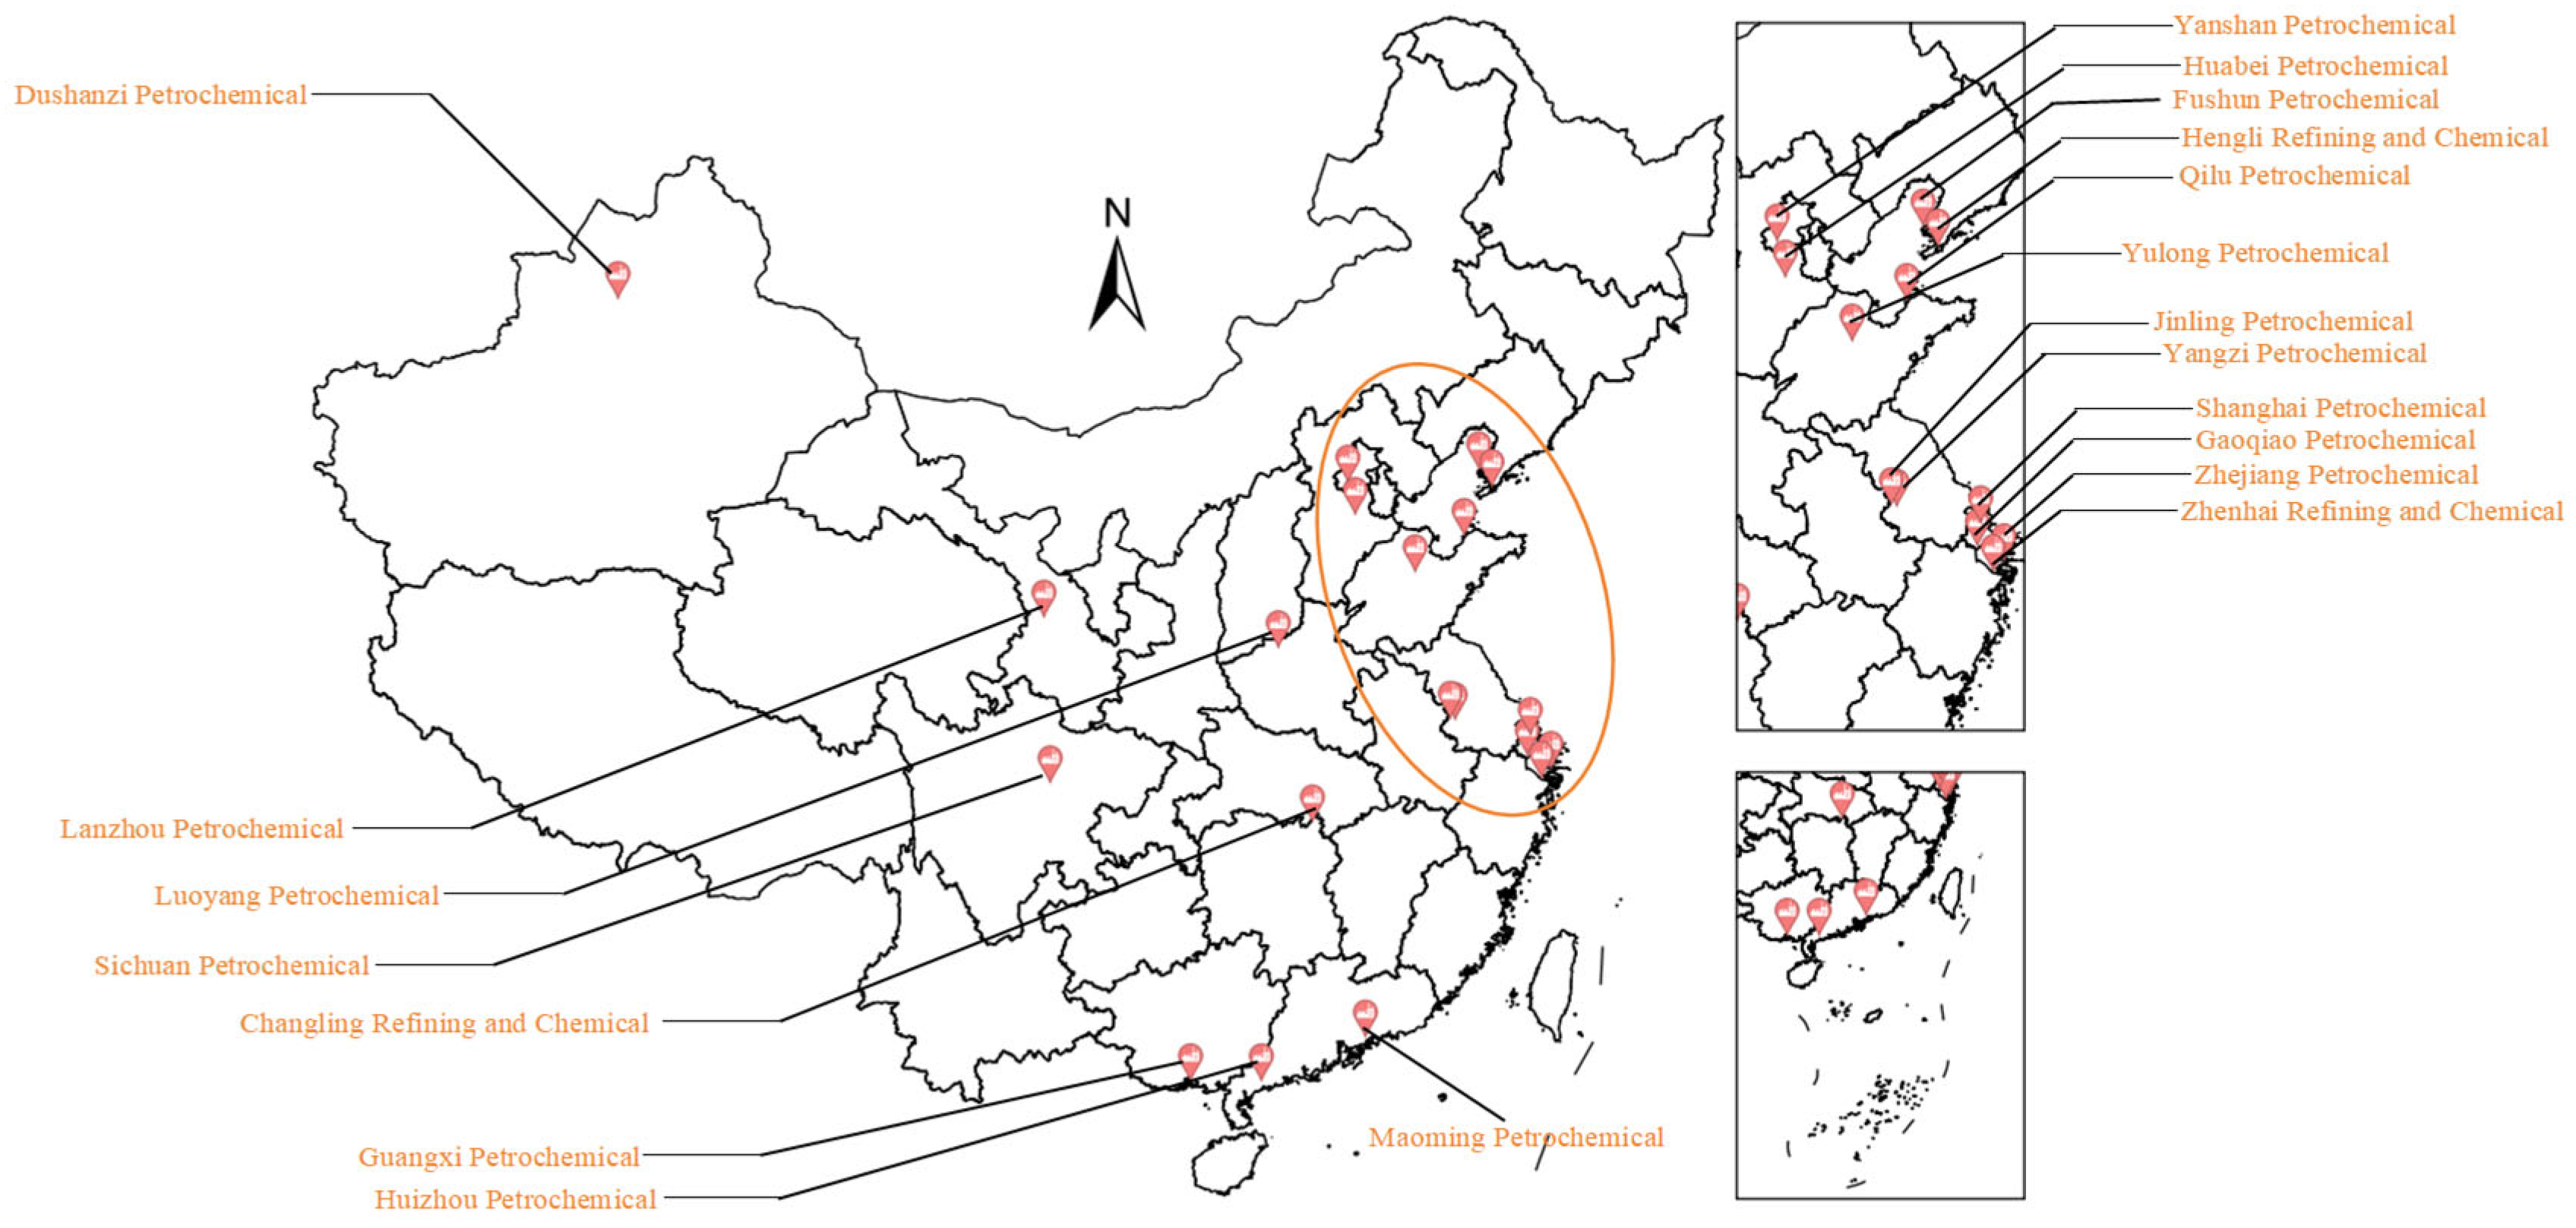
As shown in Figure 11, these 20 refineries represent China’s core facilities capable of large-scale SAF production, and they play a key role in the country’s major refining clusters, relying on refining facilities that have a large-scale unit base, a complete logistics network and process adaptability. These refineries cover the core nodes of China’s “east–central–west” refining pattern, including high-efficiency conversion bases on the east coast, regional hubs in Central China, and strategic nodes in resource-rich areas in the west. On the east coast, Zhejiang Petrochemical and Zhenhai Refining, as the world’s largest private refining bases, have advanced SAF production lines; in the central region, Luoyang Petrochemical and other refineries support the fuel demand of the Central Plains urban agglomeration; and in the west, Dushanzi Petrochemical and Lanzhou Petrochemical utilize local resources to realize energy conversion. In the west, Dushanzi Petrochemical and Lanzhou Petrochemical are utilizing local resources for energy conversion. Among them, SAF produced by Yanshan Petrochemical, Sichuan Petrochemical, Luoyang Petrochemical and Zhenhai Refining through the HEFA technology line is coordinated through the SINOPEC Unified Distribution System and has already been supplied to the airports in Beijing Daxing, Chengdu Shuangliu, Zhengzhou Xinzheng, and Ningbo Lishe.
Figure 11.
Map of SAF refineries.
4. Results and Discussion
4.1. Generated Pathway Carbon Intensity Distribution
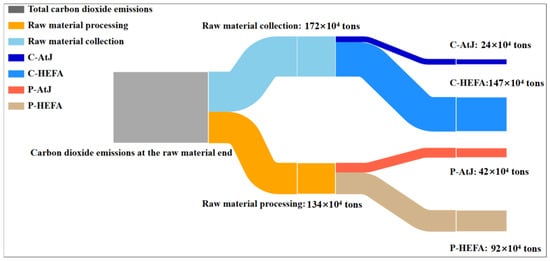
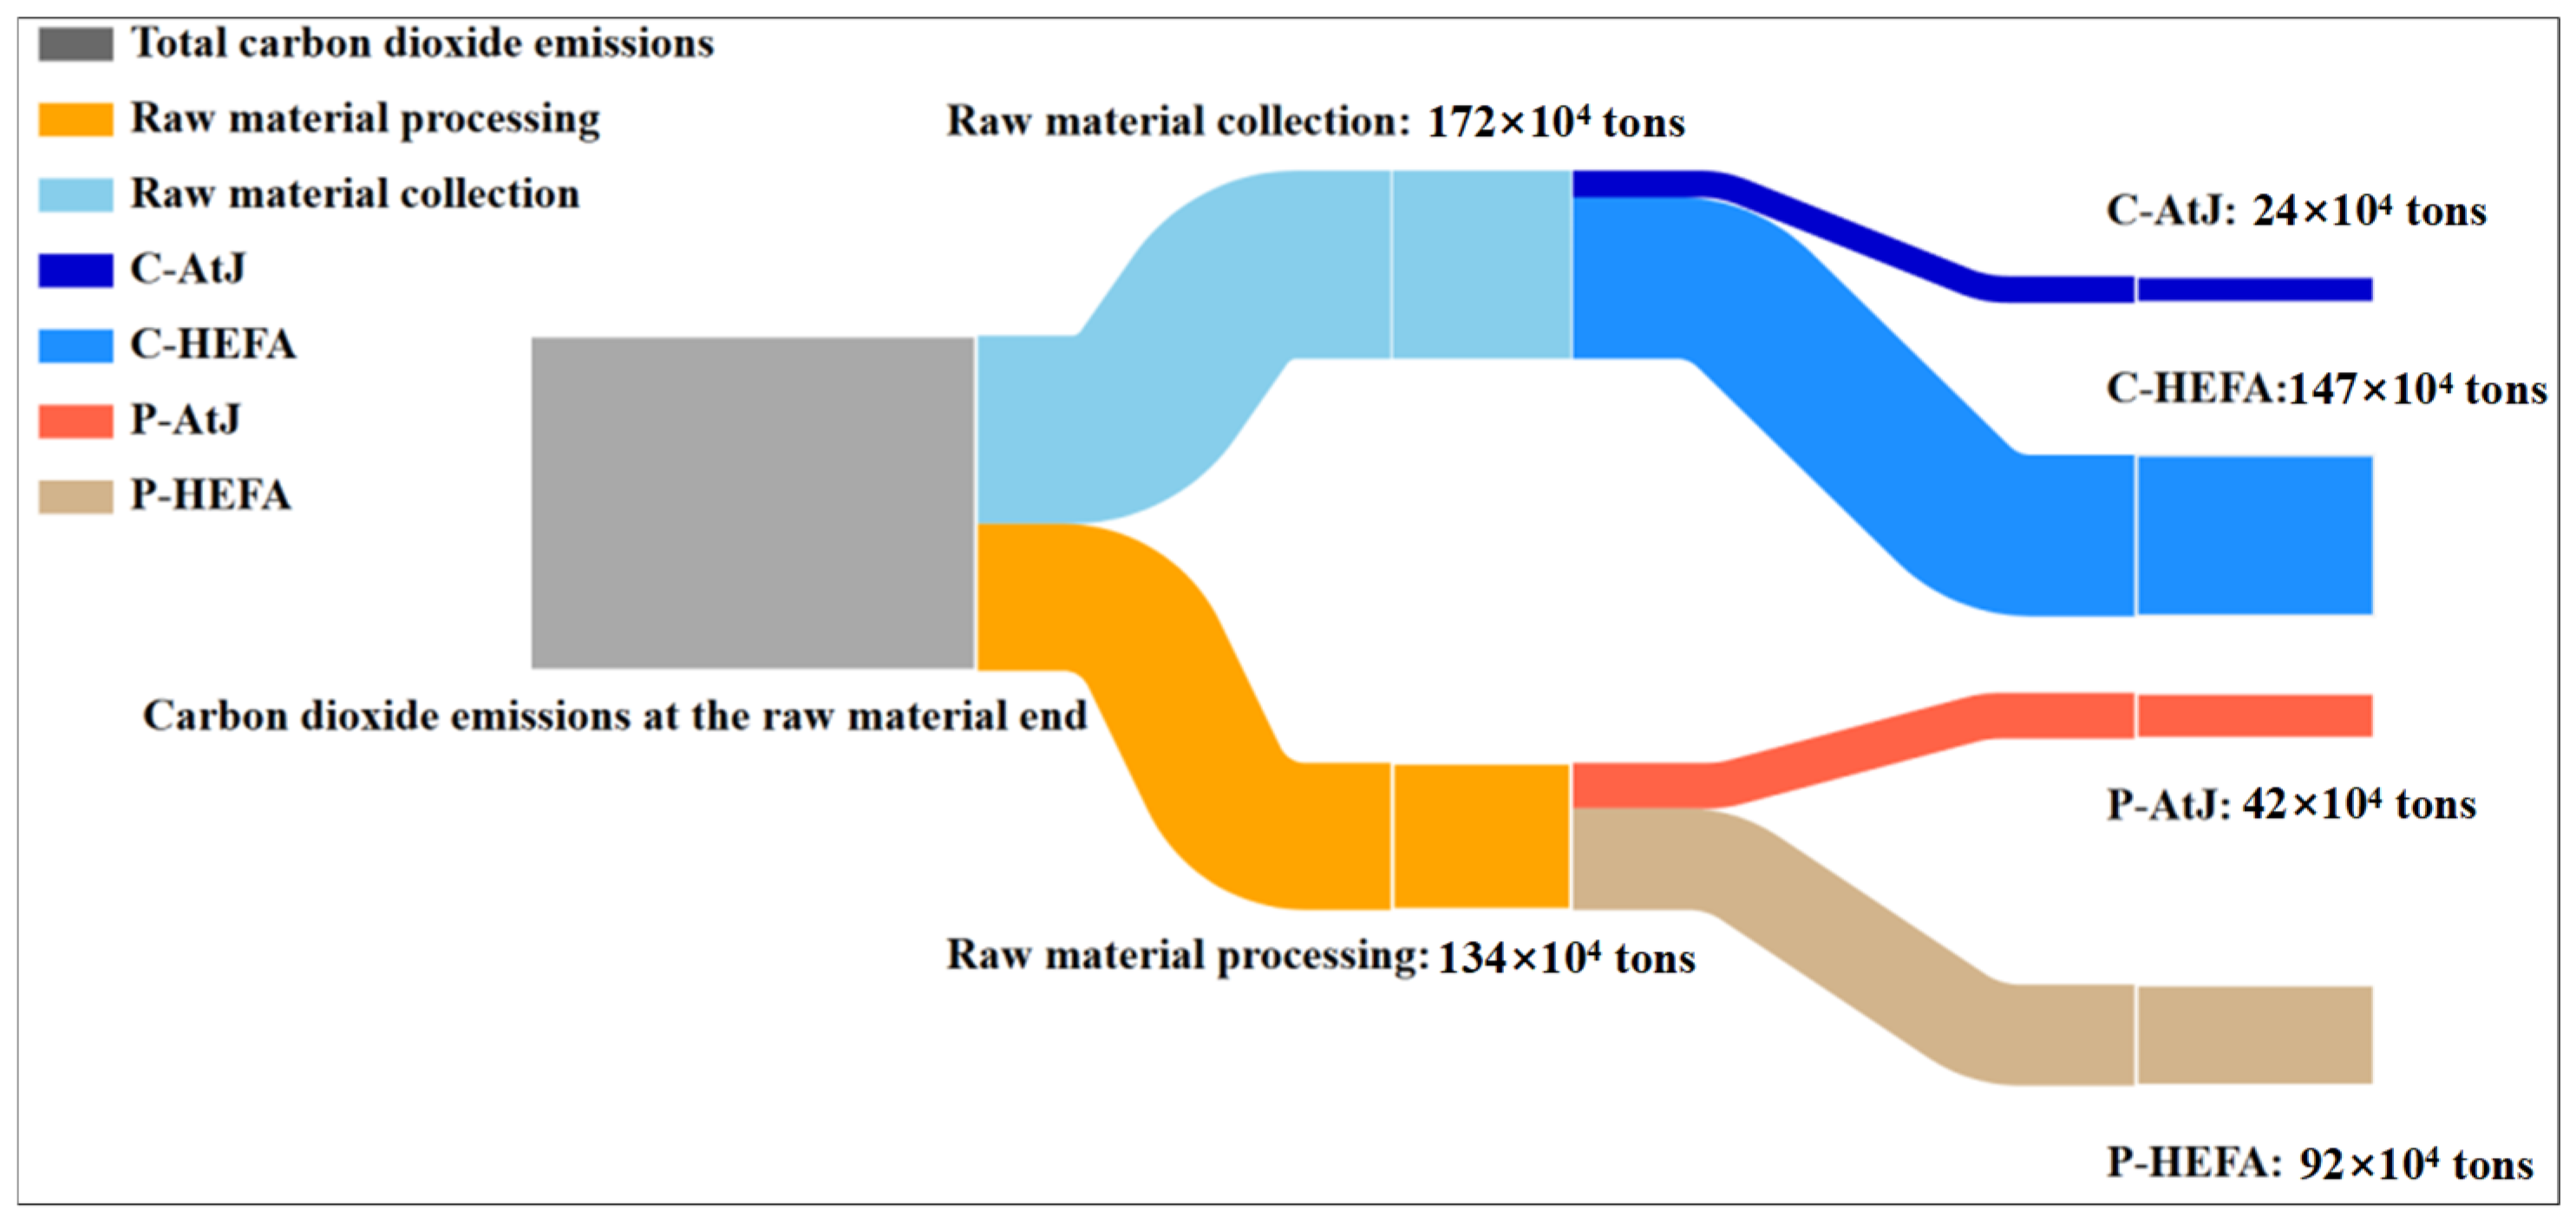
Through the life-cycle carbon footprint accounting of the SAF supply chain scheme ultimately determined after screening by the spatial layout optimization algorithm, this study provides an in-depth revelation of the emission distribution patterns between upstream resource acquisition and downstream logistics distribution. Figure 12 details the quantification of carbon emission flows at the Raw Material End for the final optimal pathway. Data show that total emissions from the collection stage reach 172 × 104 tons of CO2-equivalent, significantly higher than the 134 × 104 tons from the processing stage, indicating that under the current determined industrial layout, front-end logistics and pre-treatment processes remain the key determinants of upstream carbon intensity. In terms of specific technological pathways, the selected centralized HEFA pathway exhibits significant emission concentration during the collection stage, with its emissions at 147 × 104 accounting for 85.5% of the total collection amount; during the processing stage, the HEFA process similarly dominates with an emission scale of 92 × 104 tons, representing 68.7% of the processing end. This confirms the carbon footprint characteristics of large-scale lipid-based SAF supply pathways during spatial intensification. In contrast, the determined AtJ pathway presents a distinctly different emission structure: its feedstock collection emissions of 24 × 104 tons are far lower than the processing emissions of 42 × 104 tons, indicating that for this pathway, the optimization focus should shift from the logistics side toward improving energy efficiency at the core conversion stage.
Figure 12.
Sankey diagram of carbon emissions from SAF feedstock collection and processing stages.
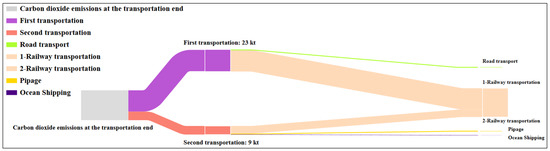
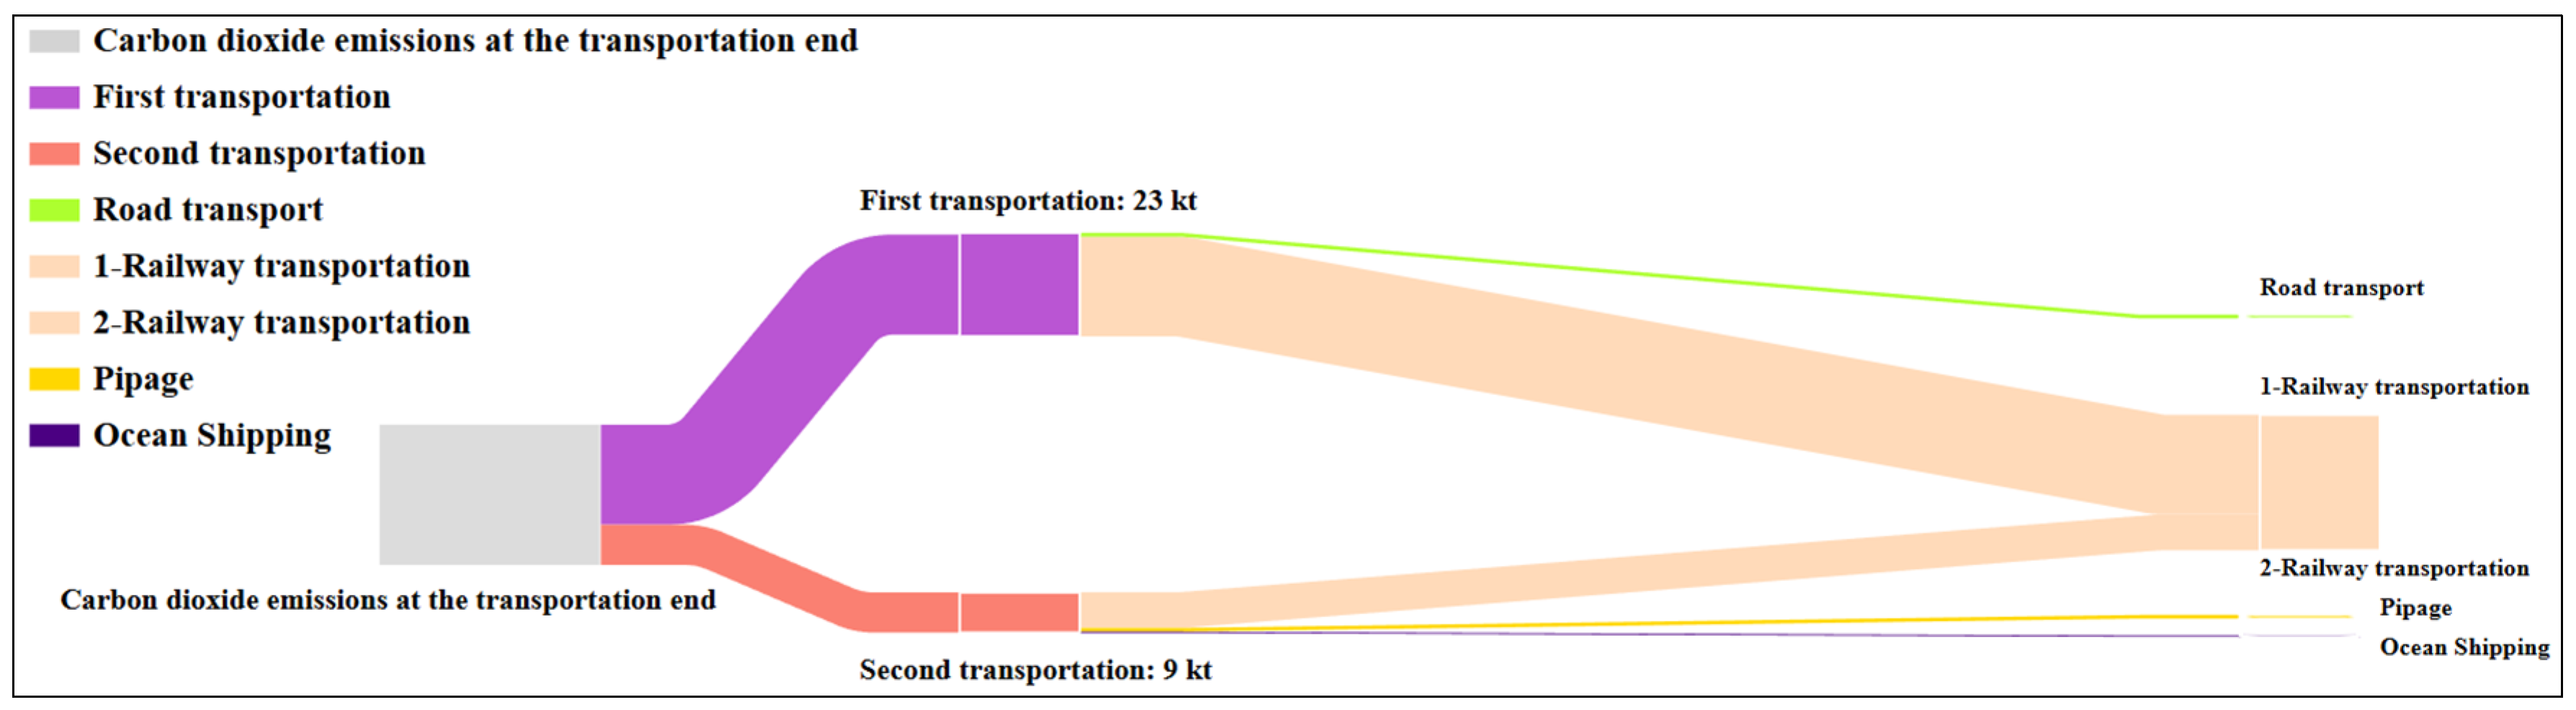
At the logistics and distribution level, Figure 13 further reveals the hierarchical distribution of transport-end carbon footprints in the final scheme through the decomposition of primary transport (feedstock to refinery) and secondary transport (finished product to airport). This study finds that emissions generated during the primary transport stage (23 kt) are approximately 2.56 times those of secondary transport (9 kt). This pronounced asymmetry profoundly reflects the inherent physical constraints of the SAF supply chain: due to high mass loss during thermochemical conversion processes, the upstream feedstock allocation load far exceeds the downstream finished product distribution load. In terms of transport mode selection, the determined optimal routes fully leverage the low unit emission advantage of rail transport, enabling it to dominate in both tiers of the distribution network. Notably, although road transport accounts for an extremely low proportion of total transport volume, its high emission intensity still constitutes a significant “secondary peak” emission source in secondary transport, serving as the core driver of carbon emission fluctuations in the last-mile delivery segment. Furthermore, despite the superior carbon efficiency of pipeline transport, it is limited by the coverage depth of existing infrastructure and thus serves only as a low-carbon supplement for specific hub nodes in the currently determined network.
Figure 13.
Sankey diagram of carbon emissions from SAF transportation stages.
The above quantitative analysis demonstrates that the emission formation mechanism of China’s SAF supply chain exhibits a pronounced, strong “process–logistics” coupling characteristic. This finding provides direct empirical data support for the subsequent formulation of a “mass near-field” layout strategy—namely, prioritizing the siting of refineries in feedstock-enriched areas to compress primary transport mileage and maximizing the foundational role of railway trunk lines in long-distance inter-provincial allocation.
4.2. Spatial Distribution and Geovisualization Analysis of Generated Pathway Structures
In the construction of the SAF industrial system, the spatial organization pattern of pathway structures exerts a decisive influence on full life-cycle carbon intensity. To identify typical pathway patterns and analyze their emission characteristics, this study conducted geovisualization processing and structural classification of pathways generated by the optimization algorithm. By examining the configurational relationships among three categories of spatial nodes—feedstock source locations, refinery siting, and airport positions—four representative pathway patterns were identified: intra-provincial closed-loop pathways, provincial co-supply structures, inter-provincial feedstock allocation pathways, and off-site refining with terminal coordination pathways.
4.2.1. Intra-Provincial Closed-Loop and Co-Supply Pathways
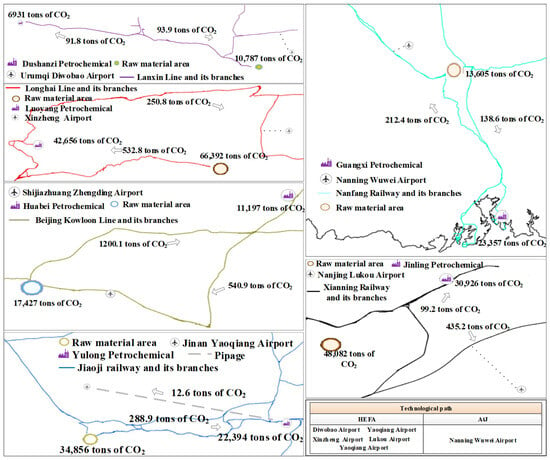
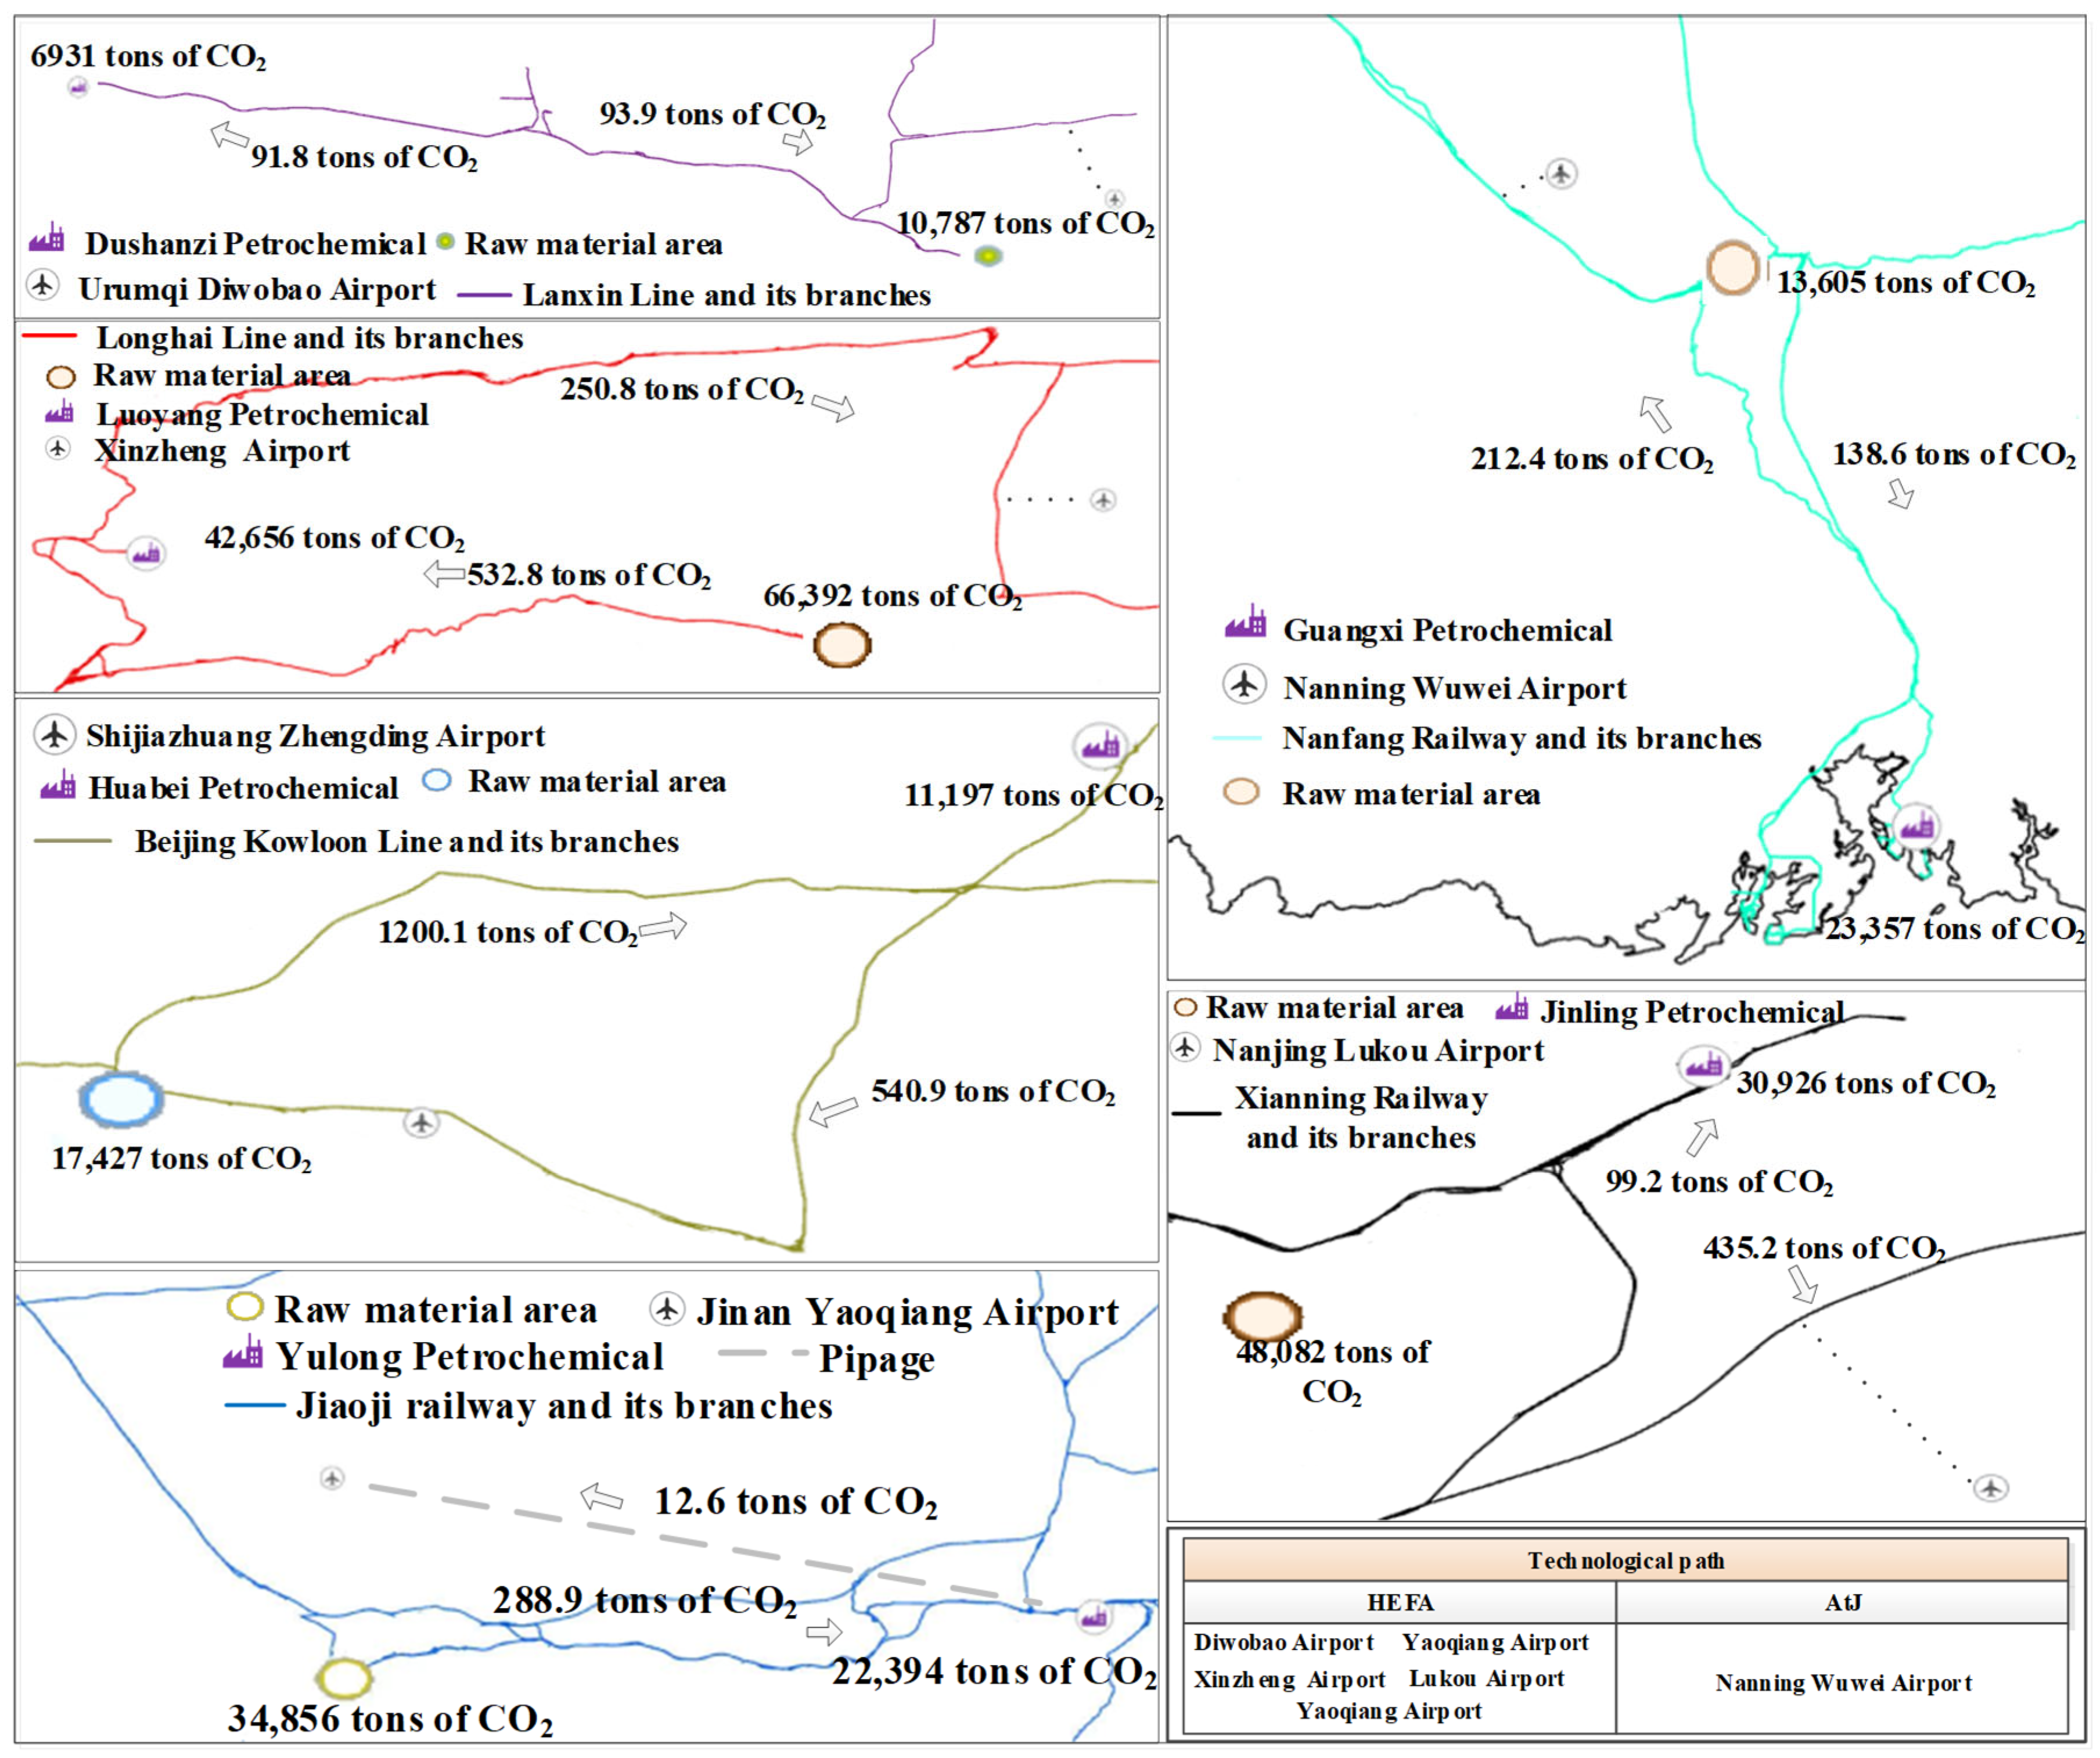
At the local scale of supply networks, this study identified two localized organizational patterns with significant emission reduction potential: the single-airport intra-provincial closed-loop model and the dual-airport co-supply structure. The single-airport intra-provincial closed-loop configuration pathway embodies a highly localized coupling between resource production and terminal consumption ends, maximizing the matching efficiency of spatial node potentials through the trinity integration of “feedstock–refinery–airport.” As illustrated in Figure 14, this pattern is particularly prominent in provinces including Xinjiang, Henan, Guangxi, Shandong, Hebei, and Jiangsu. Taking the Xinjiang pathway as an example, Dushanzi Petrochemical serves as the core processing node, directly connecting surrounding biomass feedstock agglomeration areas with Diwopu Airport, while in the Henan pathway, Luoyang Petrochemical effectively links local feedstock sources with Xinzheng Airport, forming an extremely short supply chain axis. Such pathways suppress transport segment emissions to near-minimum levels by minimizing spatial displacement. Quantitative analysis shows that, taking the Henan pathway as an example, emissions generated from feedstock delivery to the refinery amount to 66,392 tons of CO2, whereas the finished product distribution segment supported by efficient logistics facilities (relying on the Longhai Railway and its branch lines) produces only 532.8 tons of CO2. This highly intensive configuration pattern brings life-cycle carbon intensity close to theoretical minimization, representing the preferred solution for achieving low-carbon transition in provinces endowed with abundant resource endowments and well-established refining industrial foundations.
Figure 14.
Single-airport intra-provincial closed-loop configuration pathway.
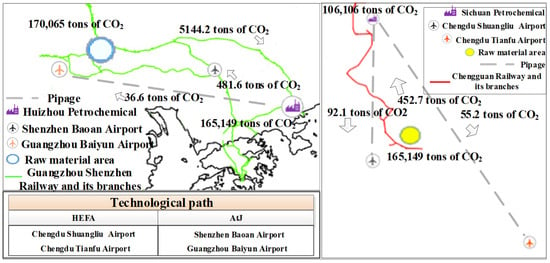
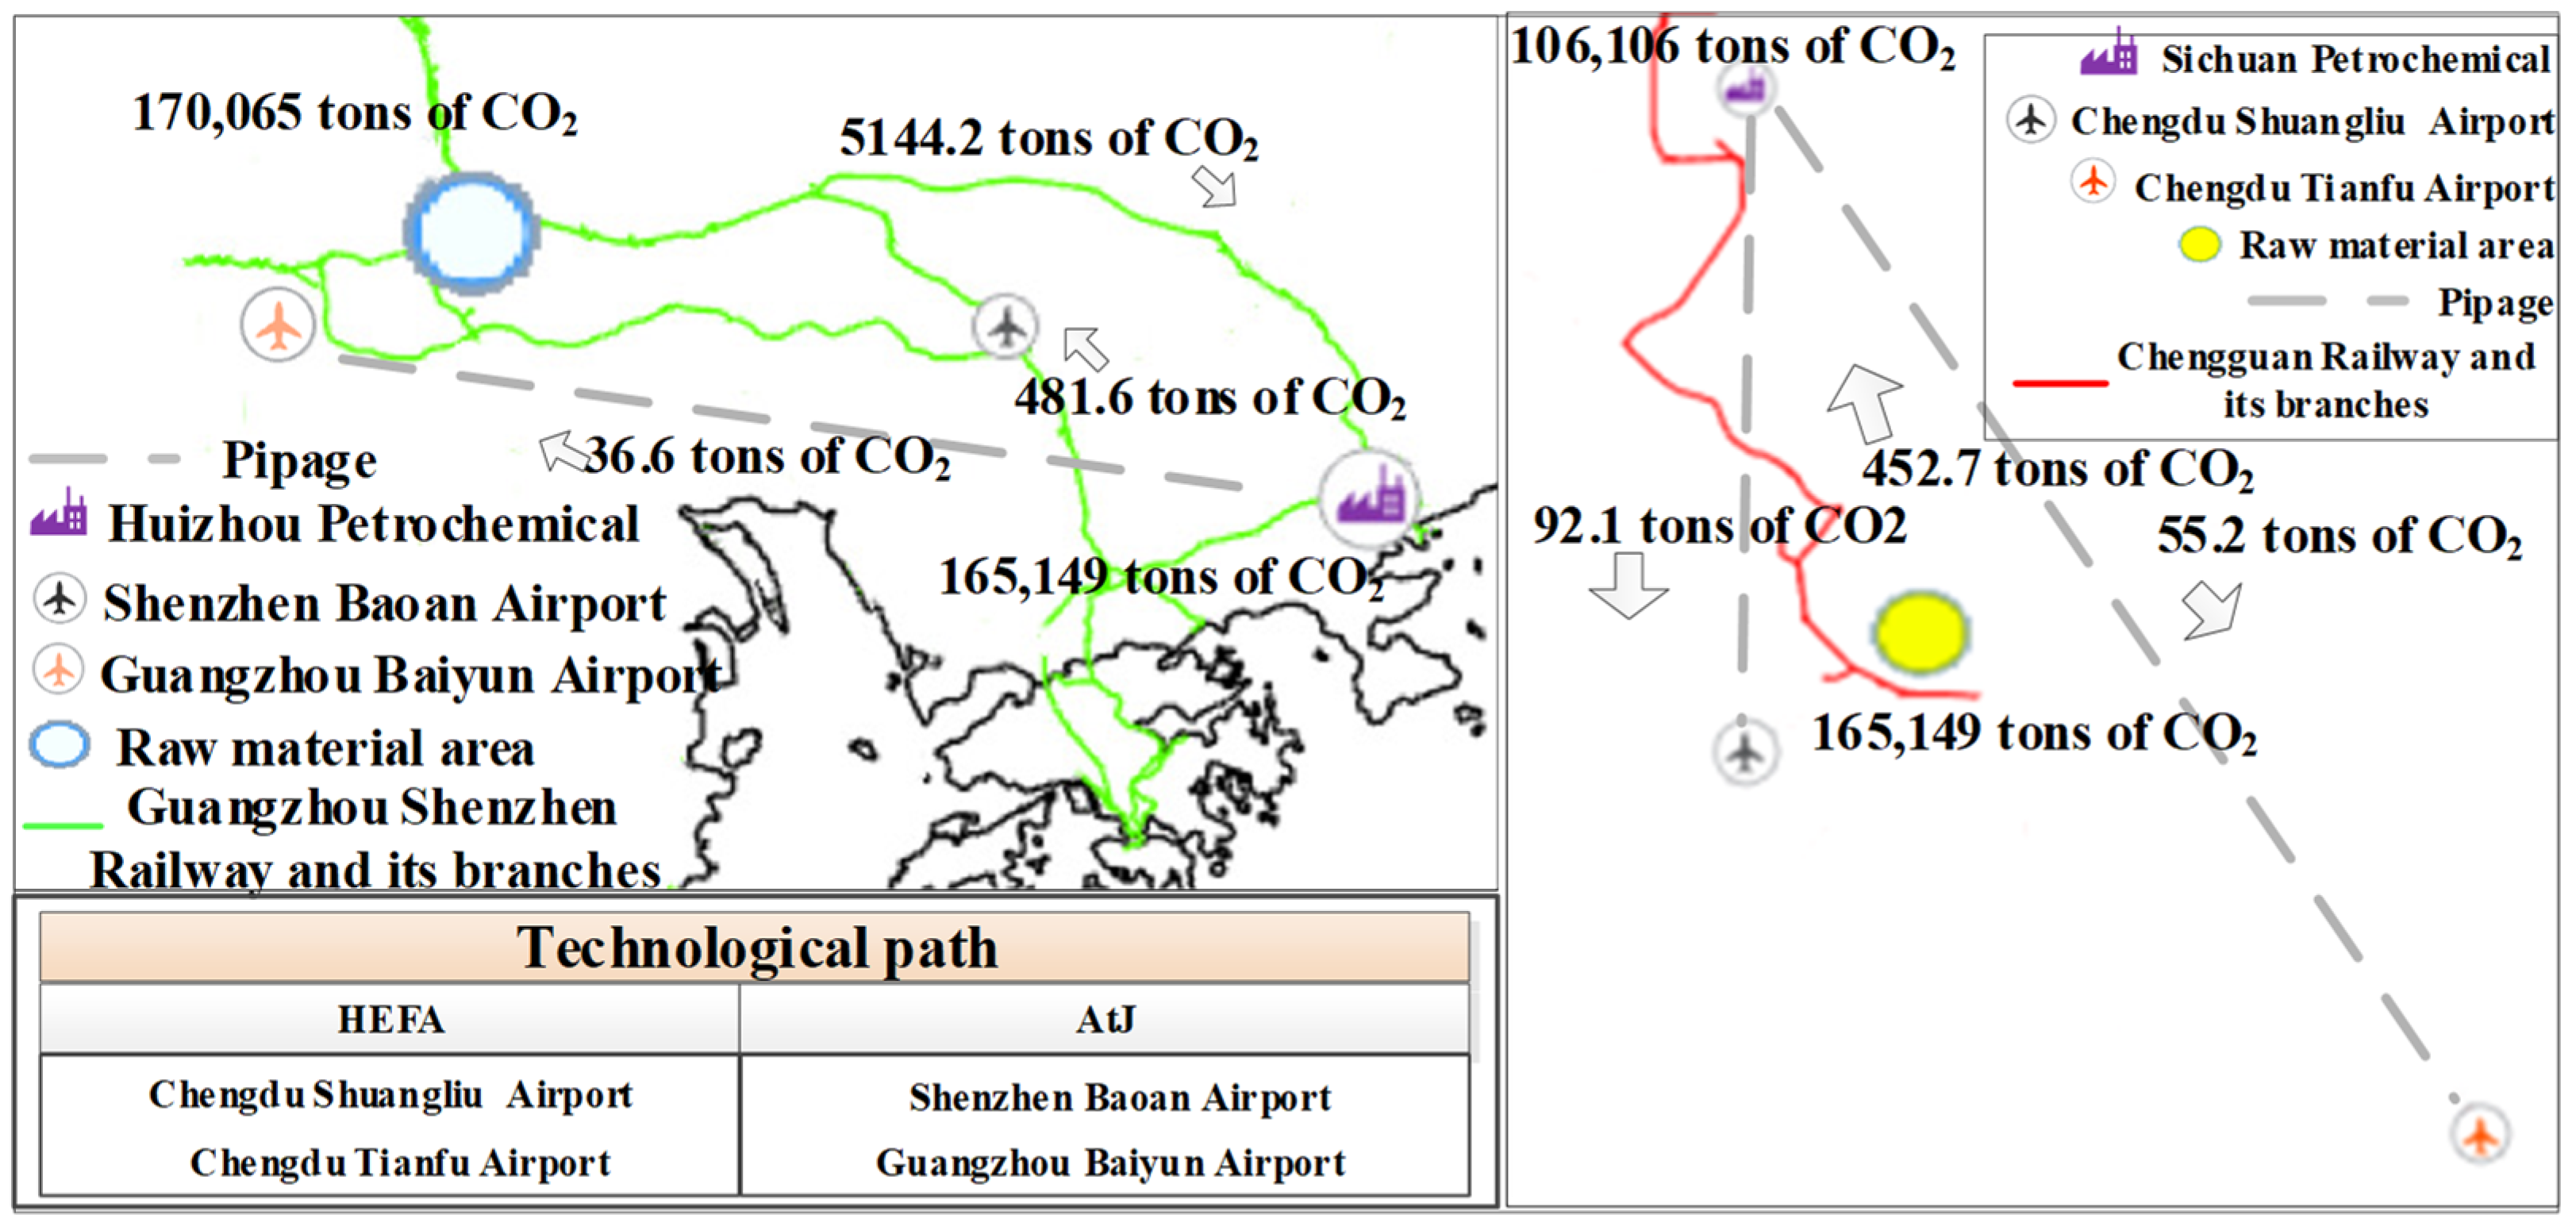
In contrast, the dual-airport intra-provincial co-supply pathway reveals a distributed supply network logic based on hub nodes, embodying the deep trade-off between intensive infrastructure utilization and logistics carbon costs. As illustrated in Figure 15, this pattern centers on a single large-scale refining node as the axis, simultaneously serving multiple core hub airports within the province through mature regional transport networks. Typical case analysis demonstrates that in the Guangdong region, Huizhou Petrochemical serves as a strategic supply point, utilizing pipeline and Guangzhou–Shenzhen Railway networks to simultaneously safeguard SAF supply demands for both Shenzhen Bao’an Airport and Guangzhou Baiyun Airport, while in the Sichuan region, Sichuan Petrochemical relies on the Chengdu–Dujiangyan Railway and its branch lines to coordinately support energy allocation for both Chengdu Shuangliu Airport and Tianfu Airport. Although the secondary distribution mileage and carbon intensity of such structures are slightly higher than those of the single-airport closed-loop model (e.g., in the Sichuan pathway, the distribution segments produce 452.7 tons and 55.2 tons of CO2 respectively), they achieve significant economies of scale through enhanced refinery capacity utilization and system dispatch flexibility. In provinces equipped with dual-hub airport configurations and highly developed railway and pipeline infrastructure, this regionally networked integrated supply pattern demonstrates stronger industrial carrying capacity and system robustness.
Figure 15.
Dual-airport co-construction provincial pathway network.
In summary, intra-provincial closed-loop and co-supply structures construct dual advantages of carbon emission reduction benefits and operational flexibility in localized deployment and should serve as prioritized strategic pathways for future SAF industrial pilot promotion in China. In actual decision-making processes, the selection of optimal layouts requires a comprehensive consideration of regional industrial cluster foundations, multimodal transport accessibility, and consumption scales of terminal airports, seeking dynamic equilibrium between the pursuit of “minimal physical pathways” and “network scale benefits.”
4.2.2. Inter-Regional Transfer Supply Pathways
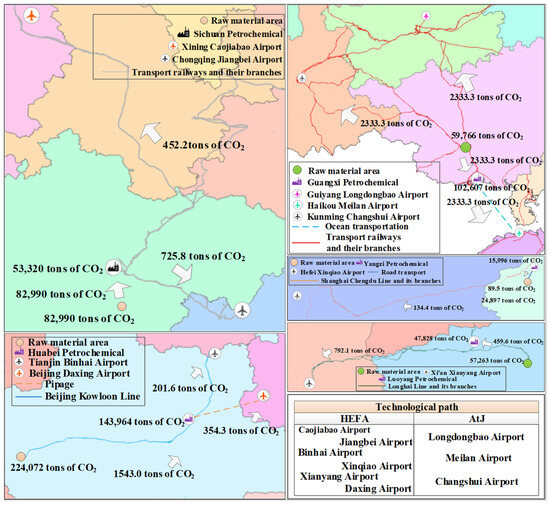
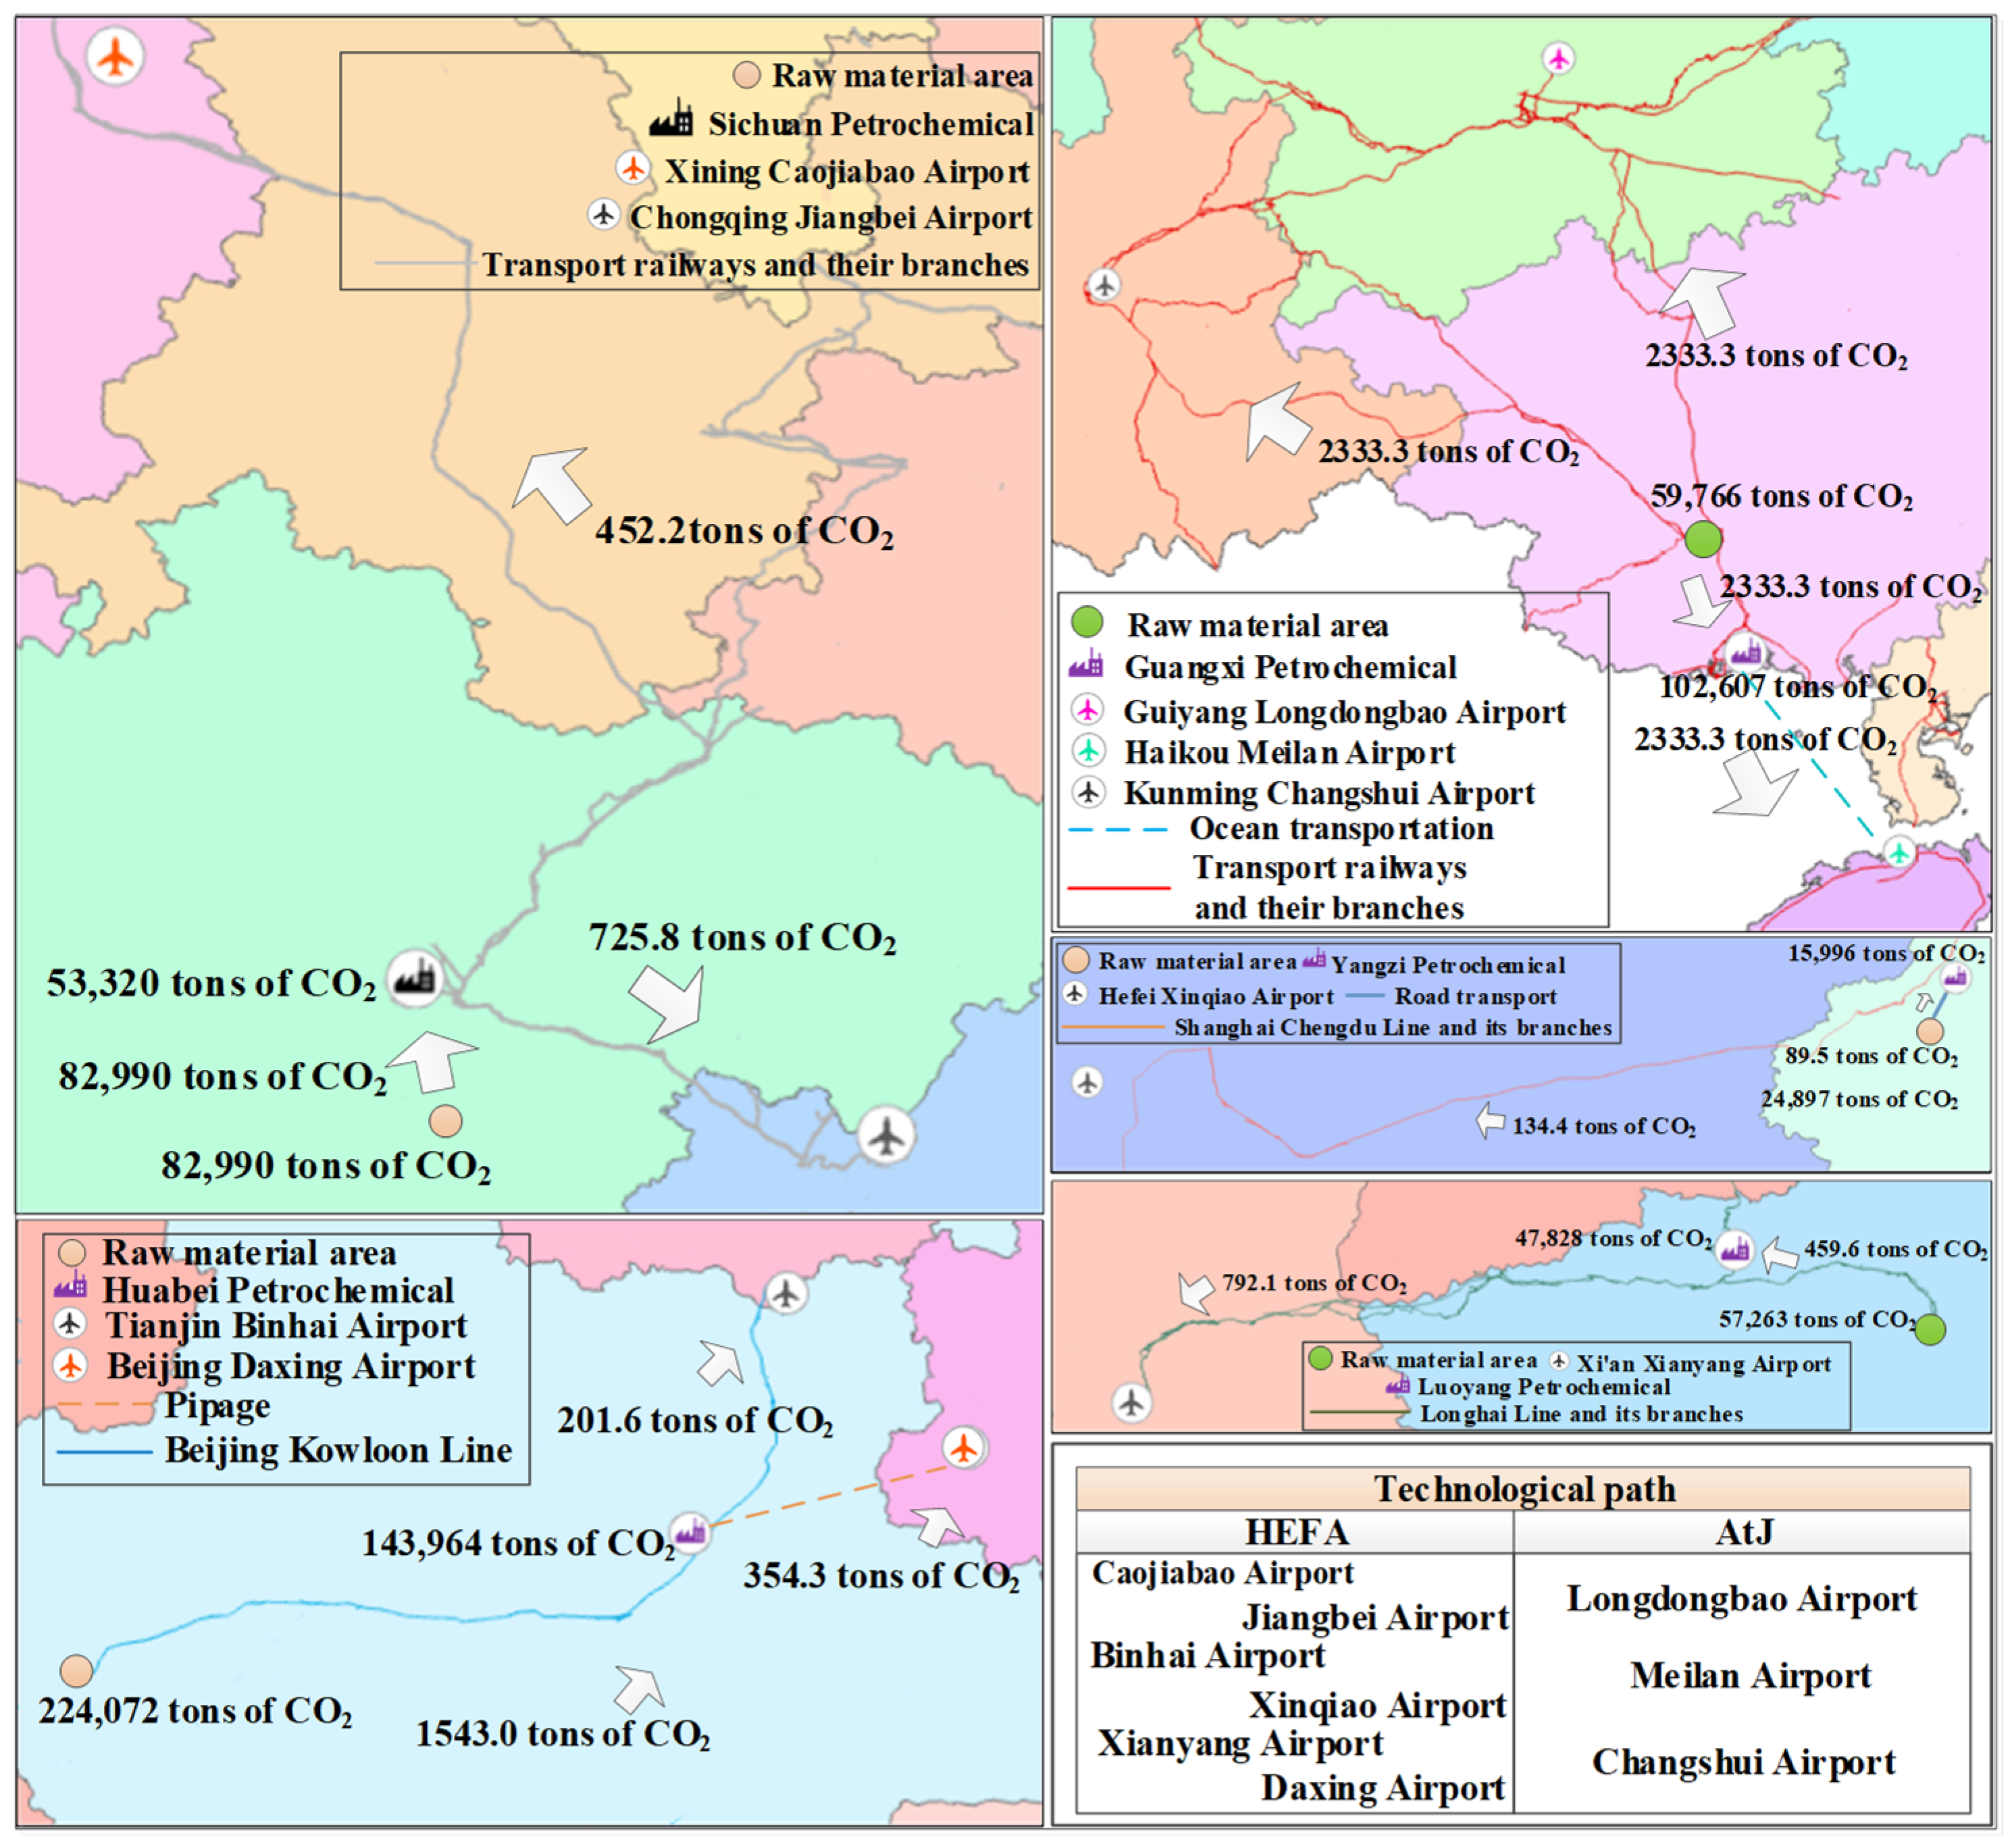
At the national scale of SAF spatial evolution patterns, the optimization algorithm identified a high-frequency distribution pathway pattern in which “supply-side cores” radiate toward inter-provincial consumption terminals. This structure typically manifests as highly intensive resource endowments and refining infrastructure in specific provinces, while generated SAF finished products are transferred across administrative boundaries to hub airports in neighboring provinces, forming a typical “supply–demand spatial separation” network. As shown in Figure 16, provinces such as Sichuan, Hebei, Guangxi, Jiangsu, and Henan, leveraging their profound petrochemical industrial foundations, serve as core hubs for inter-regional supply. Spatial topology analysis indicates that, for example, after completing internal resource integration (with feedstock segment carbon emissions reaching 224,072 tons of CO2), Huabei Petrochemical simultaneously safeguards directional supply for both Tianjin Binhai Airport (201.6 tons of CO2) and Beijing Daxing Airport (354.3 tons of CO2) through the Beijing–Kowloon Railway line and pipeline facilities. Similarly, Guangxi Petrochemical, serving as the energy hub of the southern region, not only satisfies local demand but also radiates to Guiyang Longdongbao, Haikou Meilan, and Kunming Changshui airports through multimodal transport, demonstrating pronounced “one-point-to-multipoint” unidirectional supply characteristics.
Figure 16.
Inter-regional transfer supply pathway.
Quantitative accounting reveals that the life-cycle carbon emissions of this pathway type are highly concentrated in the inter-provincial transport stage of finished SAF products, with the proportion generally exceeding 40%. Particularly when inter-provincial transport distances exceed 150 km, the selection of transport modalities exerts a significant impact on unit carbon intensity. Furthermore, certain pathways involve the dual superposition of “upstream long-distance feedstock allocation + downstream inter-provincial finished product transfer,” further elevating the total emission level of the system. Therefore, although inter-regional transfer enhances the capacity utilization rate of large-scale refineries, the optimization of its emission reduction benefits still depends on refined logistics pathway design under regional coordination mechanisms.
4.2.3. Off-Site Refining—Local Use Pathway
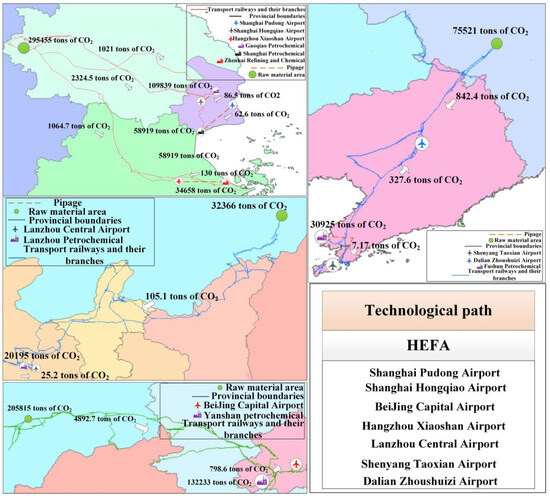
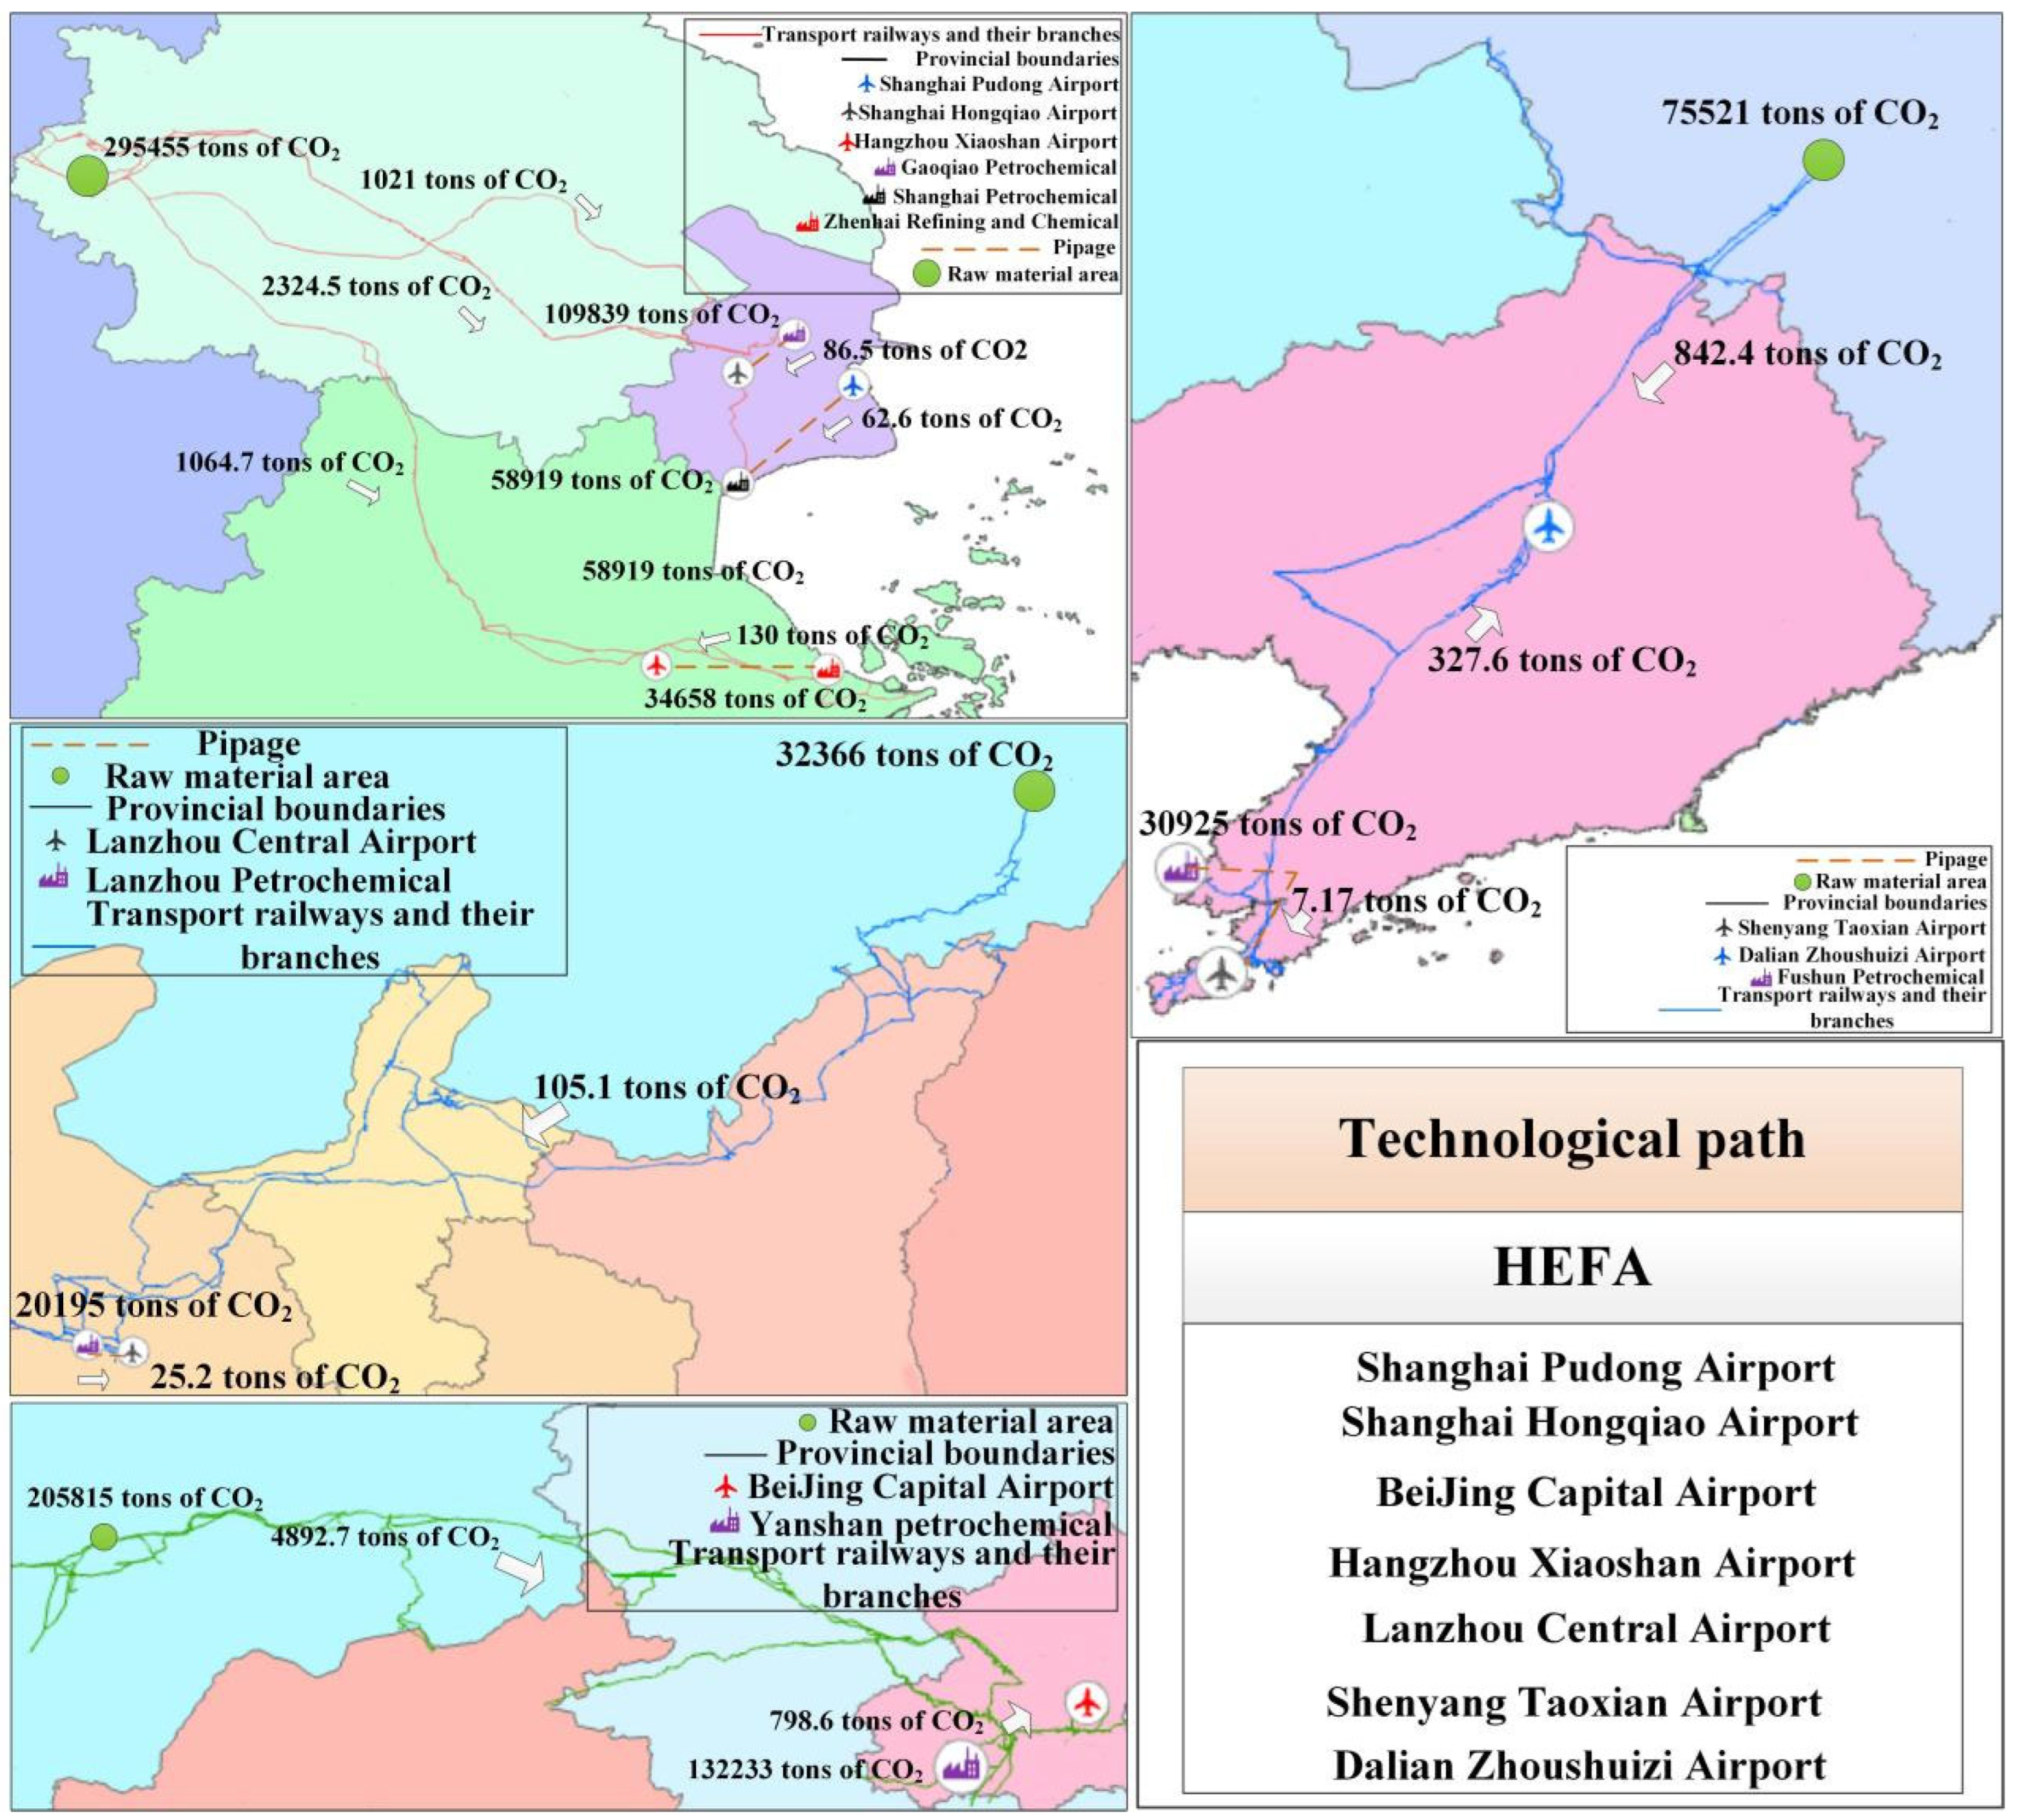
Another typical spatial organizational structure exhibits a “reverse resource integration” characteristic driven by terminal consumption demand. This pattern is commonly observed in metropolitan areas with strong aviation demand and mature refining capabilities but limited local biomass resources, forming a supply closed loop of “off-site resource import—local refining processing—on-site terminal consumption,” profoundly reflecting the resource integration mechanism under resource-scarce environments. As shown in Figure 17, regions such as Shanghai, Liaoning, Lanzhou, and Beijing demonstrate this highly intensive configuration pattern. Taking the Shanghai–Hangzhou region as an example, the Gaoqiao Petrochemical, Shanghai Petrochemical, and Zhenhai Refining cluster directly serves mega-hubs including Pudong, Hongqiao, and Hangzhou Xiaoshan airports; due to significant shortfalls in local feedstock supply, the system requires large-scale feedstock importation from surrounding resource-rich provinces (such as feedstock flows with 295,455 tons of CO2-equivalent emissions carried by railway trunk lines), followed by short-range distribution after process conversion at core refineries. From the perspective of carbon emission composition, the carbon intensity of such pathways is primarily controlled by the upstream inter-regional feedstock allocation stage, with carbon footprints from railway transport links far exceeding those of other pathway patterns. Taking the Lanzhou Petrochemical pathway as an example, although finished product delivery to Lanzhou Zhongchuan Airport produces extremely low emissions (only 105.1 tons of CO2), emissions generated from inter-regional feedstock collection (32,366 tons of CO2) constitute the primary carbon load of the system.
Figure 17.
Heterogeneous refinery collaboration pathways.
Although this structure represents a pragmatic choice under the background of uneven regional energy resource distribution, it also implies the urgency of exploring localized feedstock substitution mechanisms in core demand areas, with the aim of enhancing the overall carbon emission reduction potential of the supply chain by shortening upstream allocation radii.
4.2.4. Raw Material Callback Path
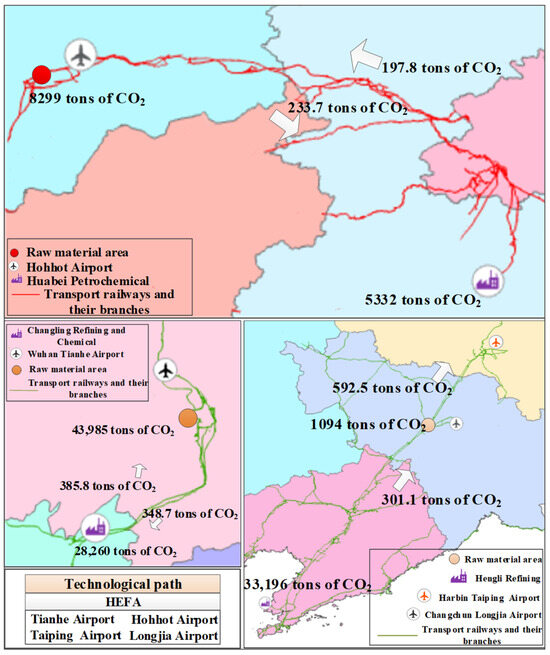
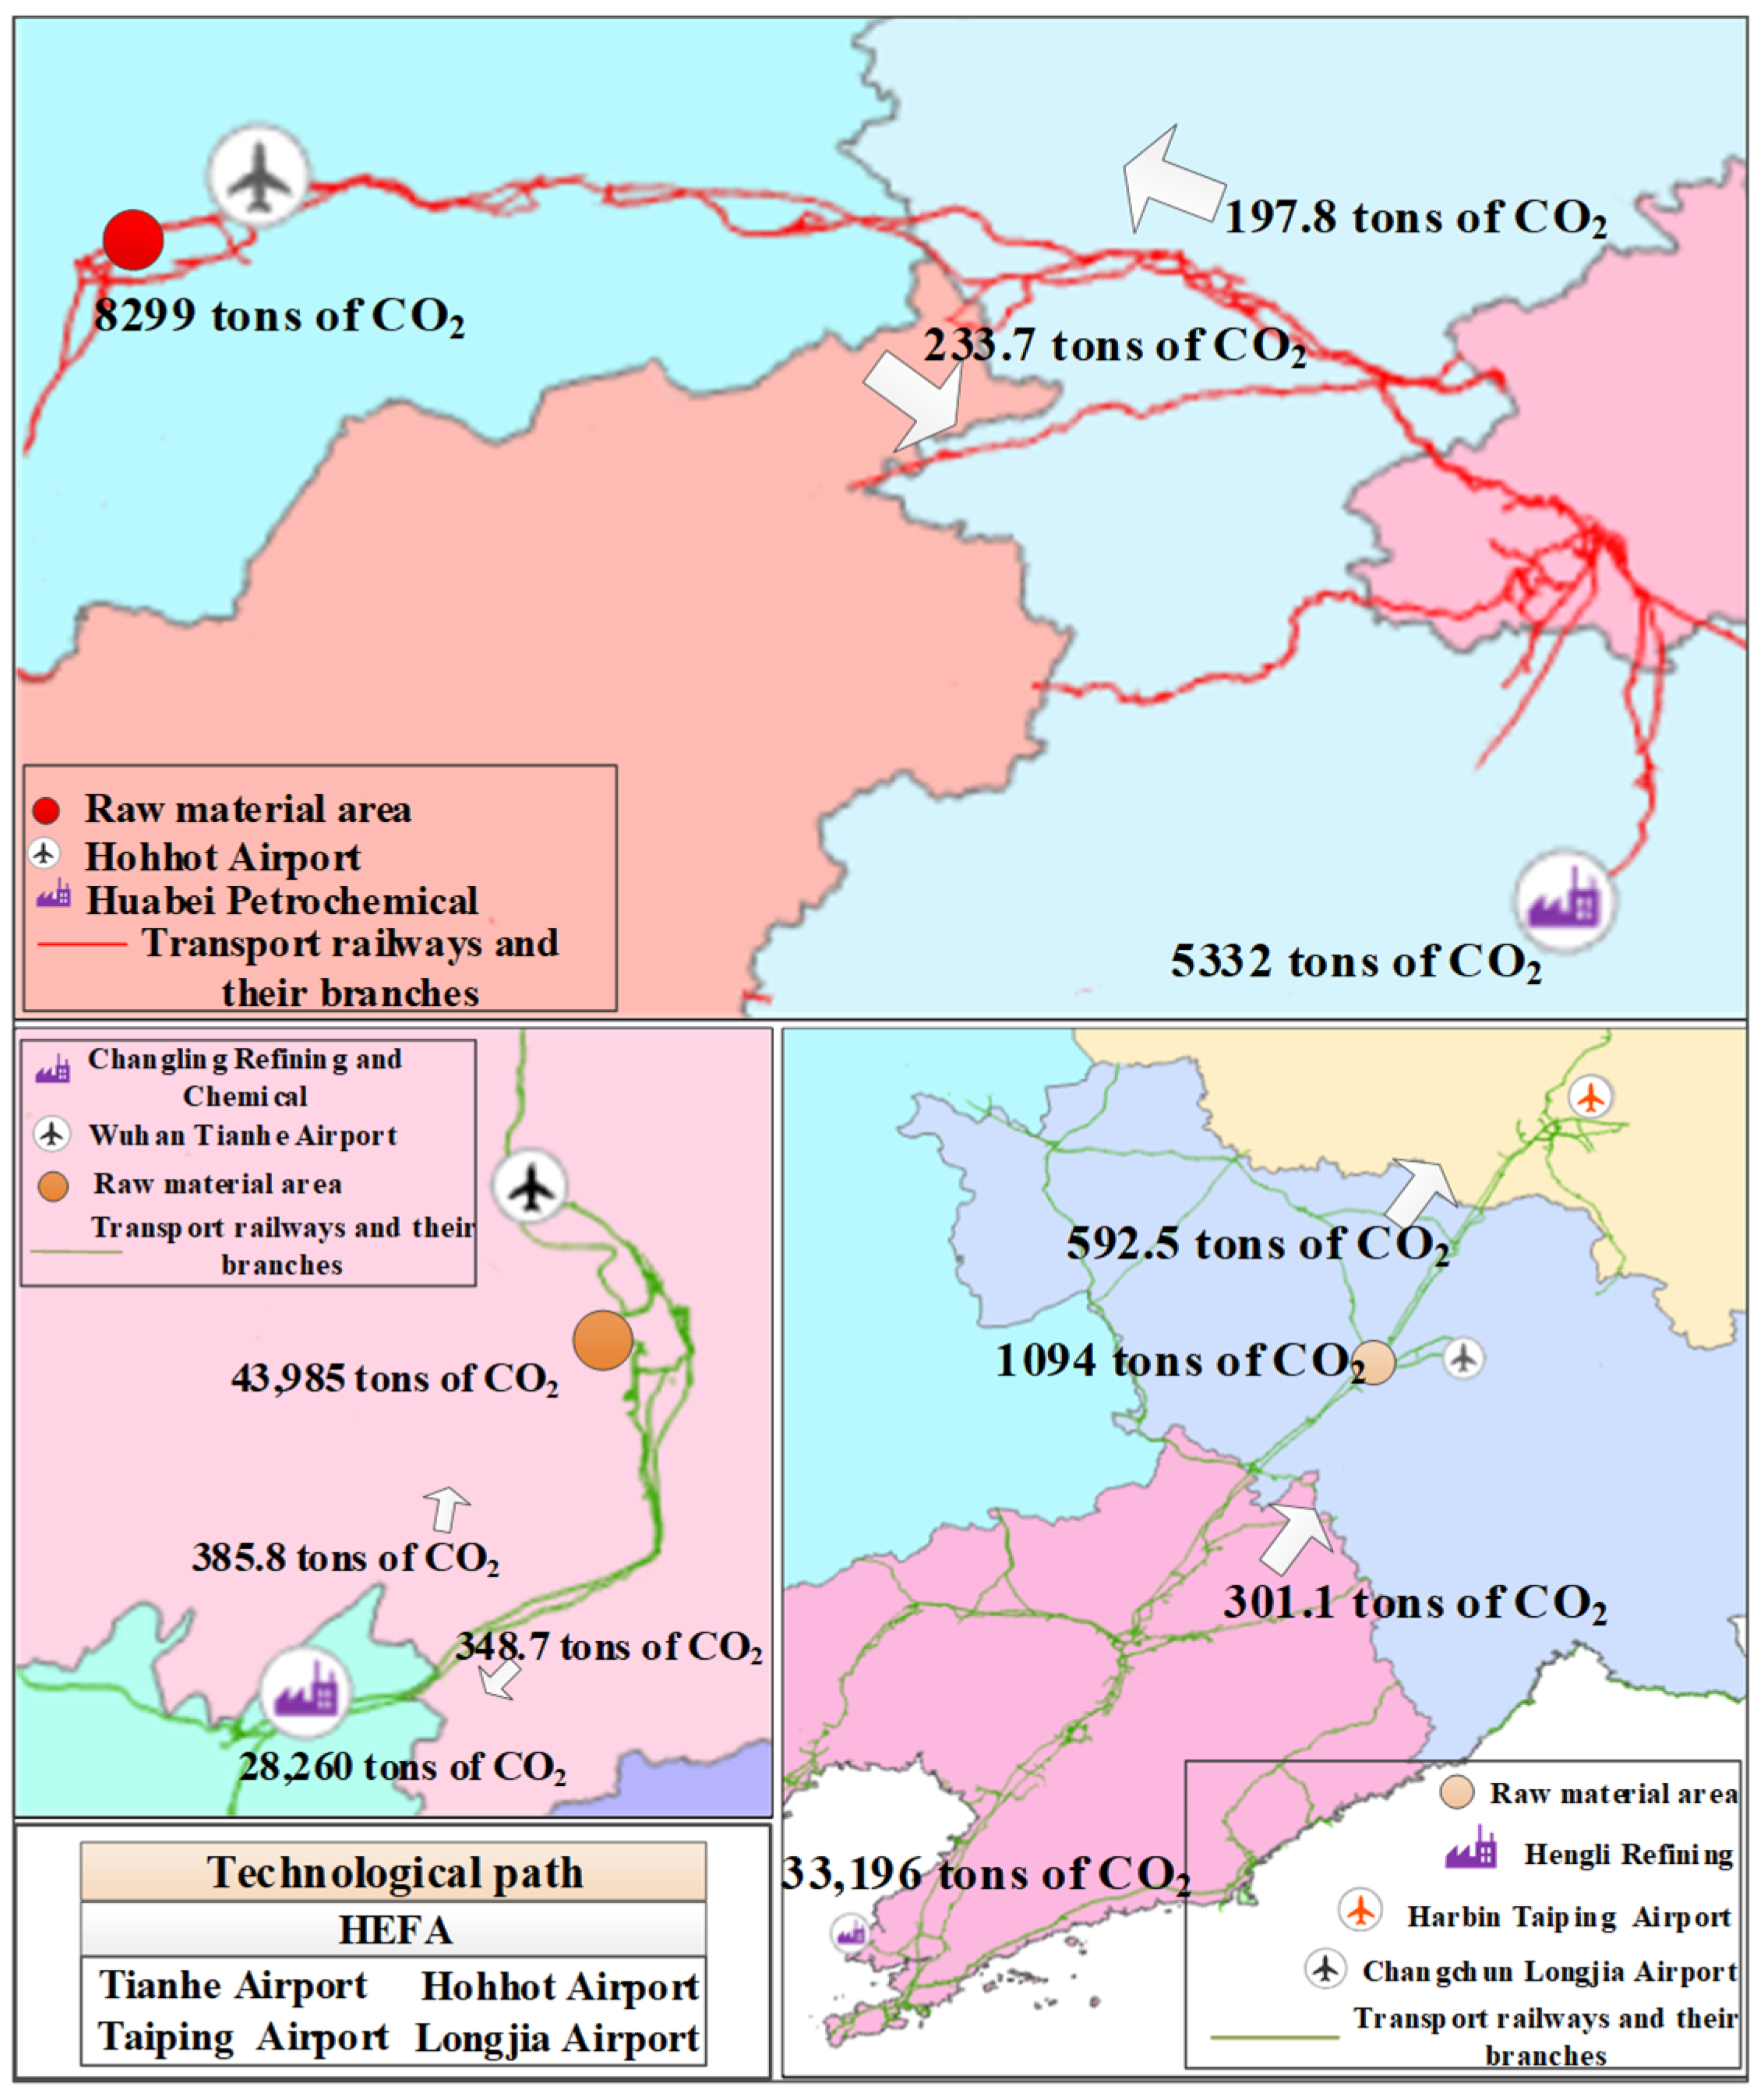
Among the generated pathway patterns, this study identified a special “Raw Material Callback” model. This pattern exhibits a counter-intuitive spatial topological structure: biomass feedstock agglomeration provinces do not achieve on-site refining but instead transport feedstock across provinces to off-site refineries for processing, then return the generated SAF finished products to the hub airports of the origin provinces. This reverse configuration pattern of “feedstock export, finished product reflux” profoundly reveals the significant imbalance between China’s current SAF refining capacity layout and feedstock spatial distribution, resulting in pathway overflow and structural logistics redundancy. As shown in Figure 18, this pattern is particularly typical in provinces such as Inner Mongolia, Hubei, Jilin, and Heilongjiang. Taking the Inner Mongolia pathway as an example, its feedstock production areas and Hohhot Baita Airport are both located within the region, yet the refining segment is undertaken by off-site Huabei Petrochemical, with finished product return delivery emissions reaching 197.8 tons of CO2. In contrast, the Hubei pathway demonstrates a relatively compact reflux structure, where Wuhan Tianhe Airport and feedstock sources rely on adjacent Changling Refining for turnover, with distribution segment emissions of 385.8 tons of CO2.
Figure 18.
Finished product reflux path.
Quantitative accounting indicates that the carbon emissions of the reflux model exhibit two core characteristics: first, the emission proportion of the feedstock transport stage is far higher than the national average; second, the overall pathway presents obvious asymmetry, reflecting the suppression of supply chain efficiency by geographic resource mismatch. Particularly in scenarios where feedstock transport heavily relies on long-distance railway modalities, carbon emission intensity increases significantly and steeply, constituting the primary technical bottleneck for emission reduction in this pathway type.
4.2.5. Comprehensive Assessment of National SAF Pathway Life-Cycle Carbon Intensity
Through a full-sample assessment of the 30 generated typical SAF supply pathways, the results show that their average life-cycle carbon intensity is 48.7 gCO2-eq/MJ, exhibiting significant regional differentiation characteristics in the spatial dimension. From the perspective of logistics-level emission levels, the national average transport segment emission is 25.6 kgCO2/t·km, which demonstrates obvious hierarchical distribution influenced by transport modalities. Long-distance trunk transport driven by railways and pipelines exhibits lower unit carbon intensity. This further validates the environmental friendliness of industrial clustering in bulk resource allocation, effectively suppressing the carbon premium of inter-regional transfer by enhancing the load factors and energy efficiency of logistics vehicles.
In stark contrast, some short-distance end-distribution pathways relying on road transport exhibit carbon emission intensity significantly higher than the national average. This data implies that under the current industrial layout, optimizing the transport system structure remains a key breakthrough point for compressing the remaining margin of life-cycle carbon emissions.
In summary, the future planning of SAF supply networks should be committed to reducing redundant mileage under the “resource reflux” model. By moderately advancing the layout of refining capacity in resource-rich areas and constructing spatially compact “feedstock–refinery–airport” networks, not only can the matching imbalance of spatial node potentials be alleviated from the source, but the carbon emission reduction performance of China’s entire SAF industrial chain can also be maximized.
4.3. Optimization of SAF Industry Cluster Layout Based on Generated Results
4.3.1. Analysis of Raw Material Agglomeration Patterns and Regional Supply Potential
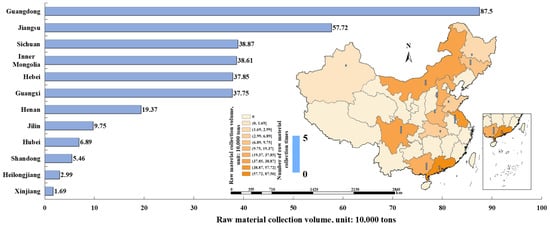
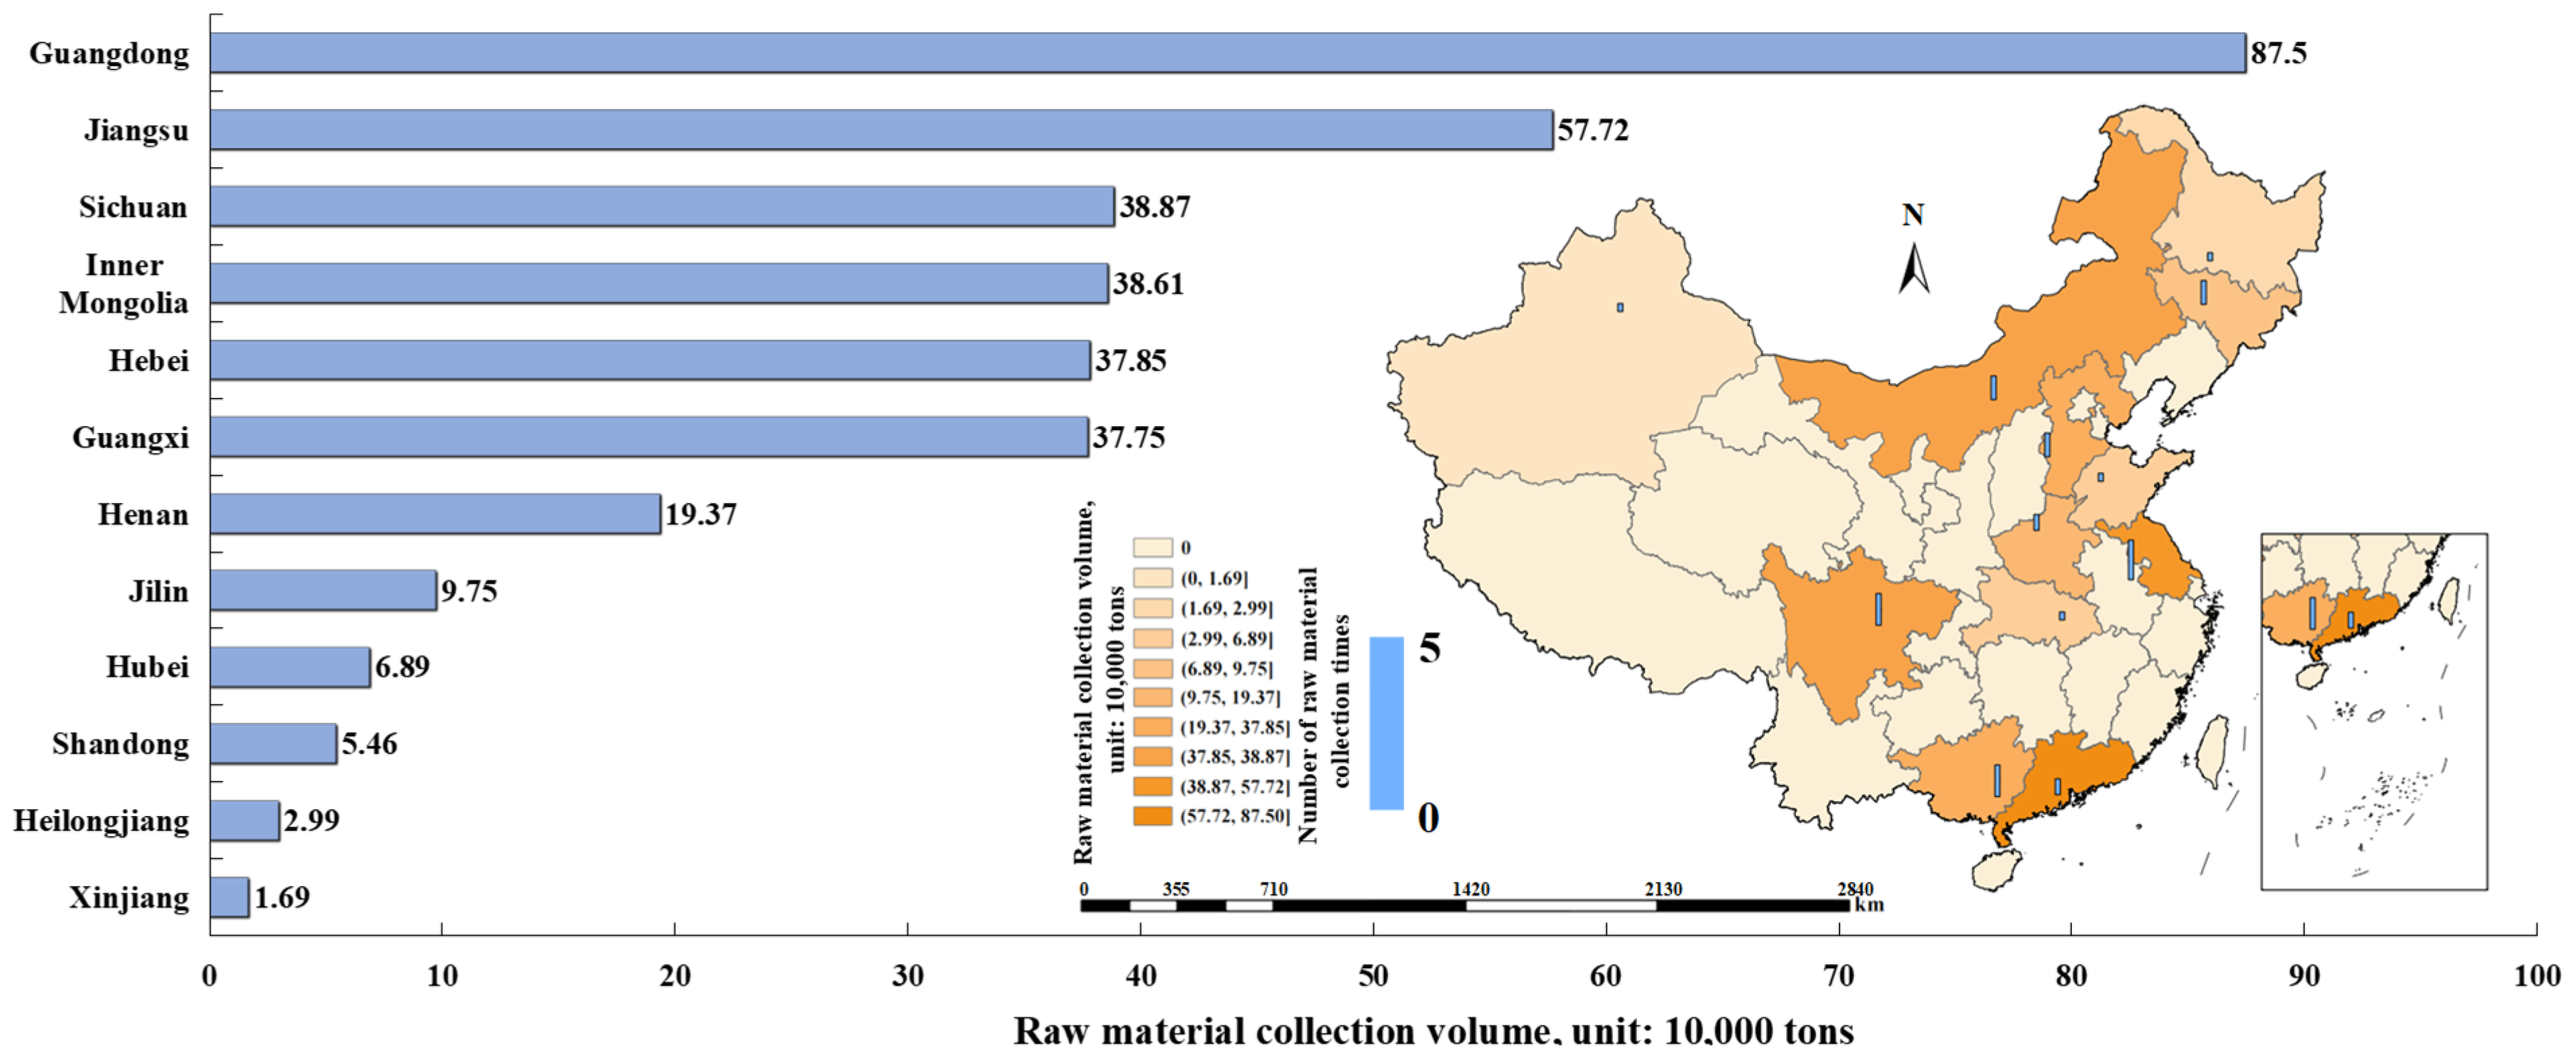
The spatial distribution of biomass feedstock across China exhibits pronounced geographical agglomeration characteristics. As shown in Figure 19, East China, Central China, and the Guangdong–Guangxi region, leveraging their abundant agricultural output and concentrated forestry and agricultural by-product resources, have formed typical high-density feedstock enrichment areas. These regions frequently appear as core supply nodes in the model-generated results, demonstrating their strategic potential to support SAF industrial clustering development and sustained large-scale supply.
Figure 19.
Raw material collection volume and frequency by province.
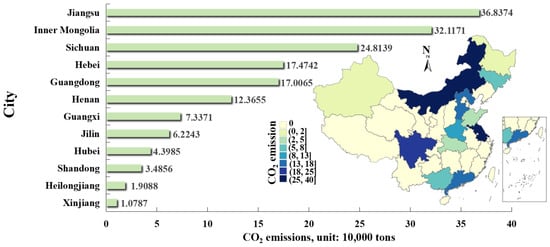
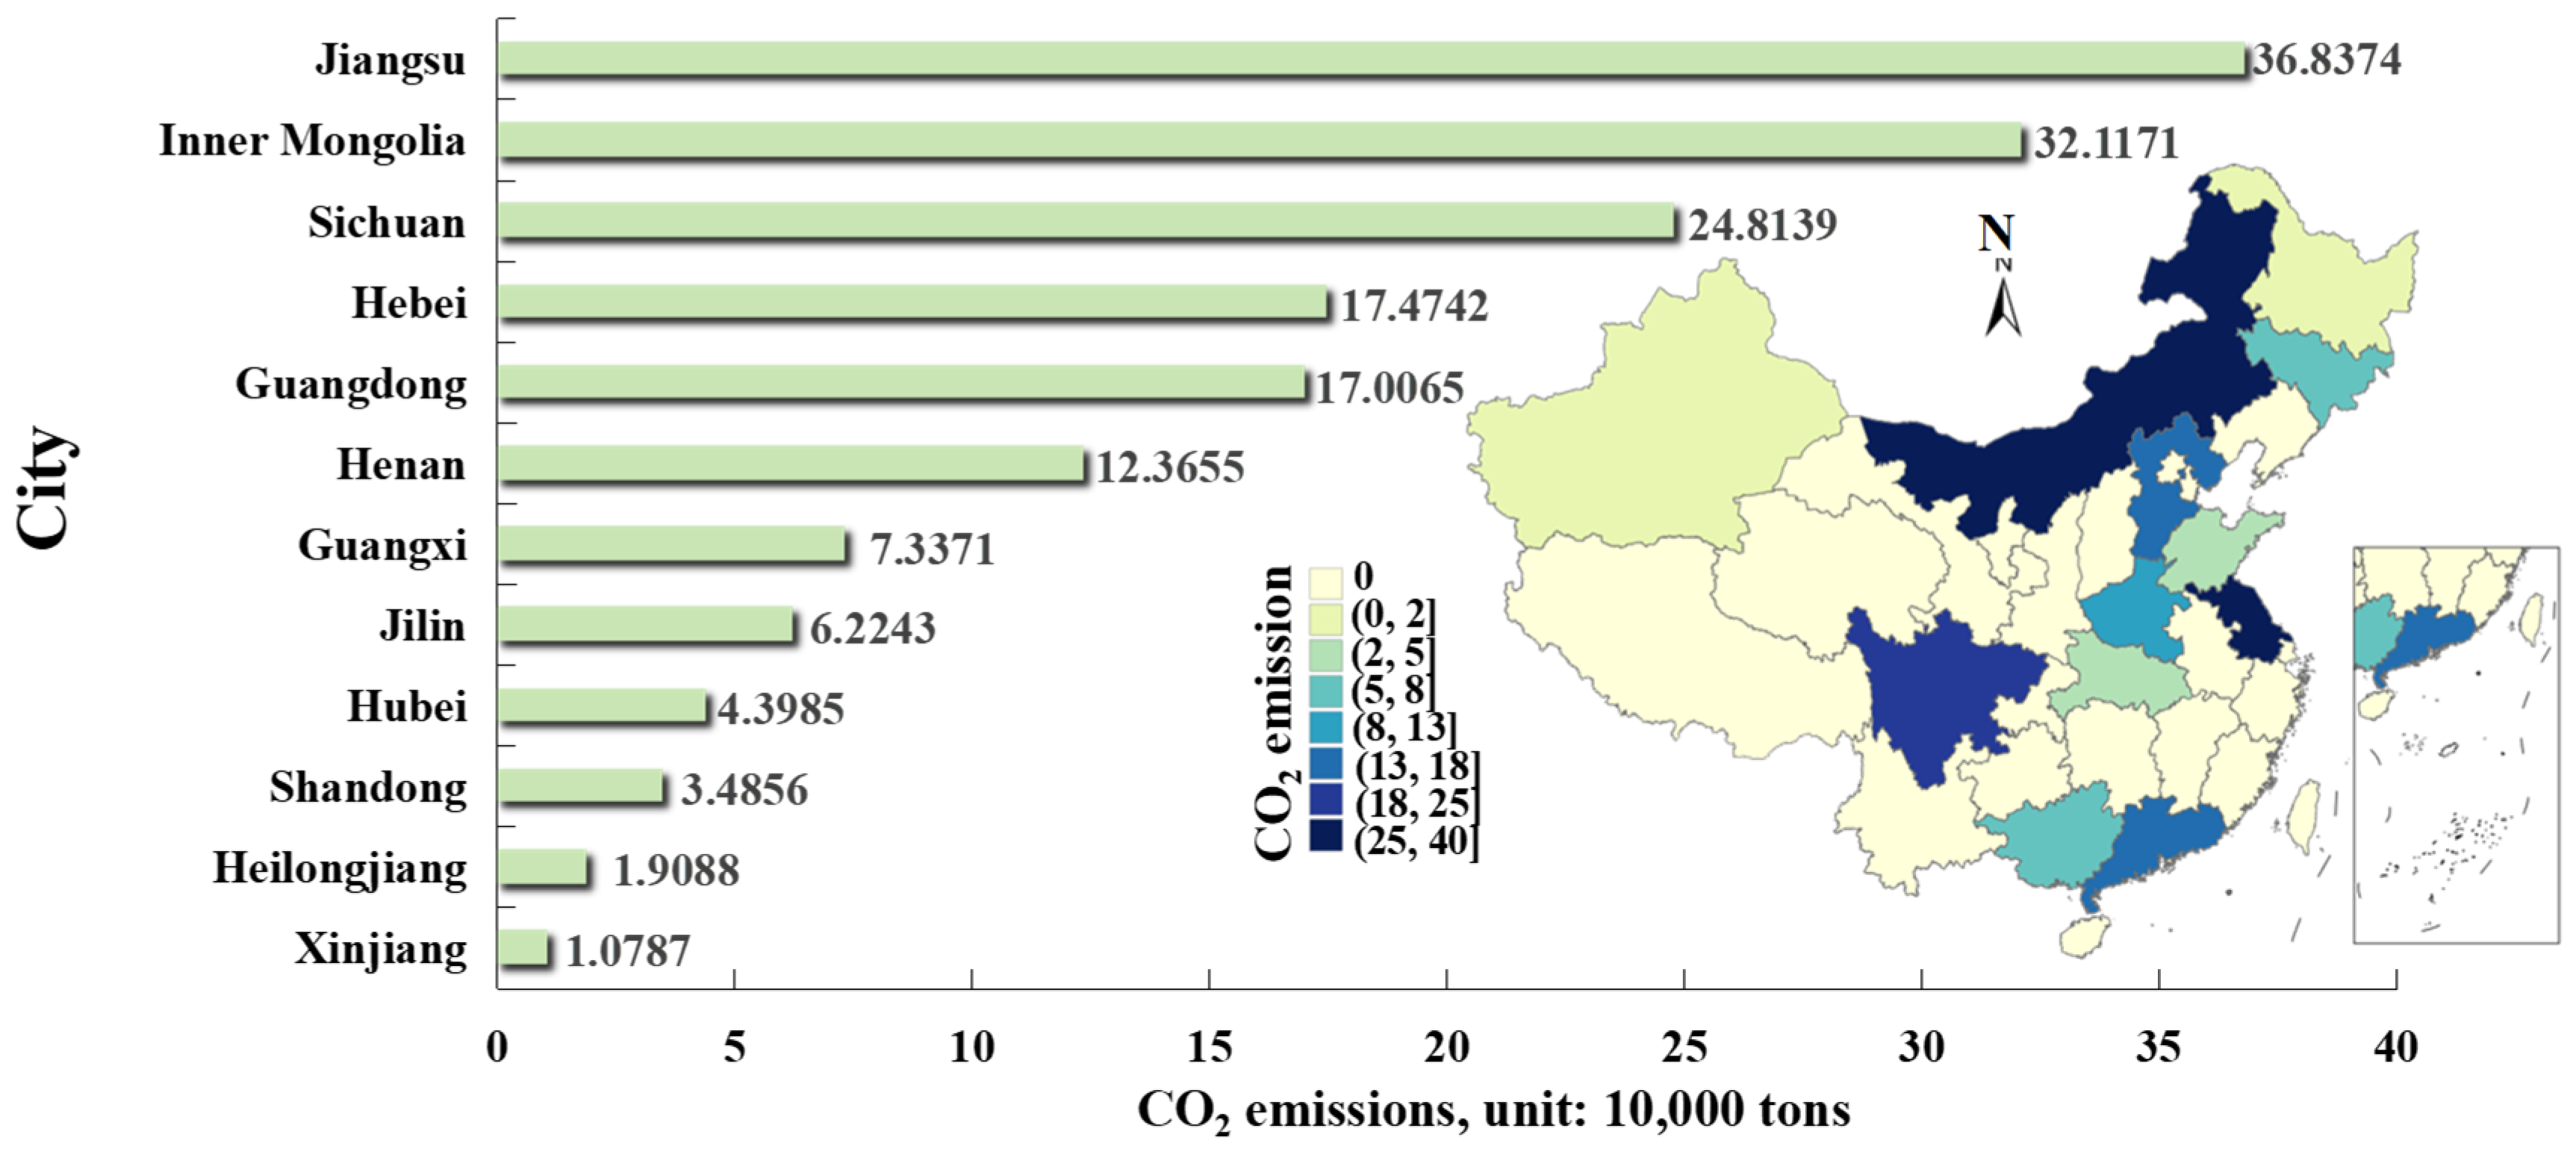
From the perspective of supply chain optimization, high-emission provinces do not necessarily equate to low-efficiency nodes. Figure 20 illustrates the total CO2 emissions during the feedstock collection process for each province. Taking Inner Mongolia and Jiangsu as examples, their emission values are at relatively high levels (368,400 tons and 321,200 tons of CO2, respectively), primarily due to their large feedstock collection bases; however, large-scale intensive collection conditions also endow these regions with stronger emission reduction potential and economies of scale. In contrast, some provinces, although exhibiting lower total collection emissions, fail to leverage the spatial potential advantages of resources due to limited SAF collection frequency. The Guangdong–Guangxi region demonstrates unique supply characteristics: despite its resource abundance being slightly lower than that of some northern provinces, its higher collection efficiency and responsive logistics provide robust low-carbon feedstock assurance for southern aviation hubs. Therefore, in feedstock-end layout planning, priority should be given to identifying provinces possessing the trinity characteristics of “high yield, low unit intensity, and high transport accessibility” as core source points for the national supply network.
Figure 20.
CO2 emissions from raw material collection in various provinces.
The above spatial characteristics indicate that the formation of feedstock agglomeration areas not only determines the SAF production capacity ceiling of a single region but also directly reshapes the node topology of the national supply chain network. The “dual-core” pattern formed by the East China–Central China corridor and the Southwest Sichuan Basin lays a solid foundation for constructing a multi-level, hierarchical national feedstock allocation system in the future. This stratified spatial supply model can effectively smooth out the carbon premium brought by long-distance transportation, achieving the global optimization of carbon performance across the entire industrial chain.
4.3.2. Selection of Refining Nodes and Evaluation of Industrial Chain Carrying Capacity
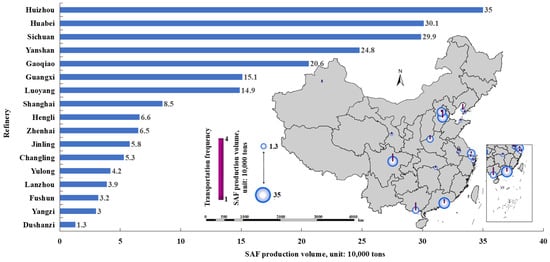
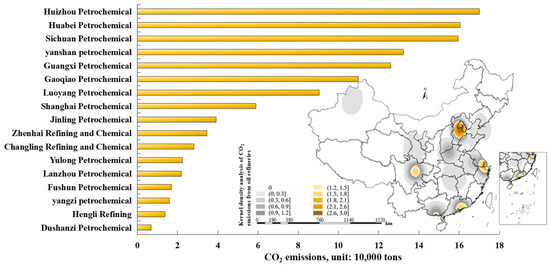
In the spatial organization of the SAF industrial chain, refining nodes serve as the pivotal core hubs connecting upstream and downstream segments. Their spatial siting not only directly reshapes the network topology of logistics and transportation but also fundamentally determines the spatial distribution pattern of life-cycle carbon emissions. As shown in Figure 21, under the globally optimal pathway configuration, the conversion scale and turnover frequency of refining nodes exhibit highly differentiated regional characteristics. Specifically, mega-scale refining clusters along coastal zones such as Zhejiang, Jiangsu, and Guangdong, as well as those along the Yangtze River Economic Belt, occupy absolute core hub positions, undertaking the vast majority of inter-provincial SAF allocation functions. Such hub nodes rely on highly developed pipeline systems and trunk railway networks, enabling the significant mitigation of logistics carbon premiums arising from long-distance inter-regional transfers. Meanwhile, regional refineries distributed across inland provinces in Central and Western China primarily serve local or nearby hub airports within their radiation circles, constructing “point-to-point” localized closed-loop networks. Although these inland nodes cannot match coastal mega-petrochemical bases in absolute production capacity, they demonstrate irreplaceable geographical advantages in shortening end-distribution distances and reducing short-distance, high-carbon road transport segments by virtue of their absolute spatial proximity.
Figure 21.
Refinery conversion of SAF quantity and conversion frequency.
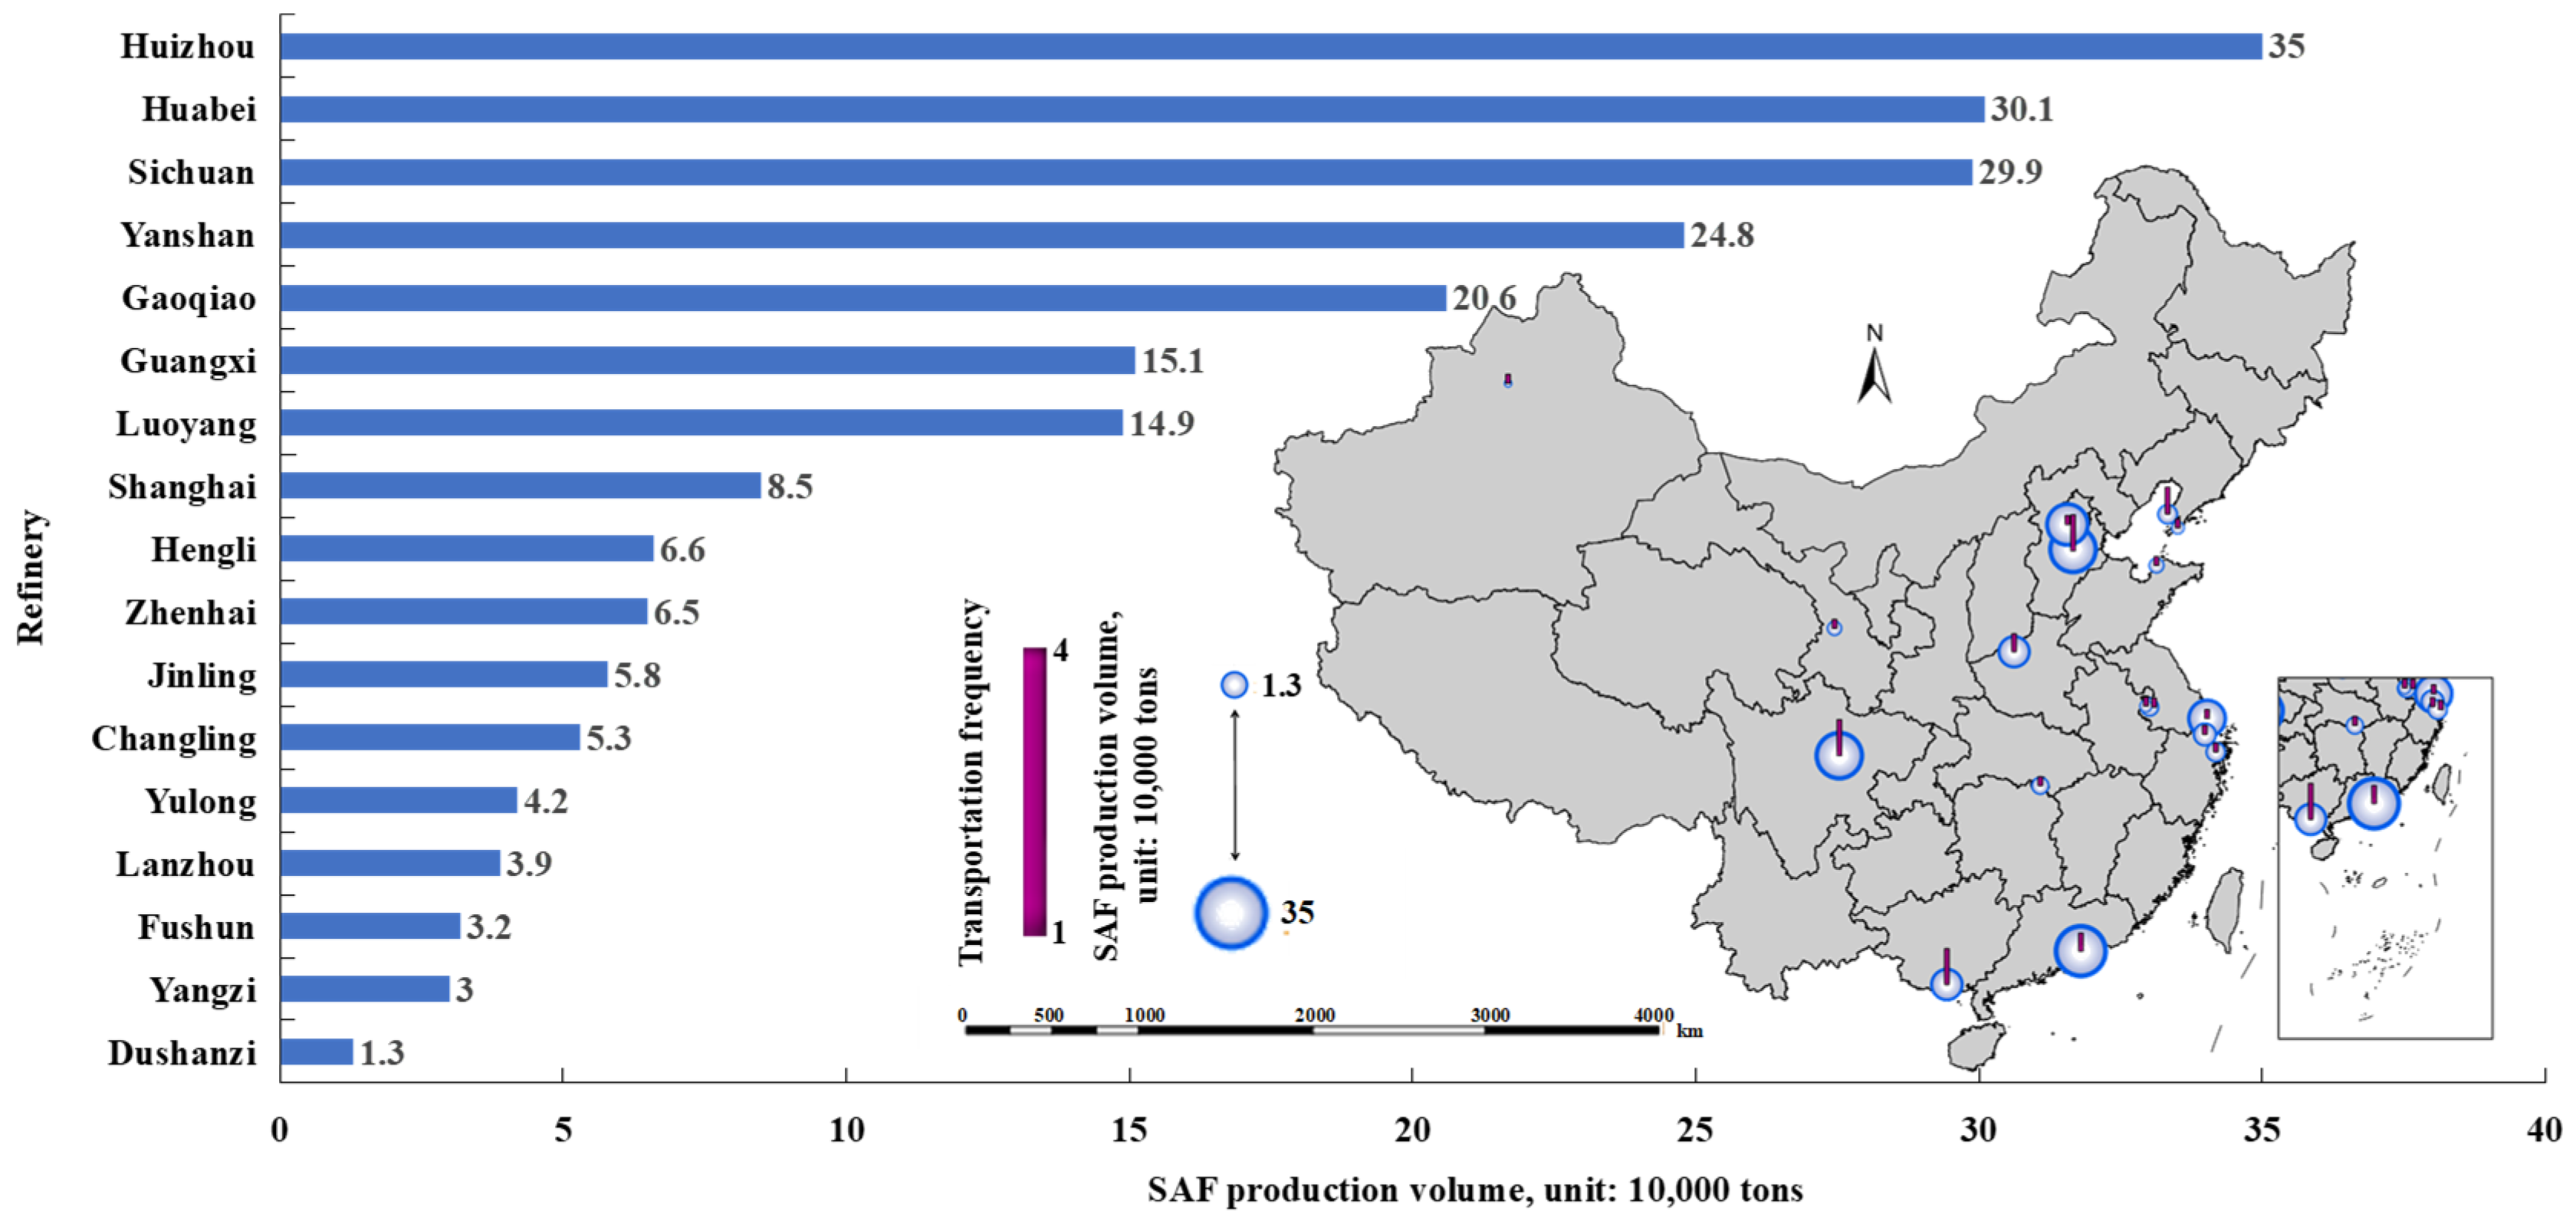
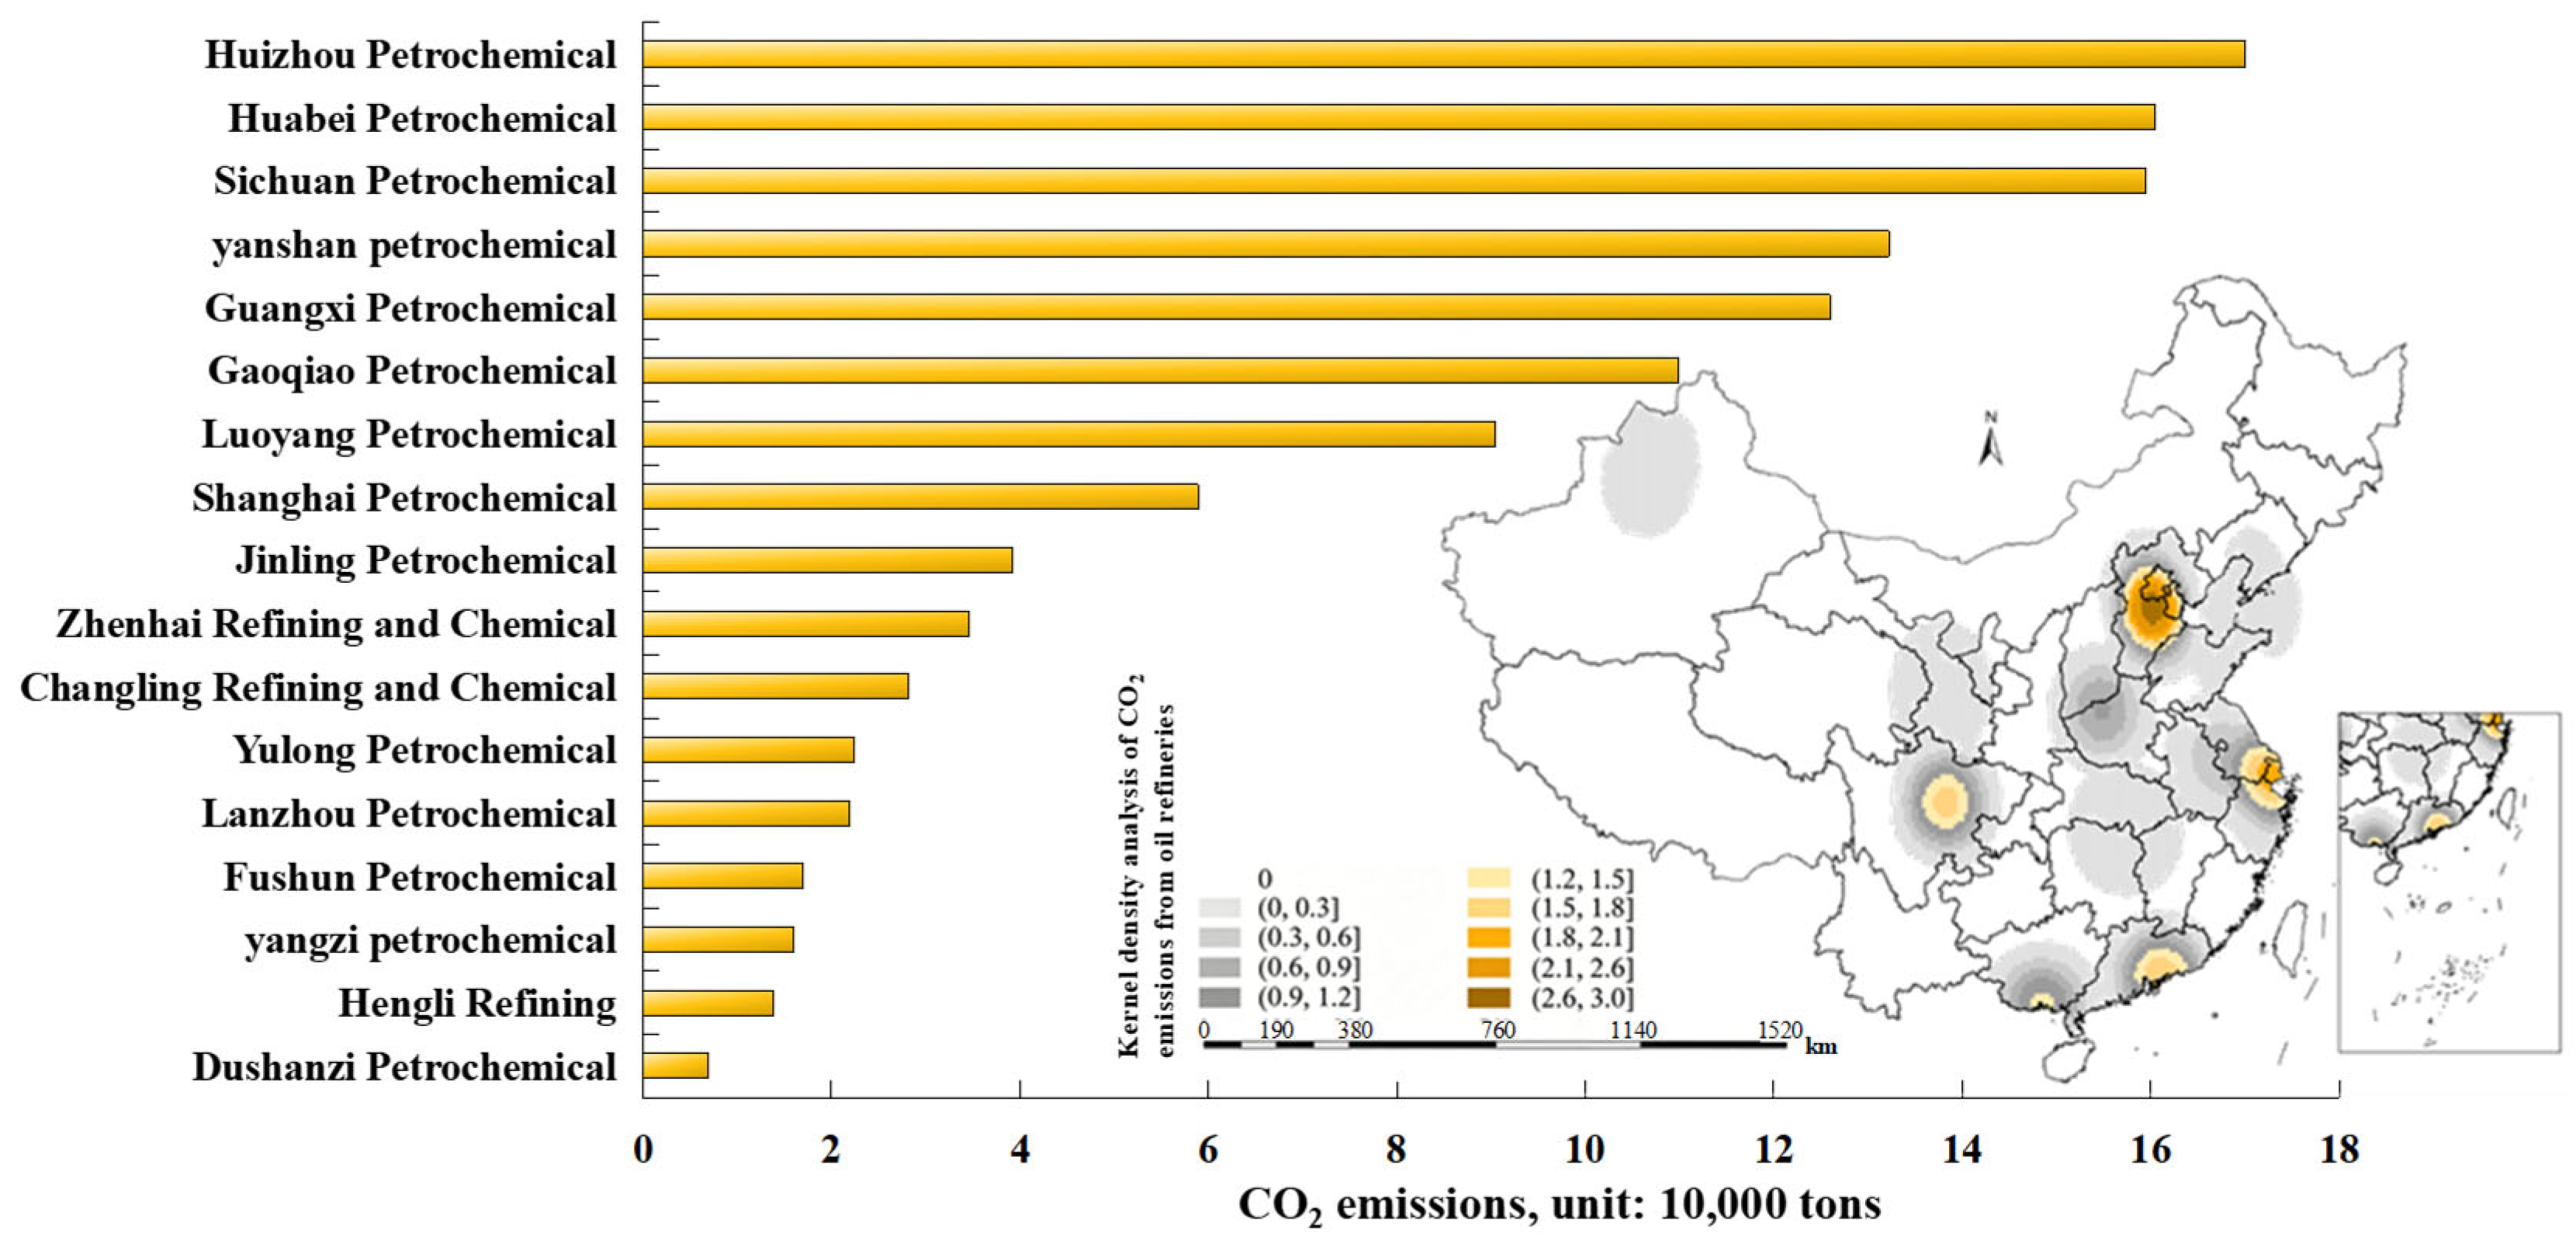
There exists a deep coupling and asymmetric relationship between the large-scale agglomeration of refining capacity and the resulting carbon emission intensity. Through a kernel density analysis of CO2 emissions from the SAF conversion process at each refinery, Figure 22 intuitively reveals the carbon emission gradient pattern of the industrial chain. Data indicate that the top three hub refineries in terms of production capacity (Zhenhai Refining, Huizhou Petrochemical, and Hengli Petrochemical) collectively contribute 32% of national SAF output, while their corresponding carbon emission share is only 28.6%. This critical inversion characteristic powerfully corroborates the economies of scale effect of ultra-large-scale refining clusters in enhancing unit carbon efficiency. From the macro-spatial scale perspective, carbon emissions from the national refining segment form a significant “three-tier stepped” distribution: high-density emission core areas represented by the Yangtze River Delta urban agglomeration and the Pearl River Delta region constitute the foundational bedrock supporting large-scale national aviation fuel supply; medium-density sub-centers represented by the Bohai Rim Economic Circle and the Chengdu–Chongqing Twin-City Economic Circle play the regional supporting role of connecting the east and west; and low-density marginal areas scattered across the vast inland hinterland serve as effective supplements at the terminal end of the supply network.
Figure 22.
Nuclear density analysis of CO2 emissions from refinery conversion of SAF.
Based on the above spatial deconstruction, it can be concluded that the optimal spatial evolution strategy for China’s future SAF refining network should establish a dual-layer nested structure concentrated in the eastern coastal region and dispersed across the central and western inland areas. Under this strategic orientation, eastern coastal hubs can fully leverage their massive production capacity base and low-carbon logistics networks to support broad-area low-carbon supply across large regions, while central and western nodes need to deeply cultivate regionalized short-chain closed loops, transforming geographical proximity advantages into tangible carbon emission reduction dividends. This differentiated spatial configuration logic can maximize the synergistic equilibrium between system production capacity scale and transport carbon efficiency, thereby comprehensively enhancing the environmental carrying capacity and system resilience of China’s entire SAF industrial chain.
4.3.3. Collaborative Layout and Global Optimization Strategy of Multi-Node Transportation Network
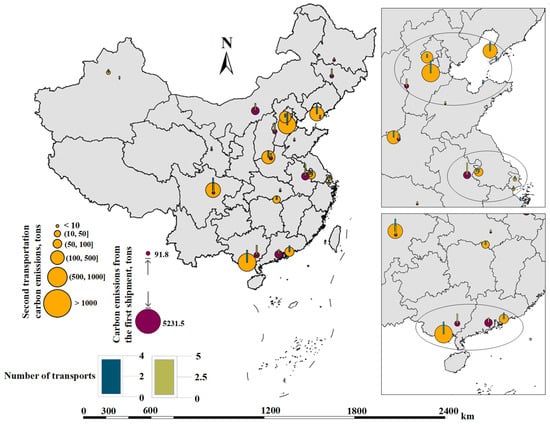
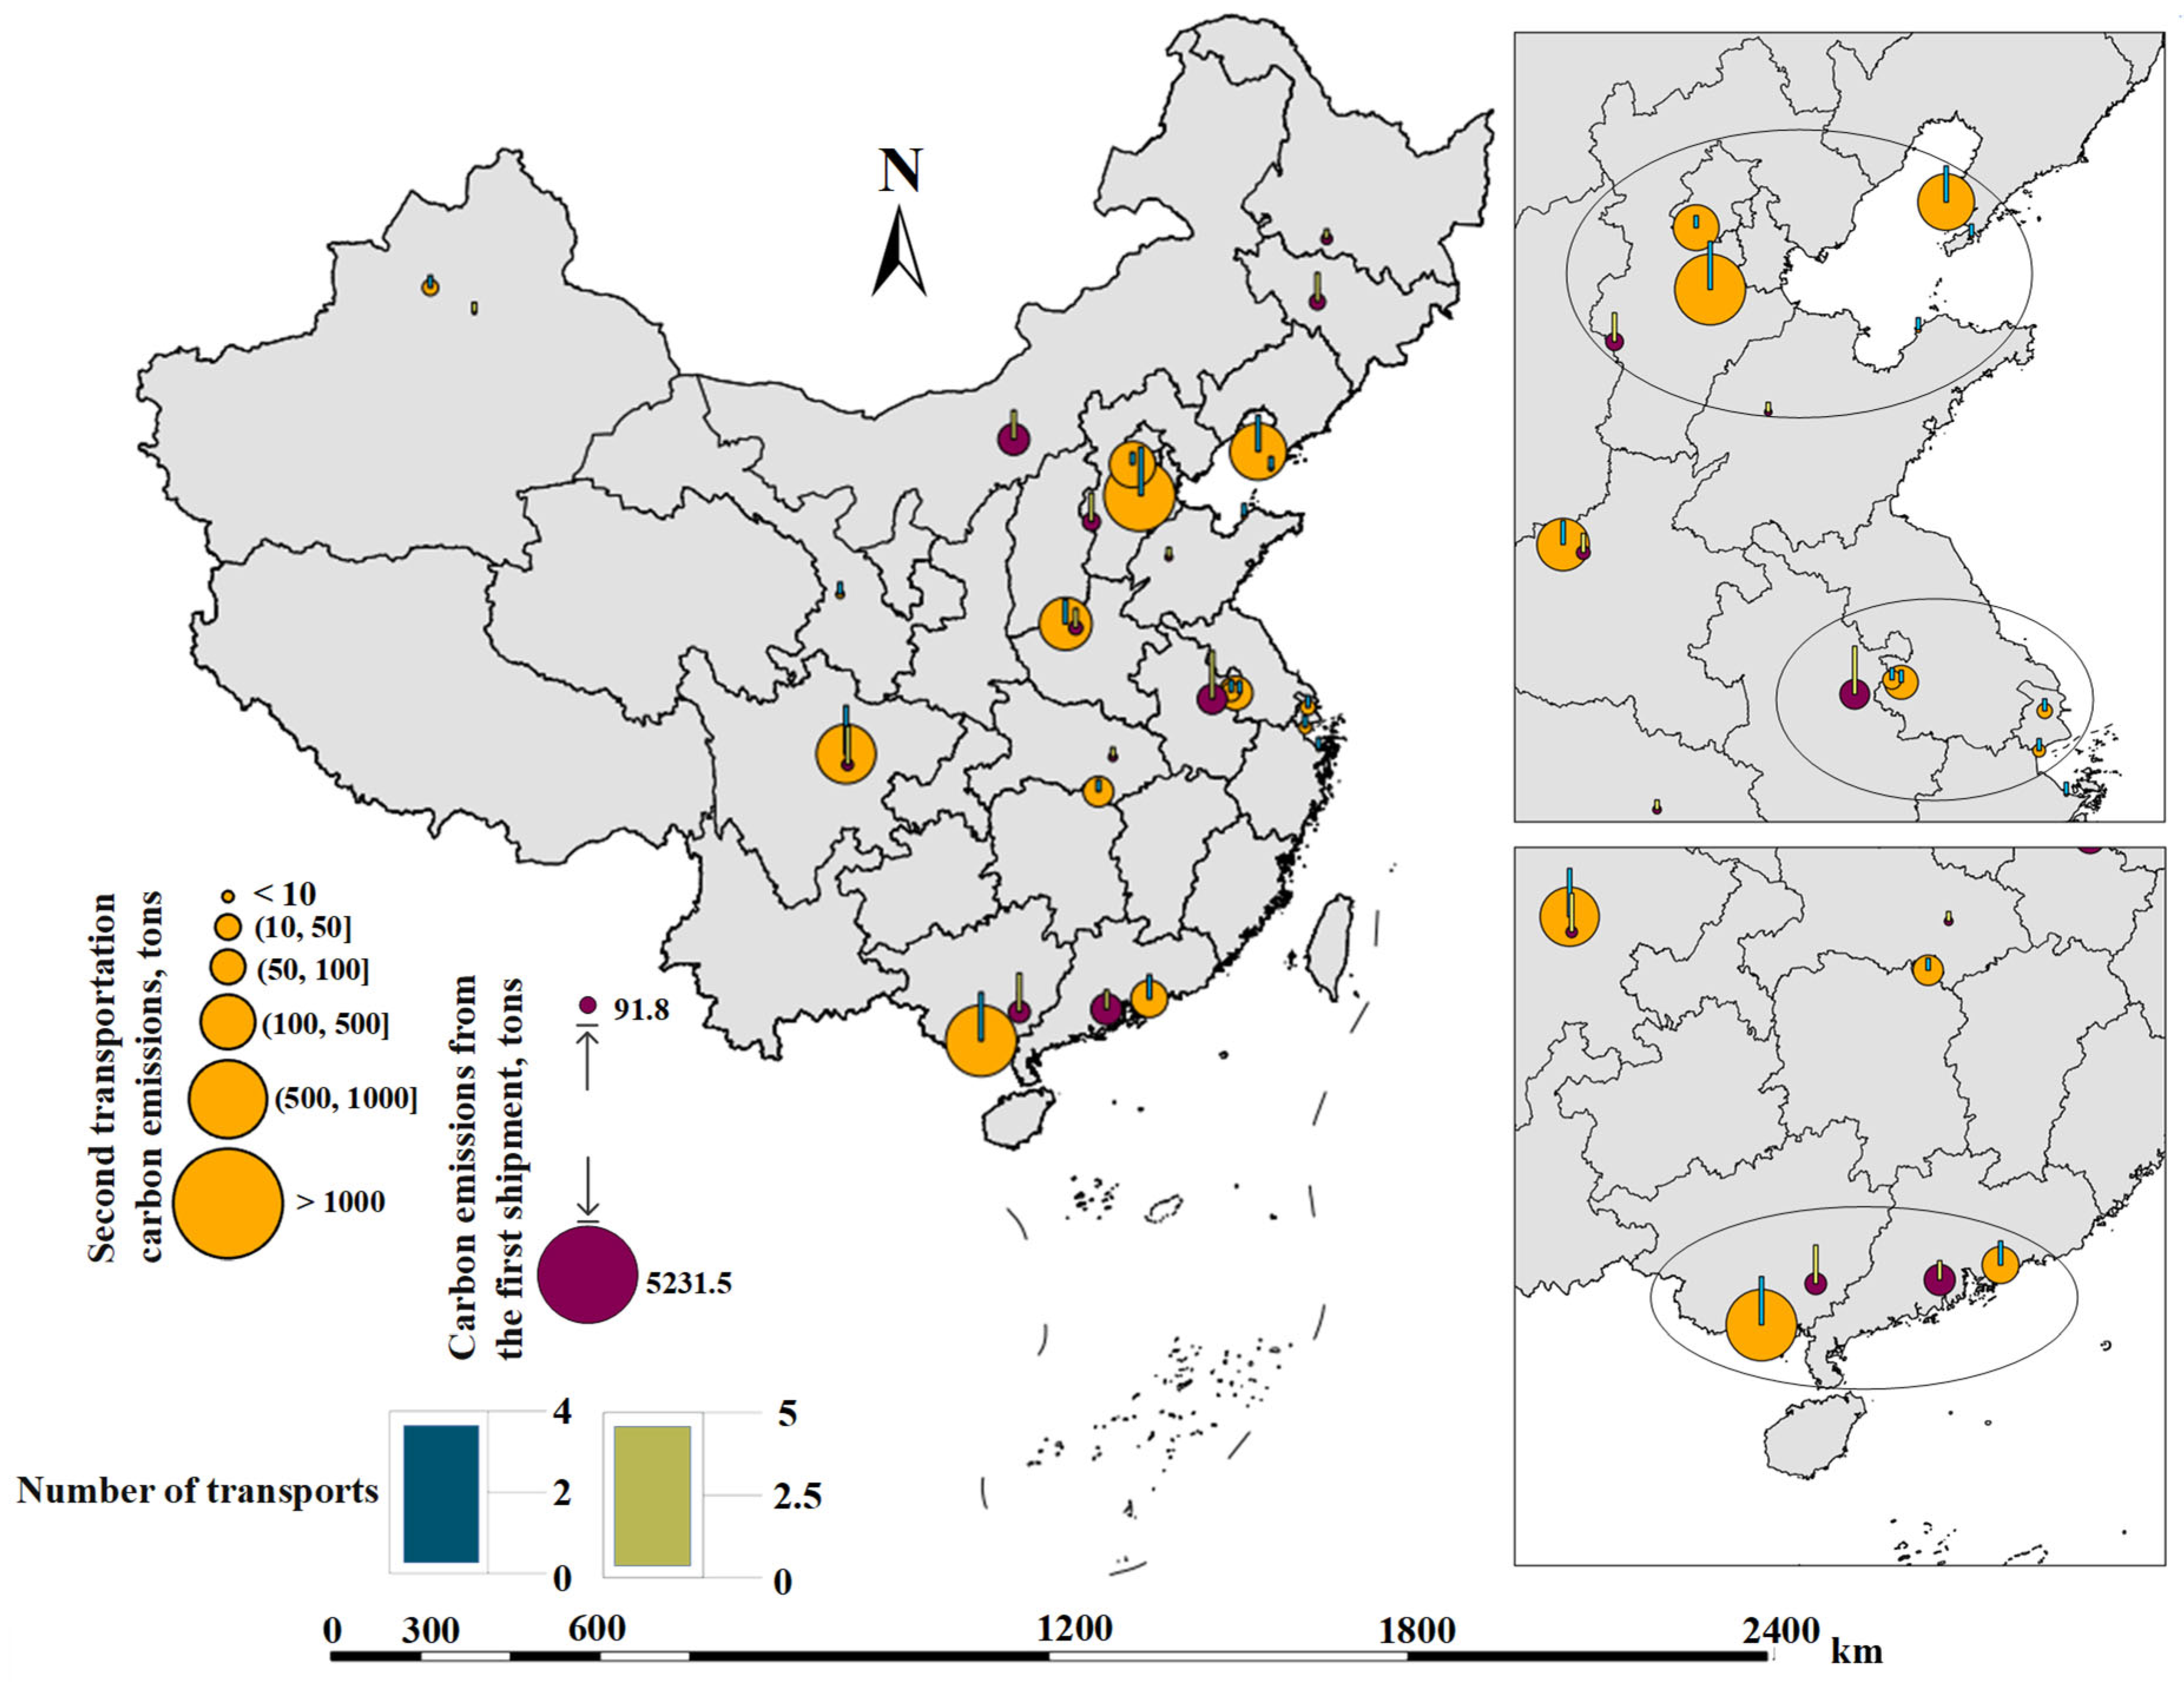
As a critical link connecting feedstock supply, refining hubs, and airport consumption, the optimized design of the transportation network directly dictates the overall carbon mitigation performance of the sustainable aviation fuel (SAF) supply chain. Through the quantitative accounting of CO2 emissions generated during the transportation phase, this study elucidates the spatial distribution characteristics of carbon footprints within a multi-node transportation network. Based on the trajectory data generated by the model, we developed a collaborative transportation system characterized by “railway and pipeline as the mainstay, supplemented by highway”. This strategy not only effectively suppresses the marginal carbon emissions of the transportation sector but also significantly enhances the resilience and response velocity of the supply chain through modal coupling. From the perspective of spatial distribution, the multi-node collaborative network spontaneously formed several high-density transportation corridors. As illustrated in Figure 23, through an in-depth analysis of transportation intensity at the points of origin, this study identifies three core channels: the “Northeast–East China Corridor,” the “Yangtze River Delta Cluster,” and the “Guangdong–Guangxi Cluster”. These corridors achieve seamless integration between resource-rich areas, refining hubs, and consumer airport clusters through highly efficient spatial coordination mechanisms.
Figure 23.
Analysis of starting point transportation intensity.
Specifically, the Northeast–East China Corridor relies on the axis of railway trunk lines to facilitate the cross-regional, long-distance transfer of feedstocks, such as soybean residues, from high-yield areas like Heilongjiang to refining hubs in the Yangtze River Delta; it further distributes finished SAF products to regional core airports. The Yangtze River Delta Cluster focuses on the deep integration of internal pipeline systems, utilizing high-density jet fuel networks to significantly curtail the carbon footprint of finished product transportation from refineries to terminal airports. Meanwhile, the Guangdong–Guangxi Cluster adopts a combined “railway + short-haul highway” model to optimize the flow of fast-growing forest biomass from Guangxi to refining bases in Guangdong, efficiently serving the world-class airport cluster in the Pearl River Delta. These primary channels undergo dynamic scheduling through algorithm-driven path selection, effectively circumventing redundant transportation and ineffective backflow, thereby reducing the carbon intensity of the logistics segment on a global scale.
5. Conclusions and Policy Implications
5.1. Conclusions
This study develops a rule-constrained generative modeling framework to explore the configuration characteristics and carbon emission performance of SAF supply chain pathways. Based on the results presented in Section 4, the following conclusions can be drawn.
First, the generated pathway samples exhibit stable statistical distributions in key attributes, including transport distance, technology selection, and carbon intensity. The consistency between generated samples and the training dataset indicates that the model is capable of capturing the underlying distribution of feasible SAF pathways under the imposed constraints.
Second, the results reveal a clear tendency toward localized supply chain configurations. A significant proportion of generated pathways are characterized by short transport distances and geographically proximate feedstock, refinery, and airport nodes. These configurations are consistently associated with lower life-cycle carbon emissions, indicating that spatial proximity is a critical factor in reducing overall emission intensity.
Third, differences in technology pathways lead to observable variations in carbon performance. Under comparable transport conditions, pathways with higher conversion efficiency and lower feedstock demand tend to achieve lower life-cycle emissions. This demonstrates the importance of aligning technology selection with supply chain characteristics.
Fourth, transport distance is identified as a key influencing factor in emission variability. The results show that pathways involving longer transport distances generally correspond to higher total carbon emissions, reflecting the mass–distance relationship embedded in the transportation emission model.
Fifth, the overall spatial distribution of generated pathways reflects a concentration in regions with higher aviation activity and infrastructure density. This indicates that supply chain configurations are influenced by both demand intensity and logistical feasibility within the modeled system.
Finally, the generated results remain consistent with the rule-constrained dataset design and life-cycle modeling assumptions, indicating that the proposed framework can produce structurally coherent and physically plausible SAF supply chain pathways. However, it should be noted that the analysis is based on a synthetic dataset, and further validation using real-world operational data remains an important direction for future research.
5.2. Policy Recommendations
The findings of this study provide several practical implications for SAF deployment. Promoting localized supply chains can significantly reduce emissions and improve system efficiency. Priority should be given to high-demand hub airports while ensuring regional balance. In addition, integrating generative modeling with life-cycle assessment offers a flexible and data-driven tool for evaluating future SAF development strategies under different technological and policy scenarios.
While this study provides a comprehensive assessment of SAF supply chain pathways from a life-cycle carbon emission perspective, it is important to acknowledge that economic factors were not explicitly incorporated into the current modeling framework. The primary objective of this research is to explore the structural characteristics and emission reduction potential of alternative supply chain configurations under technical and environmental constraints. However, in real-world applications, the feasibility of SAF deployment is not determined solely by carbon performance. Economic considerations—such as production costs, feedstock prices, transportation expenses, and infrastructure investment—play a critical role in determining whether a technically optimal pathway can be practically implemented. A pathway identified as environmentally optimal may still face significant barriers if it is not economically competitive. Therefore, the results presented in this study should be interpreted as identifying technically feasible and low-carbon-efficient configurations, rather than directly prescriptive solutions for immediate deployment. Future research will focus on integrating techno-economic analysis (TEA) with the current modeling framework to evaluate cost-effectiveness and support more comprehensive decision-making for SAF supply chain planning.
Author Contributions
Conceptualization, H.L.; Methodology, W.-K.S.; Software, M.X.; Validation, M.X.; Formal analysis, F.-Y.W.; Investigation, M.X.; Resources, P.-T.W.; Writing—original draft, F.-Y.W.; Writing—review & editing, W.-K.S. and P.-T.W.; Visualization, H.L.; Supervision, P.-T.W.; Project administration, W.-K.S.; Funding acquisition, F.-Y.W., P.-T.W. and H.L. All authors have read and agreed to the published version of the manuscript.
Funding
This study was funded by the Natural Science Foundation of Tianjin (24JCQNJC00200).
Institutional Review Board Statement
Not applicable.
Informed Consent Statement
Informed consent was obtained from all subjects involved in this study.
Data Availability Statement
The datasets analyzed during the current study involve rule-constrained synthetic data generated through an integrated analytical framework, utilizing publicly available life-cycle assessment (LCA) parameters and specific engineering assumptions. Primary data sources for emission factors and methodological benchmarks include ICAO CORSIA default values and the peer-reviewed literature. The synthetic datasets, along with the foundational parameter settings used for generation, are available from the corresponding author upon reasonable request.
Acknowledgments
In the process of writing this manuscript, the authors used Gemini 3 Flash to assist with programming. The authors have reviewed and edited the output and take full responsibility for the content of this publication.
Conflicts of Interest
The authors declare no conflicts of interest.
References
- IPCC. Chapter 10: Transport. In Climate Change 2022: Mitigation of Climate Change; Intergovernmental Panel on Climate Change: Geneva, Switzerland, 2022; Available online: https://pure.iiasa.ac.at/id/eprint/19076/1/IPCC_AR6_WGIII_Chapter10.pdf (accessed on 21 May 2026).
- CAAC. 14th Five Year Plan for the Development of Civil Aviation; Civil Aviation Administration of China: Beijing, China, 2022. Available online: https://english.www.gov.cn/statecouncil/ministries/202201/07/content_WS61d8386ac6d09c94e48a34f4.html (accessed on 21 May 2026).
- Adler, E.J.; Martins, J. Hydrogen-Powered Aircraft: Fundamental Concepts, Key Technologies, and Environmental Impacts. Prog. Aerosp. Sci. 2023, 141, 100922. [Google Scholar] [CrossRef] [Scilit]
- Dancila, B.D.; Botez, R.M. Geographical Area Selection and Construction of a Corresponding Routing Grid Used for In-Flight Management System Flight Trajectory Optimization. Proc. Inst. Mech. Eng. Part G J. Aerosp. Eng. 2017, 231, 809–822. [Google Scholar] [CrossRef] [Scilit]
- ICAO. CORSIA Supporting Document—Life Cycle Assessment Methodology; International Civil Aviation Organization: Montreal, QC, Canada, 2022; Available online: https://www.icao.int/environmental-protection/CORSIA/Pages/CORSIA-Eligible-Fuels.aspx (accessed on 21 May 2026).
- Müller-Langer, F.; Majer, S.; O’Keeffe, S. Benchmarking Biofuels—A Comparison of Technical, Economic and Environmental Indicators. Energy Sustain. Soc. 2014, 4, 20. [Google Scholar] [CrossRef] [Scilit]
- Khan, M.A.H.; Bonifacio, S.; Clowes, J.; Foulds, A.; Holland, R.; Matthews, J.C.; Percival, C.J.; Shallcross, D.E. Investigation of Biofuel as a Potential Renewable Energy Source. Atmosphere 2021, 12, 1289. [Google Scholar] [CrossRef] [Scilit]
- Liora, N.; Poupkou, A.; Papadogiannaki, S.; Parliari, D.; Giama, E.; Pieretti, G.A.; Da Rugna, L.C.; Susanetti, L.; Bressan, M.; Becerra Villanueva, J.A.; et al. A Methodology for Carbon Footprint Estimations of Research Project Activities—A Scenarios Analysis for Reducing Carbon Footprint. Atmosphere 2023, 14, 6. [Google Scholar] [CrossRef] [Scilit]
- Prussi, M. The Sustainability Dimension for Sustainable Aviation Fuels (SAF): Comparing Regional and International Approaches. Sustainability 2025, 17, 8401. [Google Scholar] [CrossRef] [Scilit]
- Yang, R.S.; Le, M.L.; Wang, Q.Z. Multi-Objective Airport Slot Allocation with Demand-Side Fairness Considerations. Aerospace 2025, 12, 119. [Google Scholar] [CrossRef] [Scilit]
- Stojkovic, G.; Soumis, F.; Desrosiers, J.; Solomon, M.M. An Optimization Model for a Real-Time Flight Scheduling Problem. Transp. Res. Part A Policy Pract. 2002, 36, 779–788. [Google Scholar] [CrossRef] [Scilit]
- Wang, R.; Qin, Y.C.; Sun, H. Research on Location Selection Strategy for Airlines Spare Parts Central Warehouse Based on METRIC. Comput. Intell. Neurosci. 2021, 2021, 4737700. [Google Scholar] [CrossRef] [Scilit] [PubMed]
- Ambrosio, W.B.; Sousa, B.A.; Kanieski, J.M.; Marchiorie, P.; Mockaitis, G. Sustainable Aviation Fuels: Opportunities, Alternatives and Challenges for Decarbonizing the Aviation Industry and Foster the Renewable Chemicals. arXiv 2025, arXiv:2504.03880. [Google Scholar] [CrossRef] [Scilit]
- Manqele, N.M.; Moolla, R.; Frost Ramsay, L. A Mid-Tier Approach to Estimating Durban’s Port Marine Mobile Emissions: Gauging Air Quality Impacts in South Durban. Atmosphere 2024, 15, 1207. [Google Scholar] [CrossRef] [Scilit]
- Brown, J.A.; Harrison, M.R.; Rufael, T.; Roman-White, S.A.; Ross, G.B.; George, F.C.; Zimmerle, D. Evaluating Development of Empirical Estimates Using Two Top-Down Methods at Midstream Natural Gas Facilities. Atmosphere 2024, 15, 447. [Google Scholar] [CrossRef] [Scilit]
- Junpen, A.; Pansuk, J.; Garivait, S. Estimation of Reduced Air Emissions as a Result of the Implementation of the Measure to Reduce Burned Sugarcane in Thailand. Atmosphere 2020, 11, 366. [Google Scholar] [CrossRef] [Scilit]
- Chao, H.; Agusdinata, D.B.; DeLaurentis, D.; Stechel, E.B. Carbon Offsetting and Reduction Scheme with Sustainable Aviation Fuel Options: Fleet-Level Carbon Emissions Impacts for US Airlines. Transp. Res. Part D Transp. Environ. 2019, 75, 42–56. [Google Scholar] [CrossRef] [Scilit]
- Li, S.Y.; Zhang, B.; Fei, L.K.; Zhao, S.P. Joint Discriminative Feature Learning for Multimodal Finger Recognition. Pattern Recognit. 2021, 111, 107683. [Google Scholar] [CrossRef] [Scilit]
- Zhao, F.; Zhang, C.C.; Geng, B.C. Deep Multimodal Data Fusion. ACM Comput. Surv. 2024, 56, 225. [Google Scholar] [CrossRef] [Scilit]
- CAEP. CORSIA Eligible Fuels–Life Cycle Assessment Methodology; Committee on Aviation Environmental Protection, International Civil Aviation Organization: Montreal, QC, Canada, 2024; Available online: https://www.icao.int/CORSIA/corsia-eligible-fuels (accessed on 21 May 2026).
- Scheer, I. Analysis of the Price and Supply of Sustainable Aviation Fuels Using a Supply Chain Optimization Model. Master’s Thesis, Delft University of Technology, Delft, The Netherlands, 2024. [Google Scholar]
- de Jong, S.; Antonissen, K.; Hoefnagels, R.; Lonza, L.; Wang, M.; Faaij, A.; Junginger, M. Life-Cycle Analysis of Greenhouse Gas Emissions from Renewable Jet Fuel Production. Biotechnol. Biofuels 2017, 10, 64. [Google Scholar] [CrossRef] [Scilit]
- IEA Bioenergy. Biojet Fuel Production Pathways and Their Potential for Commercialization; IEA Bioenergy Task 39: Dublin, Ireland, 2021. [Google Scholar]
- DESNZ. Conversion Factors: Energy and Carbon Conversions 2023 Update; Department for Energy Security and Net Zero: London, UK, 2023. Available online: https://www.gov.uk/government/publications/greenhouse-gas-reporting-conversion-factors-2023 (accessed on 21 May 2026).
- US EPA. Greenhouse Gas Emission Factors Hub; United States Environmental Protection Agency: Washington, DC, USA, 2025. Available online: https://www.epa.gov/climateleadership/ghg-emission-factors-hub (accessed on 21 May 2026).
- IEA. Greenhouse Gas Emissions from Energy: Database Documentation; International Energy Agency: Paris, France, 2021; Available online: https://www.iea.org/data-and-statistics/data-product/greenhouse-gas-emissions-from-energy (accessed on 21 May 2026).
- CEFIC; ECTA. Guideline for Measuring and Managing CO2 Emissions from Freight Transport Operations, Issue 1.0; European Chemical Industry Council: Brussels, Belgium; European Chemical Transport Association: Brussels, Belgium, 2021; Available online: https://www.ecta.com/wp-content/uploads/2021/03/ECTA-CEFIC-GUIDELINE-FOR-MEASURING-AND-MANAGING-CO2-ISSUE-1.pdf (accessed on 14 March 2026).
- Davidović, B.; Božović, M. The Effect of Intermodal Transport on the Reduction of CO2 Emission. Mob. Veh. Mech. 2014, 40, 63–79. [Google Scholar]
- Gnanha, A.T.; Cao, W.M.; Mao, X.D.; Wu, S.; Wong, H.S.; Li, Q. EviD-GAN: Improving GAN with an Infinite Set of Discriminators at Negligible Cost. IEEE Trans. Neural Netw. Learn. Syst. 2025, 36, 6422–6436. [Google Scholar] [CrossRef] [Scilit] [PubMed]
- Zhai, Z.H. Auto-Encoder Generative Adversarial Networks. J. Intell. Fuzzy Syst. 2018, 35, 3043–3049. [Google Scholar] [CrossRef] [Scilit]
- Wang, C.Y.; Xu, C.; Yao, X.; Tao, D.C. Evolutionary Generative Adversarial Networks. IEEE Trans. Evol. Comput. 2019, 23, 921–934. [Google Scholar] [CrossRef] [Scilit]
- Lee, M.; Seok, J. Controllable generative adversarial network. IEEE Access 2019, 7, 28158–28169. [Google Scholar] [CrossRef] [Scilit]
- Chen, L.; Ren, J. Multi-Attribute Sustainability Evaluation of Alternative Aviation Fuels Based on Fuzzy ANP and Fuzzy Grey Relational Analysis. J. Air Transp. Manag. 2018, 68, 176–186. [Google Scholar] [CrossRef] [Scilit]
- ICAO Committee on Aviation Environmental Protection. ICAO Guidance on Policy Measures for Sustainable Aviation Fuels (SAF) Development and Deployment; International Civil Aviation Organization: Montreal, QC, Canada, 2024; Available online: https://www.icao.int/sites/default/files/environmental-protection/Documents/Guidance-on-SAF-policies-Version-3.pdf (accessed on 21 May 2026).
- Navarrete, A.; Pavlenko, N.; O’Malley, J. SAF Policy Scorecard: Evaluating State-Level Sustainable Aviation Fuel Policies in the United States; International Council on Clean Transportation: Washington, DC, USA, 2024; Available online: https://theicct.org/wp-content/uploads/2024/11/ID-225-%E2%80%93-SAF-scorecard_final.pdf (accessed on 21 May 2026).
- National Bureau of Statistics of China. Announcement of the National Bureau of Statistics on 2024 Grain Production Data; National Bureau of Statistics of China: Beijing, China, 2024. Available online: https://www.stats.gov.cn/english/PressRelease/202412/t20241213_1957746.html (accessed on 21 May 2026).
- Ministry of Natural Resources of the People’s Republic of China. China Mineral Resources Report 2024; Geological Publishing House: Beijing, China, 2024; Available online: http://news.chinatungsten.com/pdf/China-Mineral-Resources-2024-en.pdf (accessed on 21 May 2026).
- National Energy Administration. Top Ten Achievements in Oil and Gas Exploration in 2024; National Energy Administration: Beijing, China, 2025. Available online: https://www.nea.gov.cn/20250120/f16a9ad91ce8459d9fc03d1d2869a588/c.html (accessed on 21 May 2026).
- National Bureau of Statistics of China. National Data; National Bureau of Statistics of China: Beijing, China, 2024. Available online: https://data.stats.gov.cn/ (accessed on 21 May 2026).
- Statistical Bureau of Guangdong Province. Guangdong Statistical Yearbook 2024; Statistical Bureau of Guangdong Province: Guangzhou, China, 2024. Available online: https://gdzd.stats.gov.cn/dcsj/gdsnjsj/ (accessed on 21 May 2026).
- China National Forestry Administration. Planning for the Construction Project of Fast-Growing and High-Yield Timber Forest Bases in Key Areas; China National Forestry Administration: Beijing, China, 2002. Available online: http://lycy.hebei.gov.cn/article_988.html (accessed on 21 May 2026).

Disclaimer/Publisher’s Note: The statements, opinions and data contained in all publications are solely those of the individual author(s) and contributor(s) and not of MDPI and/or the editor(s). MDPI and/or the editor(s) disclaim responsibility for any injury to people or property resulting from any ideas, methods, instructions or products referred to in the content. |
© 2026 by the authors. Licensee MDPI, Basel, Switzerland. This article is an open access article distributed under the terms and conditions of the Creative Commons Attribution (CC BY) license.