


Abstract
Drought–flood abrupt alternation (DFAA) has attracted increasing attention because of its severe compound impacts. This study used a daily SWAP index calculated by the precipitation data from 17 meteorological stations in Henan Province from June to September during the period of 1951–2020 to identify and analyze the spatiotemporal evolution of DFAA events. The results show that a drought duration of 10 d, together with a transition interval and a flood duration of 7 d, has a relatively good applicability for identifying DFAA events in Henan Province. The identified DFAA events were generally consistent with historical disaster records. DFAA events were characterized by slight decreasing trends in frequency and duration, with no obvious trend in intensity. The mean annual frequency, mean intensity, and mean duration of drought-to-flood (DTF) events were 2.19 events, 1.09, and 66.33 d, respectively, whereas those of flood-to-drought (FTD) events were 1.36 events, 0.36, and 73.82 d, respectively. Spatially, the distributions of DTF and FTD events exhibit distinct differences in their characteristics of frequency, intensity, and duration. Although the identification results obtained are based on precipitation as a single meteorological factor, the findings may provide a scientific basis for improving the understanding of DFAA evolution in the short term and enhancing regional disaster risk management in Henan Province, China.
1. Introduction
Against the backdrop of climate change, the global hydrological cycle is becoming increasingly unstable and unpredictable, and compound disaster events triggered by droughts, floods, and their rapid alternation are occurring more frequently [1,2]. In general, drought–flood abrupt alternation (DFAA) refers to a compound event formed by the rapid transition between drought and flood, mainly including two types: drought to flood (DTF) and flood to drought (FTD) [3,4]. Compared with individual drought or flood events, DFAA usually causes more severe disaster impacts and may further aggravate adverse consequences such as agricultural yield reduction, urban waterlogging, landslides, and water-quality deterioration [5]. In the summer of 2023, North China experienced below-normal precipitation in the early period, resulting in varying degrees of drought. Continuous heavy rainfall in early August rapidly alleviated the antecedent drought and led to pronounced DFAA events across many areas. This DFAA event caused 107 deaths or missing persons, led to the emergency evacuation and resettlement of 1.434 million people and resulted in direct economic losses of RMB 165.79 billion [6].
DFAA processes are usually characterized by abrupt onset, rapid stage transitions, and compounded disaster impacts, making their identification and characterization relatively complex. However, no fully unified standard has yet been established for the identification of DFAA events in meteorology and hydrology. At present, the identification methods for DFAA events can generally be divided into two categories. One is the threshold-based method, in which thresholds are directly defined according to meteorological or hydrological variables and their corresponding climatic indices to determine the occurrence periods of drought or flood, and adjacent drought and flood stages are then identified as DFAA events [7,8,9]. This method is usually based on process variables such as daily precipitation and daily runoff, and event identification is achieved by setting thresholds for transitions between dry and wet states [10,11]. It has the advantages of being intuitive, simple, and easy to apply, but its results are somewhat subjective and its ability to characterize abruptness and complex evolution processes is relatively limited. The other is the index-based method, in which DFAA indices are constructed to quantitatively describe event type, transition intensity, and the characteristics of the abrupt alternation process [12,13,14]. Compared with the threshold-based method, the index-based method can describe the transition between drought and flood states under a unified framework, thereby reducing, to some extent, the subjectivity associated with single-threshold judgments. Existing indices mainly include the Long-cycle Drought–Flood Abrupt Alternation Index (LDFAI) [15], the Short-cycle Drought–Flood Abrupt Alternation Index (SDFAI) [16], the Daily Wetness–Dryness Abrupt Alternation Index (DWAAI) [17], and the Multi-scale Standardized Drought–Flood Abrupt Alternation Index (MSDFAI) [18]. These indices are mostly developed from drought and flood indices such as SPI and SPEI, and they classify DFAA events into different categories by comparing index values with the corresponding thresholds [3]. However, it is important to note that different drought–flood indices may yield varying results in the identification of DFAA events [19]. Among them, the multi-temporal monitoring capability of the Standardized Weighted Average Precipitation (SWAP) index enables comprehensive assessment of conditions before and after DFAA events by accounting for the cumulative and decaying effects of antecedent precipitation [20,21]. Fu et al. [22] validated SPI, SPEI and SWAP indices for DFAA detection and identified SWAP as the most effective indicator. Some studies have applied daily-scale SWAP to the identification of DFAA events, and the results indicate that this index performs well in characterizing precipitation evolution processes and identifying drought–flood transitions in river basins and regions across China and other countries [23,24]. With its notable strengths, the daily-scale SWAP index is employed in this research to identify DFAA events.
Henan Province is located in the transition zone between humid and semi-humid monsoon climates. Precipitation is unevenly distributed in both time and space, and drought and flood events occur frequently [25]. According to statistics, during the DFAA events that occurred in Henan Province in 2024, more than 72,000 people were affected in Sui County, Shangqiu City, with 1.13 million hectares of crops damaged across the province and direct economic losses reaching RMB 47.5902 million [26]. Although previous studies have made some progress in the analysis of typical cases and the characterization of drought–flood variations at the monthly scale [27,28], there are few studies on short-term DFAA events. Meanwhile, drought and flood identification parameters and transition-interval days are still largely determined empirically, and their regional applicability and rationality have not been fully discussed. In addition, systematic validation of identification results remains relatively insufficient.
To address these gaps, the present study used a daily SWAP index calculated from precipitation data at 17 meteorological stations in Henan Province from June to September during the period of 1951–2020 to identify and analyze the spatiotemporal evolution of DFAA events. The objectives are to (1) determine appropriate identification parameters for identifying DFAA events in Henan Province, (2) validate the applicability of the identification method by selecting typical DFAA events in combination with historical disaster records, and (3) analyze the spatiotemporal characteristics of the frequency, intensity, and duration of DTF and FTD events during the period of 1951–2020. The findings may provide a scientific basis for improving the understanding of DFAA evolution and enhancing regional disaster risk management in Henan Province, China.
2. Data and Methods
2.1. Study Area
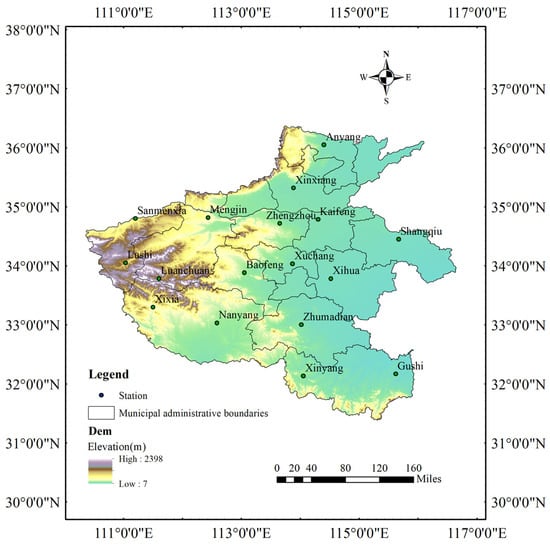
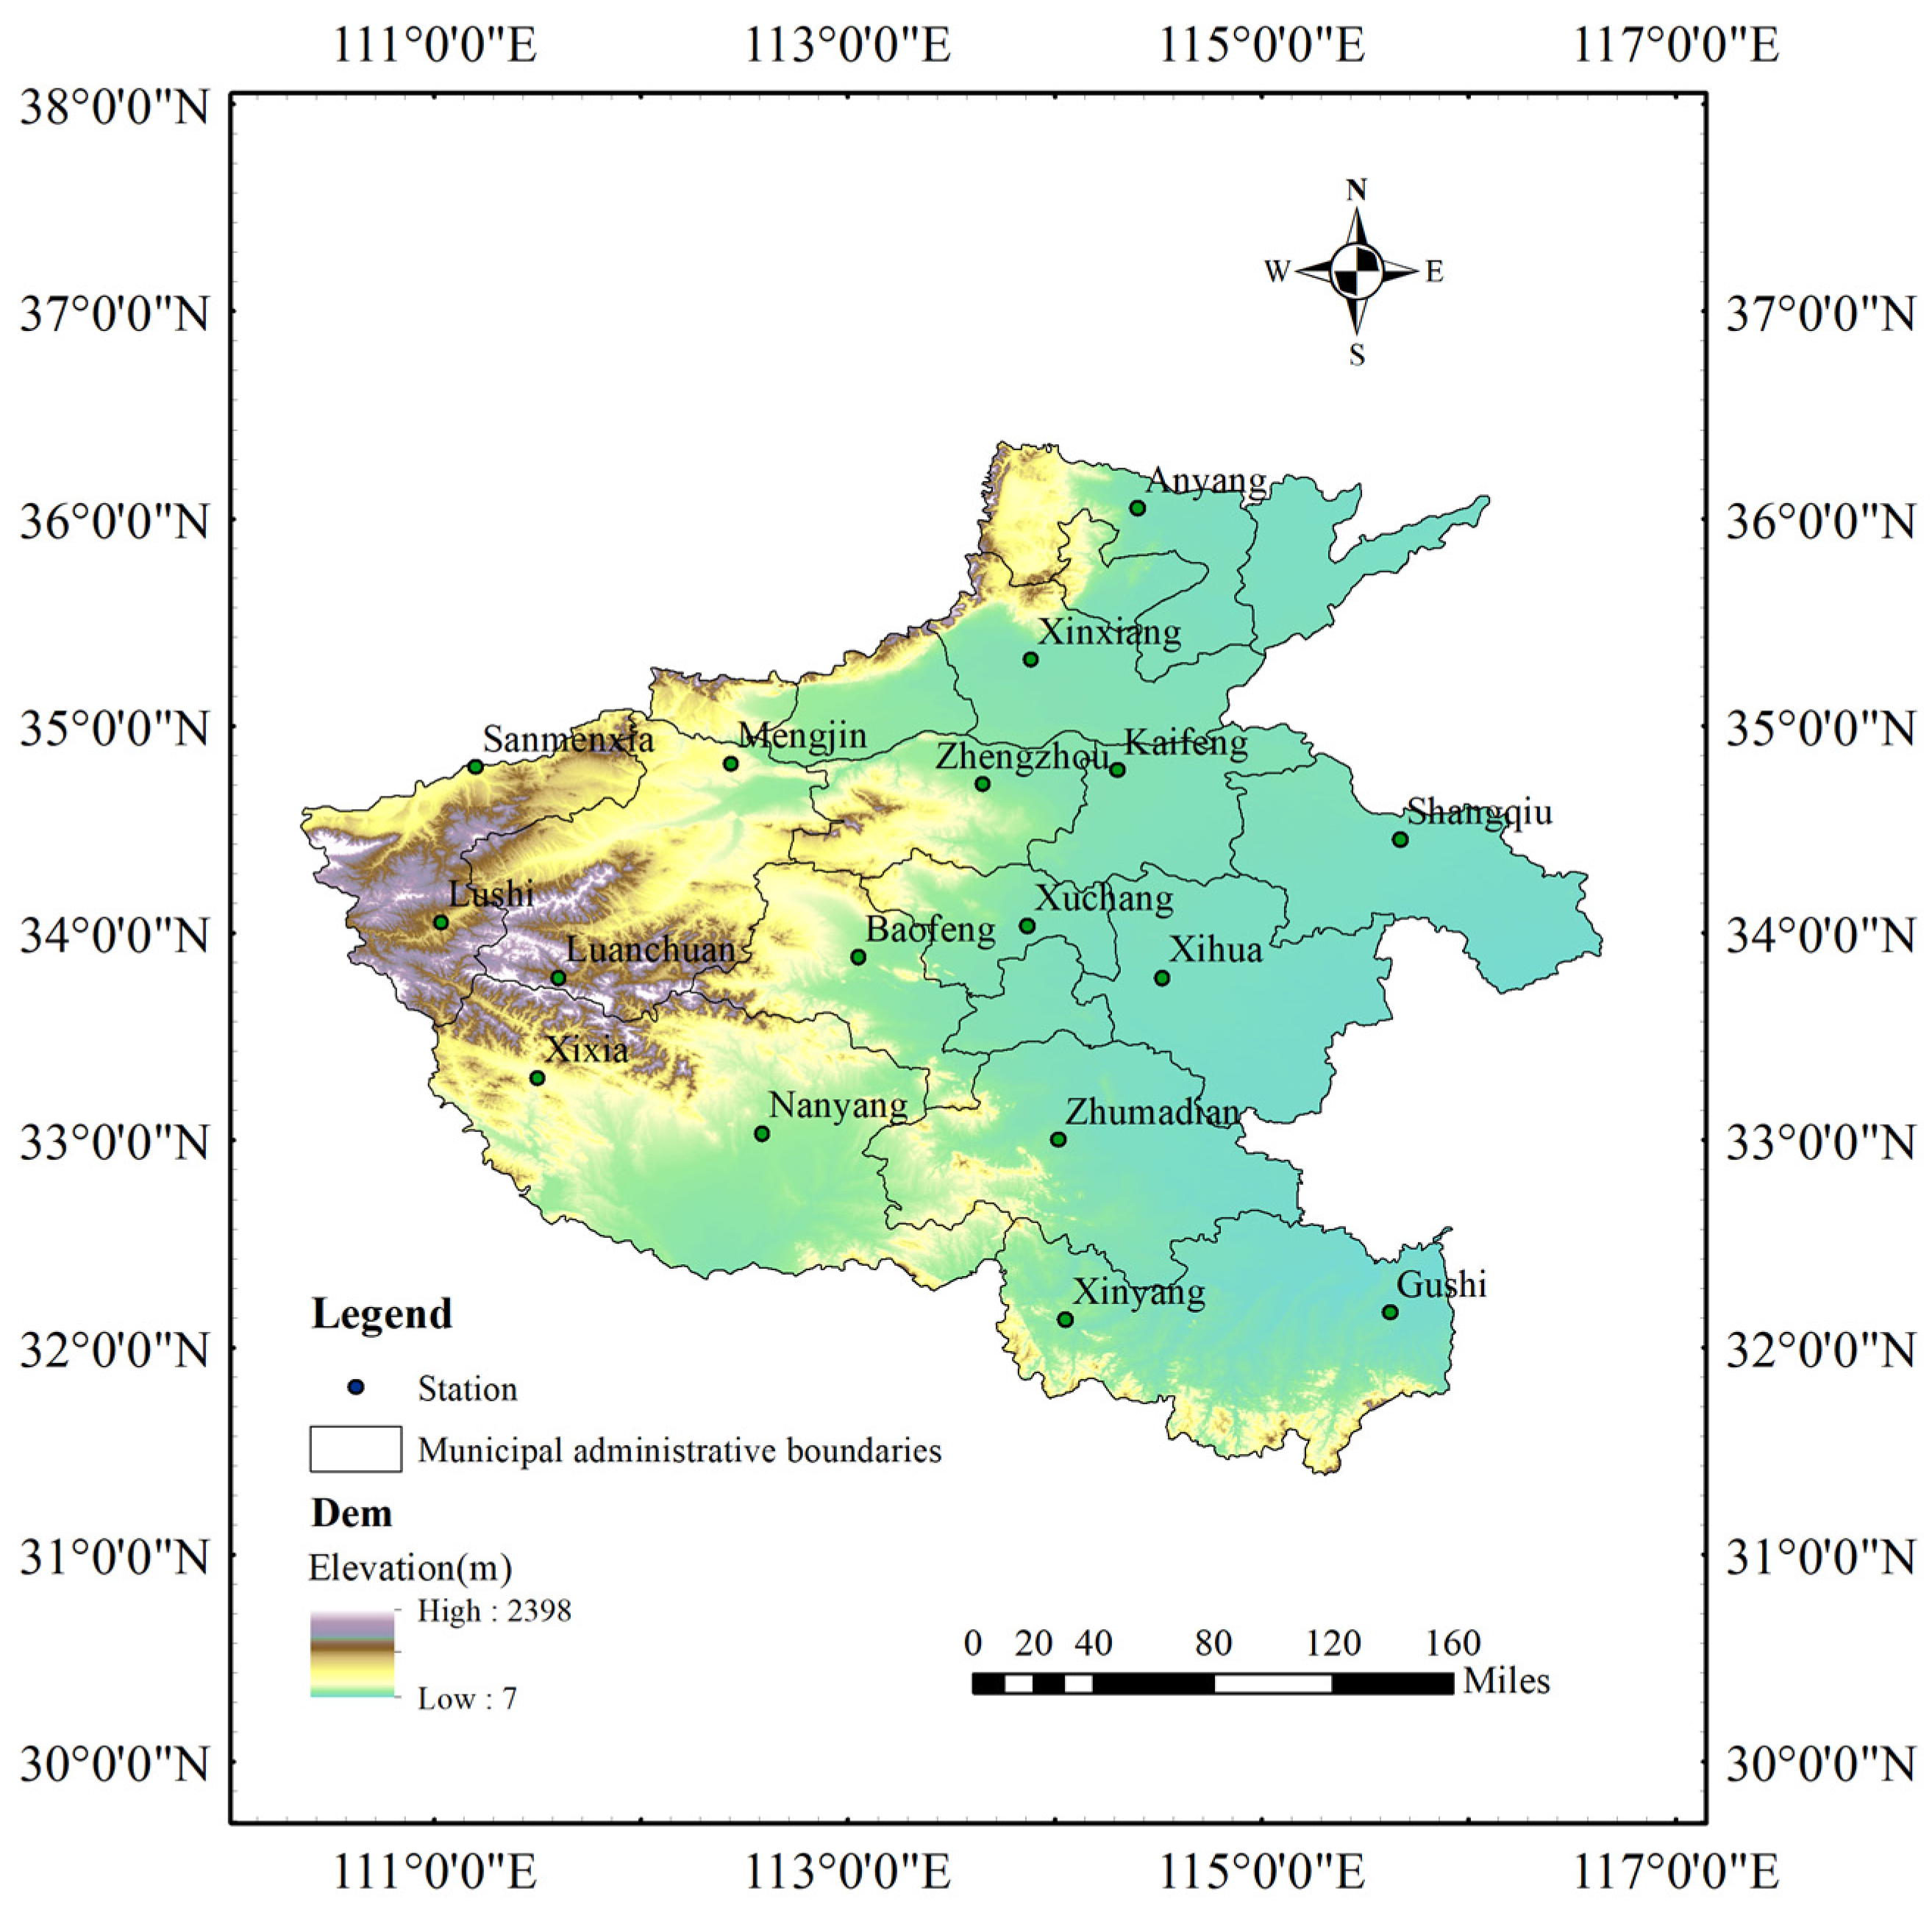
The study area (110°21′–116°39′ E, 31°23′–36°22′ N) is located mainly in the southern part of the North China Plain and covers a total area of 165,500 km2. The Qinling Mountains–Huaihe River line crosses the study area. The annual mean temperature ranges from 10 to 17 °C, and the annual precipitation ranges from 400 to 1300 mm. Figure 1 illustrates the geographical location of the study area and the spatial distribution of the selected meteorological stations.
Figure 1.
Geographical location and the selected meteorological stations.
2.2. Data
Daily precipitation records from 17 basic meteorological stations in Henan Province during 1951–2020 were obtained from the Daily Surface Climate Dataset of China (version 3.0) through the China Meteorological Data Service Centre (https://data.cma.cn). The observations were subjected to strict quality control and homogenization procedures. Basic information of the selected meteorological stations is summarized in Table 1.
Table 1.
Distribution of meteorological stations in Henan Province.
Historical records used to validate the identified DFAA events were mainly compiled from the Encyclopedia of Meteorological Disasters in China, China Flood and Drought Disaster Prevention Bulletin, China Water Resources Bulletin, Historical Droughts in China and Henan Water Resources Bulletin.
2.3. Identification of Drought and Flood Events Based on the SWAP Index
A daily-scale SWAP series is constructed by standardizing weighted average precipitation (WAP). The WAP series is calculated from the daily precipitation and comprehensively accounts for the precipitation on the target day, the cumulative contribution of antecedent precipitation, and their temporally decaying effect. The calculation formula for WAP is expressed as follows:
where Pn denotes the daily precipitation occurring n days before the target day, with n = 0 representing the precipitation on the day being evaluated; ωn is the weighting coefficient assigned to Pn; α is the decay coefficient describing the influence of antecedent precipitation; and N is the number of antecedent days considered. In general, α = 0.9 and N = 44 are adopted [20,29].
WAP series reflect only the relative drought–flood condition at a specific site or within a given region. Therefore, the multiyear WAP series for the same calendar day is further fitted to a Gamma distribution and transformed into a standard normal distribution to derive the SWAP index. For each station and each calendar day from June to September, the fitting performance of the Gamma distribution was assessed by using the Kolmogorov–Smirnov (KS), Anderson–Darling (AD), and chi-square tests [30,31].
The SWAP index can be computed by the following formula:
where β and γ are the scale and shape parameters of the Gamma distribution, respectively, and both are greater than 0. Compared with WAP series, SWAP series have a unified statistical scale, which facilitates comparisons of dry–wet anomalies across different regions and time periods. In general, a SWAP value of less than 0 indicates relatively dry conditions, while a SWAP value greater than 0 indicates relatively wet conditions. Moreover, a larger absolute SWAP value indicates a stronger dry–wet anomaly. The daily drought/flood condition was determined according to the drought–flood classification criteria [32] (Table 2).
Table 2.
Drought–flood classification criteria based on the SWAP index.
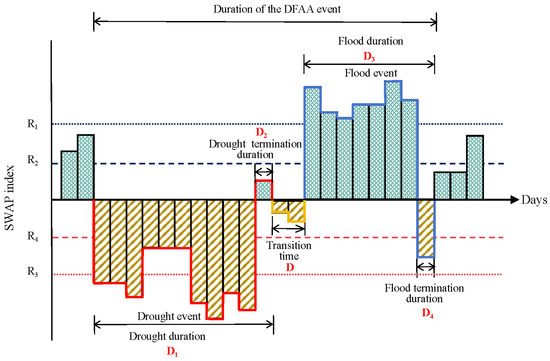
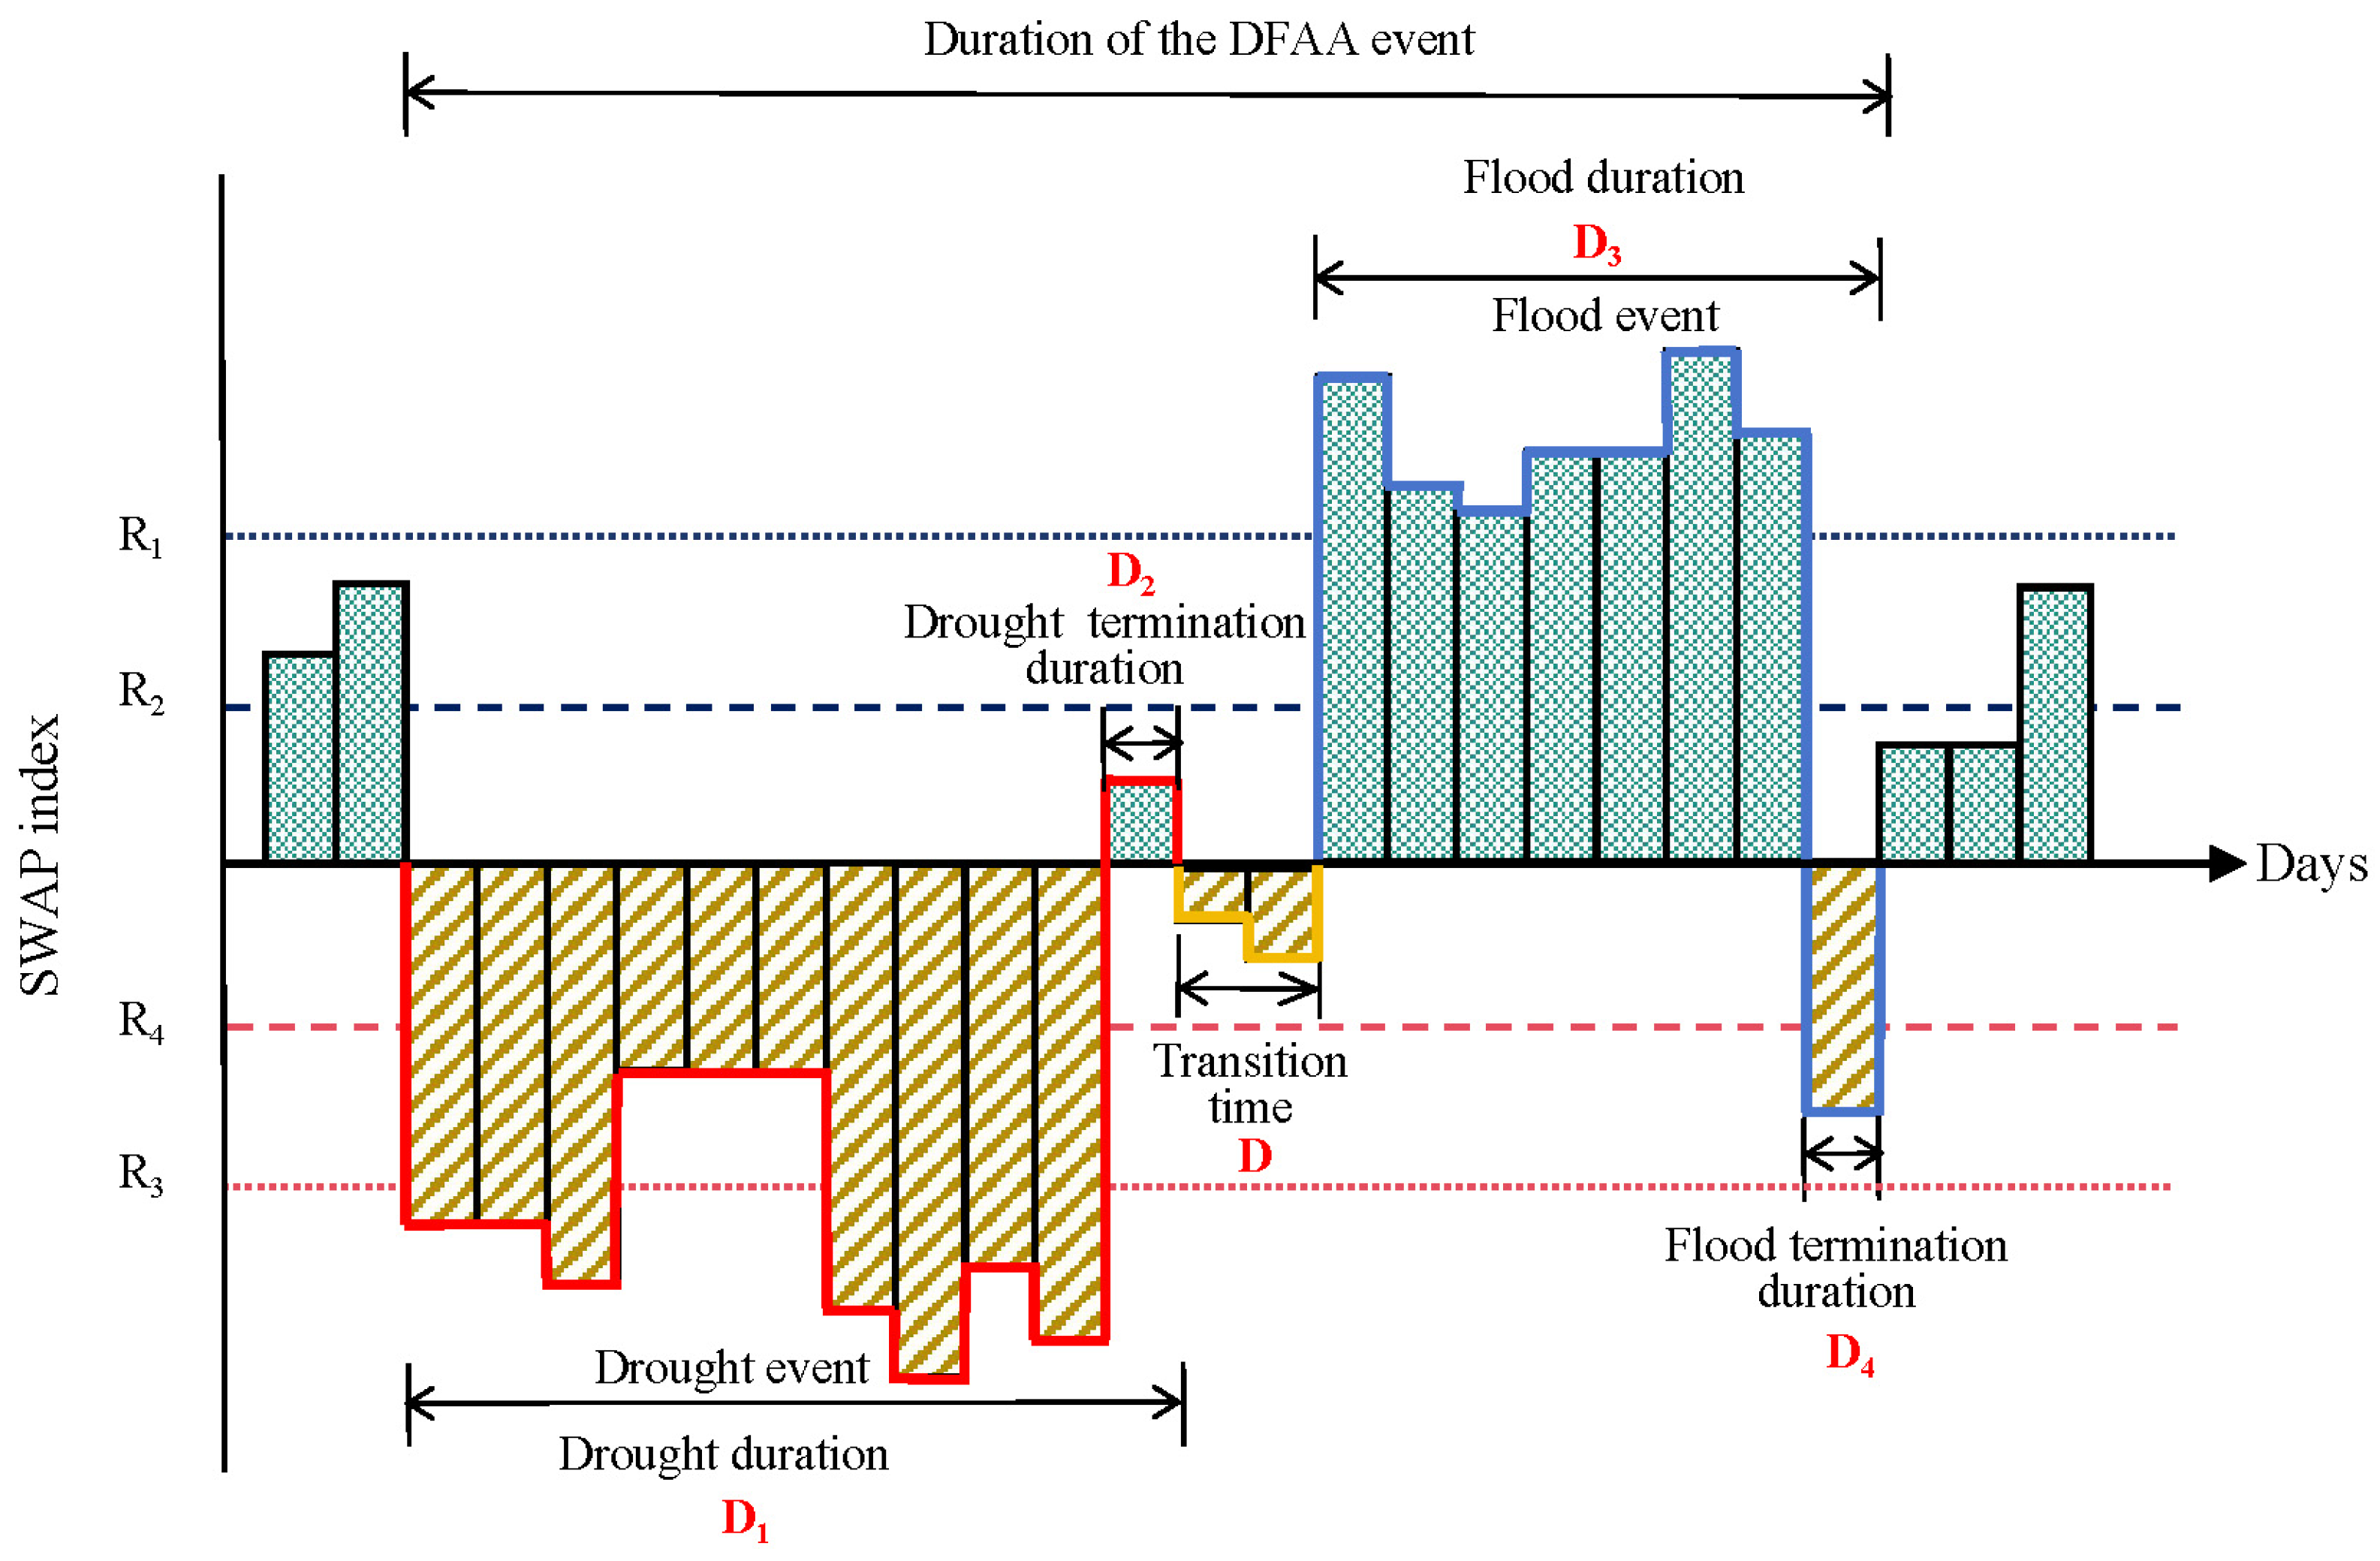
After the daily SWAP series was obtained, the theory of runs was employed to identify drought and flood events. The theory of runs is an event-detection method based on extracting consecutive abnormal segments from a time series, and it can be used to determine the onset time, termination time, duration, and intensity of drought and flood events [33]. Based on the SWAP index and its classification criteria, individual drought and flood events were first identified. As shown in Figure 2, R1 and R2 were set to 1 and 0.5, respectively, as the truncation levels for flood identification, whereas R3 and R4 were set to −1 and −0.5, respectively, for drought identification. A flood event was considered to begin when the drought–flood index remained continuously above R1 for D3 days over one or more periods, and to end when it remained continuously below R2 for D4 days. Correspondingly, a drought event was considered to begin when the drought–flood index remained continuously below R3 for D1 days over one or more periods, and to end when it remained continuously above R4 for D2 days.
Figure 2.
Schematic diagram of drought–flood event identification.
Previous studies have shown that in SWAP-based drought identification, a drought identification duration of 10 d can better reflect actual drought processes [34]. Considering the uneven intra-annual distribution of precipitation in Henan Province and based on comparisons between the identified results and historical disaster records, the drought identification duration in this study was fixed at 10 d. On this basis, the DFAA interval parameter D was set to 3, 5, 7, and 10 d, respectively, and the flood identification duration D3 was set to 5–9 d for applicability analysis under different parameter combinations.
2.4. Identification of DFAA Events
Based on the drought and flood events identified from the SWAP index, a DTF/FTD event was defined when a drought/flood event was followed by a flood/drought event, and the interval between the end of the former event and the onset of the latter event was less than D days (Figure 2). The start time of the DFAA event was defined as the onset time of the preceding drought/flood event, and the end time was defined as the termination time of the subsequent flood/drought event. The abrupt alternation intensity was calculated as follows:
where and denote the sums of the SWAP values over the D days after and before the abrupt alternation point, respectively. A larger intensity value indicates a more intense dry–wet transition and a more pronounced DFAA characteristic.
To evaluate the applicability of the above identification method for screening DFAA events and quantifying their intensity in Henan Province, typical stations and representative events were selected for validation. The duration, frequency, and intensity of the identified DFAA events were then compared with historical disaster records.
2.5. Trend Analysis
The Mann–Kendall (MK) non-parametric test [35] and Sen’s slope estimator [36] were used to assess the significance and magnitude of temporal changes in the annual frequency, intensity, and duration series of DTF and FTD events, respectively. A significance level of 0.05 was adopted, and changes with p > 0.05 were interpreted as statistically insignificant tendencies rather than significant trends. To reduce the possible influence of serial correlation on the MK test, lag-1 autocorrelation was examined [37], and the trend-free pre-whitening procedure was applied when significant lag-1 autocorrelation was detected.
3. Results
3.1. Validation of DFAA Event Identification
3.1.1. Goodness-of-Fit Assessment of the Gamma Distribution
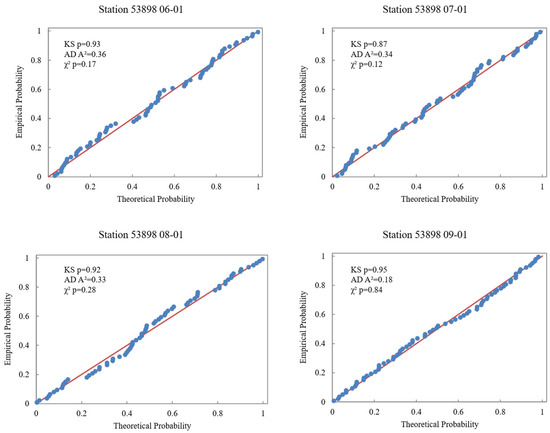
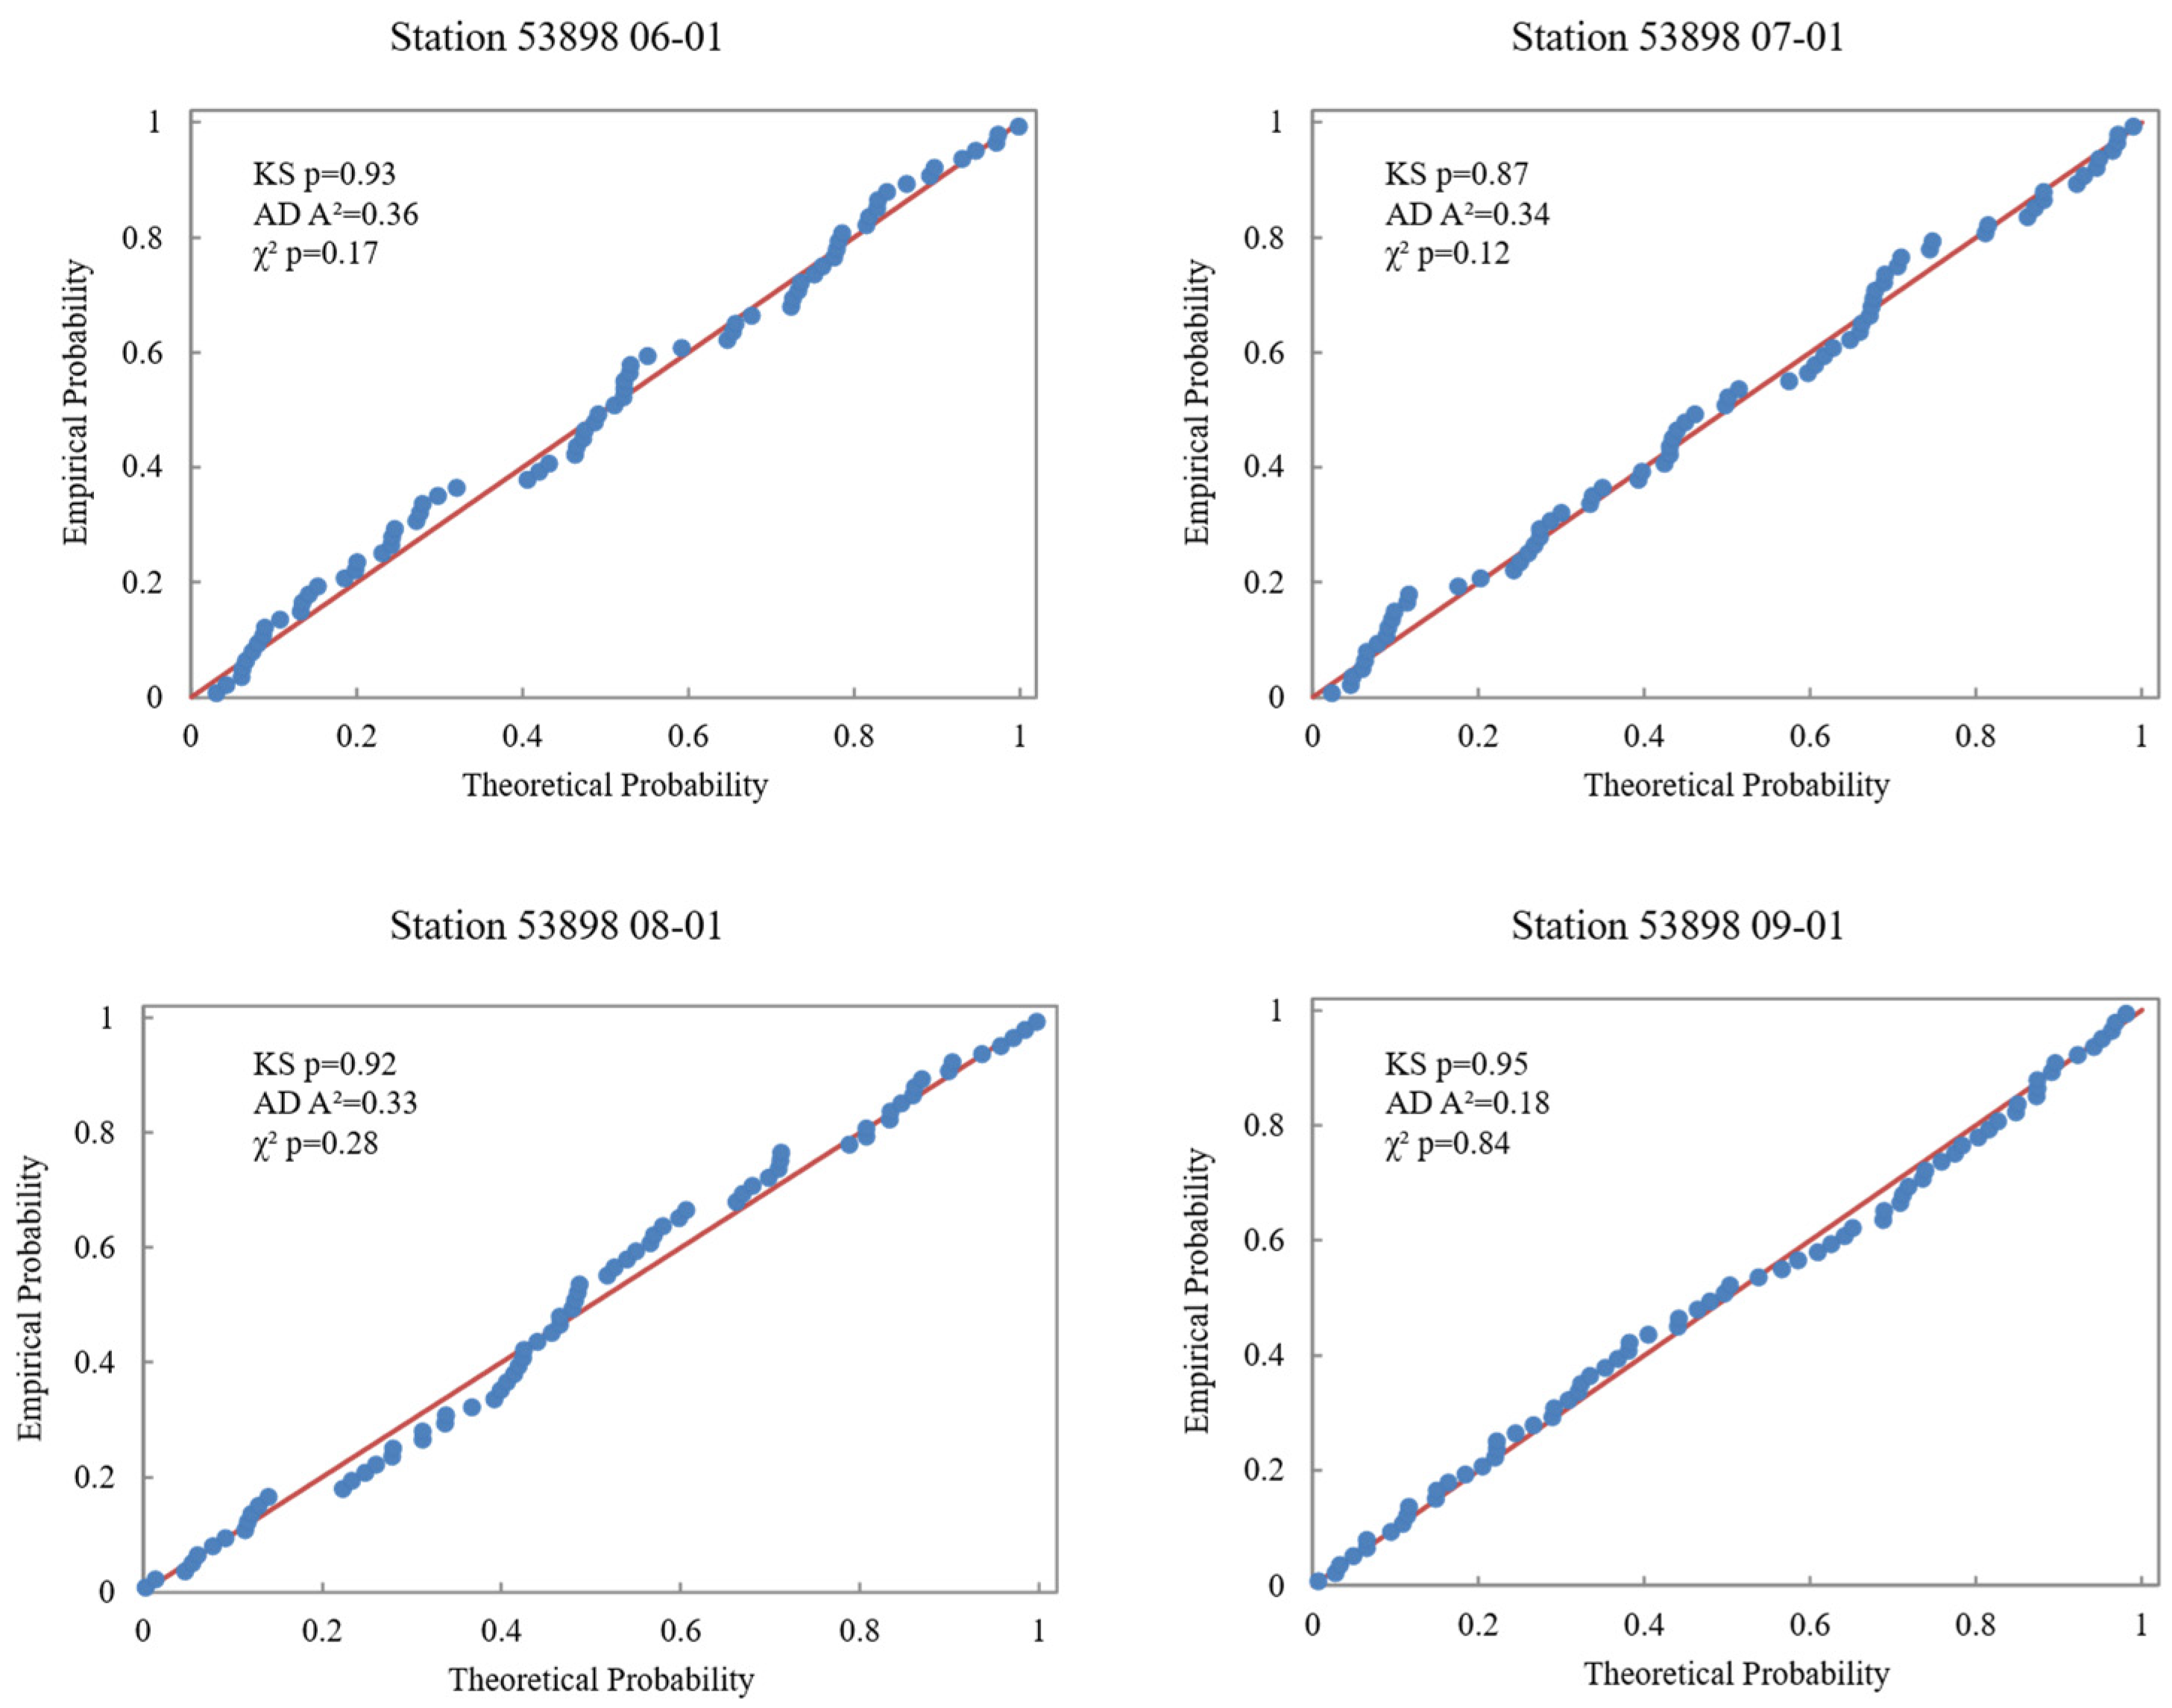
Before identifying drought, flood, and DFAA events, the goodness of fit of the Gamma distribution used for WAP standardization was evaluated. A station–calendar day sample was considered to pass the goodness-of-fit assessment only when it satisfied the criteria of the KS, AD, and chi-square tests simultaneously [25,38]. Figure 3 compares the empirical distributions of WAP samples with the fitted Gamma distributions for four typical calendar days at Anyang station. The empirical distributions of WAP samples for the four calendar days generally agreed well with the fitted Gamma curves. The detailed goodness-of-fit statistics for all stations are summarized in Table 3. As shown in Table 3, at the 0.05 significance level, among the 2074 station–calendar day samples, 1933 passed the goodness-of-fit assessment, corresponding to an overall pass rate of approximately 93.2%. Most stations had pass rates above 0.90, indicating generally good fitting performance. Mengjin and Nanyang had the highest pass rates, both reaching 0.98. In contrast, Lushi and Luanchuan had relatively lower pass rates of 0.79 and 0.86, respectively. These results indicate that the WAP series is basically consistent with the Gamma distribution assumption during the period of June–September in Henan Province.
Figure 3.
Comparison between the empirical distribution of WAP and the theoretical Gamma distribution for typical calendar days at Anyang station.
Table 3.
Goodness-of-fit test statistics.
3.1.2. Determination of the Identification Parameter
The DFAA identification results under different parameter settings are presented in Table 4. As shown in Table 4, the total number of identified DFAA events generally increased with increasing interval parameters, while it generally decreased with increasing flood identification duration, indicating that the identification results are markedly affected by the parameter combinations. When both the DFAA interval parameter and the flood identification duration were set to 7 d, a total of 153 DTF events and 95 FTD events were identified, yielding 248 events, which can better capture the characteristics of DFAA events in the study area through comparison with historical records [39]. Therefore, the drought identification duration was ultimately determined to be 10 d, whereas both the interval parameter and the flood identification duration were set to 7 d.
Table 4.
Identification results of DFAA events under different parameter settings.
3.1.3. DTF Applicability Validation
To validate the reliability of the identified DFAA events, Zhengzhou and Sanmenxia stations were selected as representative stations, mainly because both stations have relatively complete historical disaster records. The identified DFAA events were compared with historical records in terms of the start and end dates, drought intensity, and flood intensity to evaluate whether the identified events were consistent with the documented drought–flood transition processes and thereby verify the reliability of the identification method. The intensity of drought and flood events (DI and FI) is defined as the mean SWAP value during the corresponding event period. Since SWAP values during drought events are generally negative, the absolute value of the mean SWAP was used to represent drought intensity, allowing direct comparison with flood intensity.
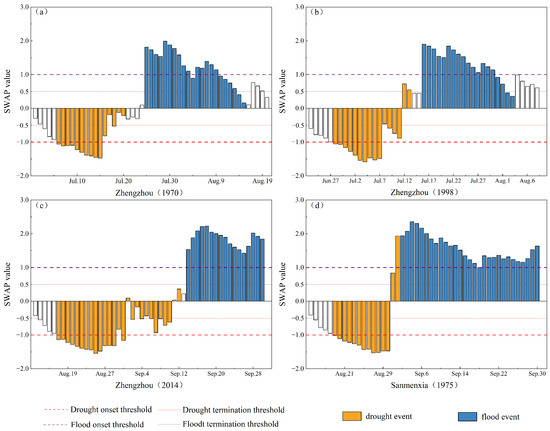
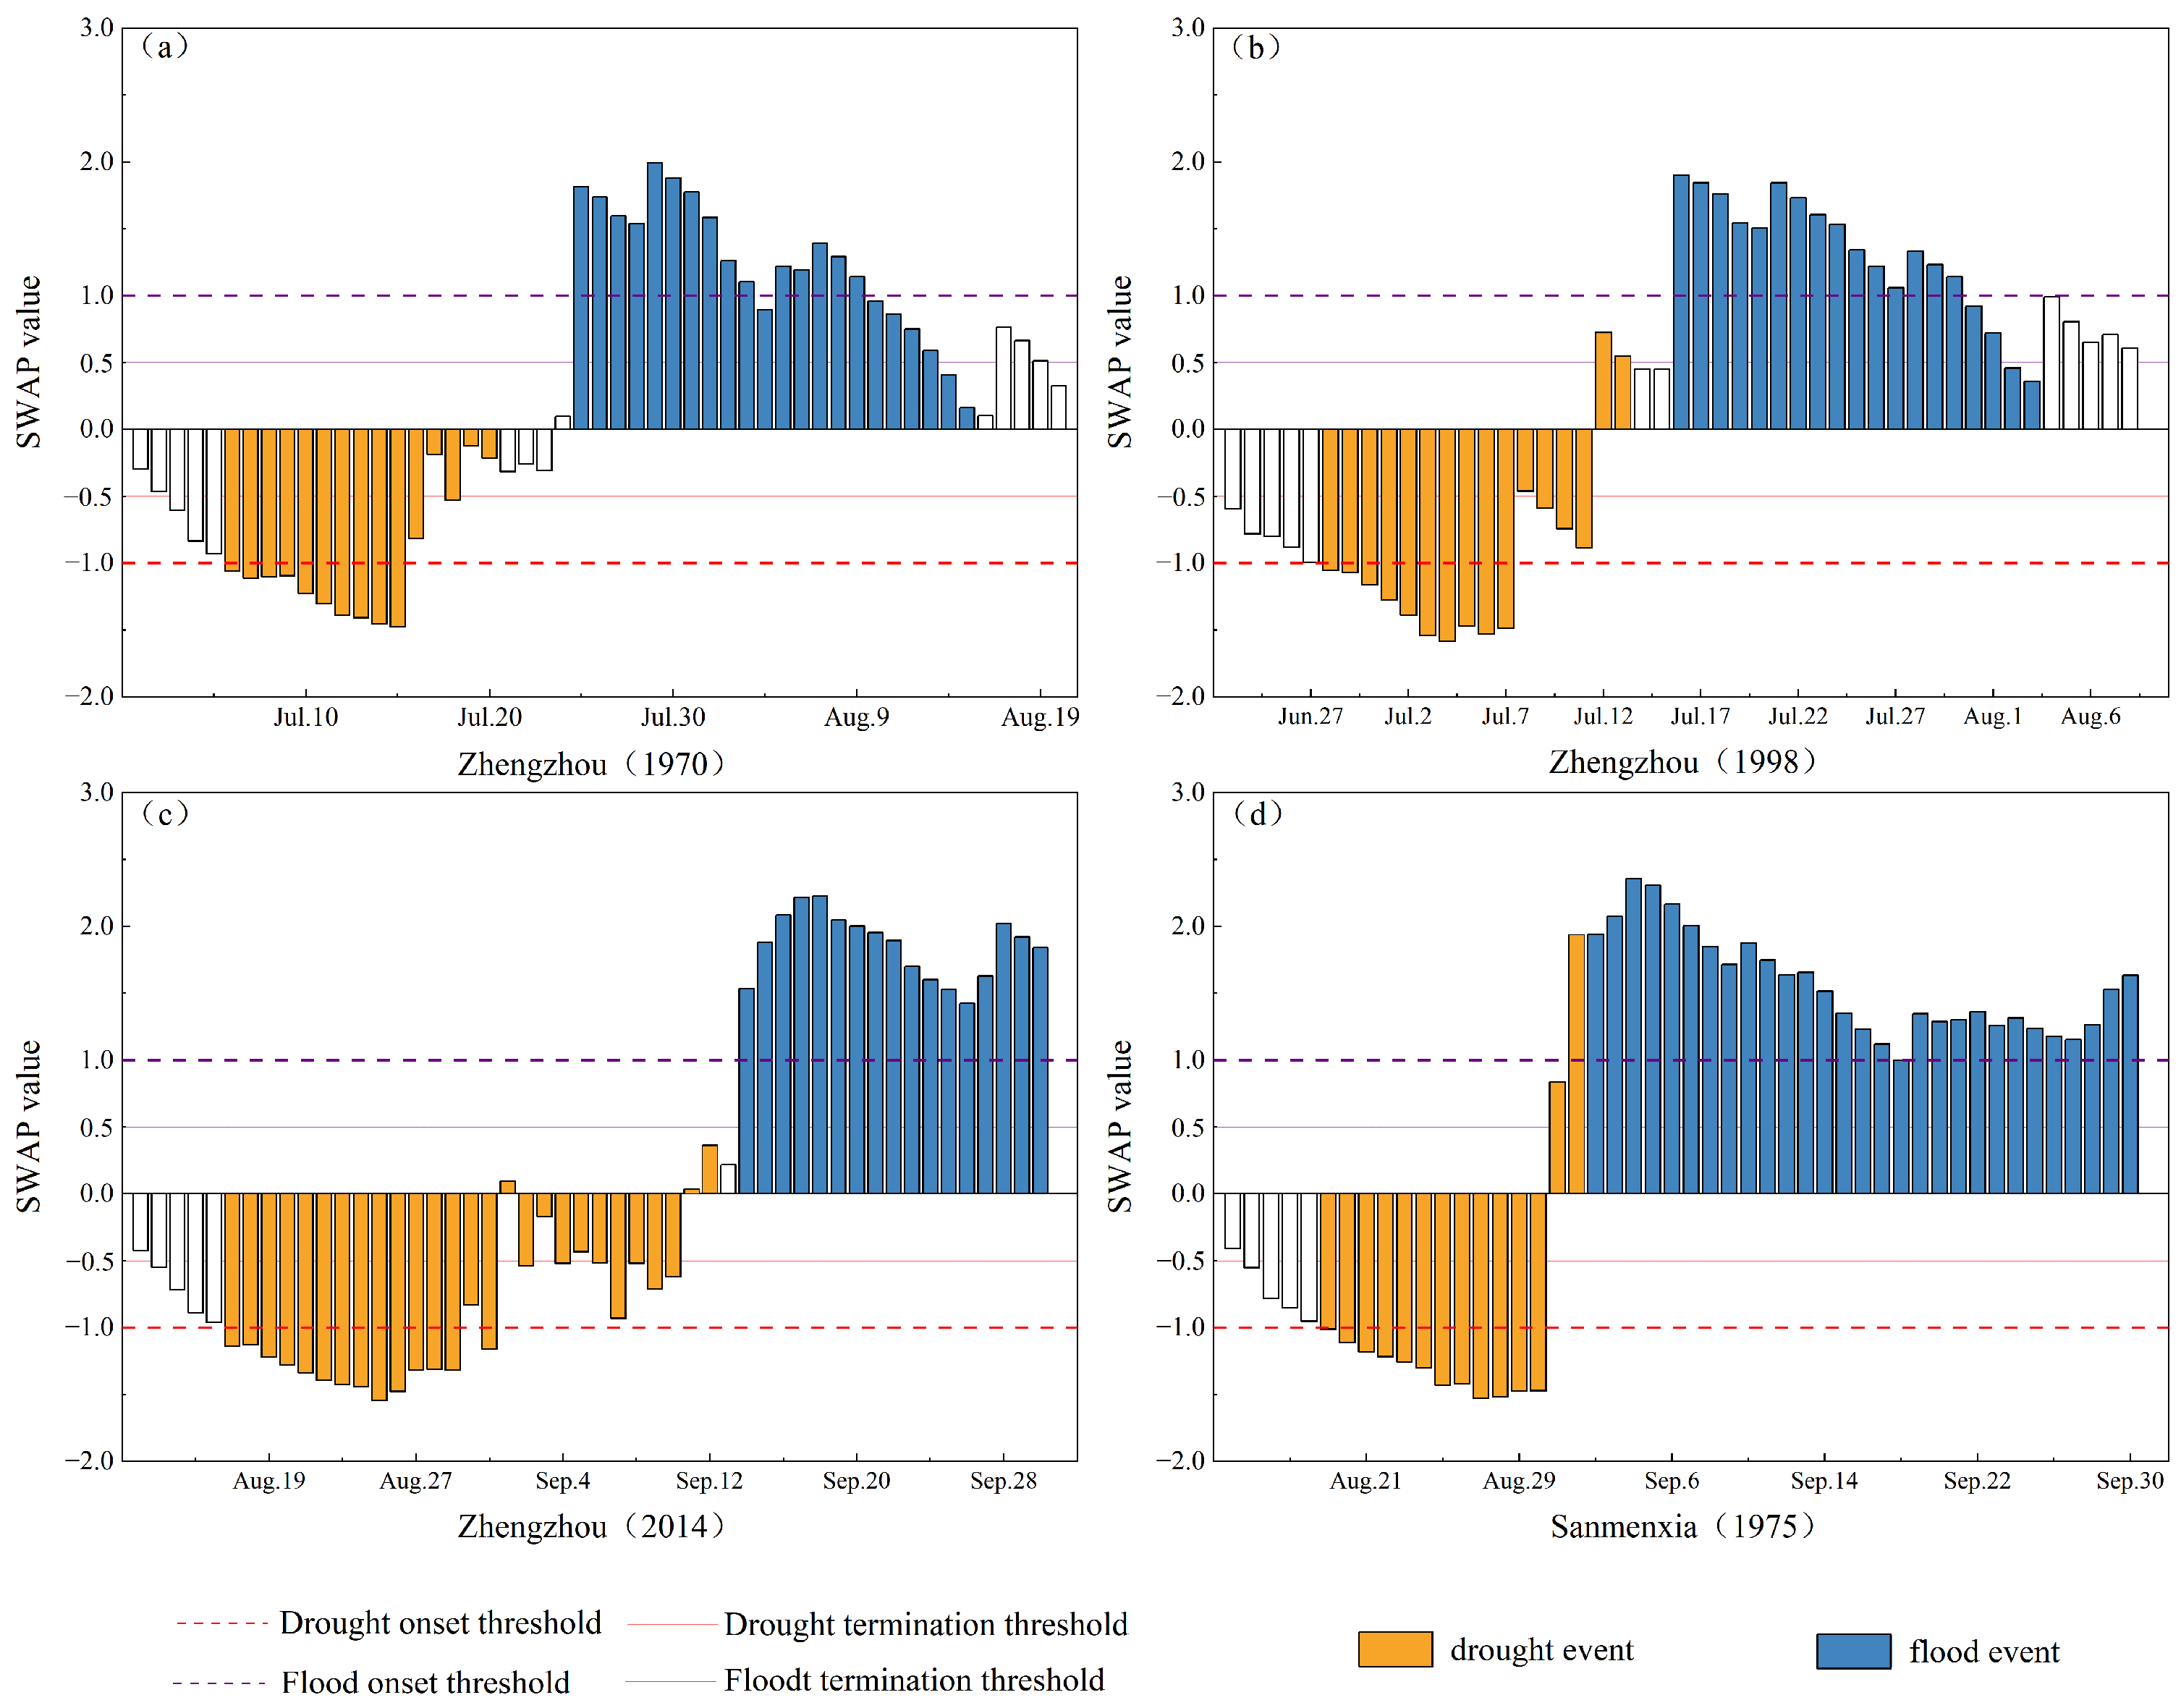
Figure 4 shows the SWAP evolution processes of the identified DTF events, and the corresponding event dates and intensity characteristics are presented in Table 5. At Zhengzhou station, for the 1970 DTF event, the DI and FI values were 1.02 and 1.28, respectively, corresponding to the historical process that a relatively severe water shortage occurred in Zhengzhou in 1970, and an abrupt rainfall event in late July alleviated the drought and shifted the station toward a mildly wet condition. This event clearly reflected a pronounced transition from persistent drought to rapid flooding. The 1998 DTF event had a DI of 1.03 and an FI of 1.37, suggesting that both the antecedent drought and subsequent wet stage were relatively evident, with the wet stage being stronger, corresponding to the historical disaster process in which heavy rainfall reoccurred after the drought in mid-July. For the 2014 DTF event, the DI and FI values were 0.93 and 1.85, respectively, which corresponds to the historical record of summer drought in Henan followed by multiple heavy rainfall events in September.
Figure 4.
SWAP evolution processes of typical DTF events at Zhengzhou and Sanmenxia stations: (a) Zhengzhou, 1970; (b) Zhengzhou, 1998; (c) Zhengzhou, 2014; and (d) Sanmenxia, 1975.
At Sanmenxia station, for the 1975 DTF event, around late August, the values of SWAP rapidly shifted from negative to positive values, rose above 1 (Moderate flood) in early September, and remained at a high level thereafter. For this event, the DI and FI values were 1.16 and 1.58, respectively, indicating that both the antecedent drought stage and the subsequent flood stage were relatively evident, with the flood stage being stronger. Historical records show that the “75.8” extreme rainstorm occurred in Henan in 1975. Sanmenxia showed relatively evident antecedent drought in late summer, followed by enhanced precipitation and a transition to a significant flood condition [40]. This is generally consistent with the identified rapid transition from drought to flood from late August through September.
Table 5.
The identified and documented typical DTF events at Zhengzhou and Sanmenxia stations.
3.1.4. FTD Applicability Validation
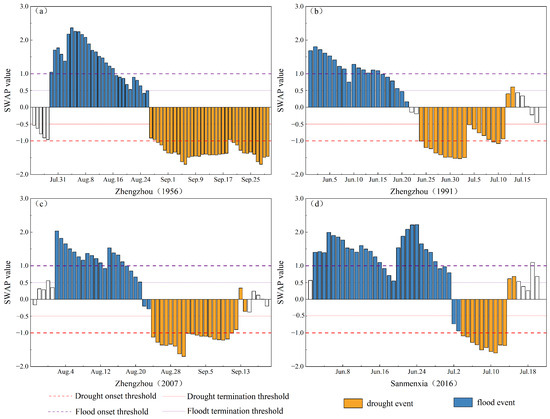
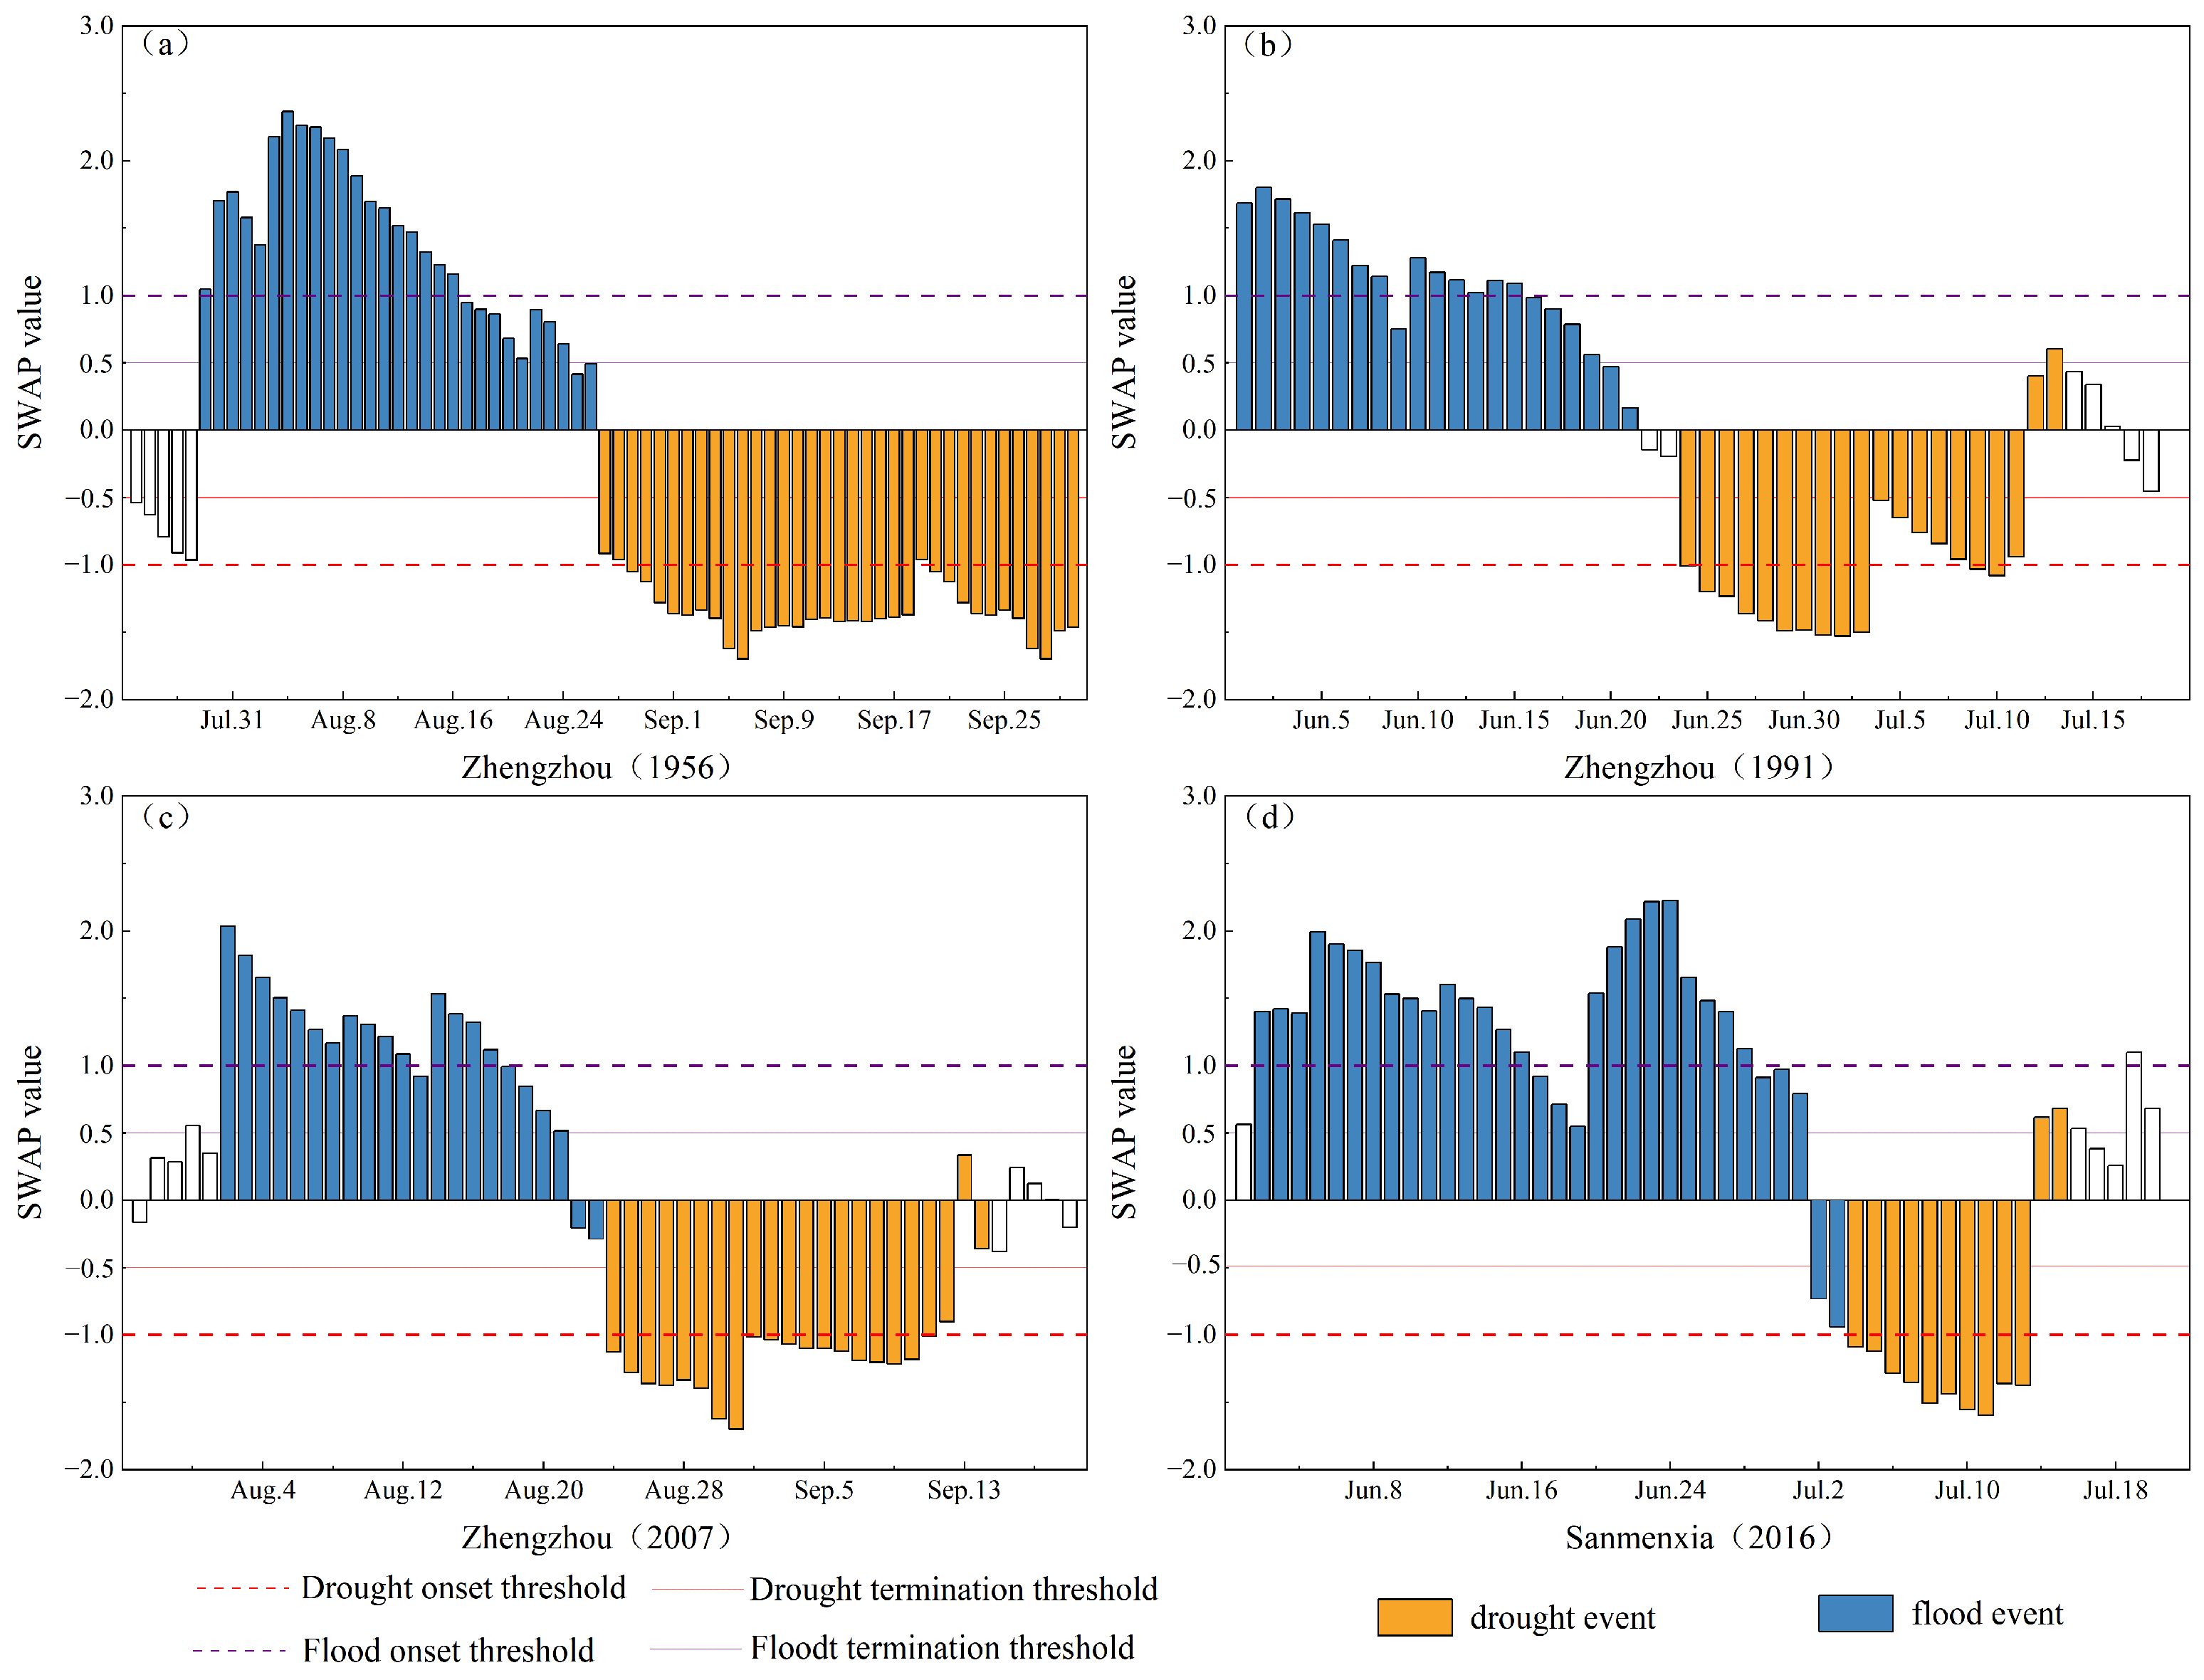
Figure 5 shows the SWAP evolution processes of the identified FTD events, and the corresponding event dates and intensity characteristics are presented in Table 6. At Zhengzhou station, for the 1956 FTD event, the DI and FI values were 1.38 and 1.30, respectively, indicating that the subsequent drought stage and antecedent wet stage were both relatively strong, with the drought stage being slightly stronger. This agrees with the historical record of regional flooding followed by reduced precipitation and a shift toward relatively severe drought in early September. The 1991 FTD event had DI and FI values of 1.06 and 1.17, respectively, suggesting that the wet and dry stages had comparable intensity, with the antecedent wet stage being slightly stronger. This corresponds to the transition from wet conditions during the Meiyu season to drought as precipitation decreased in July. The 2007 FTD event had DI and FI values of 1.14 and 1.19, respectively, indicating comparable intensities between the antecedent wet stage and the subsequent drought stage. This is generally consistent with short-duration heavy rainfall and local waterlogging in August, followed by reduced precipitation after mid-September.
Figure 5.
SWAP evolution processes of typical FTD events at Zhengzhou and Sanmenxia stations: (a) Zhengzhou, 1956; (b) Zhengzhou, 1991; (c) Zhengzhou, 2007; and (d) Sanmenxia, 2016.
At Sanmenxia station, for the FTD event in 2016, the SWAP values remained above 1 (Moderate flood) in the early stage. After early July, the values of SWAP dropped below the drought threshold, indicating that Sanmenxia station shifted from antecedent wet conditions to drought conditions. This event was therefore identified as a typical FTD event. For this event, the DI and FI values were 1.19 and 1.38, respectively, suggesting that both stages were relatively evident, with the antecedent wet stage being slightly stronger than the subsequent drought stage. Wind–hail and flood disasters occurred in many parts of Henan in early June 2016. Sanmenxia was in a wet condition during the early stage; after early July, precipitation weakened and the station shifted to relatively evident drought [44]. The identified FTD process was generally consistent with the historical records.
Overall, the identified DFAA events are generally consistent with the major disaster processes documented in historical records in terms of occurrence time and duration characteristics, indicating that the method has relatively good applicability in Henan Province.
Table 6.
The identified and documented typical FTD events at Zhengzhou and Sanmenxia stations.
3.2. Temporal Variations in DFAA Events
3.2.1. Temporal Variations in DTF Events
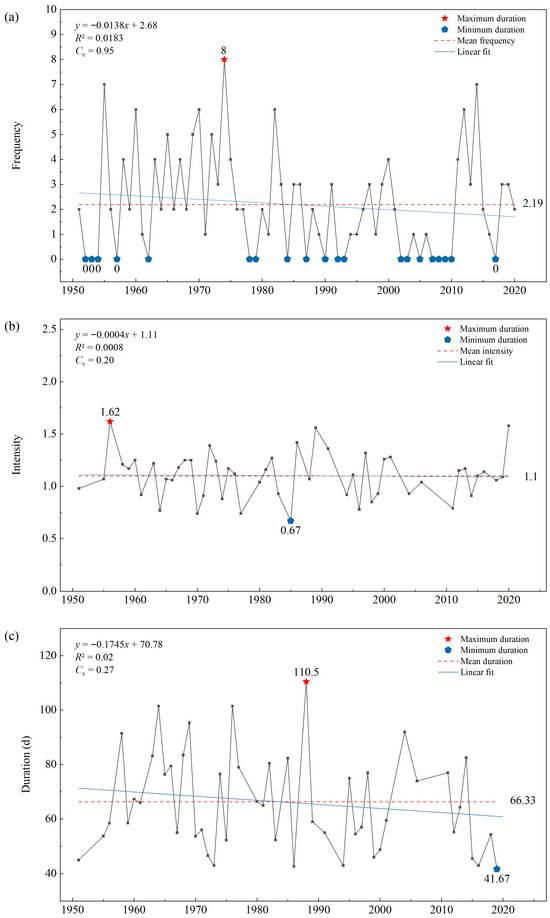
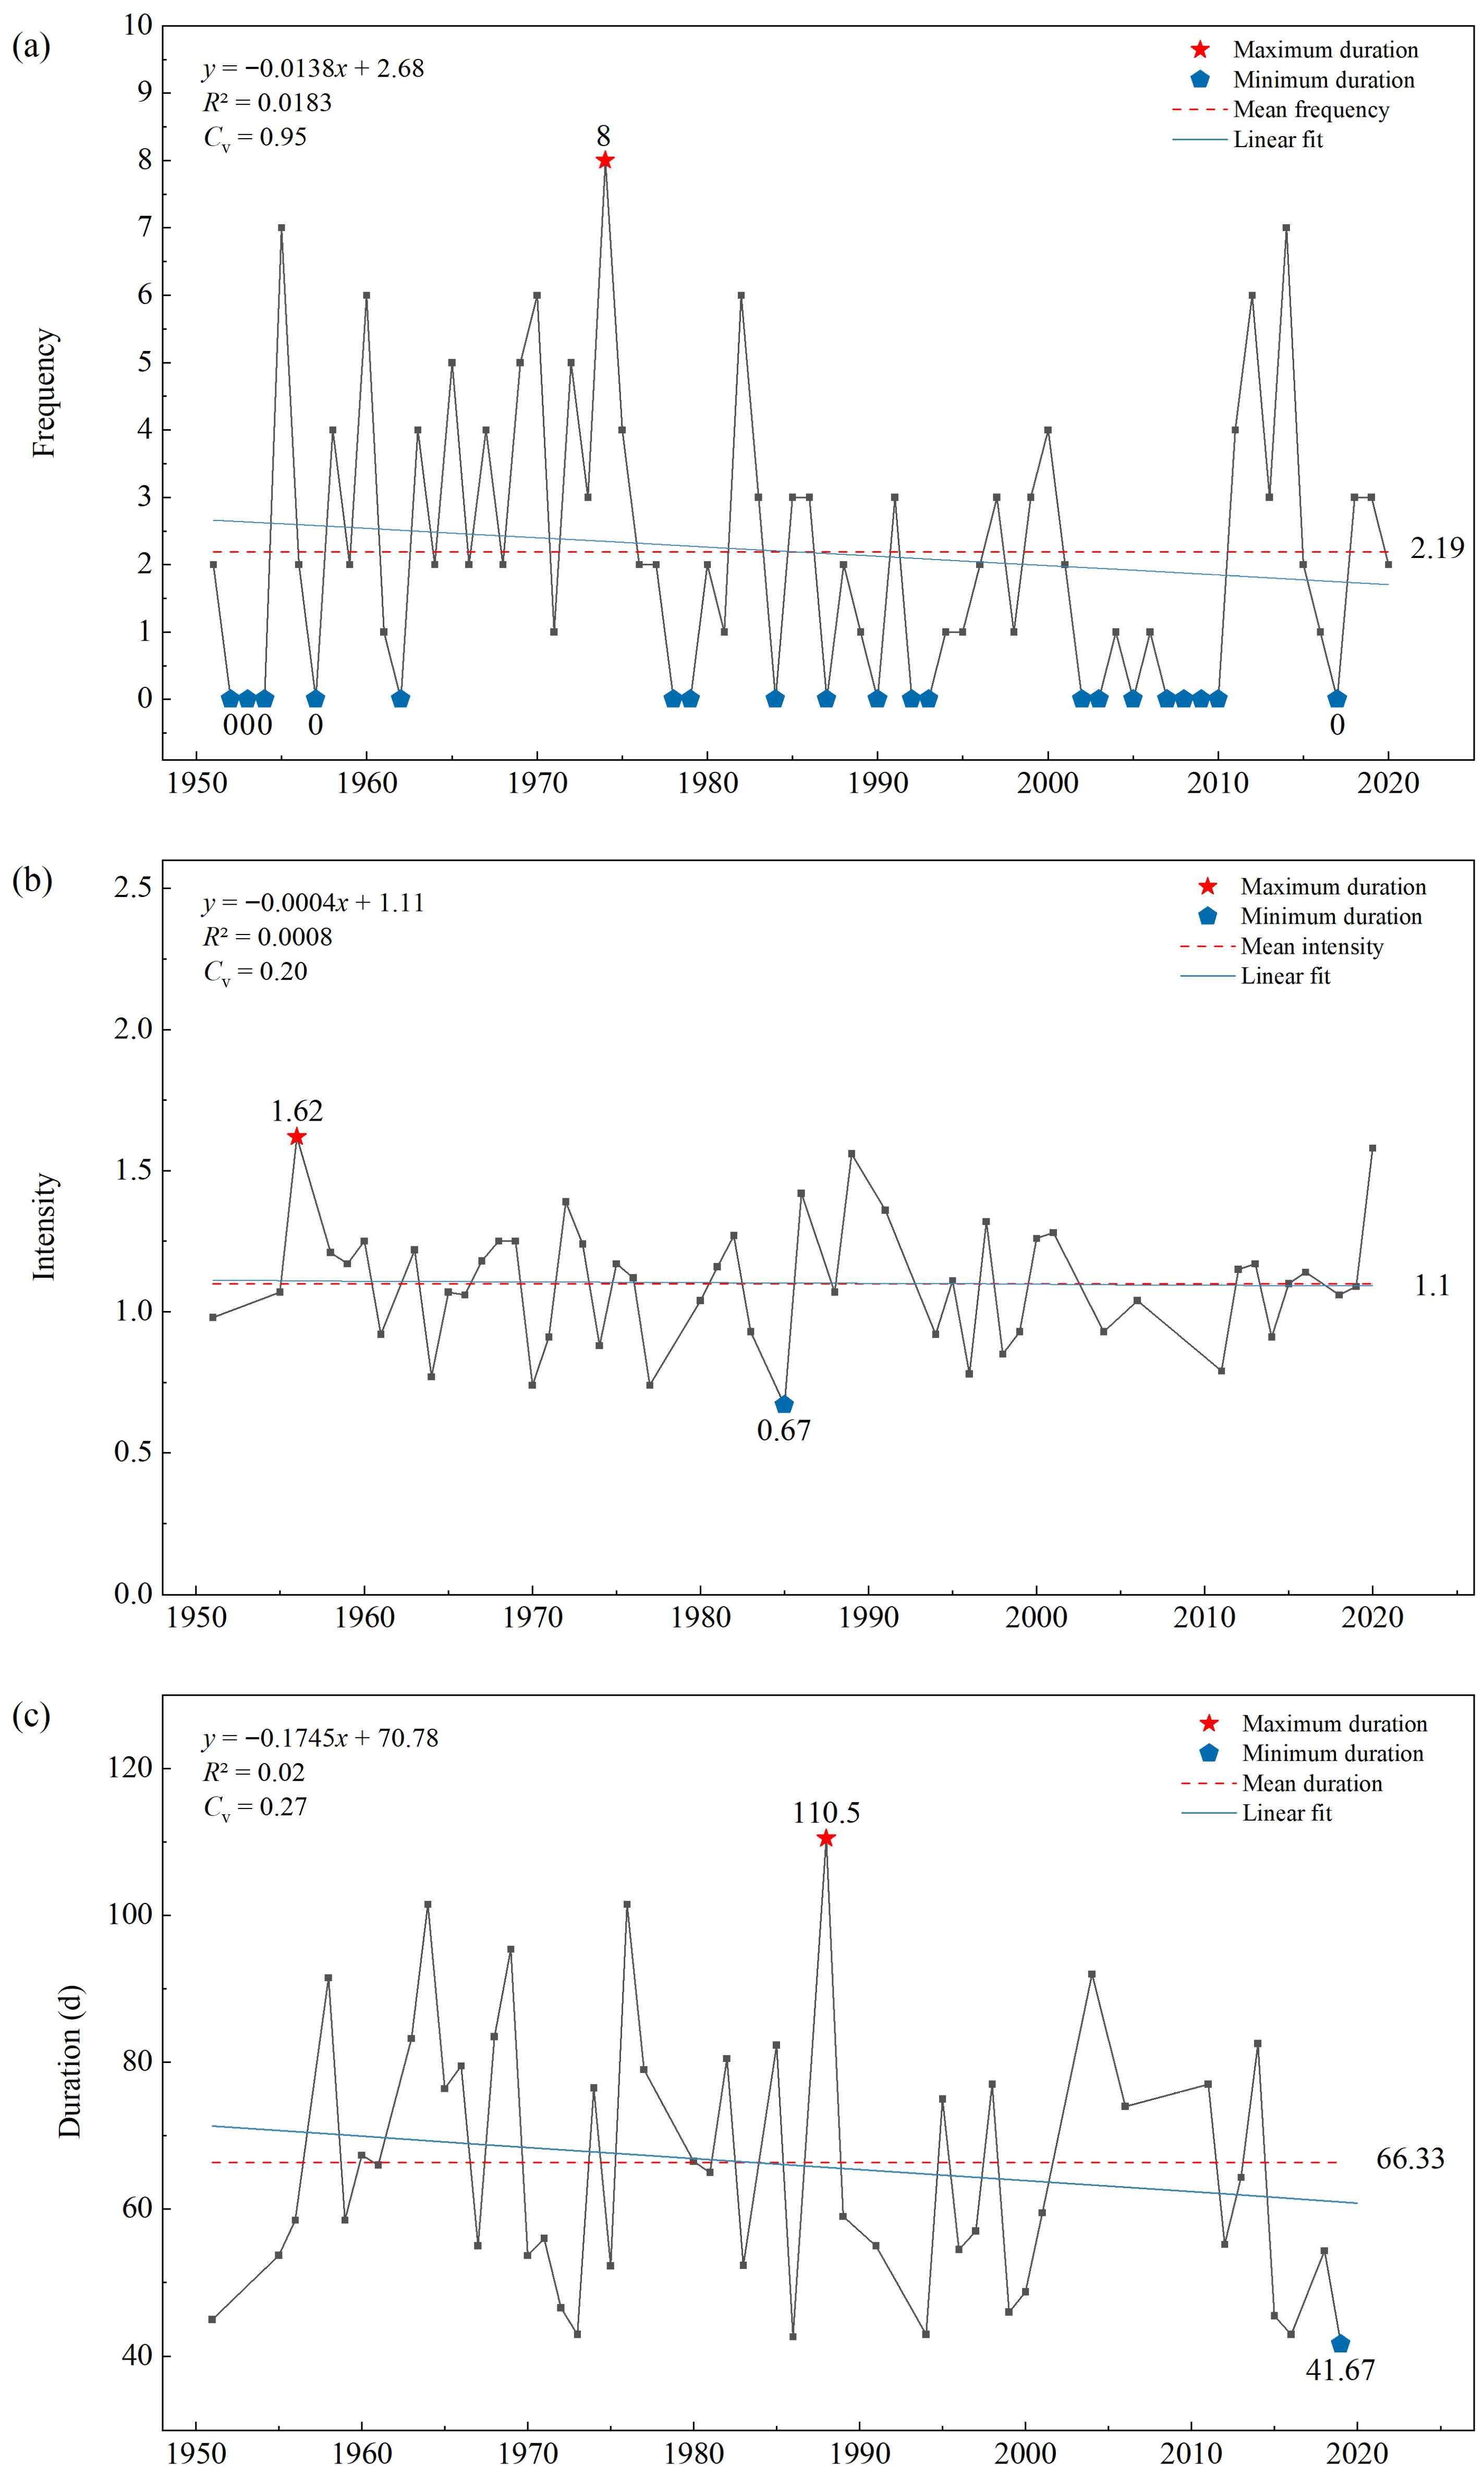
The temporal variations in DTF events during the period of 1951–2020 in Henan Province are shown in Figure 6, and the corresponding trend significance test results are presented in Table 7. The annual frequency, intensity, and duration of DTF events showed larger interannual fluctuations; however, none of the three variables exhibited a statistically significant monotonic trend at the 0.05 significance level. The frequency decreased slightly at a rate of 0.14/10a (Figure 6a); however, the low R2 value (0.0183) and the non-significant MK test result (p = 0.29) indicate that this downward tendency was weak and not statistically robust. Annual frequency ranged from 0 to 8, with a mean value of 2.19 and a high coefficient of variation (Cv = 0.95), suggesting strong interannual variability. In contrast, the decreasing slope was nearly zero (−0.004/10 a), indicating that DTF intensity remained generally stable (Figure 6b). The intensity ranged from 0.67 to 1.62, with a mean value of 1.1 and a Cv of 0.2. The Cv of duration was 0.27, and the duration had a weak decreasing trend at a rate of 2.18 d/10a (Figure 6c). It ranged from 41.67 d to 110.50 d, with a mean value of 66.33 d.
Figure 6.
Temporal variations in DTF events during 1951–2020 in Henan Province based on the daily SWAP index. (a–c) represent the frequency, intensity, and duration of DTF events, respectively.
Table 7.
Trend significance analysis results of DTF events.
DTF events showed no clear long-term trend during the period of 1951–2020. Frequency exhibited pronounced interannual variability, while intensity and duration remained relatively stable.
At the decadal scale (Table 8), DTF events were most frequent in the 1960s and 2010s, both with a mean annual frequency of 3.10 events, and least frequent in the 2000s, with only 0.30 events per year. The exceptionally low frequency in the 2000s may be related to the relatively dry climatic background in northern China during this period [48,49]. Differences in event intensity among decades were relatively small, ranging from 1.05 in the 1960s to 1.22 in the 1950s. In terms of duration, the 1960s had the longest mean duration (77.14 d), while the 1990s had the shortest mean duration (57.03 d).
Table 8.
Characteristic values of DTF events in Henan Province in decade scale.
3.2.2. Temporal Variations in FTD Events
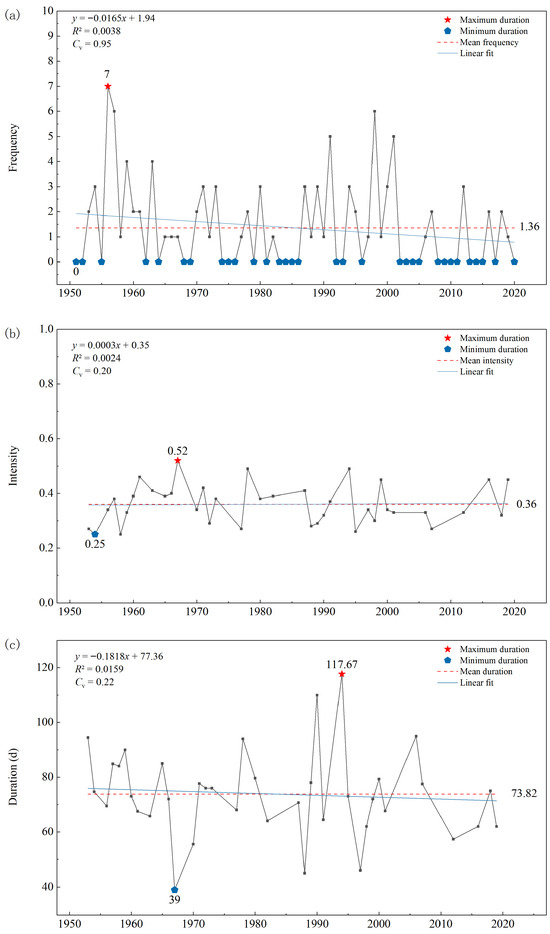
Figure 7 shows the temporal variations in FTD events during the period of 1951–2020 in Henan Province, and the corresponding trend significance test results are presented in Table 9. FTD events showed large interannual fluctuations during the period of 1951–2020, and none of the three variables exhibited a statistically significant monotonic trend at the 0.05 significance level. The frequency decreased slightly at a rate of 0.17/10a (Figure 7a), and there was a low R2 value (0.0038) and a non-significant MK test result (p = 0.115). The Cv of frequency was 0.95, and the frequency ranged from 0 to 7, with a mean value of 1.36, indicating considerable interannual variability rather than a significant decreasing trend. The intensity had an almost negligible positive fitted slope of 0.003/10a (Figure 7b) and was not significant (p = 0.900). The Cv of intensity was 0.20, and the intensity ranged from 0.25 to 0.52, with a mean value of 0.36, suggesting relatively small variation and an overall stable pattern. The Cv of duration was 0.22, and the duration also showed a decreasing trend at a rate of 1.81 d/decade (Figure 7c). It ranged from 39.00 d to 117.67 d, with a mean value of 73.82 d.
Figure 7.
Temporal variations in FTD events during the period of 1951–2020 in Henan Province based on the daily SWAP index. (a–c) represent the frequency, intensity, and duration of FTD events, respectively.
Table 9.
Trend significance analysis results of FTD events.
FTD events show no clear long-term trend during the period of 1951–2020. Frequency exhibited pronounced interannual variability, while intensity and duration remained relatively stable. These results indicate that the temporal evolution of FTD events in Henan Province was mainly characterized by year-to-year fluctuations rather than a persistent increasing or decreasing trend.
Compared with DTF events, FTD events were generally less frequent (Table 10). FTD events were most frequent in the 1950s (2.50) and least frequent in the 2000s (0.80). The values of intensity of FTD events varied slightly among decades, which had the maximum intensity value (0.42) in the 1960s and the minimum intensity value (0.31) in the 1950s and 2000s. In terms of duration, FTD events had the maximum duration in the 1950s (81.49 d) and the minimum duration in the 1960s (64.12 d).
Table 10.
Characteristic values of FTD events in Henan Province in decade scale.
3.3. Spatial Distribution of DFAA Events
3.3.1. Spatial Distribution of DTF Events
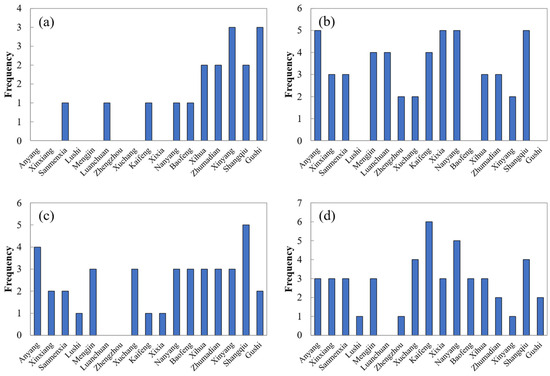
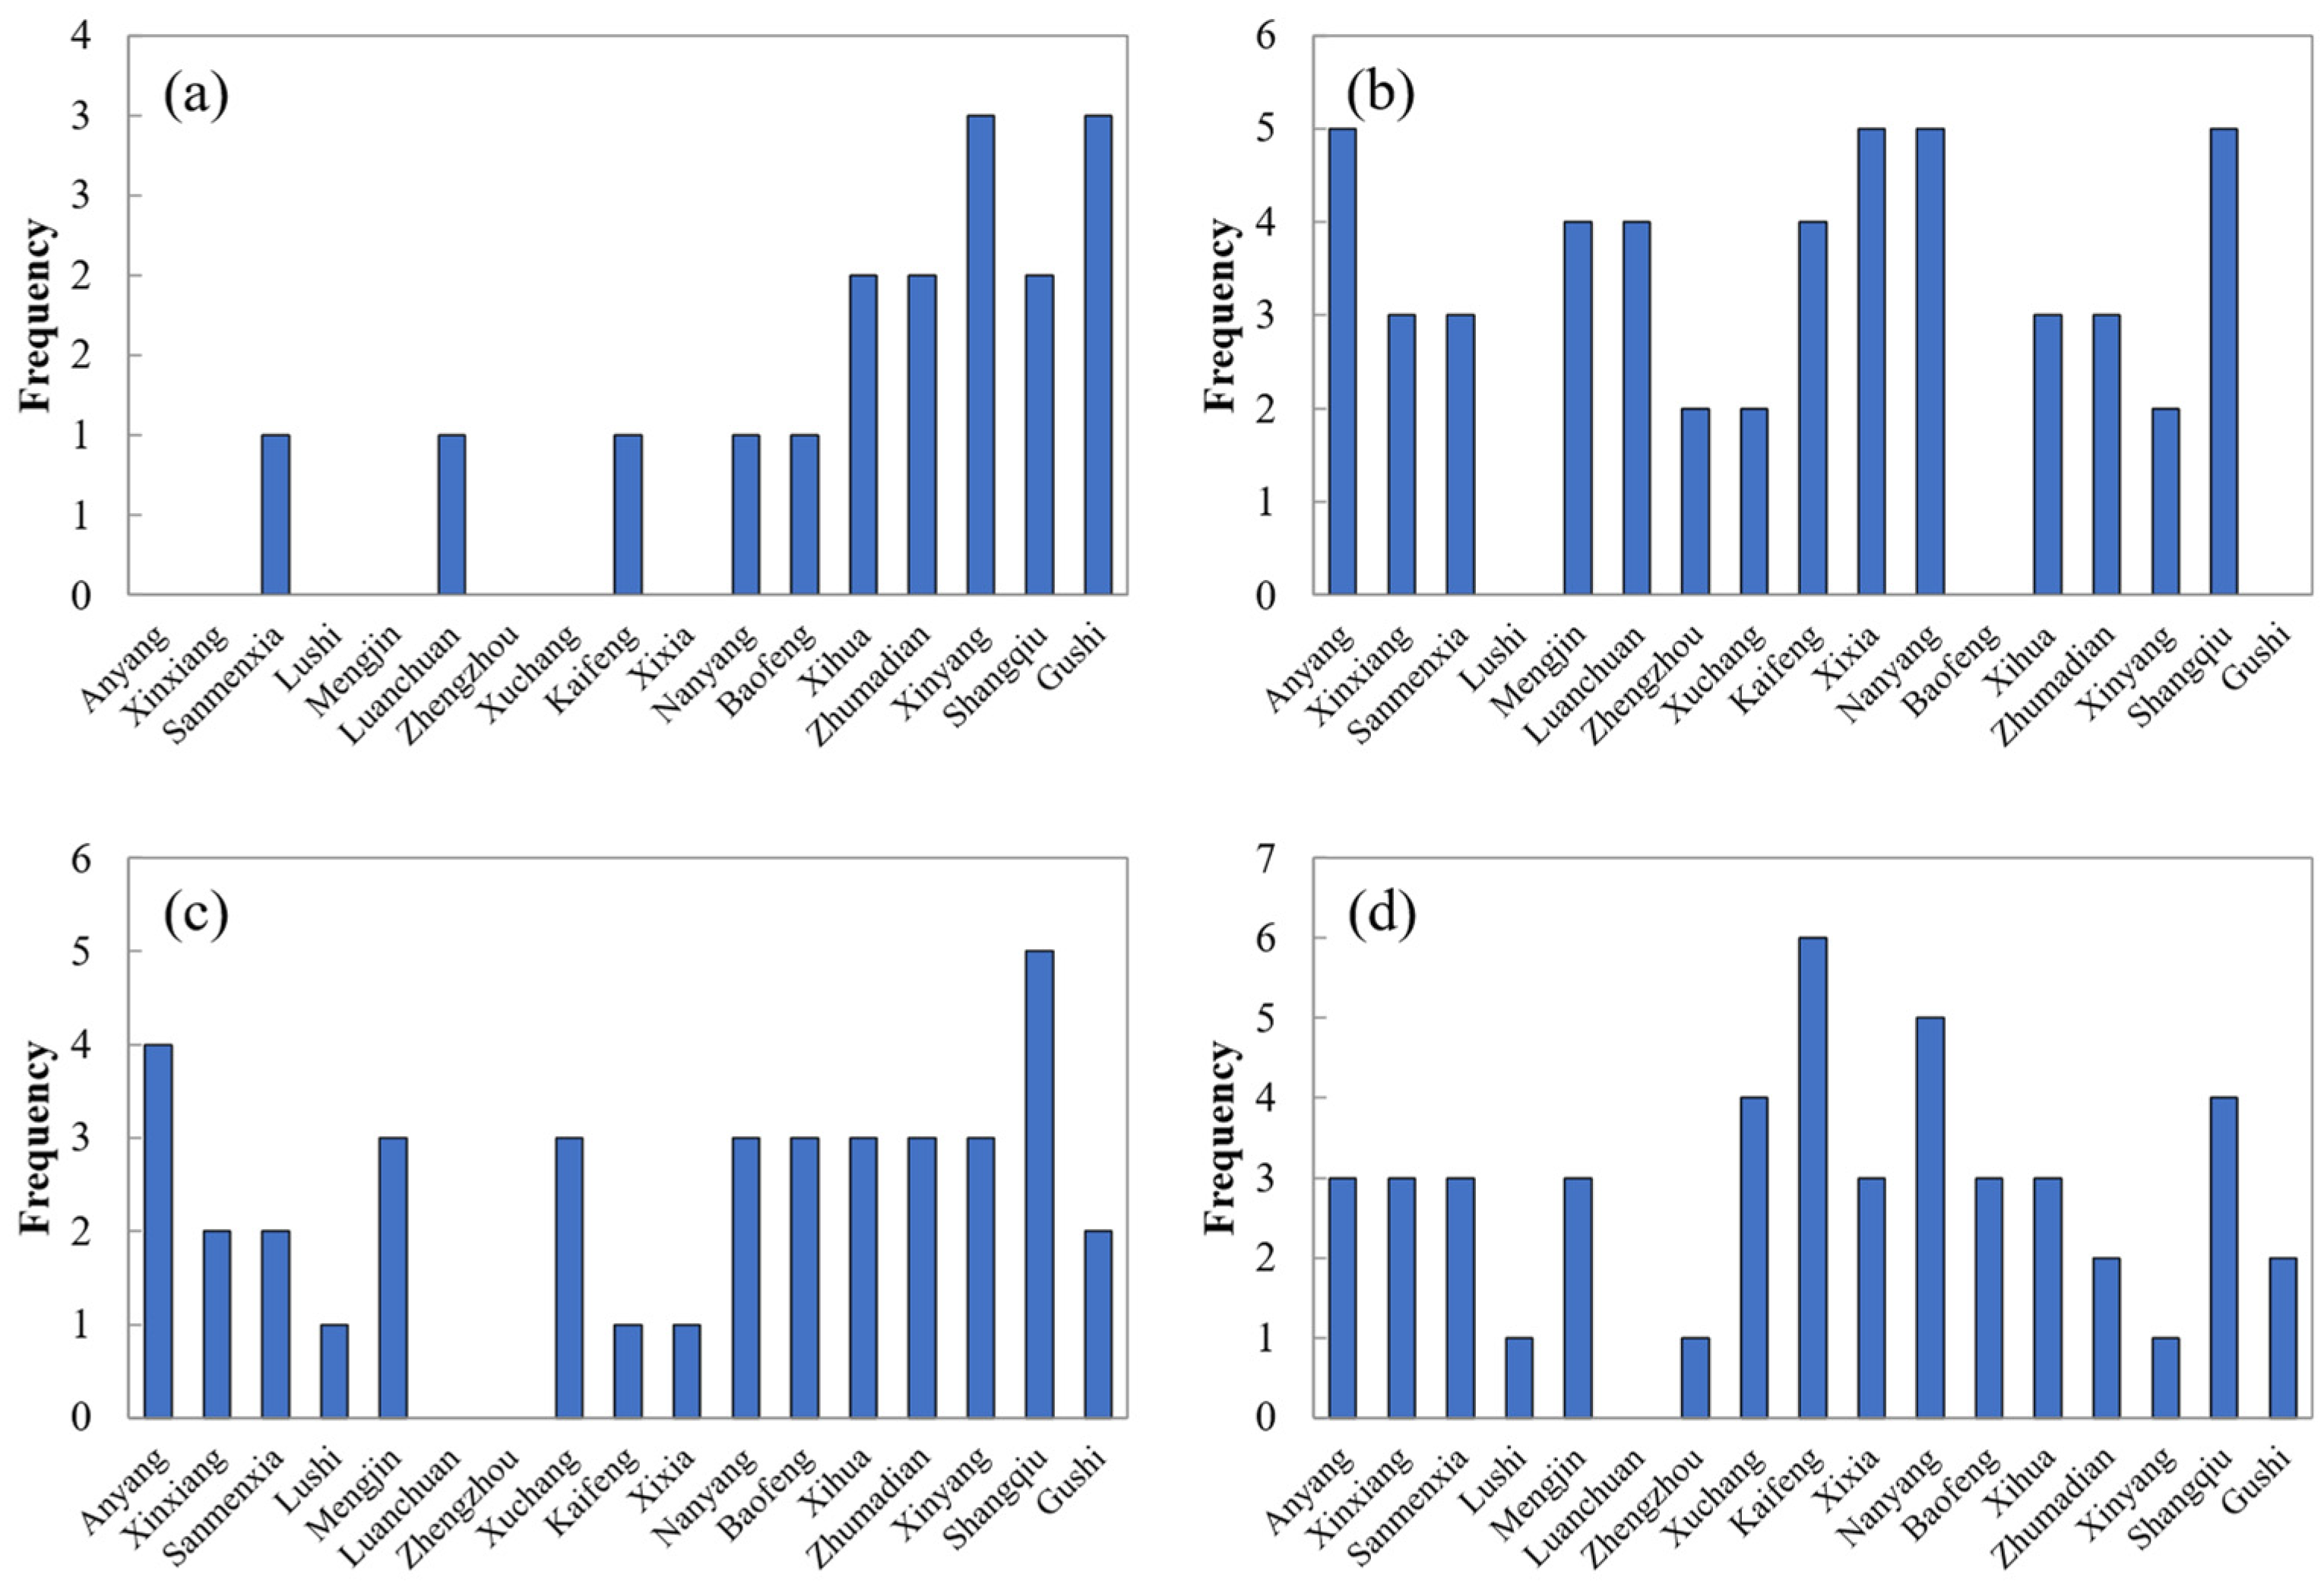
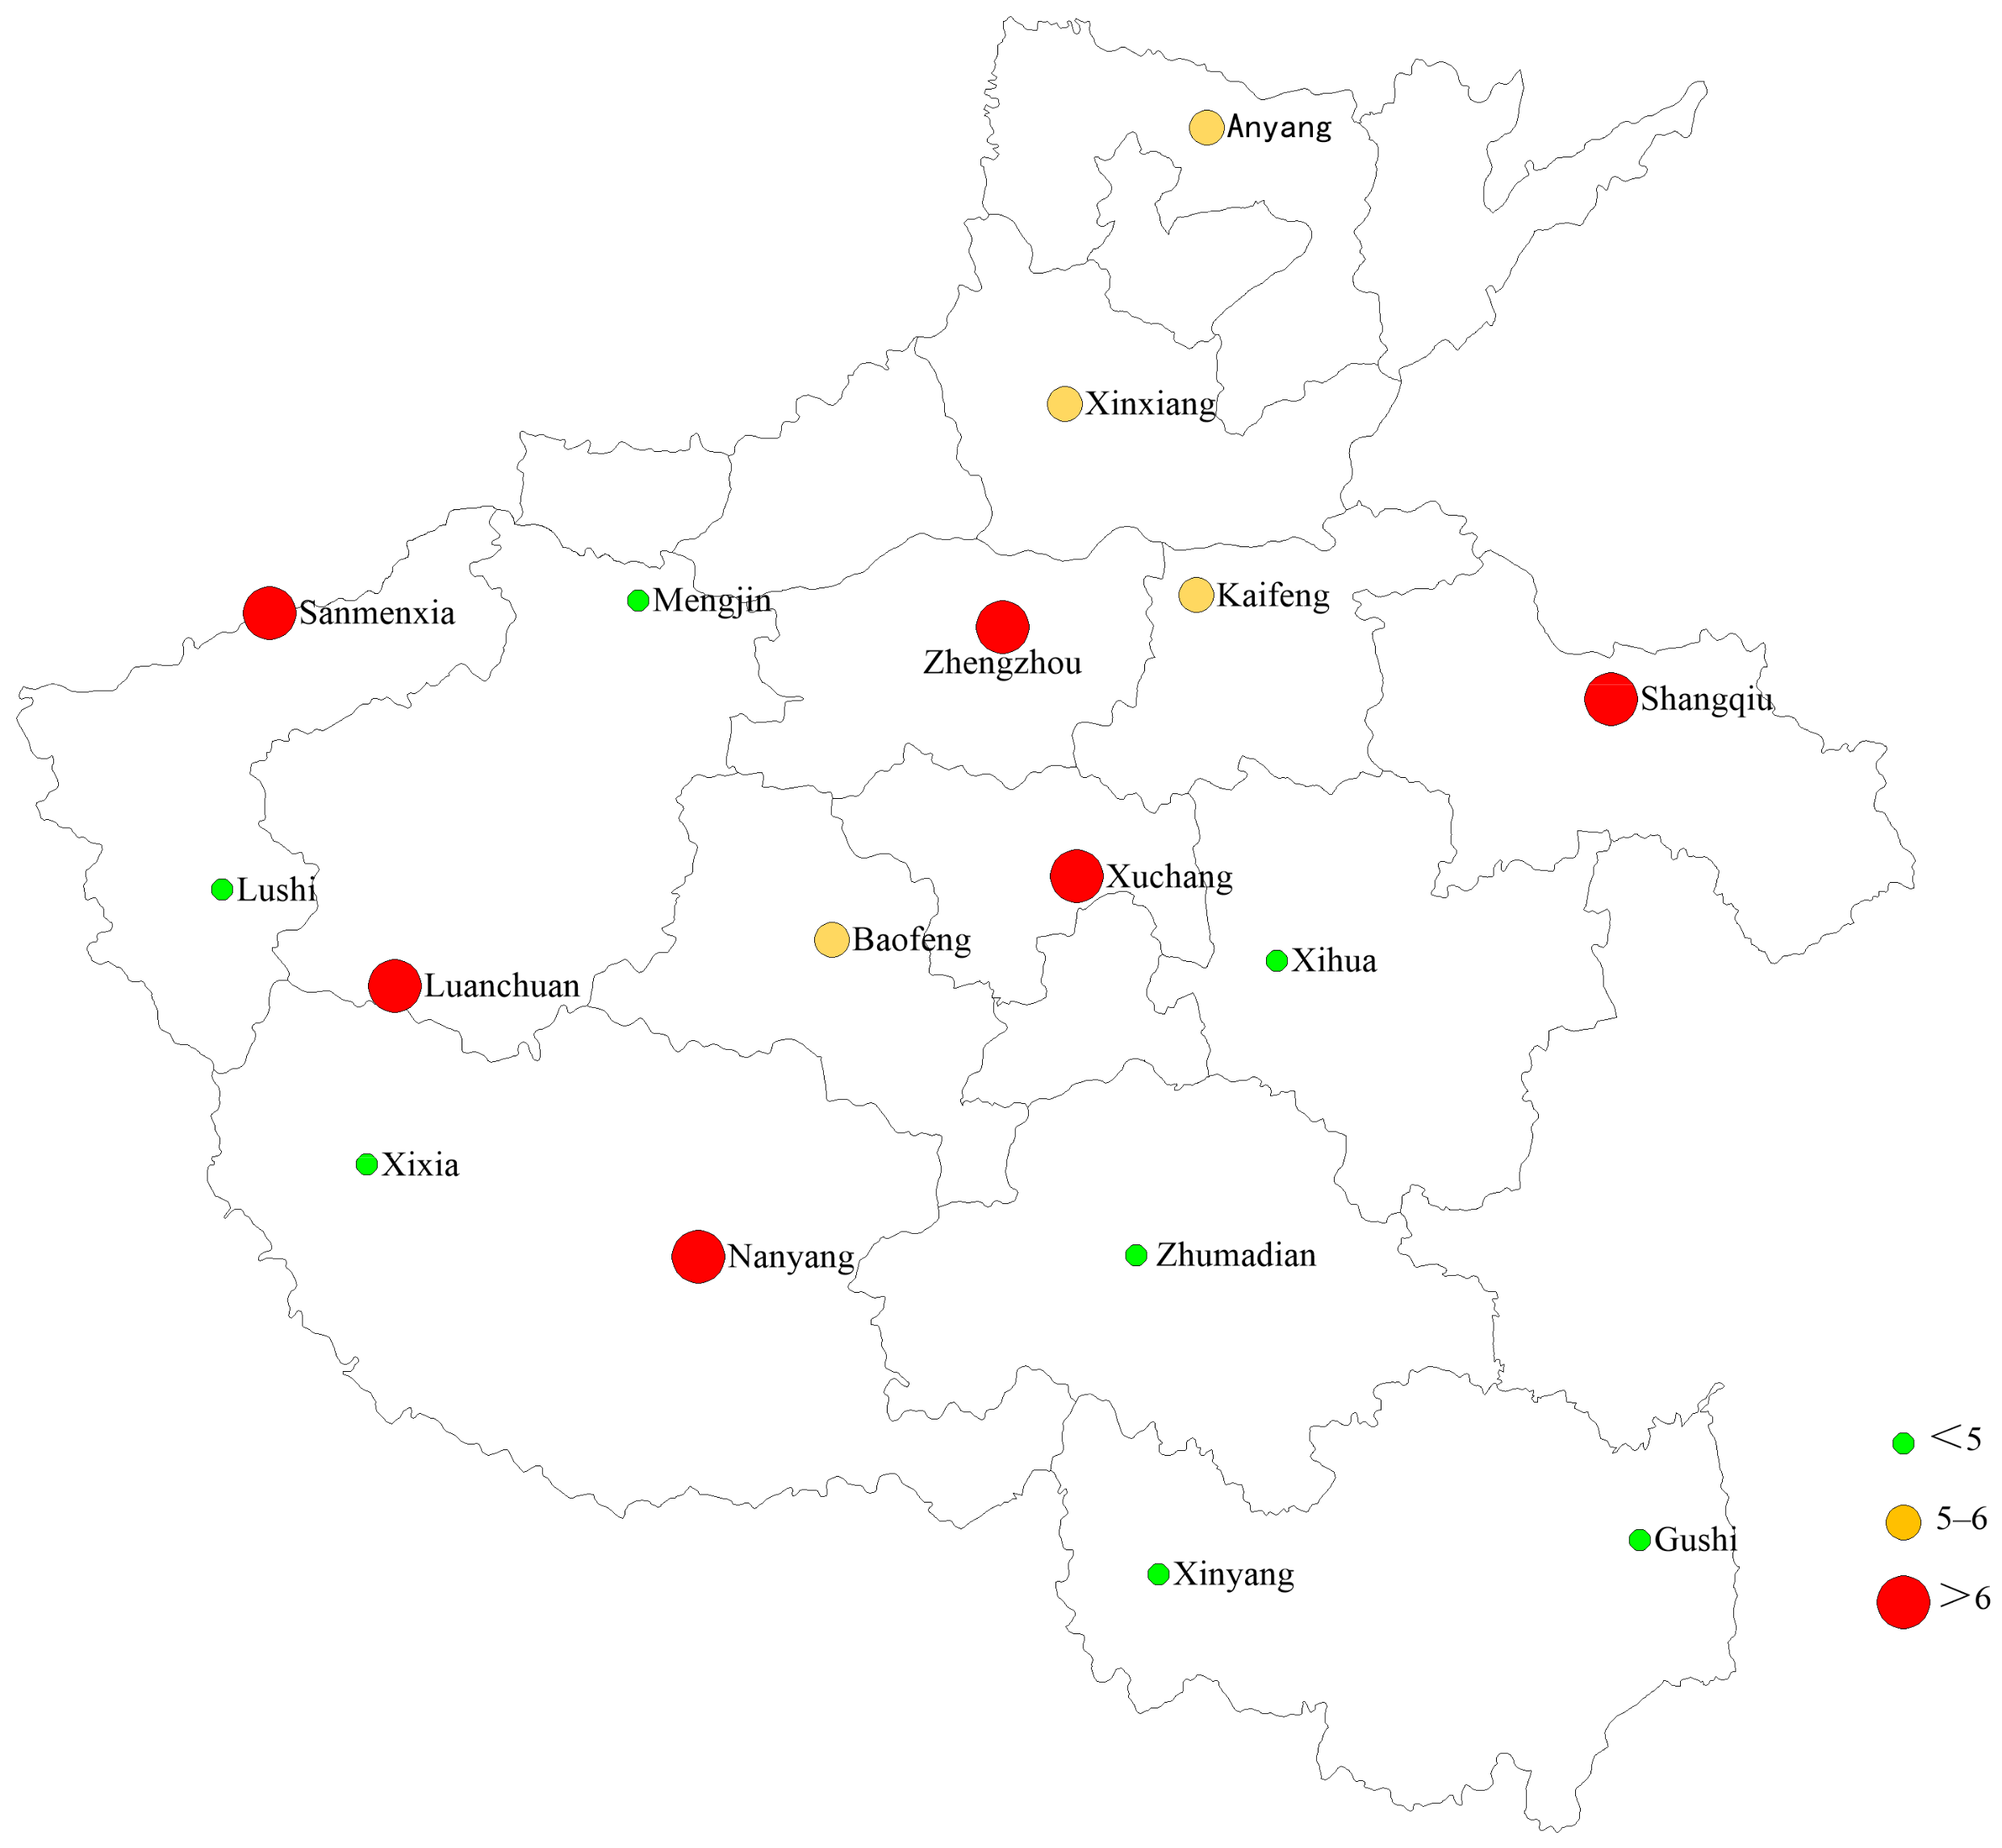
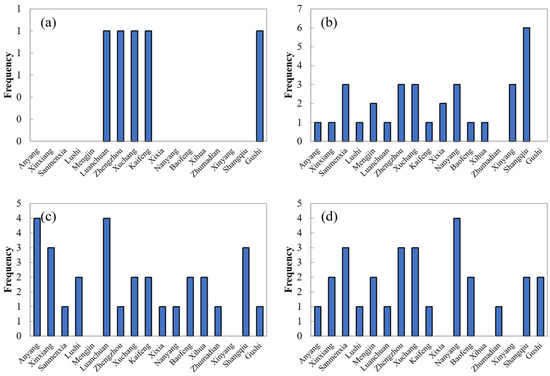
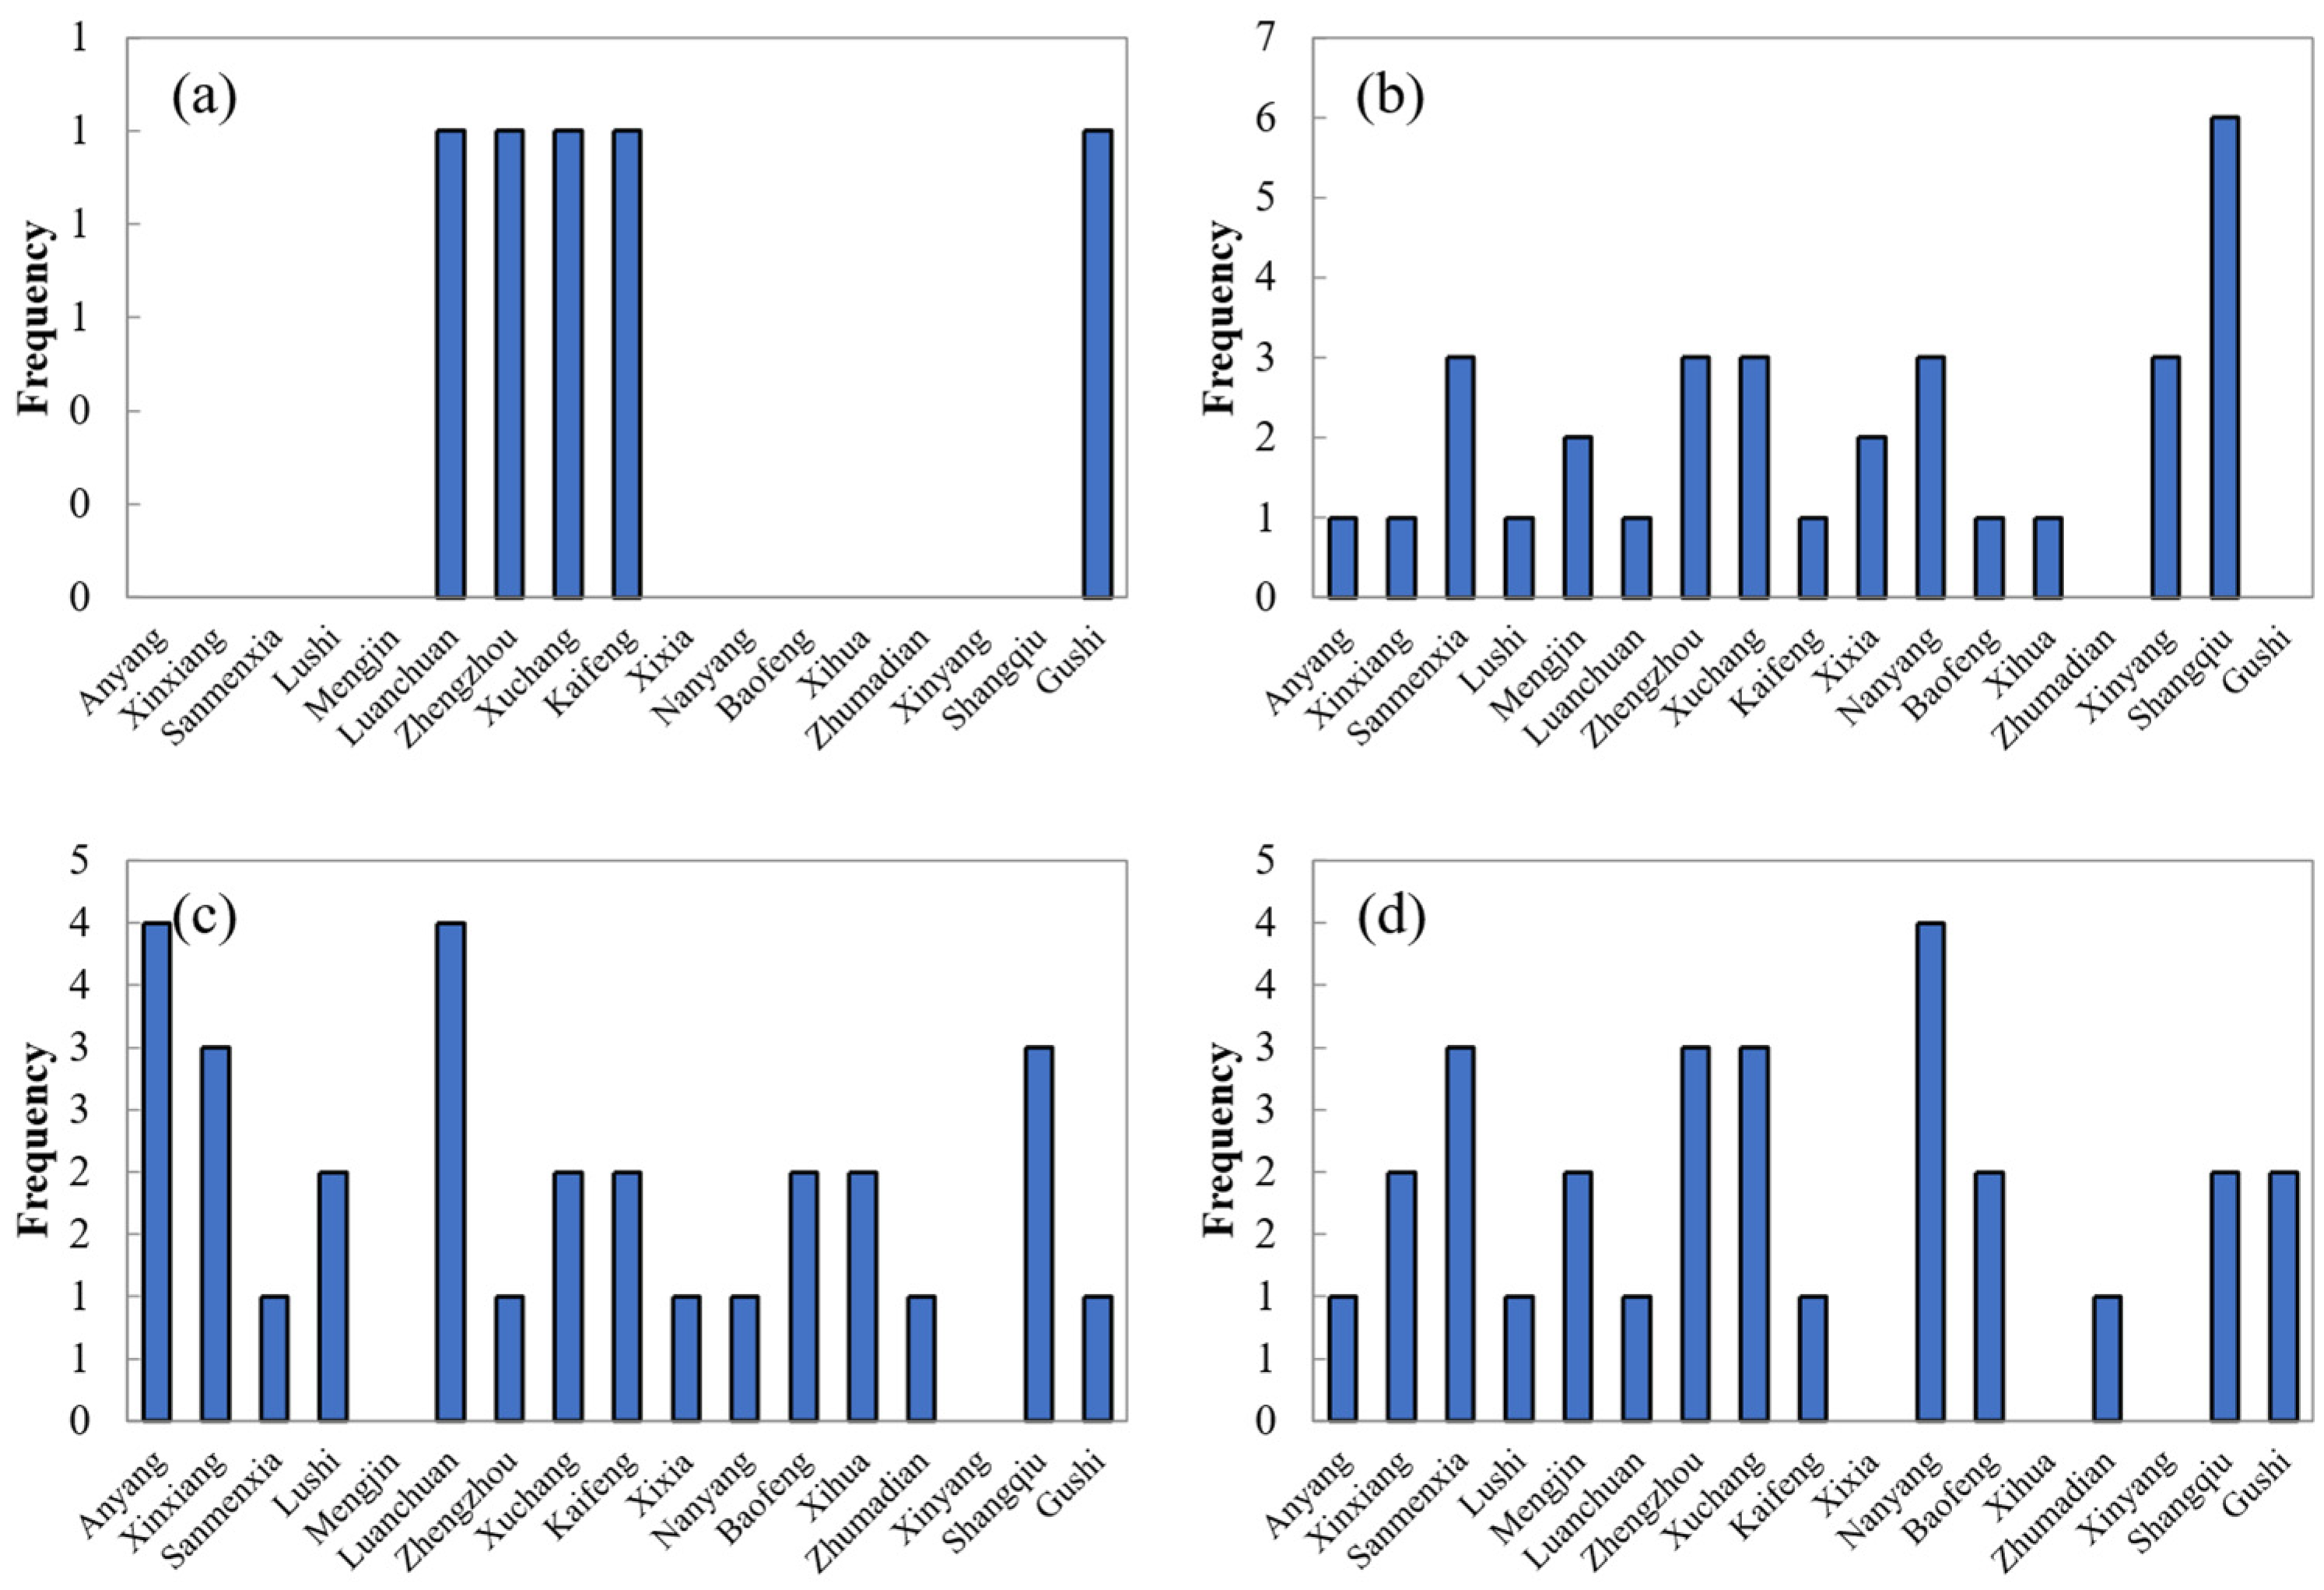
The spatial distribution of the frequency of DTF events during the period of 1951–2020 and the monthly frequency distributions at the 17 meteorological stations are shown in Figure 8. DTF events were more frequent (>10) in the northern and eastern stations; Shangqiu station had the maximum frequency (16), whereas Lushi station had the minimum frequency (2). In terms of monthly distribution, the peak month of DTF frequency differed among stations (Figure 9). There were 11 stations (65%) with maximum frequency of DTF events in July, suggesting that July was the most concentrated month for DTF events at most stations.
Figure 8.
Spatial distribution of the frequency of DTF events during the period of 1951–2020.
Figure 9.
Monthly frequency distributions of DTF events at 17 meteorological stations in Henan Province: (a) June; (b) July; (c) August; and (d) September.
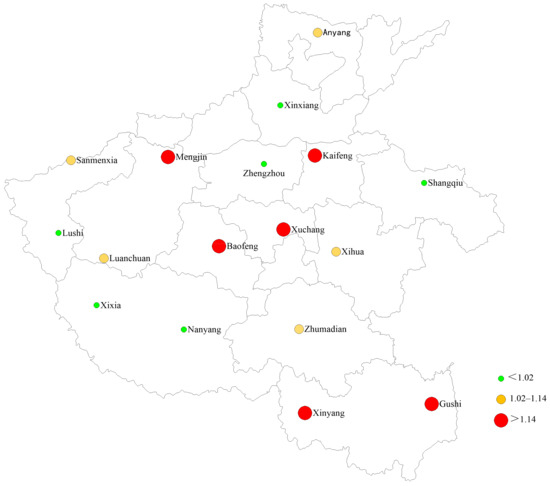
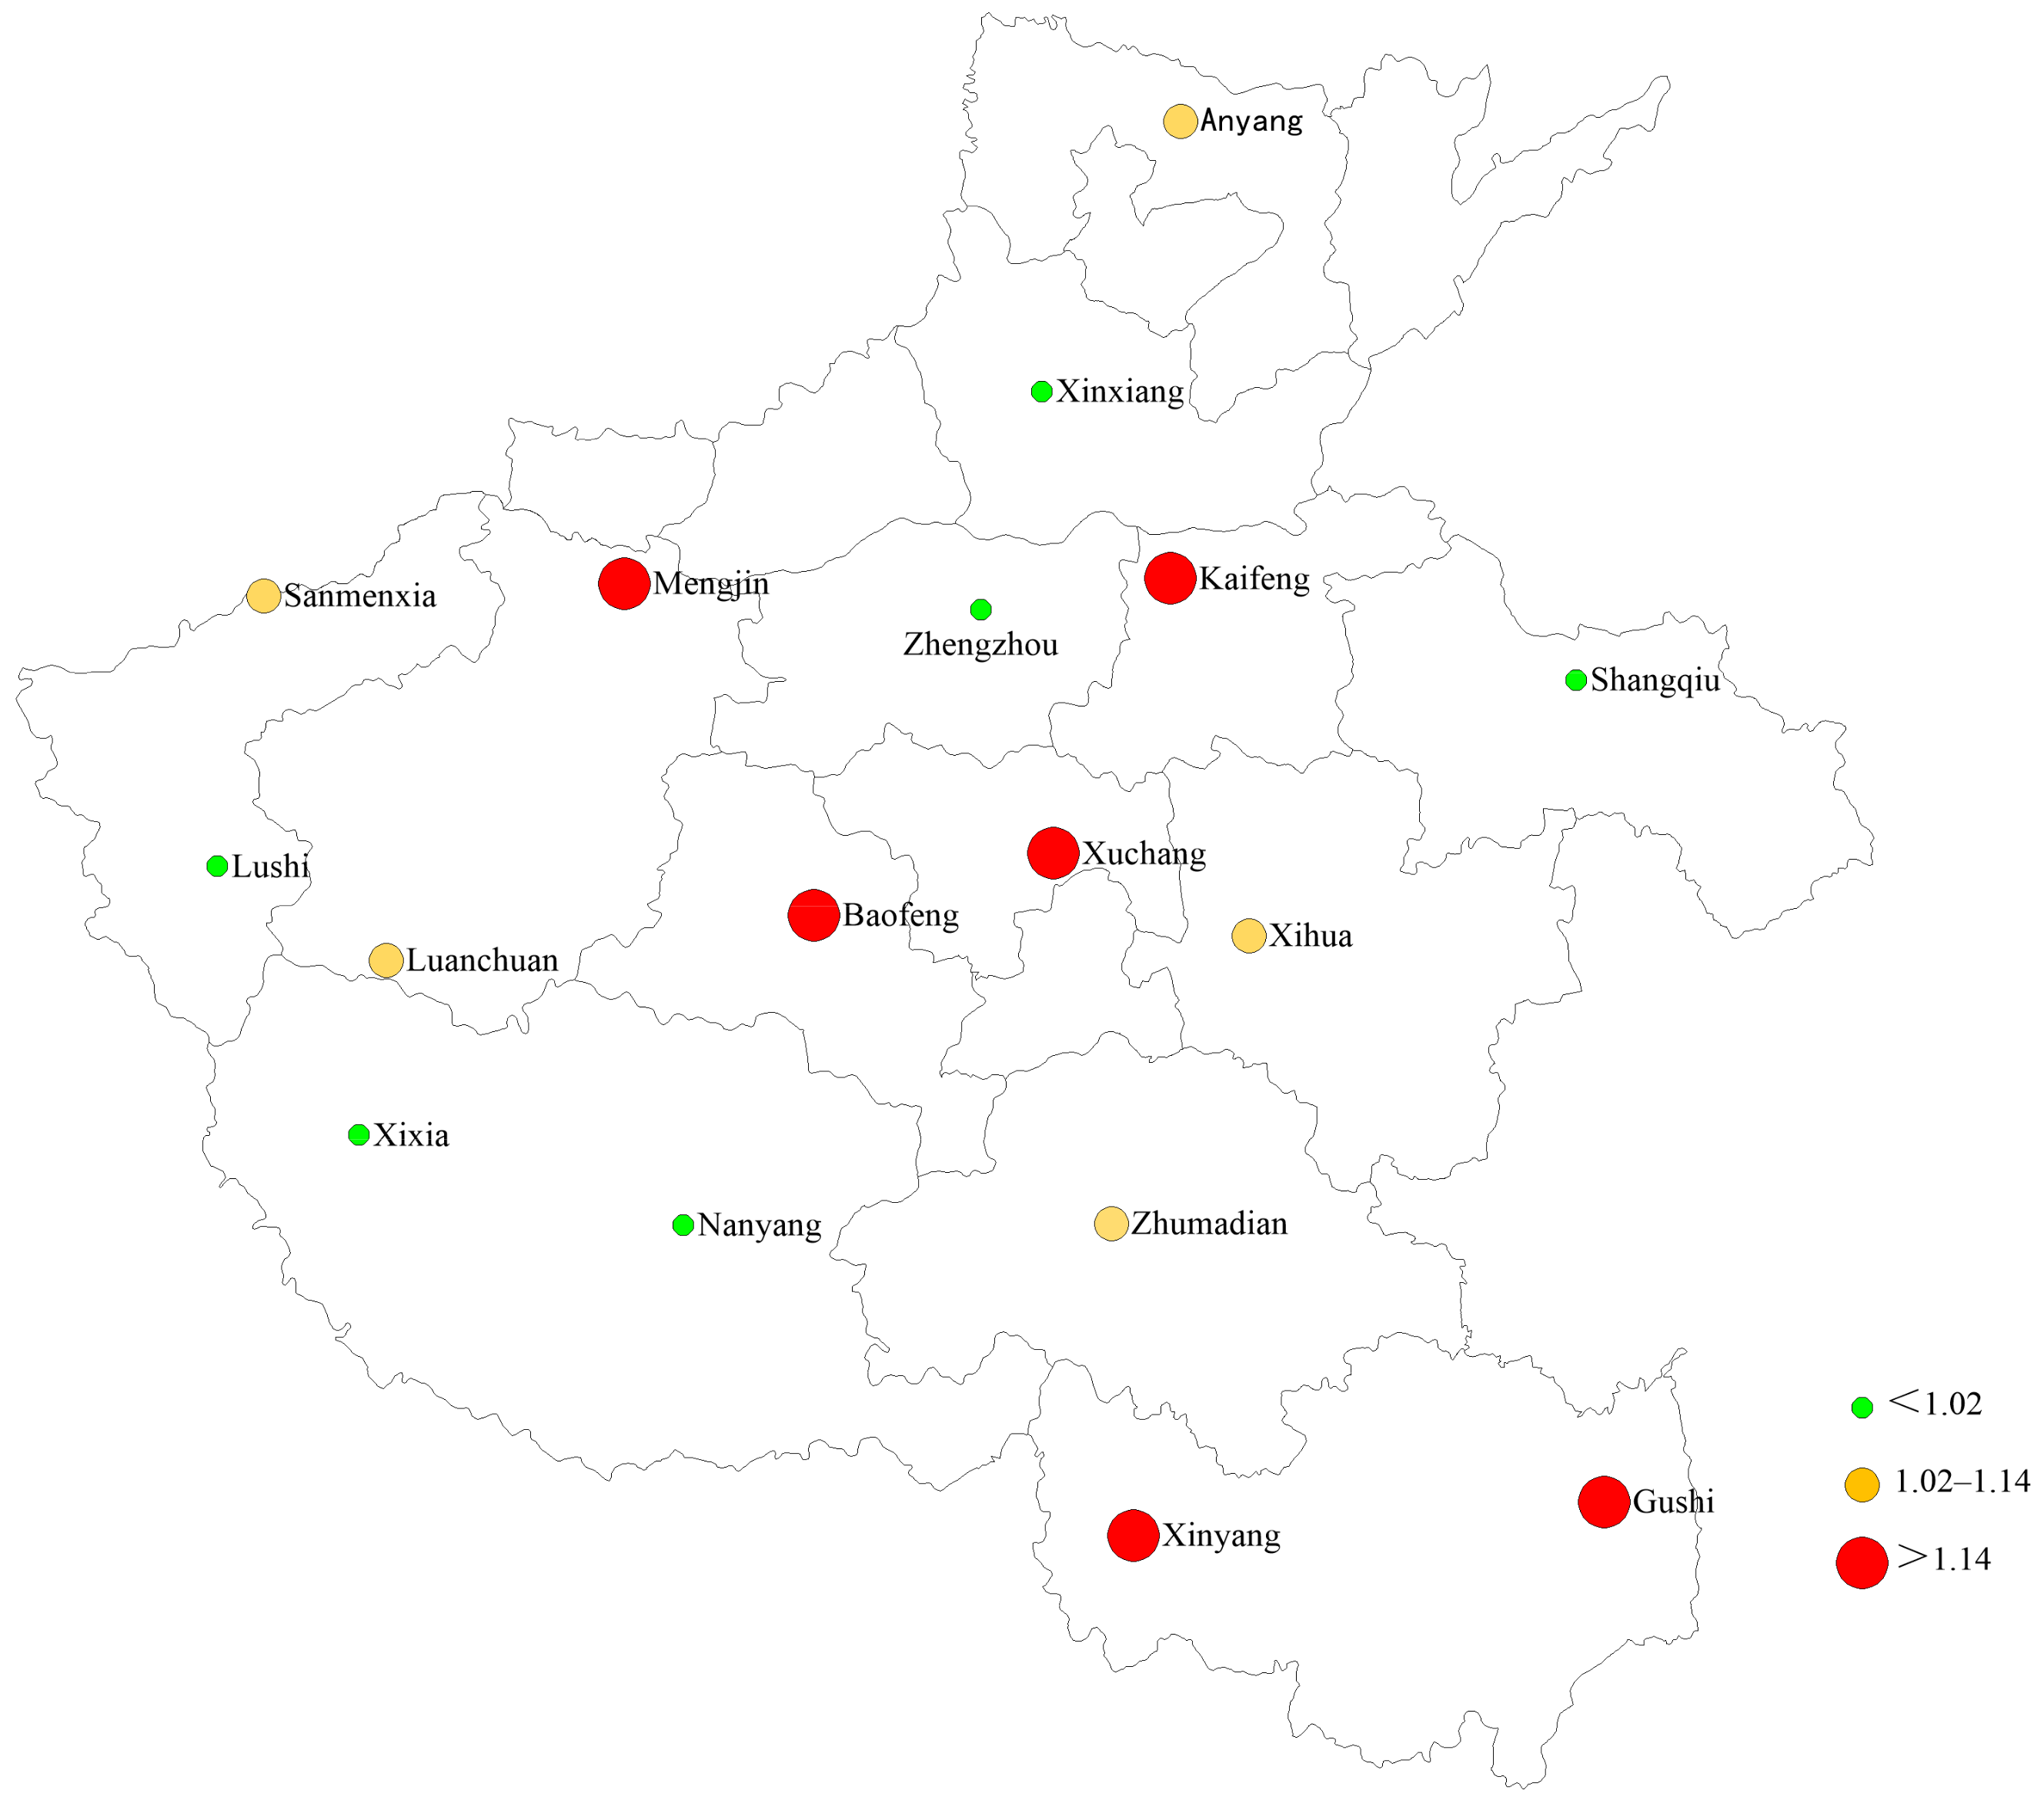
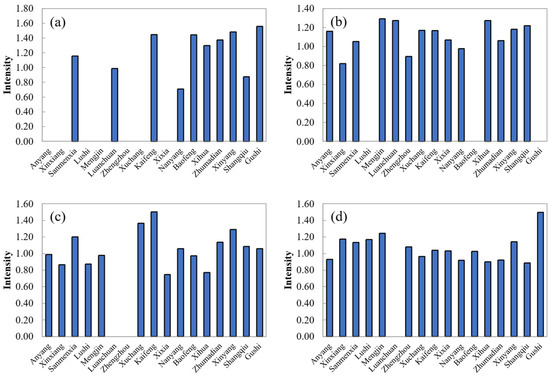
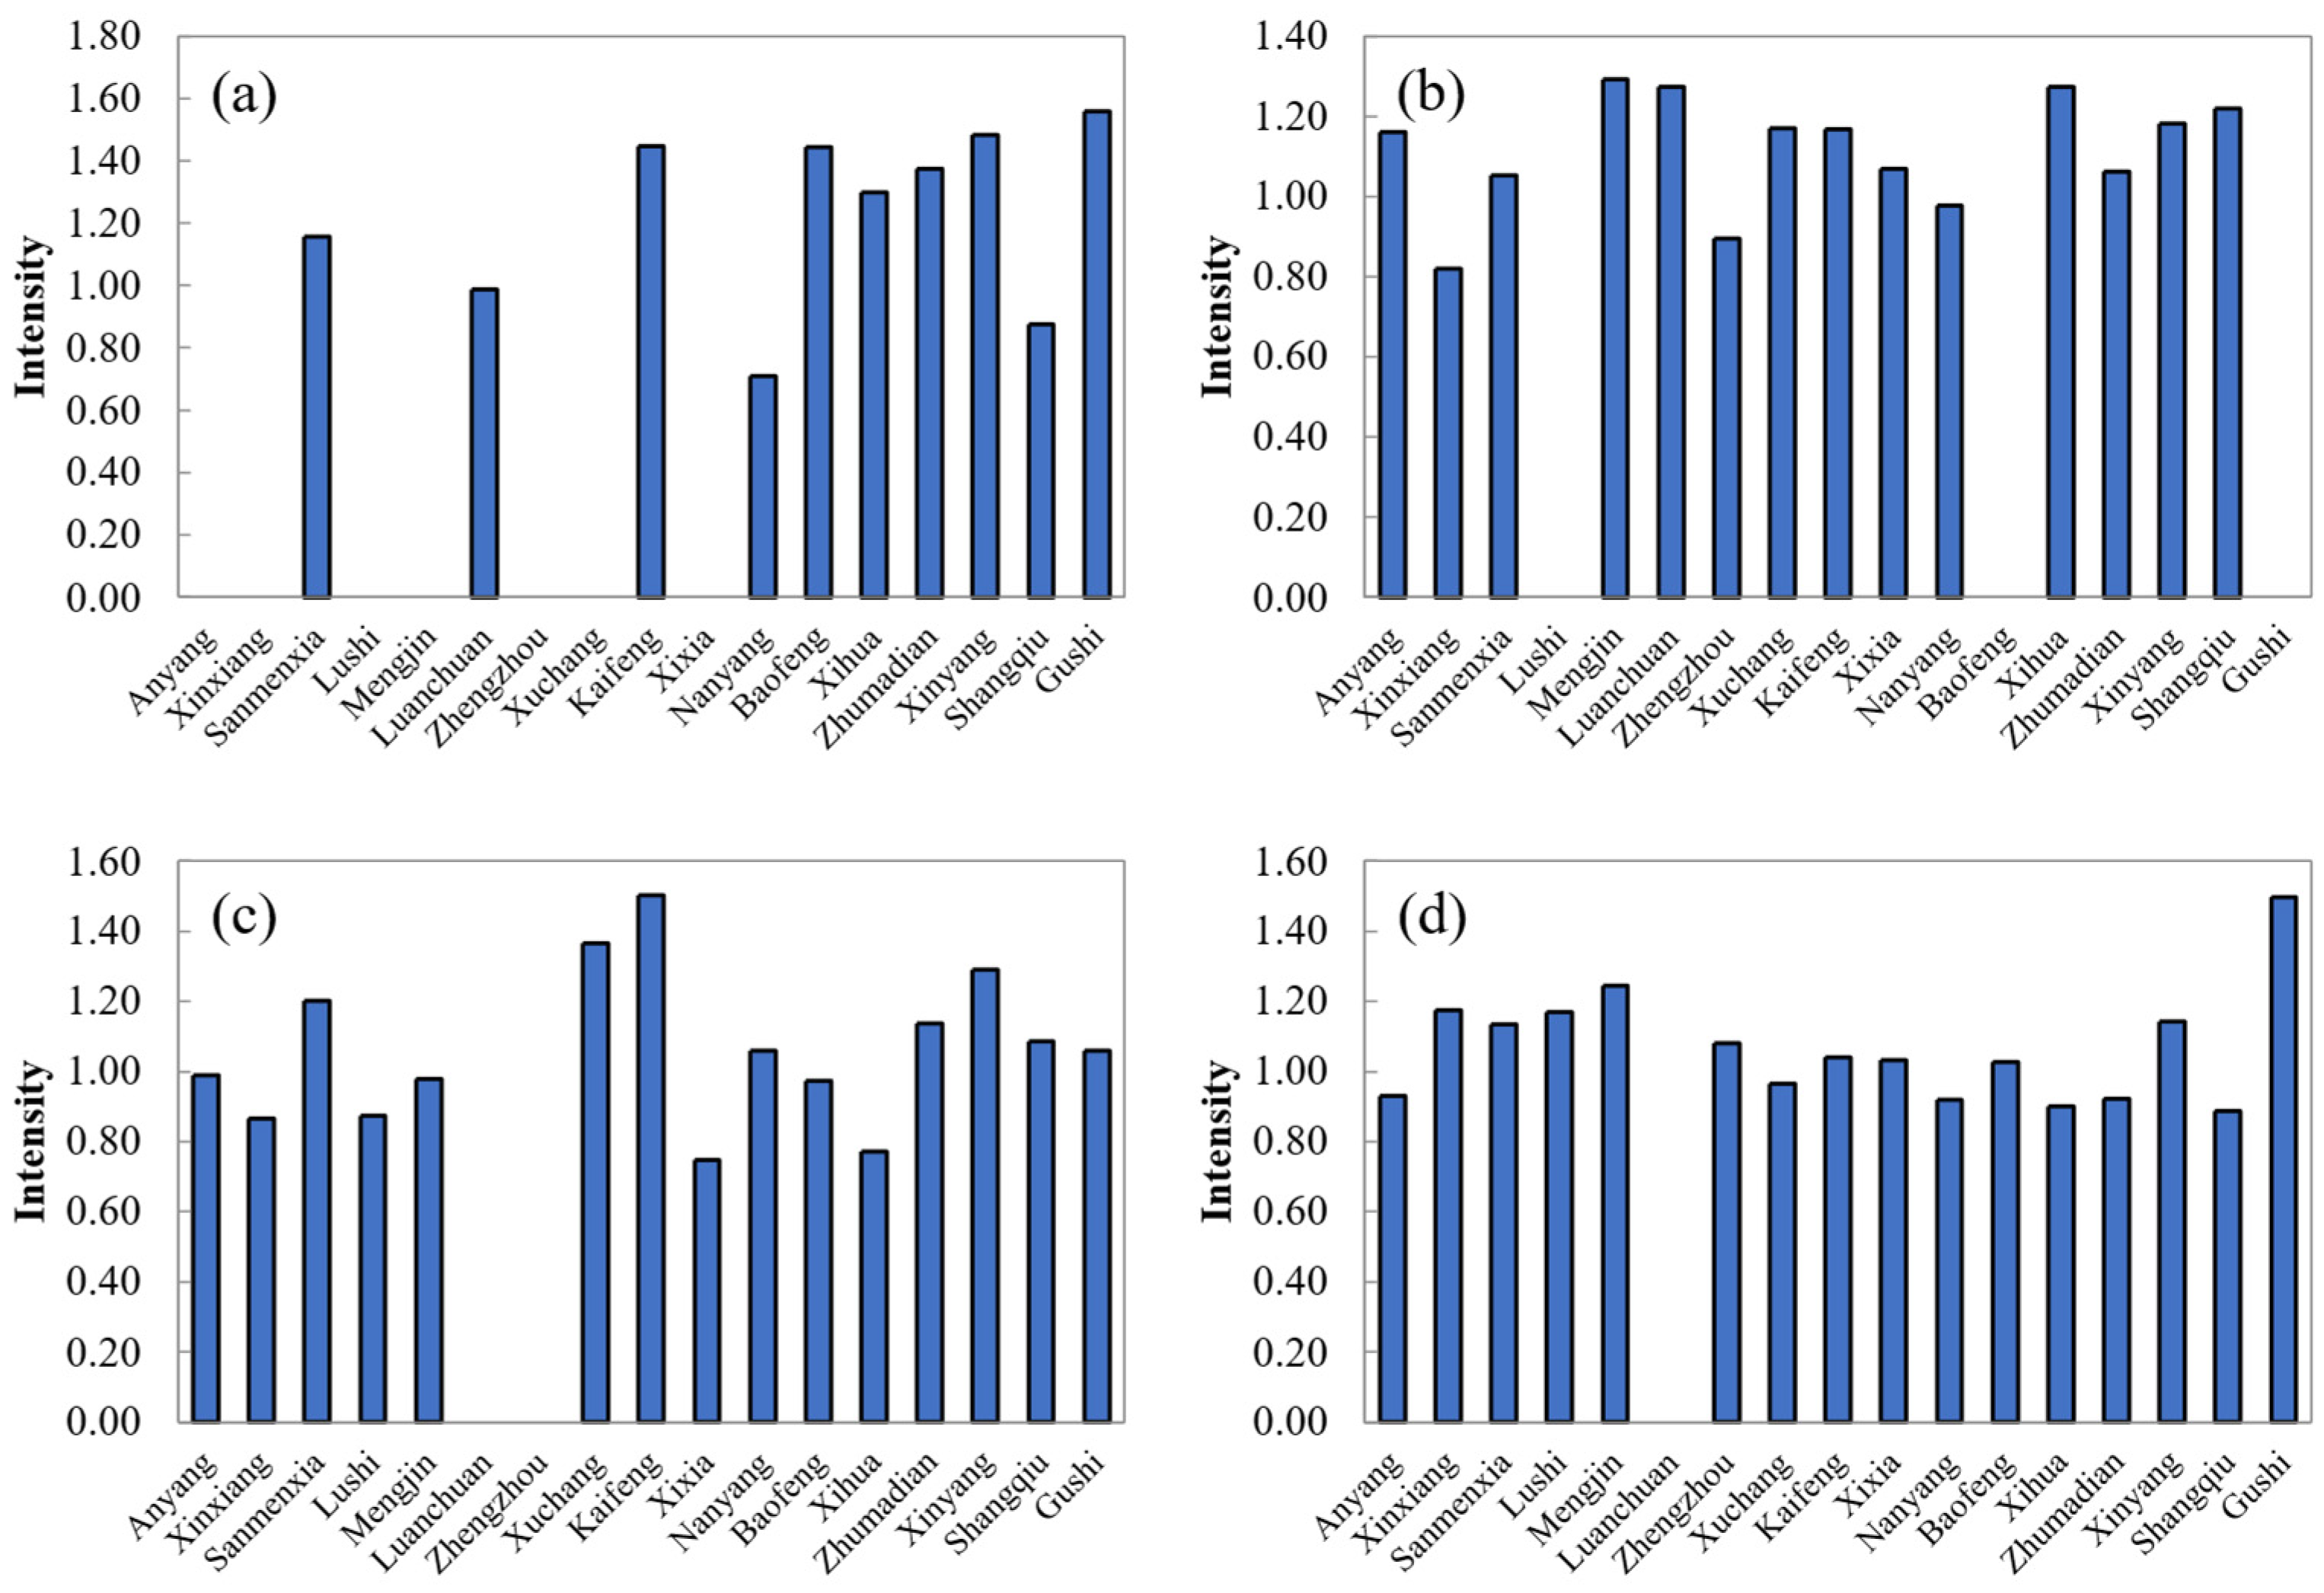
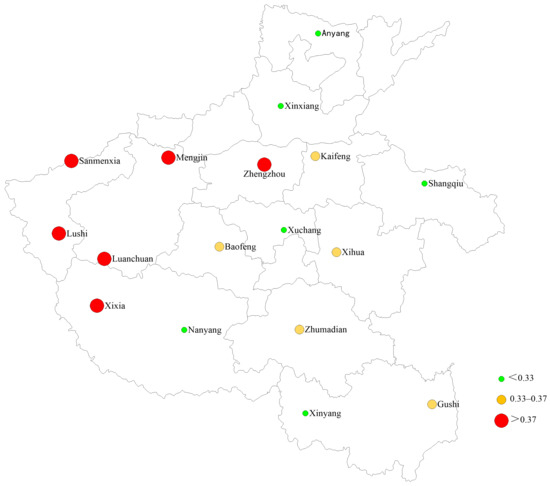
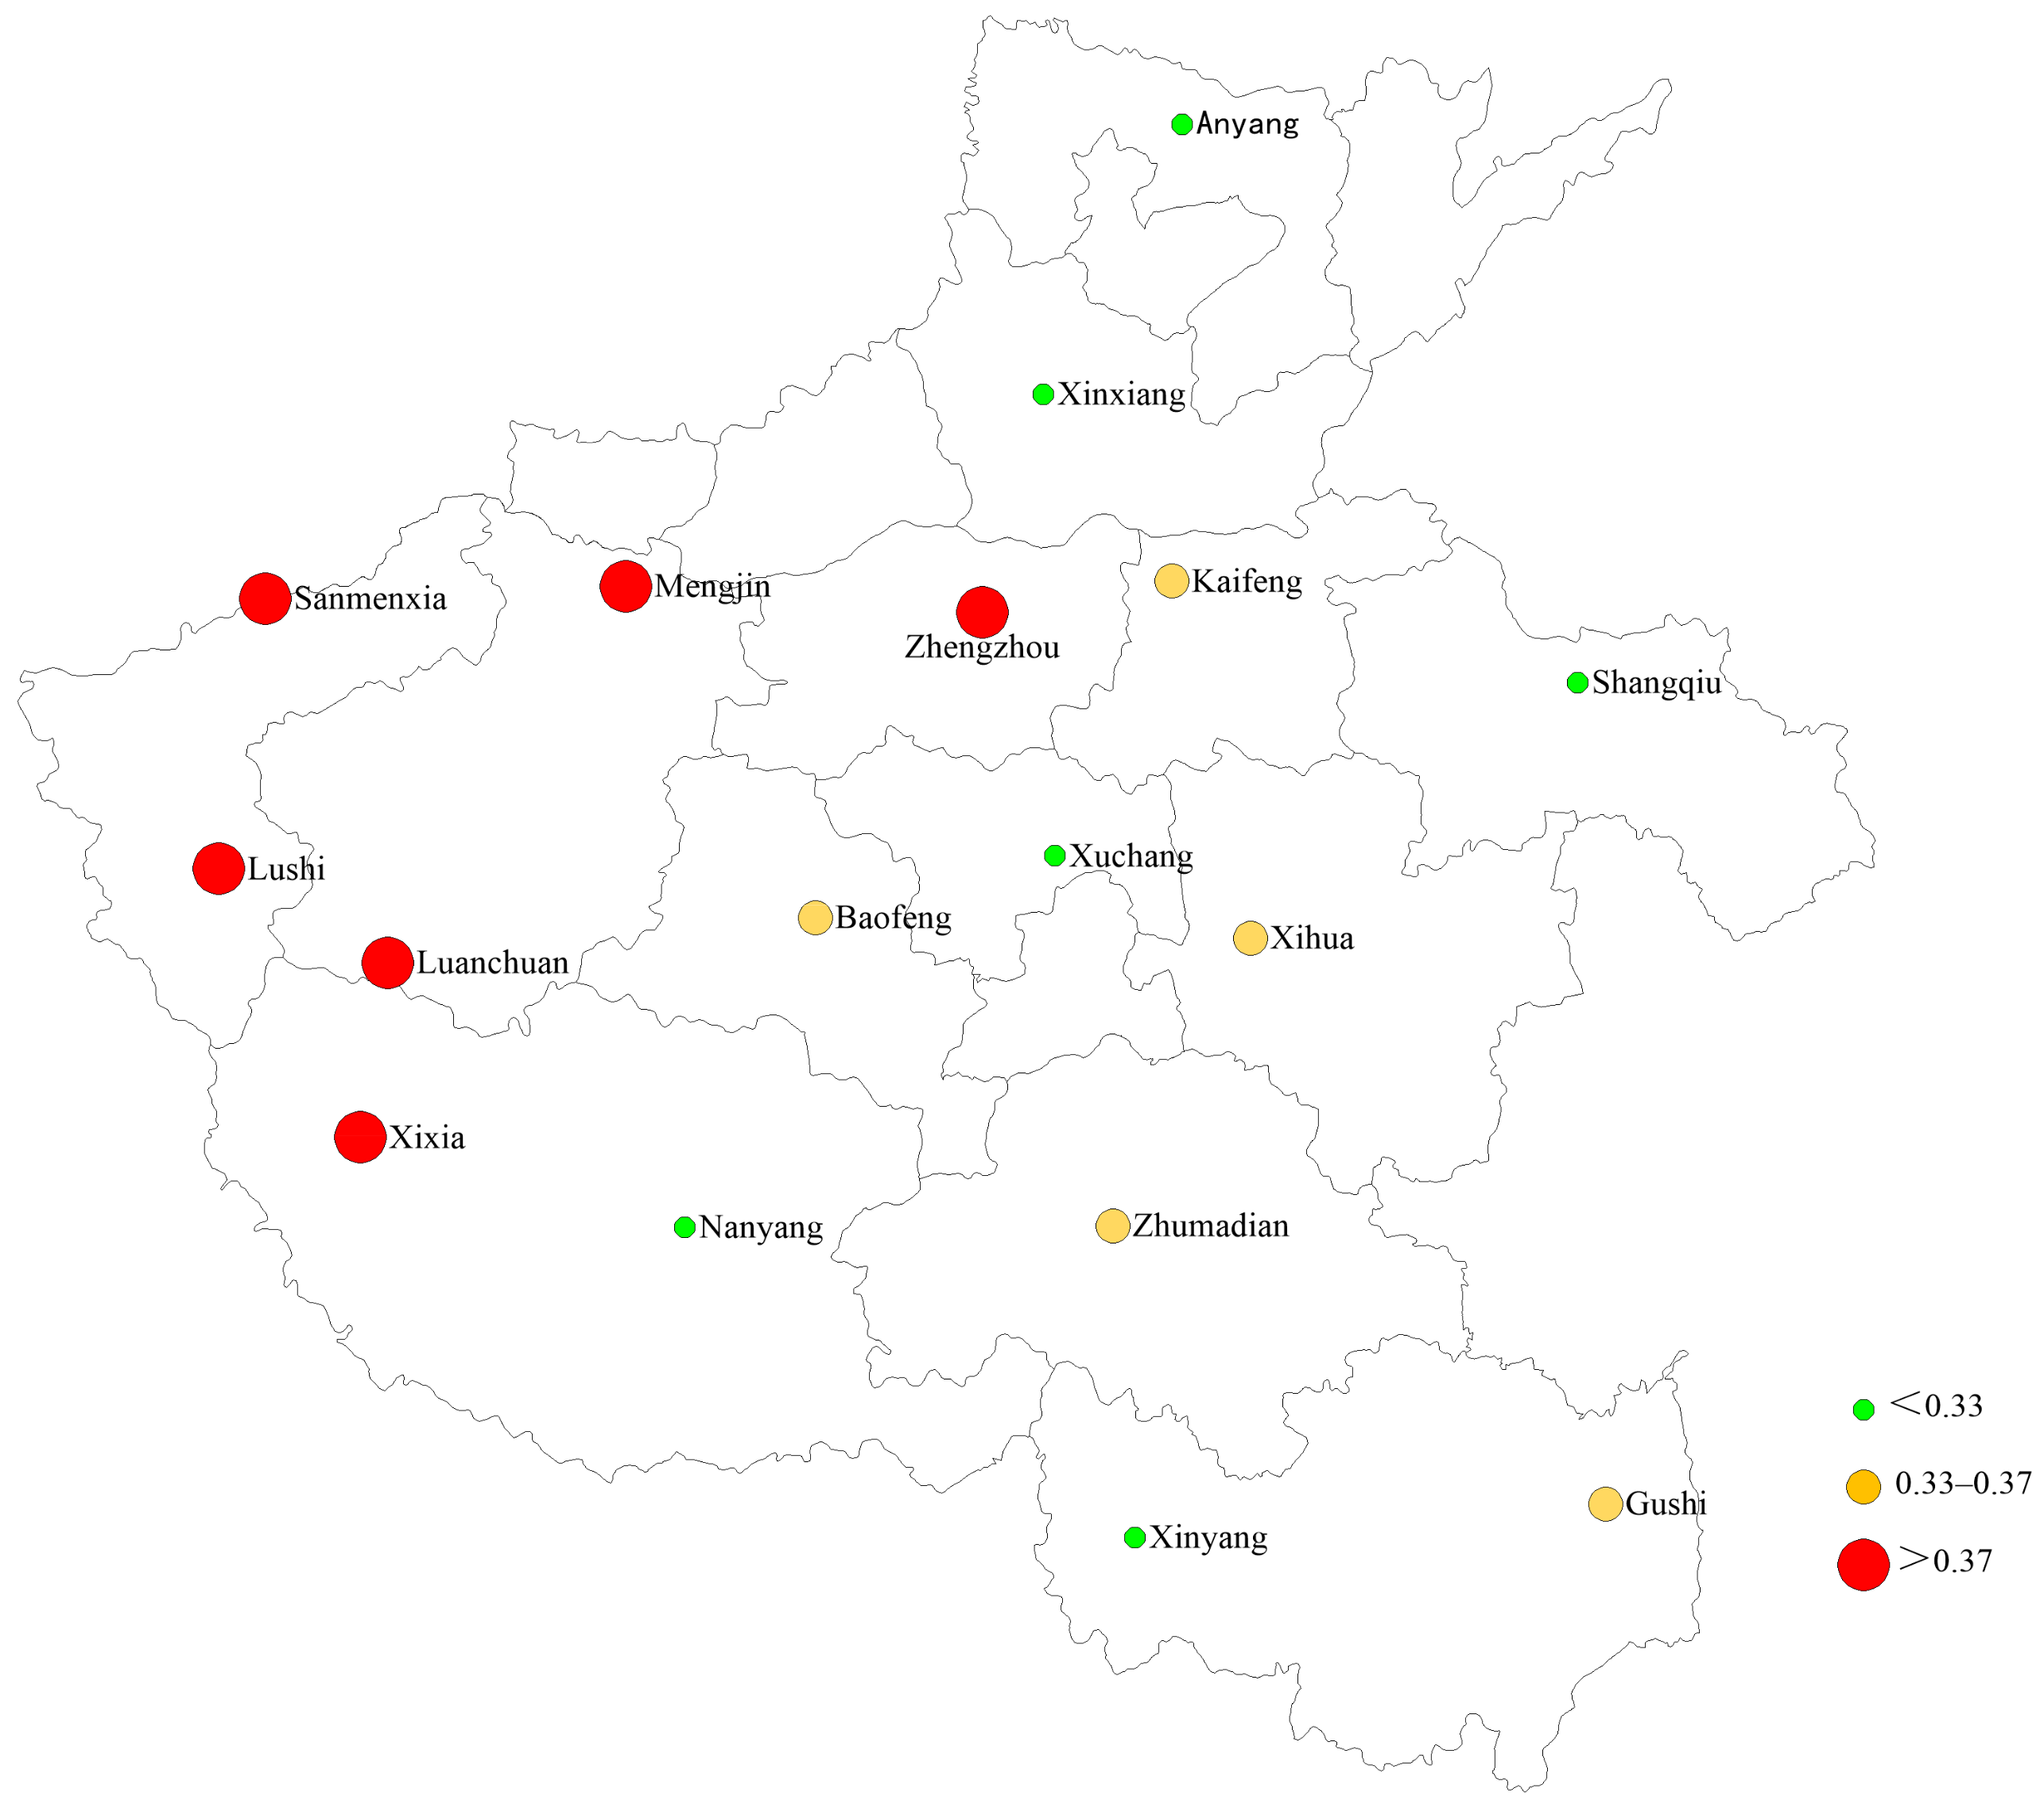
Figure 10 shows the spatial distribution pattern of DTF intensity, and Figure 11 shows the monthly intensity distributions at the 17 meteorological stations. DTF events of greater mean intensity (>1.14) were identified at six stations, mainly concentrated in the central and southern stations. Gushi station had the maximum intensity (1.37), while Nanyang station had the minimum intensity (0.92). In terms of monthly distribution (Figure 11), June and July each had the maximum monthly DTF intensity at five stations (29%), followed by August at four stations (24%) and September at three stations (18%). This suggests clear station-scale differences in the month of peak DTF intensity.
Figure 10.
Spatial distribution of the mean intensity of DTF events during the period of 1951–2020.
Figure 11.
Monthly intensity distributions of DTF events at 17 meteorological stations in Henan Province: (a) June; (b) July; (c) August; and (d) September.
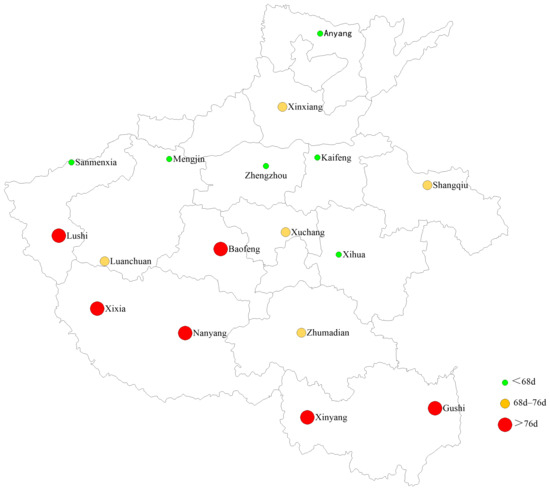
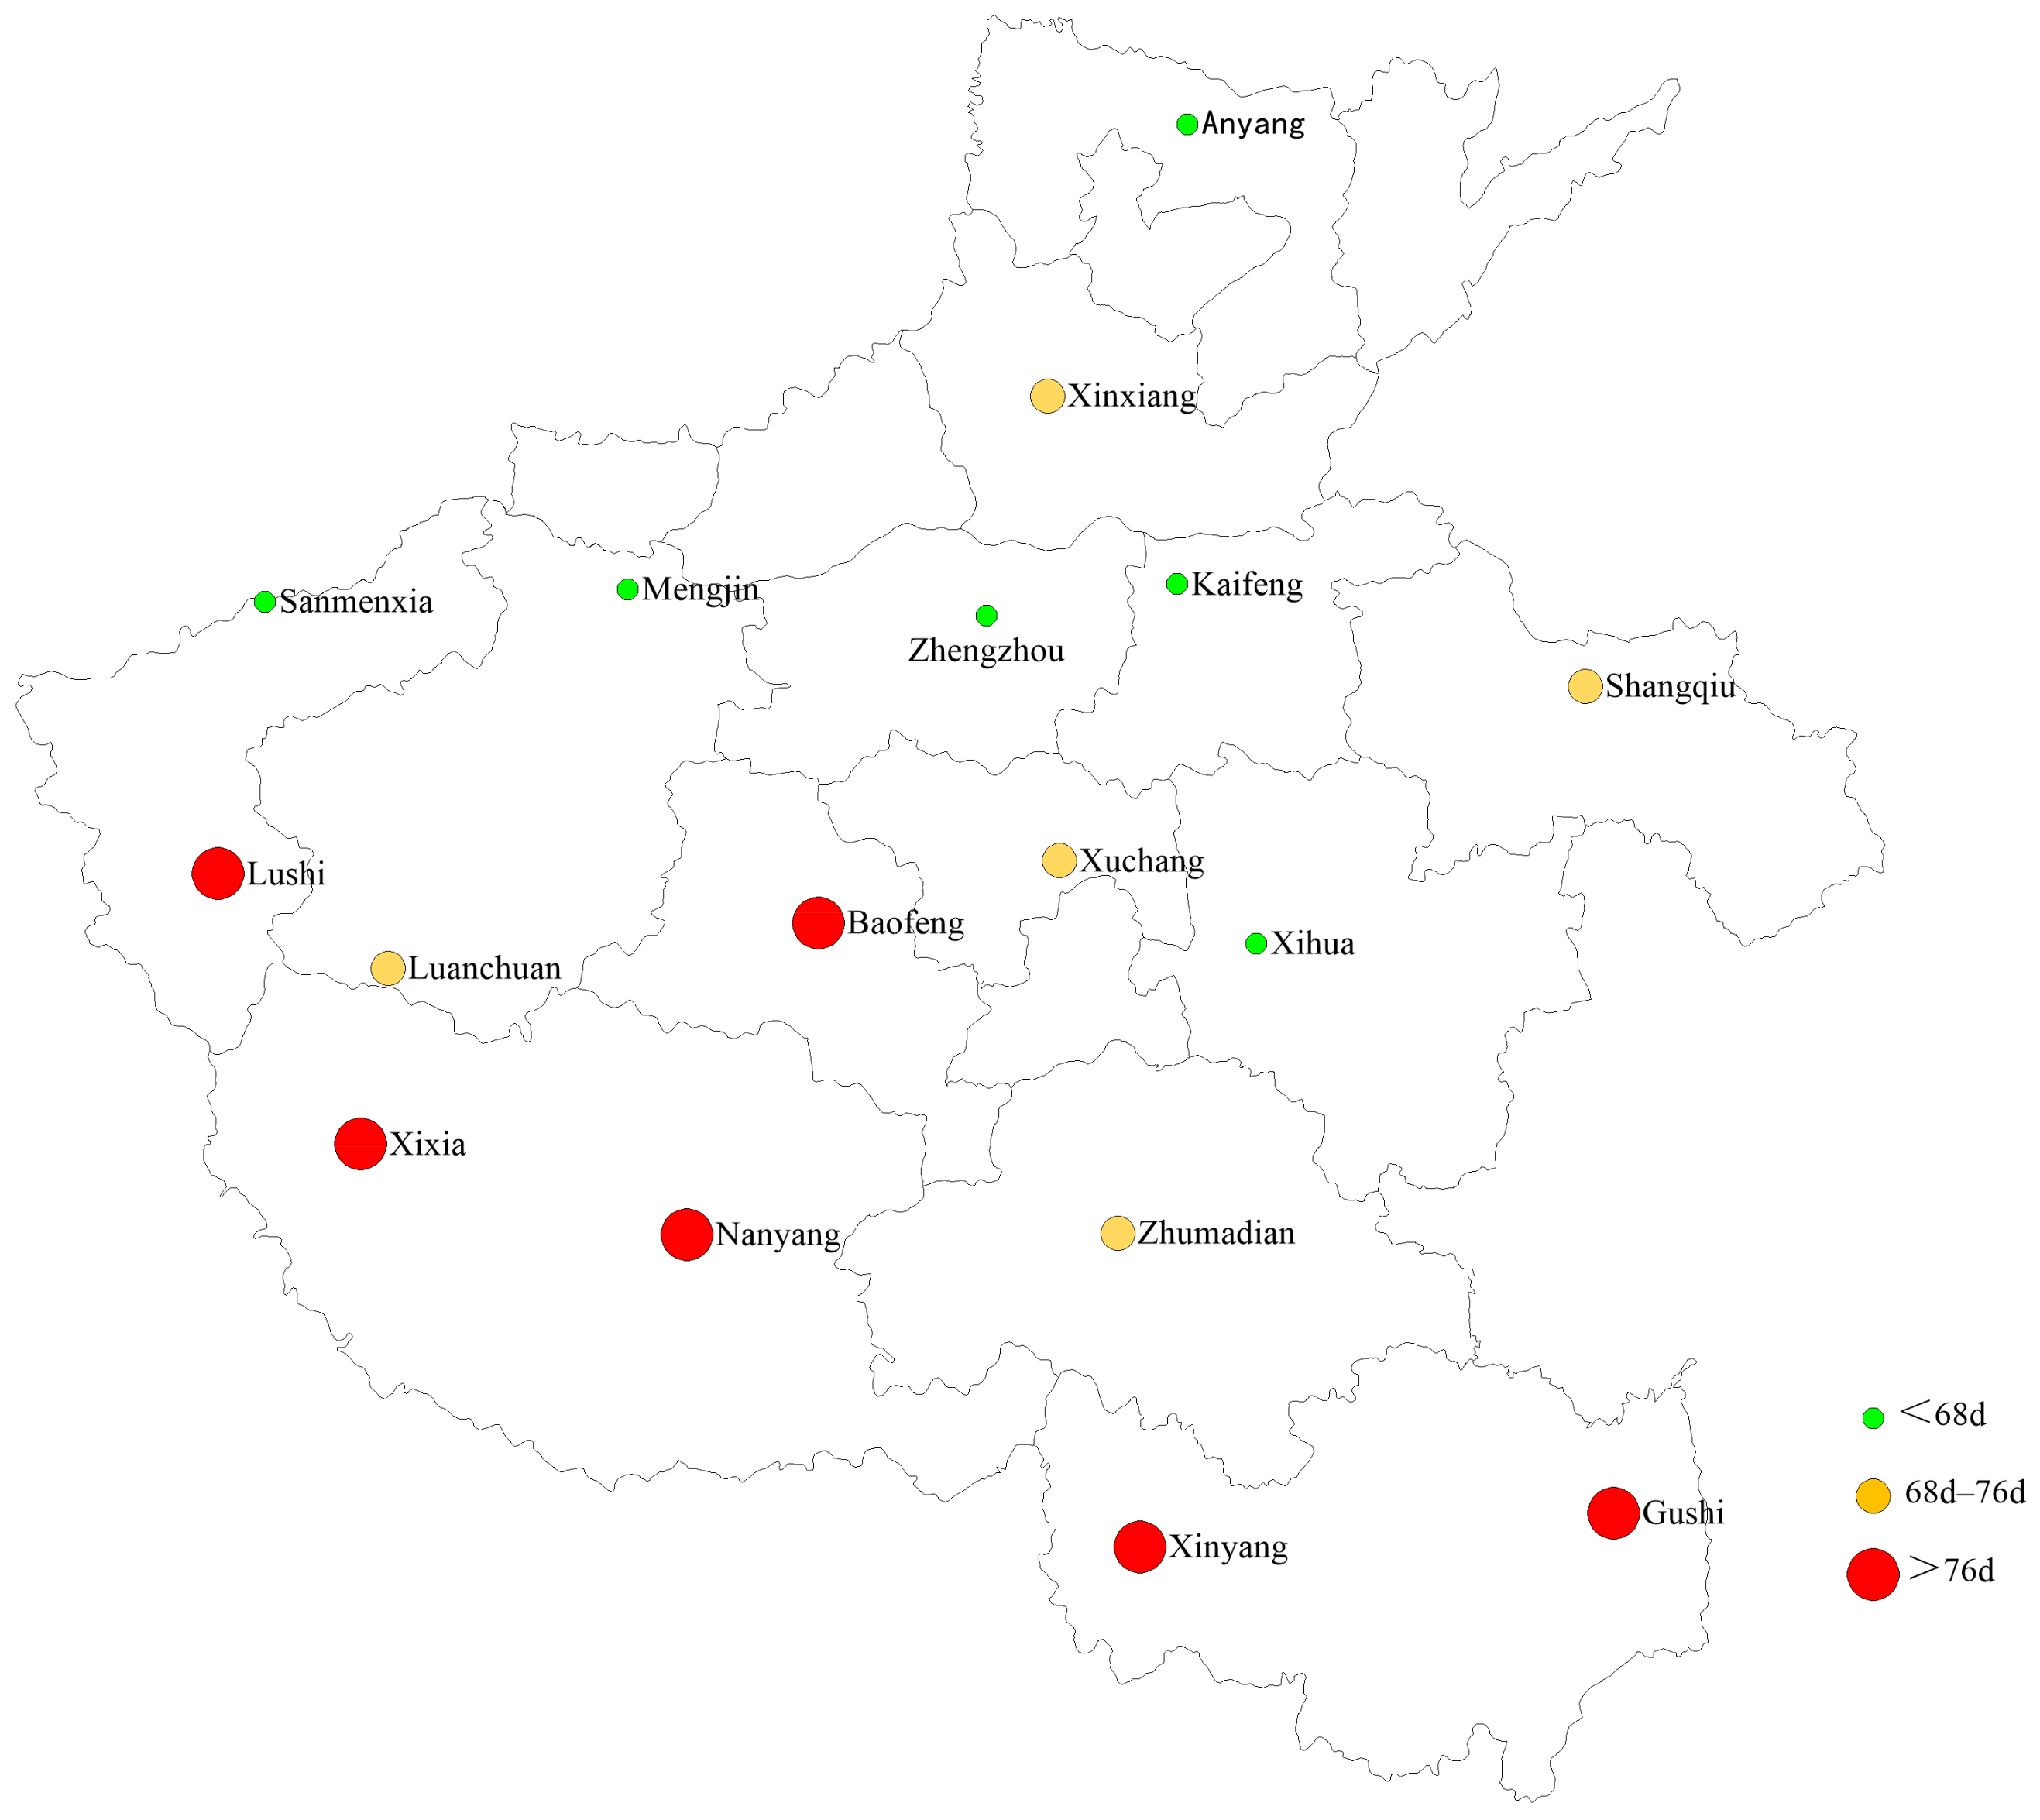
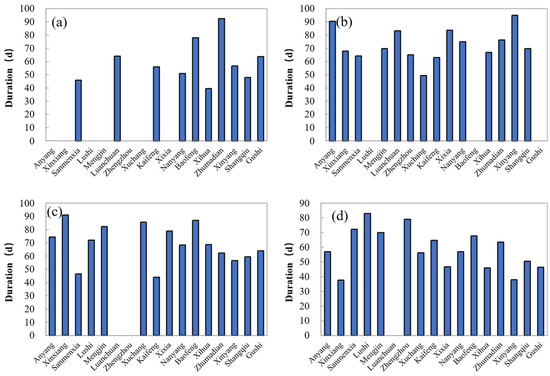
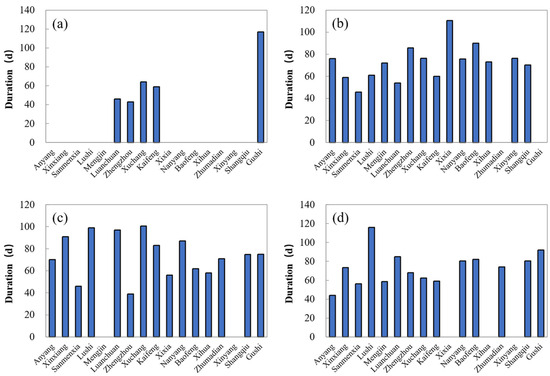
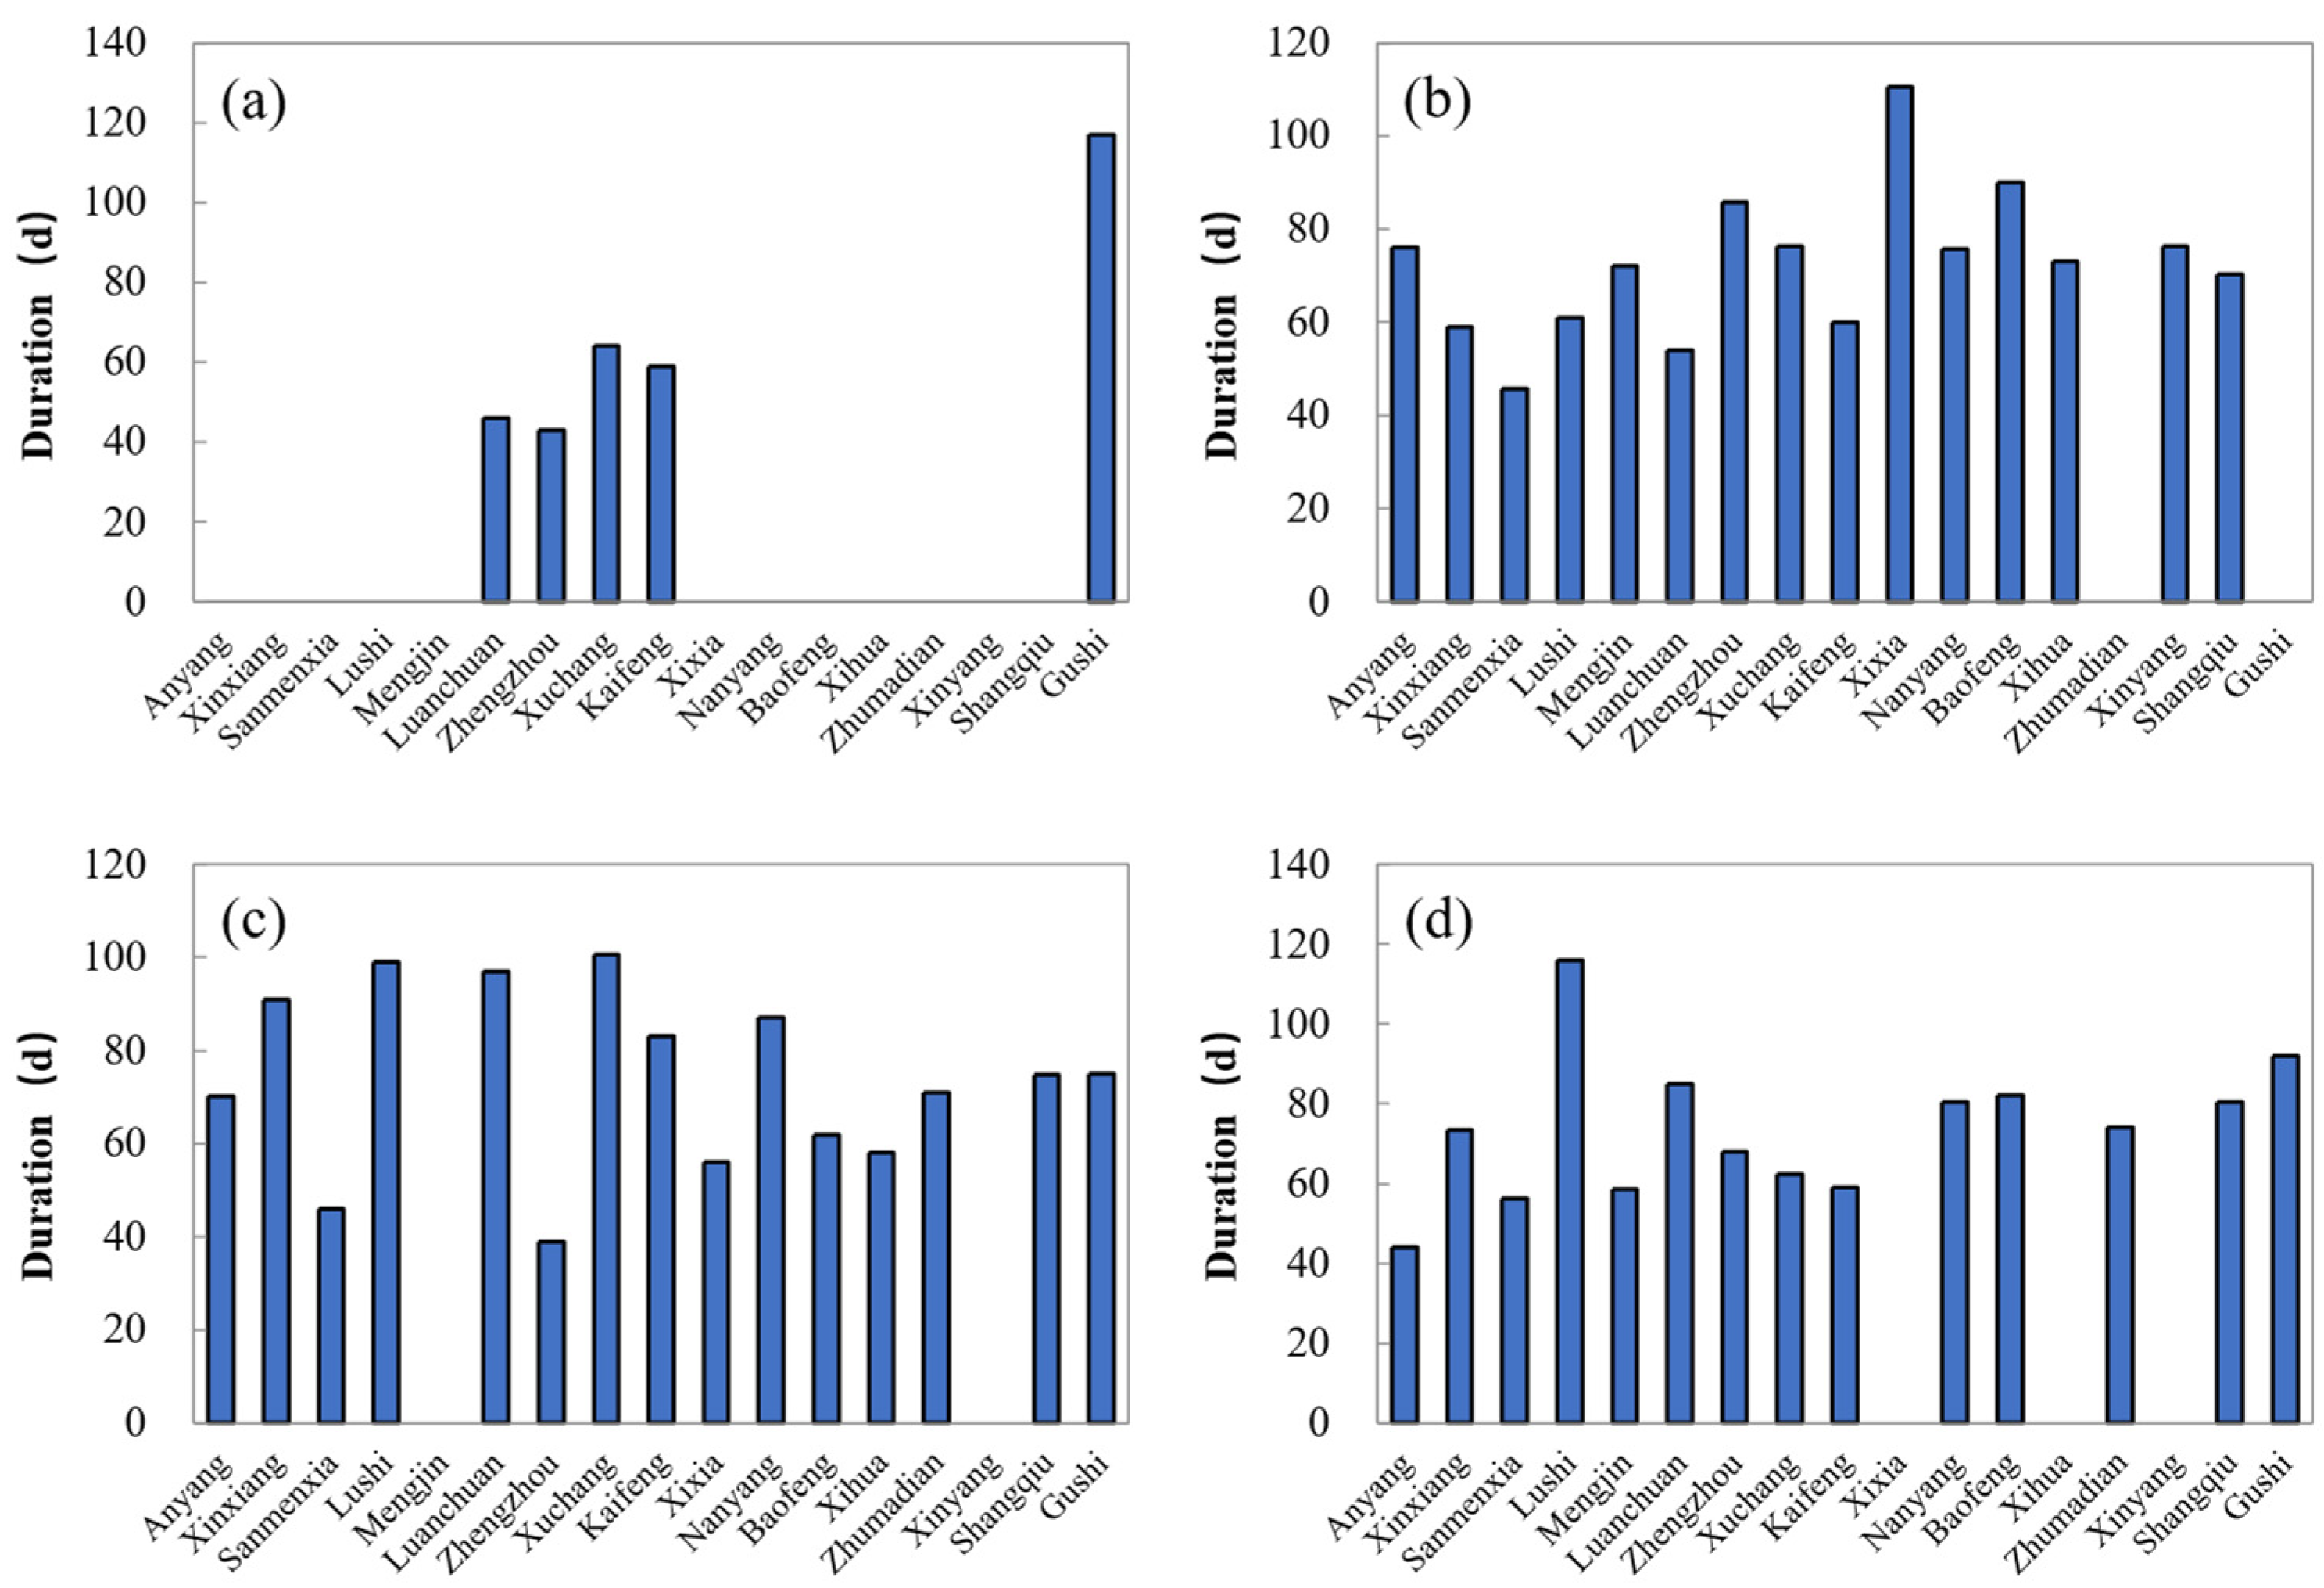
Figure 12 presents the spatial variation of DTF events in duration, and Figure 13 presents the monthly duration distributions at the 17 meteorological stations. There were nine stations in the short-duration category, six stations in the medium-duration category, and two stations in the long-duration category. Baofeng station had the longest duration (77.6 d), while Xihua station had the shortest duration (55.3 d). In terms of monthly distribution (Figure 13), the longest DTF duration occurred most often in July and August. Specifically, July and August each accounted for six stations (35%), followed by September at four stations (24%) and June at one station (6%), indicating that DTF events occurring in June generally had relatively shorter durations, and the monthly mean duration of DTF events generally increased from June to September.
Figure 12.
Spatial distribution of the mean duration of DTF events during the period of 1951–2020.
Figure 13.
Monthly duration distributions of DTF events at 17 meteorological stations in Henan Province: (a) June; (b) July; (c) August; and (d) September.
3.3.2. Spatial Distribution of FTD Events
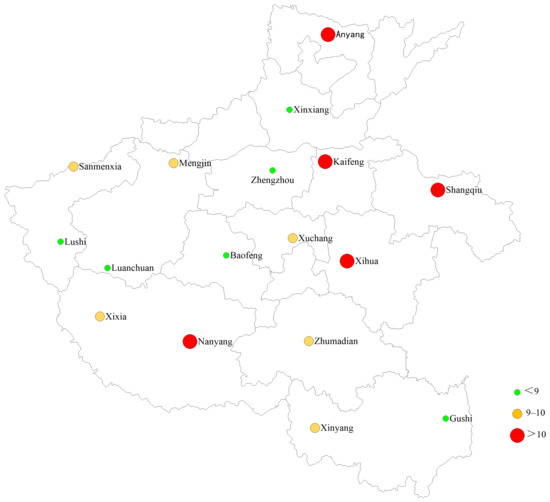
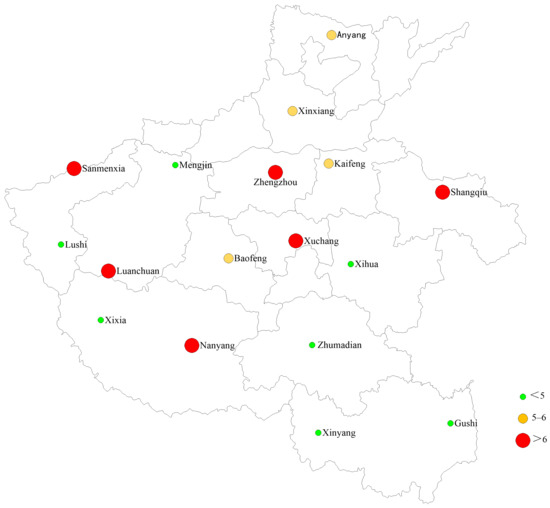
Figure 14 presents the station-scale spatial distribution of FTD event frequency during the period of 1951–2020, and Figure 15 shows the monthly frequency distributions at the 17 meteorological stations. Stations with relatively high frequency (≥7) were mainly distributed in the eastern, northern, and southwestern parts of Henan Province, and seven stations had a frequency below 5. Shangqiu station had the maximum frequency (11), while Zhumadian station had the minimum frequency (2). In terms of monthly distribution (Figure 15), the month with the highest FTD frequency differed among stations, with August and September each being one of the peak months at eight stations (47%). No station recorded its maximum FTD frequency in June.
Figure 14.
Spatial distribution of the frequency of FTD events during the period of 1951–2020.
Figure 15.
Monthly frequency distributions of FTD events at 17 meteorological stations in Henan Province: (a) June; (b) July; (c) August; and (d) September.
Figure 16 presents the spatial variation of FTD event intensity, and Figure 17 presents the monthly intensity distributions at the 17 meteorological stations. The inter-station variation in intensity was small; relatively higher intensity was observed at stations located in eastern Henan Province. Lushi station had the maximum intensity (0.48), while Xinyang station recorded the minimum mean intensity (0.30). In terms of monthly distribution (Figure 17), the maximum intensity of FTD events occurred in July at 11 stations (65%). No station recorded its maximum FTD intensity in September, indicating that the peak monthly intensity of FTD events was mainly concentrated in July and August.
Figure 16.
Spatial distribution of the mean intensity of FTD events during the period of 1951–2020.
Figure 17.
Monthly intensity distributions of FTD events at 17 meteorological stations in Henan Province: (a) June; (b) July; (c) August; and (d) September.
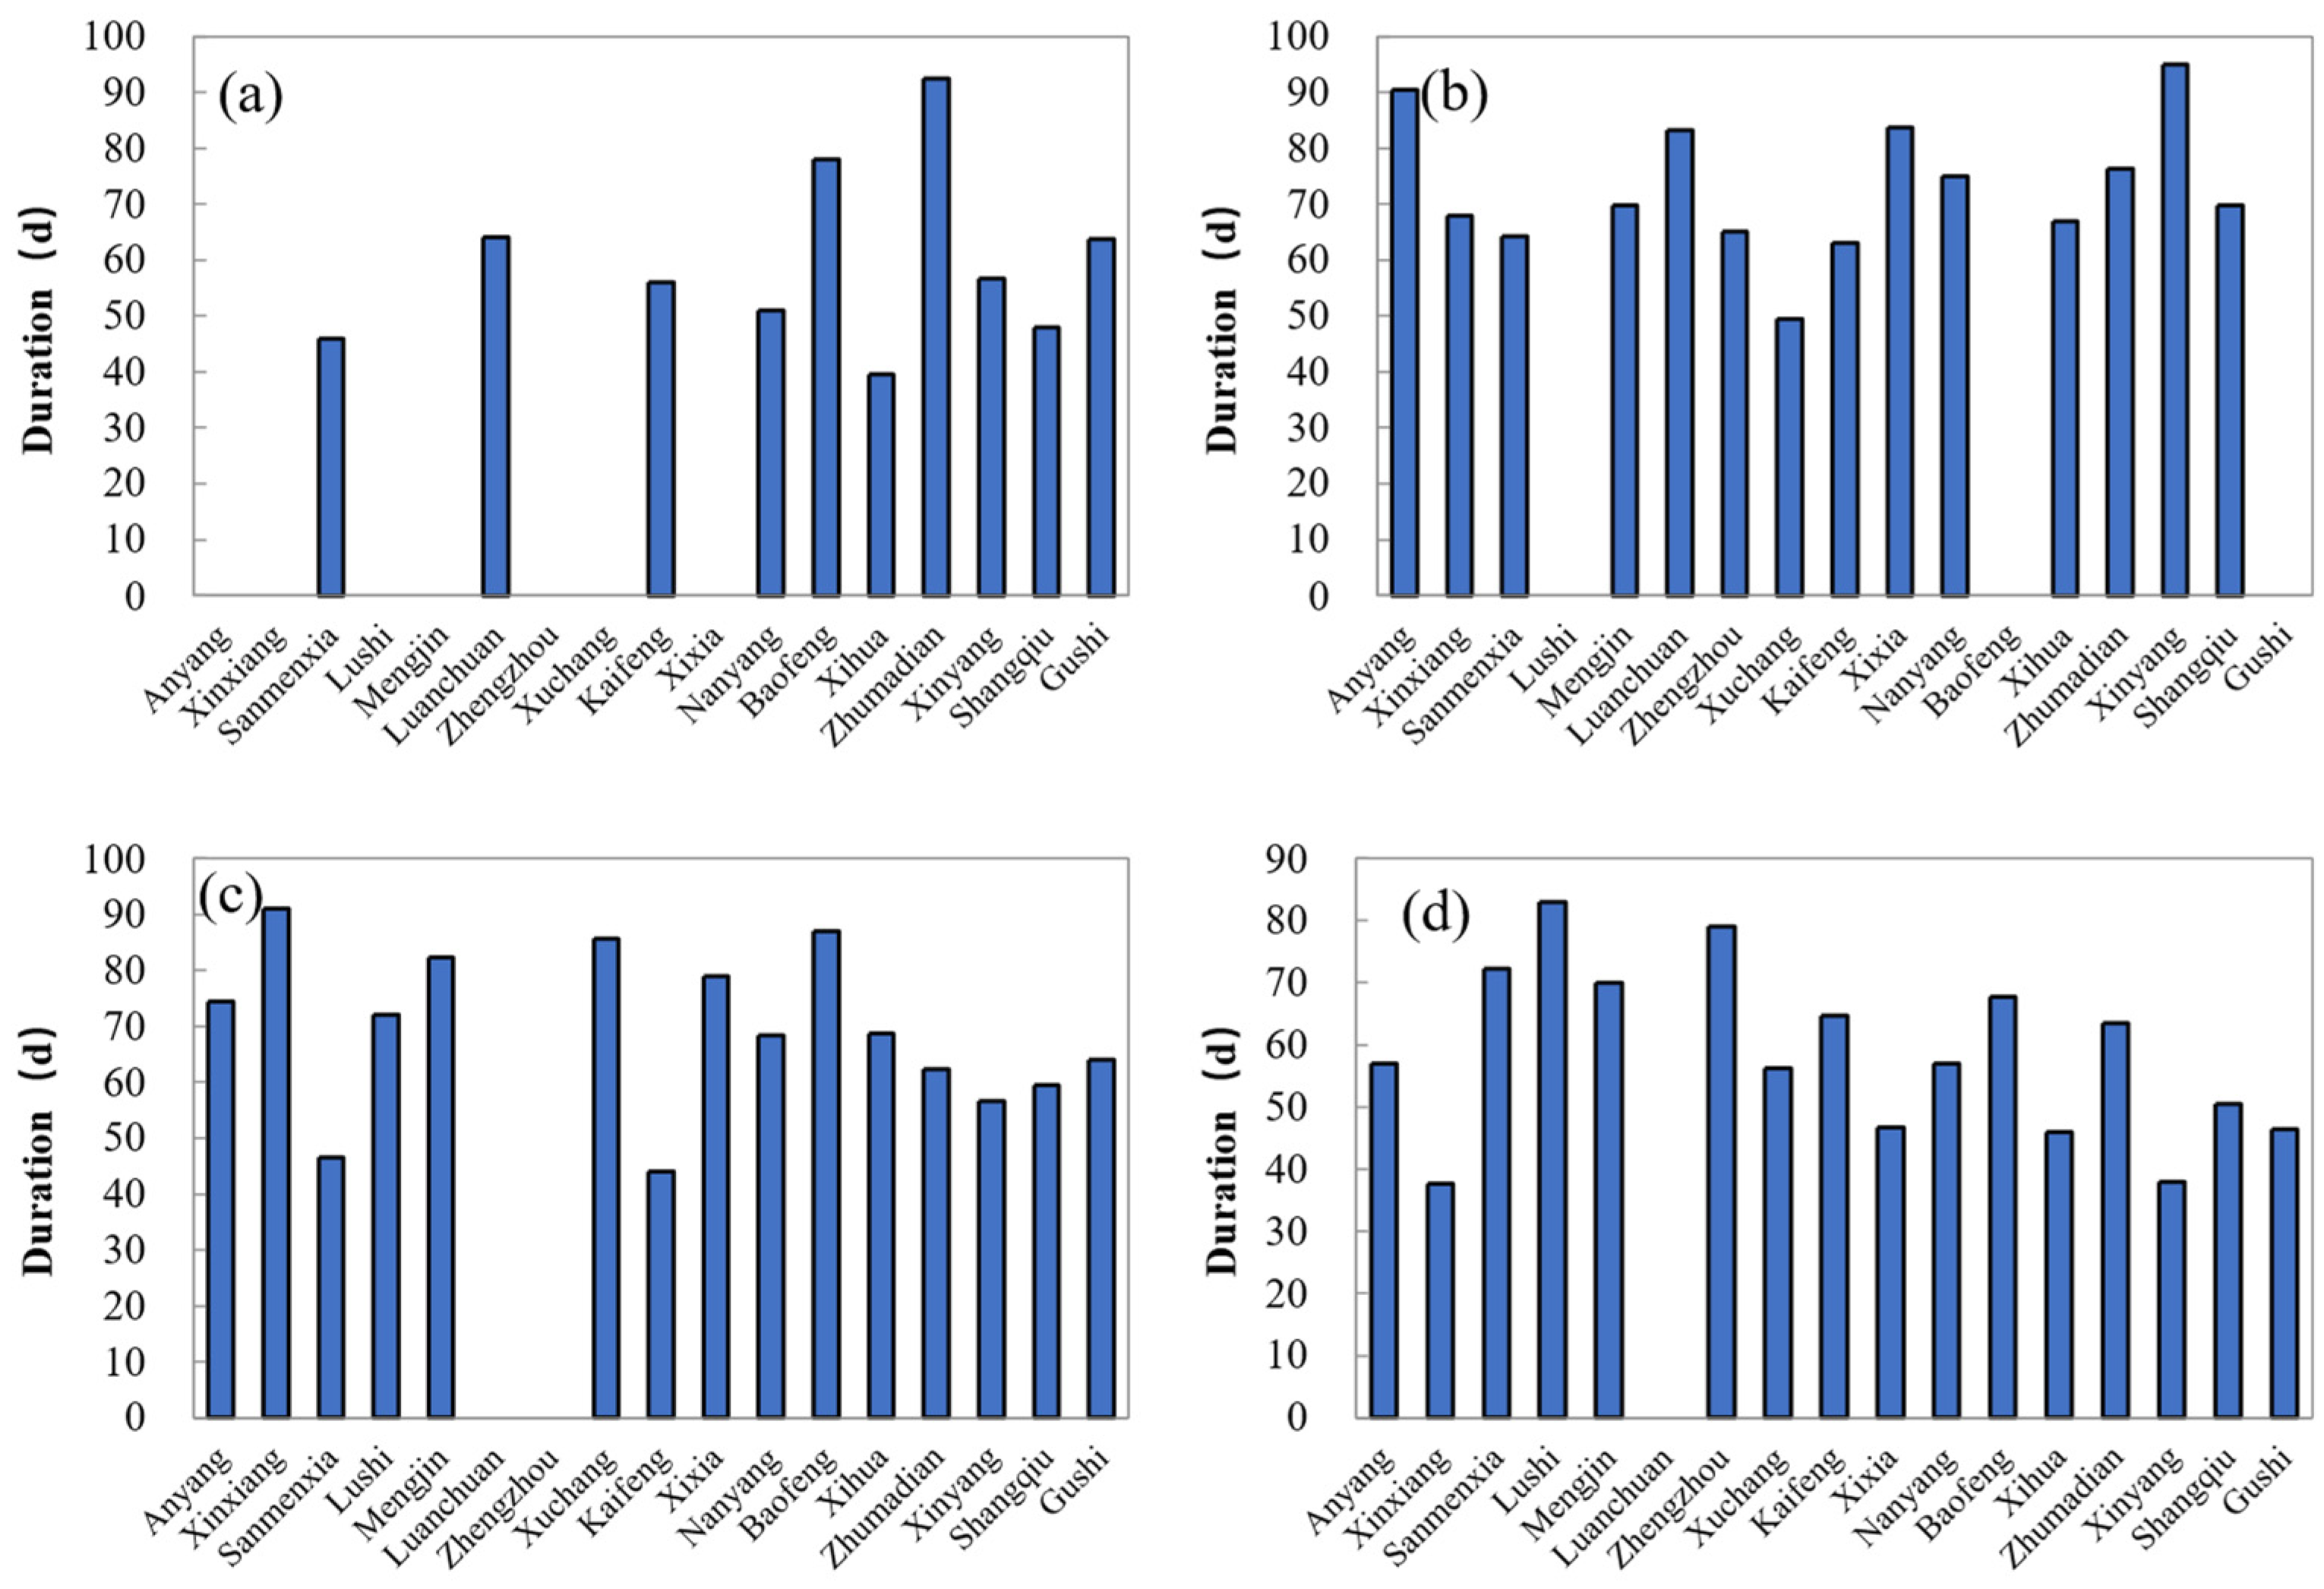
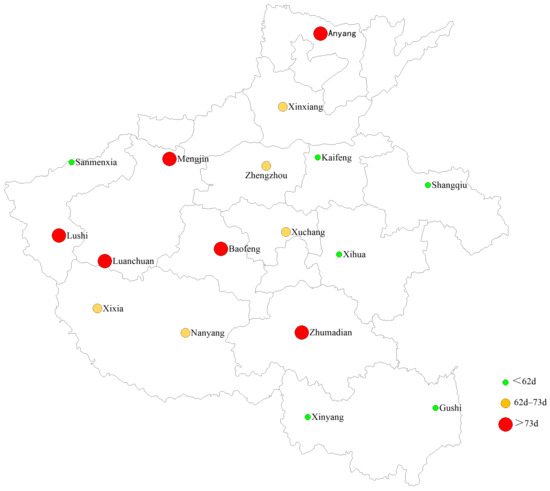
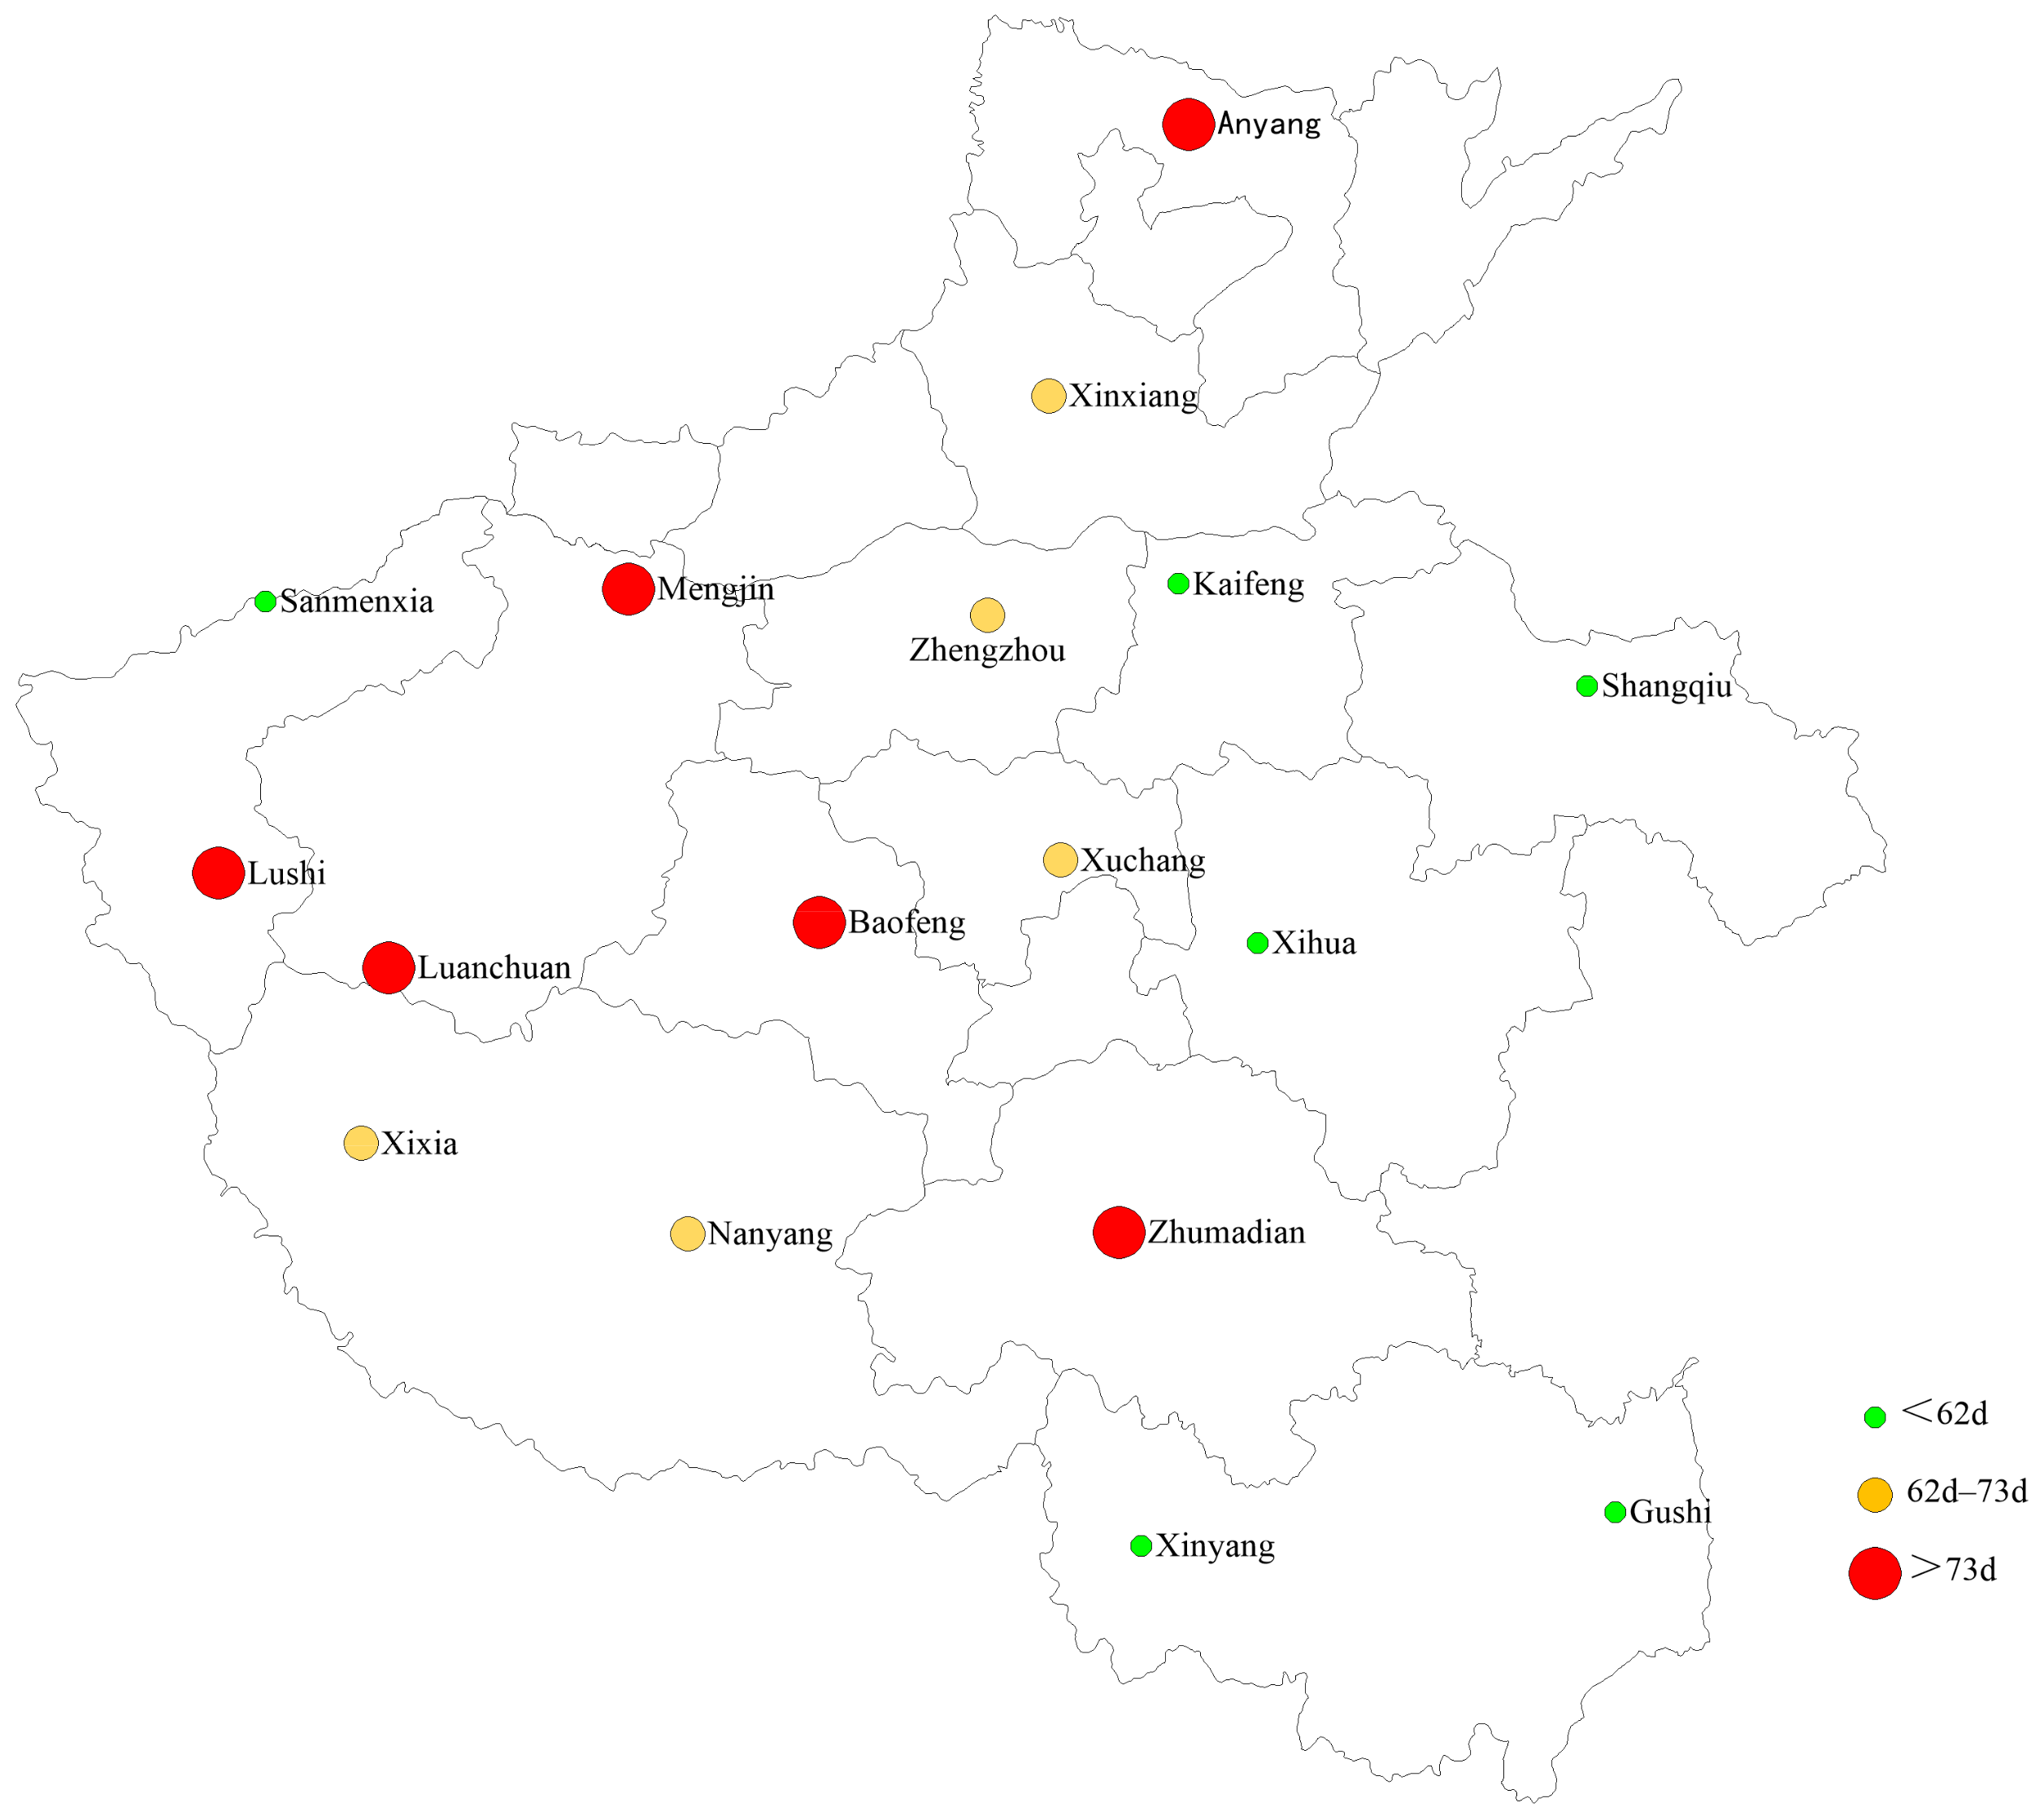
In Figure 18, FTD event duration is shown to be generally longer (>70 d) in the western and southern stations of Henan Province. Gushi station had the longest mean duration (94.7 d), and Sanmenxia station had the shortest mean duration (49.3 d). In terms of monthly distribution (Figure 19), the maximum FTD duration occurred most frequently in July, accounting for seven stations (41%), and least frequently in June, accounting for only one station (6%). This monthly pattern was similar to that of DTF duration, suggesting that both types of DFAA events generally had shorter durations in June.
Figure 18.
Spatial distribution of the mean duration of FTD events during the period of 1951–2020.
Figure 19.
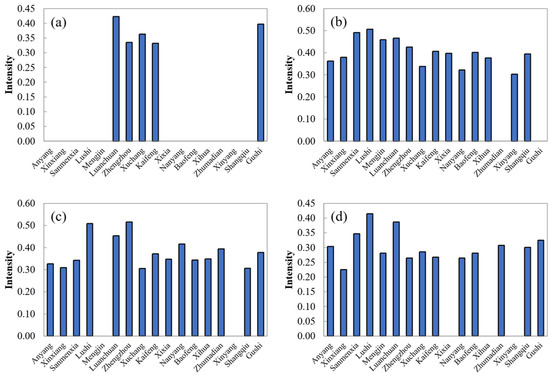
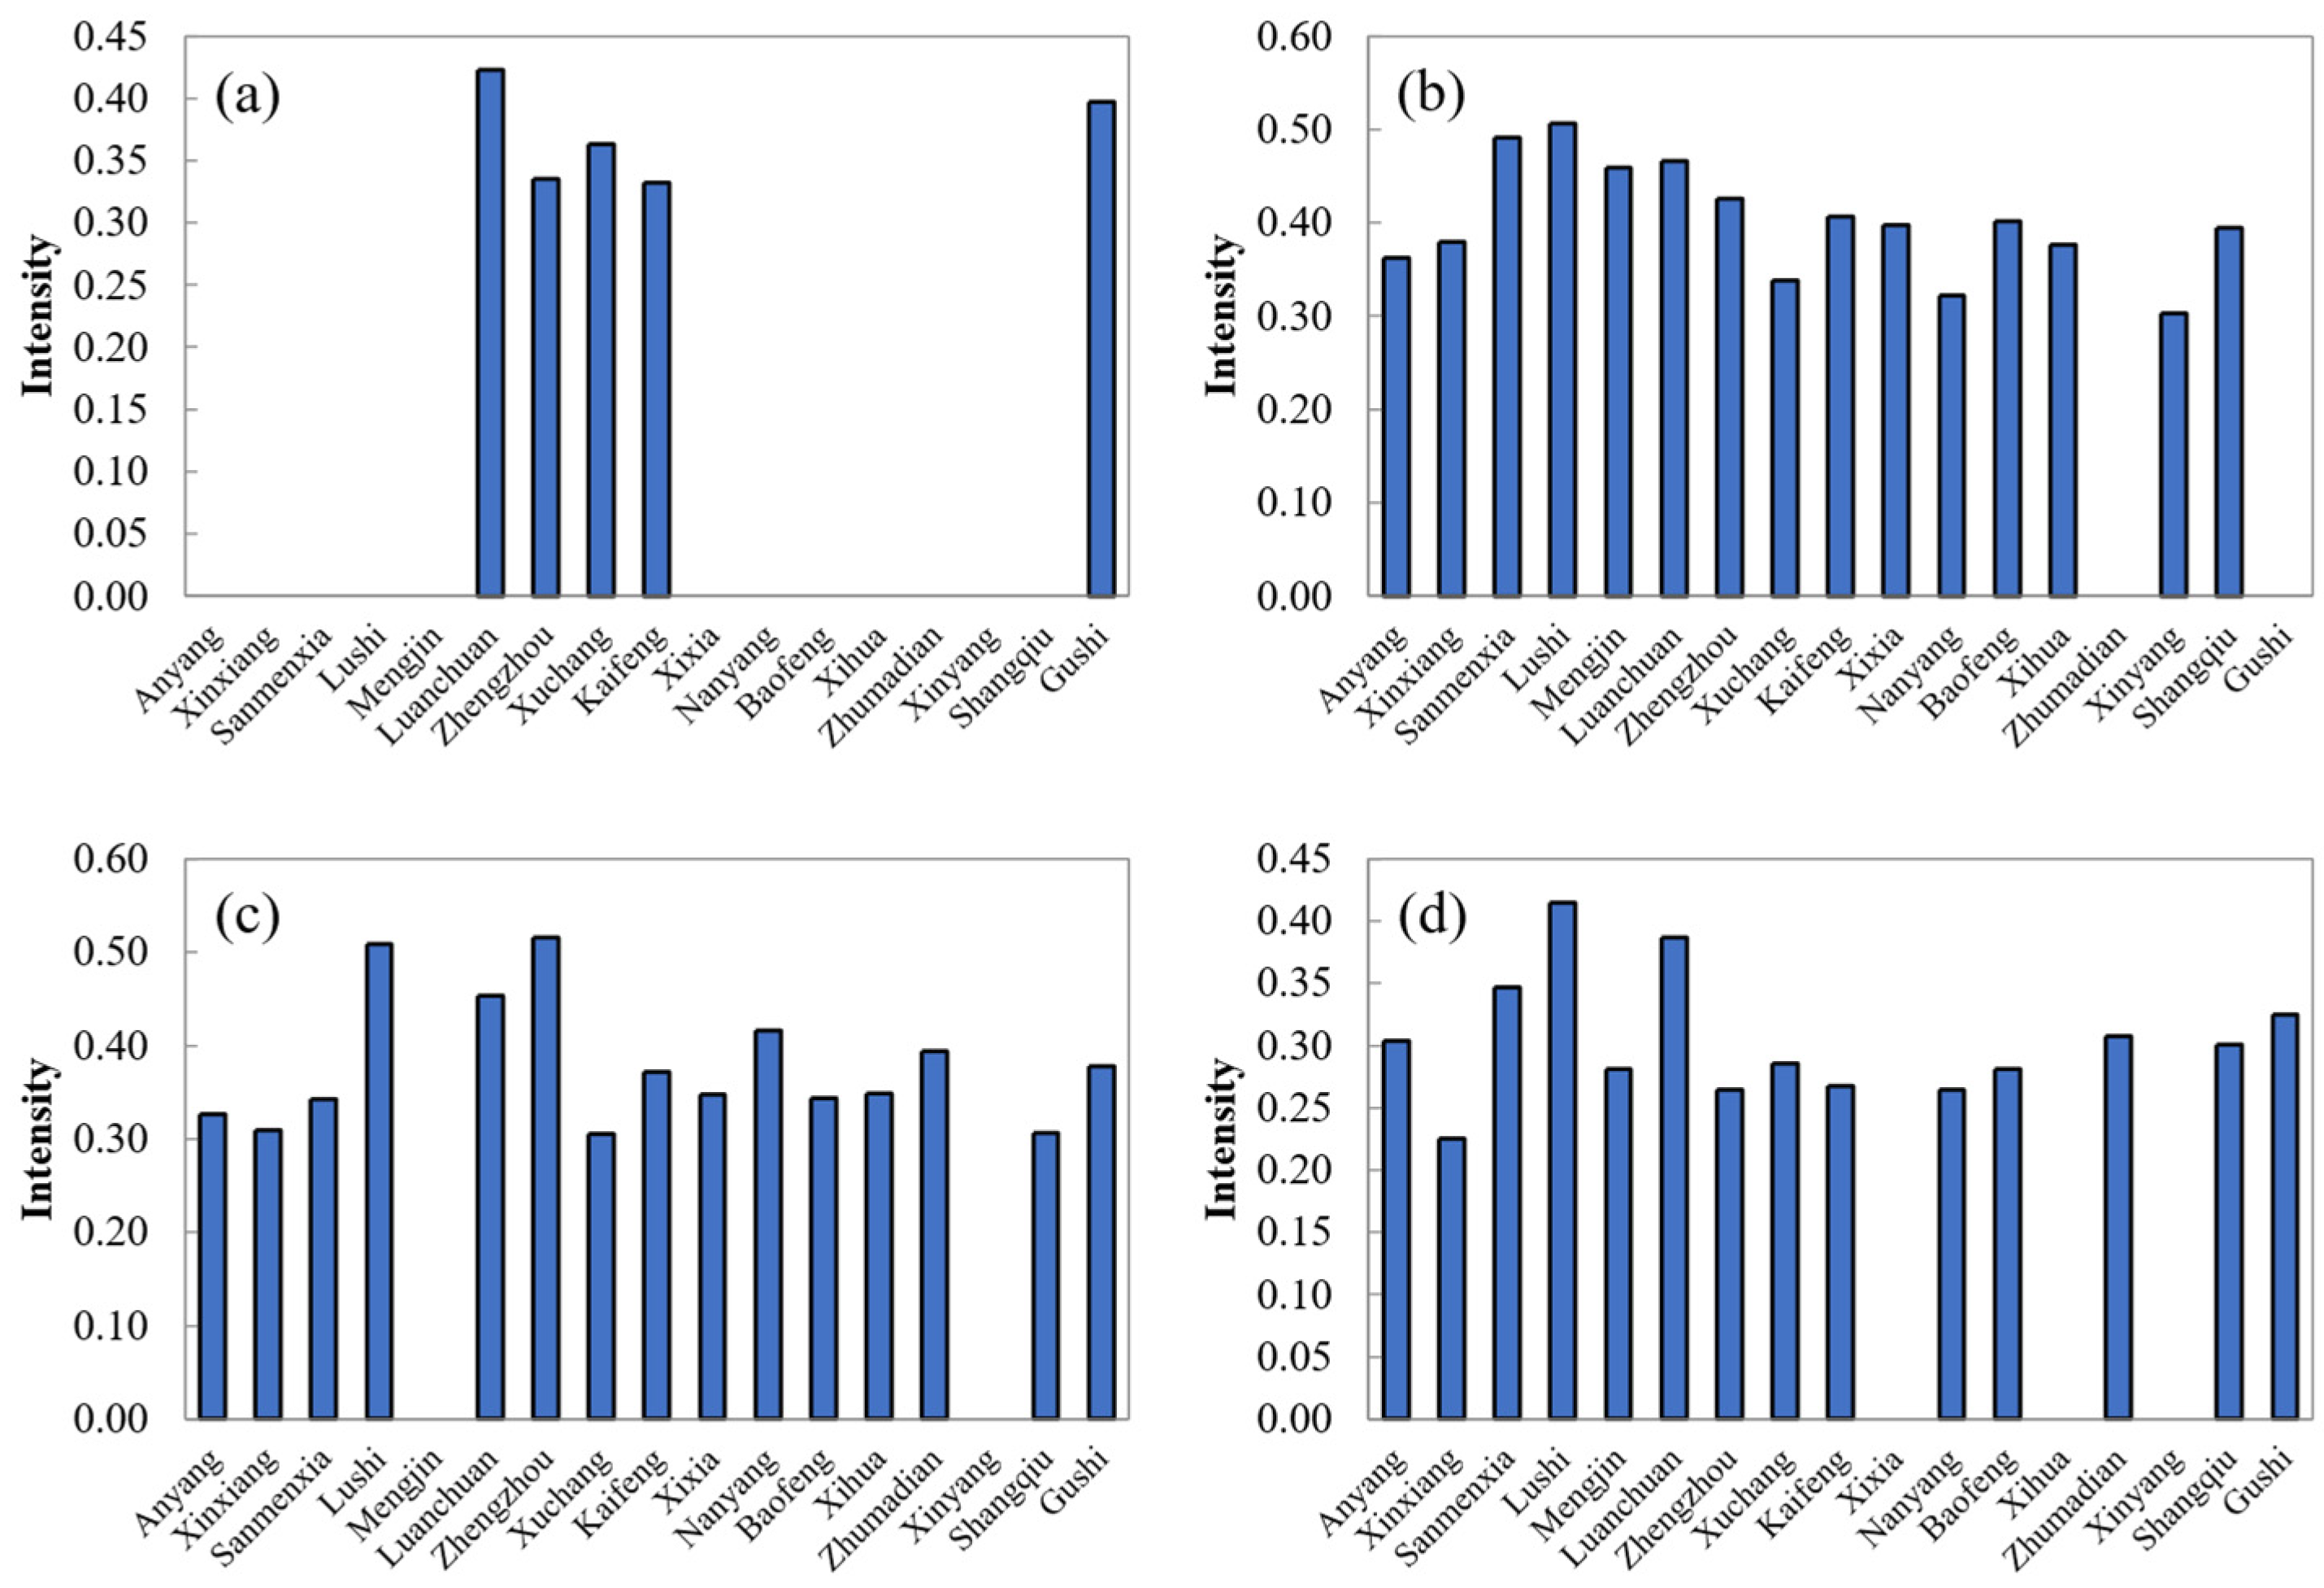
Monthly duration distributions of FTD events at 17 meteorological stations in Henan Province: (a) June; (b) July; (c) August; and (d) September.
4. Discussion
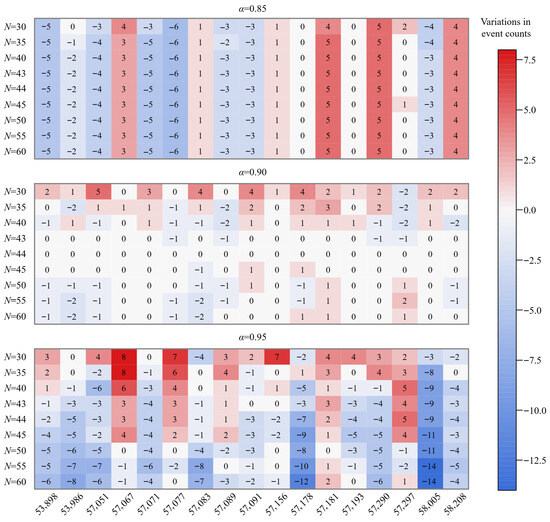
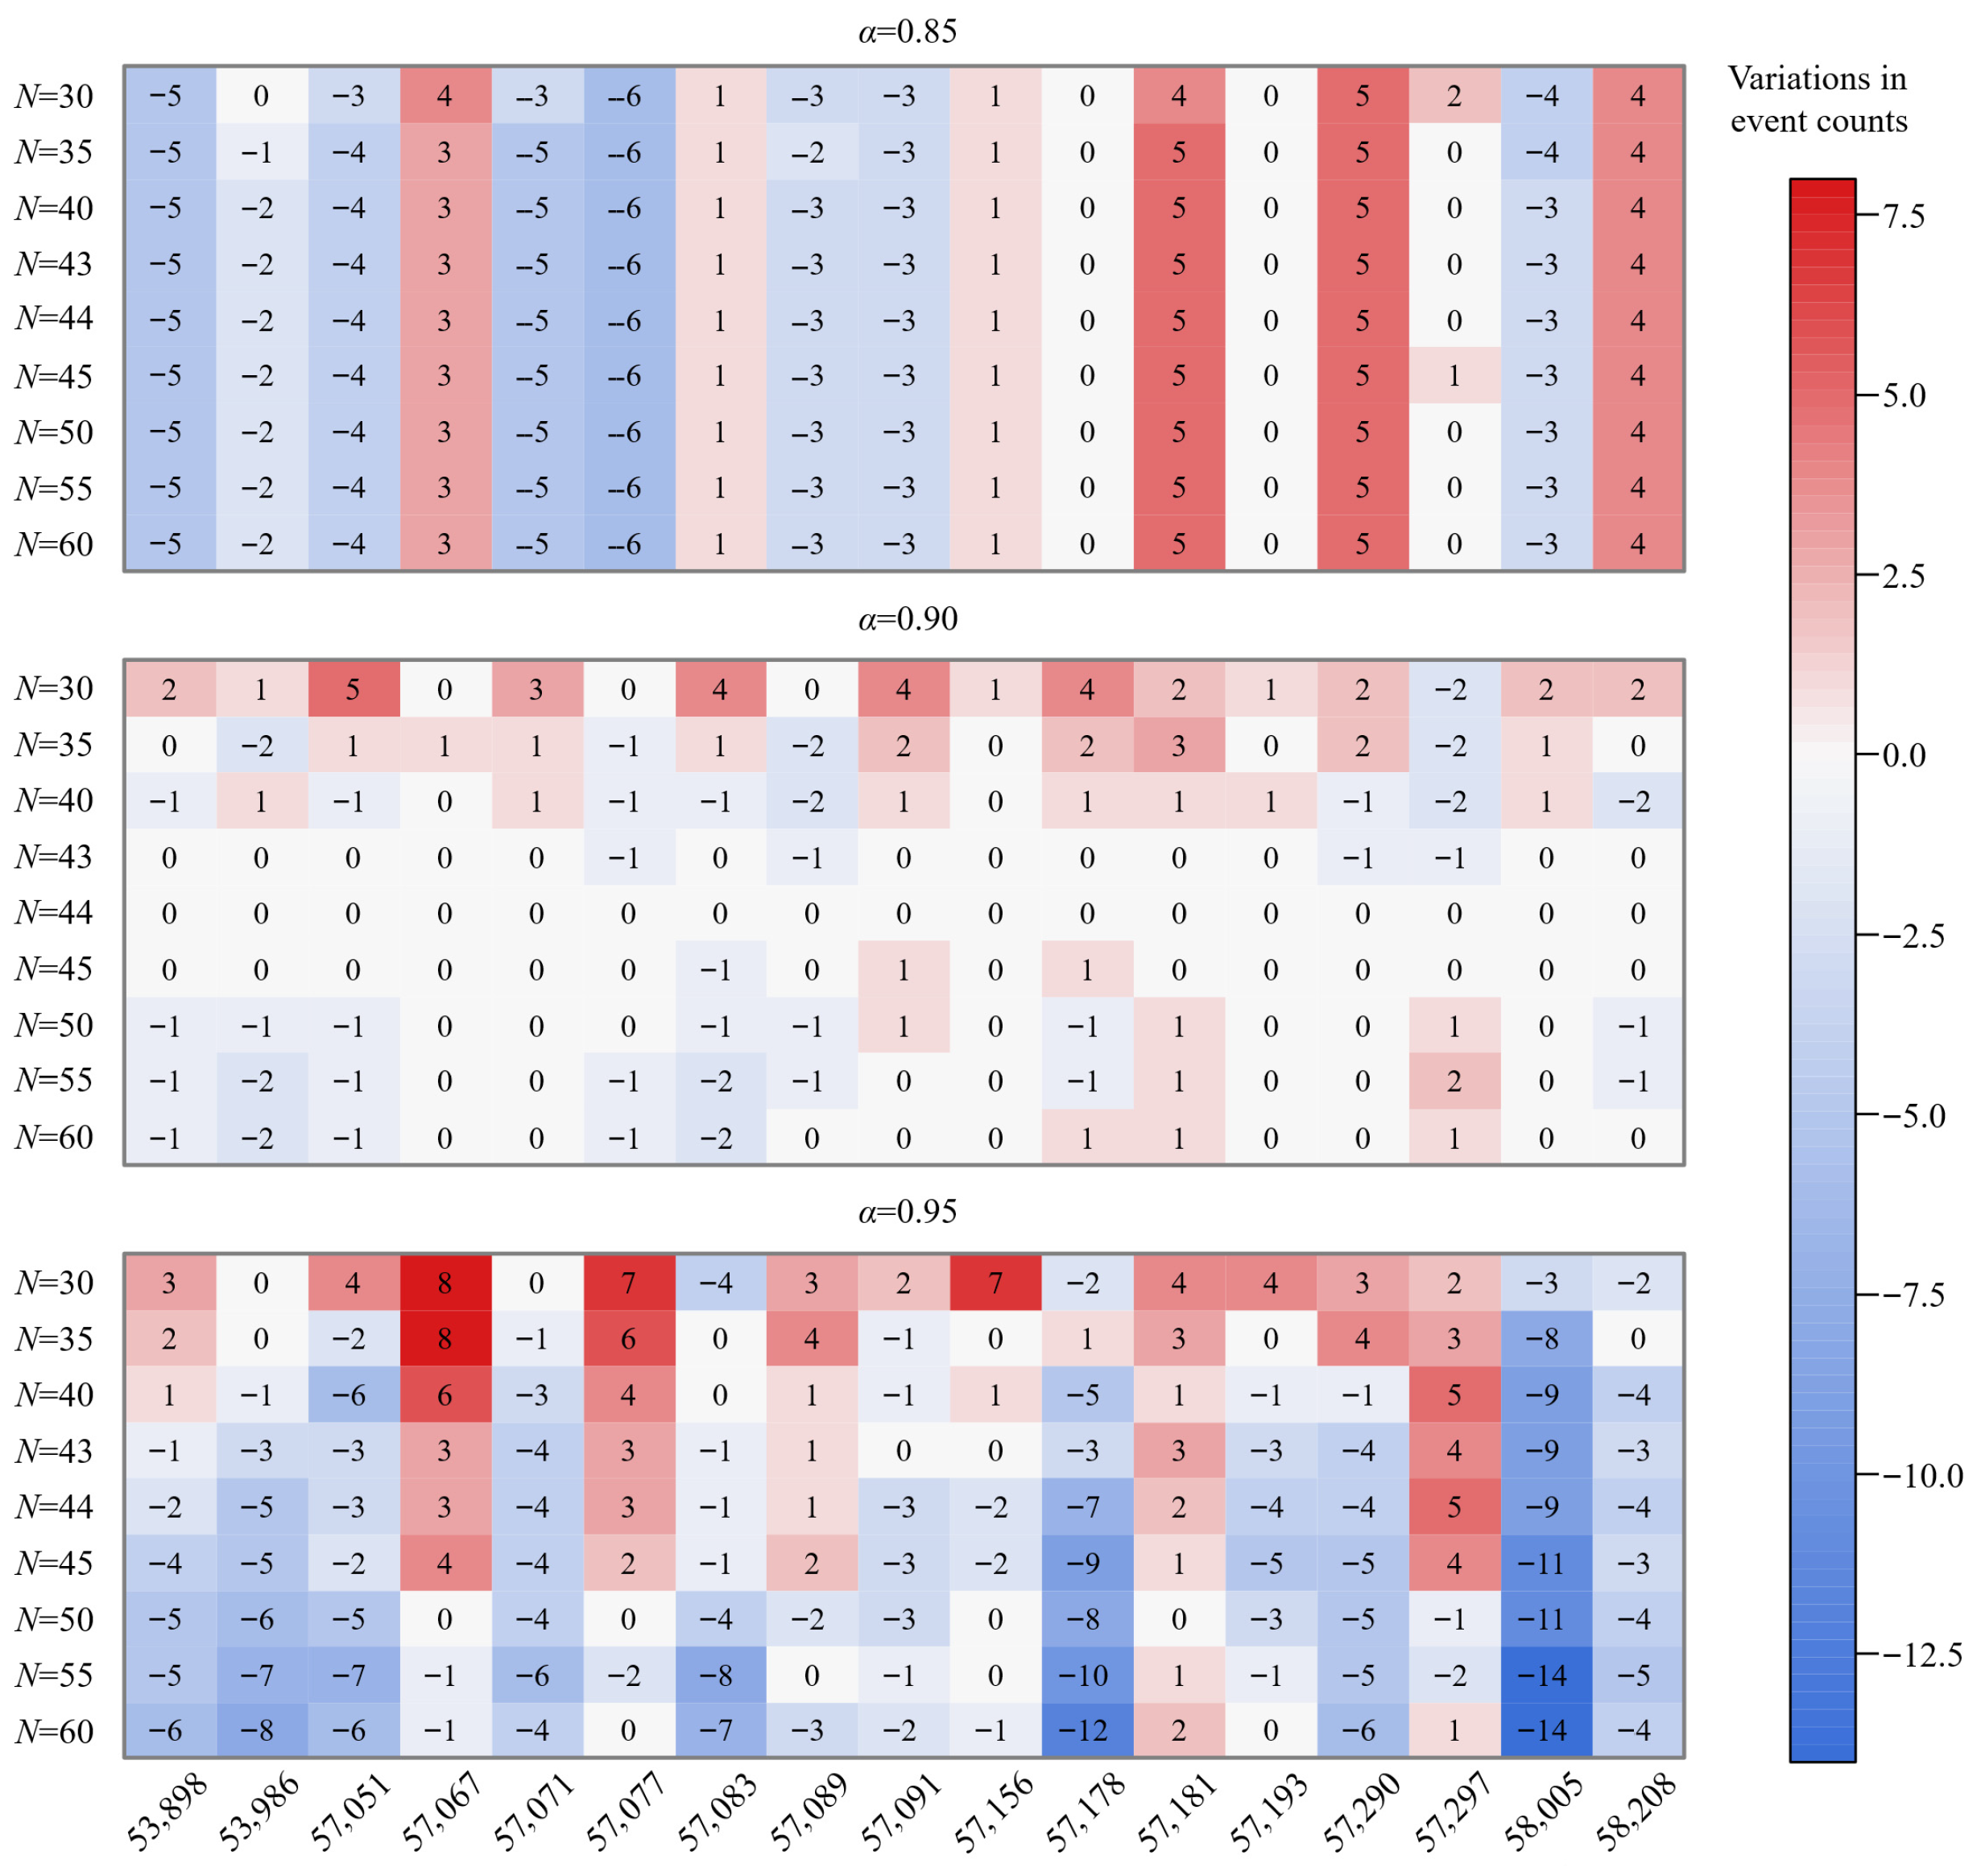
The calculation of the SWAP index assumes that the WAP series follows a Gamma distribution. In this study, the goodness-of-fit test for the Gamma distribution showed that at the 0.05 significance level, approximately 93.3% of the station–calendar day WAP samples passed the KS, AD, and chi-square tests. However, the passing rates at the Lushi and Luanchuan stations were relatively low (0.79 and 0.86, respectively), which may be related to their location in the western mountainous area of Henan Province. In this region, precipitation processes from June to September are frequently influenced by terrain, summer monsoon rainfall, and local strong convection, resulting in more abrupt precipitation characteristics and causing the WAP distribution on some calendar days to show more pronounced skewness or extreme values. Therefore, in areas with complex terrain and more abrupt precipitation processes, there is still some uncertainty in fitting WAP with the Gamma distribution and calculating the SWAP index. In addition, in most previous studies, the values of the SWAP parameters α and N were mainly determined empirically [29,34,50], and their sensitivity and applicability were relatively less discussed. To evaluate the influence of parameter selection on the identification results, this study conducted a sensitivity analysis of α and N (Figure 20). Specifically, α ∈ {0.85, 0.90, 0.95} and N ∈ {30, 35, 40, 43, 44, 45, 50, 55, 60} were considered. The results indicate that α = 0.9 and N = 44 are a suitable parameter combination. Meanwhile, the setting of drought and flood identification thresholds R1 and R3 also involves a certain degree of empiricism [32,51]. This study compared the event identification results under two threshold combinations: R1 = 1, R3 = −1 and R1 = 0.5, R3 = −0.5 (Table 11). The results show that when the thresholds were relaxed from R1 = 1 and R3 = −1 to R1 = 0.5 and R3 = −0.5, more dry–wet fluctuation events with weaker intensity and less distinct process characteristics were included, resulting in an approximately 3.5-fold increase in the number of identified events. Therefore, we consider R1 = 1 and R3 = −1 to be a suitable and relatively conservative threshold choice.
Figure 20.
Sensitivity analysis of WAP parameters for α and N.
Table 11.
Number of identified DFAA events under different drought/flood thresholds.
The identification method based on the daily SWAP index and run theory can better detect short-duration and highly abrupt DFAA events in Henan Province. Unlike previous studies that adopted empirical thresholds or directly applied existing parameter settings [17,32,34], this study determined threshold values more suitable for Henan Province through comparisons among different parameter combinations and validation against historical disaster records, thereby improving the reliability and regional applicability of the identification results [52,53]. However, the current identification method still has certain limitations. Although few studies have attempted to validate DFAA identification results by comparing the occurrence time, location, and disaster type of identified events with historical records, and by using matching ratios or accuracy to represent identification performance [54], the historical records themselves were not established according to a unified DFAA standard. Overall, there is still a lack of a systematic, complete, and unified historical record dataset of DFAA events. Therefore, it is difficult to directly match all DFAA events identified in this study with historical records one by one, and it is also difficult to construct a unified historical benchmark catalogue that can be directly used for contingency-table-based validation. In addition, this method is still mainly based on precipitation as a single meteorological factor and does not yet comprehensively consider the effects of evapotranspiration, soil moisture, hydrological processes, and human activities. Meanwhile, the applicability of fixed thresholds may also vary across different regions [55,56]. Therefore, a few identified events with relatively weak intensity and short duration are not found in historical disaster records. Future studies could further incorporate multi-factor information on the basis of daily-scale identification [12], establish a more comprehensive identification framework, and combine hydrological, agricultural, and socioeconomic data to further reveal the formation mechanisms of DFAA events and their risk evolution processes.
DTF events occurred more frequently than FTD events in Henan Province during the period of 1951–2020 and were characterized by greater abrupt transition intensity. Temporally, DFAA events were characterized by slight decreasing trends in both frequency and duration, with no obvious trend in intensity. Previous studies [57] also showed that DTF events may show an overall decreasing trend, which is broadly consistent with the results identified in this study. Spatially, DTF events were mainly distributed in the northern, eastern, and southwestern regions of Henan Province, whereas FTD events were mainly distributed in the eastern, northern, and southwestern regions. These findings are generally consistent with those of Chu et al. [28], who pointed out that DFAA shows pronounced spatial heterogeneity, with an overall pattern of lower activity in the north and south and higher activity in the central region. It is noted that Chen et al. [58] reported that both the frequency and intensity of early-summer DFAA events in the Huang–Huai–Hai River Basin have increased since the beginning of the 21st century, with a typical pattern of drought in June followed by flooding in July. The present study focuses more on characterizing the rapid dry–wet transitions during the flood season, which may lead to some differences in the identified DFAA characteristics [25,59]. The spatial distribution differences may be related to the special topographic conditions, atmospheric circulation anomalies, and human activities in Henan Province under the background of climate warming. Under climate warming, enhanced atmospheric moisture-holding capacity may increase the probability and intensity of extreme precipitation, while enhanced evapotranspiration may also aggravate antecedent drought conditions, thereby providing a favorable background for rapid dry–wet transitions [3,24]. Atmospheric circulation and large-scale climate teleconnection factors such as ENSO may regulate the East Asian summer monsoon, the western Pacific subtropical high, and moisture transport processes [2,38], thereby affecting the location and intensity of precipitation during the flood season in Henan Province and further promoting the rapid connection between antecedent drought and subsequent heavy precipitation. Meanwhile, the orographic lifting effects of the Taihang Mountains and Funiu Mountains may enhance local heavy precipitation processes [60,61], while rapid urbanization and land-use change may further influence the spatial differences in DFAA events by altering underlying-surface infiltration, water retention, and runoff generation and concentration conditions [60,62]. In addition, this study was conducted at the station scale based on 17 national basic meteorological stations [63,64], which may limit its ability to fully characterize the continuous spatial distribution of DFAA events. Future studies need to further integrate denser gridded datasets, spatial interpolation or regionalization methods to more comprehensively reveal the spatial heterogeneity of DFAA events, and incorporate multi-source data to strengthen research on the mechanisms of DFAA.
5. Conclusions
This study identified and validated DFAA events occurring from June to September during the period of 1951–2020 in Henan Province based on the daily SWAP index. The spatiotemporal variation characteristics of DFAA events were analyzed. The main conclusions are as follows:
- (1)
- A drought duration of 10 d, together with a transition interval and a flood duration of 7 d, showed relatively good applicability for identifying DFAA events in Henan Province under the daily precipitation-based SWAP framework. Validation based on representative historical stations shows that the proposed method can be relatively effective in characterizing the occurrence and evolution of DFAA events. The identified results were generally consistent with historical disaster records, indicating that the established method has relatively good applicability in Henan Province.
- (2)
- In terms of temporal variation, DTF and FTD events were characterized by slight decreasing trends in both frequency and duration, with no obvious trend in intensity in Henan Province during the period of 1951–2020. The mean annual frequency, mean intensity, and mean duration of DTF events were 2.19, 1.09, and 66.33 d, respectively, whereas those of FTD events were 1.36, 0.36, and 73.82 d, respectively.
- (3)
- The distributions of DTF and FTD events exhibit distinct differences in their characteristics of frequency, intensity, and duration, in Henan Province. In frequency, DTF events were mainly concentrated in the northern, eastern, and southwestern regions, while FTD events occurred more frequently in the eastern, northern, and southwestern regions. The higher intensity of DTF events was mainly concentrated in the central and southern regions, but that of FTD events was mainly distributed in the western and central regions. FTD events with longer duration were mainly concentrated in the western and southern regions. At the station scale, Shangqiu had the maximum frequency for both DTF and FTD events. The maximum intensity was found at Xinyang for DTF events and at Luanchuan for FTD events, while the maximum duration occurred at Zhumadian and Gushi stations.
Author Contributions
Methodology, H.X. and X.Z.; validation, W.C. and H.S.; formal analysis, H.S.; investigation, W.C. and H.S.; resources, X.Z.; data curation, W.C.; writing–original draft preparation, H.X. and C.L.; writing–review and editing, H.X., C.L. and W.C. All authors have read and agreed to the published version of the manuscript.
Funding
This research was funded by Key Scientific and Technological Project of Henan Province, China, grant number 252102320238; Key Research and Development Project of Henan Province, grant number 261111321600; National Key Research and Development Program project, grant number 2023YFC3006603; and Science and Technology Project of Housing and Urban-Rural Development of Henan Province, grant number HNJS-2025-K20.
Institutional Review Board Statement
Not applicable.
Informed Consent Statement
Not applicable.
Data Availability Statement
The analyzed data will be made available on reasonable request, and are subject to the data usage agreement of the North China University of Water Resources and Electric Power. The daily precipitation data used in this study were obtained from the Daily Surface Climate Dataset of China (Version 3.0) through the China Meteorological Data Service Centre (https://data.cma.cn, accessed on 5 April 2026).
Conflicts of Interest
The authors declare no conflicts of interest.
References
- World Meteorological Organization. State of Global Water Resources 2023; WMO: Geneva, Switzerland, 2024.
- Tong, Y.; Chen, Y.; Qu, Y.; Bento, V.A.; Song, H.; Qiu, H.; Shui, W.; Zeng, J.; Wang, Q. Evolution and prediction of drought-flood abrupt alternation in mainland China using an improved index. Clim. Dyn. 2025, 63, 392. [Google Scholar] [CrossRef] [Scilit]
- Zhang, G.; Wang, H.; Gan, T.Y.; Zhang, S.; Zhao, J.; Su, X.; Fu, X.; Shi, L.; Xu, P.; Lu, M.; et al. A comprehensive review of recent progress on the drought-flood abrupt alternation. J. Hydrol. 2025, 661, 133806. [Google Scholar] [CrossRef] [Scilit]
- Zhang, Y.; You, Q.; Ullah, S.; Chen, C.; Shen, L.; Liu, Z. Substantial increase in abrupt shifts between drought and flood events in China based on observations and model simulations. Sci. Total Environ. 2023, 876, 162822. [Google Scholar] [CrossRef] [Scilit] [PubMed]
- Li, X.; Li, S.; Wang, L.; Wang, X.; Huang, J. Spatiotemporal variability of drought-flood abrupt alternation events in Southwest China during 1961 to 2024. Theor. Appl. Climatol. 2026, 157, 96. [Google Scholar] [CrossRef] [Scilit]
- Ministry of Emergency Management of the People’s Republic of China. Mitigation and Relief Commission Released the Top Ten Natural Disasters in China in 2023. Available online: https://www.mem.gov.cn/xw/yjglbgzdt/202401/t20240120_475696.shtml (accessed on 5 April 2026).
- Qiao, Y.; Xu, W.; Meng, C.; Zhao, D. A review of study on dry wet abrupt alternation: Progress and challenge. J. Catastrophol. 2023, 38, 131–138. [Google Scholar]
- Yang, P.; Zhang, S.; Xia, J.; Zhan, C.; Cai, W.; Wang, W.; Luo, X.; Chen, N.; Li, J. Analysis of drought and flood alternation and its driving factors in the Yangtze River Basin under climate change. Atmos. Res. 2022, 270, 106087. [Google Scholar] [CrossRef] [Scilit]
- Bi, W.; Li, M.; Weng, B.; Yan, D.; Dong, Z.; Feng, J.; Wang, H. Drought-flood abrupt alteration events over China. Sci. Total Environ. 2023, 875, 162529. [Google Scholar] [CrossRef] [Scilit]
- Götte, J.; Brunner, M. Hydrological drought-to-flood transitions across different hydroclimates in the United States. Water Resour. Res. 2024, 60, e2023WR036504. [Google Scholar] [CrossRef] [Scilit]
- Rezvani, R.; RahimiMovaghar, M.; Na, W.; Najafi, M. Accelerated lagged compound floods and droughts in northwest North America under 1.5 °C–4 °C global warming levels. J. Hydrol. 2023, 624, 129906. [Google Scholar] [CrossRef] [Scilit]
- Bai, X.; Wang, Z.; Wu, J.; Zhang, Z.; Zhang, P. A novel multivariate multiscale index for drought-flood abrupt alternations: Considering precipitation, evapotranspiration, and soil moisture. J. Hydrol. 2024, 643, 132039. [Google Scholar] [CrossRef] [Scilit]
- Qiu, J.; He, C.; Liu, X.; Gao, L.; Tan, C.; Wang, X.; Kong, D.; Wigneron, J.-P.; Chen, D.; Xia, J. Projecting dry-wet abrupt alternation across China from the perspective of soil moisture. npj Clim. Atmos. Sci. 2024, 7, 269. [Google Scholar] [CrossRef] [Scilit]
- Lai, C.; Wang, Y.; Zhao, Y.; Wang, Z.; Wu, X.; Bai, X. A novel daily-scale index for detecting drought-flood abrupt alternation events: Proof from Pearl River Basin, China. Atmos. Res. 2025, 315, 107892. [Google Scholar] [CrossRef] [Scilit]
- Wu, Z.; Li, J.; He, J.; Jiang, Z. Large-scale atmospheric singularities and summer long-cycle droughts-floods abrupt alternation in the middle and lower reaches of the Yangtze River. Chin. Sci. Bull. 2006, 51, 2027–2034. [Google Scholar] [CrossRef] [Scilit]
- Zhang, S.; Zhang, J.; Min, J.; Zhang, Z.; Zhuang, J.; Lin, J. Drought-flood abrupt alternation based on runoff in the Huaihe River Basin during rainy season. J. Lake Sci. 2012, 24, 679–686. [Google Scholar] [CrossRef] [Scilit]
- Shan, L.; Zhang, L.; Song, J.; Zhang, Y.; She, D.; Xia, J. Characteristics of dry-wet abrupt alternation events in the middle and lower reaches of the Yangtze River Basin and the relationship with ENSO. J. Geogr. Sci. 2018, 28, 1039–1058. [Google Scholar] [CrossRef] [Scilit]
- Wang, L.; Guo, S.; Wang, J.; Chen, Y.; Qiu, H.; Zhang, J.; Wei, X. A novel multi-scale standardized index analyzing monthly to sub-seasonal drought-flood abrupt alternation events in the Yangtze River Basin. J. Hydrol. 2024, 623, 130999. [Google Scholar] [CrossRef] [Scilit]
- Zhang, Y.; Song, T.; Chen, Y.; Chen, X.; Gao, L.; Liu, M.; Deng, H. Spatial-Temporal Variations of Drought-Flood Abrupt Alternation Events in Southeast China. Water 2024, 16, 498. [Google Scholar] [CrossRef] [Scilit]
- Lu, E.; Cai, W.; Jiang, Z.; Zhang, Q.; Zhang, C.; Higgins, R.; Halpert, M. The day-to-day monitoring of the 2011 severe drought in China. Clim. Dyn. 2014, 43, 1–9. [Google Scholar] [CrossRef] [Scilit]
- Shi, X.; Yang, Y.; Yuan, Z.; Ding, H.; Zhang, Y.; Chen, J.; Shi, M. Integrating SWAP and SIF anomaly to assess the responses of vegetation to the drought-flood abrupt alternation in the middle and lower reaches of the Yangtze River basin, China. J. Hydrol. Reg. Stud. 2024, 52, 101726. [Google Scholar] [CrossRef] [Scilit]
- Fu, J.; Liu, B.; Lu, Y.; Liang, M.; Tan, X.; Li, D.; Huang, Z. Validation of the detected Dry–Wet Abrupt Alternation by developing a weighting analysis method. Int. J. Climatol. 2023, 43, 4572–4589. [Google Scholar] [CrossRef] [Scilit]
- Son, H.; Lee, J.; Yoo, J.; Kim, T. Characteristics of drought-flood abrupt alternation events using SWAP index in the Han River basin. J. Korea Water Resour. Assoc. 2021, 54, 925–932. [Google Scholar]
- Kumar, A.; Arya, D. Spatiotemporal analysis and mechanisms of drought flood abrupt alternation events in India. J. Hydrol. Reg. Stud. 2025, 62, 102992. [Google Scholar] [CrossRef] [Scilit]
- Jin, C.; Jiang, N.; Tian, X.; Zheng, E.; Shi, Q. Analysis of the spatial and temporal evolution of drought in Henan based on a nonlinear composite drought index. Sci. Rep. 2024, 14, 29347. [Google Scholar] [CrossRef] [Scilit]
- Henan Provincial Department of Emergency Management. 2024 Bulletin of Natural Disasters in Henan Province; Henan Provincial Department of Emergency Management: Zhengzhou, China, 2024.
- Wang, Y.; Yuan, X.; Zhou, S. Subseasonal Ensemble Prediction of the 2024 Abrupt Drought-to-Flood Transition in Henan Province, China. Water 2026, 18, 635. [Google Scholar] [CrossRef] [Scilit]
- Chu, C.; Zhou, J. Extreme and persistent features of drought-flood evolution in Henan Province from 1960 to 2018. Res. Soil Water Conserv. 2022, 29, 164–171. [Google Scholar]
- Lu, E. Determining the start, duration, and strength of flood and drought with daily precipitation: Rationale. Geophys. Res. Lett. 2009, 36, L12707. [Google Scholar] [CrossRef] [Scilit]
- Wilks, D.S. Statistical Methods in the Atmospheric Sciences, 3rd ed.; Academic Press: Oxford, UK, 2011. [Google Scholar]
- Stephens, M.A. EDF statistics for goodness of fit and some comparisons. J. Am. Stat. Assoc. 1974, 69, 730–737. [Google Scholar] [CrossRef]
- Yang, J.; Chen, H.; Hou, Y.; Zhao, Y.; Chen, Q.; Xu, C.; Chen, J. A method to identify the drought-flood transition based on the meteorological drought index. Acta Geogr. Sin. 2019, 74, 2358–2370. [Google Scholar]
- Yevjevich, V. An Objective Approach to Definitions and Investigations of Continental Hydrologic Droughts; Colorado State University: Fort Collins, CO, USA, 1967. [Google Scholar]
- Liu, B.; Liu, Y.; Wang, W.; Li, C. Meteorological drought events and their evolution from 1960 to 2015 using the daily SWAP index in Chongqing, China. Water 2021, 13, 1887. [Google Scholar] [CrossRef] [Scilit]
- Mann, H.B. Nonparametric tests against trend. Econometrica 1945, 13, 245–259. [Google Scholar] [CrossRef] [Scilit]
- Sen, P.K. Estimates of the regression coefficient based on Kendall’s tau. J. Am. Stat. Assoc. 1968, 63, 1379–1389. [Google Scholar] [CrossRef]
- Yue, S.; Pilon, P.; Phinney, B.; Cavadias, G. The influence of autocorrelation on the ability to detect trend in hydrological series. Hydrol. Process. 2002, 16, 1807–1829. [Google Scholar] [CrossRef] [Scilit]
- Nie, Y.; Sun, J. Moisture sources and transport for extreme precipitation over Henan in July 2021. Geophys. Res. Lett. 2022, 49, e2021GL097446. [Google Scholar] [CrossRef] [Scilit]
- Editorial Committee of Encyclopedia of Meteorological Disasters in China. Encyclopedia of Meteorological Disasters in China—Henan; China Meteorological Press: Beijing, China, 2005.
- China Meteorological Administration. Academician Li Zechun, Who Experienced the “75·8” Rainstorm 46 Years Ago, Discusses the Recent Zhengzhou Rainstorm Disaster: It Is Meaningless to Discuss “Once in a Thousand Years”. 24 January 2022. Available online: https://www.cma.gov.cn/2011xzt/2022zt/20220121/2022012102/202201210201/202204/t20220412_4750707.html (accessed on 5 April 2026).
- Zhengshuo Radio. Revealing Red Zhengzhou: How Was Zhengzhou City’s “Water Shortage” Solved 50 Years Ago? 10 June 2021. Available online: https://www.sohu.com/a/471412648_355267 (accessed on 5 April 2026).
- China Meteorological Administration. Heavy Rainstorm in the Yangtze River Basin in 1998. 19 July 2013. Available online: https://www.cma.gov.cn/2011xzt/2013zhuant/20130720/2013072007/201307/t20130719_220343.html (accessed on 5 April 2026).
- Orient Today. Top Ten Meteorological Events in Henan in 2014 Released, with Severe Summer Drought Ranking First. 22 January 2015. Available online: https://henan.sina.cn/news/m/2015-01-22/detail-ichmifpx5146834.d.html (accessed on 5 April 2026).
- Department of Civil Affairs of Henan Province. A Relatively Large Range of Wind, Hail, and Flood Disasters Occurred in Henan Province. 6 June 2016. Available online: https://mzt.henan.gov.cn/2016/06-06/539363.html (accessed on 5 April 2026).
- Guo, S. From flood control and drainage to storage and drainage: The formation of the haihe river basin management strategy in the 1950s. J. Univ. Chin. Acad. Soc. Sci. 2024, 44, 107–122+143–144. [Google Scholar]
- China Meteorological Administration. Review of the Main Climate Characteristics in China in 1991. 20 January 1992. Available online: https://www.cma.gov.cn/kppd/kppdqxsj/kppdtqqh/202111/t20211103_4158991.html (accessed on 5 April 2026).
- Niu, S.; Zhang, Y.; Liang, J.; Yuan, X. Comparative analysis on environmental conditions and mesoscale features of two short-time heavy rainfall events in Zhengzhou. Torrential Rain Disasters 2016, 35, 138–147. [Google Scholar]
- Wei, J.; Zhang, Q.; Tao, S. Physical causes of the 1999 and 2000 summer severe drought in North China. Chin. J. Atmos. Sci. 2004, 28, 125–137. [Google Scholar]
- Zhang, J.; Chen, H.; Zhang, Q. Extreme drought in the recent two decades in northern China resulting from Eurasian warming. Clim. Dynam. 2019, 52, 2885–2902. [Google Scholar] [CrossRef] [Scilit]
- Zhou, W.; Liu, D.; Zhang, J.; Jiang, S.; Xing, S.; Wang, J.; Cheng, Y.; Chen, N. Identification and frequency analysis of drought–flood abrupt alternation events using a daily-scale standardized weighted average of the precipitation index. Front. Environ. Sci. 2023, 11, 1142259. [Google Scholar] [CrossRef] [Scilit]
- Zhao, Y.; Weng, Z.; Chen, H.; Yang, J. Analysis of the evolution of drought, flood, and drought-flood abrupt alternation events under climate change using the daily SWAP index. Water 2020, 12, 1969. [Google Scholar] [CrossRef] [Scilit]
- Son, H.; Kim, J.; Byun, S.; Lee, J.; Kim, T. Monitoring and Evaluating the Severity of Drought-flood Abrupt Alternation Events Using Daily Standardized Precipitation Index. KSCE J. Civ. Eng. 2024, 28, 1002–1010. [Google Scholar] [CrossRef] [Scilit]
- Bai, X.; Zhao, C.; Tang, Y.; Zhang, Z.; Yang, B.; Wang, Z. Identification, physical mechanisms and impacts of drought–flood abrupt alternation: A review. Front. Earth Sci. 2023, 11, 1203603. [Google Scholar] [CrossRef] [Scilit]
- Liang, Y.; Han, P.; Kim, T.; Zhang, X.; Li, Z.; Liu, H.; Chen, S. Development of drought-flood abrupt alternations identification method based on daily soil moisture index: Spatiotemporal characterization and risk assessment in the middle and lower reaches of Yangtze River Basin. J. Hydrol. Reg. Stud. 2025, 61, 102690. [Google Scholar] [CrossRef] [Scilit]
- Cui, H.; Jiang, S.; Ren, L.; Qin, T.; Zhu, Q.; Fang, X.; Xu, C. Identification of drought-flood abrupt alternation by a new non-stationary framework considering natural-social system impacts. J. Hydrol. 2025, 654, 132899. [Google Scholar] [CrossRef] [Scilit]
- Bai, X.; Yao, Y.; Wu, J.; Xie, Y.; Zhang, Z. Tracking drought-flood abrupt alternations: Event identification, path analysis, and ecological impacts on vegetation. J. Hydrol. 2026, 666, 134858. [Google Scholar] [CrossRef] [Scilit]
- Su, J.; Ding, Y.; Liu, Y.; Wang, J.; Zhang, Y. China is suffering from fewer but more severe drought to flood abrupt alternation events. Weather Clim. Extrem. 2024, 46, 100737. [Google Scholar] [CrossRef] [Scilit]
- Chen, Z.; Zheng, Z. The strongest early-summer drought–flood abrupt alternation event over the Huang–Huai–Hai River Basin in 2024 since the 1980s: Perspective of anomalous subseasonal circulation evolution. Atmos. Ocean. Sci. Lett. 2025, 18, 100648. [Google Scholar] [CrossRef] [Scilit]
- Ren, J.; Wang, W.; Wei, J.; Li, H.; Li, X.; Liu, G.; Chen, Y.; Ye, S. Evolution and prediction of drought-flood abrupt alternation events in Huang-Huai-Hai River Basin, China. Sci. Total Environ. 2023, 869, 161707. [Google Scholar] [CrossRef] [Scilit] [PubMed]
- Tu, G.; Lu, Q.; Zhang, F.; Xia, Y.; Liao, J.; Hong, Q.; You, X.; Chen, W.; Zhao, D.; Yan, B. Spatiotemporal variability and multidimensional driving mechanisms of drought-flood abrupt alternation in the Poyang Lake basin. Atmos. Res. 2026, 336, 108887. [Google Scholar] [CrossRef] [Scilit]
- Wang, S.; Jiang, R.; Zhao, Y.; Xie, J.; Cheng, S.; Wang, L.; Lu, X. Quantifying the drought-flood abrupt alternation events over Wei River Basin: Dynamic evolution characteristics, driving factors and inherent mechanism. Atmos. Res. 2025, 323, 108185. [Google Scholar] [CrossRef] [Scilit]
- Huang, S.; Gan, Y.; Wang, C.; Wang, S.; Chen, J.; Zhang, X.; Chen, Z.; Gu, X.; Xia, J.; Chen, N.; et al. Urbanization-induced compression effect accelerates and amplifies dry-wet abrupt alternations in Chinese cities. Sci. Bull. 2026, 71, 1461–1473. [Google Scholar] [CrossRef] [Scilit] [PubMed]
- GB 31221-2014; Specifications for Meteorological Observing Environs Protection–Surface Meteorological Station. China Standards Press: Beijing, China, 2014.
- GB/T 35221-2017; Specifications for Surface Meteorological Observation–General. China Standards Press: Beijing, China, 2017.

Disclaimer/Publisher’s Note: The statements, opinions and data contained in all publications are solely those of the individual author(s) and contributor(s) and not of MDPI and/or the editor(s). MDPI and/or the editor(s) disclaim responsibility for any injury to people or property resulting from any ideas, methods, instructions or products referred to in the content. |
© 2026 by the authors. Licensee MDPI, Basel, Switzerland. This article is an open access article distributed under the terms and conditions of the Creative Commons Attribution (CC BY) license.