


Abstract
Based on a bimodal normal distribution for dust size distribution, a quantitative method for estimating dust input was established in this study, and then the transport, microphysics, and environmental effects of a dust event from 26 to 28 November 2025 were investigated based on a multi-source vertical remote sensing system in Zhejiang. The results indicate that the net PM10 input was approximately 7760 tons, exhibiting a spatial distribution that decreased from northeast to southwest. The net input per unit area ranged from 0.001 to 0.293 t/km2. The dust was coarse-dominated, initially lowering the PM2.5/PM10 ratio, which later recovered due to gravitational settling and aging. A distinct “upper-small, lower-large” depolarization ratio profile, caused by gravitational settling and hygroscopic absorption, signaled dust intrusion into the breathing zone and an imminent rise in surface PM10, thereby providing a potential early-warning indicator. Dust influx first elevated the relative humidity below the dust layer via radiative cooling but later reduced the near-surface humidity through hygroscopic absorption after settlement. Additionally, decreases in SO2 and NO2 suggested a potential mitigation of atmospheric acidity by the dust. The O3 response showed spatial heterogeneity: in most areas, it was negatively correlated with NO2, reflecting NO2 titration effects under a VOC-controlled regime, while, in a few areas, both decreased synchronously. These findings underscore the dual physical–chemical impacts of dust on regional air quality and support the development of dust-related pollution early-warning systems.
1. Introduction
Dust activity in East Asia presented a shift from a decreasing to an increasing trend before and after 2000, and this shift was accompanied by a sharp increase in total dust emissions due to the increase in strong wind days under global warming [1]. Beyond their hazards such as strong winds, sand burial, and soil erosion, dust aerosols exert health impacts via their physical, chemical and biological properties through air pollution [2]. Traditional research has extensively focused on emission mechanisms [3,4], environmental effects [5,6], and numerical modeling [7]. Recent advances have shifted towards microphysical characterization [8,9] and quantitative emission estimation [1]. However, most studies have concentrated on source regions and their immediate peripheries, leaving the long-range transported dust—a critically transformed entity—significantly understudied.
In contrast to near-source dust, transported dust undergoes substantial physicochemical aging during its journey. Upon arriving in downwind regions, it triggers distinct weather and climate feedback [10,11], influences atmospheric acidity, and may even stimulate marine carbon sequestration [12,13]. Consequently, quantifying the input flux, revealing the microphysical properties, and assessing the environmental impacts of transported dust are essential for an understanding of its role in the Earth system and for informing regional air pollution control strategies.
Studying transported dust necessitates robust observational capabilities. While ground-based point measurements lack spatial representativeness [14,15], satellite remote sensing is often hindered by cloud cover, provides only column-integrated quantities (passive sensors), or suffers from low temporal resolution (active sensors like CALIPSO) [16,17]. Ground-based remote sensing (e.g., lidar, microwave radiometer, wind profiler radar) offers high-temporal-resolution vertical profiles [18,19], and its network deployment effectively overcomes spatial limitations, as demonstrated by systems like MPLNET [20] and China’s dust-profiling observatory network [21].
Due to the shift in East Asian dust activity from a decreasing to an increasing trend, Zhejiang Province, situated in eastern China and the southern part of the Yangtze River Delta, seems to have experienced a rebound in dust events in recent years, with a rare dust event occurred in late November 2025 [22]. Its multi-source vertical profiling system—integrating lidar, microwave radiometer, and wind profiler radar—allows us to move beyond qualitative detection to the quantitative analysis that has been previously challenging. Therefore, focusing on the winter dust event on 26–28 November 2025, this study aims to (1) develop a quantitative method for estimating dust input; (2) investigate its key microphysical properties; and (3) quantify its multifaceted environmental impacts, including those on boundary layer structure, atmospheric acidity, and photochemical processes. Our findings are expected to provide scientific basis for assessing the nutrient supply effect of deposited dust, improving microphysical parameterizations in numerical models.
2. Data and Methods
2.1. Observations and Instruments
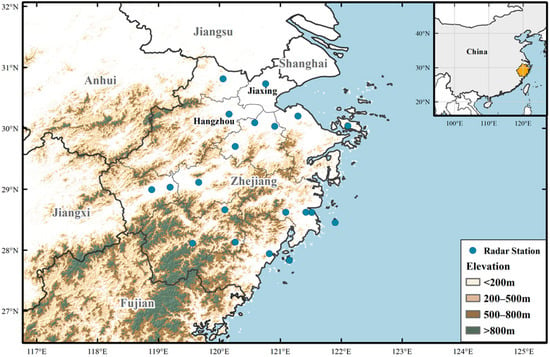
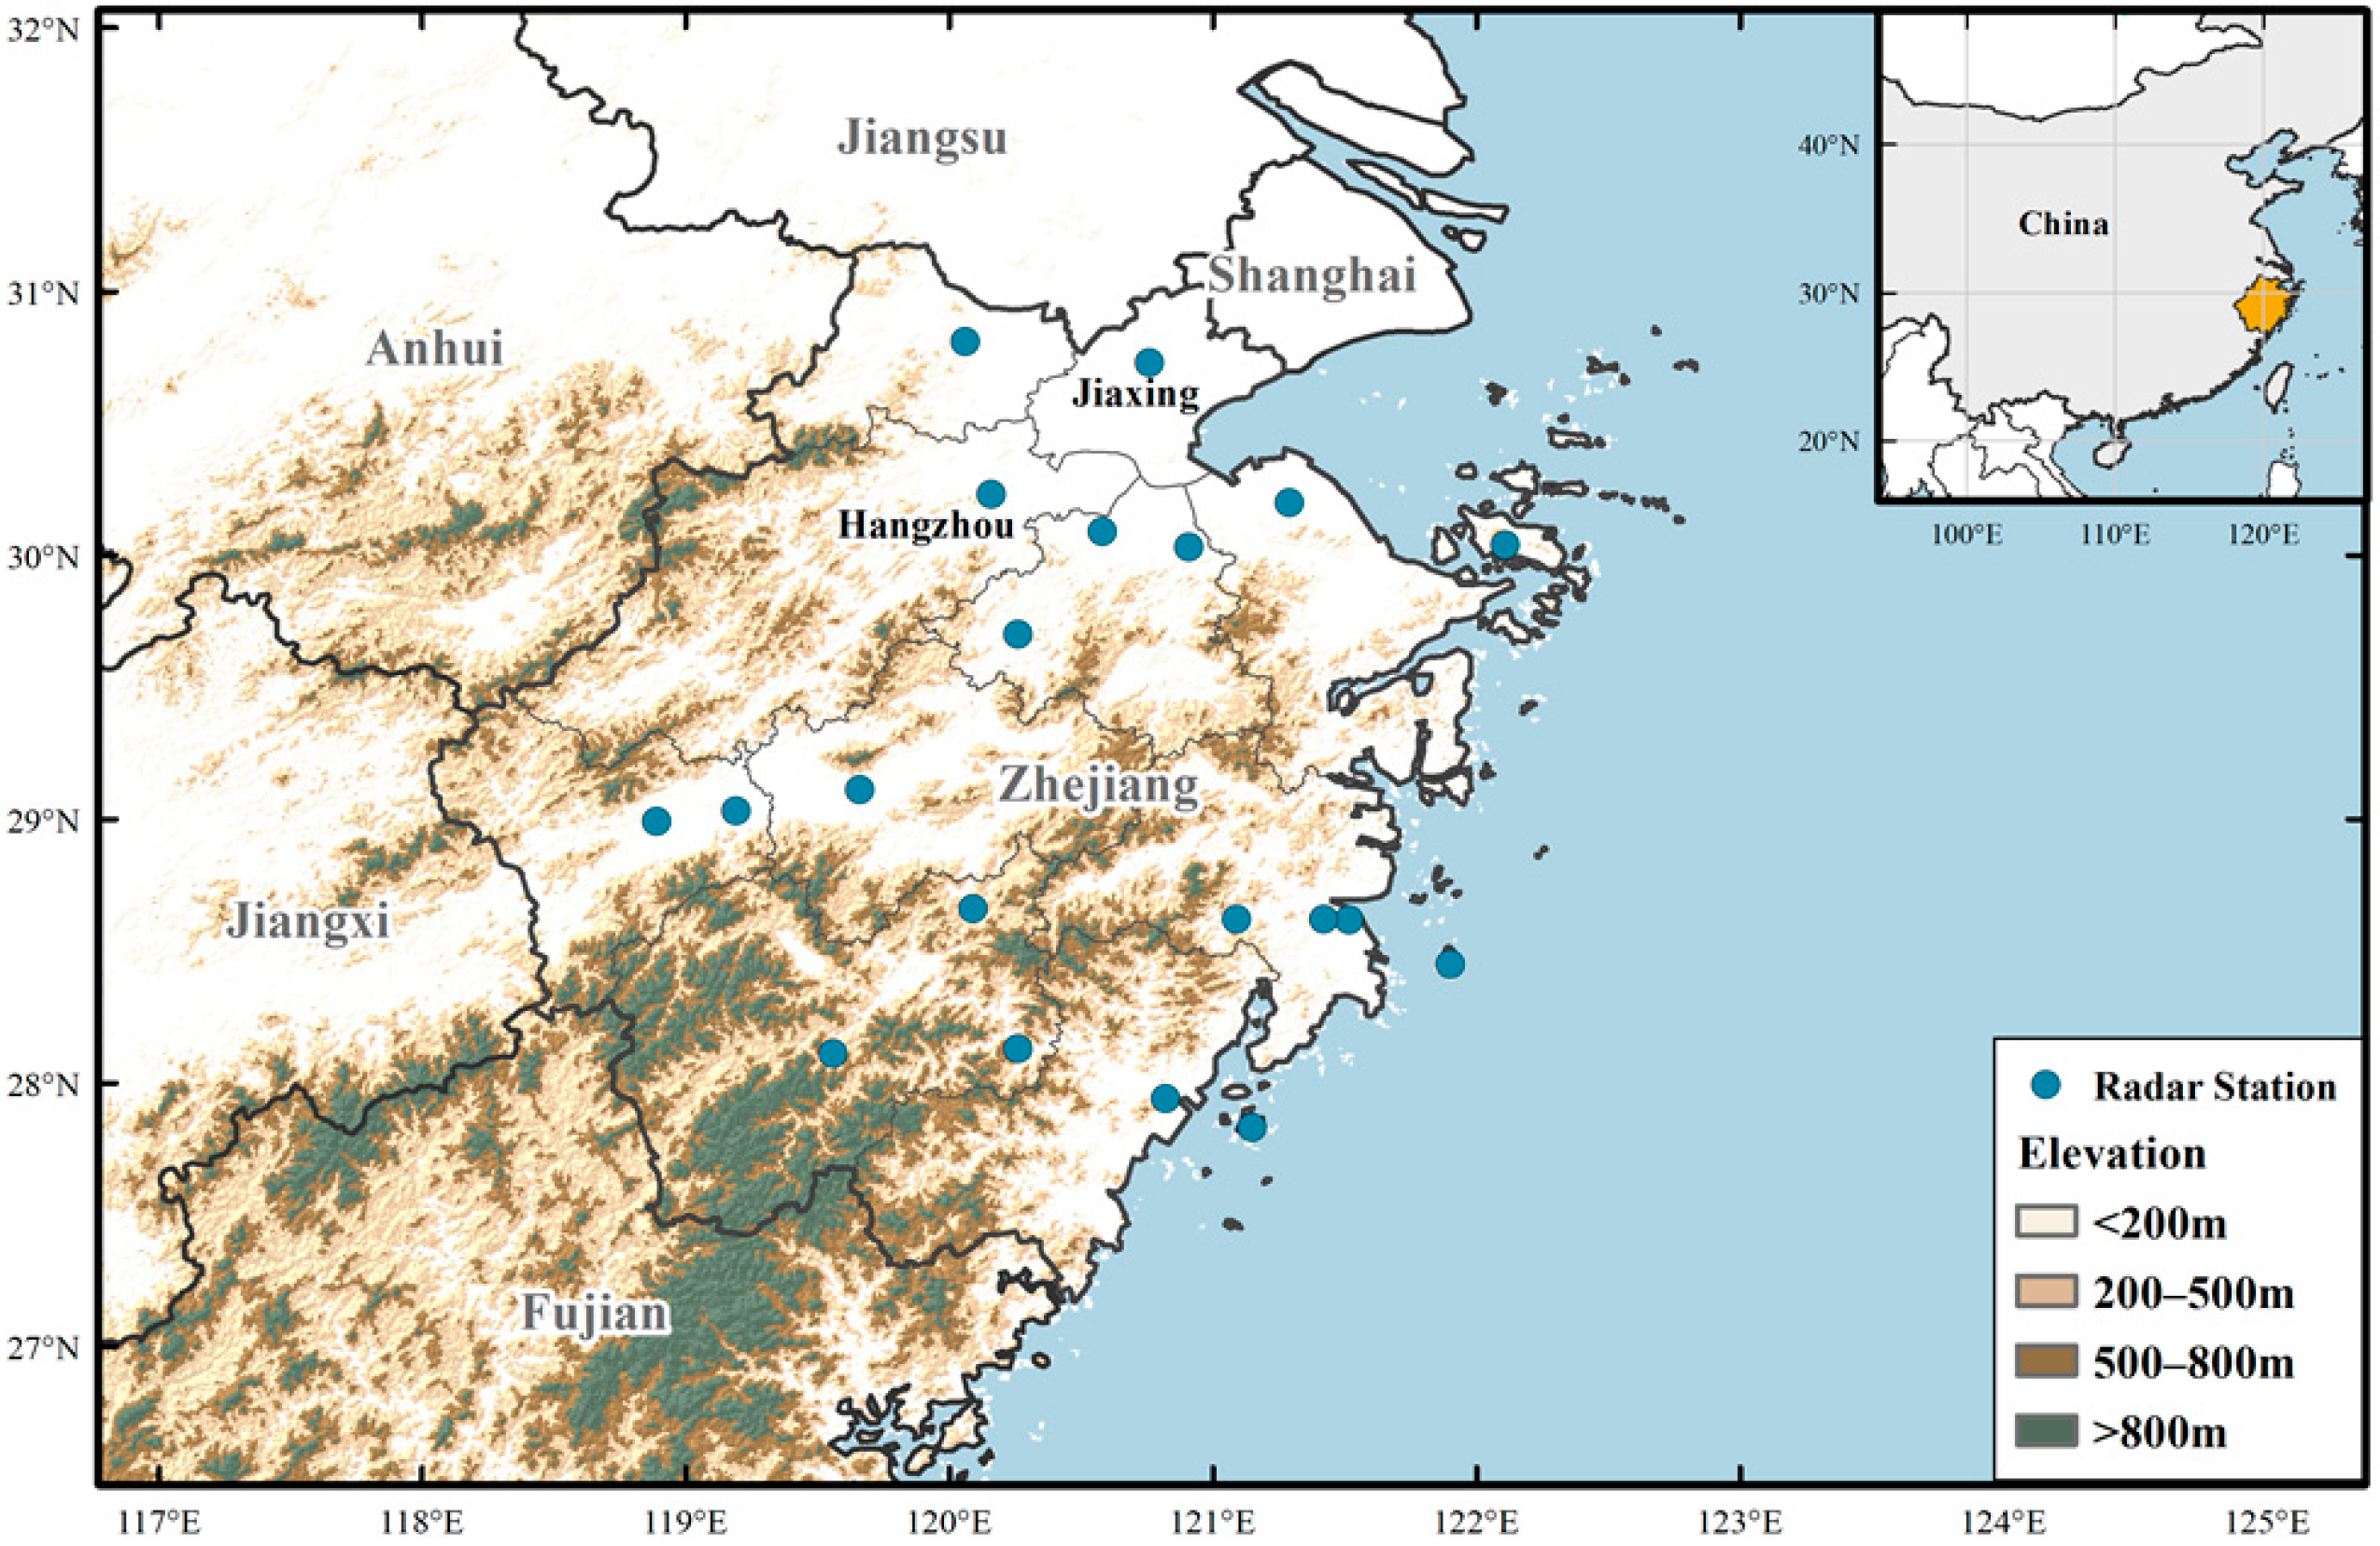
The multi-source vertical profiling system in Zhejiang Province comprises 20 Mie scattering lidars, 49 microwave radiometers, and 37 wind profiler radars. The Mie scattering lidar, with a detection wavelength of 532 nm, has both vertical and horizontal channels, with vertical and temporal resolutions of 30 m and 5 min, respectively, and a detection height of 20 km. The MP-3000A microwave radiometer, manufactured by the Radiometric Corporation (Boulder, CO, USA), is utilized for the vertical detection of atmospheric temperature, relative humidity, and other parameters. The detection height is 10 km, with one profile every 10 min, which is divided into 20 levels below 500 m, 30 levels between 500 m and 2 km, and 32 levels from 2 km to 10 km. The wind profiler radar is of the P-band tropospheric type, employed for measuring horizontal wind speed and direction, vertical wind speed, and the atmospheric refractive index structure constant . Its coverage spans 0.15 to 10.11 km, divided into 34 levels from 150 m to 4.11 km and 25 levels from 4.11 to 10.11 km, with one profile every 2 min. Multi-source vertical observation data are unified in vertical and temporal resolution through interpolation and averaging. This paper utilizes vertical observation data from 20 stations equipped with lidar, microwave radiometer and wind profiler radar (the blue circles in Figure 1). The distribution of the stations is relatively uniform, and the observations can represent the overall region.
Figure 1.
The distribution of the stations equipped with the lidar, microwave radiometer and wind profiler radar in Zhejiang Province.
There are 62 surface atmospheric composition observation stations, which include six categories of pollutants: PM2.5, PM10, NO, O3, SO2, and CO. However, the CO data exhibited relatively large errors and were therefore excluded from this study. PM2.5 and PM10 were measured using the TEOM 1400 series online monitors manufactured by Thermo Fisher Scientific (Waltham, MA, USA), while O3, NO2 and SO2 are measured by the same company’s 49I UV photometric analyzers and 42I/43I pulsed fluorescence analyzers, respectively.
2.2. Quantitative Method for Estimating Dust Input
To facilitate the operational implementation of the multi-source vertical remote sensing system in Zhejiang Province, a supporting quality control platform was established, with Zhejiang Atmospheric Detection Technology Support Center responsible for implementing standardized procedures: instrument calibration, db4 wavelet transform-based denoising, and moving-average outlier removal. Using the quality-controlled lidar data, a quantitative method for estimating dust input was established. Firstly, the aerosol extinction coefficient is obtained using the non-calibration lidar retrieval method established previously by this study’s authors [23]. Through multiple iterative processes, this method overcomes the error divergence associated with conventional inversion approaches, ultimately yielding a convergent extinction coefficient that approximates the true value. And then, based on Mie scattering theory, the aerosol extinction efficiency , mass extinction coefficient and aerosol mass concentration M are calculated:
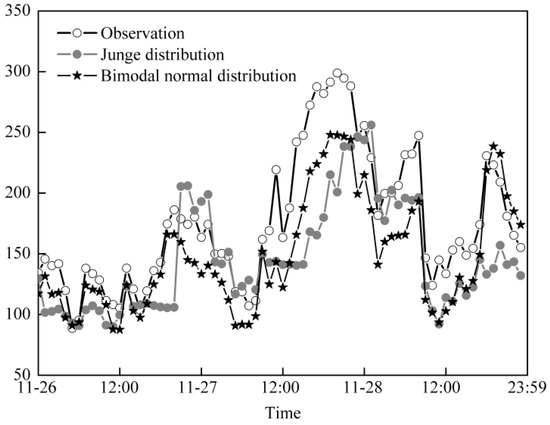
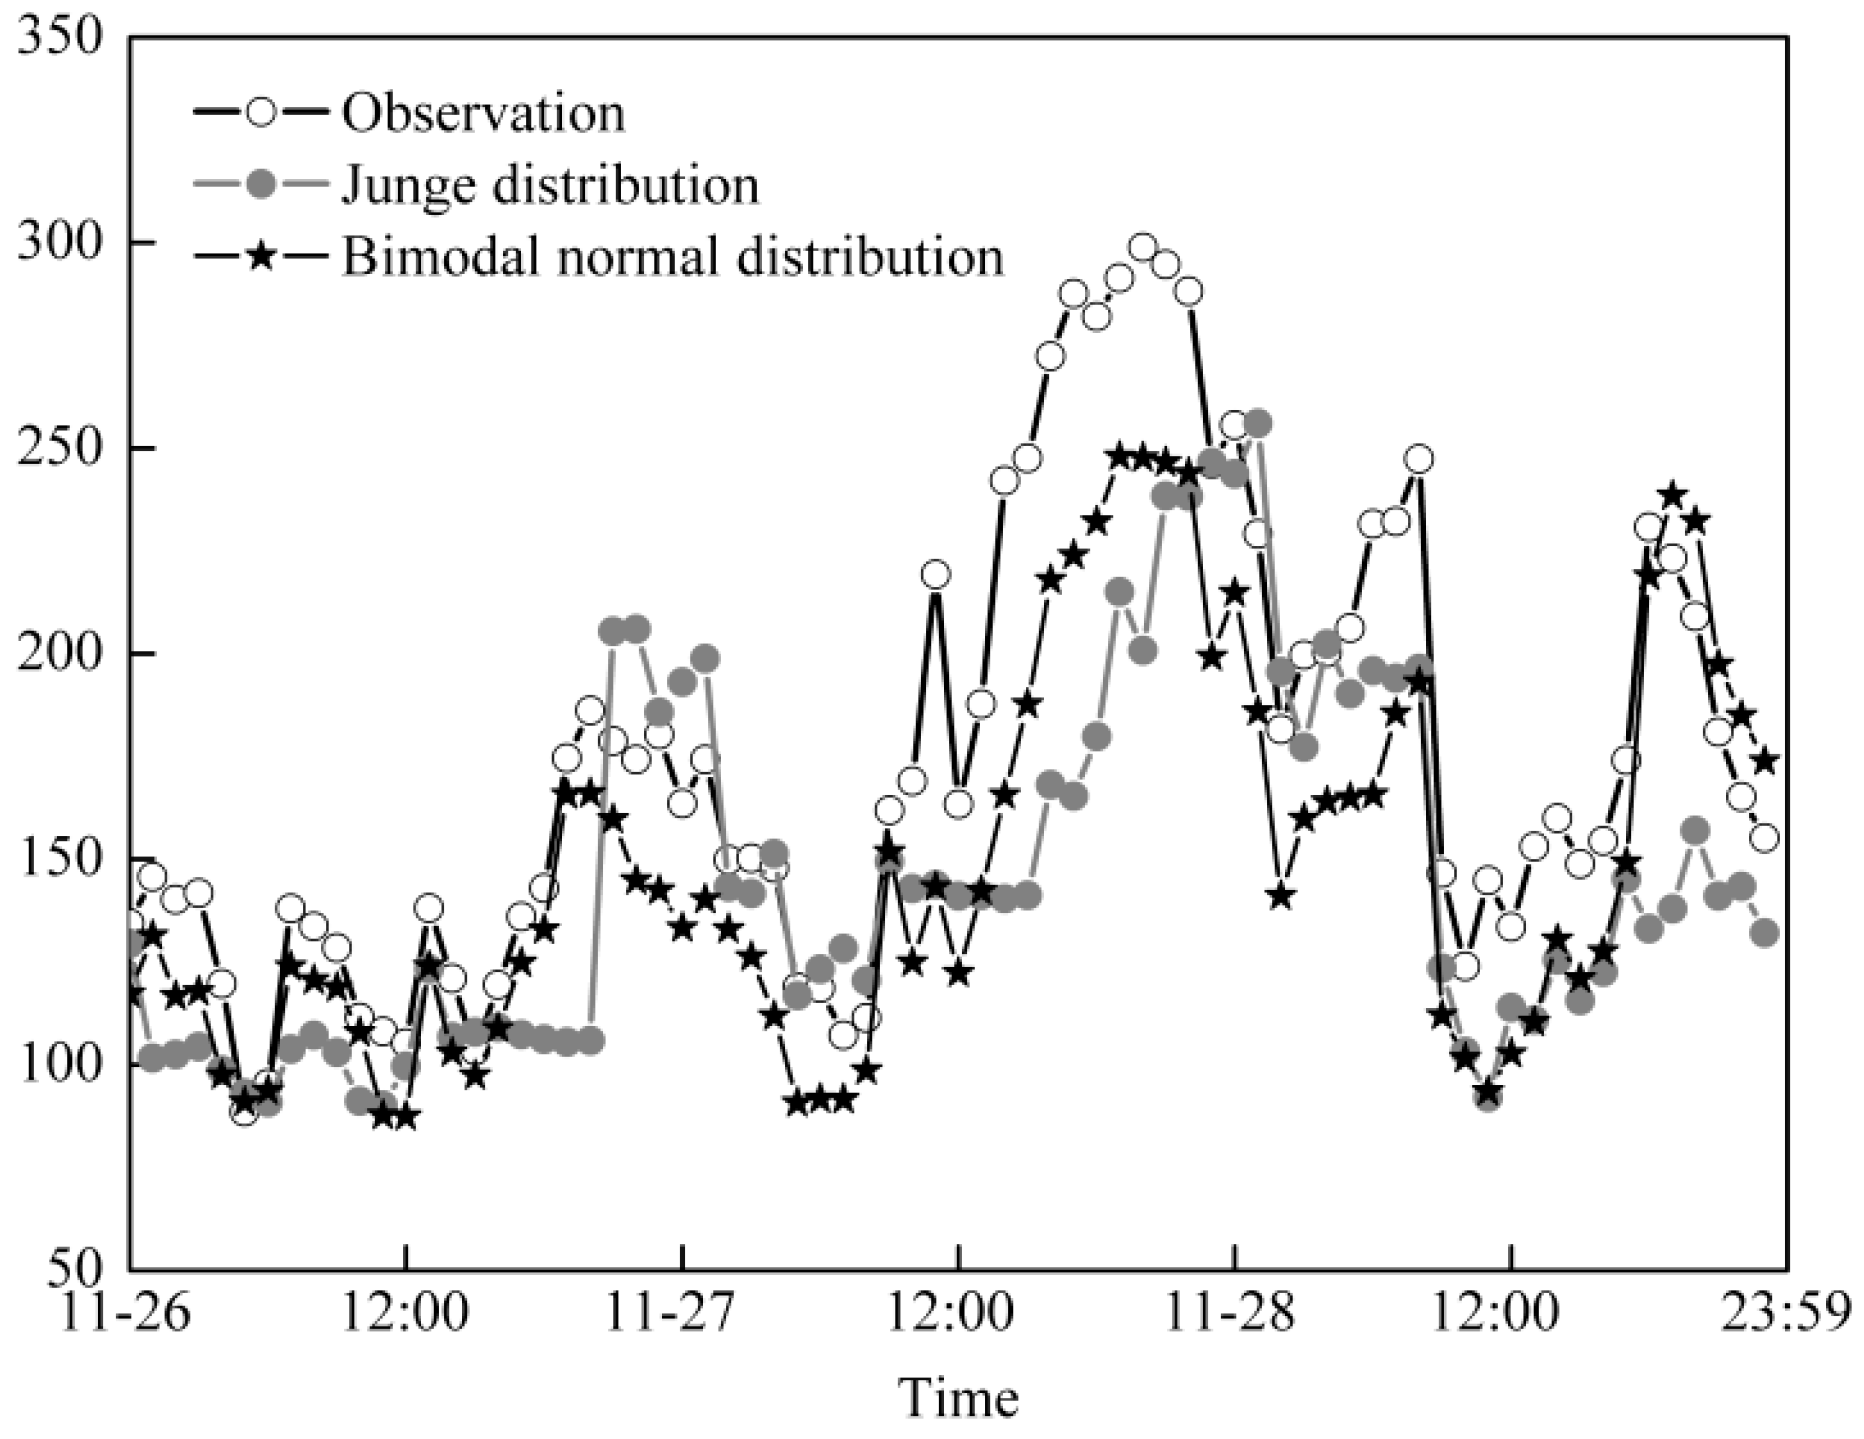
In the equations, x = 2πr/λ is the size parameter, where λ is the wavelength and r is the particle radius, with an integration range of 0.01–10.0 μm; an and bn are Mie coefficients that can be calculated accurately through programming in MatlabR2019a or similar software [24]; n(r) is the particle size distribution function; ρ is the particle density; and σ(z) is the aerosol extinction coefficient at height z km. During the data process, certain assumptions need to be made regarding the particle size distribution, particle density, and complex refractive index [15]. According to the depolarization ratio at different altitudes and stages of dust transport, particle density and complex refractive index are adjusted [25,26,27,28], and their ranges are 2.0–2.5 and 0.005–0.03, respectively, using a smaller particle density and a larger imaginary part of the complex refractive index during the later stages of dust transport [29]. The Junge distribution and the bimodal normal distribution [30,31,32], both proven to be suitable for dust, were used to calculate the surface PM10 concentrations in Hangzhou during the dust event from 26 to 28 November 2025. A comparison with real-time observations (Figure 2) shows that the PM10 concentrations calculated by both particle size distributions were lower than the observed values. However, the deviation of 19.3% obtained with the bimodal normal distribution was significantly smaller than that of the Junge distribution (31.9%), and its change trend was also more consistent with the real-time observations than that of unimodal normal distribution [33]. Therefore, the bimodal normal distribution was adopted to quantitatively estimate dust input in this study.
Figure 2.
Comparison of PM10 concentrations retrieved from the Junge distribution and the bimodal normal distribution with the real-time observations.
Because most incoming dust will be further transported downstream by airflow, only the portion entrained into the atmospheric boundary layer is regarded as effective input. Therefore, the vertical distribution of PM10 concentration at each station before the dust intrusion is calculated, and vertical integration is performed with the top of the boundary layer as the upper limit to obtain the background PM10 column concentration for each station. Using the same method, column concentration increments at 10 min resolution are calculated and accumulated to derive the net PM10 input column concentration over the entire dust passage period (the arrival and departure times of the dust were determined comprehensively based on lidar backscatter signals and abrupt changes in surface PM10 concentrations). Finally, utilizing the ArcGIS 10.1 spatial analysis module, the station-scale net PM10 input column concentrations are interpolated into 1 km × 1 km gridded data, followed by regional area integration according to the administrative boundaries of each prefecture-level city to obtain the total net PM10 input for each region.
3. Results
3.1. Quantitative Estimation of Dust Input
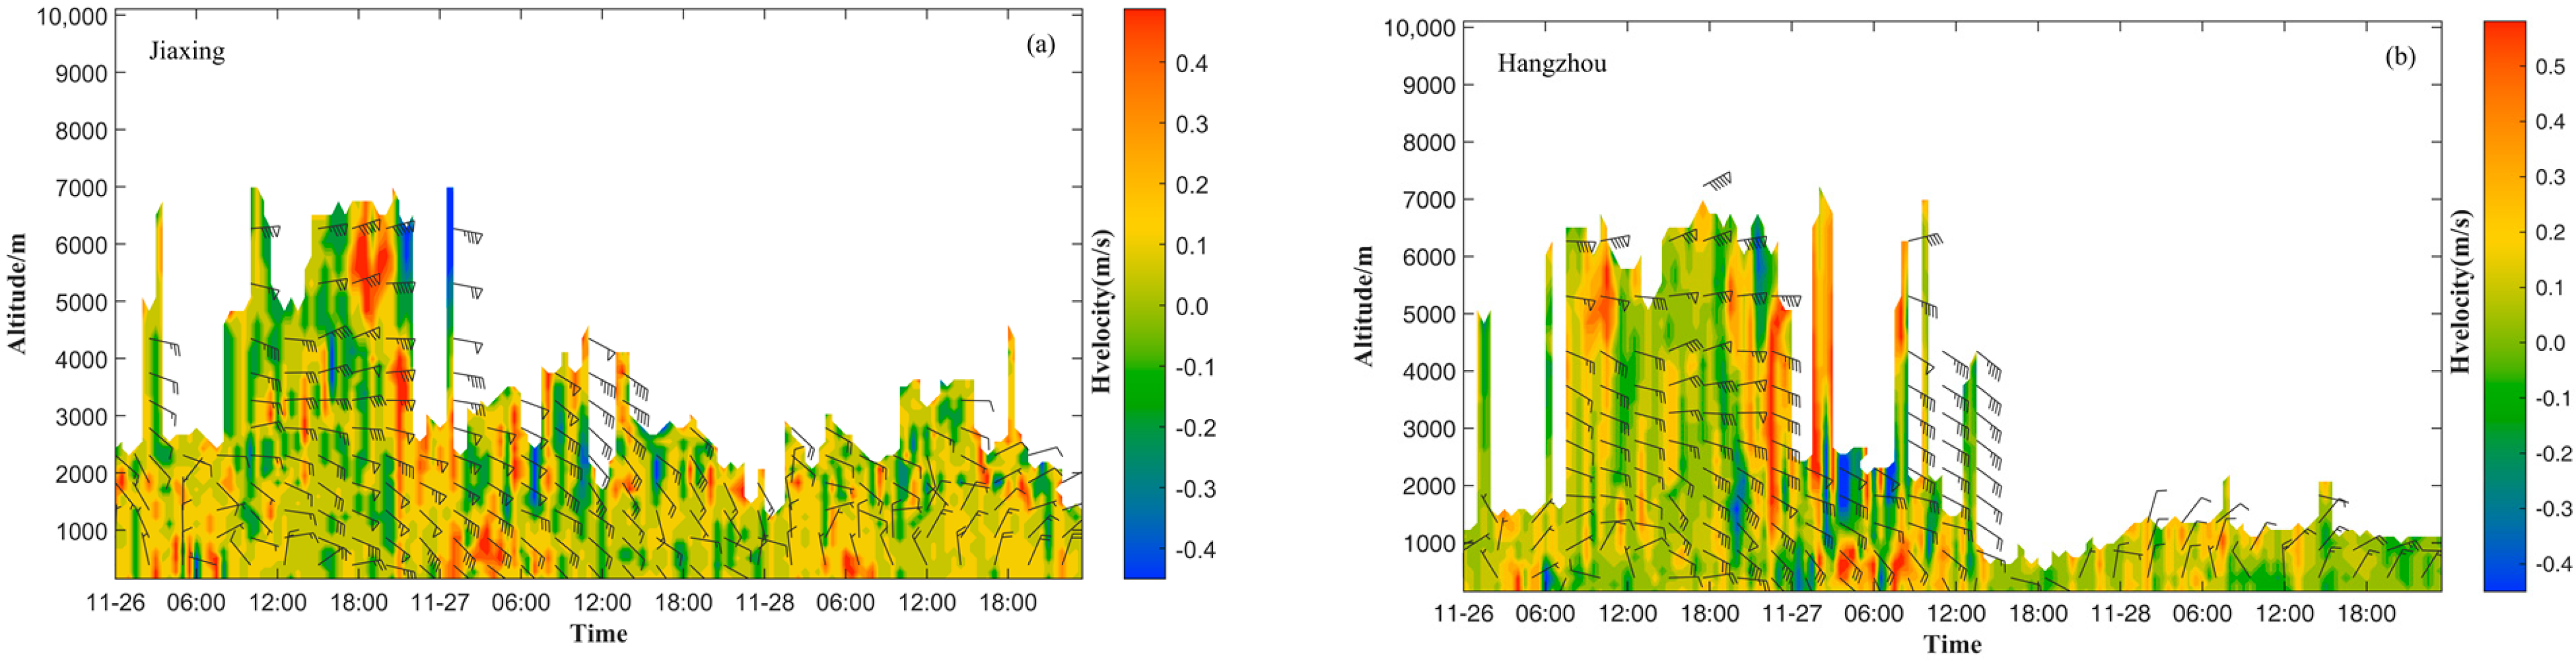
The dominant mechanism for dust events in the Yangtze River Delta region is the dust transport from upstream source areas by strong cold air and high winds. The event on 26–28 November 2025, also followed this pattern, though its occurrence in winter was relatively rare. This dust originated from western Mongolia and the desert regions along the Gansu–Ningxia border, and was carried southward by a strong cold-air mass. As shown in the time–height profiles of wind barbs from the wind profiler radar for Jiaxing and Hangzhou in Figure 3, the cold air intruded from the mid-to upper troposphere on the 26th and reached the boundary layer during the night through momentum downward transfer. The vertical wind field exhibited a characteristic wind direction reversal with height: westerly winds prevailed in the upper troposphere, while northwesterly winds dominated the mid-to lower troposphere, indicating the control of deep cold advection over the study area.
Figure 3.
The time–height profiles of wind barbs for Jiaxing (a) and Hangzhou (b) during the dust event from 26 to 28 November 2025. The wind plume indicates horizontal wind, while the color fill indicates vertical velocity.
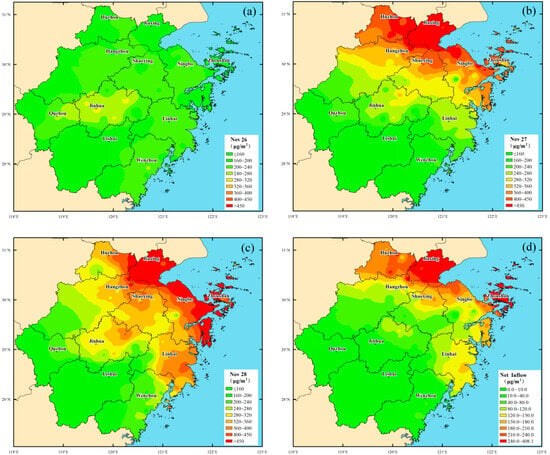
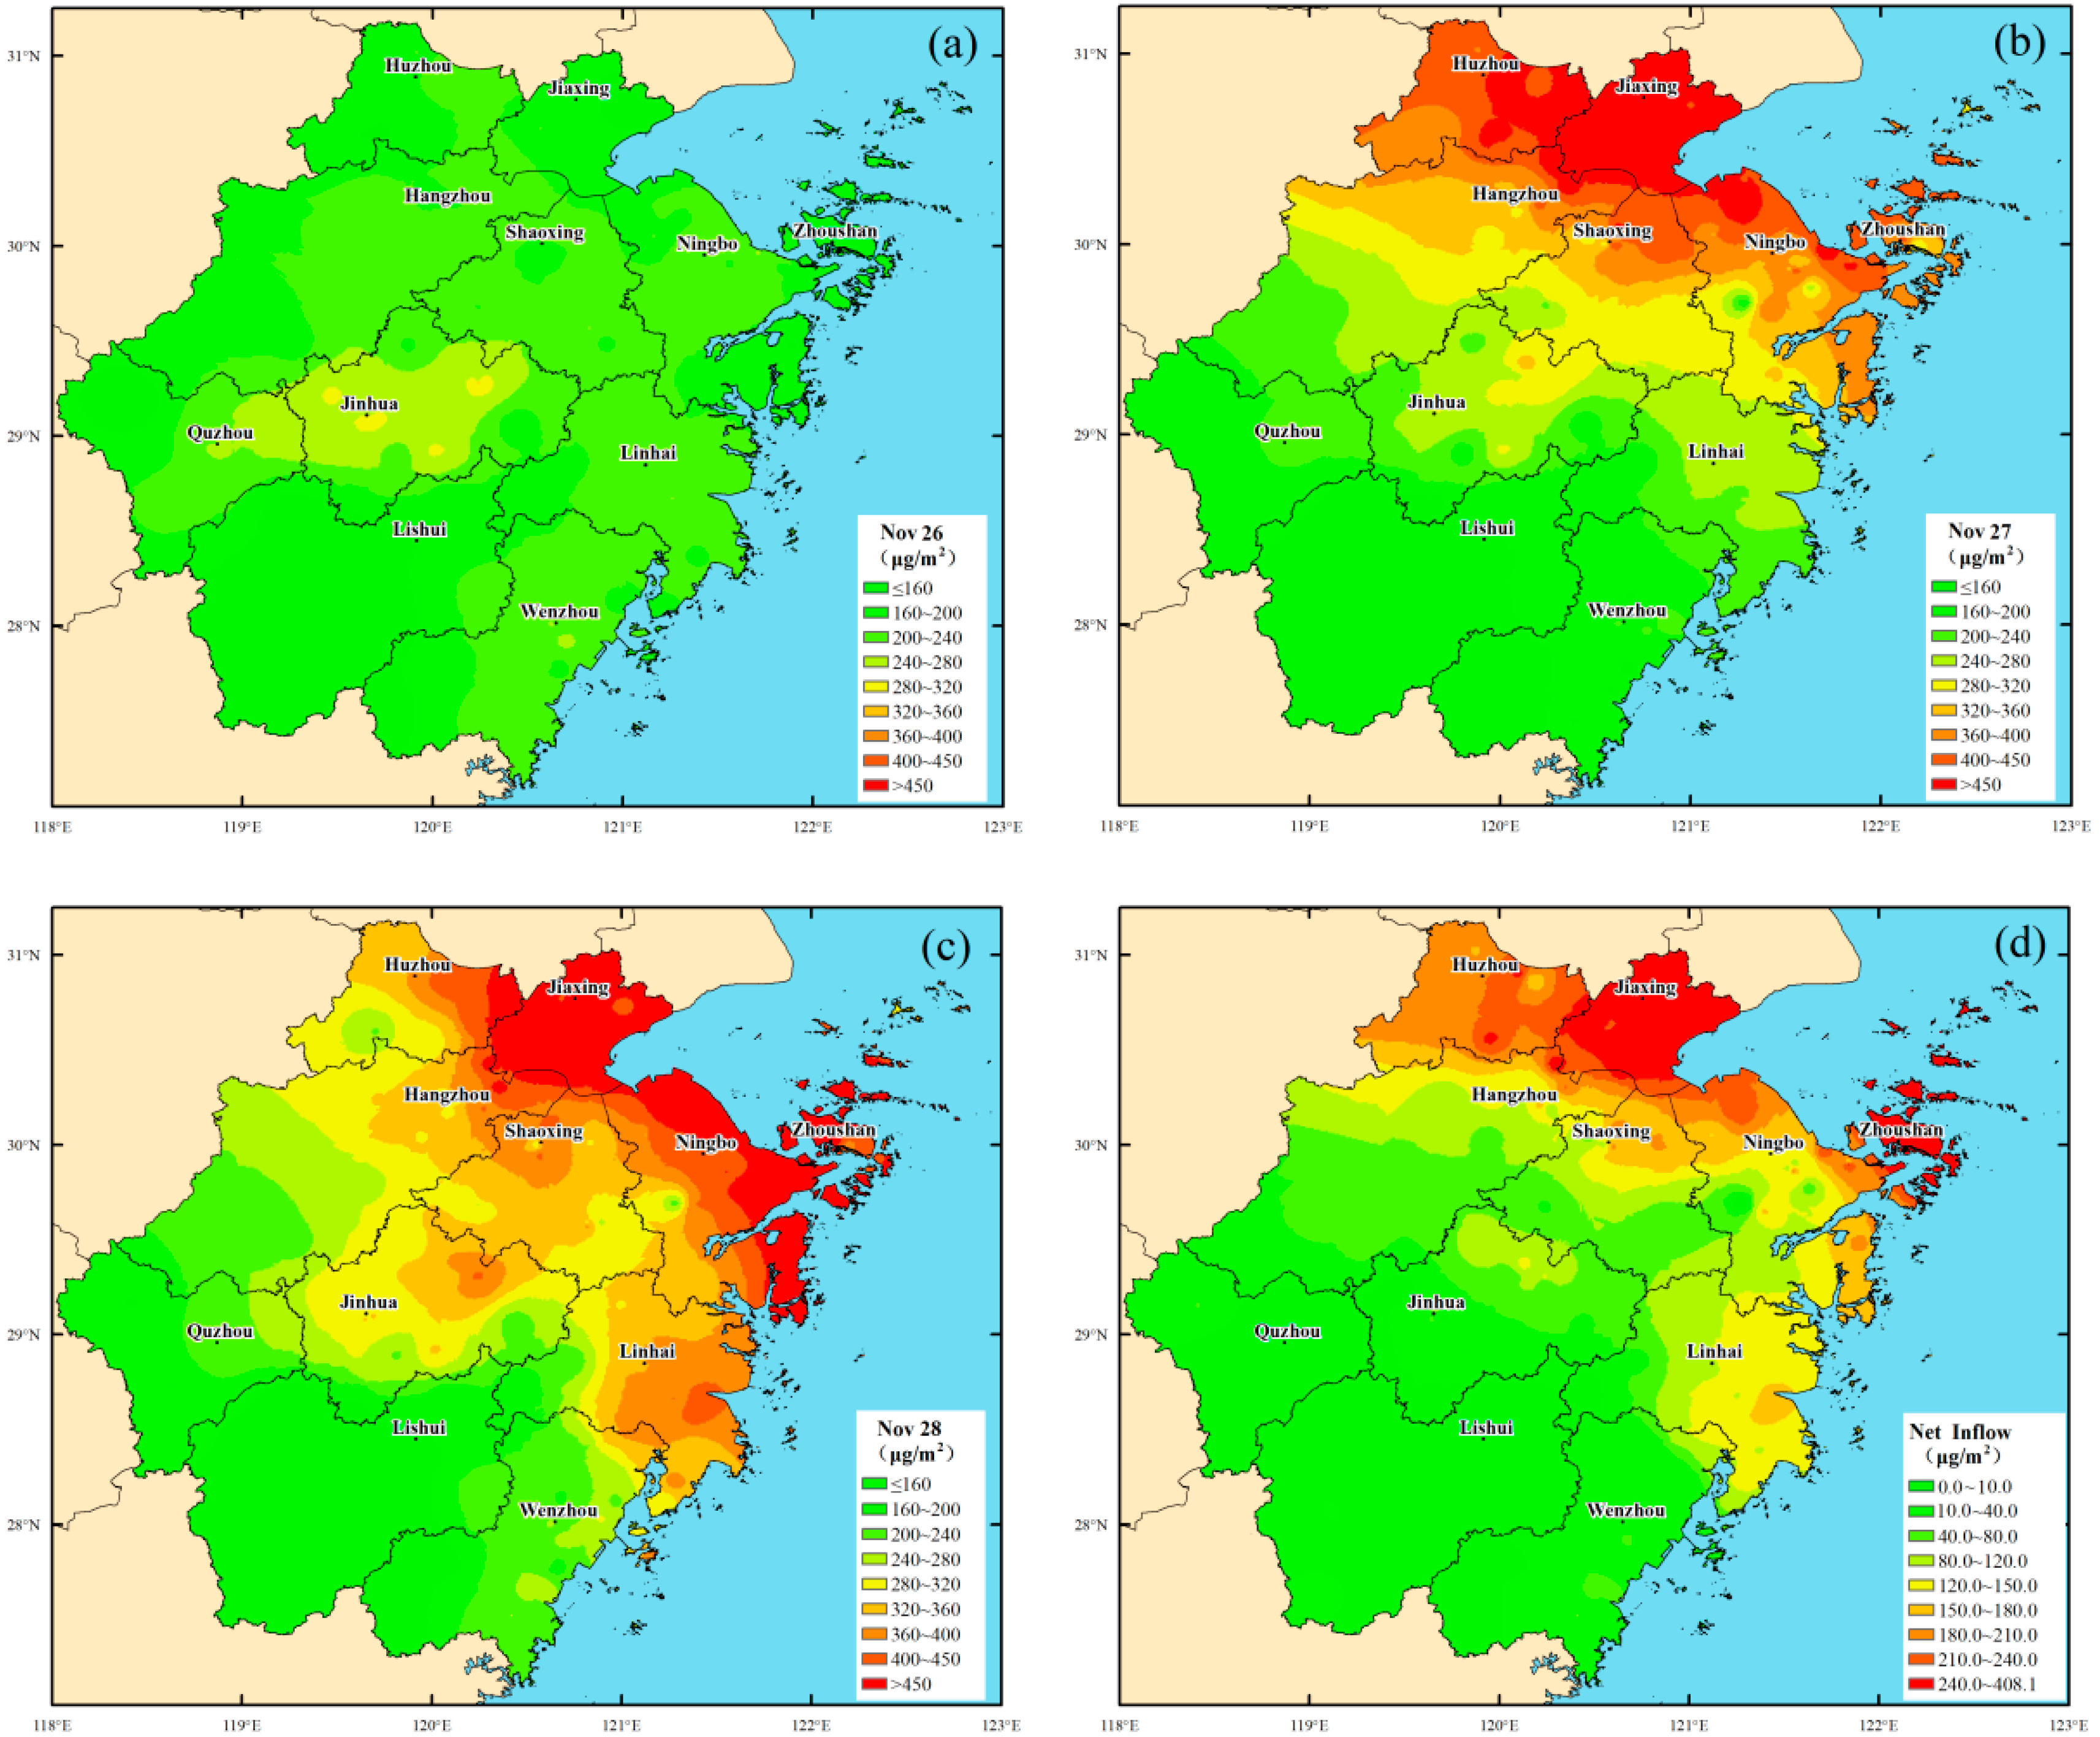
Figure 4a–d shows the distributions of the daily average PM10 column concentrations and the net dust input column concentrations during the dust event, respectively, while Table 1 presents the total net dust input and net input per unit area for each prefecture-level region and the entire province. As shown in Figure 4a–c, on the 26th, the daily average PM10 column concentration ranged from 29.3 to 180.5 μg/m2, generally exhibiting higher values in urban centers and lower values in coastal areas and ecological demonstration zones such as Lishui and Chun’an. The relatively elevated concentrations in Lishui and eastern Quzhou were primarily associated with weaker diffusion capacity due to basin topography. On the 27th, the daily average PM10 column concentration significantly increased to 54.1–316.4 μg/m2, showing a decreasing distribution pattern from northeast to southwest. On the 28th, the daily average PM10 column concentration slightly declined to 51.8–312.2 μg/m2, with the dust mass gradually moving out of Zhejiang Province along the northwest–southeast direction.
Figure 4.
(a) Daily average PM10 column concentrations on 26 November; (b) same on 27 November; (c) same on 28 November; (d) the net dust input column concentration during the dust event.
Table 1.
The total net dust input and the net input per unit area for each prefecture-level region and the entire province during the dust event from 26 to 28 November 2025.
As shown in Figure 4d and Table 1, the total net dust input in Zhejiang Province during this event was 7760 tons, which is notably lower than the 27,894 tons from the spring dust event in 2023, due to the weaker cold front [33]. Influenced by factors such as the terminal effect of the transport system, gravitational settling, and topographic blocking, the dust input exhibited a spatial pattern of high values in northeastern Zhejiang and low values in southwestern Zhejiang, decreasing from northeast to southwest. Ningbo City recorded the highest input at 1371 tons, followed by Hangzhou, Huzhou, Jiaxing, and Taizhou, each exceeding 1000 tons. Inputs in southwestern Zhejiang were relatively low, with Lishui being the smallest at 13 tons, while Quzhou and Wenzhou registered 16 tons and 21 tons, respectively.
The distribution of net input per unit area slightly differed from that of the total input. Although Zhoushan City ranked 7th in total input, its per-unit-area input reached 0.293 t/km2, the highest in the province. This was followed by Jiaxing, Huzhou, Ningbo, Shaoxing, and Taizhou, with values ranging from 0.106 to 0.261 t/km2. Due to significant impacts being limited to its northern part, Hangzhou region’s average per-unit-area input across the entire municipality was 0.082 t/km2, lower than other regions in northeastern Zhejiang. Influenced by the Hangzhou Bay–Jinqu Basin transport corridor, Jinhua region recorded a per-unit-area input of 0.037 t/km2, the highest in central Zhejiang. Southwestern Zhejiang was the least affected, with Lishui’s per-unit-area input at only 0.001 t/km2, and Quzhou and Wenzhou at approximately 0.002 t/km2.
3.2. Meteorological Impacts of the Dust Event
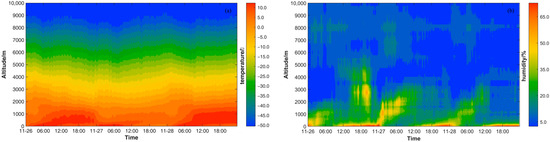
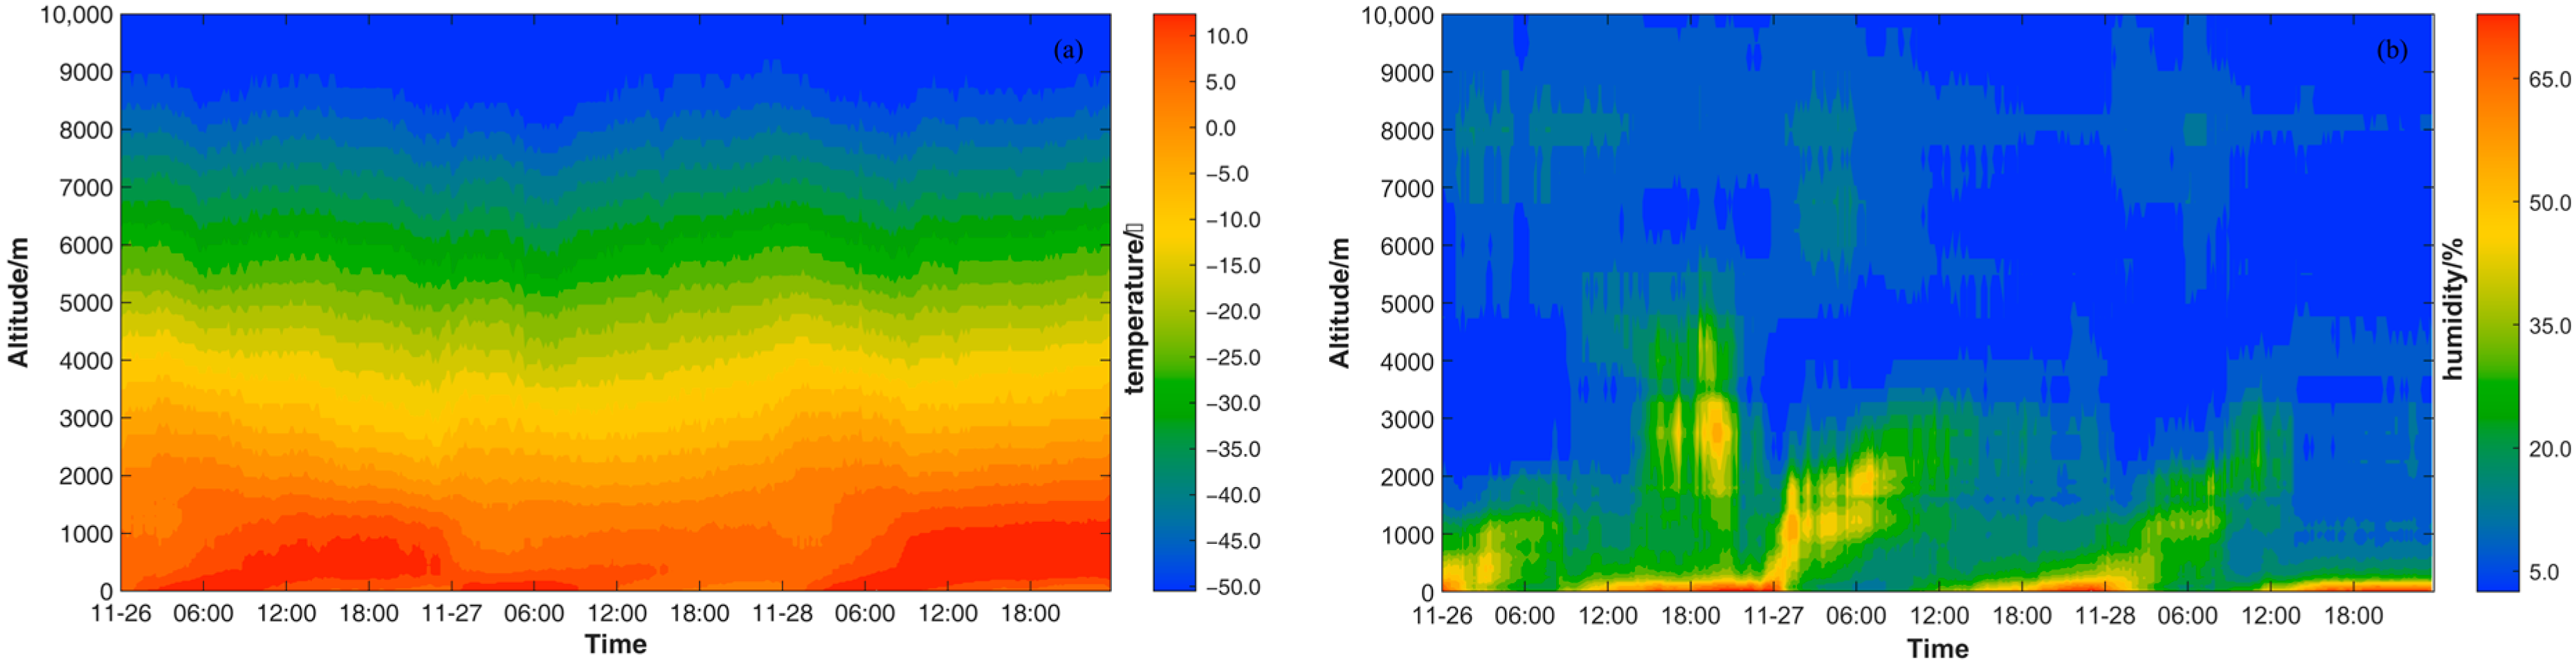
Dust is not merely a passive byproduct of weather processes but also an active forcing factor that significantly influences weather evolution. Taking Hangzhou as an example, Figure 5a,b shows the time–height profiles of temperature and relative humidity in Hangzhou from the 26th to the 28th. Influenced by the cold air, the temperature began to drop successively from the top layers downward on the 26th, and, with the nighttime surface cooling, a suspended temperature inversion occurred around 21:00. With the establishment of deep cold advection, the suspended inversion dissipated around 3:00 on the 27th. Subsequently, due to reduced solar radiation caused by the dust, temperatures within the boundary layer continued to decline until around 3:00 on the 28th. Furthermore, the shortwave shading and cooling effect of the dust induced atmospheric cooling and reduced the saturation vapor pressure below the dust layer, leading to a significant increase in relative humidity when the dust first entered the region. Integrated with Figure 6, it was found that the relative humidity decreased significantly when the dust reached the near-surface layer.
Figure 5.
The time–height profiles of temperature (a) and relative humidity (b) in Hangzhou during the dust event from 26 to 28 November 2025.
Figure 6.
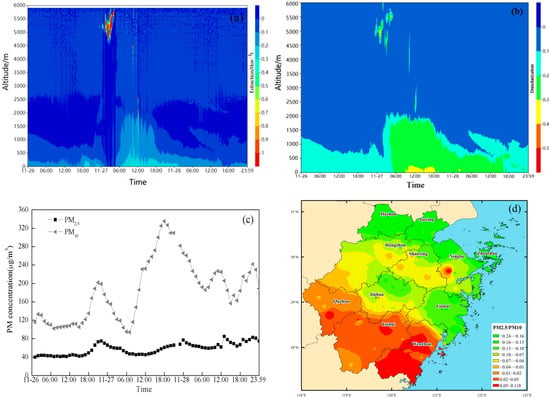
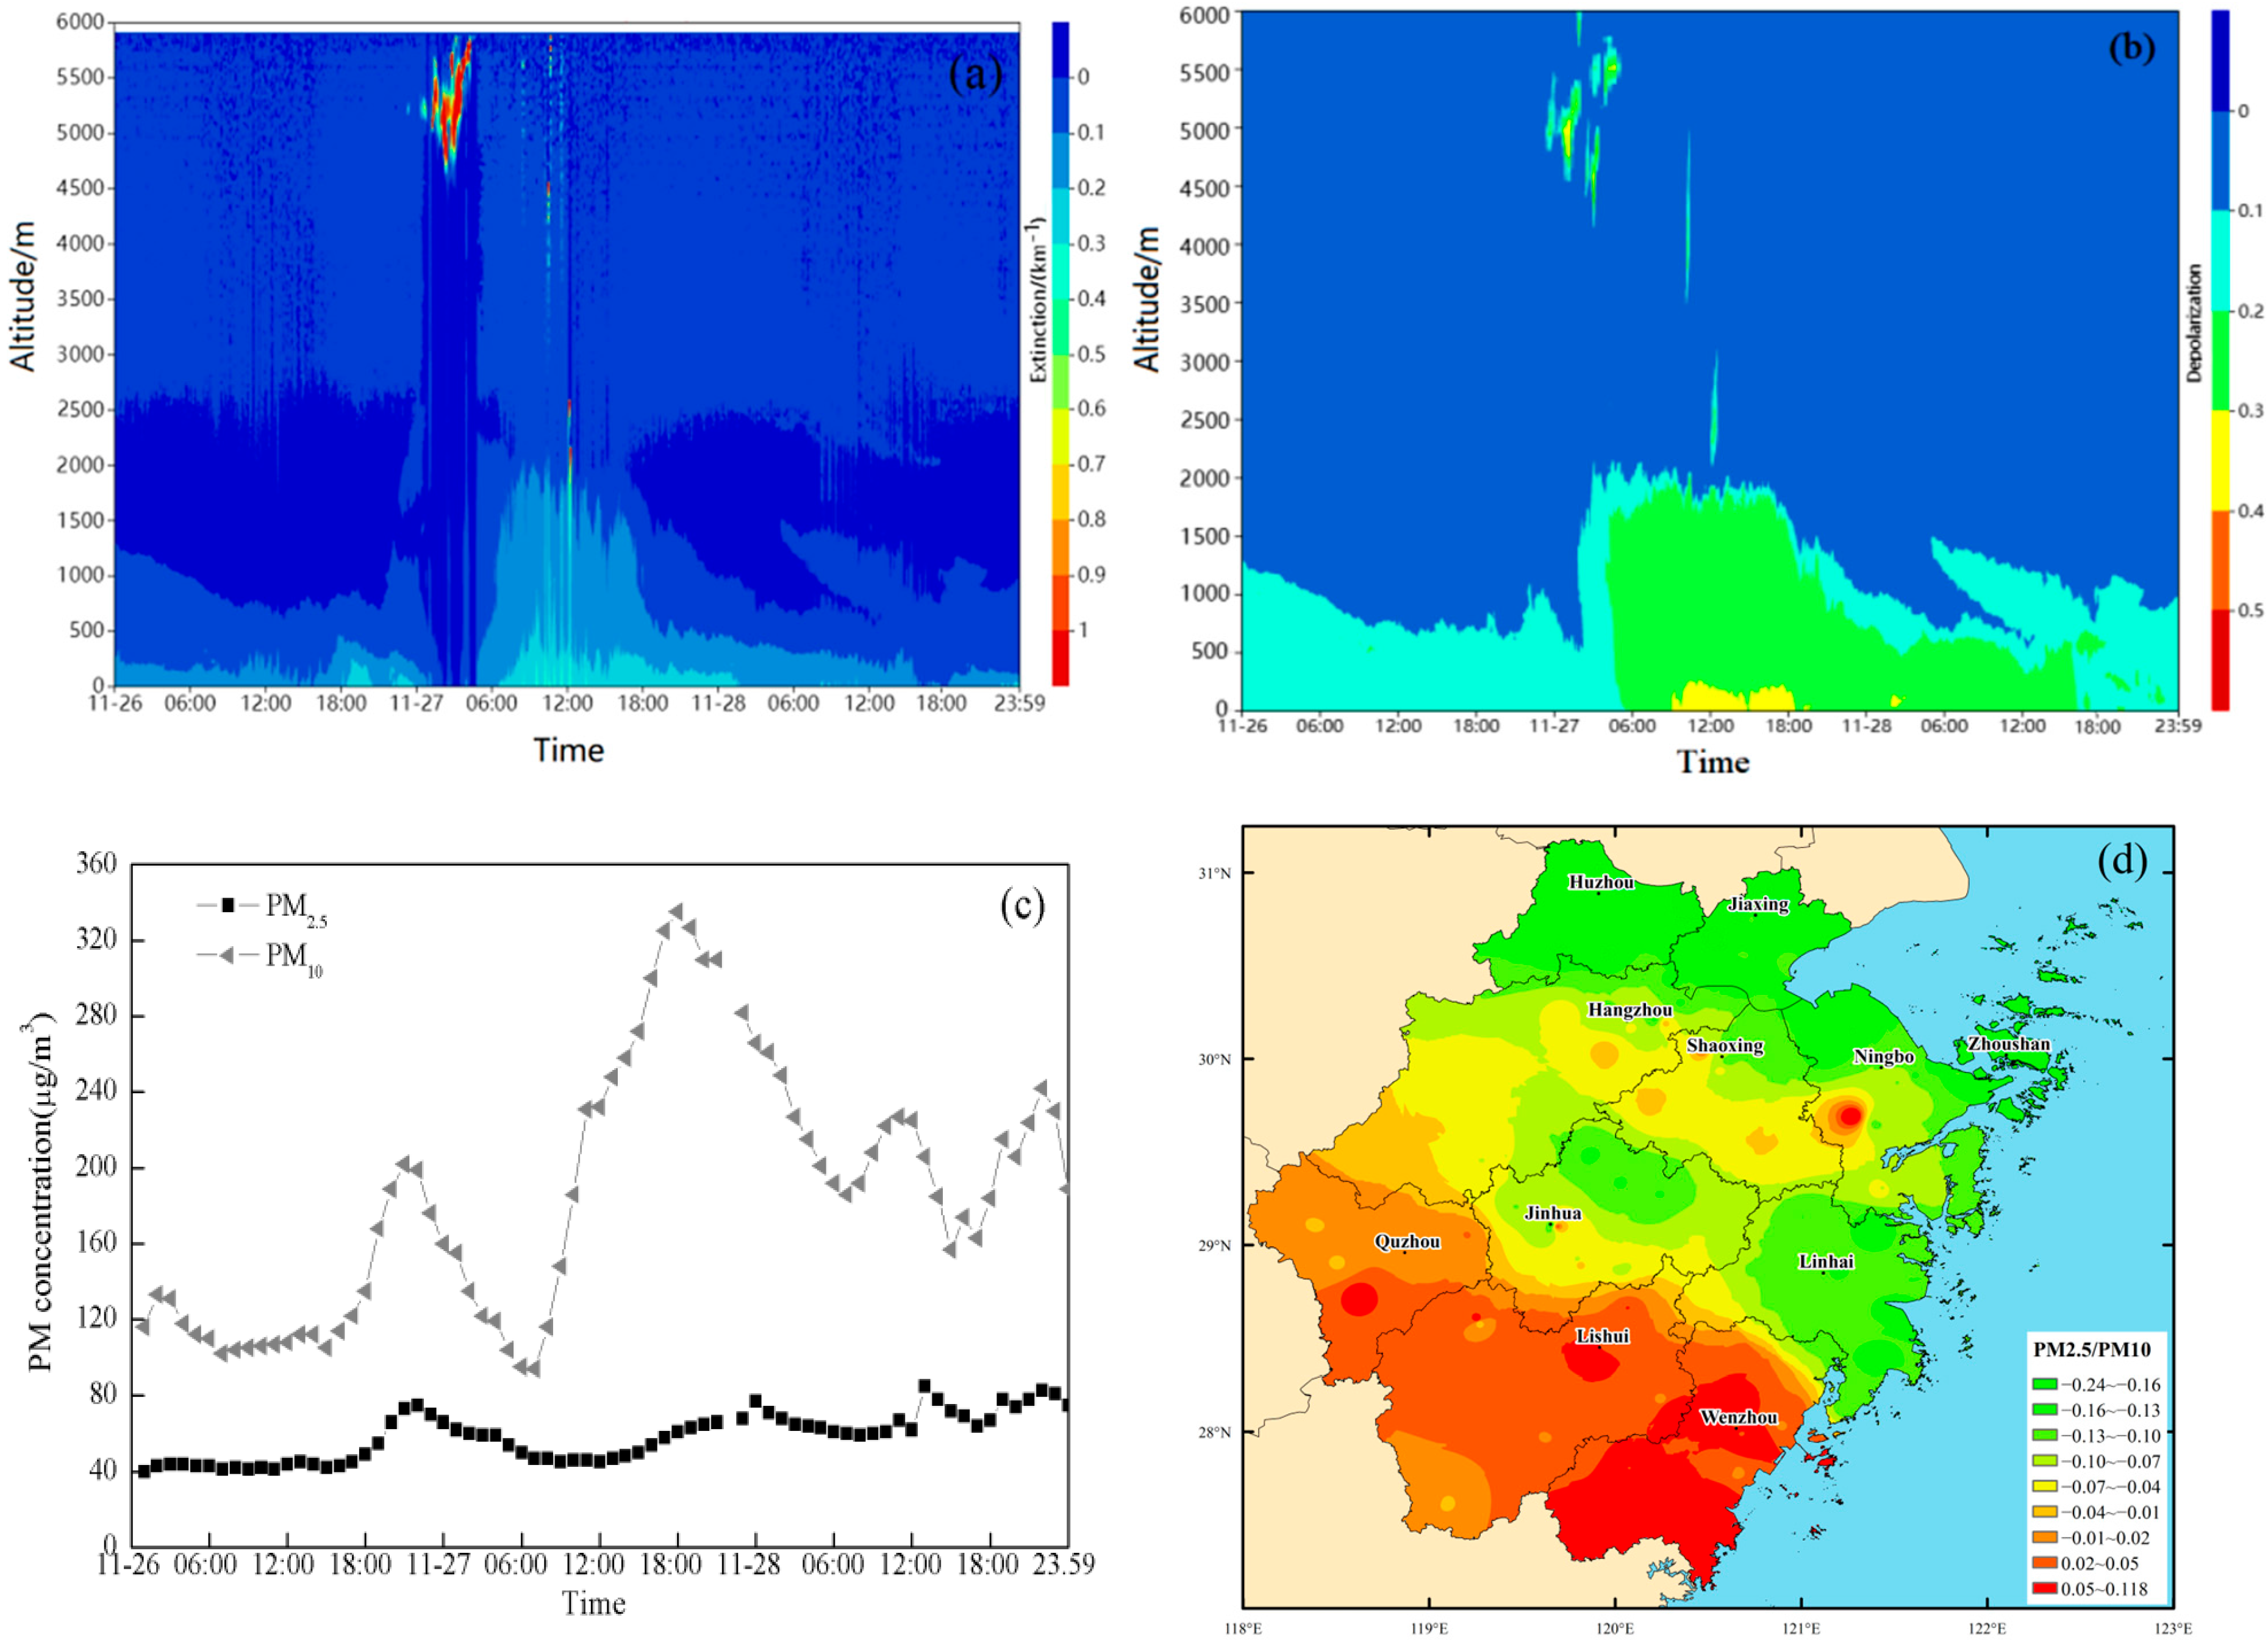
The variations of dust extinction coefficient (a), depolarization (b), and surface PM2.5 and PM10 concentrations (c) in Hangzhou during the dust event from 26 to 28 November 2025, as well as the spatial variation in surface PM2.5/PM10 ratio before and after dust intrusion in Zhejiang province (d).
3.3. Microphysical Characteristics of the Dust Event
Figure 6a–c illustrates the variation in dust extinction coefficients and depolarization ratios measured by lidar, as well as surface PM2.5 and PM10 concentrations in Hangzhou. During the intrusion of dust into the mid-to-upper troposphere, depolarization ratios varied between 0.1 and 0.4, reflecting a mixture of fresh dust and a fraction of aged dust. As dust settled, depolarization ratios generally decreased but displayed distinct vertical stratification below 2 km height: values ranged from 0.1–0.2 in the upper layer, 0.2–0.3 in the middle layer, and 0.3–0.4 in the layer closest to the surface. This gradient indicates that non-spherical coarse particles preferentially enriched the near-surface layer via gravitational settling and hygroscopic absorption, whereas the middle and upper layers were dominated by more spherical, highly aged fine particles. The markedly higher depolarization ratio near the surface compared to higher altitudes serves as an indicator that the main dust plume had descended to the breathing zone, heralding a rapid rise in surface PM10 concentrations [15,34].
Ground-based observations show a minor PM10 peak around 18:00 on 26 March, signaling early dust settlement (not captured by lidar). However, a suspended inversion layer suppressed the vertical transport of dust from the mid-to-upper troposphere to the near-surface layer, while existing near-surface dust continued to settle or be removed, leading to a temporary decline in PM10 concentrations. By the morning of 27 March, the deep cold-advection system disrupted the inversion structure, allowing dust from the middle and upper layers to subside. Consequently, surface PM10 concentrations rose sharply after 06:00, showing close temporal consistency with the enhanced vertical gradient in lidar depolarization ratio. Compared to the total PM10 increase of 135 μg/m3, PM2.5 concentrations changed only moderately, rising by just 33 μg/m3, confirming that coarse particulate comprised the main component of the invading dust.
A further analysis of the spatial variation in the surface PM2.5/PM10 ratio before and after dust intrusion (Figure 6d) reveals that, in northern Zhejiang, where dust input was high, the ratio declined significantly, with the magnitude of decrease generally correlating with the net dust input per unit area. In contrast, southwestern Zhejiang, which received lower dust input, showed smaller reductions or even slight increases in the ratio. This spatial pattern not only corroborates the dominance of coarse particles in the original dust but also suggests that coarse particles were progressively removed during transport through gravitational settling or orographic blocking, while fine particles could be transported over longer distances or form secondarily in local environments.
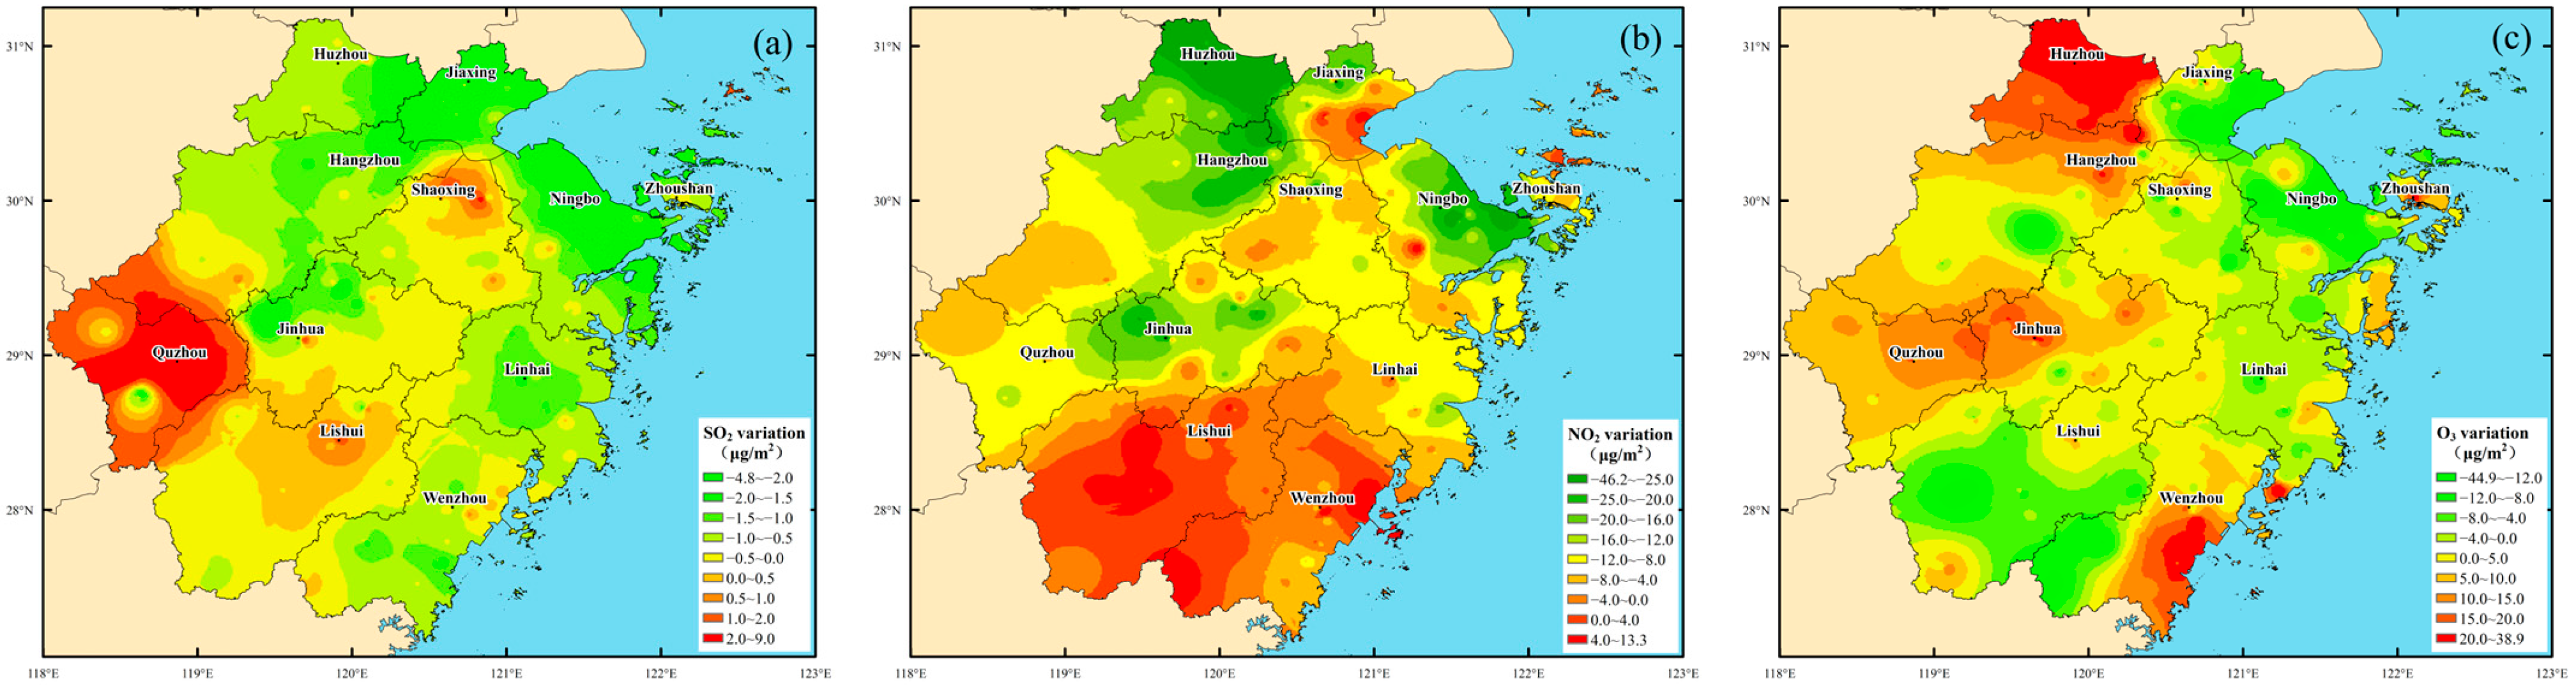
In addition to physical processes such as transport and settling that alter dust particle composition, chemical processes such as heterogeneous reactions also modify the concentration distributions of trace gases such as SO2, NO2, and O3. Figure 7a–c shows the spatial variations of surface SO2, NO2, and O3 concentrations before and after the dust intrusion in Zhejiang Province from 26 to 28 November 2025. Driven by strong cold-air horizontal dilution and vertical diffusion, together with heterogeneous oxidation reactions on dust particle surfaces [35], SO2 concentrations generally decreased after dust intrusion, with the reduction gradually weakening from northeast to southwest. However, increases were observed in Quzhou, Shaoxing, and parts of Lishui, likely due to weakened local dilution capacity, local emissions accumulation, or the transport of SO2 emissions from Shaoxing along the transport corridor. Under common circumstances, SO2 emissions in Shaoxing are relatively high within Zhejiang Province. Similarly, NO2 concentrations mostly declined following dust intrusion, though localized increases occurred in Lishui and Wenzhou, attributable to degraded dispersion conditions under the hilly-basin terrain of southern Zhejiang. In contrast to SO2 and NO2, changes in O3 concentration exhibited obvious spatial heterogeneity. In Hangzhou, Huzhou, Jinhua, Quzhou, Lishui, and Wenzhou, O3 trends were opposite to those of NO2, consistent with the NO2 titration effects and VOC-limited regime characteristics in the Yangtze River Delta [36]. In Ningbo, Zhoushan, and Taizhou, however, O3 decreased synchronously with NO2, which may be related to dust-induced radiative weakening [37], heterogeneous scavenging [38], or marine halogen chemistry processes in coastal areas [39]. These results indicate that dust intrusion reduces acidic gas SO2 and NO2 concentrations through physical dilution and chemical transformation, thereby helping to alleviate regional acidification and suppress acid rain formation.
Figure 7.
The spatial variation of surface SO2 (a), NO2 (b), and O3 (c) concentration before and after the dust intrusion in Zhejiang Province.
4. Conclusions and Discussions
- (a)
- In this study, a quantitative method for estimating dust input was established. Compared with ground-based observations, the dust input calculated using the bimodal normal distribution for dust size distribution is more accurate than that calculated using the Junge distribution.
- (b)
- The November 2025 dust event had a net PM10 input of ~7760 tons in Zhejiang province, lower than typical spring events. Influenced by coarse particle deposition, mountain blocking, and transport corridors, the spatial distribution was uneven, with higher inputs in northeastern Zhejiang and lower in the southwest. Unit area input ranged from 0.001 to 0.293 t/km2, lowest in Lishui and highest in Zhoushan.
- (c)
- Dominated by coarse particles, the dust influx caused a sharp drop in the PM2.5/PM10 ratio, which gradually recovered as coarse particles settled and dust aged, accompanied by a decreasing lidar depolarization ratio. When the main dust layer subsided to the surface, its depolarization profile showed lower values aloft and higher near the ground, serving as an early warning for the dust’s entry into the breathing layer and imminent PM10 surges.
- (d)
- Upon arrival, dust reduced surface solar radiation, fostering nocturnal temperature inversions and increasing relative humidity below the dust layer. After deposition, surface humidity dropped due to hygroscopic effects. During transit, SO2 and NO2 levels declined, suggesting a potential mitigating effect on acidity. O3 responses varied spatially: most areas showed an inverse correlation with NO2, reflecting titration and VOC-limited conditions, while, in regions like Ningbo and Zhoushan, both pollutants declined, implying possible O3 suppression via radiative effects, heterogeneous uptake, or marine halogen chemistry.
The above findings provide us with a new perspective on understanding long-range transported dust. Unlike the high concentrations and severe hazards commonly observed near dust source regions, long-range transported dust, while contributing to air pollution, also offers several environmental benefits. It can help to compensate for soil loss, replenish ecosystem nutrients, and alleviate acidification, and it may partly offset the greenhouse effect. Furthermore, our verifications of the bimodal normal size distribution and the gravitational settling of coarse particles provide key observational constraints for improving the parameterization of dust microphysical properties, including size distribution and deposition velocity. Despite these insights, this study has limitations, including the absence of a quantitative assessment of long-range transported dust on human health risks, which should be a focus of future investigations.
Author Contributions
Formal analysis, M.M.; Investigation, M.M. and F.D.; Validation, M.M. and F.D.; Software and resources, H.L. and Z.W.; Project administration, Q.L.; Writing—original draft, M.M.; Writing—review and editing, M.M. and F.D. All authors have read and agreed to the published version of the manuscript.
Funding
This research was supported by the Key Public Welfare Program of Zhejiang province (No. LGF22D050002) and the Joint Funds of the Zhejiang Provincial Natural Science Foundation of China under Grant (No.LZJMY24D050008; LZJMZ25D050001).
Data Availability Statement
The data presented in this study are available on request from the corresponding author.
Conflicts of Interest
The authors declare no conflicts of interest.
References
- Xing, Y.; Liu, B.L.; Wagner, L.E.; Guo, L.L. Source shifting and contributions to Central East Asia dust events during 2000–2023. Sci. China Earth Sci. 2025, 68, 3804–3816. [Google Scholar] [CrossRef] [Scilit]
- Middleton, N.J. Desert dust hazards: A global review. Aeolian Res. 2017, 24, 53–63. [Google Scholar] [CrossRef] [Scilit]
- Shao, Y.; Ishizuka, M.; Mikami, M.; Leys, J.F. Parameterization of size-resolved dust emission and validation with measurements. J. Geophys. Res. Atmos. 2011, 116, D08203. [Google Scholar] [CrossRef] [Scilit]
- Kok, J.F. Does the size distribution of mineral dust aerosols depend on the wind speed at emission? Atmos. Chem. Phys. 2011, 11, 10149–10156. [Google Scholar] [CrossRef] [Scilit]
- Seinfeld, J.H.; Carmichael, G.R.; Arimoto, R.; Conant, W.C.; Brechtel, F.J.; Bates, T.S.; Cahill, T.A.; Clarke, A.D.; Doherty, S.J.; Flatau, P.J.; et al. ACE-Asia: Regional climatic and atmospheric chemical effects of Asian dust and pollution. Bull. Am. Meteorol. Soc. 2004, 85, 367–380. [Google Scholar] [CrossRef] [Scilit]
- Zhang, X.Y.; Gong, S.L.; Shen, Z.X.; Mei, F.M.; Xi, X.X.; Liu, L.C.; Zhou, Z.J.; Wang, D.; Wang, Y.Q.; Cheng, Y. Characterization of soil dust aerosol in China and its transport and distribution during 2001 ACE-Asia. J. Geophys. Res. Atmos. 2003, 108, 4262. [Google Scholar] [CrossRef] [Scilit]
- Klose, M.; Shao, Y. Stochastic parameterization of dust emission and application to convective atmospheric conditions. Atmos. Chem. Phys. 2012, 12, 7309–7320. [Google Scholar] [CrossRef] [Scilit]
- Ryder, C.L.; Highwood, E.J.; Lai, T.M.; Sodemann, H.; Marsham, J.H. Coarse-mode mineral dust size distributions, composition and optical properties from AER-D aircraft measurements over the tropical eastern Atlantic. Atmos. Chem. Phys. 2018, 18, 17225–17257. [Google Scholar] [CrossRef] [Scilit]
- Weinzierl, B.; Ansmann, A.; Prospero, J.M.; Althausen, D.; Benker, N.; Chouza, F.; Dollner, M.; Farrell, D.; Fomba, W.K.; Freudenthaler, V.; et al. The Saharan Aerosol Long-Range Transport and Aerosol–Cloud–Interaction Experiment (SALTRACE). Bull. Am. Meteorol. Soc. 2017, 98, 1427–1451. [Google Scholar] [CrossRef] [Scilit]
- Han, Z.W.; Li, J.W.; Guo, W.D.; Xiong, Z.; Zhang, W. A study of dust radiative feedback on dust cycle and meteorology over East Asia by a coupled regional climate-chemistry-aerosol model. Atmos. Environ. 2013, 68, 54–63. [Google Scholar] [CrossRef] [Scilit]
- Lau, K.M.; Kim, M.K.; Kim, K.M. Asian summer monsoon anomalies induced by aerosol direct forcing. Clim. Dyn. 2006, 26, 855–864. [Google Scholar] [CrossRef] [Scilit]
- Shi, Z.; Krom, M.D.; Bonneville, S.; Baker, A.R.; Bristow, C.; Drake, N.; Mann, G.; Carslaw, K.; McQuaid, J.B.; Jickells, T.; et al. Influence of chemical weathering and aging of iron oxides on the potential iron solubility of Saharan dust during simulated atmospheric processing. Glob. Biogeochem. Cycles 2011, 25, GB2010. [Google Scholar] [CrossRef] [Scilit]
- Jickells, T.D.; An, Z.S.; Andersen, K.K.; Baker, A.R.; Bergametti, G.; Brooks, N.; Cao, J.J.; Boyd, P.W.; Duce, R.A.; Hunter, K.A.; et al. Global iron connections between desert dust, ocean biogeochemistry, and climate. Science 2005, 308, 67–71. [Google Scholar] [CrossRef] [Scilit] [PubMed]
- Mao, M.J.; Deng, F.P.; Du, R.G.; Liu, H.T.; Li, Q. Research on the cause of the intensification and spatial heterogeneity of decadal-scale surface ozone pollution in the southern Yangtze River Delta region. Atmos. Environ. 2025, 363, 121596. [Google Scholar] [CrossRef] [Scilit]
- Wang, T.H.; Han, Y.; Hua, W.L.; Liu, C.; Xia, X.; Wang, Y. Profiling dust mass concentration in northwest China using a joint lidar and sun-photometer setting. Remote Sens. 2021, 13, 1099. [Google Scholar] [CrossRef] [Scilit]
- Liu, D.; Zheng, Z.F.; Chen, W.B.; Wang, Y.Q.; Zhou, J.; Zhang, Y.P. Performance estimation of space-borne high-spectral-resolution lidar for cloud and aerosol optical properties at 532 nm. Opt. Express 2019, 27, A481–A494. [Google Scholar] [CrossRef] [Scilit]
- Omar, A.; Vaughan, M.; Kittaka, C.; Winker, D. Case studies and comparisons of the CALIPSO aerosol optical depth measurements and aerosol type estimates. In Lidar Technologies, Techniques, and Measurements for Atmospheric Remote Sensing IV; Singh, U.N., Pappalardo, G., Eds.; Proceedings of SPIE; SPIE: Cardiff, UK, 2008; Volume 7111, p. 71110A. [Google Scholar] [CrossRef] [Scilit]
- Welton, E.J.; Campbell, J.R.; Spinhirne, J.D.; Scott, V.S. Global monitoring of clouds and aerosols using a network of micropulse lidar systems. In Lidar Remote Sensing for Industry and Environment Monitoring; Singh, U.N., Itabe, T., Sugimoto, N., Eds.; SPIE: Bellingham, WA, USA, 2001; Volume 4153, pp. 151–158. [Google Scholar] [CrossRef] [Scilit]
- Campbell, J.R.; Hlavka, D.L.; Welton, E.J.; Flynn, C.J.; Turner, D.D.; Spinhirne, J.D.; Scott, V.S.; Hwang, I.H. Full-time, eye-safe cloud and aerosol lidar observation at Atmospheric Radiation Measurement Program sites: Instruments and data processing. J. Atmos. Ocean. Technol. 2002, 19, 431–442. [Google Scholar] [CrossRef] [Scilit]
- Voss, K.J.; Welton, E.J.; Quinn, P.K.; Johnson, J.; Thompson, A.M.; Gordon, H.R. Lidar measurements during Aerosols99. J. Geophys. Res. Atmos. 2001, 106, 20821–20831. [Google Scholar] [CrossRef] [Scilit]
- Yang, L.L.; Hu, Z.Y.; Huang, Z.W.; Wang, L.N.; Han WYYang, Y.P.; Tao, H.J.; Wang, J. Detection of a dust storm in 2020 by a multi-observation platform over the Northwest China. Remote Sens. 2021, 13, 1056. [Google Scholar] [CrossRef] [Scilit]
- Zhao, R.B.; Feng, X.M.; Li, C.J.; Yang, Y.; Stringer, L.C.; Fu, B.J. Positive Atlantic Multidecadal Oscillation–La Niña synergy enhances recent East Asian dust activity via hydrothermal anomalies. Sci. Bull. 2026, in press. [Google Scholar] [CrossRef] [Scilit]
- Liu, H.T.; Mao, M.J. An accurate inversion method of aerosol extinction coefficient about ground-based lidar without needing calibration. Acta Phys. Sin. 2019, 68, 074205. [Google Scholar] [CrossRef] [Scilit]
- Yuan, Y.J.; Ren, D.M.; Hu, X.Y. Computing scattering phase function by recursive formula of Mie theory. Chin. J. Light Scatt. 2005, 16, 366–371. [Google Scholar]
- Yue, D.L.; Hu, M.; Wang, Z.B.; Wen, M.T.; Guo, S.; Zhong, L.J.; Wiedensohler, A.; Zhang, Y.H. Comparison of particle number size distributions and new particle formation between the urban and rural sites in the PRD region, China. Atmos. Environ. 2013, 76, 181–188. [Google Scholar] [CrossRef] [Scilit]
- Gao, J.; Wang, T.; Zhou, X.H.; Wu, W.S.; Wang, W.X. Measurement of aerosol number size distributions in the Yangtze River delta in China: Formation and growth of particles under polluted conditions. Atmos. Environ. 2009, 43, 829–836. [Google Scholar] [CrossRef] [Scilit]
- Hussein, T.; Puustinen, A.; Aalto, P.P.; Mäkelä, J.M.; Hämeri, K.; Kulmala, M. Urban aerosol number size distributions. Atmos. Chem. Phys. 2004, 4, 391–411. [Google Scholar] [CrossRef] [Scilit]
- Heintzenberg, J. Properties of the log-normal particle size distribution. Aerosol Sci. Technol. 1994, 21, 46–48. [Google Scholar] [CrossRef] [Scilit]
- Hess, M.; Koepke, P.; Schult, I. Optical Properties of Aerosols and Clouds: The software package OPAC. Bull. Am. Meteorol. Soc. 1998, 79, 831–844. [Google Scholar] [CrossRef] [Scilit]
- Cachorro, V.E.; De Frutos, A.M.; Casanova, J.L. A revised study of the validity of the general Junge relationship at solar wavelengths: Application to vertical atmospheric aerosol layer studies. Atmos. Res. 1995, 36, 251–261. [Google Scholar] [CrossRef] [Scilit]
- Junge, C.E. Die Rolle der Aerosole und der gasförmigen Beimengungen der Luft im Spurenstoffhaushalt der Troposphäre. Tellus 1953, 5, 1–26. [Google Scholar] [CrossRef] [Scilit]
- Cheng, T.T.; Lu, D.R.; Chen, H.B.; Li, Z.Q. The size distribution of dust aerosol particles in Onqin Daga sandland. Chin. J. Atmos. Sci. 2005, 29, 147–153. [Google Scholar]
- Mao, M.J.; Liu, H.T.; Dong, Y.L.; Zhang, H.L.; Deng, F.P. Sand-dust flux and its effect on atmospheric environment based on lidar network. Laser Optoelectron. Prog. 2025, 62, 0501004. [Google Scholar] [CrossRef] [Scilit]
- Shimizu, A.; Sugimoto, N.; Matsui, I.; Arao, K.; Uno, I.; Murayama, T.; Kagawa, N.; Aoki, K.; Uchiyama, A.; Yamazaki, A. Continuous observations of Asian dust and other aerosols by polarization lidars in China and Japan during ACE-Asia. J. Geophys. Res. Atmos. 2004, 109, D19S17. [Google Scholar] [CrossRef] [Scilit]
- Jang, M.; Yu, Z.C.; Park, J. Modeling atmospheric mineral aerosol chemistry to predict heterogeneous photooxidation of SO2. Atmos. Chem. Phys. 2017, 17, 10001–10017. [Google Scholar] [CrossRef] [Scilit]
- Liu, Z.Q.; Hu, K.; Zhang, K.; Qin, M.; Su, H.; Liu, S.; Wang, S.; Li, Y. VOCs sources and roles in O3 formation in the central Yangtze River Delta region of China. Atmos. Environ. 2023, 302, 119755. [Google Scholar] [CrossRef] [Scilit]
- Zhang, Y.; Li, N.; Tang, K.; Wang, M.; Li, H.; Li, K.; Zheng, B.; Zhang, Q.; Gao, M.; Fang, J.; et al. Widespread surface ozone reduction triggered by dust storm disturbance on ozone production and destruction chemistry. Sci. Adv. 2025, 11, eadr4297. [Google Scholar] [CrossRef] [Scilit]
- De Reus, M.; Fischer, H.; Sander, R.; Gros, V.; Kormann, R.; Salisbury, G.; Van Dingenen, R.; Williams, J.; Lelieveld, J. Observations and model calculations of trace gas scavenging in a dense saharan dust plume during minatroc. Atmos. Chem. Phys. Discuss. 2005, 5, 1787–1803. [Google Scholar] [CrossRef] [Scilit]
- Chen, H.; Liu, P.; Wang, Q.; Huang, R.; Sarwar, G. Impact and pathway of halogens on atmospheric oxidants in coastal city clusters in the Yangtze River Delta region in China. Atmos. Pollut. Res. 2024, 15, 101979. [Google Scholar] [CrossRef] [Scilit] [PubMed]

Disclaimer/Publisher’s Note: The statements, opinions and data contained in all publications are solely those of the individual author(s) and contributor(s) and not of MDPI and/or the editor(s). MDPI and/or the editor(s) disclaim responsibility for any injury to people or property resulting from any ideas, methods, instructions or products referred to in the content. |
© 2026 by the authors. Licensee MDPI, Basel, Switzerland. This article is an open access article distributed under the terms and conditions of the Creative Commons Attribution (CC BY) license.