


Abstract
To address the severe snow accumulation within road cuttings triggered by wind-blown snow on mountainous highways, and to elucidate the influence mechanisms of cutting depth and snow fence parameters on the wind–snow flow field, this study presents a systematic investigation based on typical sections of the G577 Grade I mountain highway in the Xinjiang Uygur Autonomous Region, China. First, indoor wind tunnel experiments were conducted to observe the distribution characteristics of the wind– snow field inside and outside the cuttings and around the snow fences under varying cutting depths and fence parameters. Second, numerical simulations were performed using the Analysis System Fluent software with models identical to those used in the wind tunnel tests to analyze the airflow field and snow particle movement patterns. Finally, experimental results were compared with field observations of winter snow accumulation to validate the reliability of both the numerical simulations and wind tunnel experiments. The results indicate that under small intersection angles (15–30°), deep cuttings significantly exacerbate snowdrift accumulation trends, reducing wind speed within the cutting and increasing snow accumulation at the bottom (an increase of 31–81% per 5 m of depth). Furthermore, a nonlinear relationship regarding the impact of different snow fence parameters on flow field distribution. These findings provide theoretical support and valuable engineering references for optimizing road cutting design and snow fence construction in mountainous regions.
1. Introduction
Wind-blown snow is a significant natural phenomenon prevalent in high-latitude regions during the winter season. It is characterized by the transport of snow masses under the influence of critical wind velocity thresholds in cold and arid climates. Based on the intensity of snow transport, this phenomenon is generally classified into three categories: drifting snow, blowing snow, and blizzards [1,2,3]. In China, approximately 55.2% of the land area constitutes regions susceptible to wind-blown snow hazards, primarily concentrated in the Qinghai–Tibet Plateau, Northern Xinjiang (including the Tianshan Mountains), Inner Mongolia, and Northeast China. These hazards can severely affect the sustainable operation of regional transportation networks, human safety, and agro-pastoral production. For instance, in November 2012, the Mayitas area in Tacheng, Xinjiang, suffered repeated wind-blown snow disasters, resulting in extensive traffic paralysis. More recently, in January 2023, a similar catastrophic event along National Highway G219 in Tacheng caused severe traffic interruptions, resulting in direct economic losses of approximately 1.66 million USD and indirect logistics losses exceeding 7.19 million USD.
The rapid advancement in China’s infrastructure, coupled with accelerated highway construction, has driven engineering projects deeper into complex mountainous and hilly terrains. Due to topographical constraints, these projects necessitate extensive cut-and-fill earthworks, inevitably creating a large number of deep road cuttings. In snow–drift prone areas, these cuttings act as traps for snow particles; severe accumulation can bury the roadbed and sever transport links, thereby heightening disaster risk exposure levels across these vulnerable corridors [4]. Therefore, investigating the distribution laws of snow accumulation within deep cuttings and developing effective mitigation strategies are essential tasks for ensuring the safety and operational efficiency of transportation infrastructure in these regions.
Research on wind-blown snow in road cuttings has evolved significantly, advancing from early field observations that established fundamental accumulation laws, to wind tunnel experiments that surmounted scale limitations, and finally to contemporary multiphase flow numerical models capable of full-process simulation.
In the domain of field observations, Kobayashi et al. [5] conducted comprehensive studies during blizzards at the Mizuho Station in Antarctica, systematically collecting parameters such as horizontal visibility, blowing snow height, and atmospheric structure under strong wind conditions. Similarly, Gao [6] analyzed the critical threshold wind speed for snow particles through field data acquisition, elucidating its relationship with particle size, accumulation duration, and surface temperature.
In terms of experimental modeling, Delpech et al. [7] constructed a 1:10 scale model based on snow distribution data around the Concordia Station in Antarctica to conduct cryogenic wind tunnel tests. Lü [8] conducted a series of wind tunnel experiments to investigate the transport dynamics of natural snow collected from the field, ensuring the preservation of the undisturbed underlying surface structure.
In recent years, numerical simulation has become a dominant tool in this field. Li [9] integrated CFD multiphase flow analysis to establish a numerical model identical to wind tunnel experiments, elucidating the variation laws of flow field distribution inside and outside the cutting. Ma [10] utilized a combined approach of wind tunnel tests and numerical simulations to study the evolution of wind-induced snow drift in four types of open cuttings, analyzing the impact of wind speed and openness on snow distribution. Furthermore, Beyers [11] refined the snow erosion–deposition model by accounting for the effects of snow saltation and airflow impact on effective aerodynamic surface roughness and erosion. Liang [12] employed the finite element method to quantitatively analyze the influence of embankment height and slope ratio on the wind velocity field. Finally, Hai-Fei [13] leveraged numerical simulations to investigate the flow field characteristics of embankments with different slope gradients, revealing a close correlation between the flow field around the embankment and the slope gradient. Furthermore, numerical simulation has been proven as a reliable tool for analyzing snow hazards in China’s Xinjiang region, with recent studies focusing on avalanche flow characteristics and hazard dynamics [14].
Synthesizing the aforementioned findings, the majority of contemporary research has predominantly concentrated on standard subgrade cross-sections with dimensions limited to 15 m. In contrast, the literature addressing deep cuttings exceeding 15 m remains sparse, and no unified consensus has been established regarding their characteristics. Furthermore, mountain highways frequently traverse complex geological environments such as canyons and tunnel approaches. Consequently, actual cutting configurations exhibit significant morphological deviations from the simplified trapezoidal models typically adopted in current studies due to topographical constraints. Finally, methodological approaches in existing literature have generally relied on singular analytical techniques, often lacking the rigorous comparative analysis and cross-validation required for robust verification.
To address these limitations, this study selects the valley-bridge transition section (K62+000–K63+600) of the G577 Grade I mountain highway in the Xinjiang Uygur Autonomous Region, China, as the engineering background for establishing a high-fidelity 3D model. Methodologically, numerical simulations of wind-blown snow are conducted using the ANSYS Fluent 2022 R1 (ANSYS Inc., Canonsburg, PA, USA) platform across varying cutting depths to elucidate the transport dynamics of wind–snow flow. Furthermore, the simulation results are rigorously validated against wind tunnel experimental data to characterize the flow field distribution. Ultimately, this research aims to provide a scientific basis and engineering recommendations for the prevention and mitigation of wind-blown snow hazards on mountain highways.
2. Overview of the Study Area
2.1. Project Overview
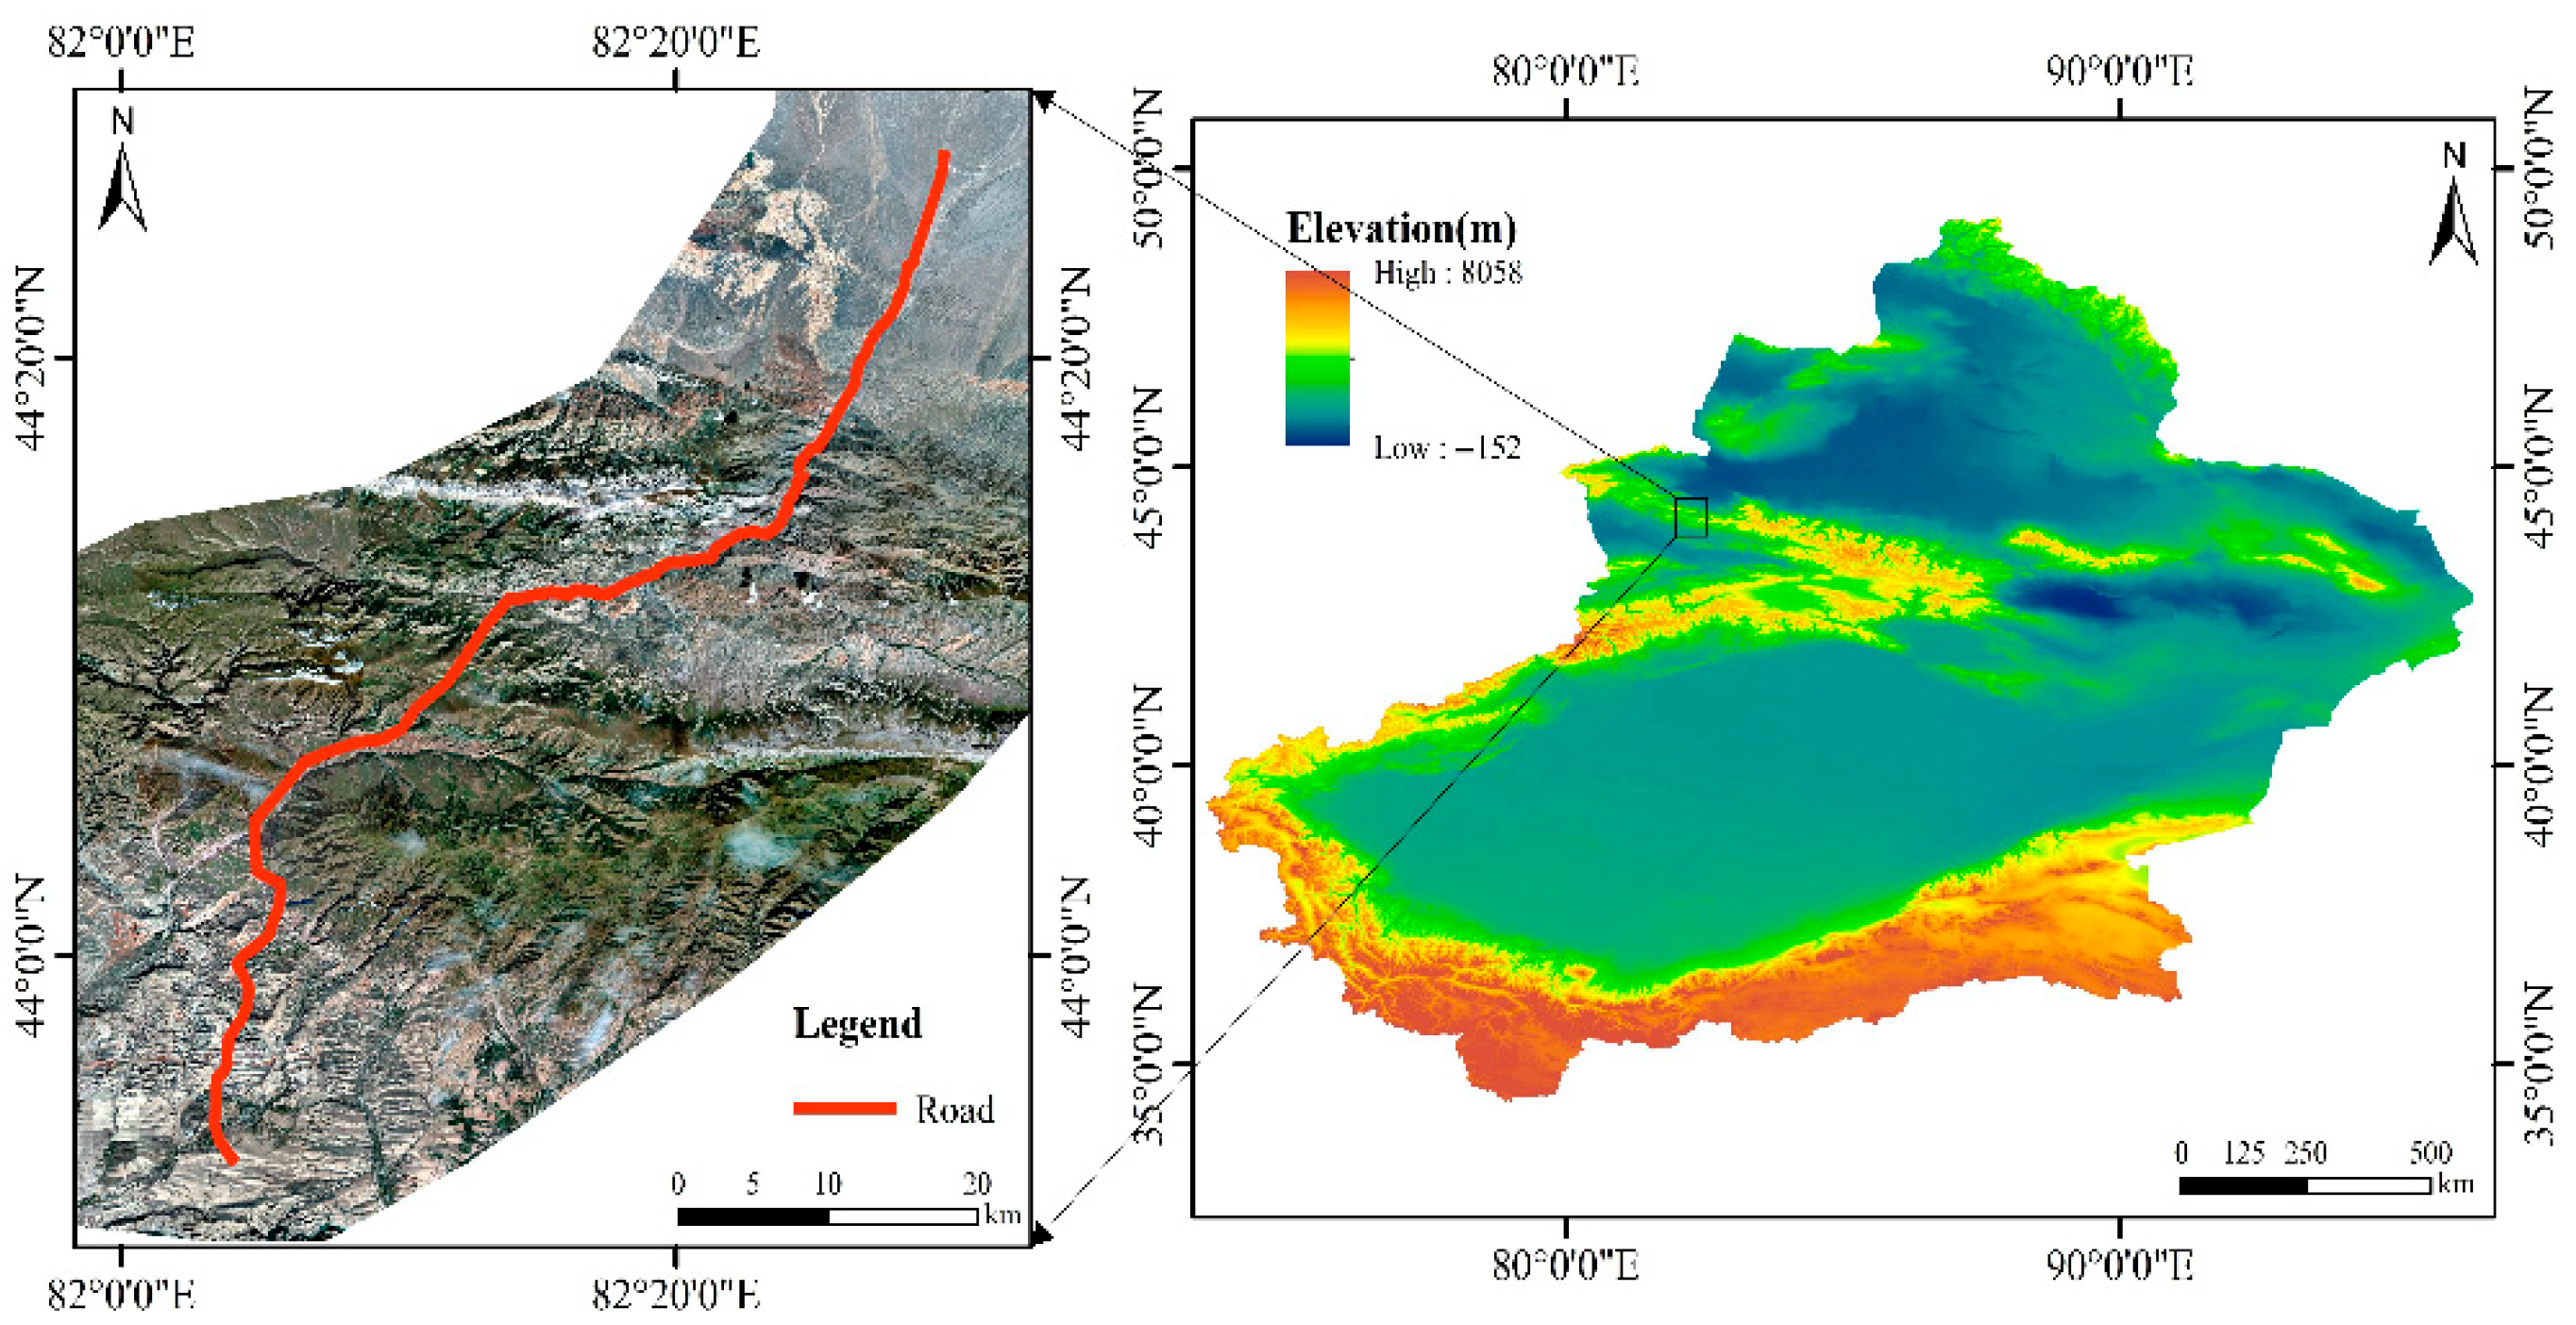
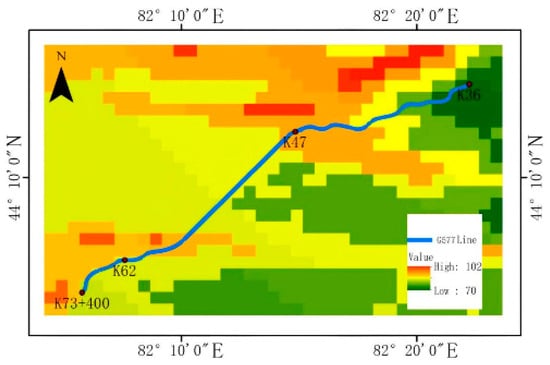
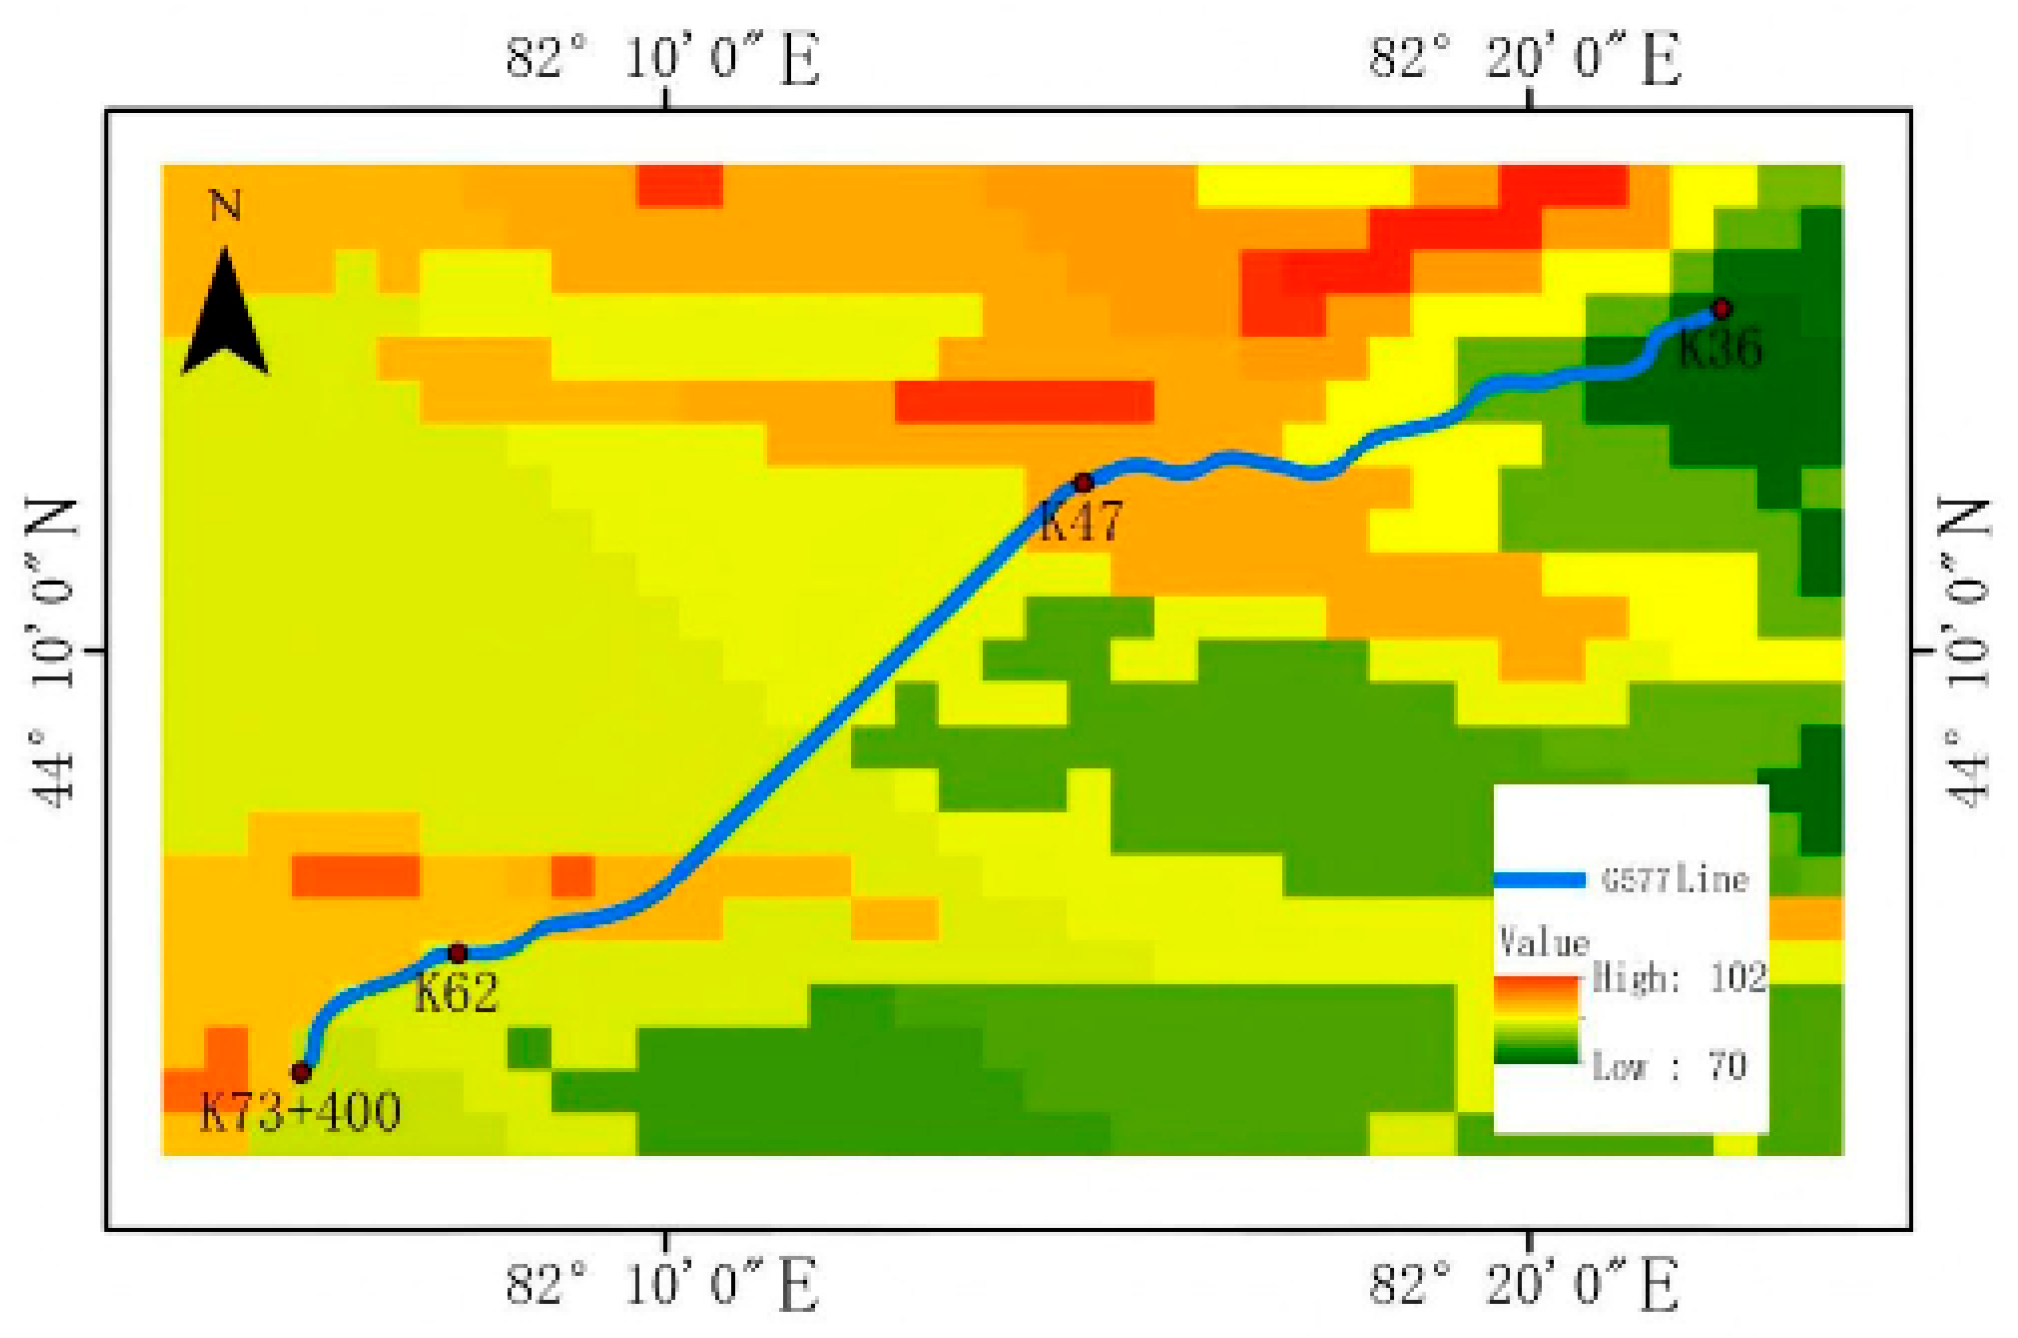
The G577 Highway (Jinghe to Yining County section) represents a strategic component of the Jinghe–Zhaosu route as delineated in the National Highway Network Planning (2013–2030). Functioning as the most expedient inter-prefecture corridor linking the Ili River Valley with Urumqi and adjacent regions, it serves as a critical arterial link for augmenting the valley’s external connectivity. The implementation of this project is pivotal for the optimization of the trunk highway network in Xinjiang; it significantly ameliorates regional traffic conditions while simultaneously bolstering transport capacity and disaster resilience. Furthermore, the corridor plays an instrumental role in facilitating regional resource exploitation and fostering sustainable socio-economic development. The location of the project is shown in Figure 1.
Figure 1.
Location map of the engineering project.
2.2. Genesis of Wind-Blown Snow
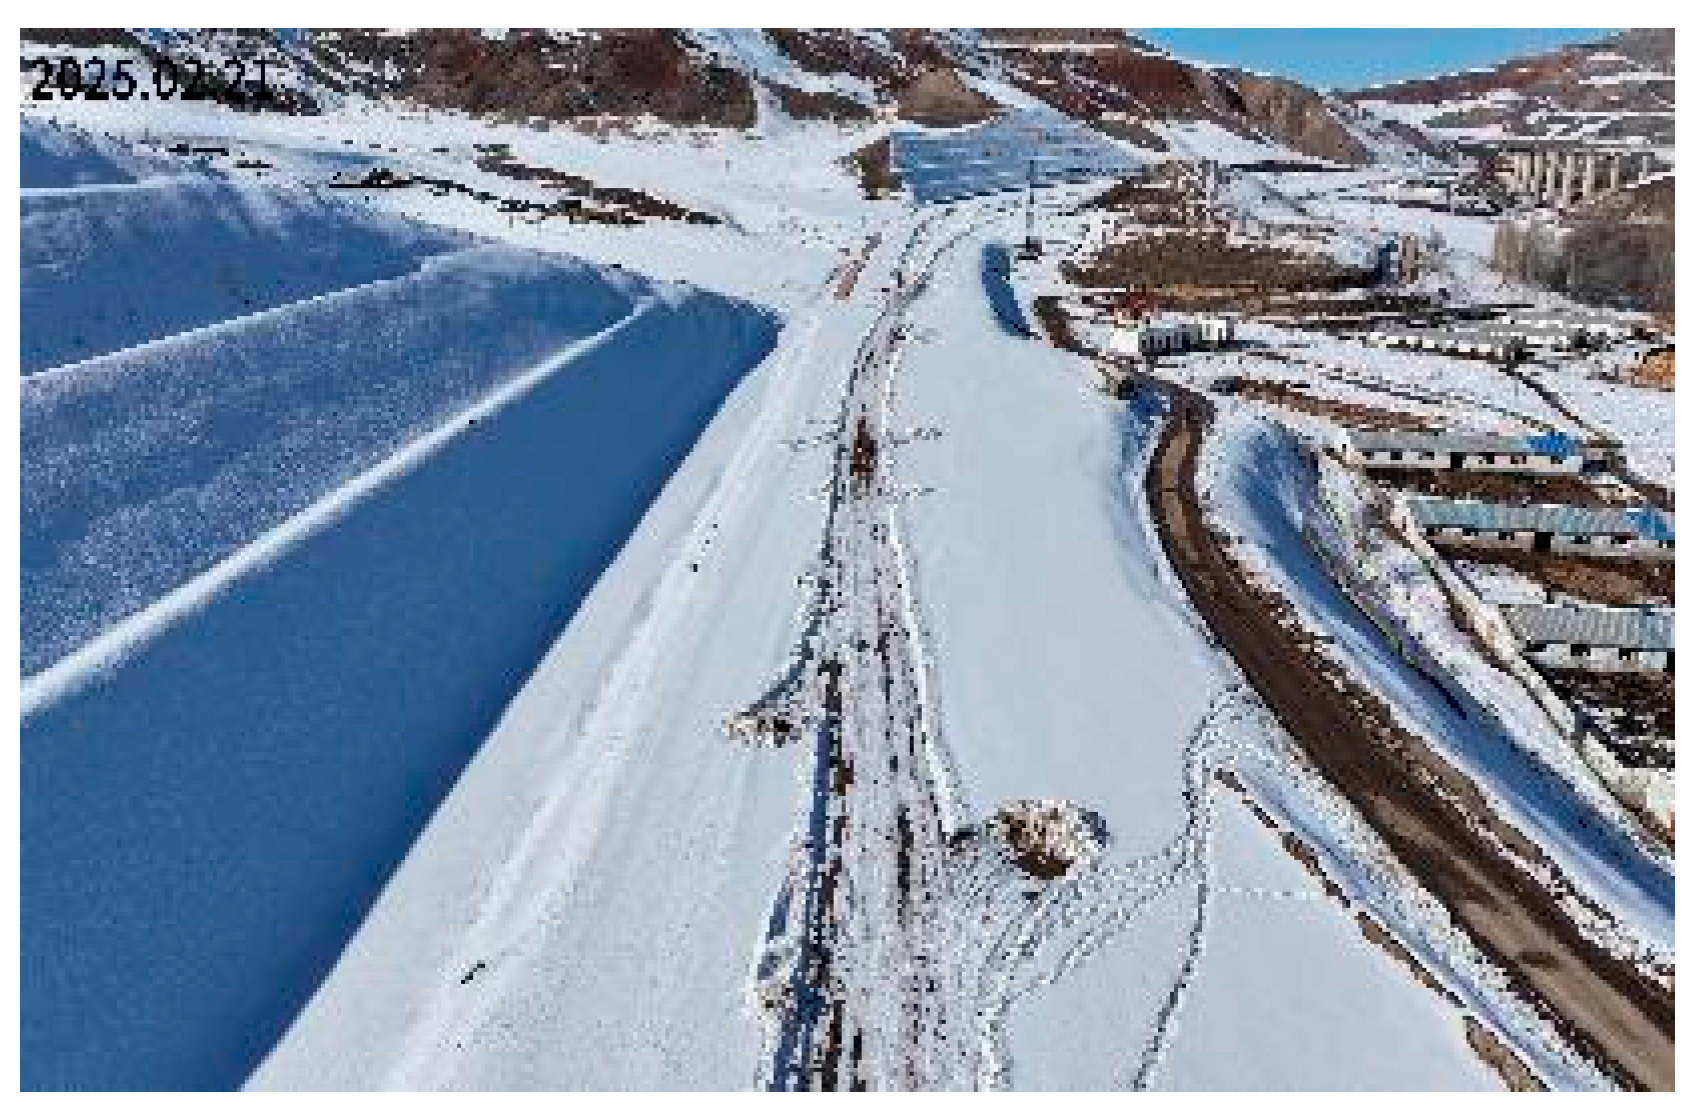
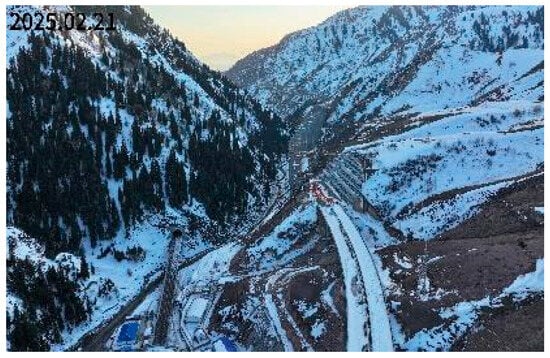
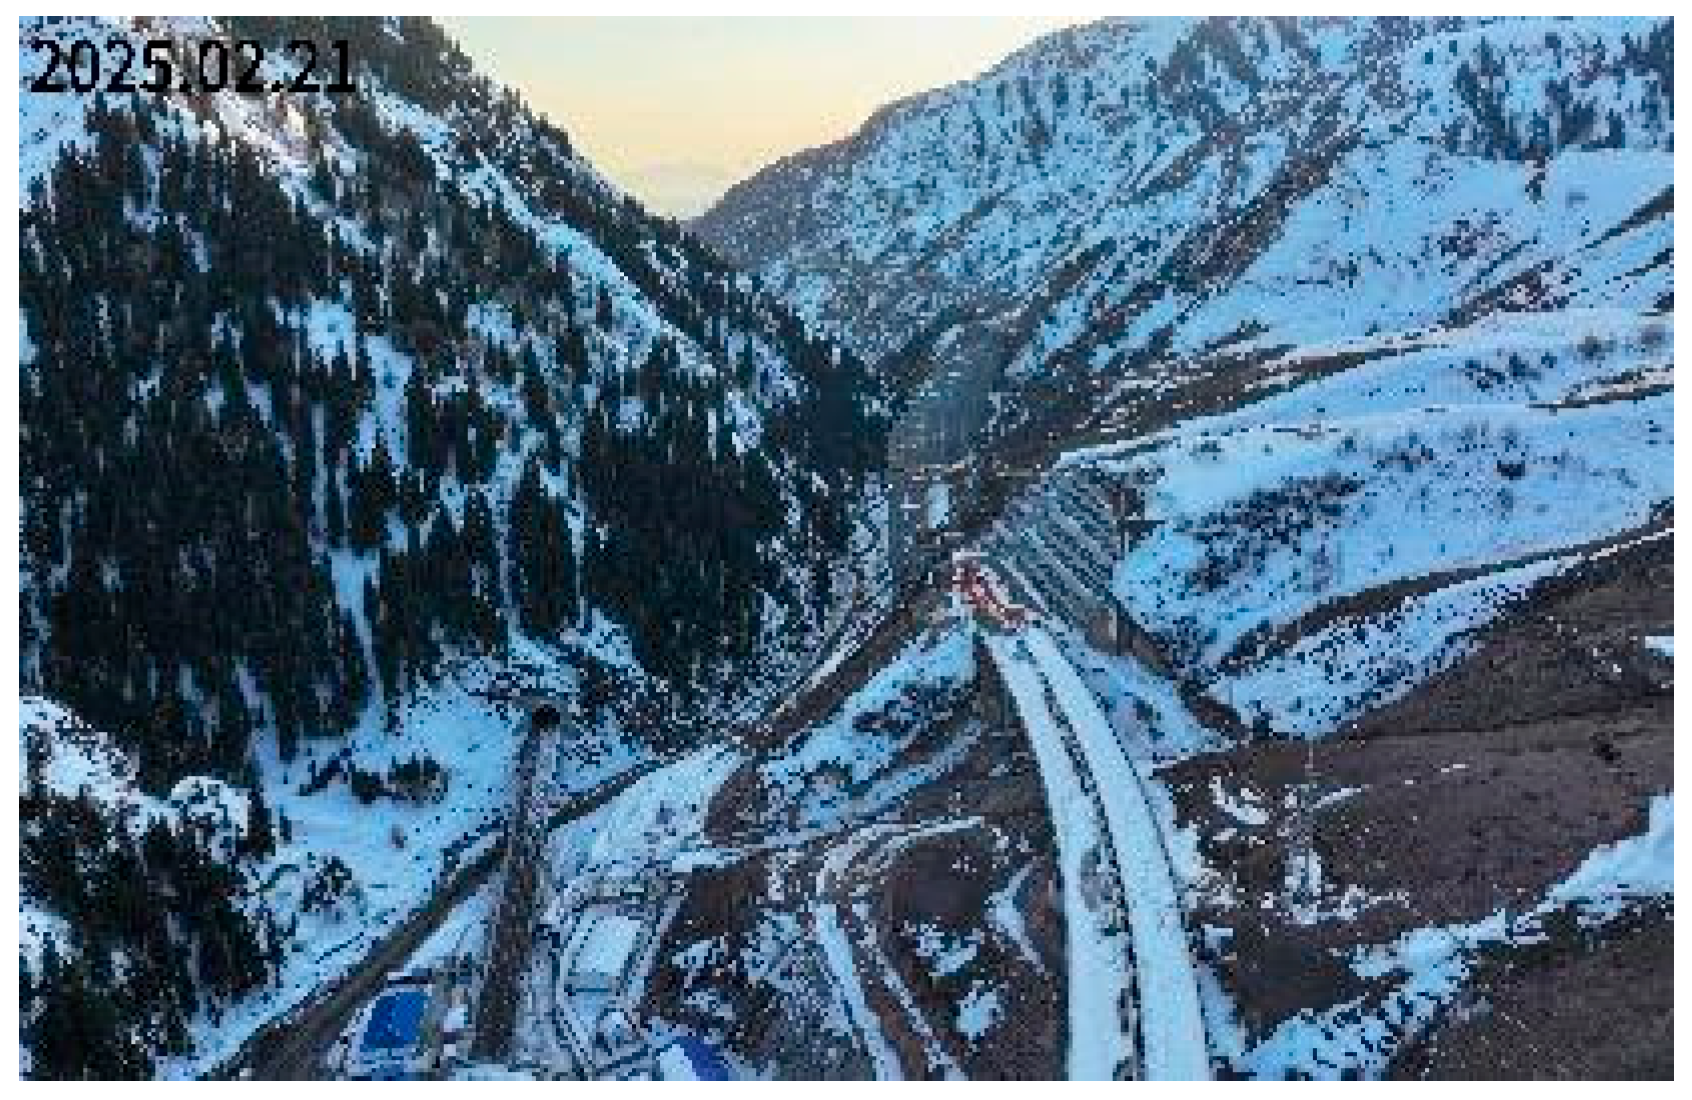
Situated within the northern Tianshan Mountains, adjacent to the Borohoro range, the G577 highway corridor traverses a region characterized by a North Temperate arid desert continental climate. The study area is characterized by an average of 35 annual snowfall days, with a prolonged snow-prone period lasting approximately 150–180 days from October to the following March. Furthermore, it exhibits extreme thermal conditions, with minimum winter temperatures plummeting to −35 °C and maximum summer temperatures exceeding 40 °C. The coupling of substantial winter snowfall and strong prevailing winds frequently induces wind-blown snow hazards, thereby severely disrupting vehicular traffic. The typical schematic diagrams of wind-blown snow hazards in this area are shown in Figure 2 and Figure 3. Hydrologically, the region is primarily sustained by atmospheric precipitation and alpine snowmelt; these sources replenish abundant bedrock fissure water near the North Tianshan Tunnel and feed fluvial systems such as the Ashale and Borbosong rivers. Furthermore, the region’s intense winter wind field is driven by the Siberian-Mongolian High. Cold air masses radiating from this high-pressure center sweep across northwestern Xinjiang unchecked by major topographical barriers. This atmospheric dynamic intensifies thermal extremes and precipitates frequent wind-blown snow events.
Figure 2.
Wind-blown snow on the G577 Highway.
Figure 3.
Snow accumulation topography at the valley-bridge connecting section.
2.3. Field Investigation
As illustrated in Figure 4, field reconnaissance reveals that snow accumulation is minimal along the northern sector of the G577 highway (K0+000–K16+000), where roadside snow depths range from 5 to 10 cm; notably, the subsequent section (K16+000–K46+000) remains virtually devoid of snow cover. In marked contrast, the corridor extending from the North Tianshan Tunnel portal (K46+000) to the project terminus at K92+000 exhibits substantial snow accumulation, with roadside depths fluctuating between 15 and 60 cm. The most severe accumulation is observed within the K84+200–K86+200 segment. Characterized by sparse vegetation coverage and a central valley location, this specific zone is highly susceptible to the combined effects of small-angle channeling winds and mountain-valley circulation.
Figure 4.
Monthly Snowfall Amount Distribution along the G577 Highway.
The study area is characterized by heavy winter snowfall, with average annual solid precipitation ranging from 150 to 250 mm. Field measurements indicate an average annual snow depth of 20–30 cm, peaking at a snow water equivalent (SWE) of approximately 82 mm. Notably, daily relative humidity reaches a maximum of 98.49%, facilitating snow crystal metamorphism and significant variations in snow density.
Regarding the hazard-prone environment, the topography features steep mountainous slopes and deeply incised ‘V’-shaped valleys. The land cover primarily consists of alpine meadows and sparse shrubs, with minimal tree presence along the road cuttings. This lack of a dense forest canopy allows for unimpeded wind-blown snow transport, resulting in substantial snow accumulation within the non-vegetated road sections.
Consequently, the excavation of deep road cuttings fundamentally alters the original local topographic configuration, thereby exerting a direct impact on regional wind fields and precipitation patterns. This modification subsequently reshapes the spatial distribution and accumulation characteristics of wind-blown snow hazards. In mountainous regions specifically, the complexity of the terrain renders the accurate prediction and early warning of such disasters exceptionally challenging. Furthermore, recent frameworks integrating high-resolution scanning with advanced modeling have further underscored the necessity of precise topographic data in characterizing alpine snow redistribution [15]. Therefore, to effectively mitigate wind-blown snow hazards in these vulnerable areas, it is imperative to acquire precise data through comprehensive field reconnaissance and experimental investigations conducted throughout both the construction and operational phases of the road cuttings.
3. Wind Tunnel Experiments on Wind-Blown Snow Based on Cutting Depth
3.1. Principles of Wind Tunnel Experiments for Terrain Models
In contrast to in situ field monitoring, wind tunnel experiments provide precise control over critical environmental variables, including wind velocity, direction, and snow flux. This methodology enables the high-fidelity reproduction of natural flow field distributions and the accurate simulation of the aerodynamic forces and kinematic states governing snow particle transport. Experimental tests utilizing simplified geometric models typically yield high-precision results, thereby facilitating the derivation of generalizable accumulation patterns. However, actual complex mountainous regions, characterized by unique undulating topography, exhibit significant morphological deviations from the simplified geometric bodies typically employed in experimental settings. Consequently, whether the flow field characteristics derived from simplified models remain valid within the context of complex mountainous terrain merits further investigation.
The terrain model wind tunnel test entails the fabrication of a physical model that faithfully preserves the geomorphic features of a specific region based on rigorous geometric scaling ratios. By analyzing wind field characteristics at measurement points on the model that spatially correspond to the in situ site, the aerodynamic properties of specific locations or the entire complex mountainous terrain can be quantitatively characterized. Such experimental protocols enable a high-fidelity reproduction of the authentic regional environment, thereby minimizing discrepancies with real-world conditions.
3.2. Experimental Procedure
3.2.1. Experimental Objectives
Diverging from traditional studies that utilize standardized embankment profiles, this research employs additive manufacturing techniques (3D printing) to reconstruct high-fidelity physical models of complex canyon topographies. The primary objective is to elucidate the flow field characteristics and snow distribution patterns within deep road cuttings. By systematically varying the cutting depth through precise adjustment of the road surface elevation, the study analyzes the flow field dynamics to identify non-linear aerodynamic transition zones. This methodological approach facilitates the establishment of a quantitative correlation between cutting depth and wind-blown snow transport, thereby providing robust data for validation against numerical simulations and field observations.
Regarding the optimization of snow fence performance, distinct combinations of structural parameters yield specific snow deposition outcomes. To optimize the design, controlled experimental investigations were conducted focusing on three critical governing variables: porosity, bottom gap, and fence height. By systematically analyzing the deposition trends resulting from these parametric variations, the study derives generalized accumulation laws. These empirical insights not only facilitate the validation of numerical models and in situ field performance but also provide robust theoretical support for the development of engineering countermeasures against wind-blown snow hazards in deep mountainous cuttings. This dual-methodology approach has been proven effective in evaluating protection strategies for linear infrastructure against wind-blown hazards [16].
3.2.2. Detailed Procedure
- (1)
- Preparation of the Wind Tunnel: To simulate the atmospheric boundary layer, sandpaper of a specific roughness was affixed to the floor of the wind tunnel. The terrain model was positioned within the test section, while a tracer particle seeding device was installed upstream, located anterior to the contraction cone.
- (2)
- Flow Field Measurement: Upon activation of the wind tunnel and stabilization at the target velocity, the tracer particle release mechanism was engaged. Simultaneously, the flow field characteristics surrounding the model were quantitatively captured using a Particle Image Velocimetry (PIV) system.
- (3)
- Preparation of Snow Simulants: Subsequent to the flow field acquisition, snow particle simulants were uniformly distributed onto a wooden substrate of a designated length. To ensure experimental fidelity, the surface of the simulants was leveled. The subgrade model was then positioned at a predetermined downstream distance.
- (4)
- Snow Drift Experiment: The wind tunnel was re-initiated to commence the snow drift simulation. The experiment proceeded until the wind speed stabilized and the snow accumulation patterns on the terrain model’s road surface and around the snow fence achieved a steady-state equilibrium (i.e., morphological evolution ceased), at which point the system was deactivated.
- (5)
- Data Acquisition and Analysis: The snow deposition morphology on the terrain and snow fence models was documented via high-resolution photography and precision metric measurements. The variation trends of snow particle distribution under distinct experimental scenarios were statistically analyzed. Additionally, a high-precision electronic balance was utilized to quantify the mass of residual simulants on the road surface after each test, thereby recording weight variations.
3.3. Determination of Model Scale Ratio
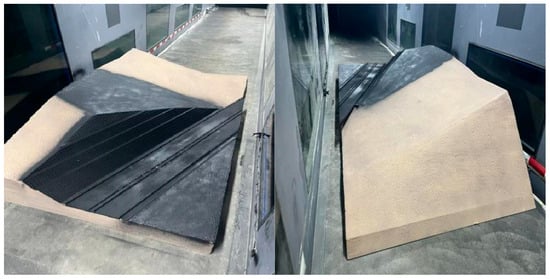
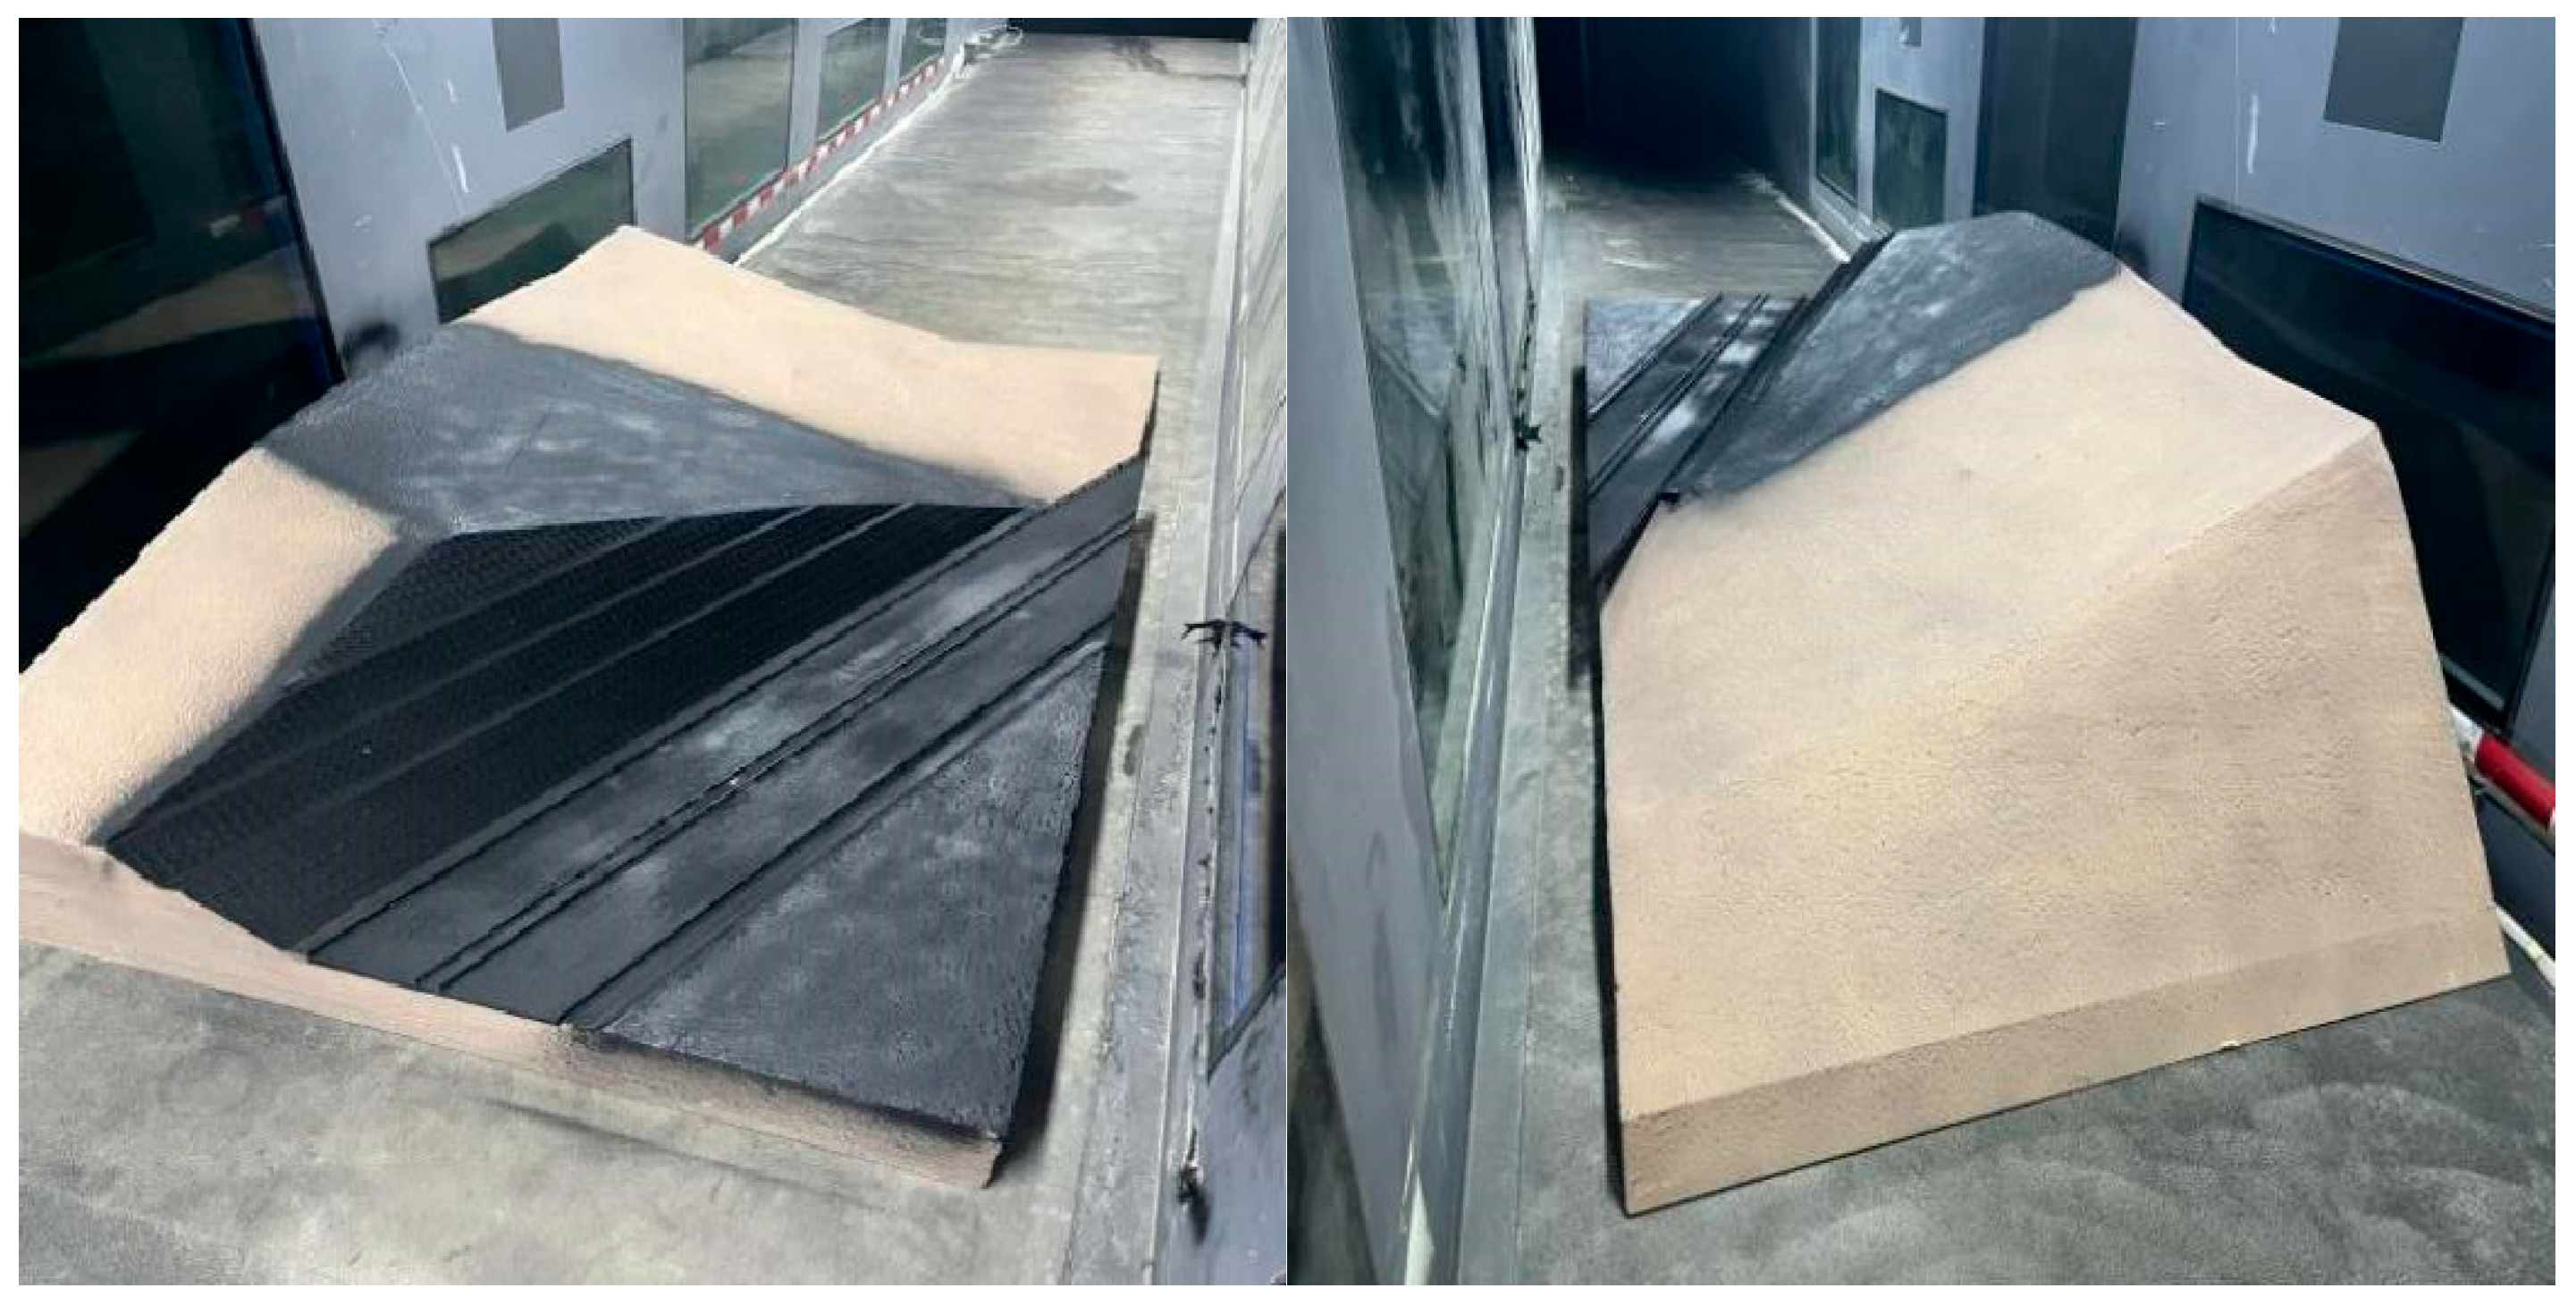
The fabrication of the physical model constitutes a critical component of the experimental methodology. This study utilized additive manufacturing techniques (3D printing) to achieve a high-fidelity replication of the authentic topography of the deep-cut valley section at K61+980 of the G577 highway. Guided by the geometric constraints of the wind tunnel and strict similarity principles, a geometric scaling ratio of 1:100 was selected to accommodate the actual cutting depth of 34.11 m. This specific ratio falls within the optimal experimental interval (1:50–1:200), ensuring that the simulation radius exceeds ten times the cutting depth [17], thereby balancing the requirements of flow field fidelity and observational clarity.
The experimental model assembly incorporates a designated study area and an upstream transition section. The transition section employs a sloped geometric design to effectively rectify the incident airflow and mitigate boundary layer turbulence. To ensure aerodynamic continuity and minimize experimental errors, the transition zone and the mountain terrain were integrally molded as a monolithic structure.
A semi-cutting geometric configuration was employed, characterized by a prototype road width of 26 m and an internal slope ratio of 1:0.75. Systematic experimental trials were conducted across a defined range of cutting depths, encompassing 10, 15, 20, 25, and 30 m. Furthermore, a specific roughness was applied to the road and slope surfaces, enabling high-fidelity simulation of the in situ wind–snow environment. Furthermore, the surfaces of the roadbed and slopes in the 3D-printed model were treated with a matte black anti-reflective coating. This specialized treatment is essential for PIV data acquisition to suppress intense laser reflections from the model surface, thereby protecting the high-speed camera lens and preventing sensor saturation to ensure the accuracy of near-wall velocity measurements. The detailed structural configuration of the model is illustrated in Figure 5.
Figure 5.
Scaled wind tunnel model of the mountainous road cutting.
Reference [18] conducted comparative experiments on terrain models characterized by blockage ratios of 19.8%, 9.7%, and 4.95% at identical elevations. The results demonstrated that the relative error in wind velocity between models with blockage ratios of 19.8% and 9.7% remained below 3%, while the deviation between the 19.8% and 4.95% configurations was within 5%. These findings suggest that the permissible blockage ratio for wind tunnel tests involving terrain models can be appropriately increased. In the present study, the maximum model height is 60 cm, yielding a calculated blockage ratio of less than 20%; consequently, the associated relative error is deemed minimal and negligible.
3.4. Selection of Parameters for Snow Simulants
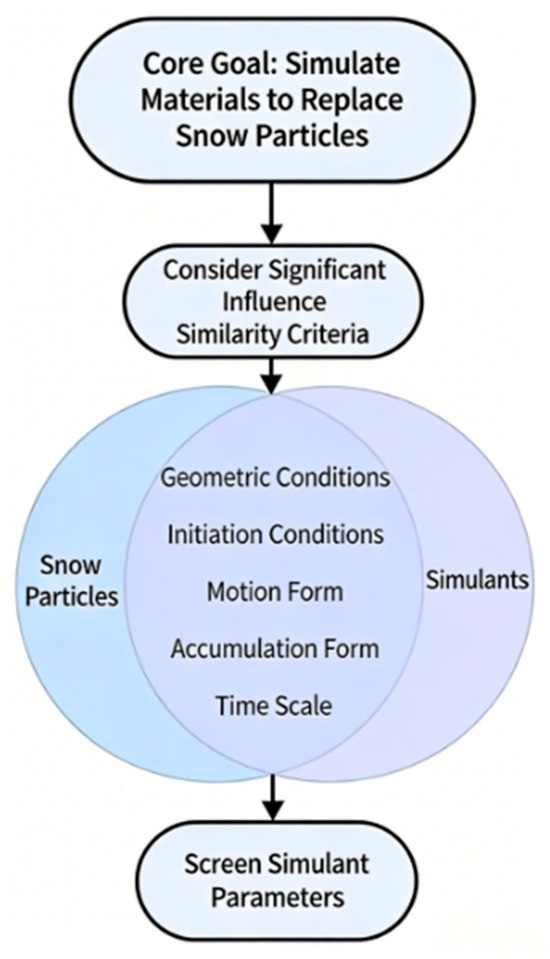
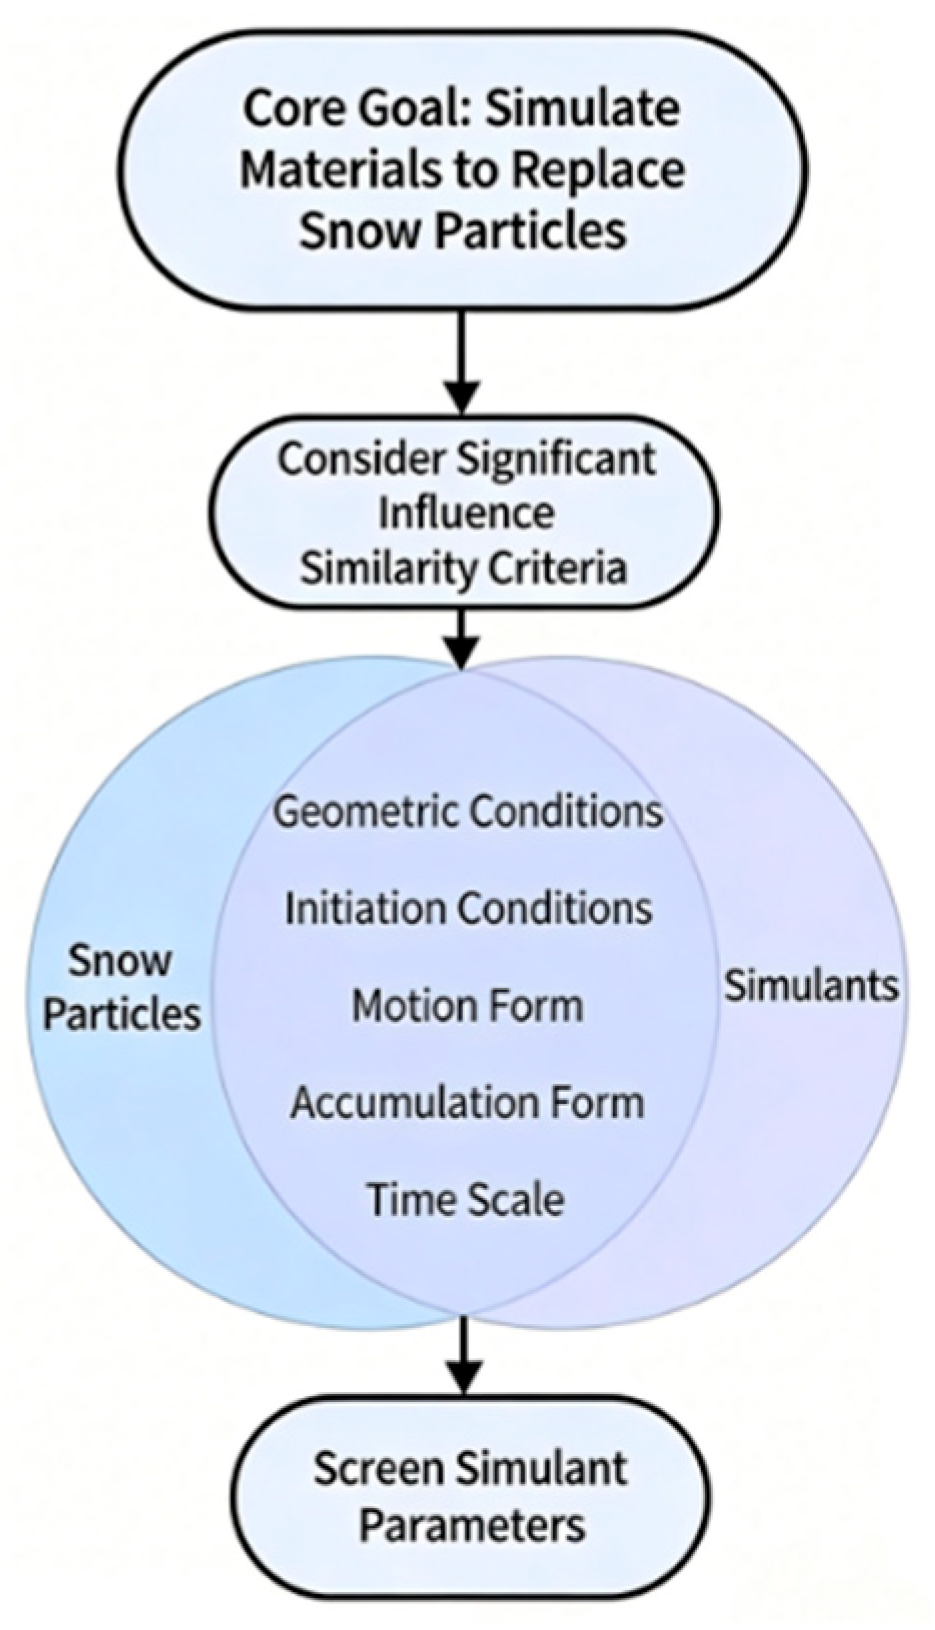
Given the inherent constraints of wind tunnel environments, snow simulants are necessarily employed as substitutes for natural snow particles; consequently, the selection of an appropriate simulant constitutes a fundamental prerequisite. The simulation of wind–snow flow is characterized as a complex gas–solid two-phase flow, involving a multitude of governing factors and similarity criteria that significantly surpass those of single-phase fluids. However, the simultaneous satisfaction of all similarity criteria within an experimental setting is practically unfeasible. Therefore, it is imperative to select a suitable simulant by prioritizing those criteria that exert a dominant influence on experimental outcomes, while relaxing non-essential conditions. This methodological approach ensures that the wind tunnel results exhibit distribution patterns consistent with natural wind-blown snow processes [10]. The systematic screening and selection process for snow particle simulants is illustrated in the flowchart in Figure 6.
Figure 6.
Flowchart for the screening and selection process of snow particle simulants.
Principal considerations for material selection prioritize geometric similarity, wherein simulants are dimensionally scaled (1:100) based on natural snow particles, which are idealized as spheres ranging from 0.05 to 2 mm in diameter. Although natural snow is characterized by inherent cohesion and a specific threshold friction velocity, strict adherence to geometric scaling would yield ultra-fine, dust-like particles that pose significant risks to experimental instrumentation. Consequently, particle size constraints were strategically relaxed to circumvent suspension-related issues and ensure experimental stability. Furthermore, the selected material must exhibit both kinematic and accumulation similarities to facilitate observable deposition patterns, while maintaining equivalence in mass and volumetric flux per unit time relative to the prototype [10].
Guided by a synthesis of these governing principles, the material selection process was predicated on a comprehensive evaluation of the angle of internal friction, particle size distribution, and bulk density. Based on a review of established literature, five common simulants—namely, aeolian sand, refined salt, silica sand, bran, and sawdust—were identified as potential candidates. To identify the optimal material for reproducing wind-blown snow effects, preliminary experimental trials were systematically conducted on these five simulants. This comparative analysis focused on their aerodynamic performance and deposition characteristics, enabling the determination of the most suitable candidate for the study. The specific physical properties of the evaluated materials are detailed in Table 1.
Table 1.
Physical properties of the simulants.
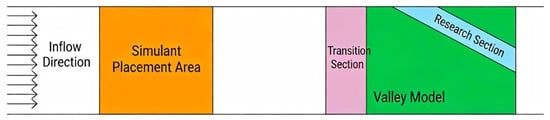
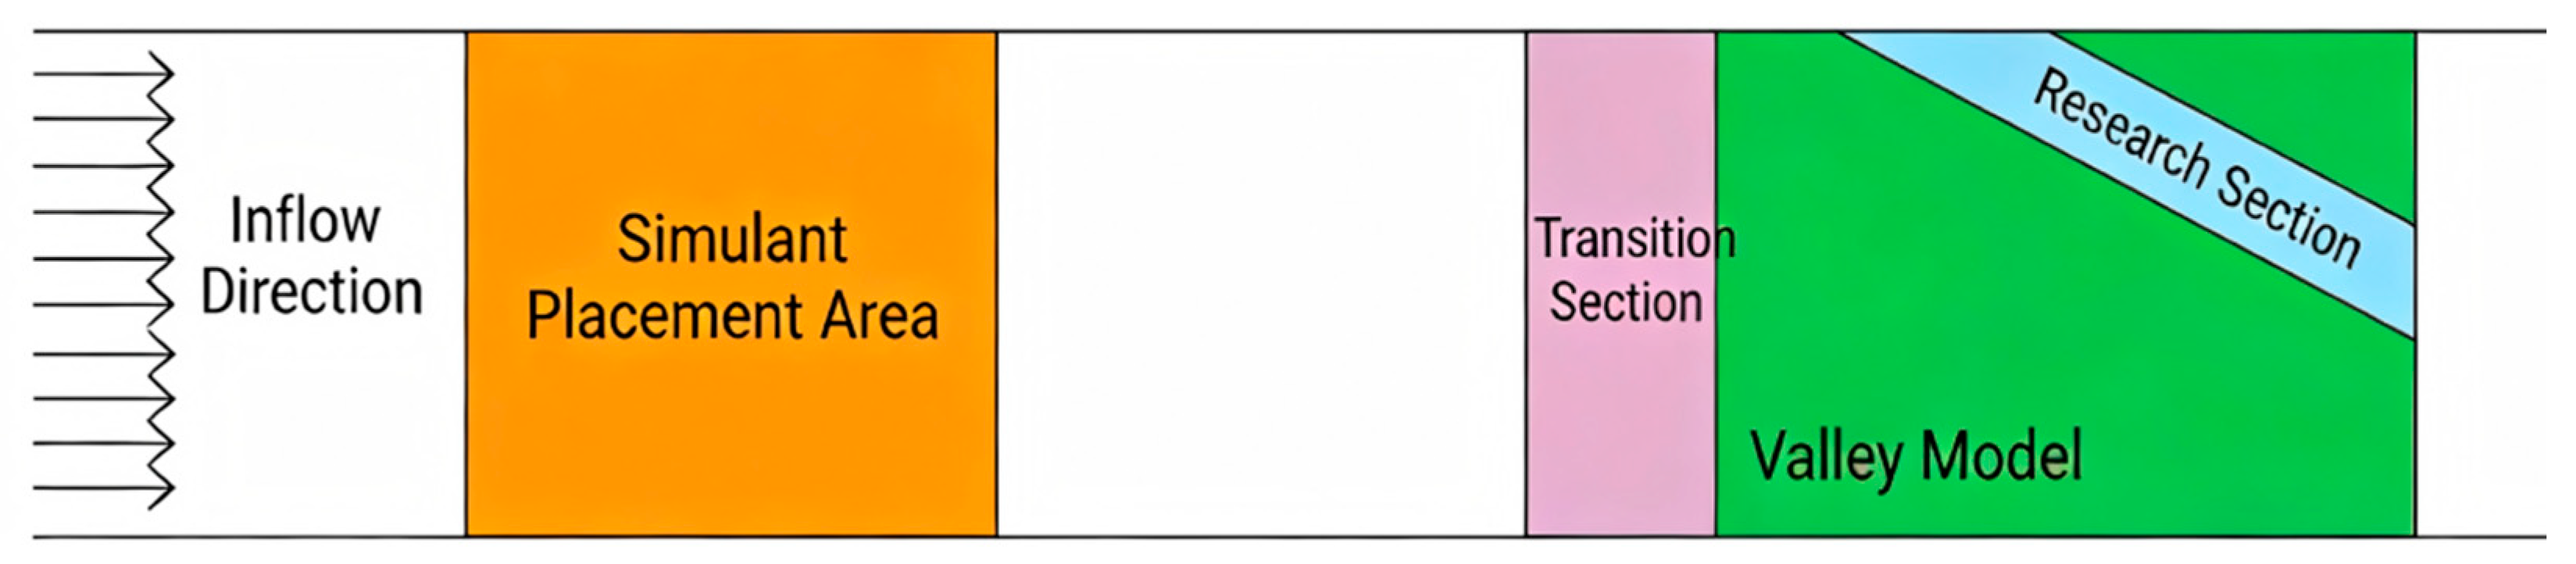
Comparative analysis reveals that both wheat bran and sawdust exhibit internal friction angles closely approximating that of natural snow; however, the bulk density of wheat bran demonstrates a significant deviation from the prototype snow particles. Concurrently, by synthesizing the simulant calculation methodology proposed by Ma et al. [19] with the results of preliminary wind tunnel trials, it was observed that the snow accumulation morphology of sawdust exhibits the strongest resemblance to that of natural snow. Consequently, sawdust was selected as the designated simulant for the wind tunnel experiments conducted in this study. The specific arrangement of the snow particle simulants is illustrated in the schematic diagram in Figure 7.
Figure 7.
Schematic diagram of the simulant layout.
3.5. Experimental Conditions
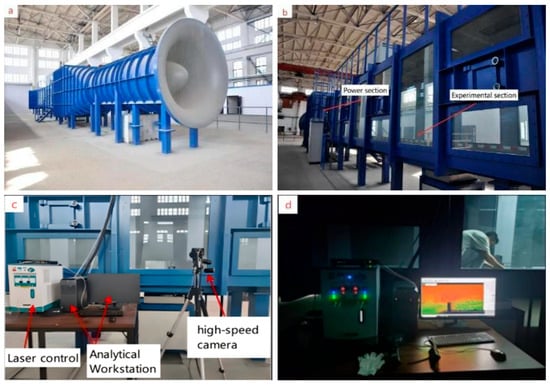
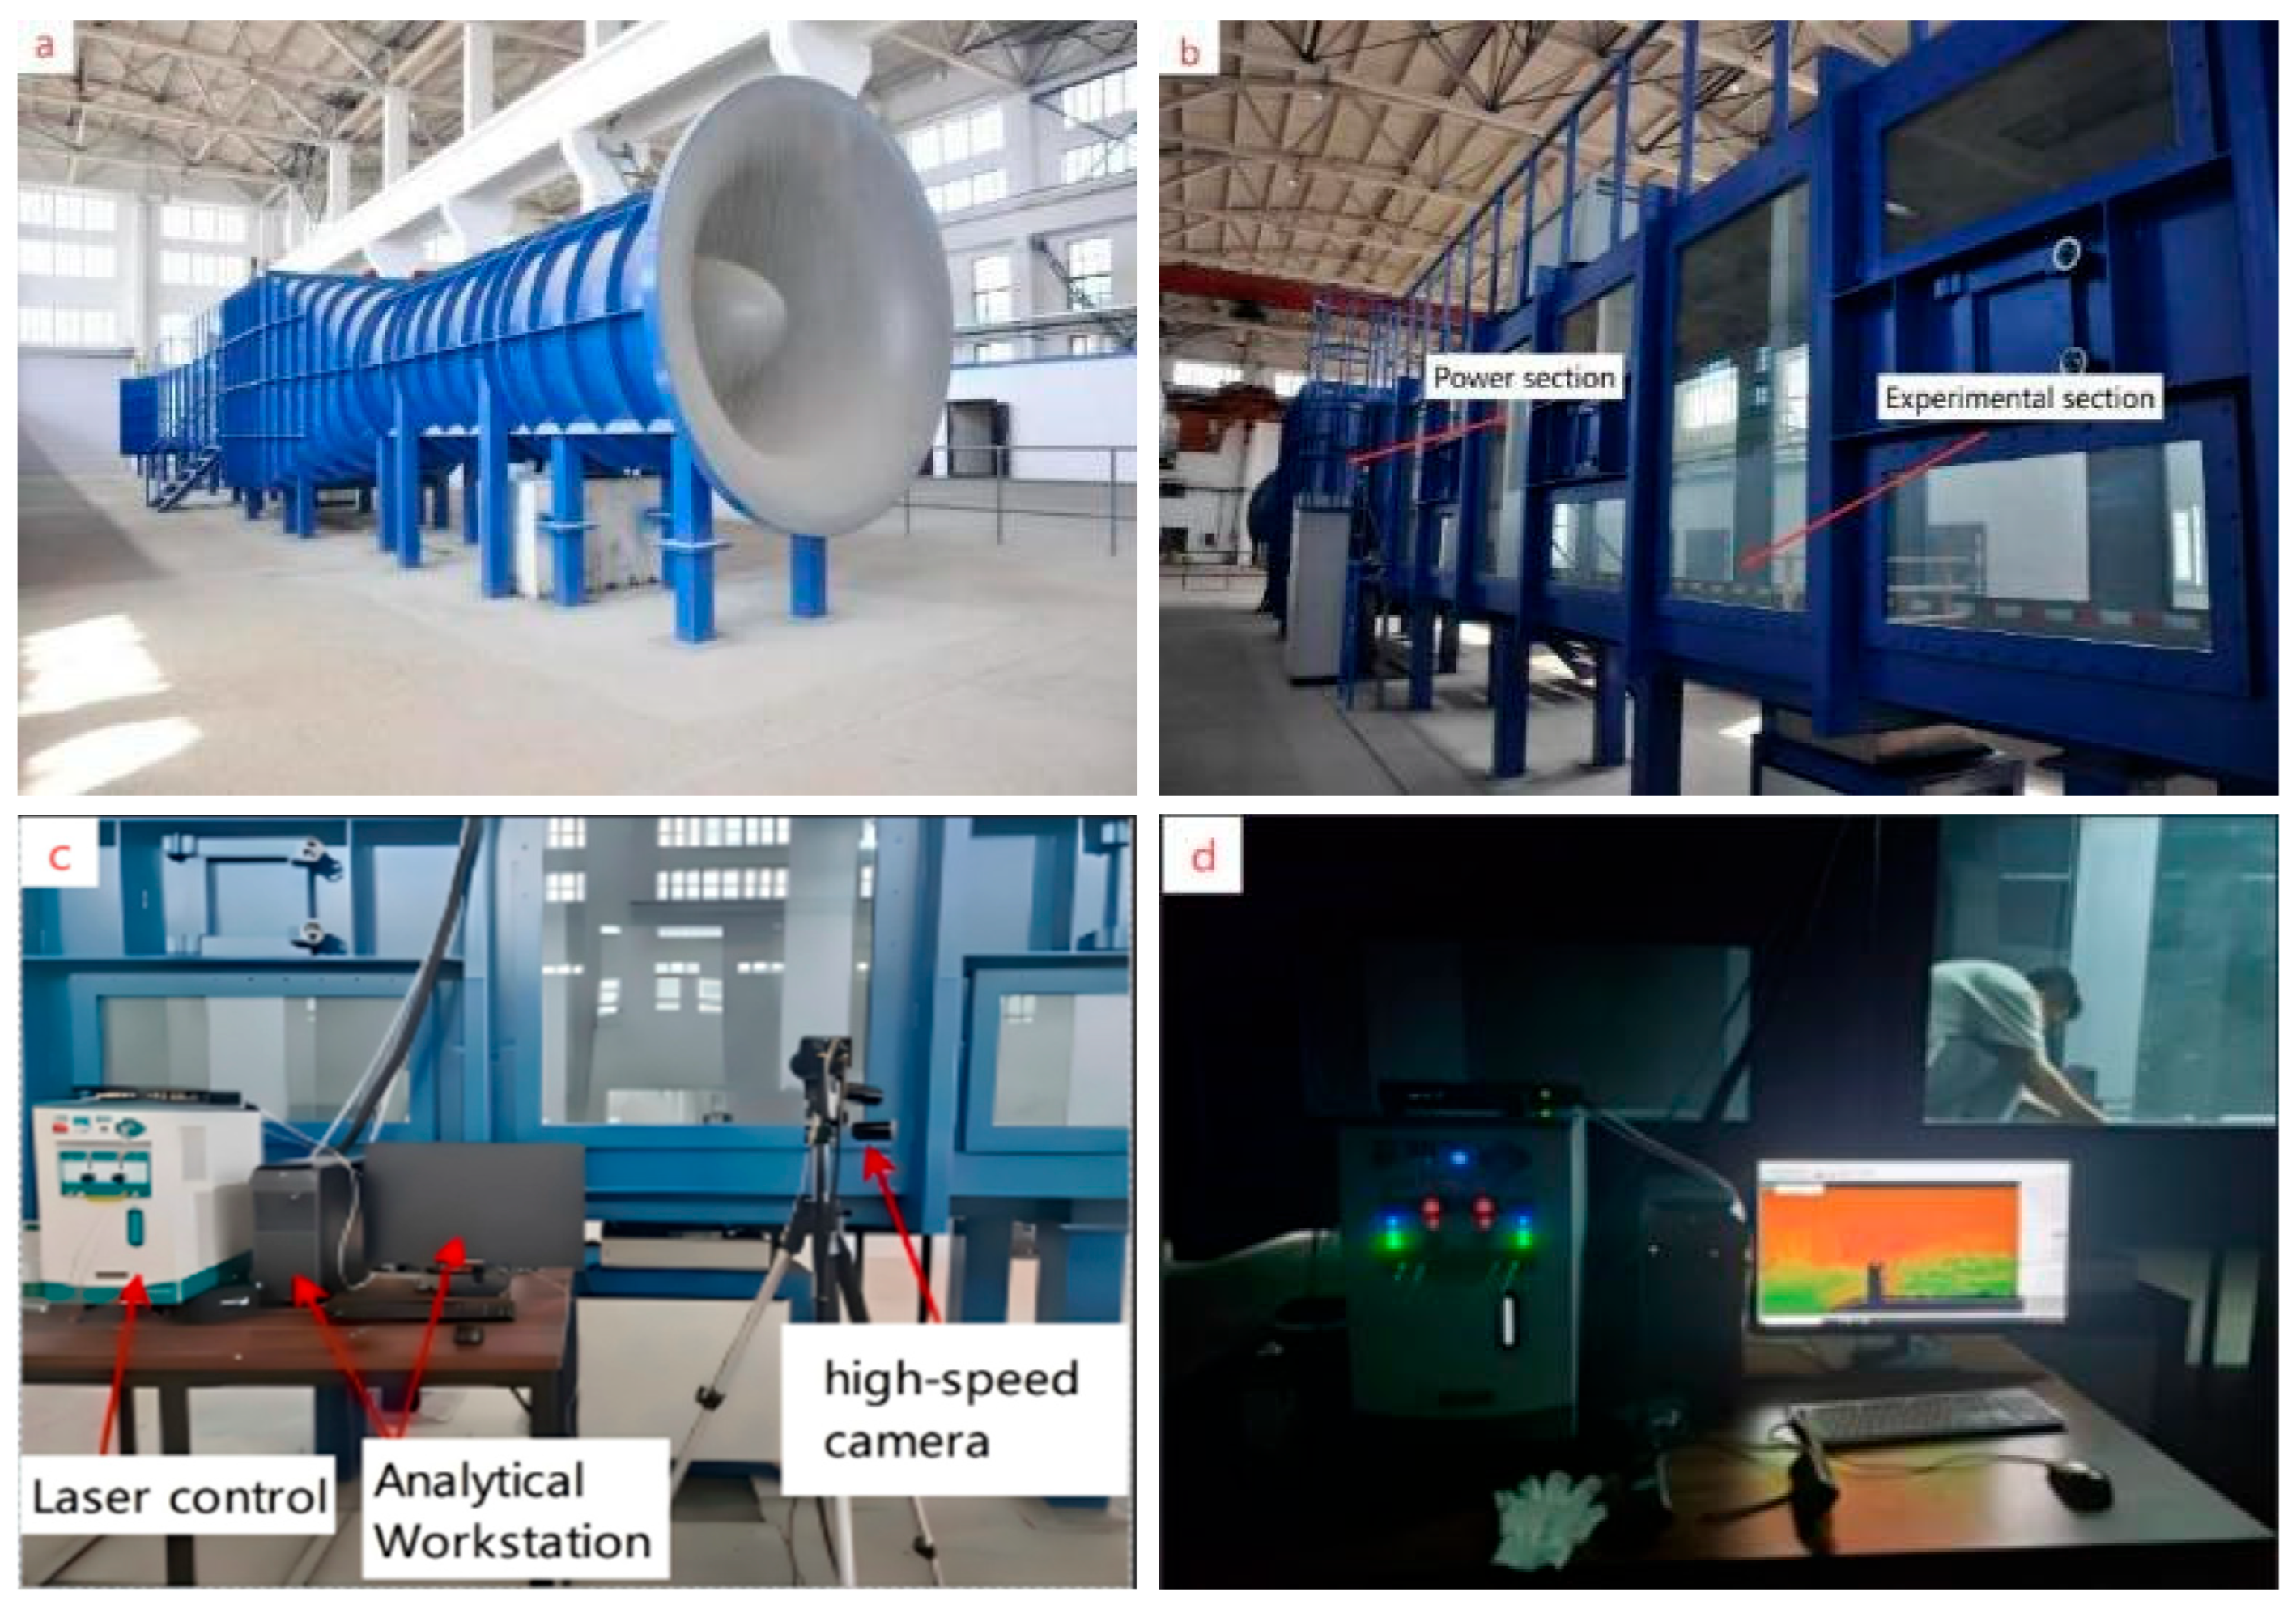
The experimental configuration and the internal facility layout are respectively illustrated in Figure 8a,b. The wind tunnel experiments were executed within the Wind-Sand-Snow Wind Tunnel Laboratory for Arid and Desert Regions. This facility utilizes a blow-down wind tunnel architecture, characterized by a continuously adjustable wind velocity ranging from 2 to 20 m/s. The tunnel extends a total length of 35 m and comprises distinct functional segments, including an intake section, rectification section, contraction section, primary test section, adjustable test section, and diffuser section. Specifically, the primary test section spans 12 m in length with a cross-sectional area of 1.5 m × 2 m. Rigorous evaluation by an independent third-party organization confirms that the flow field quality satisfies the stringent criteria required for a high-performance atmospheric boundary layer wind tunnel.
Figure 8.
Schematic diagram of the wind tunnel and PIV system.
The measurement instrumentation, comprising the PIV hardware arrangement and the control workstation, is illustrated in Figure 8c,d. A high-resolution 2D Particle Image Velocimetry (PIV) system, developed by Beijing MicroVec Co., Ltd., was utilized. As depicted in Figure 8c, the system incorporates a high-resolution CCD camera and a pulsed laser, while Figure 8d highlights the synchronization controller and the dedicated software suite for PIV image acquisition and analysis. Orchestrated by the synchronization controller, the pulsed laser and camera operate in precise synchronization to capture particle imagery, which is transmitted in real-time to a data storage workstation. Subsequently, the MicroVec analysis software processes the acquired digital images to derive a series of instantaneous full-field velocity vectors.
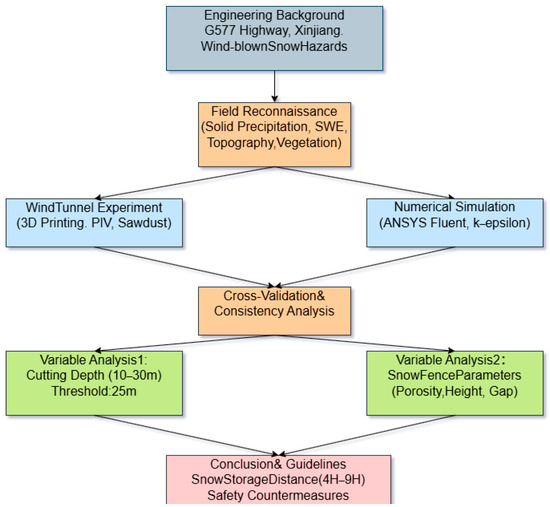
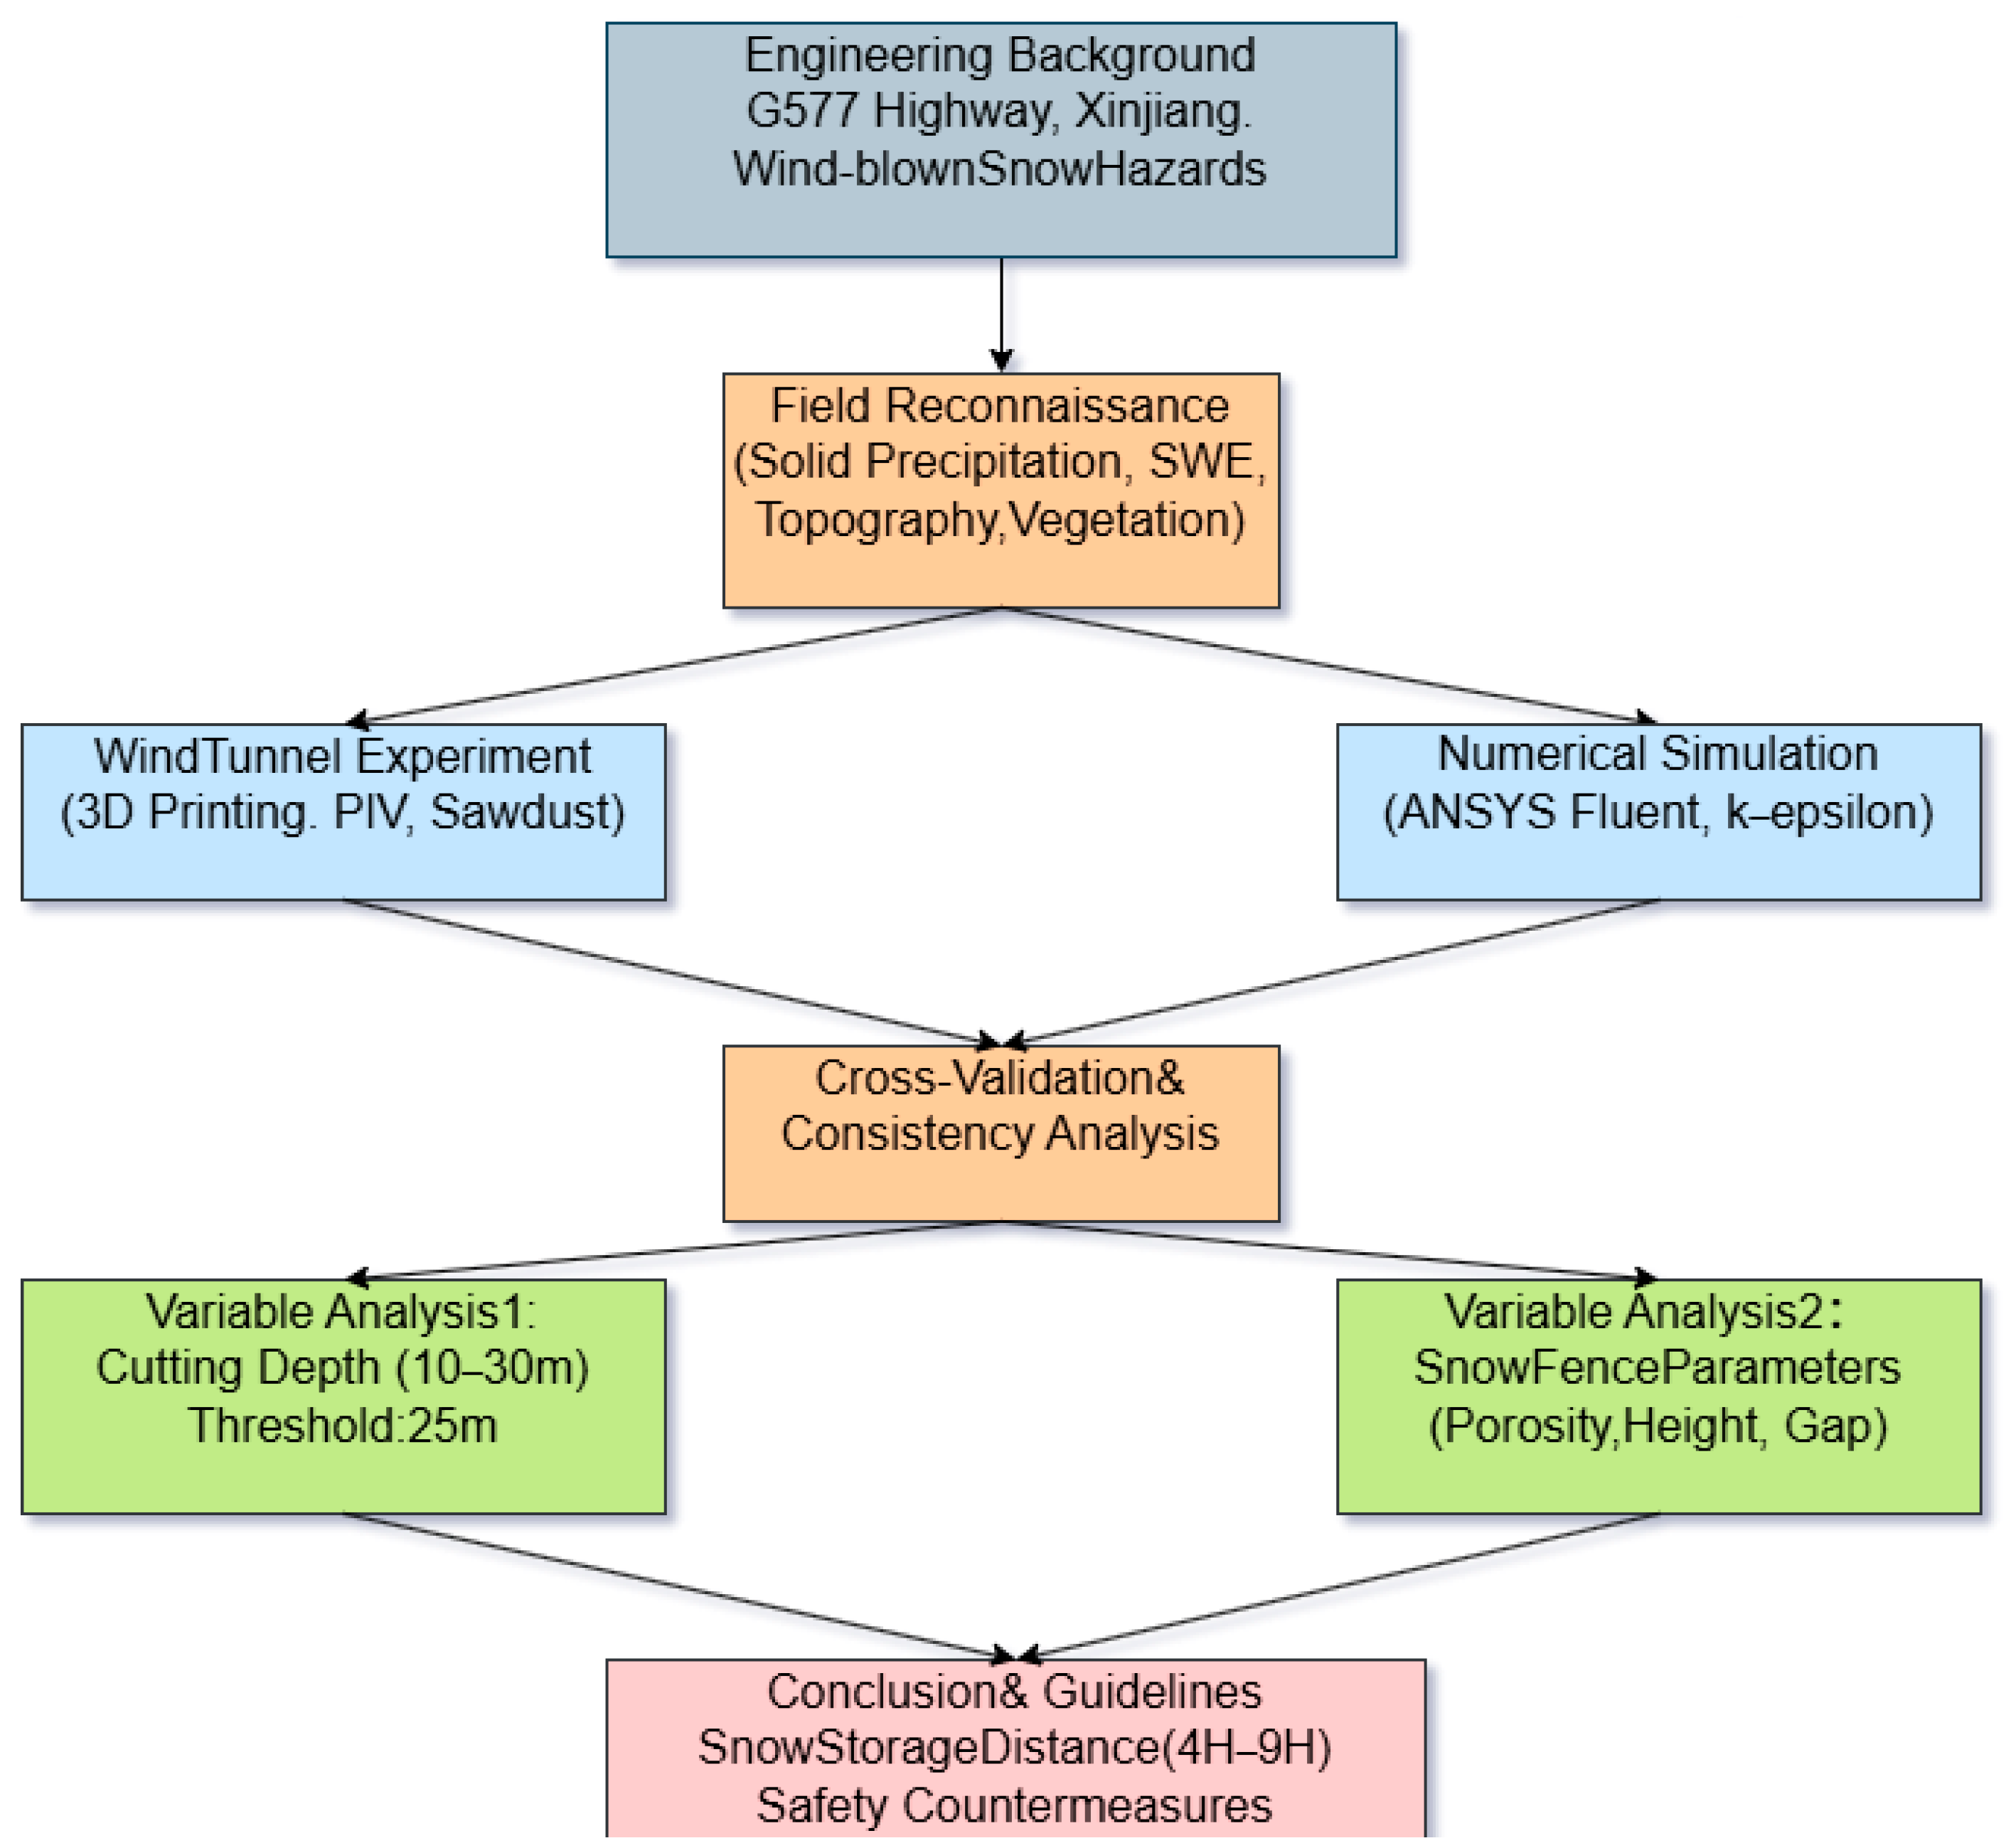
All procedures and approaches used for the purpose of this research are presented in the flowchart given in Figure 9.
Figure 9.
Technical roadmap and workflow diagram.
4. Relationship Between Wind-Blown Snow and Cutting Depth
4.1. Wind Velocity Profile and Distribution Analysis
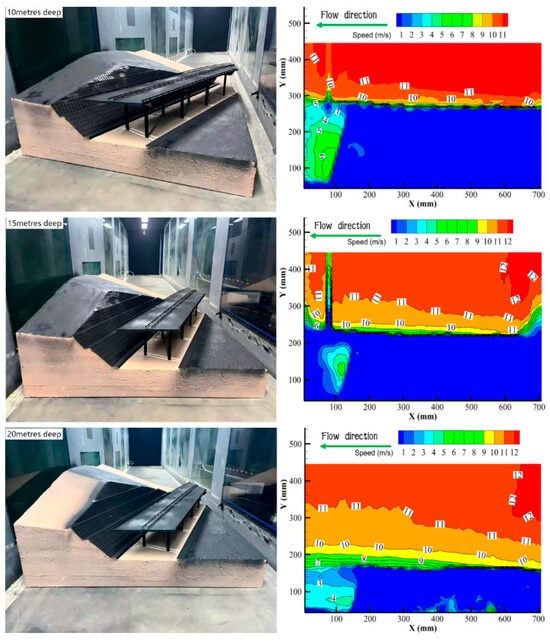
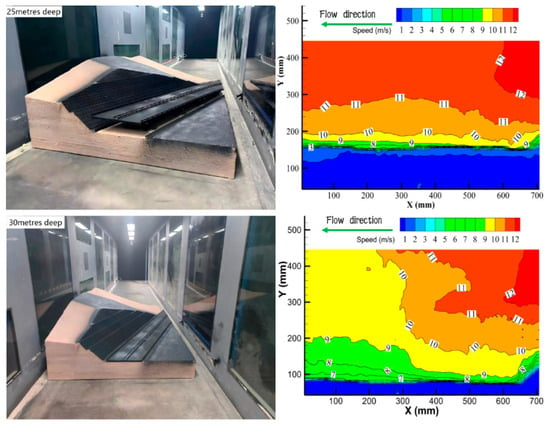
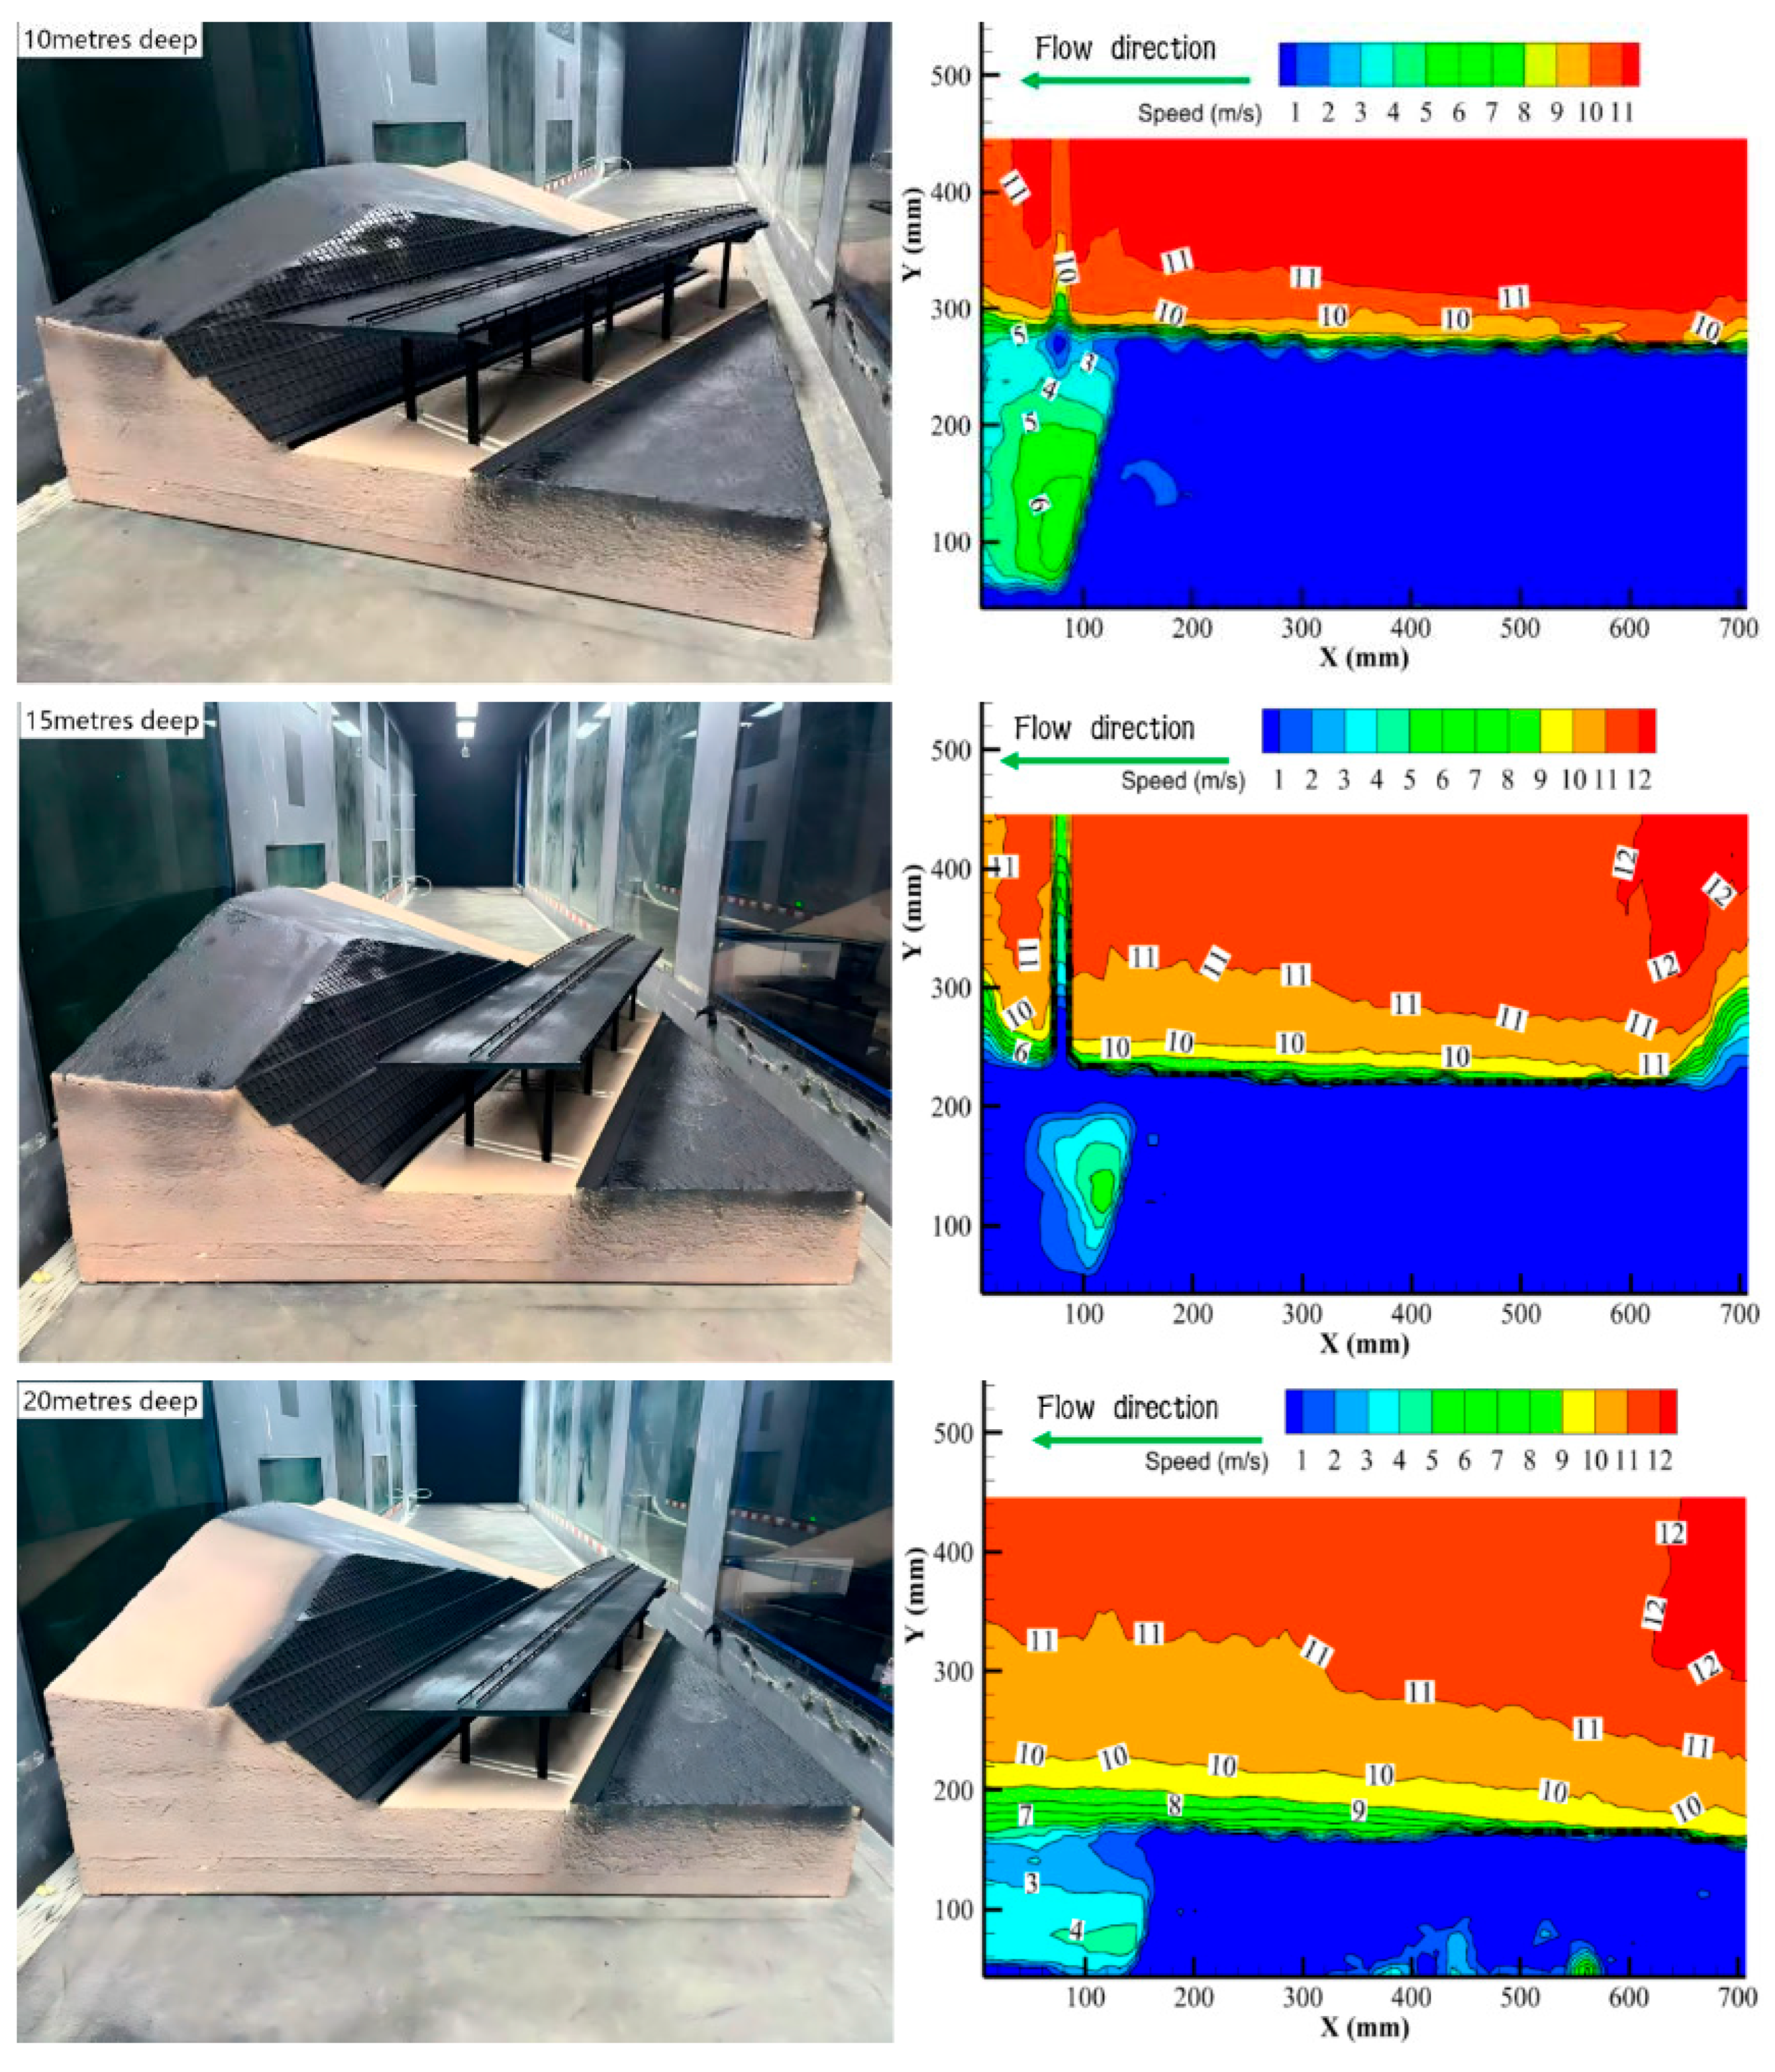
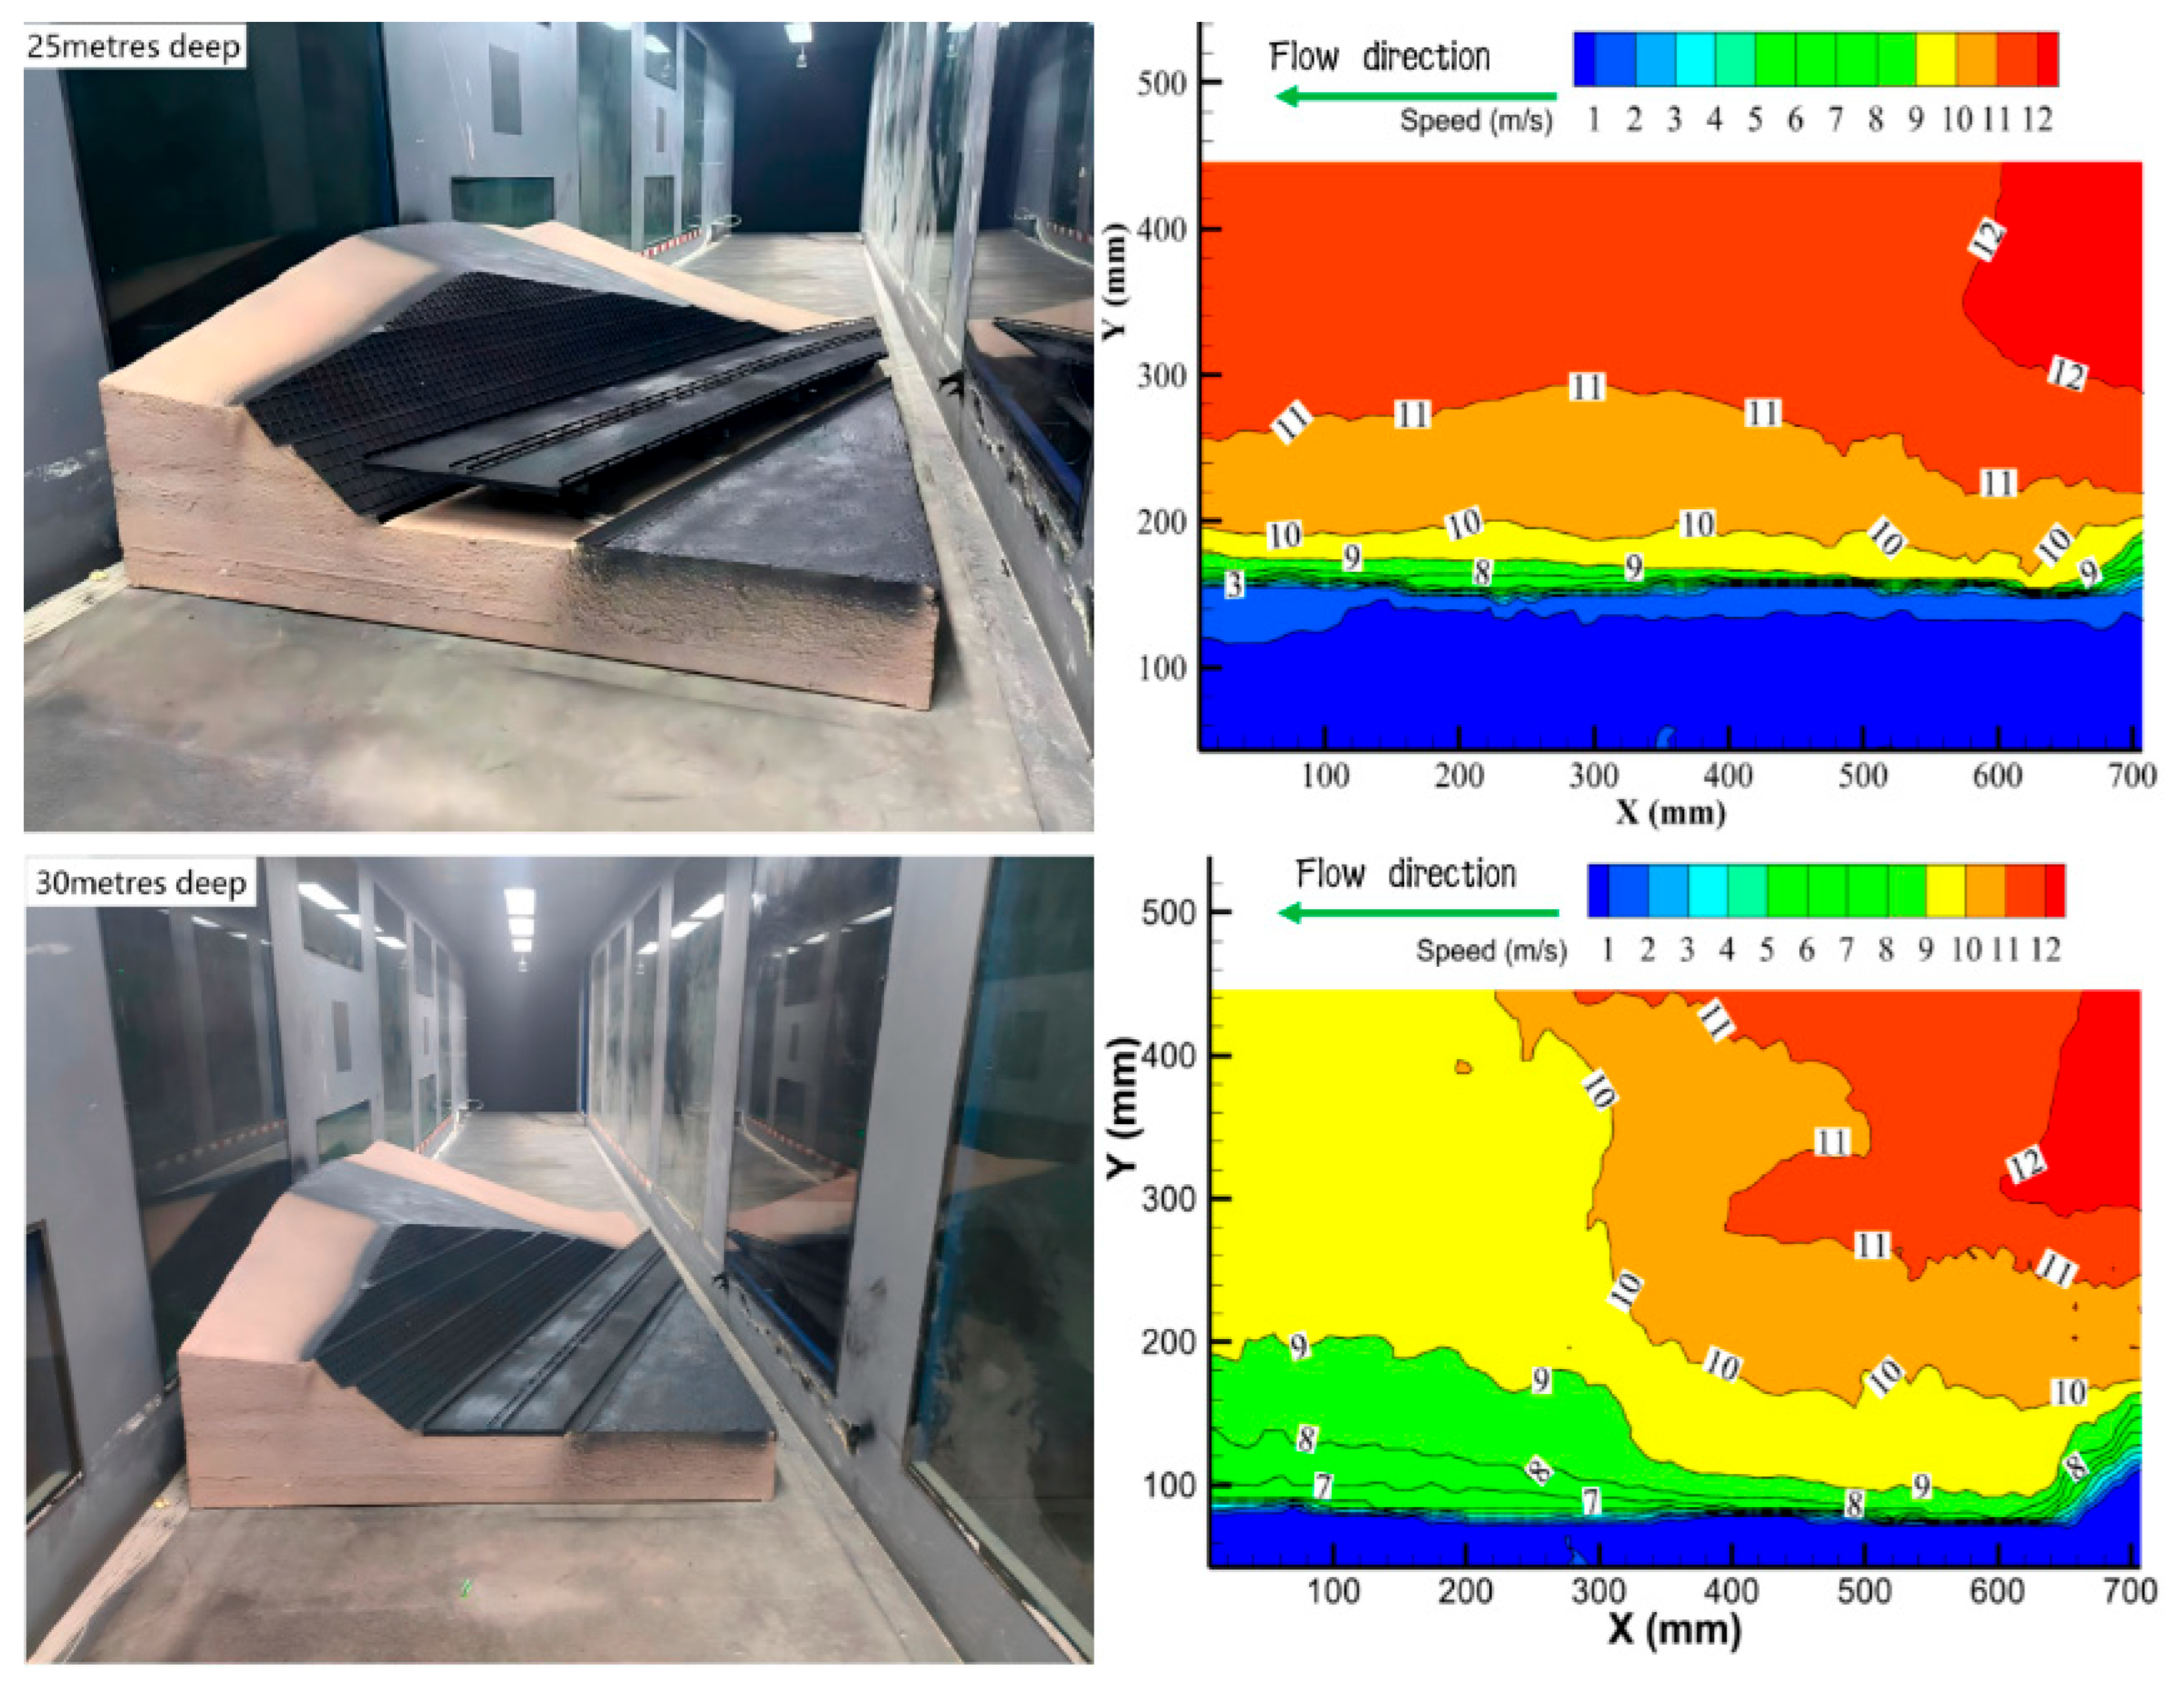
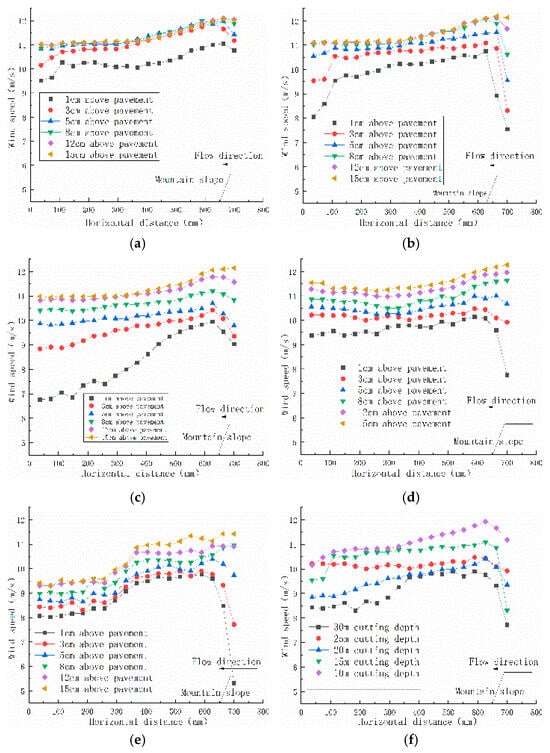
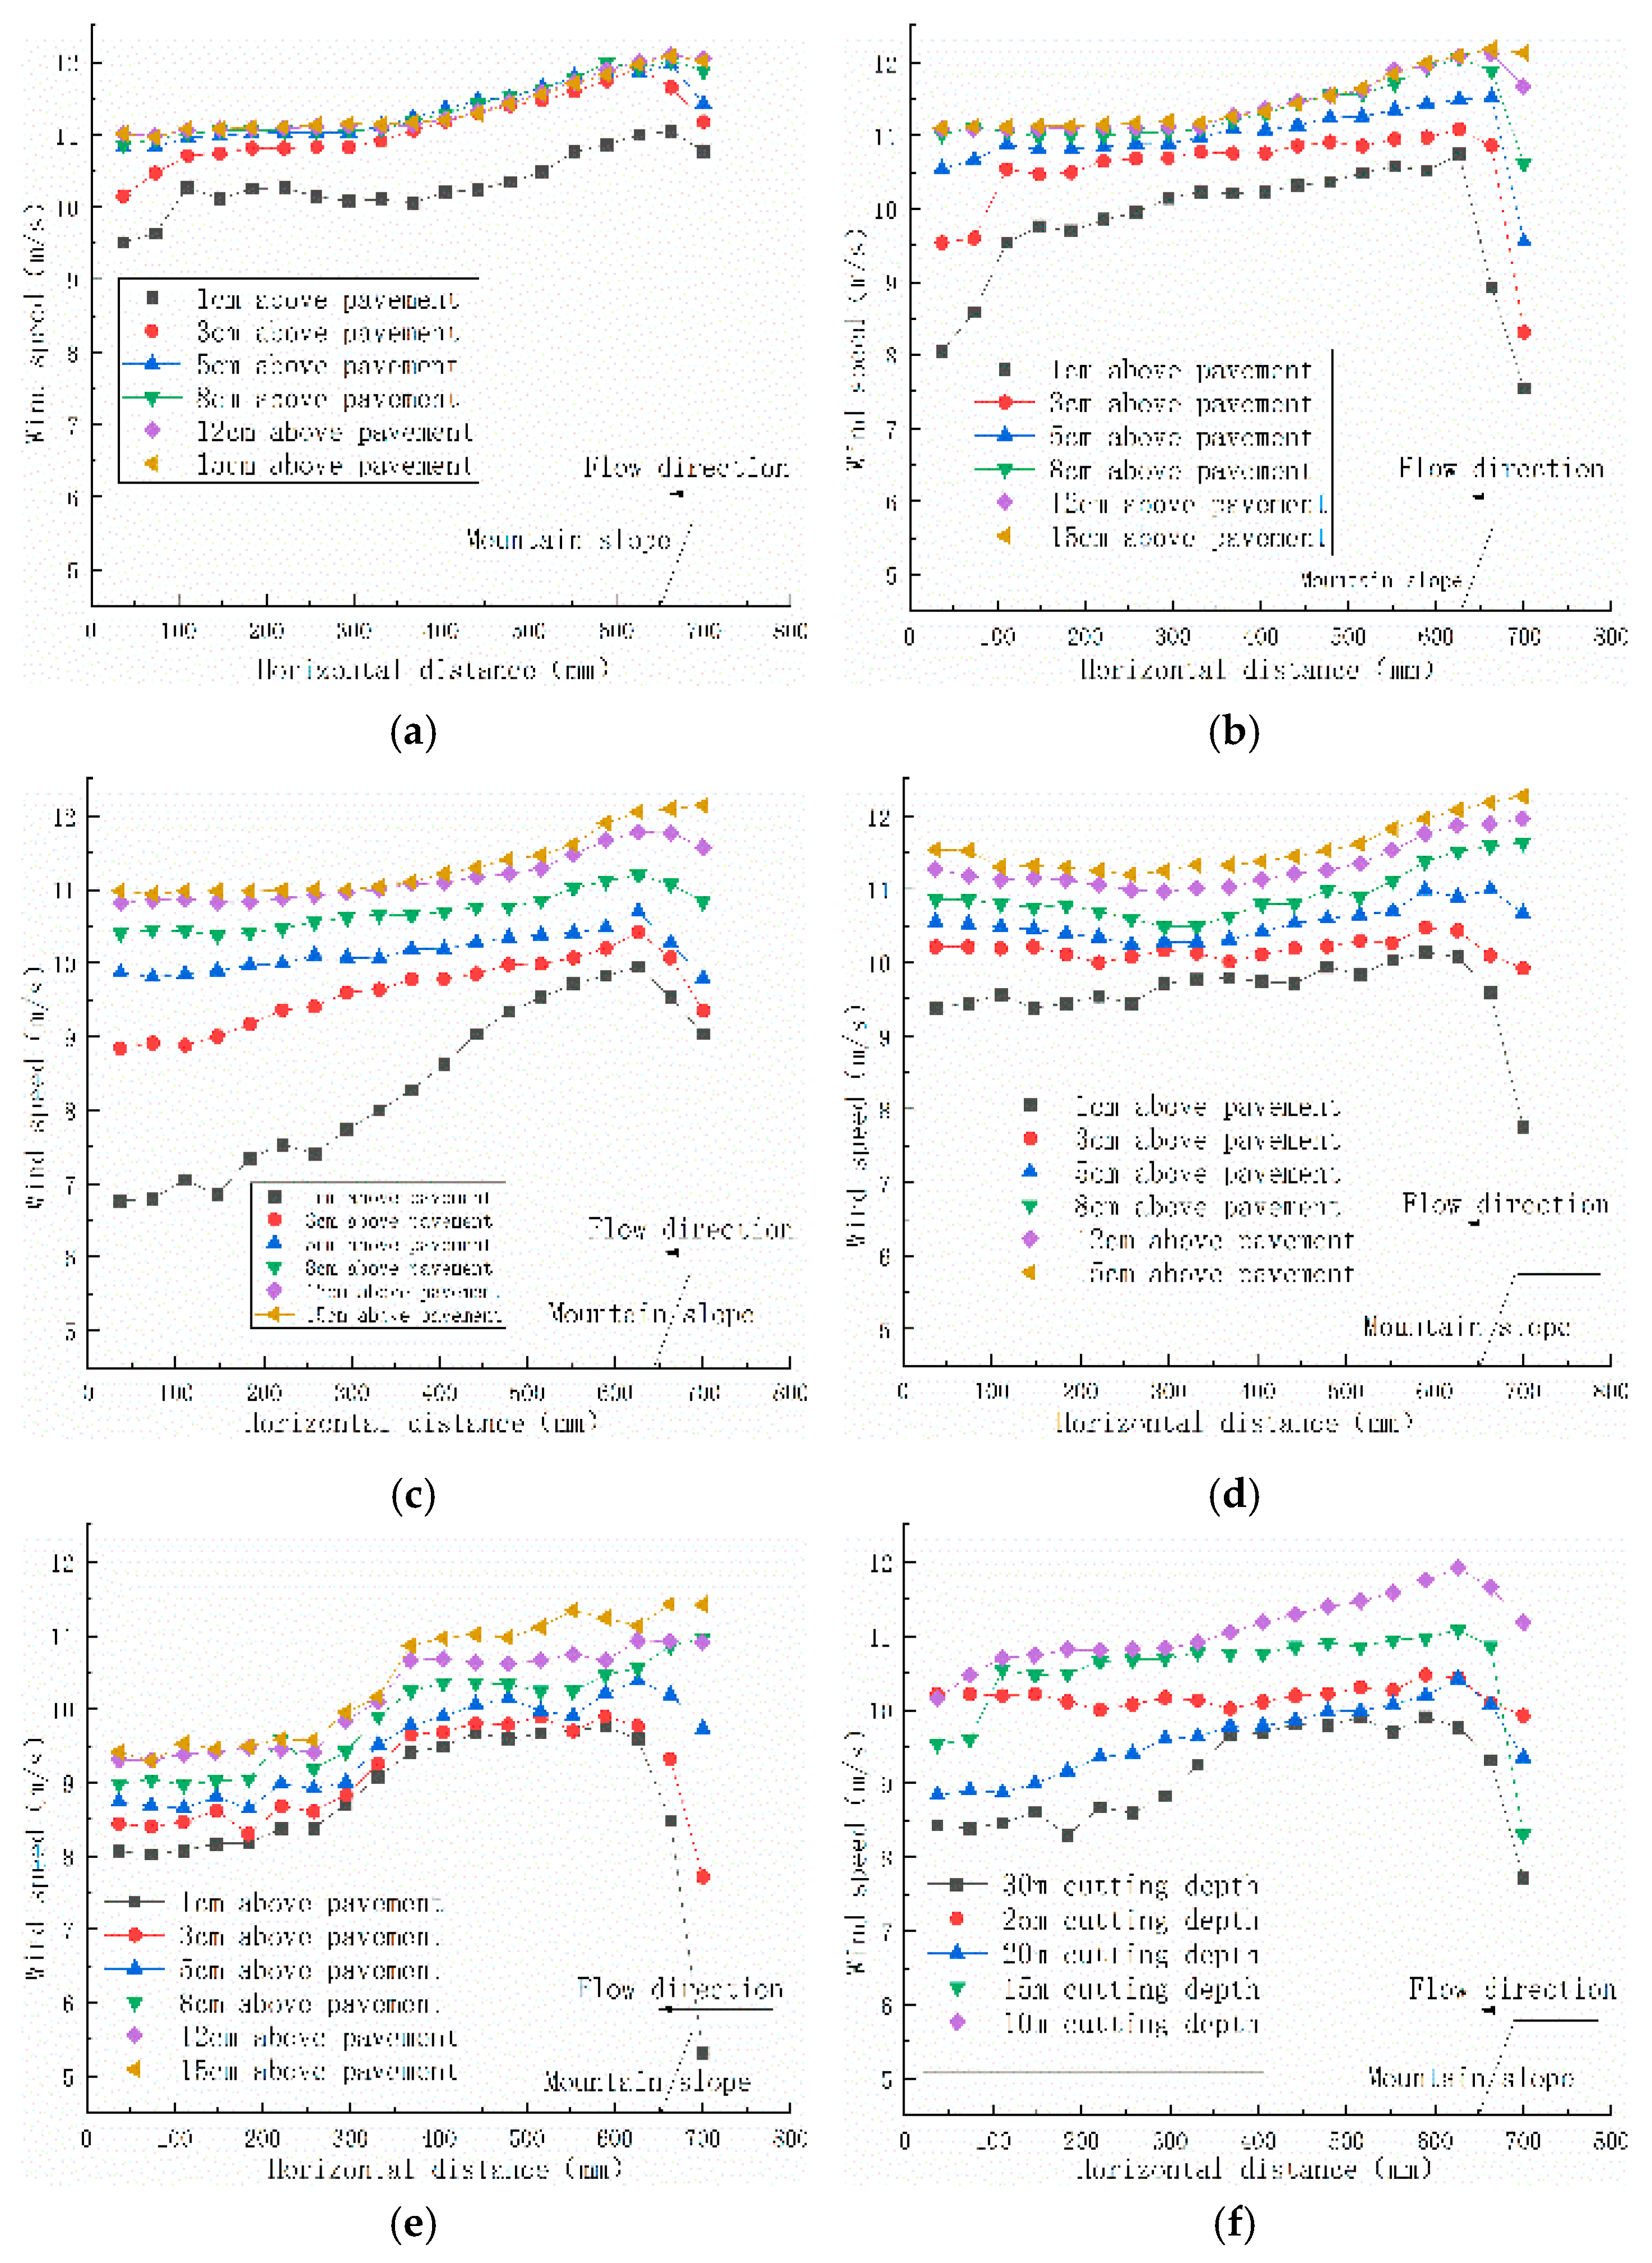
Wind velocity fields associated with road cutting models of varying depths were systematically investigated at a reference wind speed of 12 m/s. Horizontal wind speed profiles were extracted at distinct vertical heights relative to the entry slope of the cutting, as illustrated in Figure 10 and Figure 11. Specifically, the cross-section at K62+000, characterized by a depth of approximately 30 m, serves as a representative leeward semi-cutting configuration. Analysis of the data reveals that the evolutionary trends of the wind field exhibit a consistent pattern across varying cutting depths, with significant velocity attenuation predominantly confined to the region below a vertical height of 12 cm.
Figure 10.
Contours of wind speed at different cutting depths.
Figure 11.
Horizontal wind velocity profiles under varying cutting depths: (a) road cutting with a depth of 10 m; (b) road cutting with a depth of 15 m; (c) road cutting with a depth of 20 m; (d) road cutting with a depth of 25 m; (e) road cutting with a depth of 30 m; (f) wind speed values at an identical height across varying cutting depths.
The airflow dynamics exhibit distinct characteristics: upon approaching the mountain model, flow velocity undergoes a gradual reduction attributed to topographic obstruction, reaching a minimum magnitude at the toe of the transition slope. Ascending the windward slope, the velocity progressively accelerates, culminating in a peak value at the crest of the cutting slope. Quantitative analysis at a reference height of 3 cm reveals that the local velocity approximates 86.9% of the freestream velocity. Subsequently, a deceleration trend is observed as the airflow propagates beyond the crest. As the airflow traverses the road surface, the presence of guardrails induces flow deceleration at a defined distance upstream of the obstacles. These local aerodynamic obstructions, particularly roadside guardrails, significantly modulate snow particle deposition patterns as explored in recent design optimization studies [20]. This interaction further attenuates wind speed across the roadway, resulting in the formation of a deceleration zone that facilitates snow deposition adjacent to the guardrails and in the leeward direction. Upon completely traversing the cutting, both the magnitude and direction of the wind vector gradually recover. With increasing cutting depth, the spatial extent of the deceleration zone within the cutting expands, consequently intensifying snow accumulation around the central guardrails and propagating towards the leeward side. At a cutting depth of 30 m, wind speed attenuation is most pronounced; the deceleration zone attains its maximum extent, thereby resulting in the most severe snow accumulation.
4.2. Analysis of Snow Accumulation Distribution
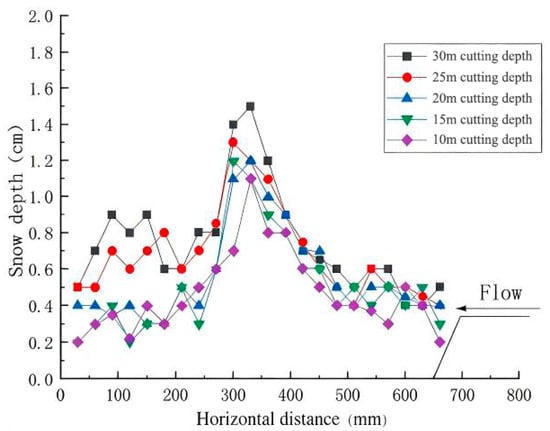
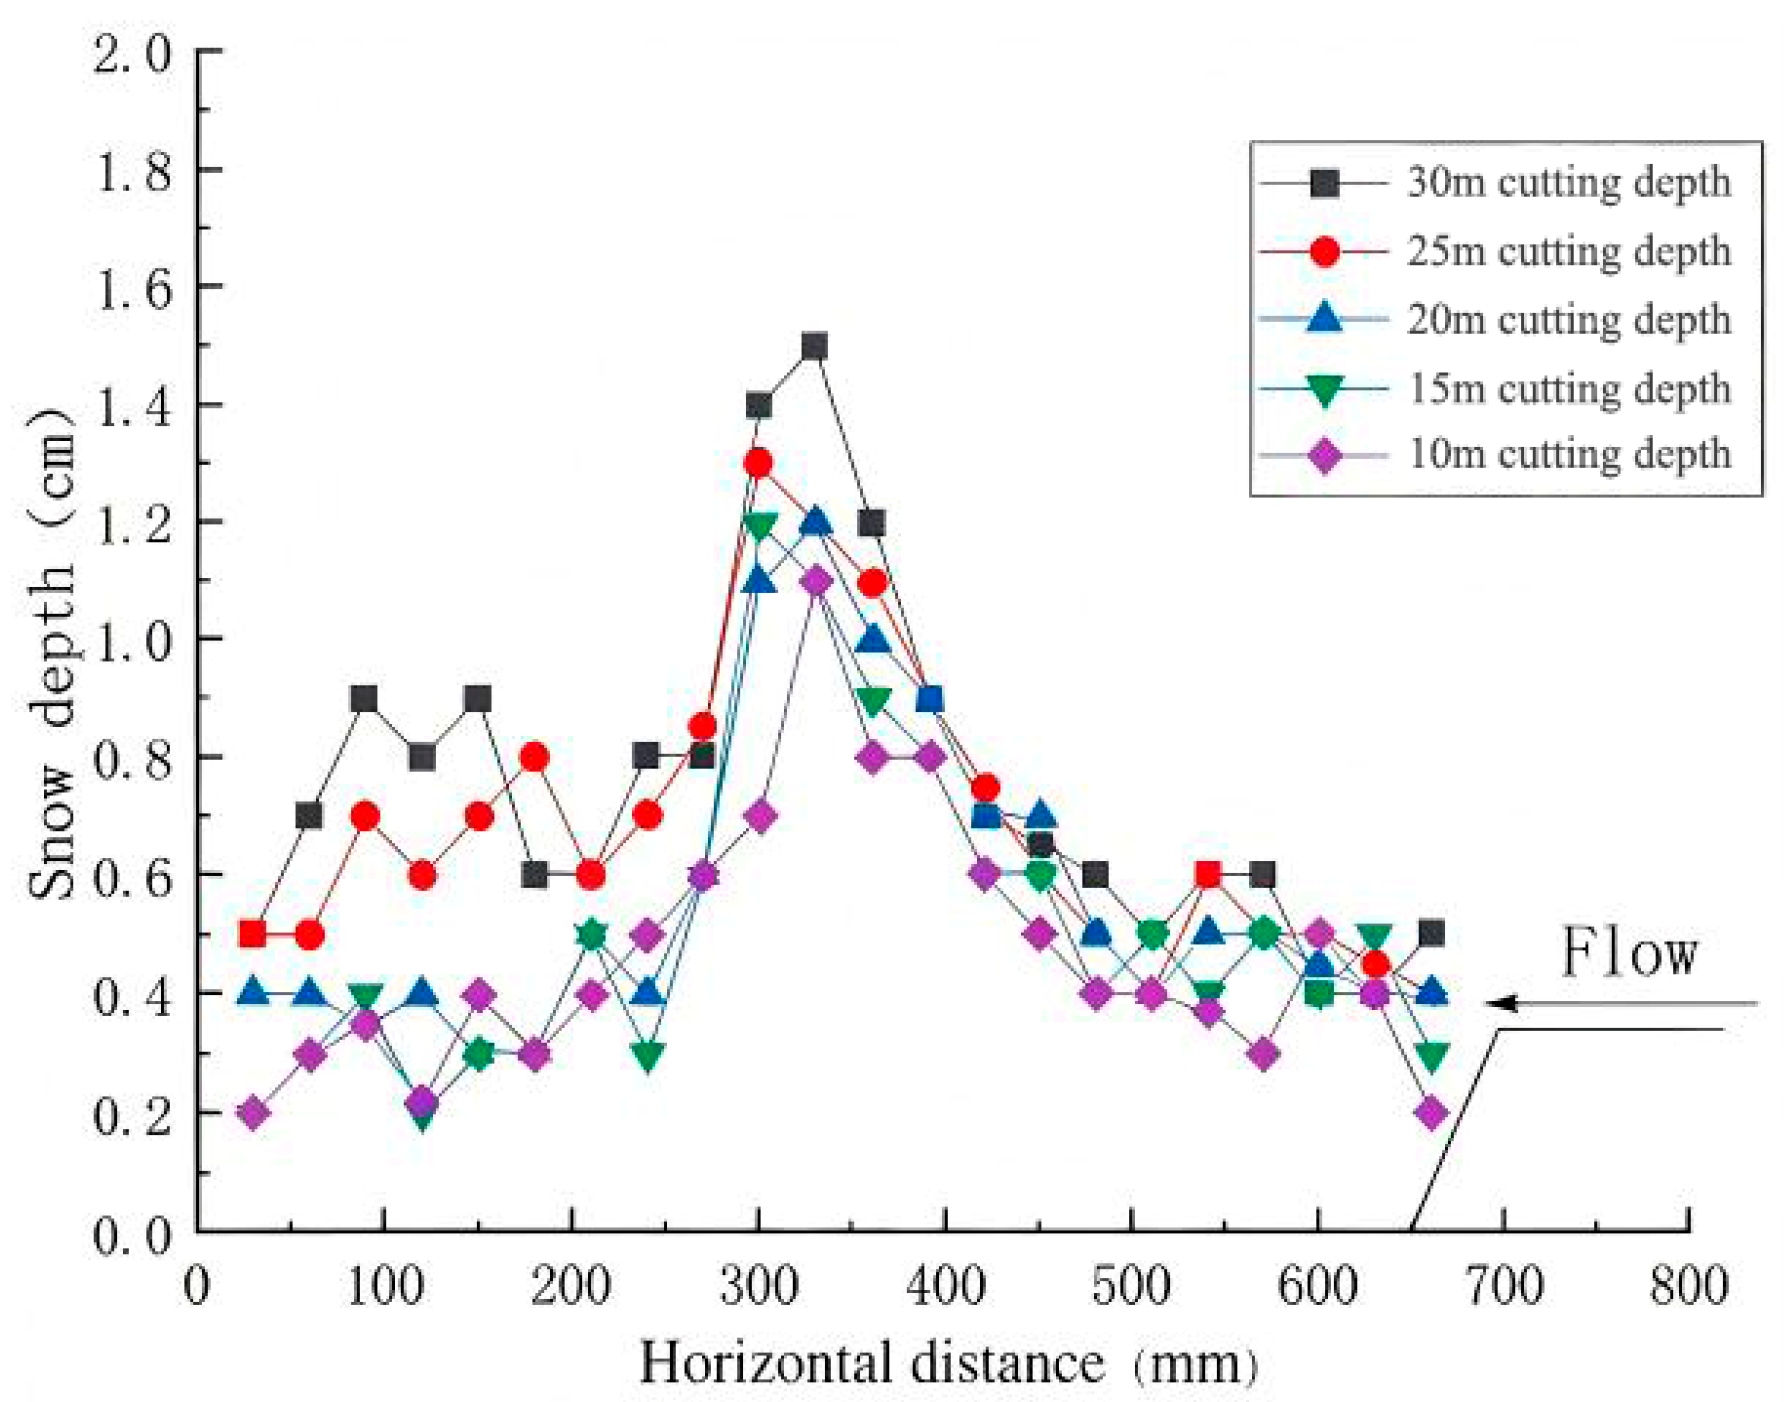
The snow distribution profiles derived from wind tunnel experiments across varying road cutting depths are illustrated in Figure 12. Boundary layer separation is induced at the slope crest, leading to a localized attenuation in wind velocity. Consequently, snow particles accumulate on the right side of the roadway and the snow platform, with the deposition zone gradually propagating toward the road centerline. Furthermore, attributable to the aerodynamic obstruction of the central guardrail, pronounced snow particle deposition is observed on both sides of the guardrail and within the immediate leeward region, attaining a maximum snow depth of 1.5 cm.
Figure 12.
Snow depth distribution profiles under varying cutting depths.
The total mass of accumulated snow collected from the five experimental configurations was quantified as 28.41 g, 37.20 g, 50.59 g, 69.82 g, and 126.37 g, respectively, exhibiting a monotonic increasing trend with depth. Notably, as the cutting depth increased from 25 m to 30 m, the snow accumulation on the roadbed demonstrated the most pronounced amplification, registering an increment of 81%. As illustrated in the figure, for cutting depths exceeding 25 m, snow accumulation intensifies significantly on the left side of the roadway. This phenomenon is attributed to the superposition effect of the macroscopic deceleration zone within the cutting and the localized flow retardation induced by the guardrail structures.
5. Numerical Model Development and Validation
5.1. Governing Equations
In this study, a gas–solid two-phase flow framework is adopted to simulate the complex dynamics of wind-blown snow. Within this numerical scheme, snow particles are idealized as cohesive spheres and treated as a continuous pseudo-fluid phase. Consequently, the Eulerian multiphase model is employed to govern the transport and dynamic behavior of the snow phase within the computational flow field.
5.1.1. Mass Conservation Equation (Continuity Equation)
The mass conservation equation postulates that the time rate of change in mass within a defined control volume is equivalent to the net mass inflow entering the volume over the corresponding time interval [21]. This fundamental principle is mathematically formulated in Equation (1).
In Equation (1), represents the volume fraction of phase ; denotes the physical density of phase ; and signifies the velocity vector associated with phase . The term characterizes the rate of mass transfer occurring from phase to phase , whereas corresponds to the mass transfer rate from phase to phase . Additionally, denotes the external mass source term for phase . Although this term defaults to zero in standard configurations, the framework allows for the specification of a constant or user-defined mass source for each individual phase. Analogous source terms are also incorporated into the momentum and enthalpy conservation equations.
5.1.2. Momentum Conservation Equation (Reynolds-Average Navier–Stokes Equation)
The momentum conservation equation states that the rate of change in fluid momentum within a fluid element is equal to the sum of all external forces acting on the element [22], as expressed in Equations (2) and (3).
where represents the momentum transfer rate from phase to phase ; and is the stress–strain tensor (or simply stress tensor) of phase q, which is expressed as
, , , , represent the additional force terms arising from multiphase flow dynamics.
To resolve the closure problem associated with Reynolds stresses, a turbulence model must be introduced. In this study, the standard model is adopted, which constitutes the most extensively utilized two-equation turbulence framework in engineering applications. The fundamental principle of this model involves solving the transport equations for turbulent kinetic energy (k) and the dissipation rate (). This methodology indirectly characterizes the mechanisms of turbulent energy transfer and dissipation, thereby providing a robust modeling basis for the determination of Reynolds stresses.
The transport equation for turbulent kinetic energy k is given by
where u′, v′, and w′ represent the fluctuating velocity components in the x, y, and z directions of the Cartesian coordinate system, respectively.
The transport equation for the dissipation rate is given by
where denotes the fluid density, which exhibits spatiotemporal variation; and represent the spatial coordinate components aligned with the flow and gravitational directions, respectively; and signifies the mean velocity component. The symbol characterizes the dynamic viscosity of the air; represents the generation of turbulent kinetic energy induced by mean velocity gradients; and denote the turbulent Prandtl numbers governing the diffusion within the transport equations. Furthermore, and constitute the model constants for the generation and dissipation terms, typically assigned values of 1.44 and 1.92, respectively. This methodological framework is capable of accurately capturing high-resolution flow field variations within small-scale regions [23,24].
Consequently, the expression for the dissipation rate () can be derived as
where represents an empirical constant typically assigned a value of 0.09 within the standard model framework. Additionally, and denote the turbulent kinetic energy and the turbulent length scale, respectively.
Numerical simulation methodologies for turbulence are principally categorized according to the resolution of turbulent scales into three distinct paradigms: Direct Numerical Simulation (DNS), Reynolds-Averaged Navier–Stokes (RANS) simulation, and Large Eddy Simulation (LES). These approaches demonstrate marked disparities regarding computational fidelity, computational cost, and domain applicability, thereby accommodating a comprehensive spectrum of requirements extending from fundamental theoretical inquiry to practical engineering implementation.
Within the Reynolds-Averaged Navier–Stokes (RANS) framework, prominent methodologies encompass the model, the model, and the Reynolds Stress Model (RSM). Among these, the series constitutes the most extensively applied category, comprising the Standard, RNG, and Realizable variants. Notably, the Realizable model is distinguished by a variable formulation for turbulent viscosity (variable Cμ) and a modified transport equation for the dissipation rate (). These formulations effectively eliminate non-physical singularities and refine the characterization of turbulent energy transfer. By ensuring rigorous adherence to mathematical constraints—specifically Reynolds stress positivity and the Schwarz inequality—this model demonstrates superior predictive accuracy for complex flow regimes characterized by strong rotation and flow separation.
In light of these considerations, the Realizable turbulence model is adopted in this study to accurately characterize the complex aerodynamic flow field features. The robustness of similar CFD frameworks has also been verified in simulating snowdrift patterns within non-equilibrium flow fields around complex structures [25]. Complementarily, the Schiller-Naumann model is employed to quantify the inter-phase momentum exchange, specifically accounting for the drag force exerted by the continuous gas phase on the dispersed snow particles.
5.2. Computational Domain and Boundary Conditions
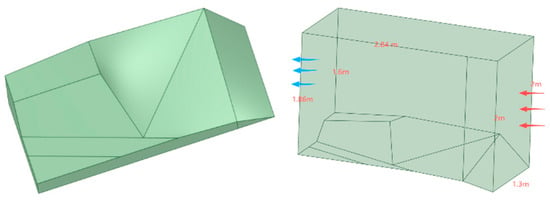
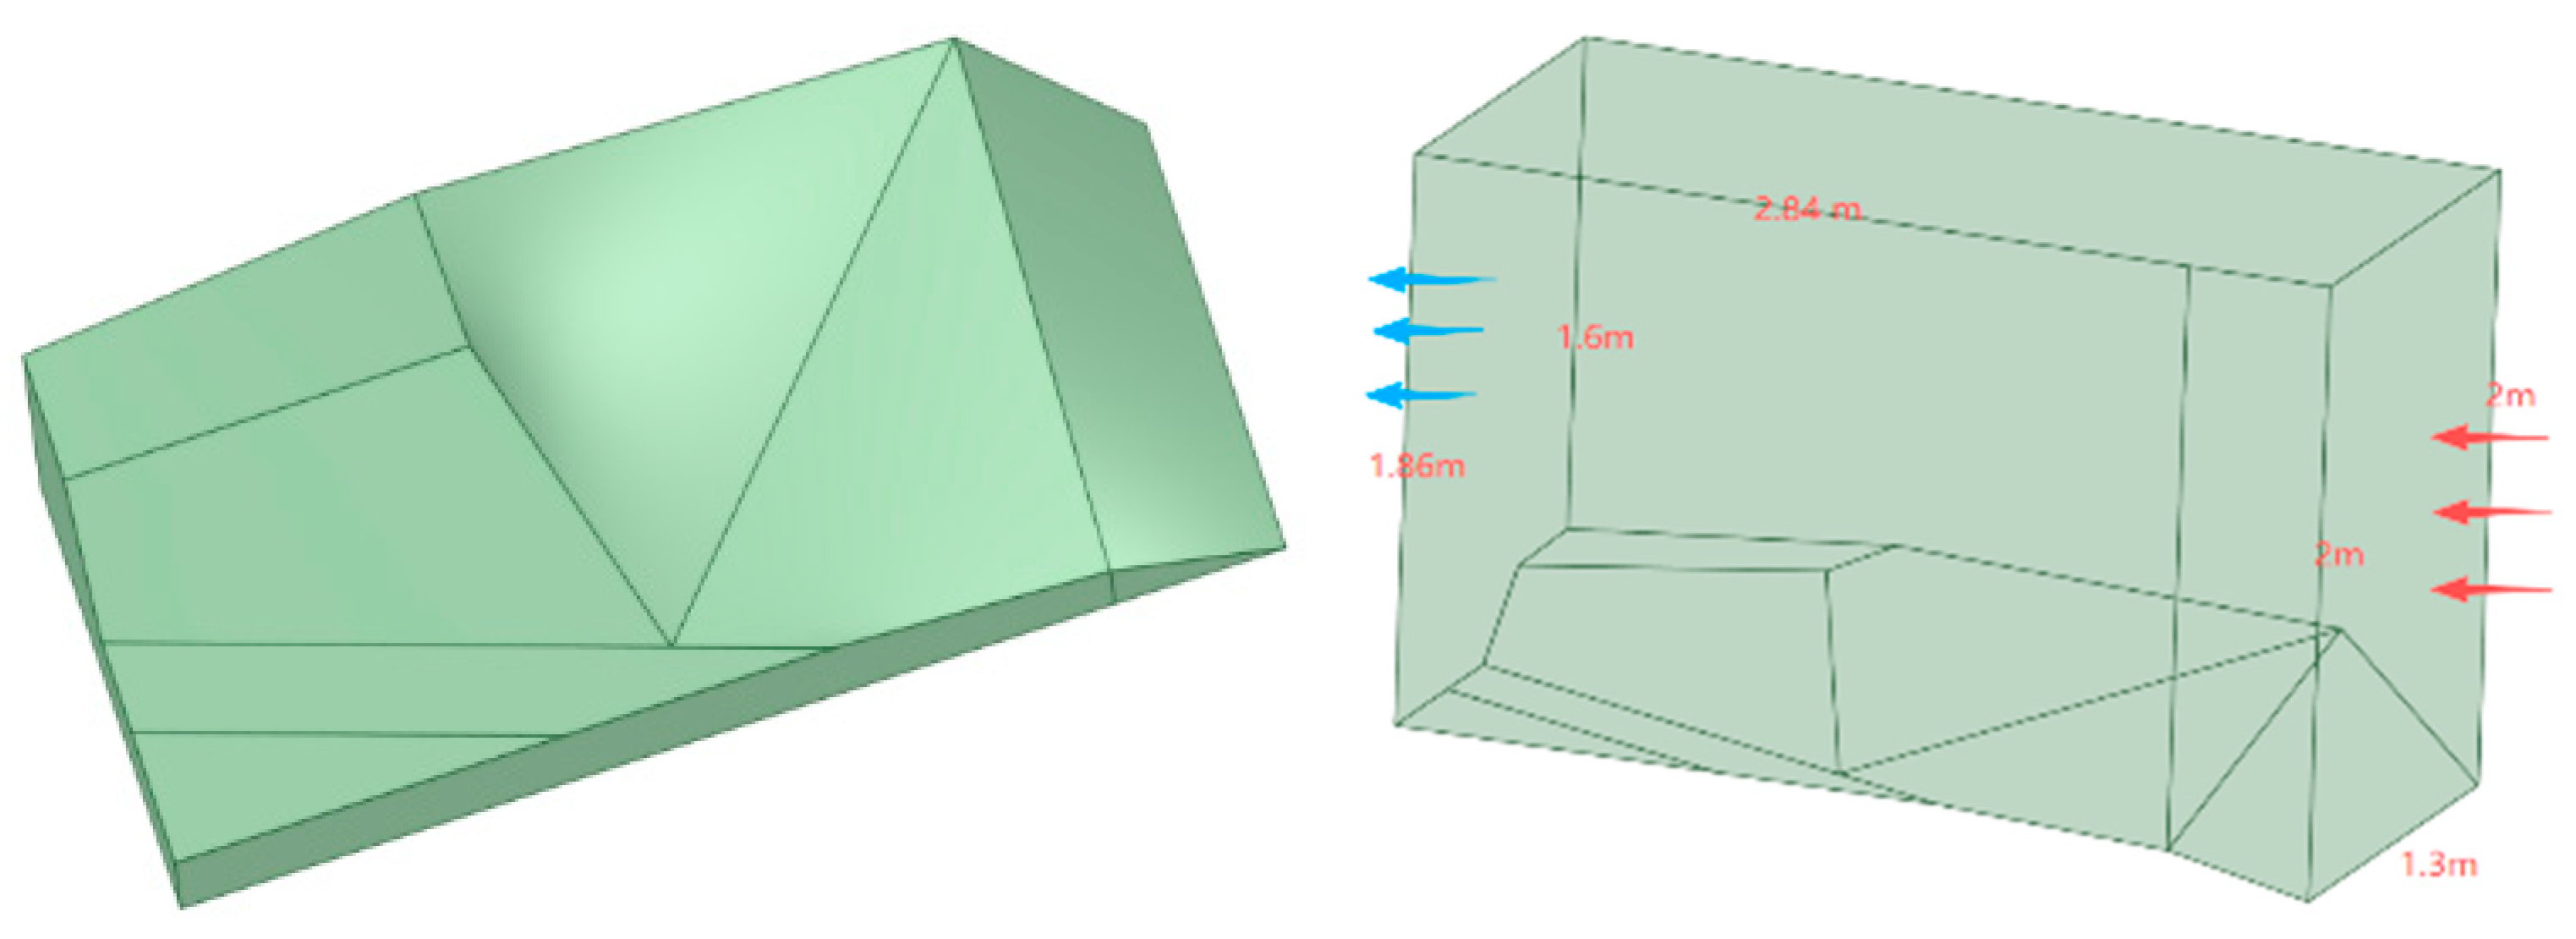
Similar parametric CFD investigations on highway subgrades have demonstrated that geometric configuration is a primary determinant of regional snow distribution [26]. Consistent with the aforementioned 3D-printed physical model, a corresponding three-dimensional numerical model was established leveraging the SpaceClaim modeling platform. The geometric specifications, encompassing the longitudinal and vertical dimensions of the computational fluid domain and the integrated terrain model, are illustrated in Figure 13.
Figure 13.
Schematic diagram of the 3D numerical model.
In both field wind-blown snow environments and wind tunnel experimental settings, the airflow exhibits non-uniform characteristics, whereby the wind velocity undergoes a progressive increase with vertical elevation. Within the near-wall region, the velocity magnitude approaches zero, a phenomenon attributed to the frictional effects of surface roughness and topographic obstacles. Consequently, to ensure high-fidelity replication of these atmospheric boundary layer conditions, a User-Defined Function (UDF) was developed and implemented within the numerical framework to define the inlet velocity profile, ensuring rigorous adherence to the power-law distribution as expressed in Equation (7):
where represents the wind velocity at a reference height of 2 m (corresponding to the wind tunnel’s cross-section of 1.5 m × 2 m), with a magnitude of 12 m/s; denotes the wind velocity at height z; and the value 0.15 signifies the surface roughness exponent for Category B terrain. This terrain category primarily encompasses landscapes such as fields, villages, forests, and hills, as well as suburban areas with sparse housing. Given that the study area is predominantly characterized by alpine meadows and sparse shrubs with minimal tree coverage, this relatively open topography—distinct from the extreme flatness of desert environments—is representative of typical Category B terrain.
Wind-blown snow is physically conceptualized as a complex gas–solid two-phase flow system. In alignment with established numerical simulation protocols, standard physical parameters were adopted for the continuous gas phase. Specifically, the air density () is fixed at , and the dynamic viscosity () is specified as . Regarding the discrete solid phase, the gravitational acceleration (g) is set to , while the snow particle density is defined as , consistent with the material properties reported in [27].
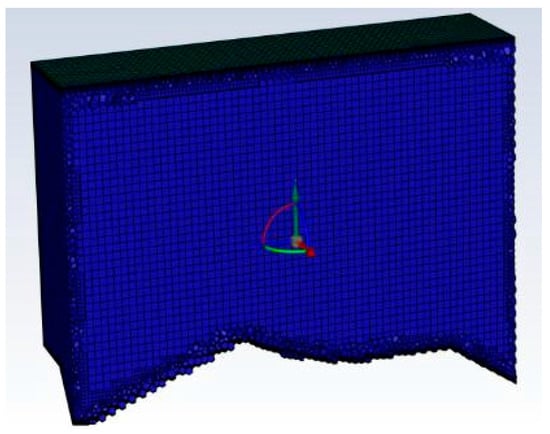
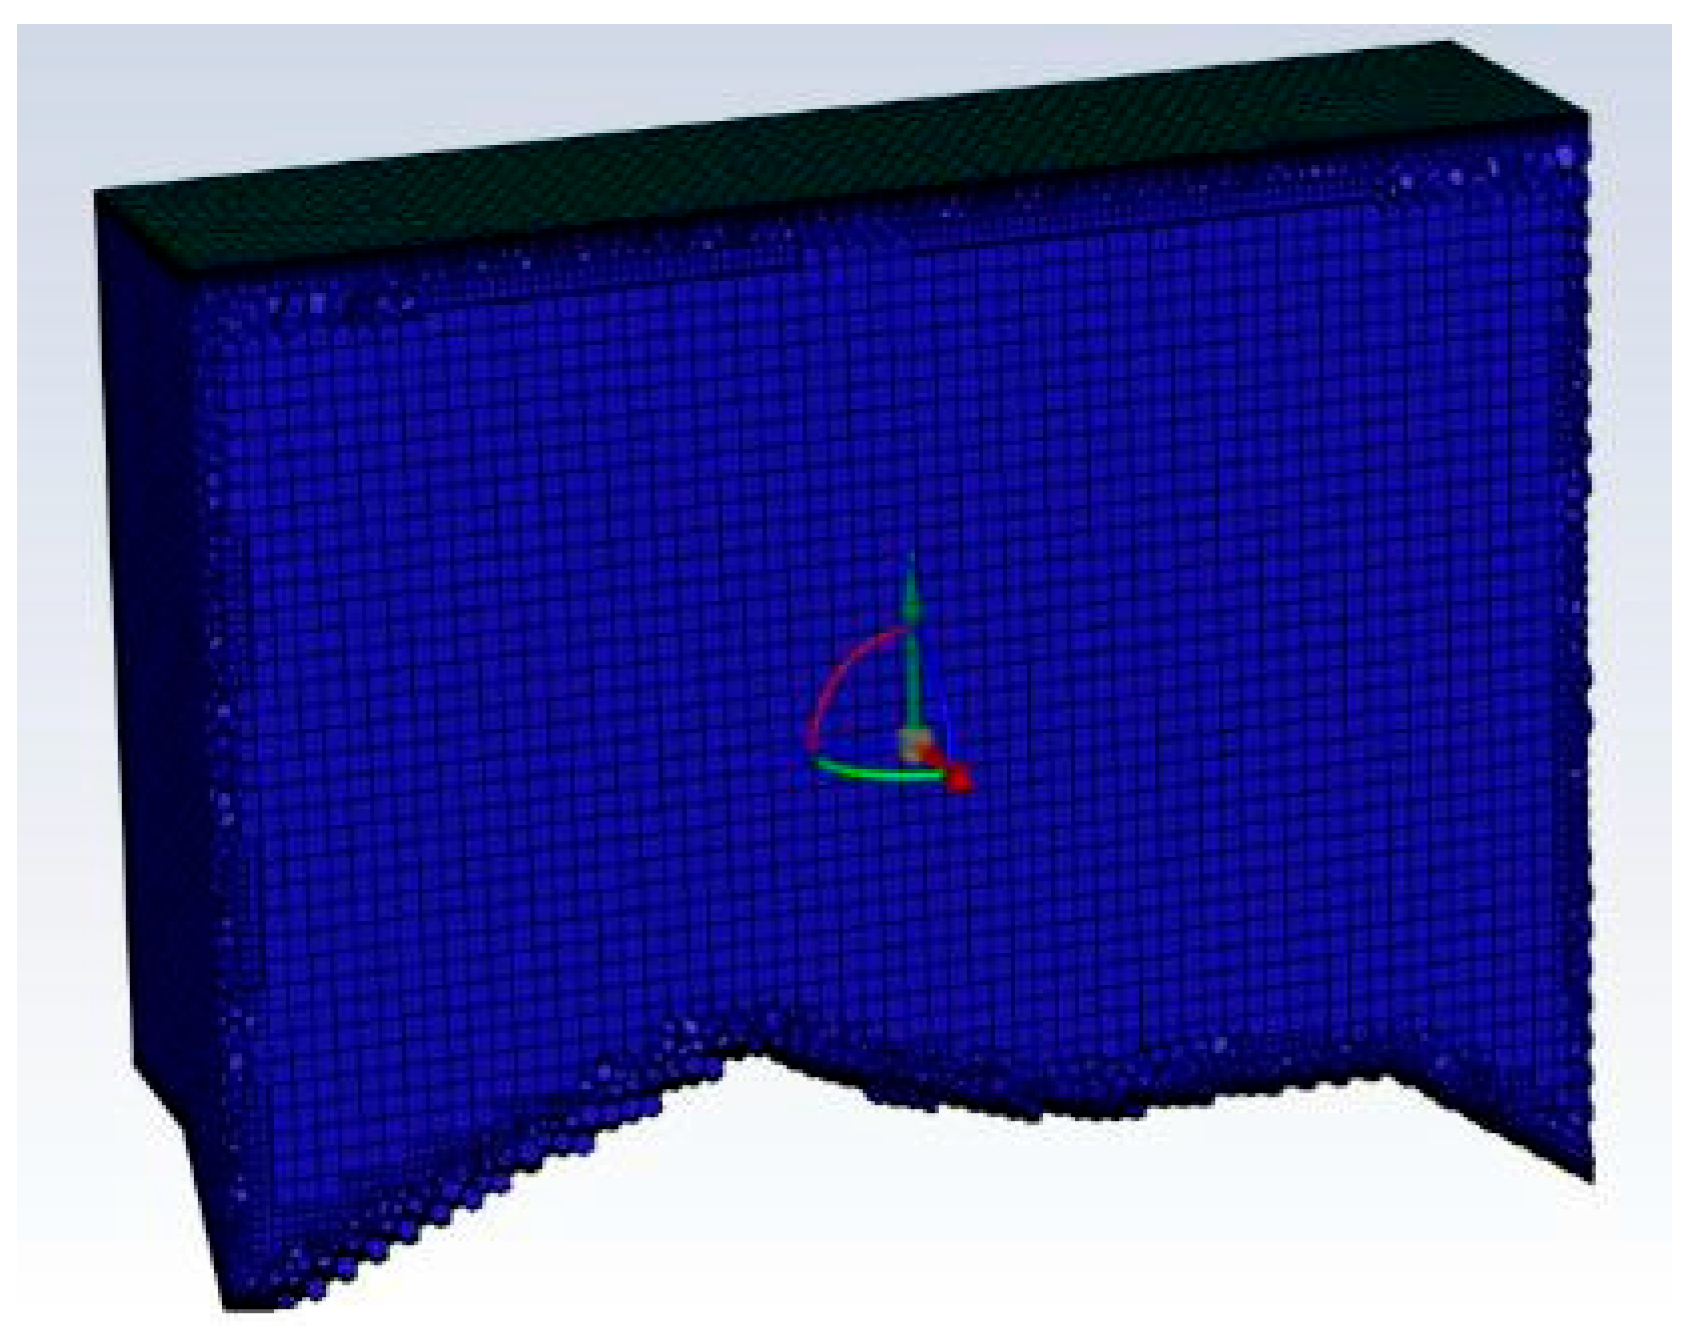
Concerning the boundary conditions, the inlet snow particles were prescribed a uniform diameter of 0.2 mm [27], accompanied by an initial volume fraction of 0.01. The outlet boundary was designated as a pressure outlet maintained at standard atmospheric pressure, whereas all remaining boundaries were imposed as impermeable, no-slip walls. Furthermore, the evaluation of snow deposition and erosion was conducted using an iso-surface methodology, predicated on a critical snow volume fraction threshold of 0.5. This procedural framework entails generating the iso-surface at the specified threshold and subsequently extracting the vertical coordinate values (Y-direction) to quantify the precise height of the snow cover. The entire computational domain was spatially discretized using structured meshes, as depicted in the Figure 14. The resulting mesh assembly comprises a total of 225,607 grid elements, characterized by a minimum orthogonal quality of 0.312, ensuring sufficient grid quality for numerical stability.
Figure 14.
Computational mesh of the fluid domain. Blue: fluid domain mesh; red/green/yellow: velocity vectors.
To achieve high-fidelity replication of realistic wind-blown snow dynamics, a fully three-dimensional numerical framework was established. The governing RANS equations were solved employing the SIMPLEC algorithm (Semi-Implicit Method for Pressure-Linked Equations-Consistent) to rigorously handle pressure–velocity coupling. Regarding spatial discretization, the Standard scheme was adopted for pressure interpolation. Concurrently, the Second-Order Upwind scheme was utilized for the momentum and turbulence transport equations to minimize numerical diffusion and enhance computational accuracy.
5.3. Numerical Simulation Results and Validation
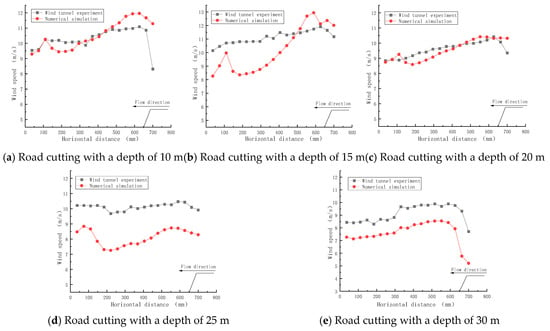
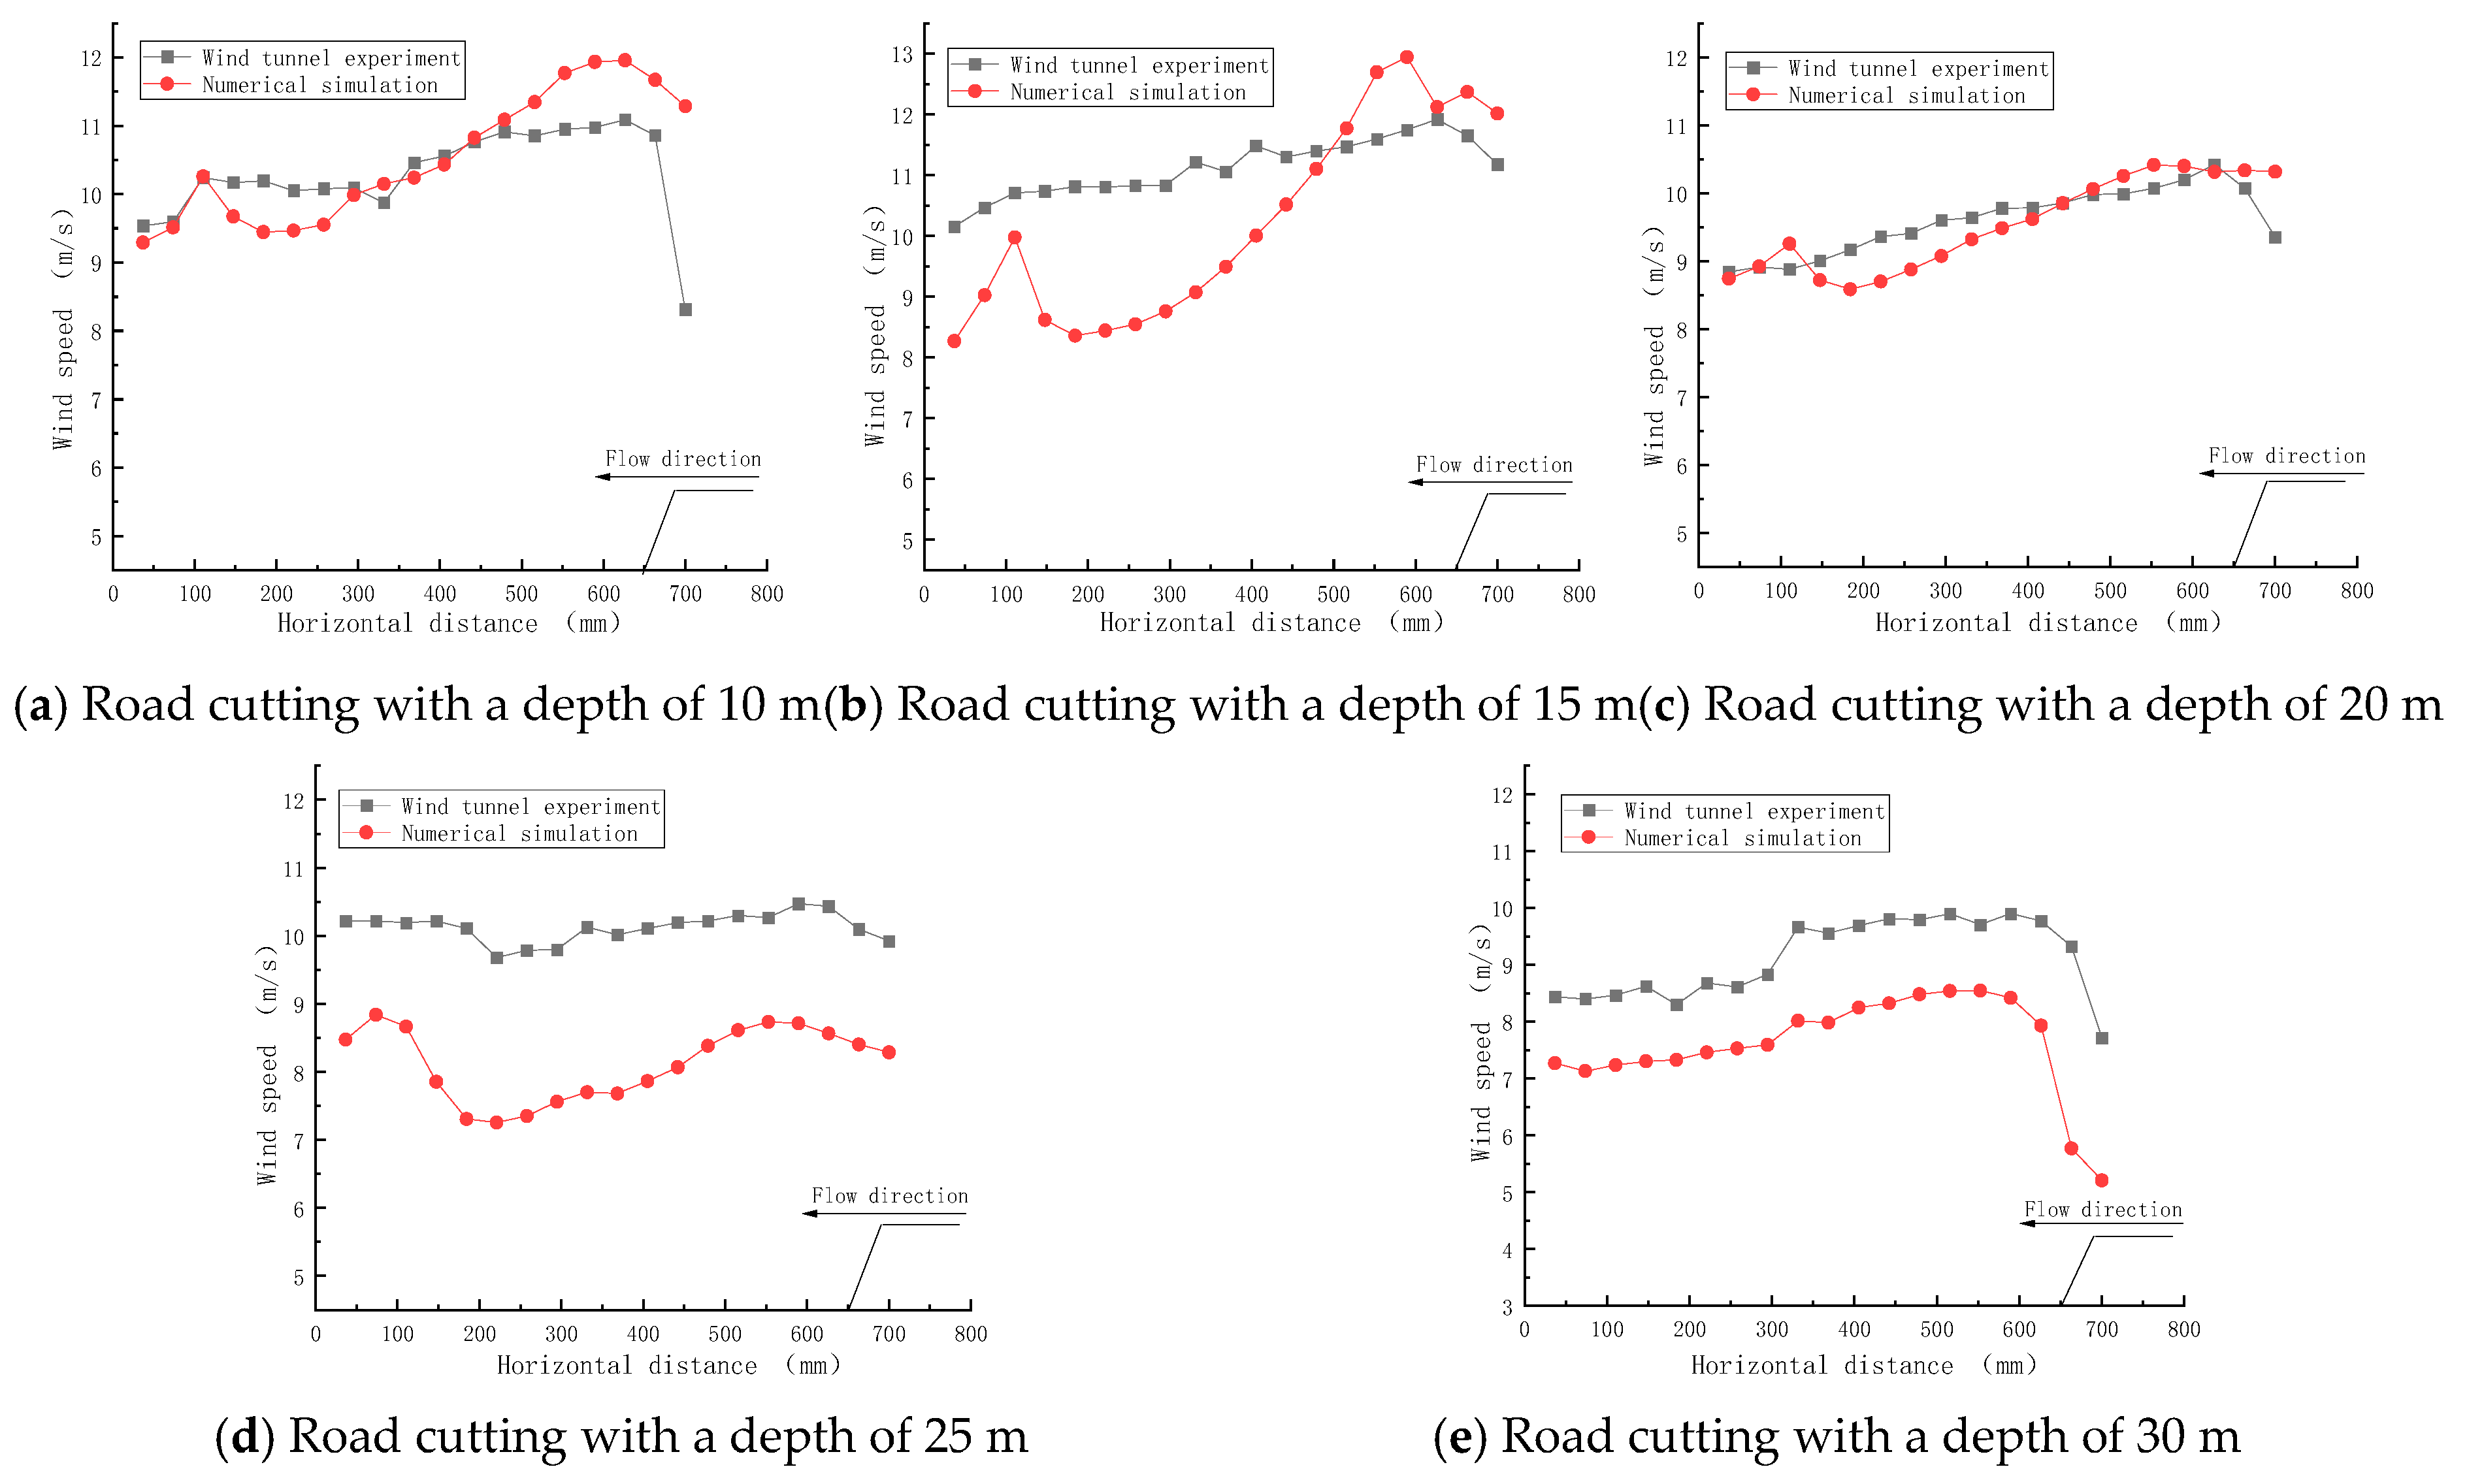
A comparative analysis was performed to evaluate the consistency between wind velocity distributions obtained from wind tunnel experiments and numerical simulations. The quantitative data were extracted at a reference height of 3 cm above the road surface within road cuttings of varying depths. The wind speed profiles derived from these respective methodologies are illustrated in Figure 15.
Figure 15.
Wind velocity distributions for road cuttings of different depths obtained by wind tunnel and numerical simulations.
The numerical simulation results demonstrate a strong consistency with the wind tunnel experimental data regarding wind velocity distribution, exhibiting consistent evolutionary trends. Specifically, within the road cutting, an increase in cutting depth induces an expansion of the deceleration zone, resulting in a continuous reduction in wind velocity.
Along the streamwise direction, the wind velocity exhibits a progressive increase as the airflow ascends the slope, culminating in a peak value at the crest. Attributed to the significant elevation drop characteristic of the deep cutting, the velocity decreases abruptly, and flow fluctuations are induced as the airflow traverses the central barrier. Downstream of the central guardrail, the airflow develops a pronounced velocity deficit zone, characterized as a wind speed valley within the cutting interior. This region functions as the primary deceleration zone, where wind velocity undergoes sharp attenuation following flow separation at the windward slope crest, reaching its local minimum in the leeward wake of the barrier. Quantitative analysis reveals that the velocity differentials (▲V) for cutting depths of 10, 15, 20, 25, and 30 m are 2.51, 4.58, 1.59, 1.35, and 1.41 m/s, respectively. Although the maximum wind speed fluctuation peaks at a 15 m depth, the spatial expansion of this deceleration zone in deeper cuttings (>25 m) is the primary mechanism that significantly exacerbates snow deposition. Subsequently, the airflow exhibits a gradual velocity recovery as it exits the deceleration zone.
It is noteworthy that slight discrepancies between the numerical simulations and experimental measurements are observed; these are predominantly attributed to the geometric simplification of the mountain terrain model adopted in the numerical setup.
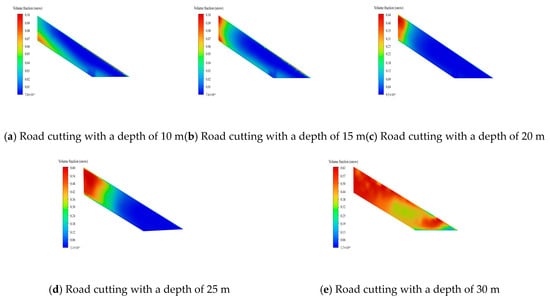
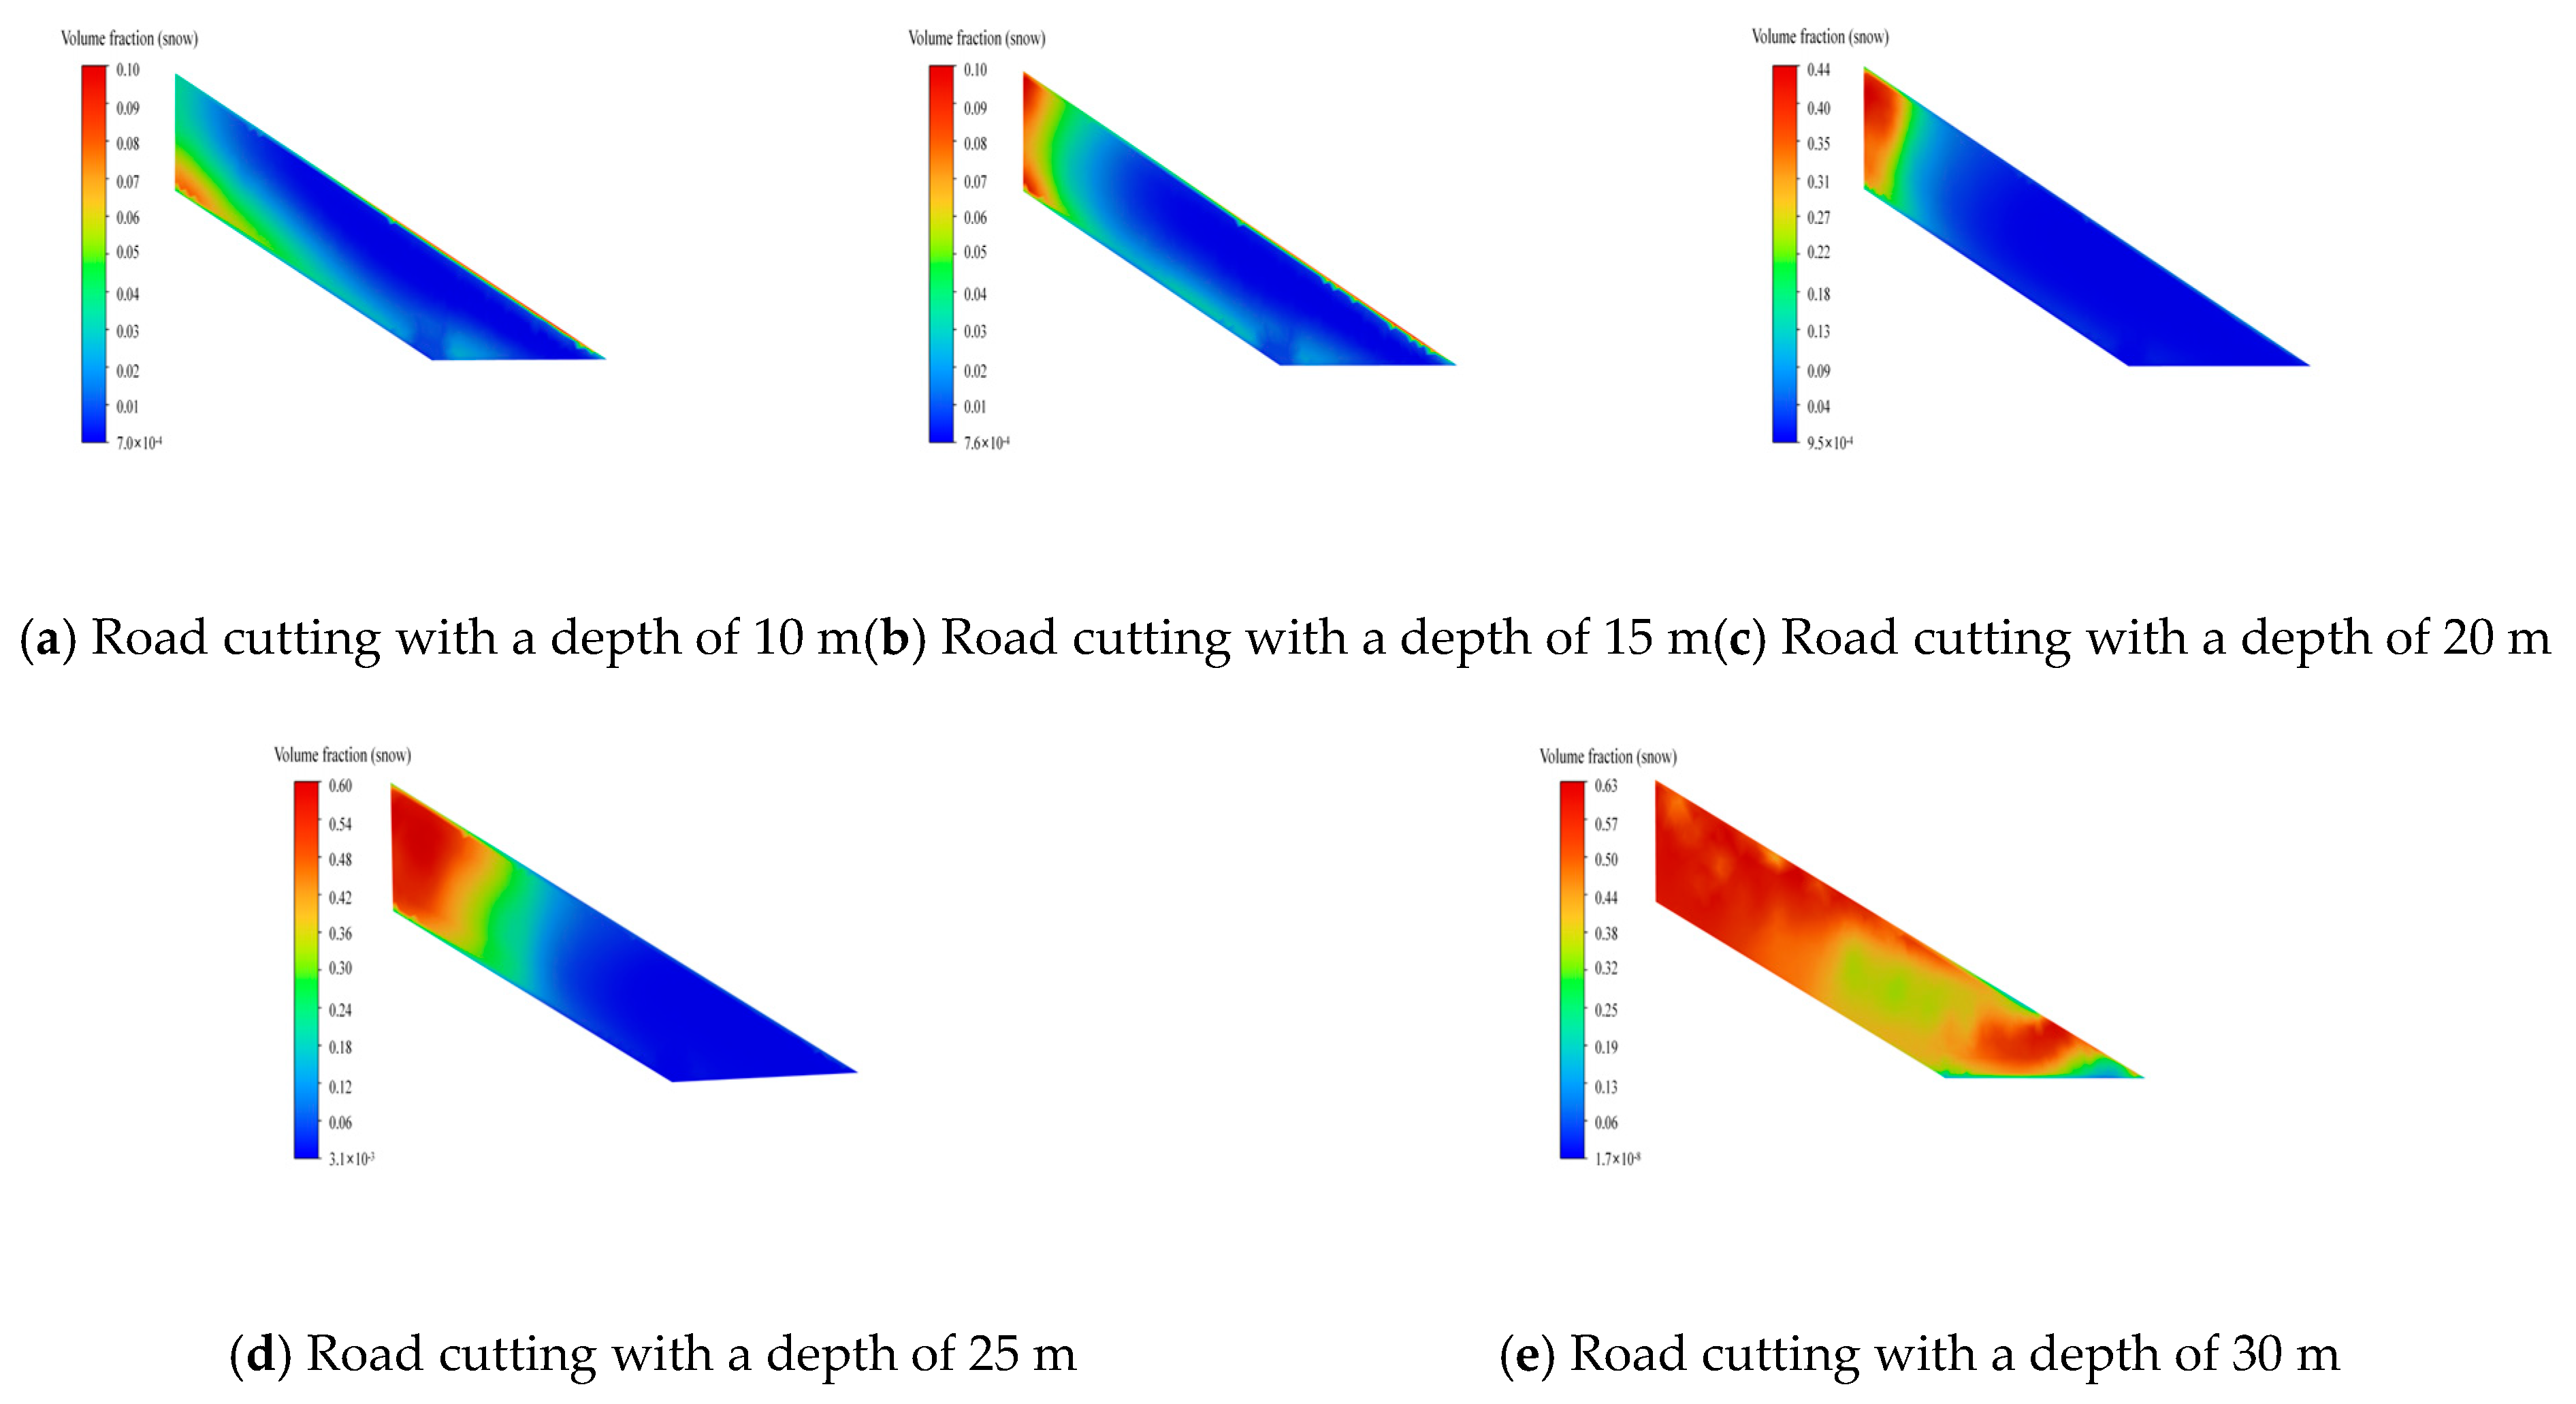
Figure 16 illustrates the contours of snow particle volume fraction corresponding to various road cutting depths. Simulation results indicate that the spatial extent of snow accumulation on the road surface expands progressively with increasing cutting depth, with significant accumulation predominantly concentrated on the leeward side and the tail region of the cutting. Specifically, for cutting depths ≤25 m, the snow-covered area exhibits a gradual increment. Conversely, when the depth exceeds 25 m, the accumulation range expands rapidly, encompassing nearly the entire road surface. These findings demonstrate a strong consistency with the wind velocity analysis presented previously.
Figure 16.
Contours of snow particle volume fraction for road cuttings of different depths.
6. Analysis of Design Parameters for Snow Fences
To precisely characterize the variations in experimental outcomes induced by alterations in key design parameters and to elucidate the corresponding theoretical trends, specific optimizations were implemented within the experimental configuration. First, a uniform geometric scaling ratio of 1:10 was adopted for the snow fence models to effectively replicate the mechanical properties and aerodynamic flow field responses of the full-scale prototype within a controlled laboratory environment. Second, the incoming flow was configured to a 90° vertical incidence mode to maximize the interaction intensity between the airflow and the fence structure, thereby facilitating the sensitive detection of data fluctuations resulting from parameter variations.
It is acknowledged that although these experimental settings exhibit minor deviations from the specific in situ engineering conditions, systematic theoretical derivations and extensive preliminary tests have corroborated that this configuration maintains the validity and reliability of the results. Moreover, this methodological approach more effectively elucidates the intrinsic correlations between the key design parameters of the snow fence and its protective performance.
6.1. Effect of Bottom Gap on Wind-Blown Snow Flow
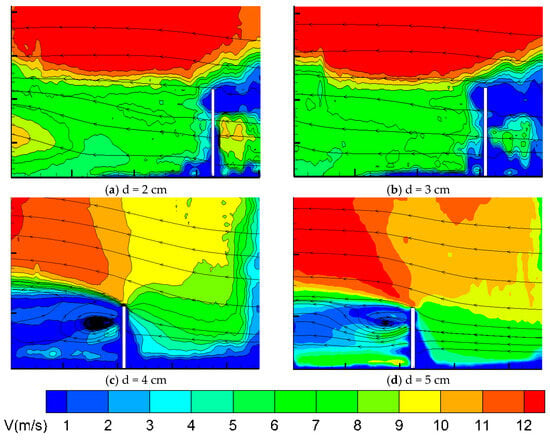
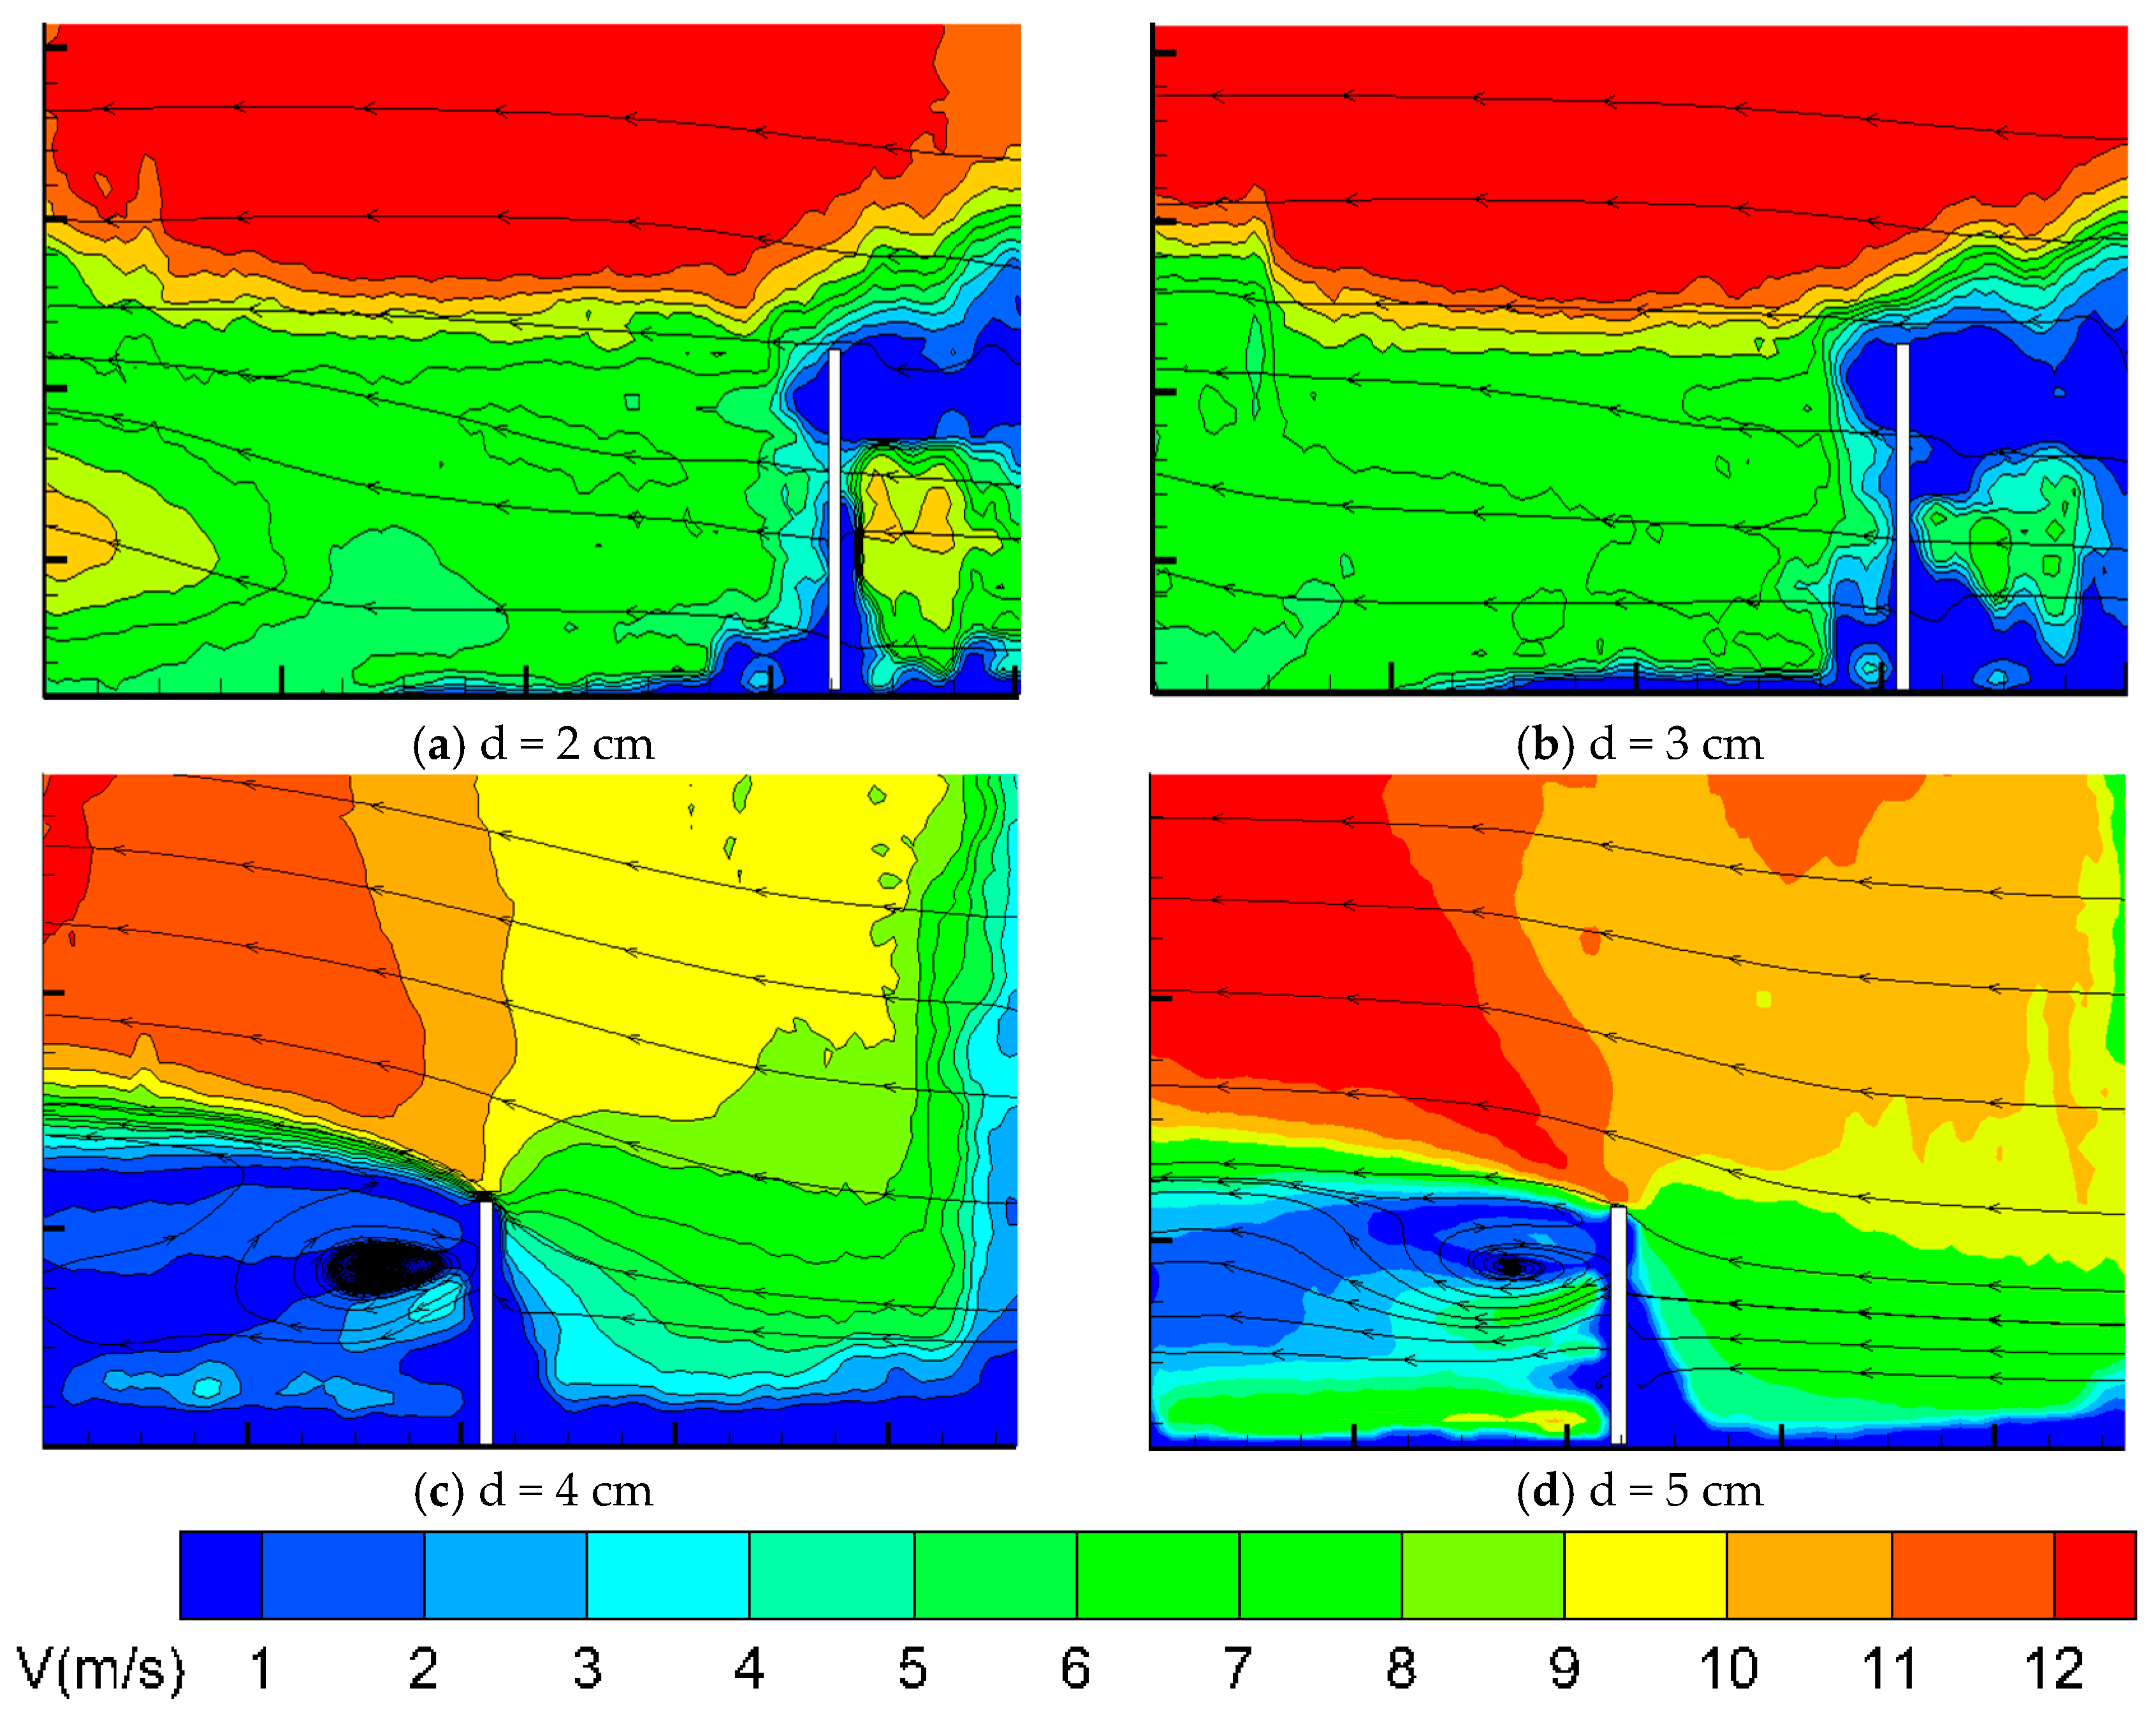
For the purpose of examining the impact of the bottom clearance d on snow drift, simulations were conducted using a fence with H = 20 cm and a porosity of 40%. The velocity field distributions for various bottom gaps are presented in Figure 17.
Figure 17.
Wind velocity contours for snow fences with different bottom gaps.
At a gap of d = 2 cm, the flow is characterized by a distinctive upstream vortex. The velocity decays significantly from the core outwards, creating a low-speed zone at the fence bottom where most snow particles are trapped on the windward side.
Conversely, with a continuous increase in the parameter d, the intensity of the upstream vortex diminishes. The airflow traversing the bottom gap accelerates due to flow constriction, resulting in an expansion of the high-velocity zone. Downstream, large-scale vortex structures develop within the leeward region. This flow pattern facilitates the transport of snow particles towards the leeward side, where the proliferation of vortices further expands the spatial extent of snow distribution. Comparative studies on embankments have also highlighted the sensitivity of snow accumulation to barrier clearance and vortex evolution [28].
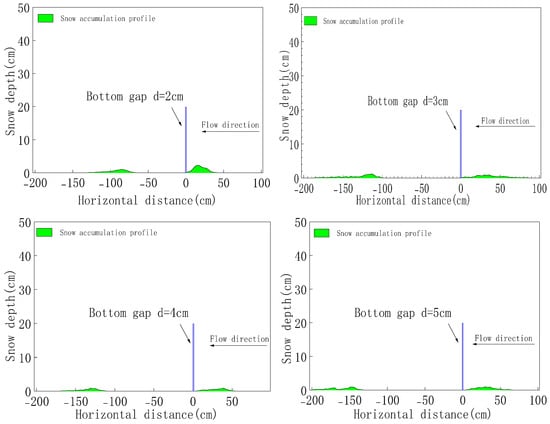
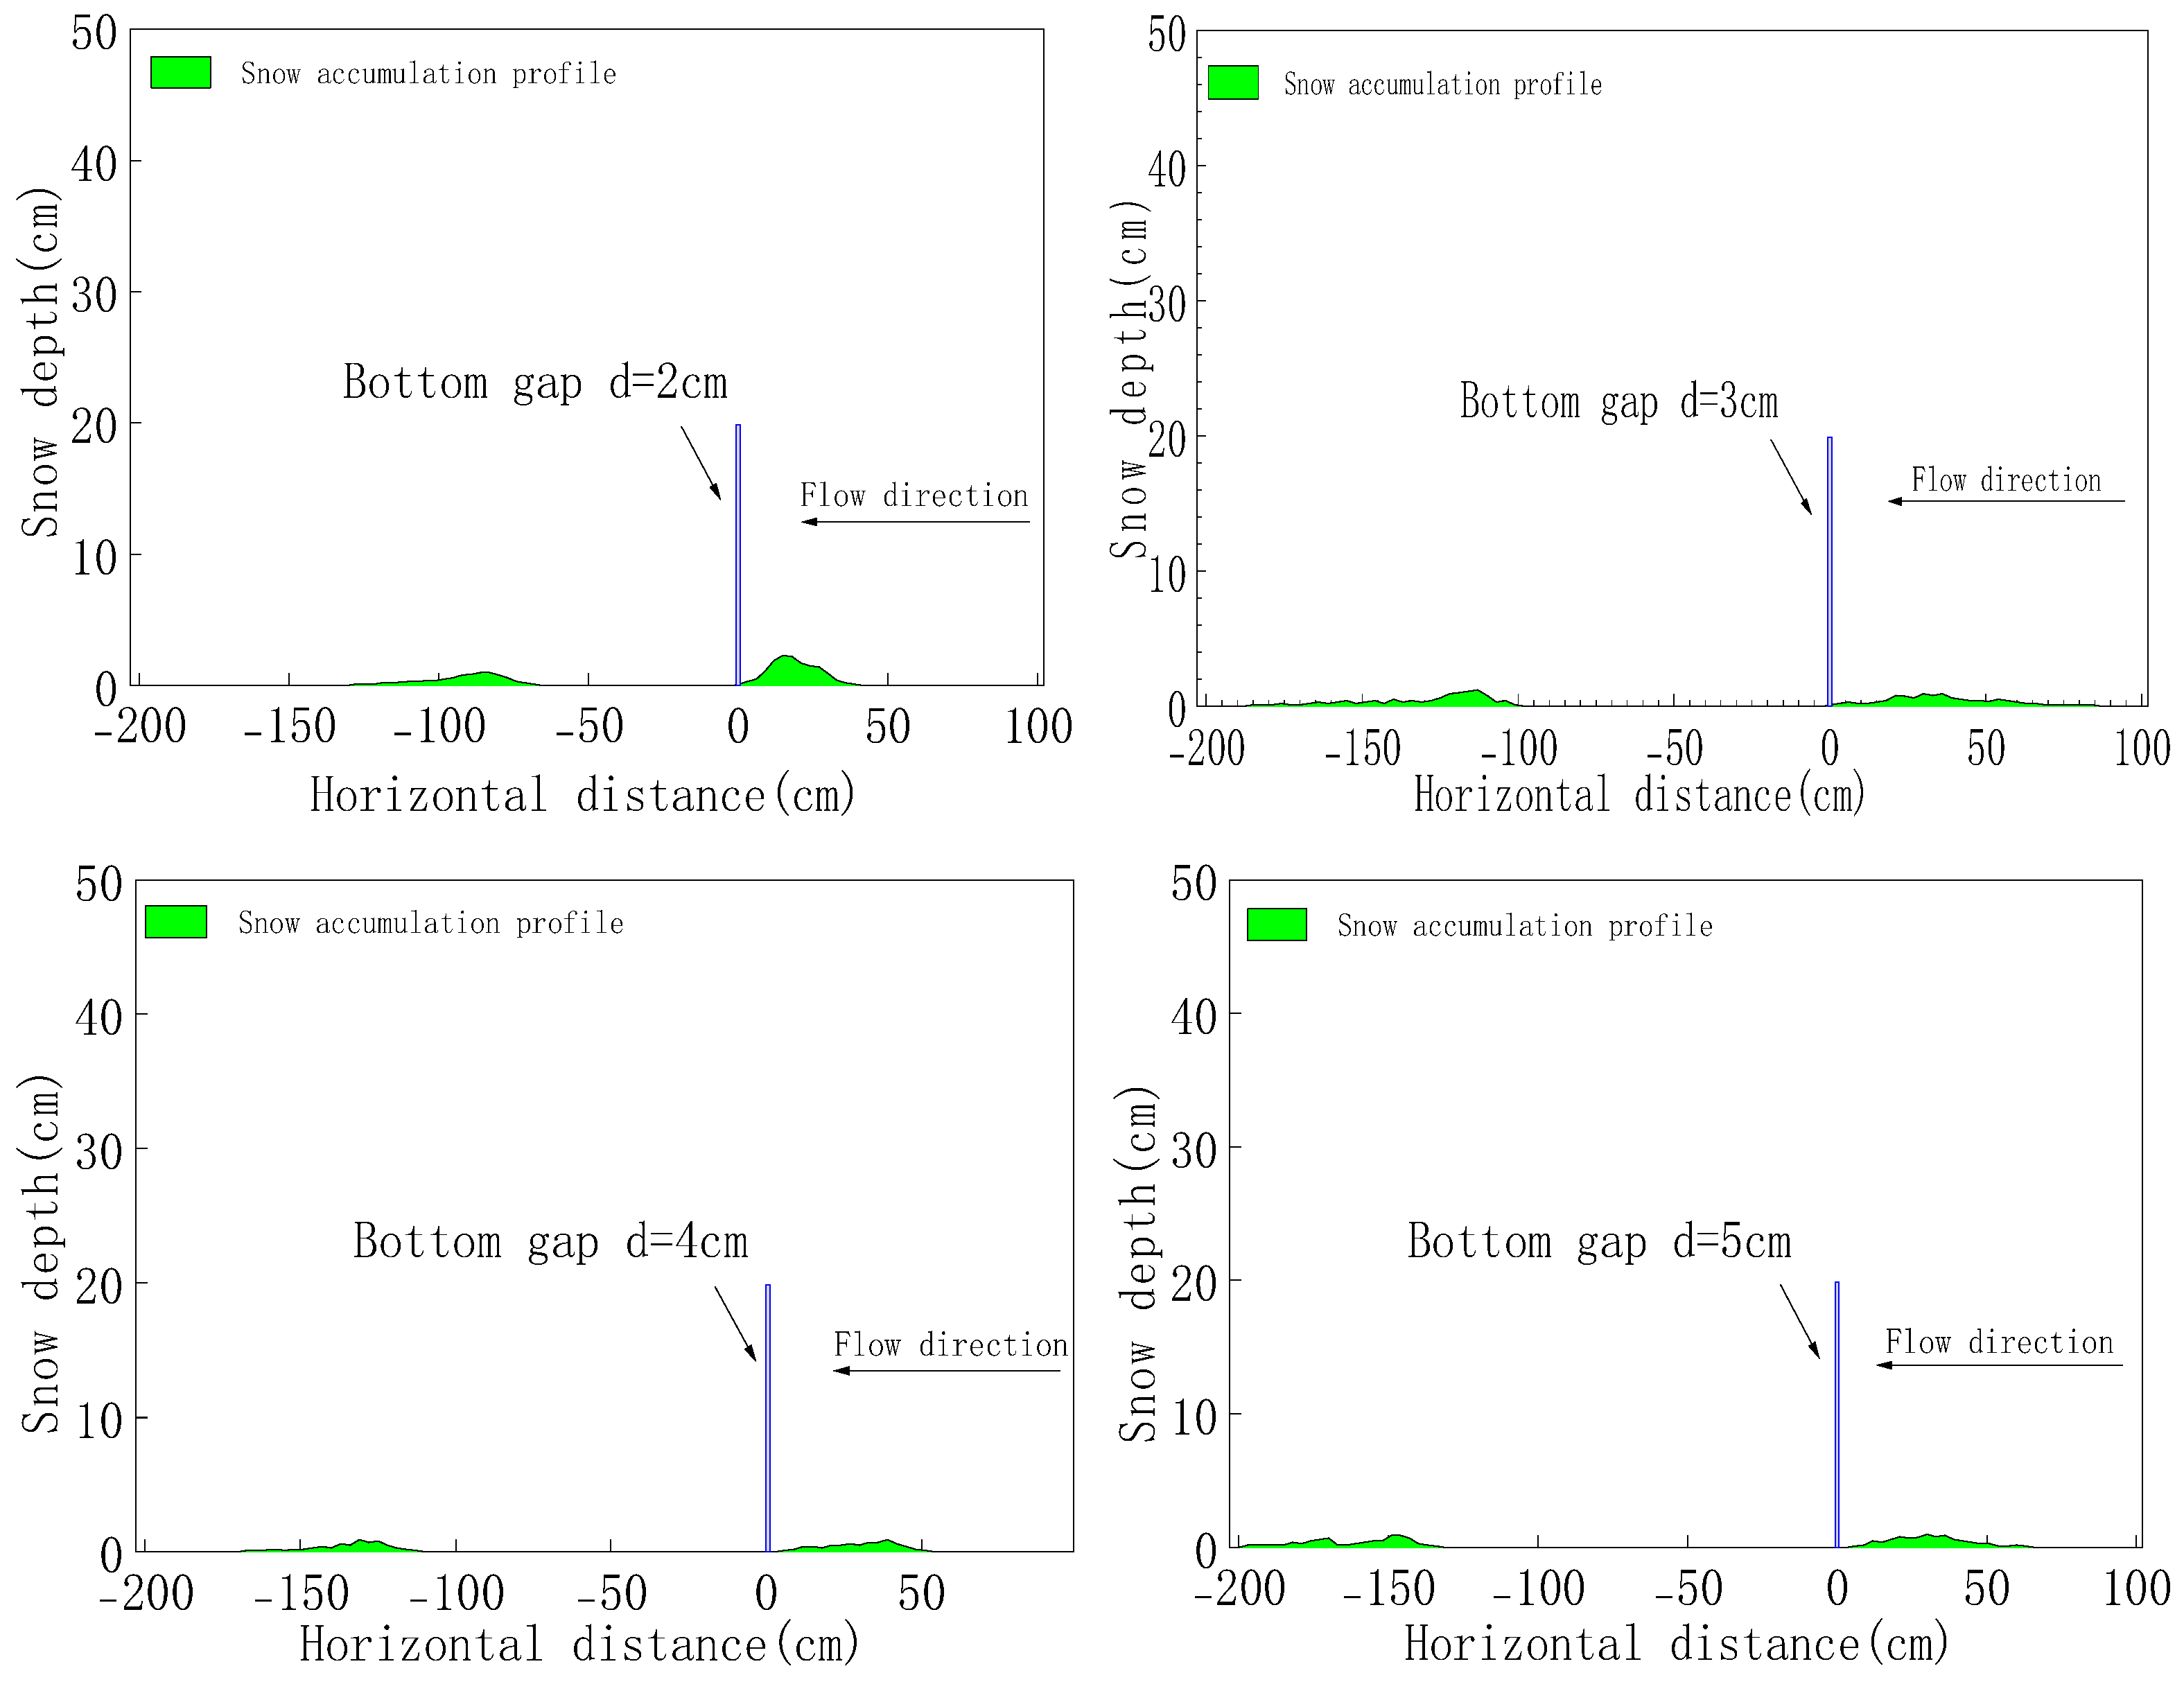
Figure 18 illustrates the snow accumulation profiles associated with varying bottom gap configurations. It is evident that with the progressive widening of the bottom gap, the predominant mass of snow particles is transported from the windward side to the leeward side of the fence.
Figure 18.
Snow accumulation profiles for snow fences with different bottom gaps.
Specifically, for the configuration where d = 0.2 cm, pronounced snow accumulation is observed in the immediate windward region of the fence. Conversely, with a progressive increment in d, the basal acceleration zone undergoes expansion. Consequently, the distance spanning from the fence to the onset of leeward snow deposition extends progressively to 67 cm (3.4H), 100 cm (5H), 112 cm (5.6H), and 135 cm (6.75H), respectively. This phenomenon is principally attributed to the spatial expansion of the leeward vortex structure, which modulates the transport and distribution of snow particles, resulting in a more dispersed and gentler accumulation profile.
6.2. Effect of Snow Fence Height on Wind-Blown Snow Flow
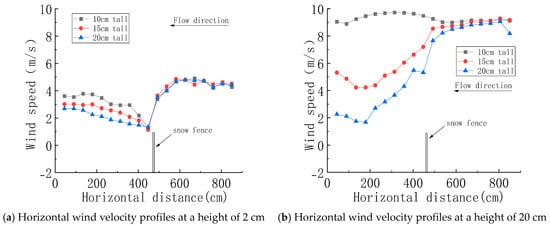
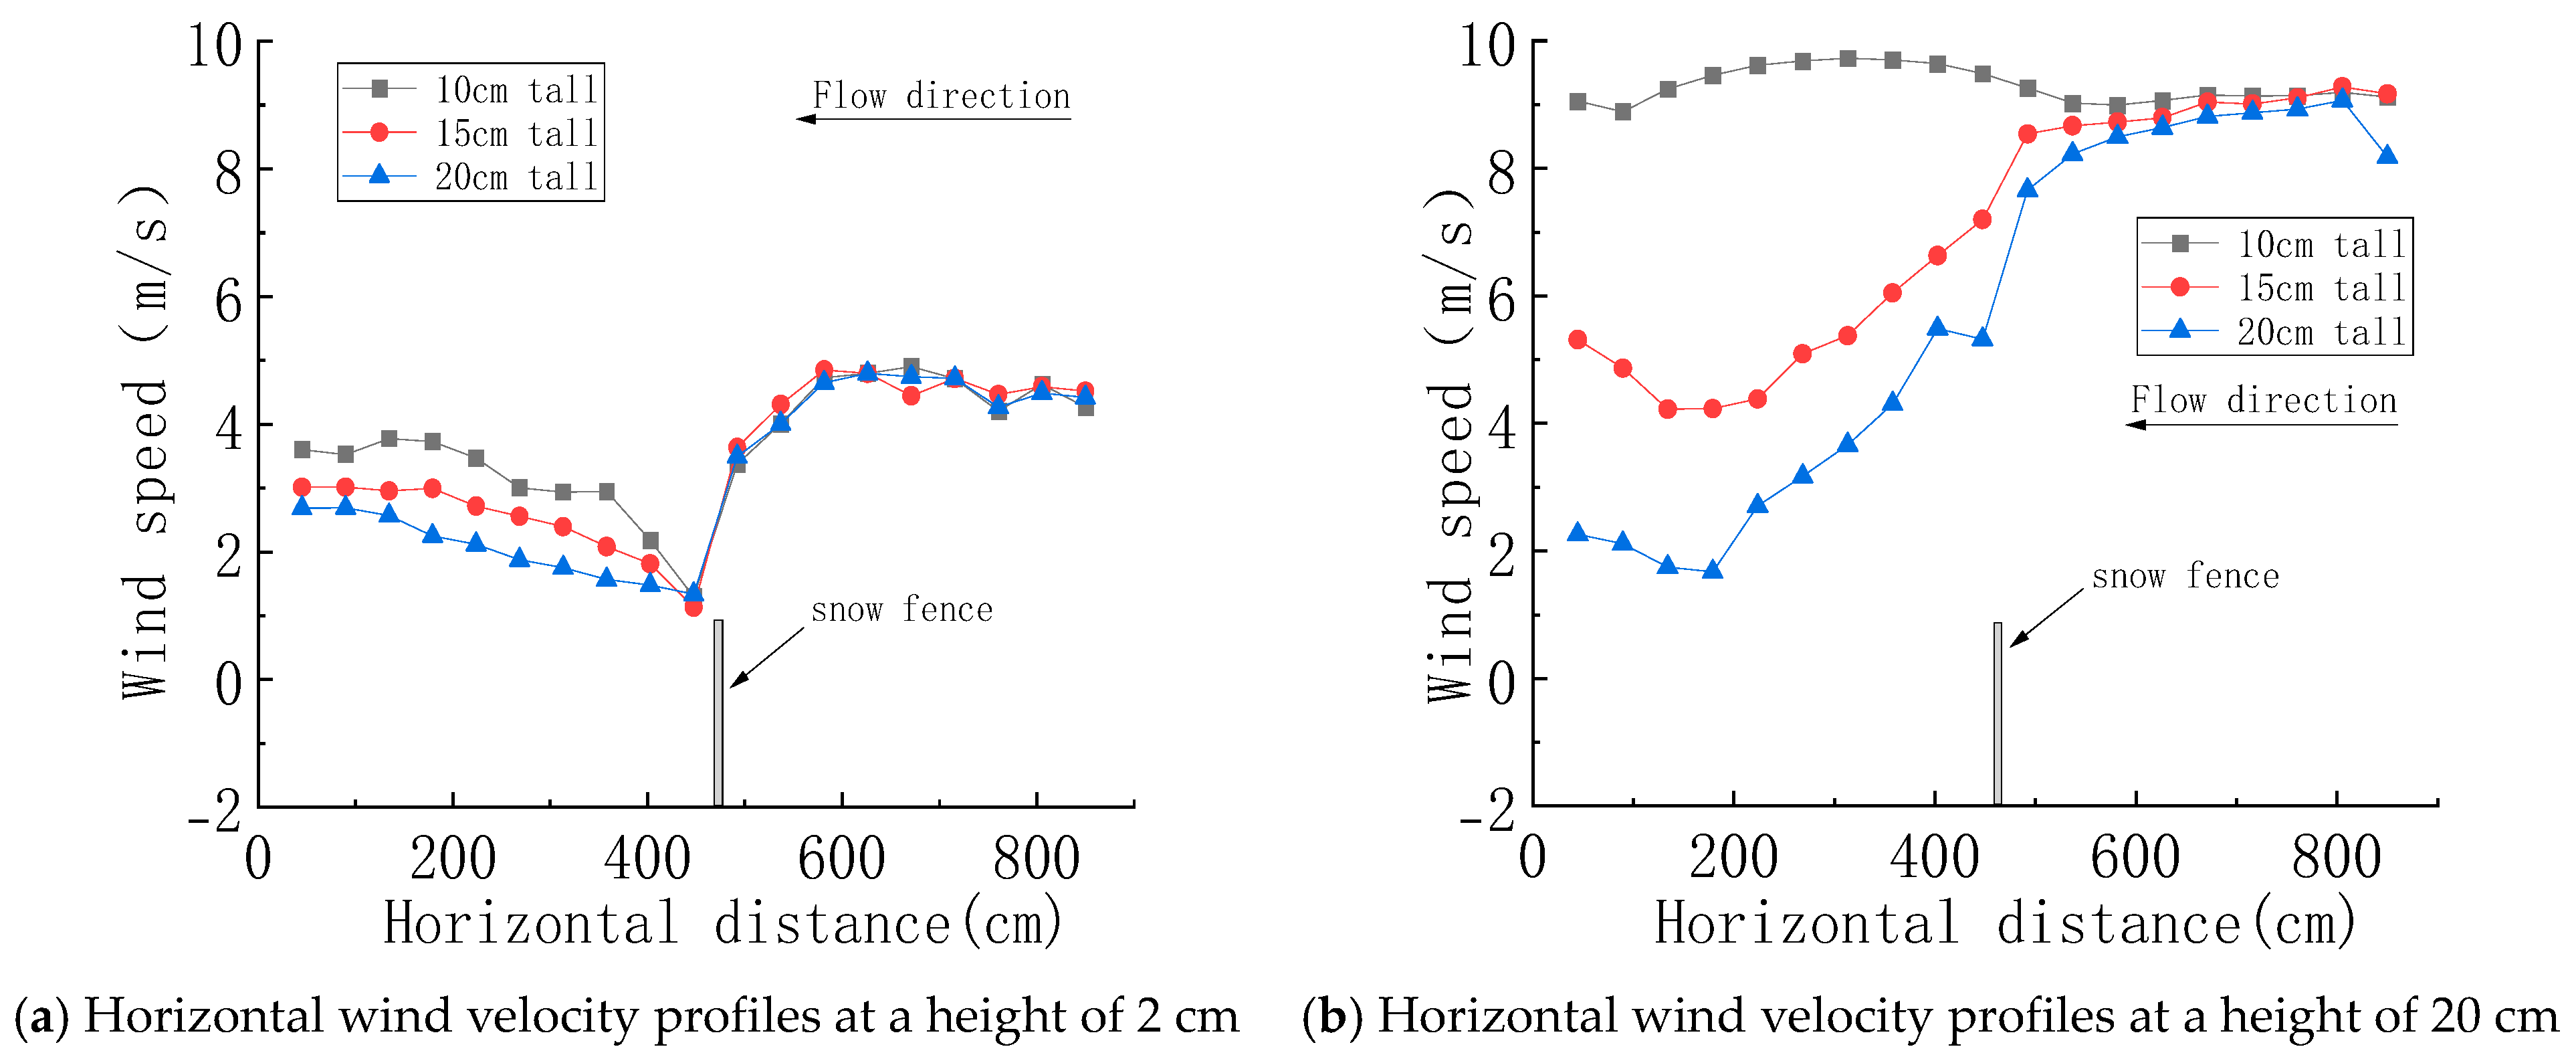
Figure 19 presents the horizontal wind velocity profiles for snow fences of varying heights, with a fixed porosity of 30% and a bottom gap d of 2 cm.
Figure 19.
Horizontal wind velocity profiles for snow fences with different heights.
Specifically, at a reference vertical height of 2 cm above the ground surface (situated below the fence crest), the wind velocity attenuation within the leeward region is particularly pronounced. With the progressive increase in fence height, the downstream wind velocity exhibits a continuous reduction, inducing a spatial expansion of the leeward vortex structure (wake zone). Consequently, the deposition area of snow particles enlarges commensurately.
Conversely, at a vertical elevation of 20 cm (a level surpassing the crest of the 10 cm fence model), the airflow trajectory remains substantially unperturbed by the 10 cm fence configuration. However, concomitant with the increase in fence height, the deceleration effect becomes increasingly pronounced. Based on these quantitative observations, it is deduced that the effective vertical domain of aerodynamic influence extends to approximately 1H.
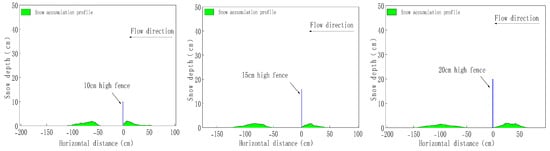
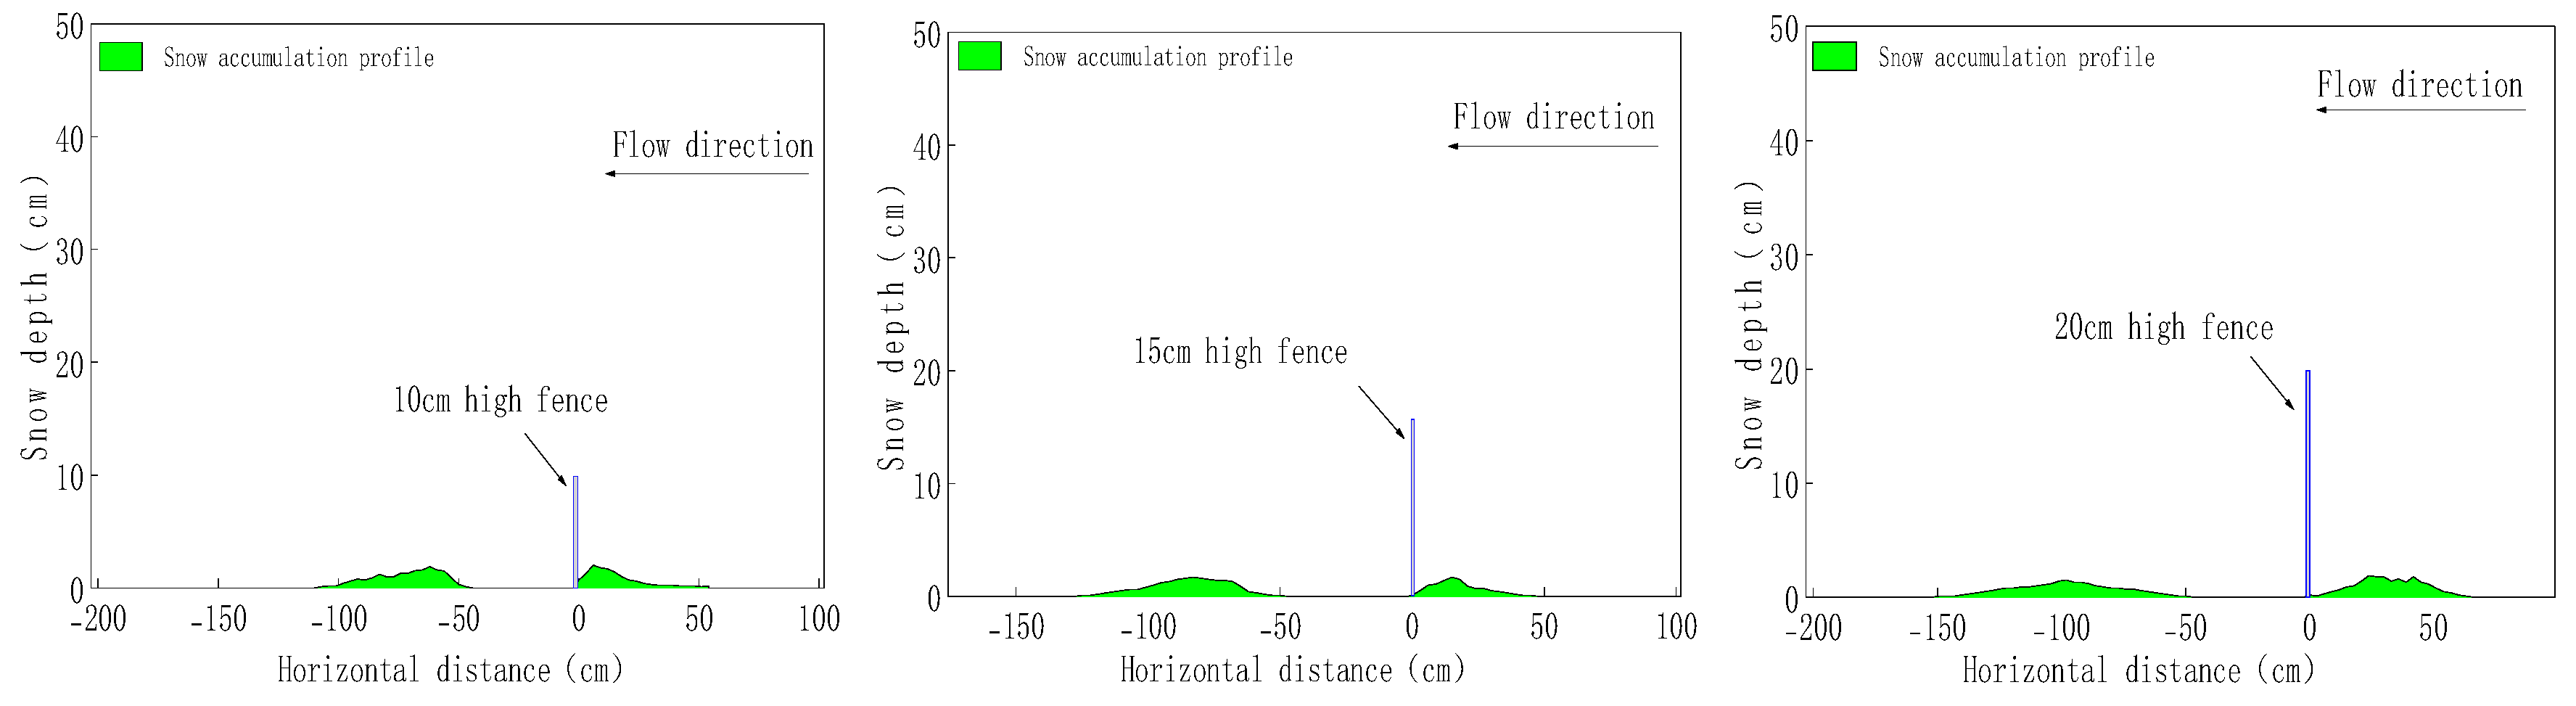
Figure 20 illustrates the snow accumulation profiles for snow fences of varying heights, with a porosity of 30% and a bottom gap (d) of 2 cm.
Figure 20.
Snow accumulation profiles for snow fences with different heights.
Observations indicate that concomitant with the increase in fence height, the peak of the snow depth exhibits a progressive downstream migration. Quantitatively, the longitudinal displacement magnitude of this peak is approximately double the increment in fence height (2▲H). Furthermore, the spatial extent of snow deposition undergoes continuous expansion, resulting in an accumulation profile that becomes increasingly flattened and uniform.
Specifically, for the fence configuration with a height of 10 cm, the longitudinal extent of snow accumulation extends to 60 cm. This deposition zone expands to 76 cm for a 15 cm height and culminates at 99 cm when the height is increased to 20 cm. Consequently, it is deduced that for every 5 cm increment in fence height (▲H = 5 cm), the downstream snow accumulation range exhibits an expansion of approximately 25 cm, a value corresponding to a scaling relationship of roughly 5▲H.
6.3. Effect of Snow Fence Porosity on Wind-Blown Snow Flow
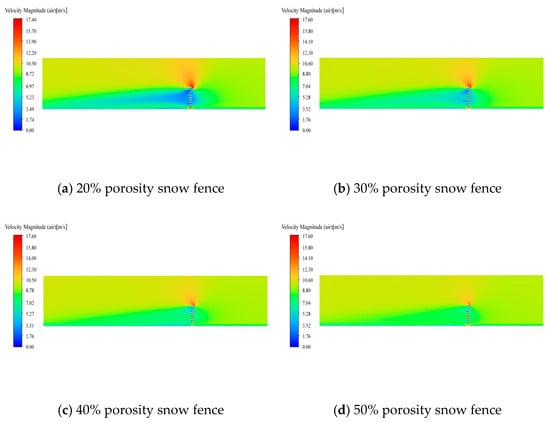
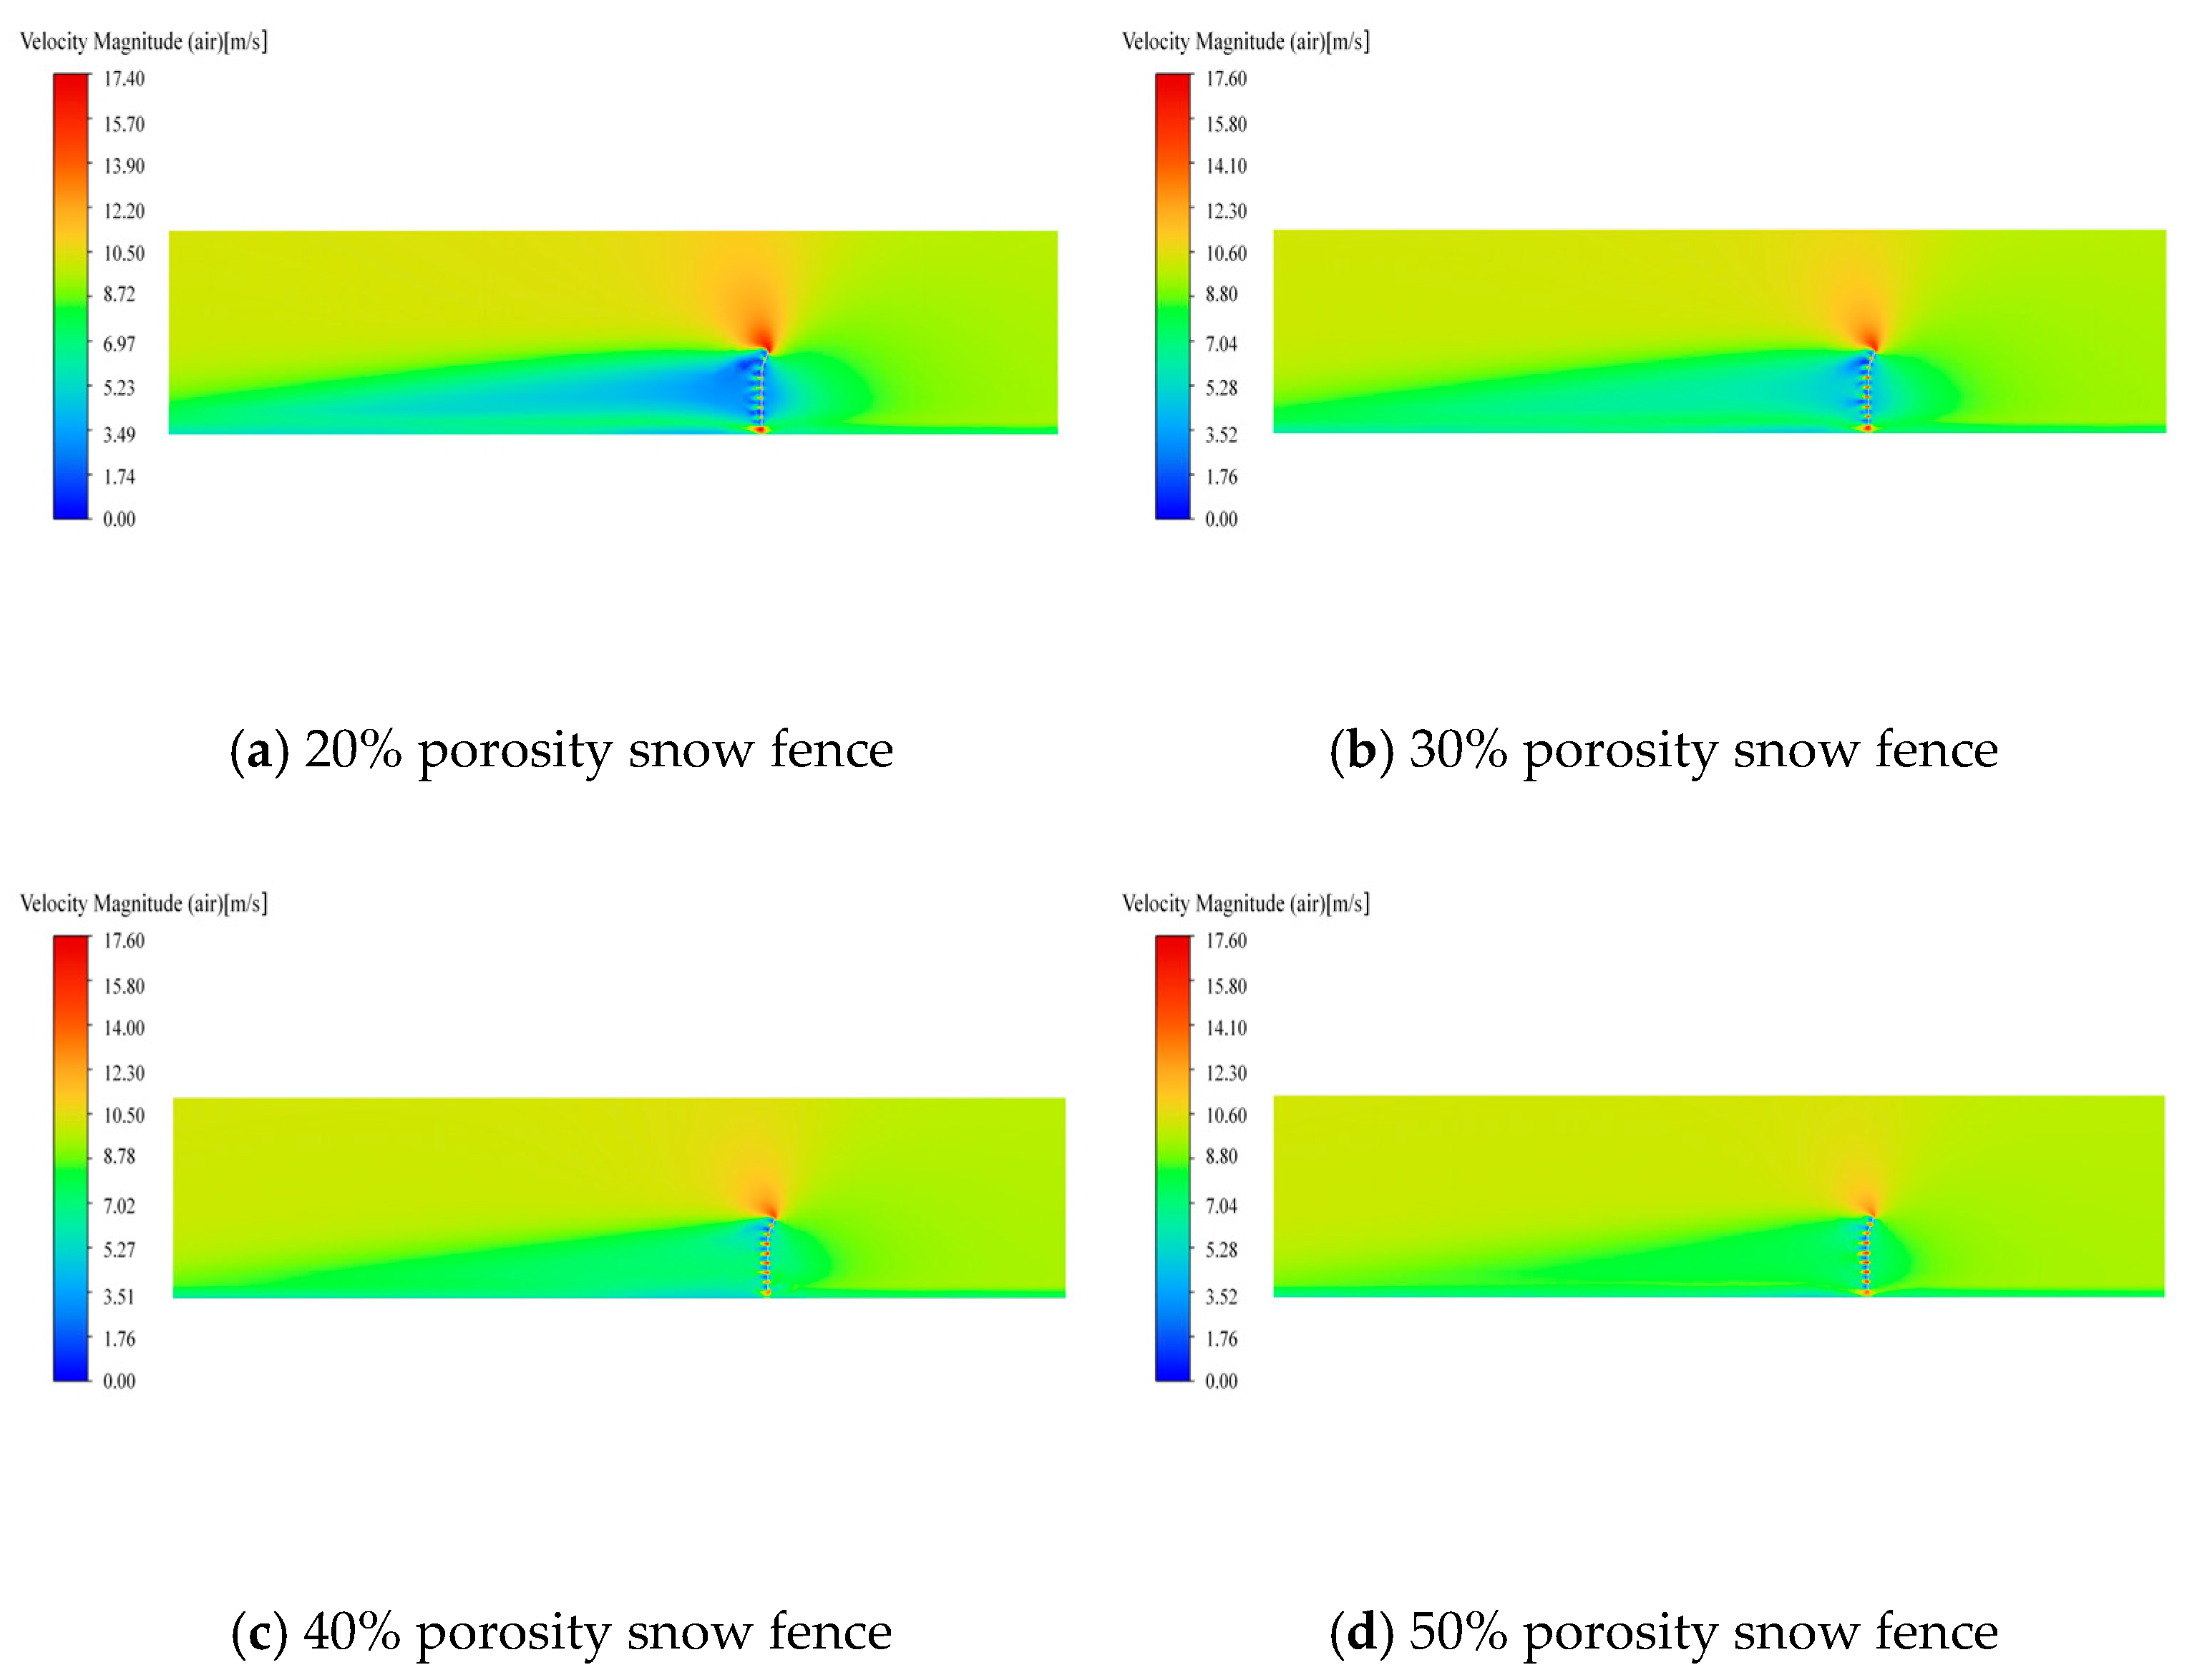
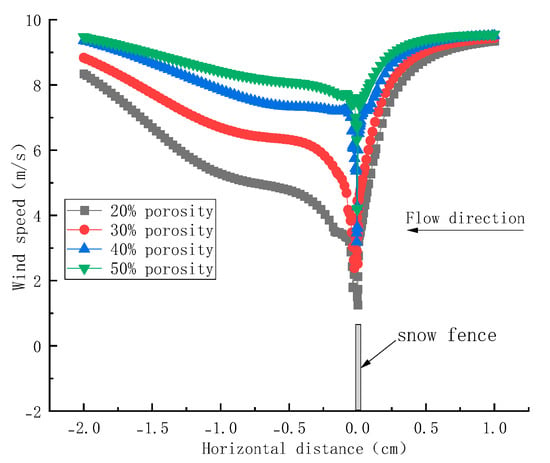
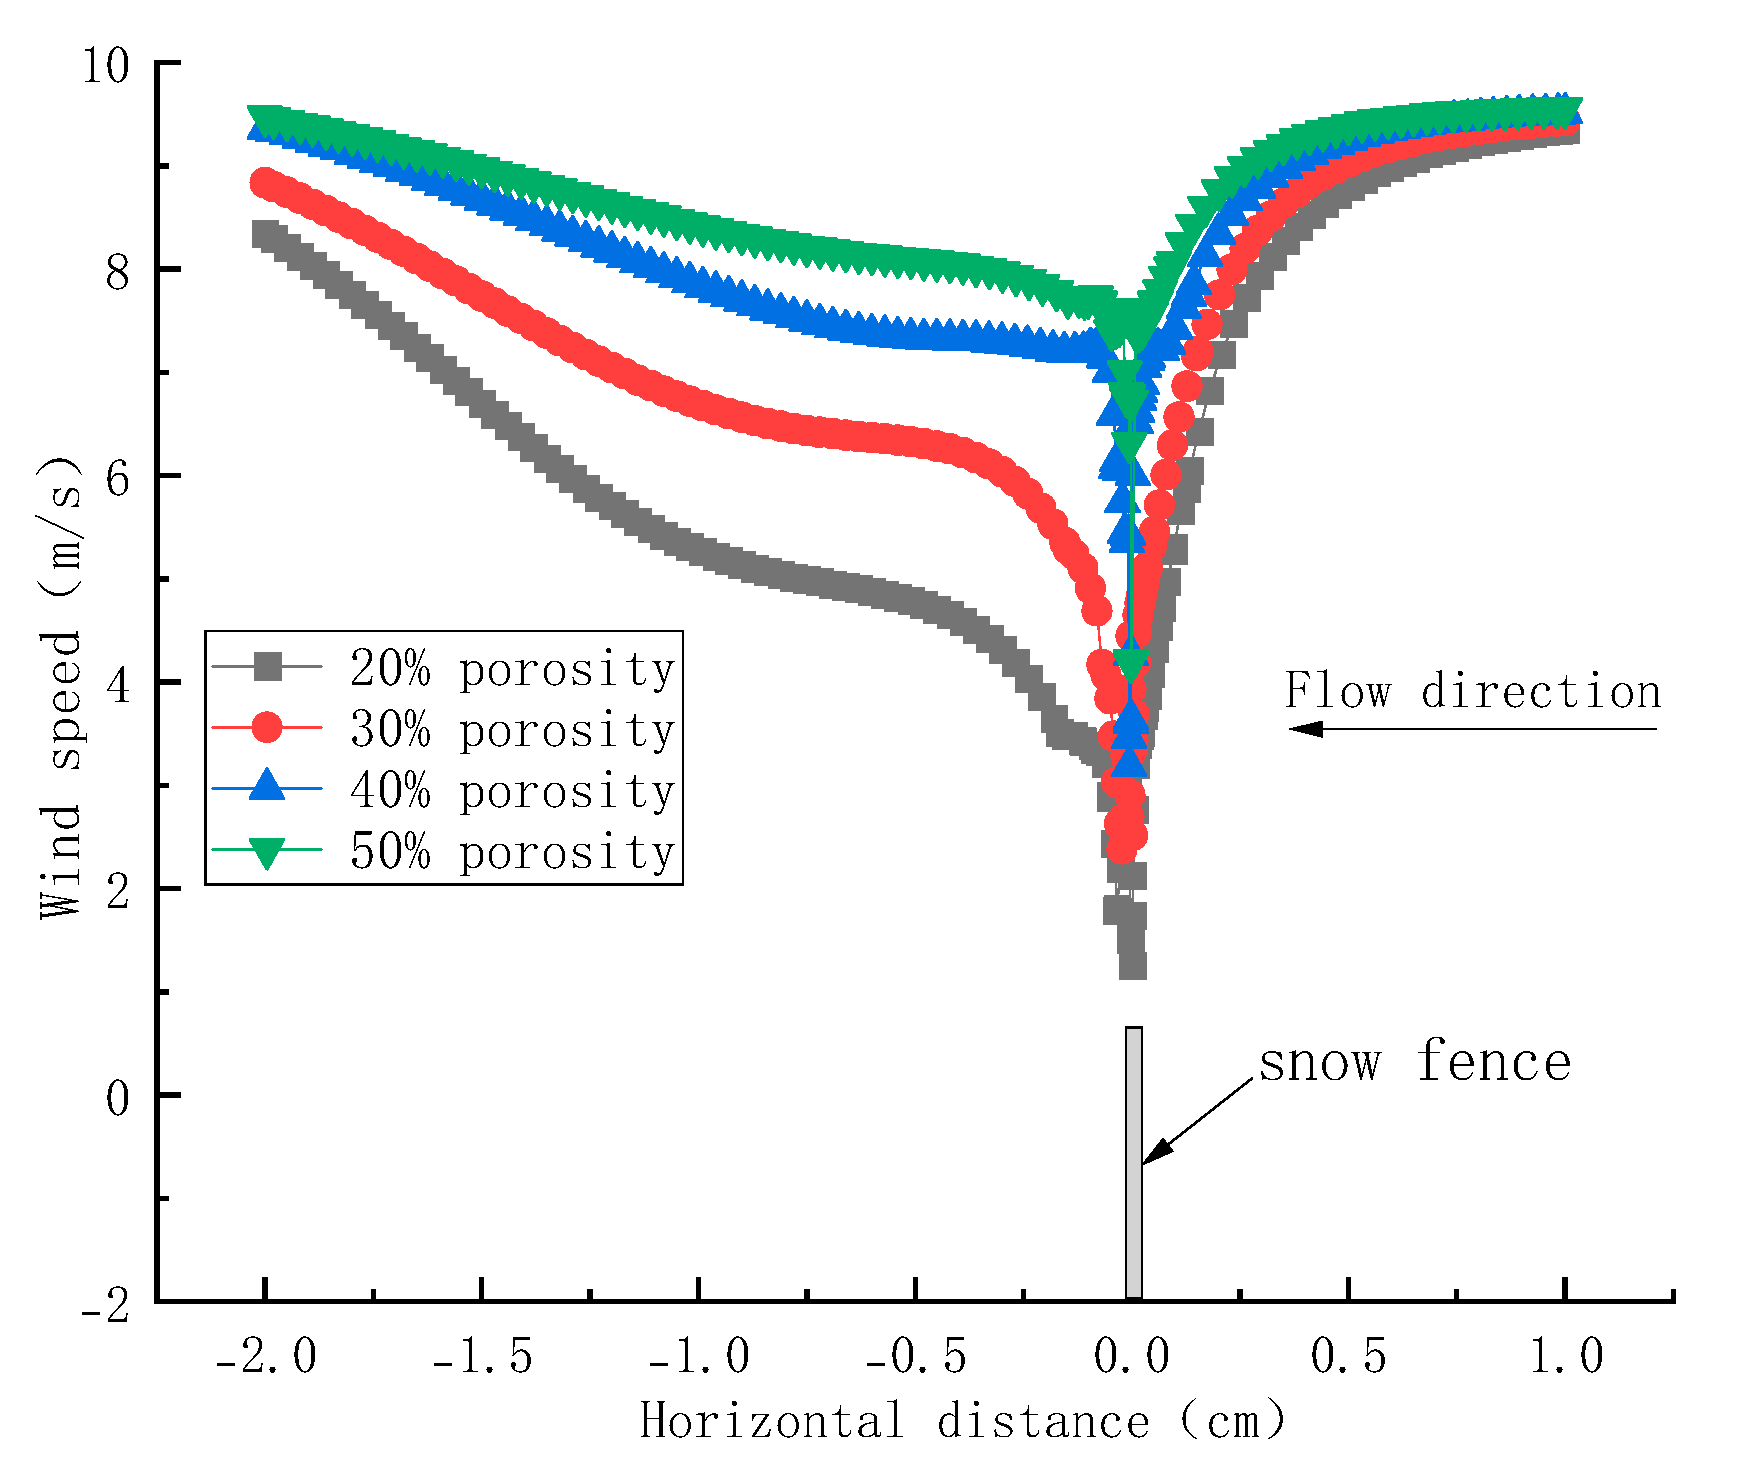
The porosity of the snow fence is defined as the ratio of the open area to the total projected surface area. Figure 21 and Figure 22 illustrate the wind velocity contours and horizontal wind speed profiles corresponding to snow fences with varying porosities, under specified configurations where the bottom gap (d) is 2 cm, and the fence height (H) is 20 cm.
Figure 21.
Wind velocity contours for snow fences with different porosities.
Figure 22.
Horizontal wind velocity profiles for snow fences with different porosities.
Observations indicate that the general trends of wind velocity distribution demonstrate consistent evolutionary patterns across varying porosity conditions. Specifically, when the porosity is ≤40%, the wind velocity within the leeward region exhibits a monotonic increase. Conversely, when the porosity exceeds the 40% threshold, the variations in leeward wind speed become less pronounced, indicating a reduced sensitivity of the airflow response to further increments in porosity.
Notably, the snow fence with 20% porosity exerts the most pronounced perturbation on the leeward wind field. An aerodynamic attenuation zone extending approximately 1 m is observed downstream, followed by a rapid velocity recovery at a distance of 1.5 m from the fence. In contrast, for porosities of 30%, 40%, and 50%, the wind speed reduction within the leeward region is comparatively tempered. As the porosity increases, the vortex architecture undergoes a structural transition from localized, high-intensity interactions to larger-scale, attenuated influences. Consequently, the center of the leeward vortex zone exhibits a progressive downstream migration, leading to a commensurate increase in the distance required for wind speed recovery.
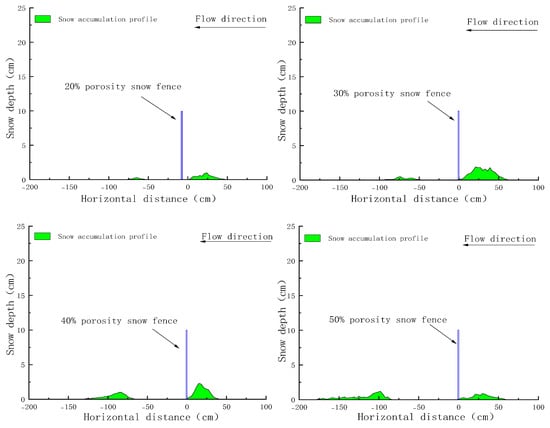
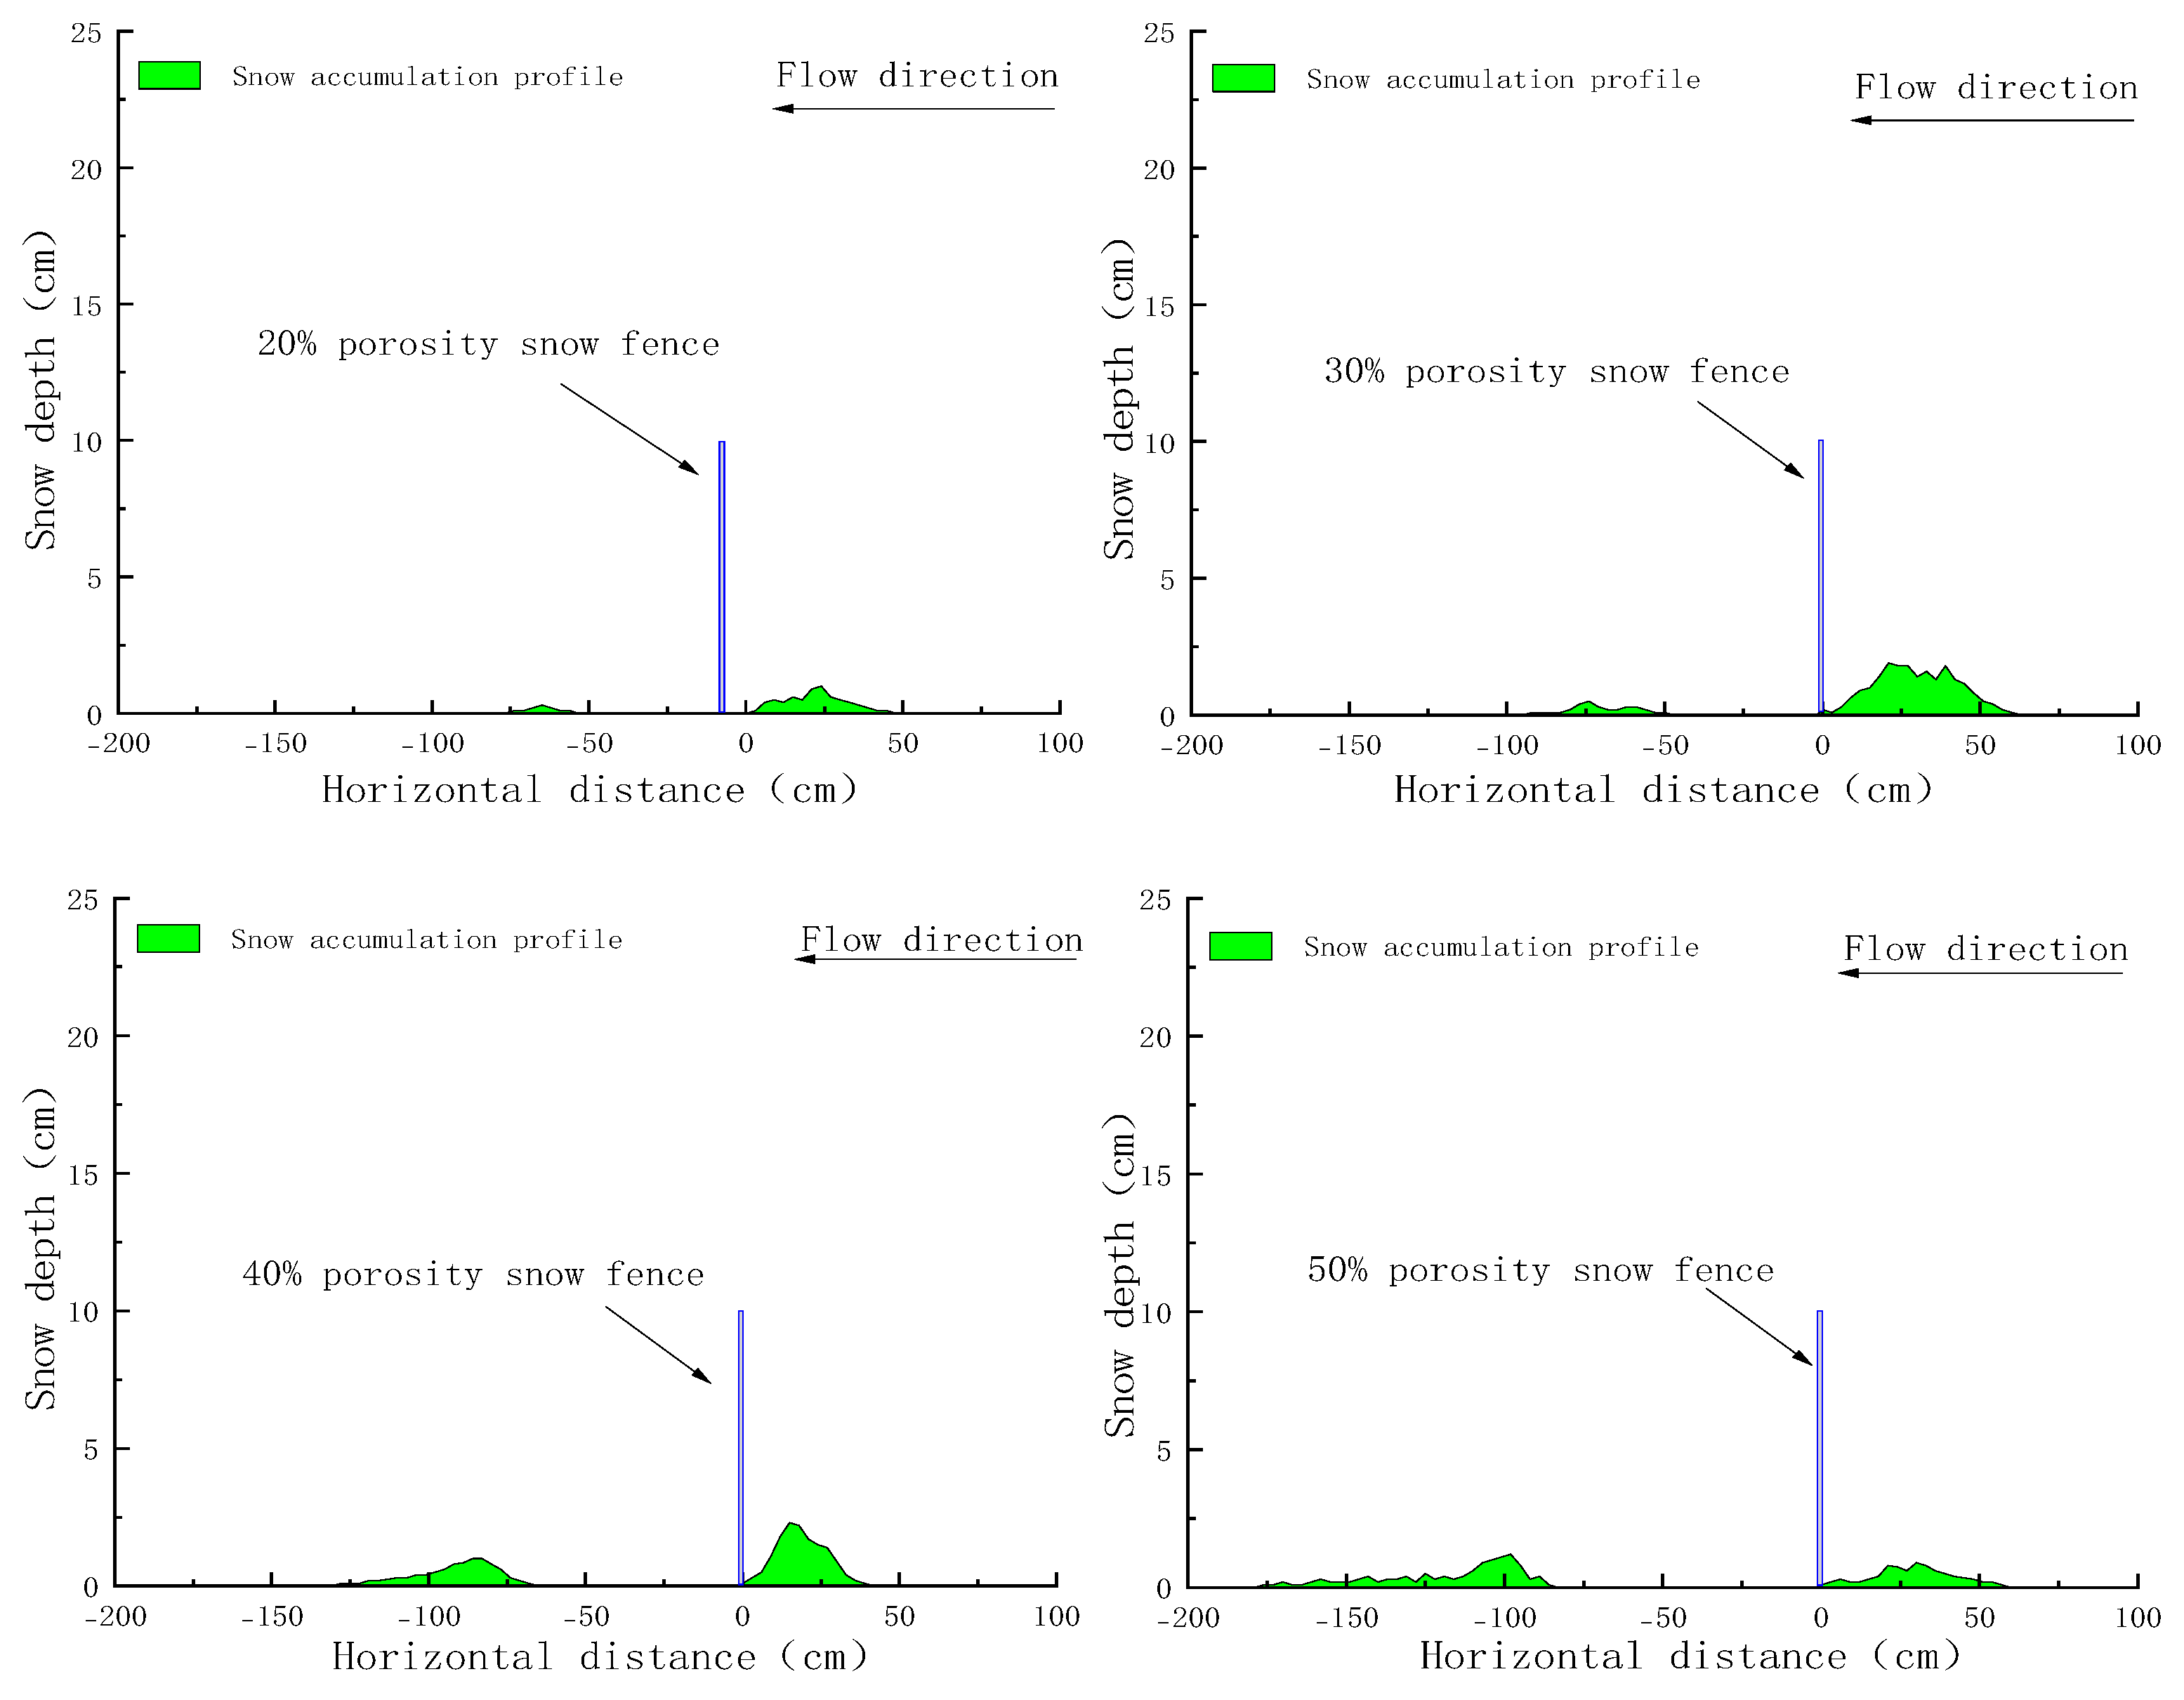
Figure 23 illustrates the snow distribution patterns for snow fences associated with varying porosities. Observations indicate that at a porosity of 20%, snow accumulation initiates at a distance of 53 cm behind the fence and terminates at 74 cm, resulting in a total snow coverage range of approximately 74 cm (3.7H). Similarly, as the porosity increases to 30%, 40%, and 50%, the longitudinal extent of snow coverage exhibits a progressive expansion, reaching 92 cm (4.6H), 128 cm (6.4H), and 176 cm (8.8H), respectively.
Figure 23.
Snow accumulation profiles for snow fences with different porosities.
This conclusion is consistent with the findings of recent studies [29]. These results indicate that concomitant with an increase in porosity, the fluctuations in the snow distribution profile become less pronounced—characterized by an increasingly flattened morphology—while the spatial extent of snow deposition expands significantly. Consequently, it is imperative to increase the snow storage distance on the leeward side in engineering designs. This adjustment ensures that the road infrastructure is positioned at a sufficient distance from the fence to circumvent the low-velocity zone where snow accumulation typically occurs.
7. Research Limitations
This study systematically investigates wind-blown snow hazards and snow fence parameter optimization through an integrated approach combining wind tunnel experiments, numerical simulations, and field observations, providing valuable theoretical support and engineering references. However, constrained by the complexity of natural environments, limitations of experimental conditions, and inherent characteristics of research methods, this study still has the following shortcomings that require further improvement in subsequent research:
(1) The wind tunnel tests adopted a 1:100 scaled 3D-printed terrain model. While it reproduces the core topographic features of the deep cutting valley section at K61+980 of the G577 highway based on similarity principles, complex mountain microtopography (e.g., local undulations, scattered vegetation) was reasonably simplified. Despite the scaling ratio falling within the optimal 1:50–1:200 interval, scale effects may still induce deviations in simulating fine-scale turbulence of wind–snow flow near cutting slopes. Additionally, sawdust, selected as the snow simulant for its similarity to natural snow in key physical parameters (e.g., internal friction angle, density), cannot fully replicate natural snow’s dynamic evolution (e.g., crystal metamorphism, cohesion fluctuations, freeze–thaw cycles), which may compromise the precision of snow accumulation morphology simulation.
(2) The ANSYS Fluent-based gas–solid two-phase flow model idealizes snow particles as cohesive spheres and treats them as a continuous pseudo-fluid phase. While the Eulerian multiphase model describes their transport, mesoscopic behaviors of natural snow particles (e.g., collision, fragmentation, adhesion) were not fully accounted for. The Realizable k − ε turbulence model effectively characterizes complex flow separation and vortices but may underestimate energy loss from local strong vortices in deep cuttings. Moreover, the inlet wind velocity profile, defined by a power-law function for atmospheric boundary layer distribution, fails to reflect natural wind’s transient characteristics (e.g., gust pulsations, direction deflection) or the dynamic coupling between wind fields and snow evolution, nor does it consider snow particles’ feedback on airflow.
(3) Limitations of field observation scope and duration: Field data were primarily collected from the G577 highway’s valley-bridge transition section (K62+000–K63+600), featuring a northern Tianshan arid continental climate and V-shaped valley terrain. Generalizability to mountainous highways in other climate zones (e.g., maritime snowfall regions) or topographic types (e.g., U-shaped valleys, plateau cuttings) remains to be verified. Additionally, observations focused on typical winter snowfall periods, lacking long-term continuous monitoring under extreme events (e.g., abnormal heavy snow, persistent strong winds), which hinders comprehensive characterization of interannual variations and extreme-scenario evolution of wind-blown snow hazards.
(4) Narrow research scope of snow fence parameters: Snow fence optimization experiments adopted a single-factor design to explore the effects of porosity, height, and bottom gap on wind–snow flow, but synergistic coupling effects among multiple parameters (e.g., high porosity combined with large bottom gaps) were not explored.
(5) Neglect of wind-blown snow’s dynamic evolution: This study focuses on steady-state characteristics of wind–snow flow fields and snow accumulation, analyzing final snow morphologies and flow distributions under different cutting depths and fence parameters. However, transient evolutionary processes (e.g., rapid accumulation from short-term strong winds, secondary snowfall from snowmelt-refreezing, dynamic balance of snow particle erosion-transport-deposition) were not addressed. Additionally, long-term impacts of repeated wind-blown snow events on snow fence durability and protective efficiency, as well as interaction mechanisms between snow accumulation and roadbed stability or pavement skid resistance, remain underexplored and require targeted future research.
8. Conclusions
In this study, the dynamics of wind-blown snow flow were investigated through an integrated approach combining wind tunnel experiments and numerical simulations (Ansys Fluent). The research focused on the influence of varying road cutting depths and critical snow fence parameters on mountainous highway sections under small yaw angle conditions. Specifically, the wind velocity distributions and snow accumulation morphologies across multiple spatial positions within the cutting were quantitatively analyzed. The primary conclusions derived from this investigation are summarized as follows:
(1) For deep cuttings on mountainous highways, an increase in cutting depth induces a progressive expansion of the internal airflow deceleration zone. While snow accumulation area increases gradually for cutting depths ≤ 25 m, a critical transition occurs at 30 m, where wind speed attenuation and the resultant deceleration zone reach their maximum magnitude. This leads to severe accumulation encompassing nearly the entire road surface. Consequently, these findings suggest that for cutting depths exceeding 25 m, it is imperative to enhance snow protection designs or implement targeted engineering mitigation measures.
(2) The introduction of a bottom gap (d) progressively attenuates the windward vortex effect while inducing an expanding basal acceleration zone due to flow constriction. On the leeward side, the development of larger and more numerous vortices facilitates a wider dispersal of snow particles. This aerodynamic transition shifts the onset of snow accumulation further downstream and results in a gentler accumulation profile. Consequently, it is recommended to increase the snow storage distance between the fence and the road. Specifically, for bottom gaps of 0.2 m, 0.3 m, 0.4 m, and 0.5 m, the minimum safety storage distances are optimized at 4H, 6H, 6H, and 7H, respectively.
(3) The aerodynamic attenuation behind the snow fence is pronounced, with leeward wind velocities decreasing progressively as fence height (H) increases. This trend induces an expansion of the vortex structure, yielding a corresponding increase in the snow deposition range by approximately 5▲H. Additionally, observations indicate that the effective vertical domain of wind speed influence above the fence extends to approximately 1H.
(4) Snow fence porosity, defined as the ratio of open area to total projected area, significantly modulates leeward aerodynamics. While wind velocity behind the fence increases monotonically for porosities ≤40%, the variations in wind speed become less pronounced beyond this threshold. Increasing porosity induces a downstream migration of the leeward vortex center and a progressive extension of the flow reattachment distance. Consequently, to maintain structural safety and efficiency, the recommended snow storage distances for porosities of 20%, 30%, 40%, and 50% are optimized at 4H, 5H, 7H, and 9H, respectively.
Author Contributions
Conceptualization, J.L., R.L., F.W. and Z.H.; methodology, J.L., R.L., H.T., F.W. and Z.H.; software, H.T., R.L. and F.W.; validation, H.T., R.L. and F.W.; formal analysis, H.T. and R.L.; investigation, J.L., R.L., F.W. and Z.H.; resources, J.L. and Z.H.; data curation, R.L. and F.W.; writing—original draft preparation, J.L. and R.L.; writing—review and editing, J.L., R.L., H.T. and H.X.; visualization, R.L.; supervision, F.W. and H.X.; project administration, J.L., H.T., F.W. and Z.H.; funding acquisition, J.L., H.T. and Z.H. All authors have read and agreed to the published version of the manuscript.
Funding
This research was funded by China Railway City Investment Development Group Co., Ltd. (Research on the Popularization and Application of Key Technologies for Construction and Maintenance of High-grade Highways in High-cold and Heavy-snow Mountainous Areas of the Tianshan Mountains, grant number Yili Changyue-Jiangguan-13-2023-14); and Xinjiang Transportation Science Research Institute Co., Ltd. (Research Project on Snow Disaster Prevention and Control Technologies for Highways in High-cold and High-altitude Mountainous Areas, grant number 2023-KT-23).
Institutional Review Board Statement
Not applicable.
Informed Consent Statement
Not applicable.
Data Availability Statement
Data are contained within the article.
Conflicts of Interest
Author Haojie Tang was employed by the company China Railway City Investment Development Group Co., Ltd. Ruixin Liu, Jian Liu, Fenglong Wang and Zhixuan Hu are employees of Xinjiang Transportation Research Institute Co., Ltd. This paper reflects the views of the authors alone and does not represent those of the institute.
References
- Wang, Z.L. Study on snow cover, wind-blown snow and avalanches in China. J. Glaciol. Geocryol. 1988, 273–278. [Google Scholar]
- Wang, Z.L. Study on snow hazards and their prevention and control in China. J. Mt. Sci. 1983, 22–31, 65–66. [Google Scholar]
- Hu, R.J. Study on snow cover, snow hazards and their prevention in the Tianshan Mountains of China. Xinjiang Geogr. 1978, 84–98. [Google Scholar]
- Wang, X.; Liu, J.; Guo, Q.; Wang, B.; Yang, Z.; Cheng, Q.; Xie, H. Avalanche Hazard Dynamics and Causal Analysis Along China’s G219 Corridor: A Case Study of the Wenquan-Khorgas Section. Atmosphere 2025, 16, 817. [Google Scholar] [CrossRef] [Scilit]
- Kobayashi, S.; Ishikawa, N.; Ohata, T. Katabatic snow storms in stable atmospheric conditions at Mizuho Station, Antarctica. Ann. Glaciol. 1985, 6, 229–231. [Google Scholar] [CrossRef] [Scilit]
- Ma, G.S.; Huang, N. Study on the threshold wind speed of snow drifting. J. Lanzhou Univ. (Nat. Sci.) 2006, 42, 130–134. (In Chinese) [Google Scholar]
- Delpech, P.; Palier, P.; Gandemer, J. Snowdrifting simulation around Antarctic Buildings. J. Wind Eng. Ind. Aerodyn. 1998, 74–76, 567–576. [Google Scholar] [CrossRef] [Scilit]
- Lü, X.; Huang, N.; Tong, D. Wind tunnel experiments on natural snow drift. Sci. China Technol. Sci. 2012, 5, 927–938. [Google Scholar] [CrossRef] [Scilit]
- Li, P.X.; Bai, M.Z.; Ding, L.S.; Qiu, S.M. Study on the characteristics of railway blowing snow based on indoor and outdoor wind tunnel tests. J. Cent. South Univ. 2022, 53, 3245–3258. (In Chinese) [Google Scholar]
- Ma, W.Y.; Li, J.L.; Sun, Y.C.; Li, S.; Bai, J.F. Tests and simulation for evolution process of wind-induced cutting snow accumulation. J. Vib. Shock. 2023, 42, 284–292. (In Chinese) [Google Scholar]
- Beyers, J.; Sundsbø, P.; Harms, T. Numerical simulation of three-dimensional, transient snow drifting around a cube. J. Wind Eng. Ind. Aerodyn. 2004, 92, 725–747. [Google Scholar] [CrossRef] [Scilit]
- Liang, S.; Ma, X. Study on the relationship between embankment cross-section form and snow drifting disaster. In Proceedings of the International Conference on Snow Engineering, Sapporo, Japan, 6–9 June 2010. [Google Scholar]
- Li, H.F.; Hu, S.Y.; Liu, Q. Numerical study on the influence of slope and snow-fence on the flow field around embankment. In Proceedings of the International Conference on Wind Engineering, Beijing, China, 1–5 September 2021. [Google Scholar]
- Li, P.X. Research on the Formation Mechanism and Prevention Technology of Wind-Blown Snow Hazards on the Afuzhun Railway. Ph.D. Thesis, Beijing Jiaotong University, Beijing, China, 2019. (In Chinese) [Google Scholar]
- Voordendag, A.; Goger, B.; Prinz, R.; Sauter, T.; Mölg, T.; Saigger, M.; Kaser, G. A novel framework to investigate wind-driven snow redistribution over an Alpine glacier: Combination of high-resolution terrestrial laser scans and large-eddy simulations. Cryosphere 2024, 18, 849–868. [Google Scholar] [CrossRef] [Scilit]
- Maimait, A.; Wang, Y.; Lei, J.; Chen, D.; Zhang, R.; Cheng, J. Prevention and Control of Wind-Sand and Wind-Snow Compound Disasters Along Railways Based on Wind Tunnel Testing and Numerical Simulations. Sustainability 2025, 17, 10356. [Google Scholar] [CrossRef] [Scilit]
- JTG/T D60-01-2004; Code for Wind-Resistant Design of Highway Bridges. Ministry of Transport of the People’s Republic of China: Beijing, China, 2004. (In Chinese)
- Zou, Y.F.; Yue, P.; Zhou, S.; He, X.; Wang, Z. Wind tunnel experimental study on wind field characteristics at a bridge site in a deep-cut canyon of a plateau. J. Cent. South Univ. (Sci. Technol.) 2022, 53, 2533–2543. (In Chinese) [Google Scholar]
- Ma, L.; Liu, J.; Ran, W.P.; Hu, Z.; Li, Z.; Yu, X. Wind tunnel experimental study on wind-blown snow prevention gallery for highways. J. Glaciol. Geocryol. 2022, 44, 726–734. (In Chinese) [Google Scholar]
- Peng, G.; Li, H.; Liu, Z.; Zhang, Z.; Yan, Y. The mechanism and design optimization of snowdrift disaster prevention and control by the wind deflector of the roadside Guardrail. Int. J. Transp. Sci. Technol. 2026, in press. [Google Scholar] [CrossRef] [Scilit]
- Zhang, Y.; Dehkordi, R.H.M.; Kholoud, J.M.; Hamidreza, A.; Li, Z.; Mohammad, A. Numerical modeling of the temperature distribution and melt flow in dissimilar fiber laser welding of duplex stainless steel 2205 and low alloy steel. Opt. Laser Technol. 2024, 174, 110575. [Google Scholar] [CrossRef] [Scilit]
- Hazar, C.; Toz, A.C. Numerical and experimental simulation on efficiency of air bubble barrier on various pollutants for preventing oil spill spread. Mar. Pollut. Bull. 2024, 201, 116254. [Google Scholar] [CrossRef] [Scilit]
- Zhou, X.Y.; Kang, L.Y.; Gu, M.; Qiu, L.; Hu, J. Numerical simulation and wind tunnel test for redistribution of snow on a flat roof. J. Wind Eng. Ind. Aerodyn. 2016, 153, 92–105. [Google Scholar] [CrossRef] [Scilit]
- Tominaga, Y.; Okaze, T.; Mochida, A. CFD modeling of snowdrift around a building: An overview of models and evaluation of a new approach. Build. Environ. 2011, 46, 899–910. [Google Scholar] [CrossRef] [Scilit]
- Nara, R.; Groth, C.; Biancolini, M.E. Numerical Simulation of Snowdrift Development in Non-Equilibrium Flow Fields Around Buildings. Fluids 2025, 10, 75. [Google Scholar] [CrossRef] [Scilit]
- Liu, J.; He, Z.; Wang, Y.; Wang, F.; Yang, Z. Optimizing subgrade design for blowing snow prevention: A CFD-based parametric study. Front. Earth Sci. 2025, 13, 1720538. [Google Scholar] [CrossRef] [Scilit]
- Li, P.X.; Bai, M.Z.; Qiu, S.M.; Li, J.X. Study on the effectiveness of snow fences for wind-blown snow control in railway cutting areas. J. Harbin Inst. Technol. 2022, 54, 122–130. [Google Scholar]
- Qiu, S.; Bai, M.; Lin, D.; Xia, H.; Tang, Z. Study on the Evolution Process of Snow Cover in Wind-Induced Railway Embankments and the Control Effect of Snow Fences. Appl. Sci. 2025, 15, 6057. [Google Scholar] [CrossRef] [Scilit]
- Zhang, Z.; Ma, W.; Li, Q.; Si, C.; Li, S. Field Measurements and Predictions of Snow Distribution around Horizontal-Slat Snow Fences. Transp. Res. Rec. J. Transp. Res. Board 2024, 2679, 939–951. [Google Scholar] [CrossRef] [Scilit]

Disclaimer/Publisher’s Note: The statements, opinions and data contained in all publications are solely those of the individual author(s) and contributor(s) and not of MDPI and/or the editor(s). MDPI and/or the editor(s) disclaim responsibility for any injury to people or property resulting from any ideas, methods, instructions or products referred to in the content. |
© 2026 by the authors. Licensee MDPI, Basel, Switzerland. This article is an open access article distributed under the terms and conditions of the Creative Commons Attribution (CC BY) license.