


Abstract
Terminal lakes are crucial to maintaining ecological balance in arid and semi-arid regions. However, these lakes are increasingly facing severe ecological degradation due to human activities and climate change. This study aims to provide a sustainable management solution for ecological security by determining the suitable water surface area of terminal lakes. We selected eight major terminal lakes in Xinjiang, including Bosten Lake, Lake Ebinur, Lake Ailik, Manas Lake, and Lake Ayding, and analyzed the changes in water surface area over the past 30 years. This research proposes a new method based on ecosystem safety demands to assess the minimum ecological water levels required to maintain the health of these lakes. The study utilizes remote sensing images, ecological security assessments, and hydrological data to analyze the water surface changes, vegetation growth, and ecological health of these lakes. Main findings include the following: (1) The water surface area of most lakes fluctuates significantly, with Bosten Lake maintaining a water surface area between 920 and 1100 km2, while Lake Ebinur decreased sharply from 884 km2 in 2003 to 350 km2 in 2022. (2) The proposed method calculates the suitable water surface area for each lake, ranging from 25 km2 (Lake Ayding) to 1050 km2 (Bosten Lake). (3) The proposed method provides precise recommendations that can maintain ecological stability while optimizing water resource usage. (4) Some of the findings have already been adopted by local government departments and are applied to water resource management in Xinjiang. This study provides a new approach for defining a suitable water surface area based on ecological security demands and offers valuable insights for the sustainable management of terminal lakes in arid regions.
1. Introduction
With global population growth and the intensification of climate change [1], the rational use of water resources has become an urgent issue in many arid and semi-arid regions [2]. This problem is particularly prominent in Xinjiang, which is an important water resource and agricultural production area in China [3,4]. As natural reservoirs of water resources and ecological functional zones [5,6], terminal lakes play a crucial role in regulating regional ecological stability and water resources. However, due to climate change [7] and excessive human exploitation of water resources [8]—primarily driven by extensive agricultural irrigation systems and the export of virtual water embodied in agricultural products—many terminal lakes are facing ecological degradation [9] and rapid depletion of water resources [10]. It is therefore urgent to propose more scientific definitions and management strategies for ecological conservation and water resource utilization of these lakes [11].
Terminal lakes refer to lakes formed in the low-lying areas of desert plains after rivers originating in mountains flow through oases. Geographically, these lakes are located at the ends of watersheds, usually where rivers cannot flow out. Xinjiang is one of the regions with the widest distribution of lakes in China, with more than 130 natural lakes, many of which are terminal lakes (also known as endorheic lakes). Major terminal lakes in Xinjiang include Lake Chaiwopu, Lake Ailik, Lake Barkol, Lake Manas, Lake Ulungur, Lake Bosten, Lake Ayding, Lake Ebinur, and Lake Taitema. These terminal lakes not only regulate hydrological cycles [12] and prevent sandstorms from encroaching on oases [13], but also play a vital role in maintaining ecosystem [14]. Most of these water bodies are located in a complex geographic system of mountains–oases–deserts [15], and their surface areas are crucial for sustaining local ecosystems [16]. Changes in water sources, especially fluctuations in lake water levels, directly affect surrounding wetland ecosystems, which are internationally recognized as crucial breeding grounds and Ramsar-conservation spots for migratory birds navigating transcontinental flyways [17,18,19]. However, with the intensification of climate change and human activities, the surface areas of these lakes have undergone significant changes [20], posing great challenges to their ecological functions.
In recent years, as demand for water resources has increased [21], Xinjiang’s terminal lakes have experienced varying degrees of shrinkage and degradation [10]. For example, Lake Chaiwopu once reached 30 km2 in the 1980s, and its maximum area reached 33.5 km2 in 1996. However, since entering the 21st century, its surface area has shrunk year by year, at one point reducing to just 0.18 km2. Similarly, lakes such as Ailik and Manas have also experienced varying degrees of surface changes, alternating between desiccation and recovery [22]. These changes are mainly caused by the combined effects of climate change, excessive water resource exploitation, and the construction of hydraulic projects [23]. For a long time, the suitable lake area and ecological water level of Xinjiang’s lakes have mainly been determined through hydrological models and hydraulic analyses [24,25]. While advanced ecohydrological models (e.g., habitat suitability curves) integrate precise ecological thresholds, they require extensive species-specific data often unavailable for remote arid lakes. Consequently, local management has traditionally relied on basic hydraulic analyses, which struggle to operationalize the holistic spatial areas needed to maintain landscape-scale ecosystem stability [26,27].
To address these challenges in water resource management for Xinjiang’s terminal lakes, this study aims to determine suitable lake surfaces and ecological water levels through more scientific approaches. The core goal is to propose a new method for defining lake areas based on ecological security requirements, reverse-engineering the suitable lake surface necessary to maintain ecosystem stability. This approach not only enables a scientific delineation of lake surface ranges but also provides decision-making support for improving water-use efficiency and ensuring ecological security. Specifically, the study includes the following aspects: (1) Analysis of ecosystem evolution in terminal lakes: using remote sensing imagery data and feasible methods, we analyze changes in lake surface areas over the past 30 years and their relationship with ecological factors, revealing the patterns and drivers of lake surface change. (2) Construction and evaluation of an ecological security index system: based on landscape ecology theory and the entropy weight method, we establish an index system suitable for assessing the ecological security of terminal lakes in arid regions, and quantify interannual changes in ecological security. (3) Calculation of suitable lake surface and ecological water demand: on the basis of ecosystem security assessment, we calculate the suitable lake surface needed to maintain ecological security for each lake, and estimate ecological water demand, providing a scientific basis for water resource management. (4) Protection strategies and recommendations for terminal lakes: considering the current state of lake protection, we propose practical measures to promote ecological conservation and efficient use of water resources.
Through the lake surface delineation method based on ecosystem security, the study can scientifically define suitable water surface ranges, avoiding water resource waste caused by blindly pursuing “larger water surfaces.” Furthermore, the proposed quantitative relationship between ecological water levels and surface changes offers theoretical support for future water resource allocation under different climate change scenarios. The results of this research have significant practical implications for promoting ecological conservation and water resource management of Xinjiang’s terminal lakes. These lakes not only occupy an important position in regional ecosystems but their water levels and surface changes directly affect oasis agriculture and biodiversity. Therefore, scientifically sound water allocation can not only help ensure ecological security but also promote sustainable socio-economic development, supporting regional food security and water resource utilization.
2. Materials and Methods
2.1. Study Area
The Xinjiang Uygur Autonomous Region, located in northwestern China, represents a typical arid zone (Figure 1). It covers an area of approximately 1.66 × 10⁶ km2 and exhibits pronounced geographical diversity, encompassing mountains, river valleys, oases, and deserts. Terminal lakes in Xinjiang are primarily distributed along the southern foothills of the Tianshan Mountains, within the Tarim River Basin, and its surrounding regions. Serving as natural reservoirs of regional water resources, these lakes play a critical role in hydrological regulation and ecological protection. Among the major terminal lakes in Xinjiang are Lake Bosten, Lake Ailik, and Lake Manas, each possessing significant ecological and water regulation functions. The selection of these specific lakes was based on three main criteria: (1) they are representative terminal lakes (endorheic lakes) within major inland river basins in Xinjiang; (2) they have experienced significant ecological and hydrological variations over the past 30 years; and (3) there is a continuous and reliable availability of long-term remote sensing and meteorological data to support historical ecological security assessments. Lake Bosten, situated in the Yanqi Basin, is the largest freshwater lake in Xinjiang. It provides essential services such as water quality purification and ecological maintenance. Lake Ailik, the terminal lake of the Baiyang River Basin, is characterized by considerable surface area fluctuations due to unstable water inflows. Although water diversion projects in recent years have partially restored its surface area, the lake continues to face pressures from water scarcity and ecological degradation.
Figure 1.
Spatial distribution of the river systems and seven terminal lakes in Xinjiang, China.
The terminal lakes of Xinjiang face a common challenge of water scarcity, particularly in arid and semi-arid regions. Fluctuations in lake water levels are influenced not only by climate change but also by excessive regional exploitation of water resources, agricultural irrigation, and reservoir construction. Lakes such as Bosten and Ailik have experienced significant declines in water levels, with some lakes even approaching the risk of desiccation. As climate change and human activities intensify, the ecological pressures on these lakes continue to mount. In response, local governments and research institutions in Xinjiang have initiated a series of water resource management and ecological restoration measures aimed at maintaining lake levels within a reasonable range, thereby ensuring the stability and sustainability of lake ecosystems.
To provide a comprehensive overview of the environmental and socio-economic contexts of these watersheds, the general characteristics of the nine major terminal lakes—including their elevation, water salinity type, catchment size, and estimated basin population—are summarized in Table 1.
Table 1.
General characteristics of the nine major terminal lakes and their catchments in Xinjiang.
2.2. Theoretical Framework
Landscape ecology emphasizes the relationship between ecosystem structure and function, proposing that at the landscape scale, ecosystems are composed of patches, corridors, and matrices. The rational configuration of these elements enhances overall ecological performance [28,29]. This theoretical perspective provides critical support for constructing and optimizing regional ecological security patterns. In the context of terminal lake research, this implies that maintaining stability should not rely solely on sustaining large water surface areas. Instead, ecological integrity and efficiency can be achieved through the coordinated configuration of water bodies, wetlands, and vegetation [30,31].
In addition, the panarchy concept and ecological resilience framework proposed by Holling (2001) [32], alongside the theory of multiple stable states suggests that ecosystems may exhibit different equilibrium states under the same external conditions. Their structures and functions can undergo abrupt shifts when subjected to disturbances, leading to the establishment of a new equilibrium [33]. Such regime shifts are often sudden and irreversible; however, the newly formed state may persist over the long term. For terminal lakes, reductions in surface area or fluctuations in water level may drive the ecosystem toward a new stable state. Consequently, restoring historical water levels is not necessarily a reasonable management goal. While formal statistical regime-shift detection (e.g., BFAST or Pettitt tests) is beyond the scope of this methodological framework, the multiple stable states theory serves as our fundamental management philosophy: a more scientifically grounded approach is to maintain ecological security and functional stability within the new equilibrium state, rather than forcing the system back to an unattainable historical baseline. A more scientifically grounded approach is to maintain ecological security and functional stability within the new equilibrium state.
2.2.1. Conceptual Definitions
The lake surface refers to the area within a lake basin that is covered by water. At the annual scale, this study adopts the concept of the effective lake surface to represent lake area. The effective lake surface is defined as the portion of the lake that remains water-covered for at least seven months in a year [27], hereafter referred to simply as the lake surface. Determining the size of the lake surface involves two aspects: identifying the minimum lake surface and the suitable lake surface [28]. The minimum lake surface denotes the ecological “red line” water level required to meet the most basic needs of the lake ecosystem. Common methods for estimating this threshold include morphometric analysis, the minimum spatial requirement of aquatic organisms, annual assurance rate methods, and lowest annual mean water level approaches. While maintaining the minimum ecological water level may temporarily prevent severe damage to the structure and function of the lake ecosystem, sustaining it over the long term often results in ecosystem degradation or even collapse. The suitable lake surface, by contrast, refers to the optimal water area necessary to preserve the structural stability and biodiversity of the lake ecosystem [34,35,36]. It ensures the long-term and sustainable health of lake ecosystems [28].
In Xinjiang, the conflict between economic water use and ecological water demands is particularly acute. Defining the suitable lake surface thus requires balancing both ecological security and efficient water use. Under conditions of declining inflows, all nine terminal lakes in Xinjiang have experienced ecological degradation or face ecological threats. For example, Lake Manas and Lake Ayding have been desiccated for extended periods or remain permanently dry; Lake Chaiwopu and Lake Ailik, though partially restored after episodes of desiccation, have seen water quality deteriorate from Class I to Class V or VI, where it has remained for extended durations. Lake Ulungur and Lake Bosten face risks of increased mineralization or organic matter content, while the shrinkage of Lake Ebinur has exposed saline soils that have evolved into sources of salt-dust storms [37]. Addressing these ecological issues—or preventing their further deterioration—constitutes the key objective of protecting Xinjiang’s nine terminal lakes. Based on the dual requirements of ecological protection and efficient water use, and in light of the specific conditions and ecological problems of each lake, this study defines the suitable lake surface as follows: (1) A lake surface that maintains the long-term, rather than short-term, health of the lake ecosystem. (2) A lake surface that sustains the new ecological equilibrium established over the past three decades under external disturbances. (3) A lake surface that balances ecological protection with efficient water use. (4) A lake surface that aligns with the current key conservation objectives of each lake.
2.2.2. Research Design
Addressing the challenge that excessively small lake surfaces render ecosystems insecure and unstable, while overly large surfaces result in inefficient ecological water use, this study adopts an integrative approach. The framework prioritizes both efficient water utilization and the maintenance of structural stability and functional integrity of lakes. Building on the concepts of the “suitable lake surface” and drawing upon landscape ecology and multiple stable state theory, a reverse-tracing methodology is employed. First, supported by remote sensing imagery (e.g., Landsat data available since the 1980s, and Sentinel-2 imagery available since 2015) along with meteorological, hydrological, and soil monitoring data, land cover information for lake basins is extracted using a combination of automated classification and human–computer interactive methods. These results, together with previous studies on lake surface dynamics in Xinjiang, are used to clarify the evolutionary trajectories of terminal lake ecosystems. Second, a comprehensive evaluation index system for lake ecological security is constructed. Using the entropy weight method, the ecological security status of each lake is quantified and classified, enabling an assessment of interannual variations in ecosystem stability. Third, the suitable lake surface is defined through a three-dimensional framework that integrates: (i) ecological security baselines, determined by referencing the lake surface areas during years when ecological security was assessed as “good” or “excellent”; (ii) water-use efficiency thresholds, quantified by calculating annual time-series data of evapotranspiration (ET) and ecological service value (ESV), and further deriving the ecological benefit of water use (i.e., ESV/ET) to identify the upper limit of water-efficient surfaces; and (iii) ecological function and conservation targets, ensuring water quality standards are met, lake morphology remains stable, saline dust sources do not form, and key species are effectively protected (Figure 2). Finally, in alignment with national and regional policies on wetland protection and sustainable development, the current status of terminal lake conservation is analyzed. Key issues and constraints are identified, and targeted strategies and recommendations are proposed to establish a long-term safeguard mechanism for maintaining the stability of lake ecosystems.
Figure 2.
Technical roadmap of research design.
2.3. Data and Methods
2.3.1. Lake Surface Extraction
At the annual scale, this study measures lake surface area using the concept of the effective lake surface, defined as the portion of a lake covered by water for at least seven months in a given year [29]. To extract this area, we applied an adaptive threshold water extraction method that combines the Normalized Difference Water Index (NDWI) with Otsu’s algorithm [38]. The data source was the Landsat Surface Reflectance (SR) dataset, encompassing all Landsat SR images covering the study area from 1 January 1990 to 31 December 2022. The workflow was as follows: Cloud-masking was first applied to the Landsat SR data in Google Earth Engine (GEE) to generate cloud-free imagery for the study area. The annual datasets were then processed using percentile compositing. The adaptive threshold extraction method, integrating NDWI with Otsu’s algorithm, was applied to the composite images to obtain monthly water distribution maps. Based on the definition of the effective lake surface, areas covered by water for seven or more months within a year were identified as effective lake surfaces (hereafter referred to simply as “lake surface”). Finally, ArcGIS 10.2 spatial analysis tools were employed to overlay and analyze the spatial data, generating the effective lake area for each year. Finally, specific ArcGIS spatial analysis tools, such as the Raster Calculator and Tabulate Area, were employed to overlay the monthly water frequency maps and calculate the precise effective lake area in square kilometers for each year.
2.3.2. Normalized Difference Vegetation Index (NDVI)
The Normalized Difference Vegetation Index (NDVI) is widely used as a proxy for vegetation coverage. It is calculated as (Rouse et al., 1974) [36], where NIR and Red are the near-infrared and red spectral bands, respectively. In this study, NDVI was employed to quantify vegetation cover in the lake basins. Values range between −1 and 1, with NDVI > 0.1 generally indicating vegetation-covered areas, while NDVI < 0.1 denotes non-vegetated surfaces. Based on this threshold, the spatial distribution of vegetation within terminal lake basins was extracted, and the vegetation-covered area was calculated, providing essential data for analyzing vegetation dynamics. The Landsat NDVI dataset was generated from Landsat Surface Reflectance data available on the Google Earth Engine (GEE) platform (https://earthengine.google.com/, accessed on 6 May 2025). The dataset, with a spatial resolution of 30 m × 30 m, has been pre-processed for radiometric calibration and atmospheric correction. For the period 1990–2022, Landsat 5/7/8 Surface Reflectance Tier 1 data were selected for each terminal lake. NDVI values were computed and aggregated annually using the Maximum Value Composite (MVC) method, resulting in a continuous annual NDVI dataset for 1990–2022.
2.3.3. Temperature Vegetation Dryness Index (TVDI)
The Temperature Vegetation Dryness Index (TVDI) was initially proposed by Sandholt et al. based on the feature space between a simplified vegetation index (NDVI) and land surface temperature (LST) to characterize surface drought conditions [39]. The theoretical value of TVDI ranges from 0 to 1, where a higher TVDI indicates more severe drought in the region, while a lower value corresponds to wetter conditions [40]. Land surface temperature (LST) data were obtained from the Google Earth Engine (GEE) platform using MODIS and Landsat datasets, with preprocessing steps such as image mosaicking and cropping performed entirely on the GEE platform.
It is effective for drought monitoring, particularly for assessing relative drought severity across a region during specific periods within a given year and can be used to study spatial variations in drought intensity. The model exhibits a strong correlation with surface soil moisture and is widely applied in remote sensing drought studies due to its straightforward formulation [41]. The TVDI calculation model is as follows:
In the formula, represents the land surface temperature; denotes the maximum land surface temperature corresponding to the same NDVI value in the two-dimensional coordinate system; denotes the minimum land surface temperature corresponding to that NDVI value.
The and are obtained by establishing the dry edge and wet edge of the NDVI-Ts feature space. The calculation formula is as follows:
where and are the coefficients of the dry-edge fitting equation, and and are the coefficients of the wet-edge fitting equation.
2.3.4. Standardized Precipitation Evapotranspiration Index (SPEI)
The original meteorological observation station data were sourced from the National Meteorological Information Center (http://data.cma.cn, accessed on 6 May 2025), with daily temperature and precipitation data selected for the period 1990–2020. Daily temperature data were averaged, and precipitation data were summed to obtain monthly values. Due to substantial data gaps at some stations, missing values of 1–2 days were replaced with the average of adjacent days; gaps longer than 2 days were filled using the multi-year average of the same calendar day from other years. Stations with more than 5% missing data were excluded, resulting in a final dataset from 80 meteorological stations.
The Standardized Precipitation Evapotranspiration Index (SPEI) reflects the degree to which drought conditions in a given period deviate from the long-term normal. A lower SPEI value indicates more severe drought. The Thornthwaite method was selected to calculate potential evapotranspiration for the SPEI index because it primarily requires historical temperature and precipitation data, ensuring a continuous long-term calculation (1990–2022) across all local meteorological stations. Conversely, the Penman–Monteith–Leuning (PML) model was specifically utilized for assessing spatial Ecological Water Consumption (ET) and Water Use Efficiency (WUE) after 2000, as it provides high-resolution spatial data incorporating aerodynamic and surface resistance parameters. Changes in precipitation and evapotranspiration are the two primary drivers of dry/wet climate patterns. SPEI integrates both precipitation and evapotranspiration and exhibits multi-scale characteristics, enabling a reasonable assessment of dry/wet variations across different time scales. The SPEI index can not only visually reflect the spatial distribution and trends of regional dryness/wetness but also capture drought variations at different temporal scales [42]. Drought itself is multi-scale in nature, and its impact on different affected systems varies with time scale [43]. The detailed steps for calculating SPEI are as follows:
The monthly potential evapotranspiration was calculated using the Thornthwaite method:
where K is the correction coefficient calculated based on latitude; T is the monthly mean temperature; I is the annual total heat index; and m is a coefficient determined by I.
The difference between monthly precipitation and potential evapotranspiration is calculated as:
where is the monthly precipitation and is the monthly potential evapotranspiration.
The three-parameter log-logistic distribution is used to fit , and its cumulative distribution function is derived as follows:
where is the scale parameter, is the shape parameter, is the origin (location) parameter, is the probability density function, is the probability distribution function.
The series is then normalized to a standard normal distribution to obtain the corresponding SPEI:
where, when P ≤ 0.5, p = F(x); when P > 0.5, p = 1 − F(x). The other parameters are: = 2.515517, = 0.802853, = 0.010328, = 1.432788, = 0.189269, = 0.001308. The SPEI index exhibits multi-time-scale characteristics (e.g., 1, 3, 6, 12, 24, 48 months). A 3-month scale SPEI reflects seasonal drought, while a 12-month scale SPEI can more clearly reveal inter-annual drought variations [44]. For ease of analysis and comparison, the 12-month scale SPEI is used in this study to examine the spatiotemporal evolution of inter-annual drought in the research region.
2.3.5. Biological Abundance Index (BAI)
The Biological Abundance Index reflects the richness or poverty of biological abundance within an evaluated area by measuring the differences in the number of biological species per unit area across different ecosystem types [45,46]. Typically, regions with high ecosystem quality exhibit high biological abundance levels, whereas low ecosystem quality indicates low biological abundance levels. The InVEST (Integrated Valuation of Ecosystem Services and Trade-offs) model, specifically its Habitat Quality module, analyzes the response degree, distribution, and degradation of habitats under different landscape patterns by integrating landscape type sensitivity and external threat intensity. Ecological threat sources refer to external disturbances that endanger the growth and development of individual organisms (such as drought and cold) and their resulting physiological effects, as well as disturbances that threaten the stability of populations, communities, and ecosystems (such as population growth, resource scarcity, and environmental pollution) [47,48]. Based on the ecological effects generated by these threats, the module calculates habitat quality, which reflects the regional biological richness, thereby enabling the quantification of biological abundance in the area. The specific calculation formula is as follows:
In the formula, represents the habitat quality of land use/cover type j (landscape class) in grid cell x; denotes the habitat suitability of landscape class j; indicates the degree of habitat degradation in grid cell x within landscape class j; K is the half-saturation coefficient; Z is an intrinsic scaling constant of the system, with a value of 2.5; R is the number of ecological threat factors; is the weight of ecological threat factor r; is the total number of grid cells that are sources of ecological threat factor r; Based on the actual conditions of the study area, this research selects certain natural factors that have a significant impact on surface landscapes as ecological threat factors. According to China’s land use classification standards and the actual conditions of the seven lakes in the study area, the landscape is divided into six broad categories: grassland, wetland, water surface, bare land, shrubland, and forest land.
The represents the maximum influence distance of the ecological threat factor r; is the number of ecological threat factors present in grid cell of landscape class j; indicates the level of legal access or reachability, reflecting the degree of protection of land resources or ecosystems; denotes the sensitivity of landscape class j to threat factor r, with a value range of [0, 1].
First, the land use type map of the study area was collected and categorized into the aforementioned six major classes using the Reclassify tool in ArcGIS. Based on the classified map, threat source data were configured: in the Reclassify tool, threat sources were assigned a value of 1, while all other areas were assigned 0, resulting in a threat source raster dataset. A threat source table was then established, containing the maximum influence distance, weight, threat factor, and distance decay function (linear or exponential). Here, the maximum influence distance refers to the farthest distance over which different threat factors affect habitat quality, and its setting is related to the assignment of threat source weights. A sensitivity table was also prepared; sensitivity indicates both the degree of threat posed by a threat source to existing land classes and the suitability of existing land classes, representing an inverse buffer effect. Finally, the land use type raster data, threat source raster data, and the two tables were input into the InVEST-Habitat Quality module. The half-saturation parameter was set, which influences the spread and distribution of habitat quality values but does not alter the classification of habitat quality, thereby facilitating the visualization of result classification. The output habitat quality is presented as raster data with values ranging from 0 to 1.
2.3.6. Land Cover Type (LUCC)
This study collected and acquired Landsat, Sentinel, and high-resolution image data for the summers and autumns of 2000, 2005, 2010, 2015, and 2020 from nine major terminal lakes: Chaiwopu Lake, Lake Ailik, Barkol Lake, Manas Lake, Ulungur Lake, Bosten Lake, Ayding Lake, Ebi Lake, and Taitema Lake. Consideration of the actual land use conditions of the nine terminal lakes, the land use types within the terminal lake basins were classified into six categories: forest land, shrubland, grassland, lake surface, wetland, and bare land (Table 2). Interpretation keys for these types were established based on the remote sensing imagery. Subsequently, human–computer interactive interpretation and digitization were performed on the imagery from the five years according to these interpretation standards. Following field verification and refinement, vectorized thematic maps were generated, providing foundational data for analyzing land use status, changes, and landscape pattern dynamics in the terminal lake areas.
Table 2.
Land Use Classification and Interpretation System (Note: The remote sensing interpretation criteria images are displayed using a standard false-color composite, i.e., Near-Infrared, Red, and Green bands, to highlight vegetation and water features).
2.3.7. Ecological Water Use Efficiency (WUE)
Ecological Water Use Efficiency (WUE) is defined as the ratio of the total value of ecological services in the lake area to the total ecological water consumption, with the unit of CNY/m3. The data sources and processing methods for calculating the total ecological service value and total ecological water consumption are as follows:
In the formula, WUE represents Ecological Water Use Efficiency; ESV denotes Ecological Service Value; ET signifies Ecological Water Consumption.
Ecological Water Consumption (ET): The total ecological water consumption data is derived from the PML (Penman–Monteith–Leuning) data product, developed by the research team led by Professor Yongqiang Zhang at the Institute of Geographic Sciences and Natural Resources Research, Chinese Academy of Sciences. The PML dataset was evaluated using the water balance method across 43 major global river basins, comparing 10 global evapotranspiration (ET) products (including PML) from 2003 to 2012. Results demonstrated the superior performance of PML in estimating ET processes. Additionally, the model was calibrated using data from 95 global eddy covariance flux stations. In April 2022, the team received dual awards in the first “Outstanding Open Remote Sensing Dataset Collection” initiative organized by the National Earth Observation Data Center: “Top 10 Most Contributing Data Teams” and “Top 10 Most Valuable Annual Datasets.”
The PML terrestrial evapotranspiration dataset comprises five key components: gross primary productivity (GPP), vegetation transpiration (Ec), soil evaporation (Es), vaporization of intercepted rainfall (Ei), and evaporation from water bodies, ice, and snow (ET_water). The data are provided in TIFF format with a spatiotemporal resolution of 8 days and 500 m, covering the period from 2000 to 2022.
Based on the Penman–Monteith–Leuning (PML) model, the PML product incorporates stomatal conductance theory and couples GPP processes. The mutual constraint and interaction between GPP and ET significantly enhance the accuracy of ET simulation compared to previous models.
Ecological Service Value (ESV): The calculation of ecosystem service value refers to Xie Gaodi’s equivalent factor table for terrestrial ecosystem services in China. Adaptations were made to align with the actual conditions of the study area. Based on data including grain yield, unit price, and production income in the region, the economic value of a single ecosystem service value equivalent factor for the oasis areas of Xinjiang was determined to be 1743.94 CNY·hm−2 [49]. This value was then multiplied by the corresponding data from the Chinese terrestrial ecosystem service value equivalent factor table to derive the ecosystem service value coefficients for all land use types in the study area (Table 3).
Table 3.
Ecosystem Service Value (ESV) Coefficients by Land Use Type (CNY·hm−2).
The formula for calculating ecosystem service value is as follows:
where: ESV is the total ecological service value. is the area of land use type k. is the ecosystem service value coefficient for land use type k (see Table 2).
2.3.8. Entropy Weight Method
Entropy is a physical concept originating from thermodynamics, later introduced into information theory by C.E. Shannon [50]. The entropy weight method can overcome the subjectivity of artificially determined weights and the overlapping information among multiple indicator variables. It is now widely applied in research fields such as ecology, geography, and socio-economics [51,52]. The calculation steps are as follows:
- Suppose there are m subjects to be evaluated and n evaluation criteria, forming the original indicator data matrix X:In the formula, represents the value of the j-th indicator for the i-th element.
- Data standardization processing:For the positive indicators, negative indicators, and standardized matrix, the expressions are as follows:
- Calculate the proportion of the i-th element’s value under the j-th indicator:
- Calculate the entropy value of the j-th indicator:
- Calculate the degree of divergence for evaluation indicator j.
- Calculate the weight for evaluation indicator j.
- Calculate the regional comprehensive evaluation value .
Using the weight of the j-th indicator multiplied by the proximity (the standardized value of the j-th evaluation indicator for the i-th element in the standardized matrix) as the evaluated value .
3. Results
The results focus on the key components of lake ecosystems. Beginning with the hydrological and ecological baselines, we examine the temporal variations in water surface area and vegetation cover, as these constitute the most fundamental and visible features of lake ecosystems. Building upon this foundation, NDVI and the Standardized Precipitation Evapotranspiration Index (SPEI) are analyzed to reveal the coupling and response mechanisms between vegetation growth and climatic moisture conditions, thereby highlighting the role of climate variability in shaping lake ecological processes. Subsequently, TVDI is combined with biological abundance indicators to illustrate the impacts of drought stress on ecosystem stability and species diversity, reflecting the adaptive capacity and vulnerability of lakes under extreme environmental conditions [53]. Finally, through a comprehensive evaluation using the entropy weight method, the analyses of these elements are integrated to provide an overall assessment of lake ecosystem security.
3.1. Hydrological and Ecological Characteristics of Lakes
From 1990 to 2022, as illustrated in Figure 3, the water surface areas of Xinjiang’s major terminal lakes displayed significant heterogeneity and evident stage-specific fluctuations. Lake Bosten, the largest freshwater lake in the region, consistently maintained an area between 920 and 1094 km2. It reached peaks of 1084 km2 in 2000 and 1094 km2 in 2002, and although minor oscillations occurred thereafter, it remained stable around 1000 km2. This stability reflects its strong resilience in terms of hydrological replenishment and ecological functionality. By contrast, Lake Ebinur underwent much larger shifts: its area expanded from about 567 km2 in 1990 to a peak of 830–885 km2 between 2002 and 2004, but then declined continuously, shrinking to only 355 km2 by 2022. This represents a contraction of more than 50 percent, making Ebinur a typical case of severe terminal lake degradation.
Figure 3.
Temporal Dynamics of Water Surface Area in Major Terminal Lakes of Xinjiang with Confidence Intervals and Linear Fitting Results (1990–2022).
Lake Ulungur, which comprises Buluntuo Sea and Jili Lake, also exhibited contrasting dynamics between its two components. Buluntuo Sea remained relatively stable between 840 and 890 km2, even expanding slightly to nearly 892 km2 during 2017–2019, suggesting an overall stable trajectory with a modest upward trend. Jili Lake, though much smaller at 170–180 km2, showed limited variability, peaking at 178 km2 in 2010 and briefly expanding to 182 km2 in 2011 before settling back into minor fluctuations. Lake Ailik, in turn, displayed clear evidence of human intervention. With a surface area of about 23 km2 in 1990, it dried up completely between 1997 and 2000 but began to recover in 2002. Between 2004 and 2015, the lake stabilized at 50–55 km2, and even reached a maximum of 56 km2 during 2010–2014, demonstrating the effectiveness of water diversion projects (e.g., the Irtysh-Karamay ecological water transfer project initiated around 2000 to replenish the Baiyang River basin) in promoting its restoration.
Lake Barkol showed dramatic oscillations throughout the study period. Its surface area fell from 90 km2 in 1990 to less than 45 km2 by 2009–2010, rebounded to 98 km2 in 2016, and then contracted again to only 42 km2, reflecting the extreme instability of its water supply. Lake Ayding experienced an almost continuous decline: from 14 km2 in 1990, it briefly recovered to 30 km2 in 1996 but shrank rapidly thereafter, declining to 2.9 km2 in 2010 and falling below 1 km2 by 2020. By 2022, it remained in a state of severe contraction, having effectively lost its ecological functionality. Similarly, Lake Chaiwopu decreased steadily from about 30 km2 in 2000 to a low of 9.5 km2 in 2015. Although it has partially recovered to more than 20 km2 in recent years, its overall downward trajectory indicates that the lake has remained in a fragile ecological state over the long term.
From a comparative perspective, the water surface area changes of terminal lakes in Xinjiang can be categorized into three distinct patterns. The first type is relatively stable, exemplified by Lake Bosten and Buluntuo Sea of Lake Ulungur, which benefit from large catchment inflows. Their water areas exhibit limited fluctuations, and the ecosystems remain relatively well maintained. The second type is highly fluctuating, represented by Lake Ebinur and Lake Barkol. These lakes can expand rapidly during wet years but shrink drastically in droughts or periods of insufficient inflow, highlighting their sensitivity to climatic variability and water management interventions. The third type is long-term decline, such as Lake Ayding, Lake Chaiwopu, and, in certain stages, Lake Ailik, where lake areas have continuously decreased or even dried up, relying solely on ecological water transfers or diversion projects for restoration. Overall, over the past three decades, terminal lakes in Xinjiang have exhibited three evolutionary patterns—stability, fluctuation, and decline.
Between 1990 and 2022, the vegetation cover dynamics around Xinjiang’s major terminal lakes generally exhibited a strong overall consistency with their hydrological phases, though clear differences existed among individual lakes (Figure 4). At Lake Bosten, the vegetation area expanded from 523 km2 to 653 km2, reaching peak values between 2013 and 2017. This indicates that the lake’s stable scale provided sustained support for vegetation growth. At Lake Ebinur, by contrast, vegetation expanded from only 25 km2 in 1990 to 277 km2 in 2022 despite the extreme water surface shrinkage mentioned earlier. In the Lake Ulungur basin, vegetation around Buluntuo Sea grew moderately from 82 km2 in 1990 to 141 km2 in 2022. Jili Lake, however, supported vegetation that fluctuated between 40 and 50 km2, showing no clear long-term trend.
Figure 4.
Temporal Variations and Linear Fitting of Vegetation Area in Major Terminal Lakes of Xinjiang (1990–2022).
Several lakes displayed pronounced ecological fragility. Lake Ailik dried up entirely between 1997 and 2000, with its water surface reduced to zero, but gradually recovered to 55 km2 after 2002 through ecological water transfers. Its vegetation also rebounded after a sharp decline in 2003, underscoring the immediate ecological benefits of water diversion projects. Lake Barkol contracted to a low of 43 km2 in 2009, then recovered to 98 km2 by 2016, while its vegetation area remained relatively stable at 55–65 km2, reflecting severe hydrological instability but limited vegetation response. Lake Ayding almost completely lost its lacustrine character: its water surface shrank from 14 km2 in 1990 to less than 1 km2 in 2022. Yet its vegetation expanded steadily after 2000, rising from under 20 km2 to about 70 km2, suggesting a process in which saline bare land was gradually replaced by drought-tolerant vegetation. Lake Chaiwopu shrank from 30 km2 in 2000 to just 9.5 km2 in 2015, with partial recovery above 20 km2 in recent years. However, vegetation remained at persistently low levels between 2000 and 2012, only increasing rapidly after 2013 to over 10 km2, reflecting the early ecological benefits of management interventions.
Overall, the dynamics of water surface area and vegetation cover in Xinjiang’s terminal lakes reveal a degree of synchrony, though not a strictly linear relationship. Large lakes such as Bosten and Buluntuo Sea maintained stable water surface areas, accompanied by steady vegetation expansion. Medium-sized lakes, including Ebinur and Barkol, exhibited dramatic fluctuations in water surface area due to climatic variability and unstable inflows, whereas vegetation responded more gradually, reflecting a lagged effect. Small lakes such as Ailik, Chaiwopu, and Ayding proved highly sensitive to water availability, with desiccation and restoration directly determining vegetation growth or decline. In particular, Ayding and Chaiwopu demonstrated a divergence between shrinking water bodies and expanding vegetation, indicative of vegetation community replacement under extreme arid conditions. Three main factors underlie these differences. First, climatic moisture fluctuations directly affect both lake levels and vegetation growth, with wet years driving lake expansion and enhanced vegetation cover. Second, basin inflows and water management interventions play a decisive role; for example, ecological water transfers facilitated the recovery of Taitema and Ailik lakes. Third, salinization processes and human disturbance during lake evolution may trigger a shift from wetland to drought-tolerant vegetation communities, explaining cases where vegetation expands despite shrinking water bodies. Taken together, the relationship between water surface and vegetation cover highlights the dual sensitivity of terminal lake ecosystems to both climatic variability and human activities, while also reflecting their adaptive capacity and successional dynamics under extreme environmental stress.
3.2. Vegetation–Climate Response Characteristics
Between 1990 and 2022, NDVI values of terminal lakes in Xinjiang exhibited an overall upward trend, though the degree of change varied significantly among lakes. At Lake Bosten, NDVI fluctuated between 0.10 and 0.54, rising from just 0.19 in 1990 to a peak of 0.54 in 2016, and then stabilizing around 0.50. This indicates that vegetation cover improved substantially after 2000 and has remained at relatively high levels in the past decade. In contrast, Lake Ebinur maintained consistently low NDVI values, increasing only slightly from 0.03 in 1990 to about 0.05 by 2022. Despite a slow rise after 2009, the results suggest that vegetation recovery potential in this basin remains very limited. Buluntuo Sea of Lake Ulungur showed a clear improvement, with NDVI rising from 0.09 to approximately 0.30. After fluctuating between 0.10 and 0.20 before 2000, NDVI increased rapidly after 2013, peaking at 0.30 in 2016, reflecting the combined influence of water expansion and favorable climatic conditions. By comparison, Jili Lake maintained NDVI values between 0.20 and 0.30 throughout the study period, reaching a local maximum of 0.32 in 2013, but overall changes remained modest.
Smaller lakes displayed more complex trajectories. NDVI values at Lake Ailik fluctuated substantially from 1990 to 2000 but gradually stabilized between 0.10 and 0.15 thereafter (Figure 5). Lake Barkol exhibited persistently low NDVI levels, rising only slightly from 0.05 to 0.07–0.08, with notable interannual variability. Lake Ayding also showed a long-term low-coverage pattern, increasing only from 0.056 in 1990 to about 0.079 in 2022, consistent with its arid, saline environment. Lake Chaiwopu, by contrast, declined from 0.25 in 2000 to 0.10 in 2010, then rebounded to 0.33 in 2016, demonstrating the role of water restoration projects in promoting vegetation growth.
Figure 5.
Temporal Variations and Linear Fitting Results of NDVI in Terminal Lakes of Xinjiang, China (1990–2022).
On a broader scale, improvements in NDVI were concentrated after 2000, particularly at Lake Bosten and Buluntuo Sea, both of which maintained relatively high values after 2010. A Pearson correlation analysis was conducted to quantify the relationships between environmental variables. The results show a significant positive correlation between lake water area and NDVI across most basins (r = 0.58 to 0.82, p < 0.05), indicating a strong dependency of vegetation on lake extent. Furthermore, SPEI exhibited a positive correlation with lake area (r = 0.45 to 0.71, p < 0.05), while TVDI showed a strong negative correlation with biological abundance indices (r = −0.63 to −0.88, p < 0.01).
From the perspective of driving mechanisms, NDVI values were generally positively correlated with water surface area, implying that lake expansion promotes vegetation cover. However, exceptions such as Lake Ebinur—where water expansion did not yield synchronous vegetation improvement—suggest that external factors such as soil salinization and land use practices can weaken the positive impact of increased water availability. In contrast, the significant NDVI improvements observed at Lake Bosten and Buluntuo Sea highlight that, in areas with abundant water and favorable climatic conditions, the positive feedback between water bodies and vegetation restoration is far more pronounced.
Between 1990 and 2022, the Standardized Precipitation Evapotranspiration Index (SPEI) of the eight major terminal lakes in Xinjiang exhibited pronounced interannual fluctuations, underscoring the role of climatic wet–dry variability as a key external driver of lake ecosystems. At Lake Bosten, SPEI reached humid peaks of 1.83 in 1992 and 1.25 in 2003, while severe droughts were recorded in 1999 (−0.93) and 2001 (−0.94). Over the past decade, values were predominantly negative, indicating frequent drought events. Lake Ebinur showed a similar pattern, with markedly wet years in 1993 (1.60) and 2003 (1.01), followed by continuous droughts from 2006 to 2009 and negative values again in 2014–2015, highlighting the significant influence of climatic variability on the basin. Buluntuo Sea and Jili Lake of the Ulungur system exhibited highly consistent SPEI trajectories: both experienced strong wet conditions in 1992–1993 (SPEI > 1.8), while 2012 (−0.83) and 2020 (−0.85) were characterized by severe drought, closely corresponding with fluctuations in lake surface area and NDVI.
Smaller lakes displayed more extreme variability. In the Ailik basin, conditions were relatively moist during 1990–1996, with predominantly positive values, but shifted to persistent dryness after 1997, including sustained severe droughts (SPEI < −1.5) during 2017–2019. Lake Barkol and Lake Chaiwopu also experienced large-amplitude fluctuations, with individual years dropping below −1.5, underscoring their vulnerability to anomalous climatic events. Lake Ayding was even more fragile, remaining in drought conditions for most of the post-2000 period. During 2016–2020, SPEI values consistently fell below −1.5, reflecting the extreme aridity of the region and the heightened vulnerability of its ecosystem. Overall, wet years were generally associated with lake expansion and improved NDVI, whereas consecutive drought years coincided with significant contractions in water surface area and declines in vegetation cover. These findings confirm the strong coupling between climatic moisture variability and the hydrological–ecological dynamics of terminal lakes in arid Xinjiang (Figure 6).
Figure 6.
Temporal Variations and Linear Fitting Results of SPEI in Terminal Lakes of Xinjiang, China (1990–2022).
By integrating NDVI and SPEI results, it is evident that vegetation shows a pronounced response to climatic wet–dry variability. At Lake Bosten, NDVI exhibited marked increases during wet years such as 1992 and 2003, when SPEI reached peak values, reflecting the strong positive influence of humid conditions on vegetation recovery. At Lake Ebinur, however, vegetation improvement was limited even in the wet year of 2003, suggesting that salinization and anthropogenic disturbance in the basin may have weakened the positive ecological effects of favorable climate conditions. For Buluntuo Sea and Jili Lake of the Ulungur system, NDVI increased steadily after 2010, coinciding with SPEI values recovering to positive levels after 2000, demonstrating the direct role of climatic improvement in driving vegetation restoration. In contrast, vegetation conditions at Lake Chaiwopu and Lake Ayding remained persistently poor: despite occasional positive SPEI years, NDVI did not show significant recovery, indicating that under conditions of extreme aridity and lake shrinkage, vegetation responses may be delayed or even lose sensitivity altogether.
Overall, the coupling between SPEI and NDVI indicates that humid periods are generally associated with vegetation recovery, while drought periods correspond to vegetation degradation. This relationship is particularly evident in smaller lakes, highlighting both the extreme sensitivity of terminal lake ecosystems to climatic fluctuations and their dual characteristics of recovery potential and ecological fragility.
3.3. Lake Drought Stress and Biological Feedback
Between 1990 and 2022, the TVDI values of Xinjiang’s eight major terminal lakes showed distinct regional differences and varied temporal fluctuations. At Lake Bosten, TVDI ranged from 0.44 to 0.73. From 1993 to 2004, the lake was relatively moist, reaching its lowest value (0.44) in 2004. However, peaks of 0.73 in 2013 and 2015 indicated episodes of severe soil drought. Lake Ebinur consistently exhibited high TVDI levels, fluctuating around 0.80, and even reaching 0.91 in 1999. These values reflect persistent soil aridity and limited moisture availability in the basin. Buluntuo Sea and Jili Lake of the Ulungur system maintained much lower TVDI values (0.25–0.40), reflecting relatively moist soil conditions supported by stable inflows. Buluntuo Sea reached its lowest range (0.30–0.32) during 2003–2007, coinciding with improved precipitation and water management, while Jili Lake showed even smaller fluctuations, with a minimum of 0.25 in 2018, indicating generally humid conditions.
Other lakes displayed much stronger drought stress. At Lake Ailik, TVDI remained in the 0.70–0.90 range for most years, spiking to an extreme drought level of 0.98 in 2000. Although conditions eased slightly between 2002 and 2004, values rose again during 2007–2012, consistently reflecting severe drought stress. Lake Barkol typically registered values between 0.40 and 0.55, but reached highs of 0.55 in 2009–2012, showing how quickly soil dryness intensifies under reduced inflows. Lake Ayding presented the most extreme pattern after 2000: its TVDI reached 0.67 in 2000 and climbed above 0.63–0.70 during 2016–2019, highlighting the persistent decline in soil moisture under prolonged water shortages. Lake Chaiwopu maintained values between 0.48 and 0.62 during 2000–2022, with peaks around 0.62 between 2012 and 2016, reflecting the cumulative impact of shrinking lake area and regional aridification on soil water stress.
Comparison of TVDI with NDVI and biological abundance underscores the direct linkage between drought stress and ecosystem stability (Figure 7). At Lake Bosten and Ulungur, lower TVDI values coincided with relatively high NDVI, indicating stable ecosystems. In contrast, when TVDI values rose to around 0.70, vegetation cover declined markedly, demonstrating the suppressive effect of drought stress on plant growth. At Lake Ebinur and Lake Ayding, high TVDI consistently corresponded with low NDVI, and vegetation cover remained poor, indicating extremely weak ecological resilience. Lake Barkol and Lake Chaiwopu showed less synchronized responses: in some drought years, small increases in vegetation cover were observed, suggesting that human interventions such as irrigation or water diversion partly altered the ecological feedback pathways.
Figure 7.
Temporal Variations and Linear Fitting Results of TVDI in Terminal Lakes of Xinjiang, China (1990–2022).
Overall, the persistent high TVDI values and cyclical increases highlight the widespread problem of declining soil moisture in terminal lakes of arid Xinjiang. Severe drought stress was particularly evident at Lake Ayding, Lake Ebinur, and Lake Ailik, where it has become the main constraint on ecosystem recovery. By contrast, Lake Bosten and Ulungur demonstrated stronger ecological resilience, supported by water management interventions and relatively favorable climatic conditions. Comparisons between TVDI and biological indicators further illustrate that under sustained drought pressure, ecosystem stability and biodiversity are significantly reduced. This relationship emphasizes the importance of strengthened water regulation and ecological water supplementation to mitigate drought stress and support ecosystem sustainability.
Between 1990 and 2022, the biological abundance indices of the eight major terminal lakes in Xinjiang showed marked differences. Lake Bosten consistently remained at a high level (0.864–0.900), rising gradually to 0.895–0.900 after 2000. This stability reflects the strong ecological carrying capacity of the lake, confirming that as the largest freshwater lake in Xinjiang, its ecosystem has maintained considerable resilience under long-term climatic fluctuations. Buluntuo Sea of Lake Ulungur and Lake Chaiwopu exhibited similar index values (0.85–0.87), both remaining stable with little variation. These results suggest favorable inflow conditions in their basins and relatively robust ecosystem stability. By contrast, Jili Lake’s index hovered around 0.24 with minimal variation, indicating that its overall ecological functionality is limited.
Several lakes displayed clear fluctuations and stage-specific differences. At Lake Ebinur, the index was only 0.40 in 1990 but rose rapidly to 0.57 during 2000–2004, reflecting strong recovery when water resources were sufficient. However, it stabilized around 0.50 thereafter and declined again to 0.48 by 2022, signaling weakened ecosystem stability in recent years. Lake Barkol maintained relatively low values (0.22–0.24), reaching its lowest point of 0.219 in 2010, which underscores the strong pressures of drought and water scarcity on biodiversity. Lake Ailik had an index of 0.70 in 1990, but it dropped rapidly to a minimum of ~0.59 during the lake’s desiccation from 1997 to 2000. Afterward, it gradually recovered, reaching values above 0.80 after 2015, highlighting the positive effects of ecological water transfers on restoration. In contrast, Lake Ayding’s index remained extremely low throughout the study period, declining from 0.093 in 1990 to 0.089 in 2016 and only 0.079 in 2022. This lack of recovery demonstrates the extreme fragility of ecosystems in arid saline basins (Figure 8).
Figure 8.
Temporal Variations and Linear Fitting Results of the Biological Abundance Index in Terminal Lakes of Xinjiang, China (1990–2022).
A clear negative correlation emerges between drought stress and ecosystem health when comparing TVDI with biological abundance indices. At Lake Bosten and Lake Ulungur, where TVDI values remained relatively low (0.30–0.60), biological abundance indices stayed consistently high, indicating that favorable soil moisture conditions support greater biodiversity. By contrast, Lake Ebinur and Lake Ayding exhibited persistently high TVDI values (>0.80), with correspondingly low biological abundance (0.40–0.57 and 0.08–0.09, respectively), reflecting the suppressive effect of long-term drought stress on ecosystem recovery. The case of Lake Ailik further illustrates the role of human intervention: around 2000, TVDI spiked to 0.98, and biological abundance dropped sharply to 0.59. Following the implementation of ecological water transfers, TVDI declined and biological abundance gradually recovered to above 0.80, underscoring the critical importance of water management for ecological resilience.
Overall, the relationship between TVDI and biological abundance highlights the dual characteristics of terminal lake ecosystems. On one hand, under humid climatic conditions and lake expansion, ecosystems can maintain or restore high levels of biodiversity. On the other, under prolonged drought and shrinking lake areas, ecosystems display significant fragility, and in some cases, irreversible degradation. The contrasting responses among lakes also demonstrate that basin inflow conditions and artificial regulation directly determine the capacity of terminal lake ecosystems to withstand drought stress.
3.4. Ecological Security Levels of Lakes
The comprehensive multi-indicator evaluation based on the entropy weight method revealed a marked improvement in the ecological security status of Bosten Lake (Figure 9c). In 1990, the score was only 0.12, classified as “poor.” After 1995, conditions began to improve, reaching 0.39 in 1998 and entering the “moderate” category. In 2000, the ecological security score surpassed the threshold of 0.50 for the first time, reaching the level of “good,” and by 2003 it rose further to 0.58, approaching the “excellent” level. During 2005–2015, the scores fluctuated between 0.40 and 0.50, within the “moderate–good” range, reflecting the combined influence of climatic variability and human activities. Since 2016, the scores have stabilized around 0.55, with most years exceeding the “good” threshold. In 2021, the score reached 0.61, the highest in the record, indicating a significant improvement in ecological security over the past decade.
Figure 9.
Temporal variations of ecological indicators for Bosten Lake during 1990–2022. (a) Annual changes of water area and NDVI, showing the synergistic trend between lake expansion and vegetation cover. (b) Annual variation of water area and standardized precipitation evapotranspiration index (SPEI), illustrating the strong impact of climatic wetness/dryness on lake area fluctuations. (c) Ecological security score derived from multi-indicator entropy weighting, with thresholds for poor, medium, good, and excellent grades. The score shows a long-term improvement from low to medium-high levels, reflecting enhanced ecological stability of the lake system.
Overall, Bosten Lake has exhibited an integrated trajectory of “lake expansion—vegetation recovery—ecological security enhancement” during the past three decades. The coordinated growth of water and vegetation areas reflects the resilience of the lake ecosystem, with the positive role of humid years being particularly prominent. The entropy-weighted evaluation results further demonstrate that Bosten Lake has gradually transitioned from a low level of ecological security to a stable “good” level. This suggests that under the combined effects of external water regulation and climatic variability, the lake ecosystem has displayed strong adaptability and resilience.
4. Discussion
As the largest freshwater lake in Xinjiang, Lake Bosten has maintained a surface area between 950 and 1100 km2 over the long term. Remote sensing data and landscape ecological security assessments show that while there have been interannual fluctuations, the overall stability of the lake has remained strong. In 2000 and 2002, the surface area exceeded 1080 km2, whereas during 2010–2015 it declined slightly but never fell below 920 km2. Surrounded by wetlands with extensive reed beds, Lake Bosten plays a vital role in maintaining regional biodiversity. The entropy-weighted evaluation results demonstrate a continuous improvement in ecological security after 2000, approaching or reaching the “good” to “excellent” levels. Considering the need for long-term ecological stability, efficient water use, and the control of evaporative losses, the suitable lake surface was identified as 1000–1050 km2. This range not only secures wetland and aquatic vegetation functions but also avoids inefficient water consumption associated with overly large lake surfaces, while contributing to downstream water regulation for the Peacock River. Thus, maintaining Lake Bosten’s area at around 1000 km2 maximizes both ecological and social service functions.
Lake Ebinur, Xinjiang’s largest saline lake, exhibits much greater variability. Historically exceeding 800 km2, in recent years its surface has contracted significantly, in some years dropping to 350–400 km2. Monitoring data indicate that the lake peaked at 884 km2 in 2003 but declined to 408 km2 by 2013, and in the past five years has stabilized between 350–500 km2. Shrinkage has exposed saline soils, generating salt-dust sources that threaten both ecosystems and human health. The biological abundance index increased from 0.40 in the 1990s to 0.57 after 2000, but more recently declined, indicating limited and unstable recovery. Ecological security evaluations suggest that a suitable lake surface of 750–850 km2 would effectively cover saline bare land, reduce salt-dust risks, and preserve ecological balance in the lake and surrounding wetlands. This range thus represents both the ecological safety threshold and a critical target for regional salt-dust control.
Lake Ulungur, composed of Buluntuo Sea and Jili Lake, has maintained a total area of 850–1050 km2. Buluntuo Sea, the dominant sub-basin, has remained at 800–900 km2, with a trough of 425 km2 in 2003 and near 900 km2 in 2018, demonstrating strong resilience. Jili Lake, smaller at 170–180 km2, has shown significant fluctuations, peaking at 182 km2 in 2011, generally in close synchrony with Buluntuo Sea. Entropy-weighted evaluation results show long-term high ecological security, with biological abundance indices of 0.86–0.87, indicating healthy ecosystem conditions. The suitable surface is identified as 850–900 km2 for Buluntuo Sea and 170–175 km2 for Jili Lake, totaling 1020–1070 km2. This range sustains fishery production, wetland stability, and ecosystem resilience under climatic variability and human activities, thus meeting both ecological protection and economic utilization goals.
Lake Ailik, a typical terminal lake, historically covered 56 km2 but dried completely in the late 1990s due to reservoir construction and reduced inflows. After 2000, ecological water transfers enabled gradual recovery, peaking at 85.9 km2 in 2010 before stabilizing around 40 km2 in recent years. For the stability and sustainability of the lake ecosystems during desiccation, the ecosystem degraded severely, with declines in NDVI and biological abundance, but recovery was evident after water diversion. To maintain basic stability, the lake should not fall below 40 km2, but overly large areas would waste scarce water resources. Considering vegetation cover, ecological water demand, and water management, the suitable range is 50–55 km2, sufficient to sustain wetlands and vegetation functions while ensuring efficient resource use. Ailik’s trajectory underscores the decisive role of human intervention in lake ecosystem recovery.
Lake Barkol, located on the northern slope of the eastern Tianshan, has experienced drastic fluctuations. Historically exceeding 100 km2, its surface contracted to 43.6 km2 in 2009, then rebounded to 98.3 km2 in 2016. These shifts are driven by precipitation, inflows from small rivers, agricultural use, and climatic variability. Vegetation area has remained at 55–65 km2, with consistently low NDVI values, reflecting the system’s sensitivity to hydrological variability. The biological abundance index has hovered at 0.22–0.24, with a minimum of 0.219 in 2010, evidencing significant degradation during low-water phases. Evaluations suggest a suitable range of 90–110 km2, which would stabilize wetland and grassland systems while supporting local pastoralism. Below 60 km2, degradation risks intensify, while exceeding 120 km2 would waste water resources. Thus, 100 km2 represents the optimal balance between ecological and economic functions.
Lake Ayding, a typical arid-zone saline lake, has suffered prolonged shrinkage. Once covering 150 km2 in the 1950s, in recent decades it has rarely exceeded 10 km2, falling to 2.9 km2 in 2010 and only 0.78 km2 in 2020. NDVI has remained low (0.06–0.08), and biological abundance indices below 0.1, confirming extreme ecosystem fragility. Shrinkage has exacerbated salt-dust emissions, severely impacting local environments. Assessments indicate that maintaining even the most basic ecological functions requires 25–30 km2. Although far below historical levels, this range would prevent total desiccation, reduce salt-dust risks, and sustain minimal vegetation and wetland presence. Given basin-wide water scarcity, achieving this would require sustained ecological water transfers and integrated management. For Ayding, the suitable lake surface is therefore a minimum safeguard, essential for preventing ecological collapse.
Lake Chaiwopu, near Urumqi, maintained 30 km2 in the 1990s but shrank rapidly after 2000, reaching just 9.5 km2 in 2015 and nearly drying in some years. Restoration and management measures have since promoted recovery, with the area reaching 22.9 km2 in 2022, though still below historical levels. The ecosystem has been heavily impacted by agricultural withdrawals and urban development, with water quality consistently at inferior Class V, posing ecological risks. NDVI declined from 2000 to 2012 but improved after 2015, alongside recovery in biological abundance. Evaluations suggest a suitable surface of 25–30 km2, sufficient to prevent desiccation, maintain basic wetland functions, and control evaporative losses under regional water scarcity. The recovery of Chaiwopu demonstrates that scientific water allocation and strengthened management can reverse degradation trends.
Lake Bosten, the largest freshwater lake in Xinjiang, has long maintained an area exceeding 1000 km2. Based on landscape ecological security assessments and ecological water demand analysis, its suitable lake surface is defined as approximately 1000–1050 km2. This range not only stabilizes wetland vegetation but also minimizes evaporative losses, ensuring effective downstream water regulation. Lake Ebinur historically exceeded 800 km2 but in recent years has shrunk to 350–500 km2. Considering ecological security thresholds and salt-dust control targets, the suitable lake surface is identified as 750–850 km2. This range prevents exposure of saline soils, reduces dust storm risk, and preserves regional ecological security. Buluntuo Sea, the dominant part of Lake Ulungur, has maintained 800–900 km2 annually. To ensure water stability, fishery resources, and wetland integrity, the suitable surface is 850–900 km2. Jili Lake, smaller and more sensitive to fluctuations, is optimally maintained at 170–175 km2, which preserves hydrological connectivity with Buluntuo Sea and stabilizes the wetland system. Lake Ailik, once ~56 km2, dried out in the late 1990s but has been partially restored through ecological water transfers, reaching 40–60 km2. Evaluations suggest a suitable range of 50–55 km2, sufficient to maintain wetland and vegetation functions while aligning with ecological water management goals. Lake Barkol historically exceeded 100 km2 but has fluctuated dramatically in recent decades. Ecological assessments indicate that the suitable range is 90–110 km2, balancing wetland and grassland ecosystems while preventing degradation. Lake Ayding, historically 150 km2, now remains below 10 km2 and is often desiccated. Its suitable lake surface is 25–30 km2, a minimum threshold to avoid complete collapse, reduce salt-dust emissions, and maintain minimal wetland and vegetation presence. Lake Chaiwopu, near Urumqi, has fluctuated between 20 and 30 km2 but shrank to less than 10 km2 after 2000. Based on both ecological security and water-use efficiency, the suitable surface is 25–30 km2. This ensures that the lake does not dry up again while balancing ecological conservation with limited water resources (Table 4).
Table 4.
Suitable Lake Surface Areas of Eight Terminal Lakes in Xinjiang.
While this study establishes a robust historical baseline for suitable lake surfaces, future management must consider several dynamic constraints. First, under future climate projection scenarios, rising temperatures and evapotranspiration (ET) variability will likely increase lake ecological water demands, potentially requiring dynamic adjustments to these spatial thresholds. Second, achieving these optimal surfaces is highly contingent on managing upstream irrigation withdrawals. Compared to traditional river-centric environmental flow frameworks, our spatial lake-area targets provide more intuitive benchmarks for regional water quotas. Ultimately, the policy feasibility of maintaining these suitable surfaces under severe water scarcity will rely on rigid basin-wide water-saving regulations and integrated ecological water-transfer mechanisms.
5. Conclusions
The concept of a suitable lake surface represents a critical threshold for sustaining ecological security and achieving efficient water use. Long-term analyses of remote sensing and monitoring data across eight terminal lakes reveal clear differences in ecological security baselines. Large lakes such as Bosten and Ebinur require relatively high water levels to maintain ecosystem stability, while smaller and medium-sized lakes such as Ailik and Chaiwopu require only a minimum ecological threshold under limited water availability. This demonstrates that the “suitable lake surface” is not a fixed value but the outcome of integrating basin characteristics, ecological requirements, and water resource carrying capacity. This study specifically addresses a methodological gap in current research by integrating entropy-weighted ecological security and water-use efficiency to reverse-engineer an optimal spatial ‘suitable lake surface’ range, moving beyond traditional one-dimensional ‘minimum ecological water levels’. It also provides scientific evidence for efficient water resource utilization.
Climatic wet–dry variability and human activities jointly drive lake evolution. These trajectories are driven not only by climatic moisture conditions but also by basin-scale water allocation and regulation measures. Results from SPEI and TVDI confirm that climate fluctuations directly induce cyclical changes in lake surface area and vegetation cover. During wet periods, lake expansion and vegetation recovery are evident, whereas during droughts, contraction and vegetation degradation dominate. However, asynchronous trends suggest that vegetation recovery often lags behind hydrological changes, reflecting delayed responses to both climatic variability and water diversion measures. At the same time, human interventions play a decisive role. The recovery of lakes such as Ailik and Taitema shows that ecological water transfers can rapidly improve lake conditions, demonstrating that anthropogenic regulation of water resources plays a pivotal role in ecological restoration. Conversely, the decline of Ayding and Chaiwopu vividly illustrates the dual pressures of climatic aridification and excessive water extraction, highlighting the vulnerability of ecosystems under these extreme constraints.
Lake ecosystems exhibit a strong relationship between drought stress and biological feedback. The coupling of TVDI and biological abundance indices indicates that lakes under persistently high drought stress (e.g., Ayding and Ebinur) generally show reduced biological abundance and constrained ecosystem health. By contrast, lakes such as Bosten and Ulungur, with relatively lower drought stress, maintain high levels of biological abundance over time. This underscores that suitable lake surfaces, combined with favorable hydrological conditions, are essential for regional ecological security.
Defining suitable lake surfaces requires balancing ecological protection with social demands. This study proposes a “three-dimensional framework”: using ecological security baselines as the minimum threshold, ecological water-use efficiency as the upper limit, and integrating lake functional roles and conservation objectives. Within this framework, lakes are safeguarded against ecological collapse due to undersized surfaces, while also preventing water wastage from excessively large surfaces. This method provides an operational pathway for fine-scale water resource management in arid regions.
The study carries important practical implications for regional water resource management. By quantifying the suitable lake surface ranges for eight terminal lakes, it offers concrete guidance for both ecological protection and water allocation in Xinjiang. These findings not only help prevent further ecosystem degradation but also provide theoretical and methodological support for constructing a management model that harmonizes water resource utilization with ecosystem sustainability in arid zones.
Author Contributions
Conceptualization, Z.Z. and X.G.; Methodology, Z.Z.; Software, X.S.; Validation, X.S.; Formal analysis, N.P.; Investigation, N.P.; Resources, N.P.; Data curation, X.H.; Writing—original draft, Z.Z. and X.G.; Writing—review & editing, X.H.; Visualization, X.G.; Supervision, X.G.; Project administration, X.G.; Funding acquisition, X.H. All authors have read and agreed to the published version of the manuscript.
Funding
This research was funded by [Research on Ecological and Environmental Protection of the Ebinur Lake Basin], [Key Field Science and Technology Research Project of XPCC] grant number [2023AB059], [Third Xinjiang Scientific Expedition Program] grant number [2021xjkk0804], [Project of the Xinjiang Talent Support Program for Major Demands] grant number [2026403025018003] and [Science and Technology Project of Shihezi City] grant number [2023NY01]. And The APC was funded by [2024DB049, 2026403025018003].
Institutional Review Board Statement
Not applicable.
Informed Consent Statement
Not applicable.
Data Availability Statement
The original contributions presented in this study are included in the article. Further inquiries can be directed to the corresponding authors.
Conflicts of Interest
Ning Pang is employee of Ltd. of China Power Engineering Consulting Group. The paper reflects the views of the scientists and not the company.
References
- Li, J.; Zhao, W.; Liu, L.; Zhou, C. Variation characteristics of extreme precipitation indicators in central Yunnan Province from 1960 to 2020. Water Resour. Hydropower Eng. 2025, 56, 1–14. [Google Scholar] [CrossRef]
- Kahil, M.T.; Dinar, A.; Albiac, J. Modeling water scarcity and droughts for policy adaptation to climate change in arid and semiarid regions. J. Hydrol. 2015, 522, 95–109. [Google Scholar] [CrossRef] [Scilit]
- Jiang, L.W. Water resources, land exploration and population dynamics in arid areas—The case of the Tarim River Basin in Xinjiang of China. Popul. Environ. 2005, 26, 471–503. [Google Scholar]
- Luo, M.; Liu, T.; Meng, F.; Duan, Y.; Bao, A.; Xing, W.; Feng, X.; De Maeyer, P.; Frankl, A. Identifying climate change impacts on water resources in Xinjiang, China. Sci. Total Environ. 2019, 676, 613–626. [Google Scholar] [CrossRef] [Scilit]
- Brenden, T.O.; Wang, L.Z.; Su, Z.M. Quantitative Identification of Disturbance Thresholds in Support of Aquatic Resource Management. Environ. Manag. 2008, 42, 821–832. [Google Scholar] [CrossRef] [Scilit]
- Xinfeng, Z.; Hailiang, X.; Peng, Z. Changes of Lake Area, Groundwater Level and Vegetation under the Influence of Ecological Water Conveyance—A Case Study of the Tail Lake of Tarim River in China. Water 2022, 14, 1026. [Google Scholar] [CrossRef] [Scilit]
- Croley, T.E.; Lewis, C.F.M. Warmer and Drier Climates that Make Terminal Great Lakes. J. Great Lakes Res. 2006, 32, 852–869. [Google Scholar] [CrossRef] [Scilit]
- Xu, Y.; Ma, Y.; Wang, Y.; Bao, L.; Yang, T. Research and practice on water-use rights trading model among irrigation water users in Ningxia. Water Resour. Dev. Res. 2025, 25, 33–39, 91. [Google Scholar] [CrossRef]
- Yan, W.; Ma, X.; Liu, Y.; Qian, K.; Yang, X.; Li, J.; Wang, Y. Ecological Assessment of Terminal Lake Basins in Central Asia under Changing Landscape Patterns. Remote Sens. 2022, 14, 4842. [Google Scholar] [CrossRef] [Scilit]
- Zhou, J.; Chang, C.; Wang, G. Analysis on the control measures and effects of groundwater overexploitation in Yellow River Delta: A case study on Binzhou City, Shandong Province. Water Resour. Dev. Res. 2025, 25, 40–46. [Google Scholar] [CrossRef]
- Dou, X.; Ma, X.; Huo, T.; Zhu, J.; Zhao, C. Assessment of the environmental effects of ecological water conveyance over 31 years for a terminal lake in Central Asia. CATENA 2022, 208, 105725. [Google Scholar] [CrossRef] [Scilit]
- O’Sullivan, P.E.; Reynolds, C.S. (Eds.) Volume 1: Limnology and Limnetic Ecology. In The Lakes Handbook; Blackwell Science Ltd.: Oxford, UK, 2004. [Google Scholar]
- Kang, S.; Su, X.; Tong, L.; Zhang, J.; Zhang, L.; Davies. A warning from an ancient oasis: Intensive human activities are leading to potential ecological and social catastrophe. Int. J. Sustain. Dev. World Ecol. 2008, 15, 440–447. [Google Scholar] [CrossRef] [Scilit] [PubMed]
- Creutz, M.; Van Bocxlaer, B.; Abderamane, M.; Verschuren, D. Recent environmental history of the desert oasis lakes at Ounianga Serir, Chad. J. Paleolimnol. 2016, 55, 167–183. [Google Scholar] [CrossRef] [Scilit]
- Cai, P.; Hamdi, R.; He, H.; Luo, G.; Wang, J.; Zhang, M.; Li, C.; Termonia, P.; De Maeyer, P. Numerical Study of the Interaction between Oasis and Urban Areas within an Arid Mountains-Desert System in Xinjiang, China. Atmosphere 2020, 11, 85. [Google Scholar] [CrossRef] [Scilit]
- Heino, J.; Alahuhta, J.; Bini, L.M.; Cai, Y.; Heiskanen, A.S.; Hellsten, S.; Kortelainen, P.; Kotamäki, N.; Tolonen, K.T.; Vihervaara, P.; et al. Lakes in the era of global change: Moving beyond single-lake thinking in maintaining biodiversity and ecosystem services. Biol. Rev. 2021, 96, 89–106. [Google Scholar] [CrossRef] [Scilit]
- Biggs, J.; von Fumetti, S.; Kelly-Quinn, M. The importance of small waterbodies for biodiversity and ecosystem services: Implications for policy makers. Hydrobiologia 2017, 793, 3–39. [Google Scholar] [CrossRef] [Scilit]
- Ancillotto, L.; Bosso, L.; Salinas-Ramos, V.B.; Russo, D. The importance of ponds for the conservation of bats in urban landscapes. Landsc. Urban Plan. 2019, 190, 103607. [Google Scholar] [CrossRef] [Scilit]
- Dunee, D.; Dagadu, P.P.; Ayimadu, E.T.; Asante, I.O.; Daanaah, B.; Galaa, M.V.; Pangestu, F.F. Impact of climate change on water resources and its implications on biodiversity, flood disasters, and food security in Ghana: A review. GeoJournal 2025, 90, 106. [Google Scholar] [CrossRef] [Scilit]
- Meli, P.; Ceccon, E.; Mastrangelo, M.E.; Calle Díaz, Z. Ecosystem restoration and human well-being in Latin America. Ecosyst. People 2022, 18, 609–615. [Google Scholar] [CrossRef] [Scilit]
- Fan, M.; Xu, J.; Chen, Y.; Li, D.; Tian, S. How to Sustainably Use Water Resources-A Case Study for Decision Support on the Water Utilization of Xinjiang, China. Water 2020, 12, 3564. [Google Scholar] [CrossRef] [Scilit]
- Paul, P.K.; Brar, T.S.; Daggupati, P.; Rudra, R.; Goel, P. Evaluating water quantity and quality of Canadian Great Lakes Watershed using LTHIA GIS Model. CBE J. 2024, 65, 1.1–1.16. [Google Scholar] [CrossRef] [Scilit]
- Wu, Y.; Liu, C.; Zhang, F.; Li, M.; Chan, N.W.; Oke, S.A.; Ma, X.; Wei, L. Long-term dramatic spatial and temporal changes in the watershed areas of multiple types of lakes and reservoirs in Xinjiang, China. Ecol. Indic. 2024, 169, 112885. [Google Scholar] [CrossRef] [Scilit]
- Shang, S.H. Lake surface area method to define minimum ecological lake level from level-area-storage curves. J. Arid. Land 2013, 5, 133–142. [Google Scholar] [CrossRef] [Scilit]
- Shang, S.P.; Shang, S.H. Simplified Lake Surface Area Method for the Minimum Ecological Water Level of Lakes and Wetlands. Water 2018, 10, 1056. [Google Scholar] [CrossRef] [Scilit]
- Liu, H.; Yin, Y.; Piao, S.; Zhao, F.; Engels, M.; Ciais, P. Disappearing Lakes in Semiarid Northern China: Drivers and Environmental Impact. Environ. Sci. Technol. 2013, 47, 12107–12114. [Google Scholar] [CrossRef] [Scilit]
- Zhang, F.; Tiyip, T.; Johnson, V.C.; Kung, H.T.; Ding, J.L.; Sun, Q.; Zhou, M.; Kelimu, A.; Nurmuhammat, I.; Chan, N.W. The influence of natural and human factors in the shrinking of the Ebinur Lake, Xinjiang, China, during the 1972–2013 period. Environ. Monit. Assess. 2015, 187, 4128. [Google Scholar] [CrossRef] [Scilit]
- Gao, F.; Yang, W.; Zhang, S.; Xin, X.; Zhou, J.; Du, G. An Integrated Approach to Constructing Ecological Security Pattern in an Urbanization and Agricultural Intensification Area in Northeast China. Land 2023, 12, 330. [Google Scholar] [CrossRef] [Scilit]
- Lai, X.; Yu, H.; Liu, G.; Zhang, X.; Feng, Y.; Ji, Y.; Zhao, Q.; Jiang, J.; Gu, X. Construction and Analysis of Ecological Security Patterns in the Southern Anhui Region of China from a Circuit Theory Perspective. Remote Sens. 2023, 15, 1385. [Google Scholar] [CrossRef] [Scilit]
- Scheffer, M.; Carpenter, S.; Foley, J.A.; Folke, C.; Walker, B. Catastrophic shifts in ecosystems. Nature 2001, 413, 591–596. [Google Scholar] [CrossRef] [Scilit]
- Pekel, J.F.; Cottam, A.; Gorelick, N.; Belward, A.S. High-resolution mapping of global surface water and its long-term changes. Nature 2016, 540, 418. [Google Scholar] [CrossRef] [Scilit]
- Bosso, L.; De Conno, C.; Russo, D. Modelling the risk posed by the zebra mussel Dreissena polymorpha: Italy as a case study. Environ. Manag. 2017, 60, 304–313. [Google Scholar] [CrossRef] [Scilit] [PubMed]
- Cantonati, M.; Poikane, S.; Pringle, C.M.; Stevens, L.E.; Turak, E.; Heino, J.; Richardson, J.S.; Bolpagni, R.; Borrini, A.; Cid, N.; et al. Characteristics, main impacts, and stewardship of natural and artificial freshwater environments: Consequences for biodiversity conservation. Water 2020, 12, 260. [Google Scholar] [CrossRef] [Scilit]
- Zhang, T.; Dong, Z.; Luo, Y.; Shi, Q.; Han, Y.; Cui, C.; Zhou, Q.; Zhang, Y. Optimum ecological water level of water-carrying lake based on the relationship between water quality and water level. J. Lake Sci. 2022, 34, 1670–1682. [Google Scholar] [CrossRef] [Scilit]
- Wang, H.X.; Zhu, Y.W.; Zha, H.F.; Guo, W.X. Ecological water level and its safeguard measures in Lake Dongting. J. Lake Sci. 2020, 32, 1529–1538. [Google Scholar] [CrossRef] [Scilit]
- Wang, J.; Yang, S.; Lou, H.; Liu, H.; Wang, P.; Li, C.; Zhang, F. Impact of lake water level decline on river evolution in Ebinur Lake Basin (an ungauged terminal lake basin). Int. J. Appl. Earth Obs. Geoinf. 2021, 104, 102546. [Google Scholar] [CrossRef] [Scilit]
- Ren, C.; Liu, T. An adaptive threshold approach for water body extraction in the OTSU-Cuckoo. Sci. Surv. Mapp. 2022, 47, 163–169, 180. [Google Scholar]
- Sandholt, I.; Rasmussen, K.; Andersen, J. A simple interpretation of the surface temperature/vegetation index space for assessment of surface moisture status. Remote Sens. Environ. 2002, 79, 213–224. [Google Scholar] [CrossRef] [Scilit]
- Gao, Z.; Gao, W.; Chang, N.-B. Integrating temperature vegetation dryness index (TVDI) and regional water stress index (RWSI) for drought assessment with the aid of LANDSAT TM/ETM+ images. Int. J. Appl. Earth Obs. Geoinf. 2011, 13, 495–503. [Google Scholar] [CrossRef] [Scilit]
- Rouse, J.W., Jr.; Haas, R.H.; Schell, J.A.; Deering, D.W. Monitoring vegetation systems in the Great Plains with ERTS. In Third ERTS-1 Symposium, NASA SP-351; NASA: Washington, DC, USA, 1974; Volume 30103017, pp. 309–317. [Google Scholar]
- Liu, L.; Zhang, W.; Duan, Y.; Xing, L.X.; Chen, S.B.; Zhao, M. Terrain corrected TVDI for agricultural drought monitoring using MODIS data. Acta Ecol. Sin. 2014, 34, 3704–3711. [Google Scholar] [CrossRef] [Scilit]
- Lin, W.; Wen, C. Applicability Analysis of the Standardized Precipitation Evapotranspiration Index in Drought Monitoring in China. Plateau Meteorolocy 2014, 33, 423–431. [Google Scholar]
- Gulisitan, A.; Jianli, D.; Wen, M. Study on the influence of different types of dusty weather and related factors onaerosol optical thickness in South Xinjiang region. Acta Sci. Circumstantiae 2024, 44, 259–269. [Google Scholar]
- Fraissinet, M.; Ancillotto, L.; Migliozzi, A.; Capasso, S.; Bosso, L.; Chamberlain, D.E.; Russo, D. Responses of avian assemblages to spatiotemporal landscape dynamics in urban ecosystems. Landsc. Ecol. 2023, 38, 293–305. [Google Scholar] [CrossRef] [Scilit]
- Ahmad, S.; Wanghe, K.; Li, J.L.; Gonzalez, E.B.; Syms, C.; Strelnikov, I.I.; Bosso, L.; Mao, W. Climate-Driven Morphological Variation in Passerine Birds. Glob. Ecol. Biogeogr. 2025, 34, e70164. [Google Scholar] [CrossRef] [Scilit]
- Gu, X.; Zhang, P.; Zhang, W.; Liu, Y.; Jiang, P.; Wang, S.; Lai, X.; Long, A. A Study of Drought and Flood Cycles in Xinyang, China, Using the Wavelet Transform and M-K Test. Atmosphere 2023, 14, 1196. [Google Scholar] [CrossRef] [Scilit]
- Fu, S.; Wang, W.; Wan, B. Study on normalization coefficients of biological abundance and vegetation coverage in Hebei Province based on RS and GIS. Chin. J. Environ. Manag. 2014, 6, 27–31. (In Chinese) [Google Scholar]
- Zuo, F.; Wang, Z. Application of geographical national conditions monitoring in comprehensive evaluation of eco-environmental quality. Geomat. Spat. Inf. Technol. 2021, 44, 141–144, 147. (In Chinese) [Google Scholar]
- Wu, Z.; Zhang, J.; Wang, J.; Lü, S.; Li, B. Spatiotemporal changes in oasis land use and ecosystem service value in the Jinghe River Basin. J. Ecol. Rural. Environ. 2021, 37, 1168–1175. (In Chinese) [Google Scholar]
- Qiu, Y. Information and information pollution. China Inf. Technol. Educ. 2019, 9, 21. (In Chinese) [Google Scholar]
- Wang, B.; Lu, B.; Wang, D.; Zhao, P.; Li, W.; Zhang, G. Optimization method of plantation tree neighborhood structure based on entropy method. J. Northwest For. Univ. 2024, 39, 67–72, 80. (In Chinese) [Google Scholar]
- Pang, N.; Deng, X.; Long, A.; Zhang, L.; Gu, X. Evaluation of the Resilience of the Socio-Hydrological System of the Tarim River Basin in China and Analysis of the Degree of Barriers. Sustainability 2022, 14, 7571. [Google Scholar] [CrossRef] [Scilit]
- Gao, L.; Chen, T.; Li, J.; Li, X.; Wang, X. Instability threshold of vehicles in floodwaters based on CFD. Water Resour. Hydropower Eng. 2025, 56, 15–25. [Google Scholar] [CrossRef]
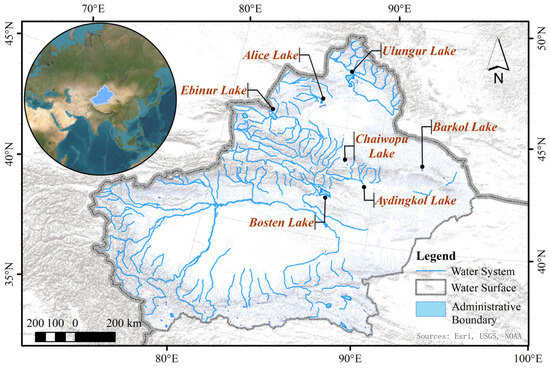
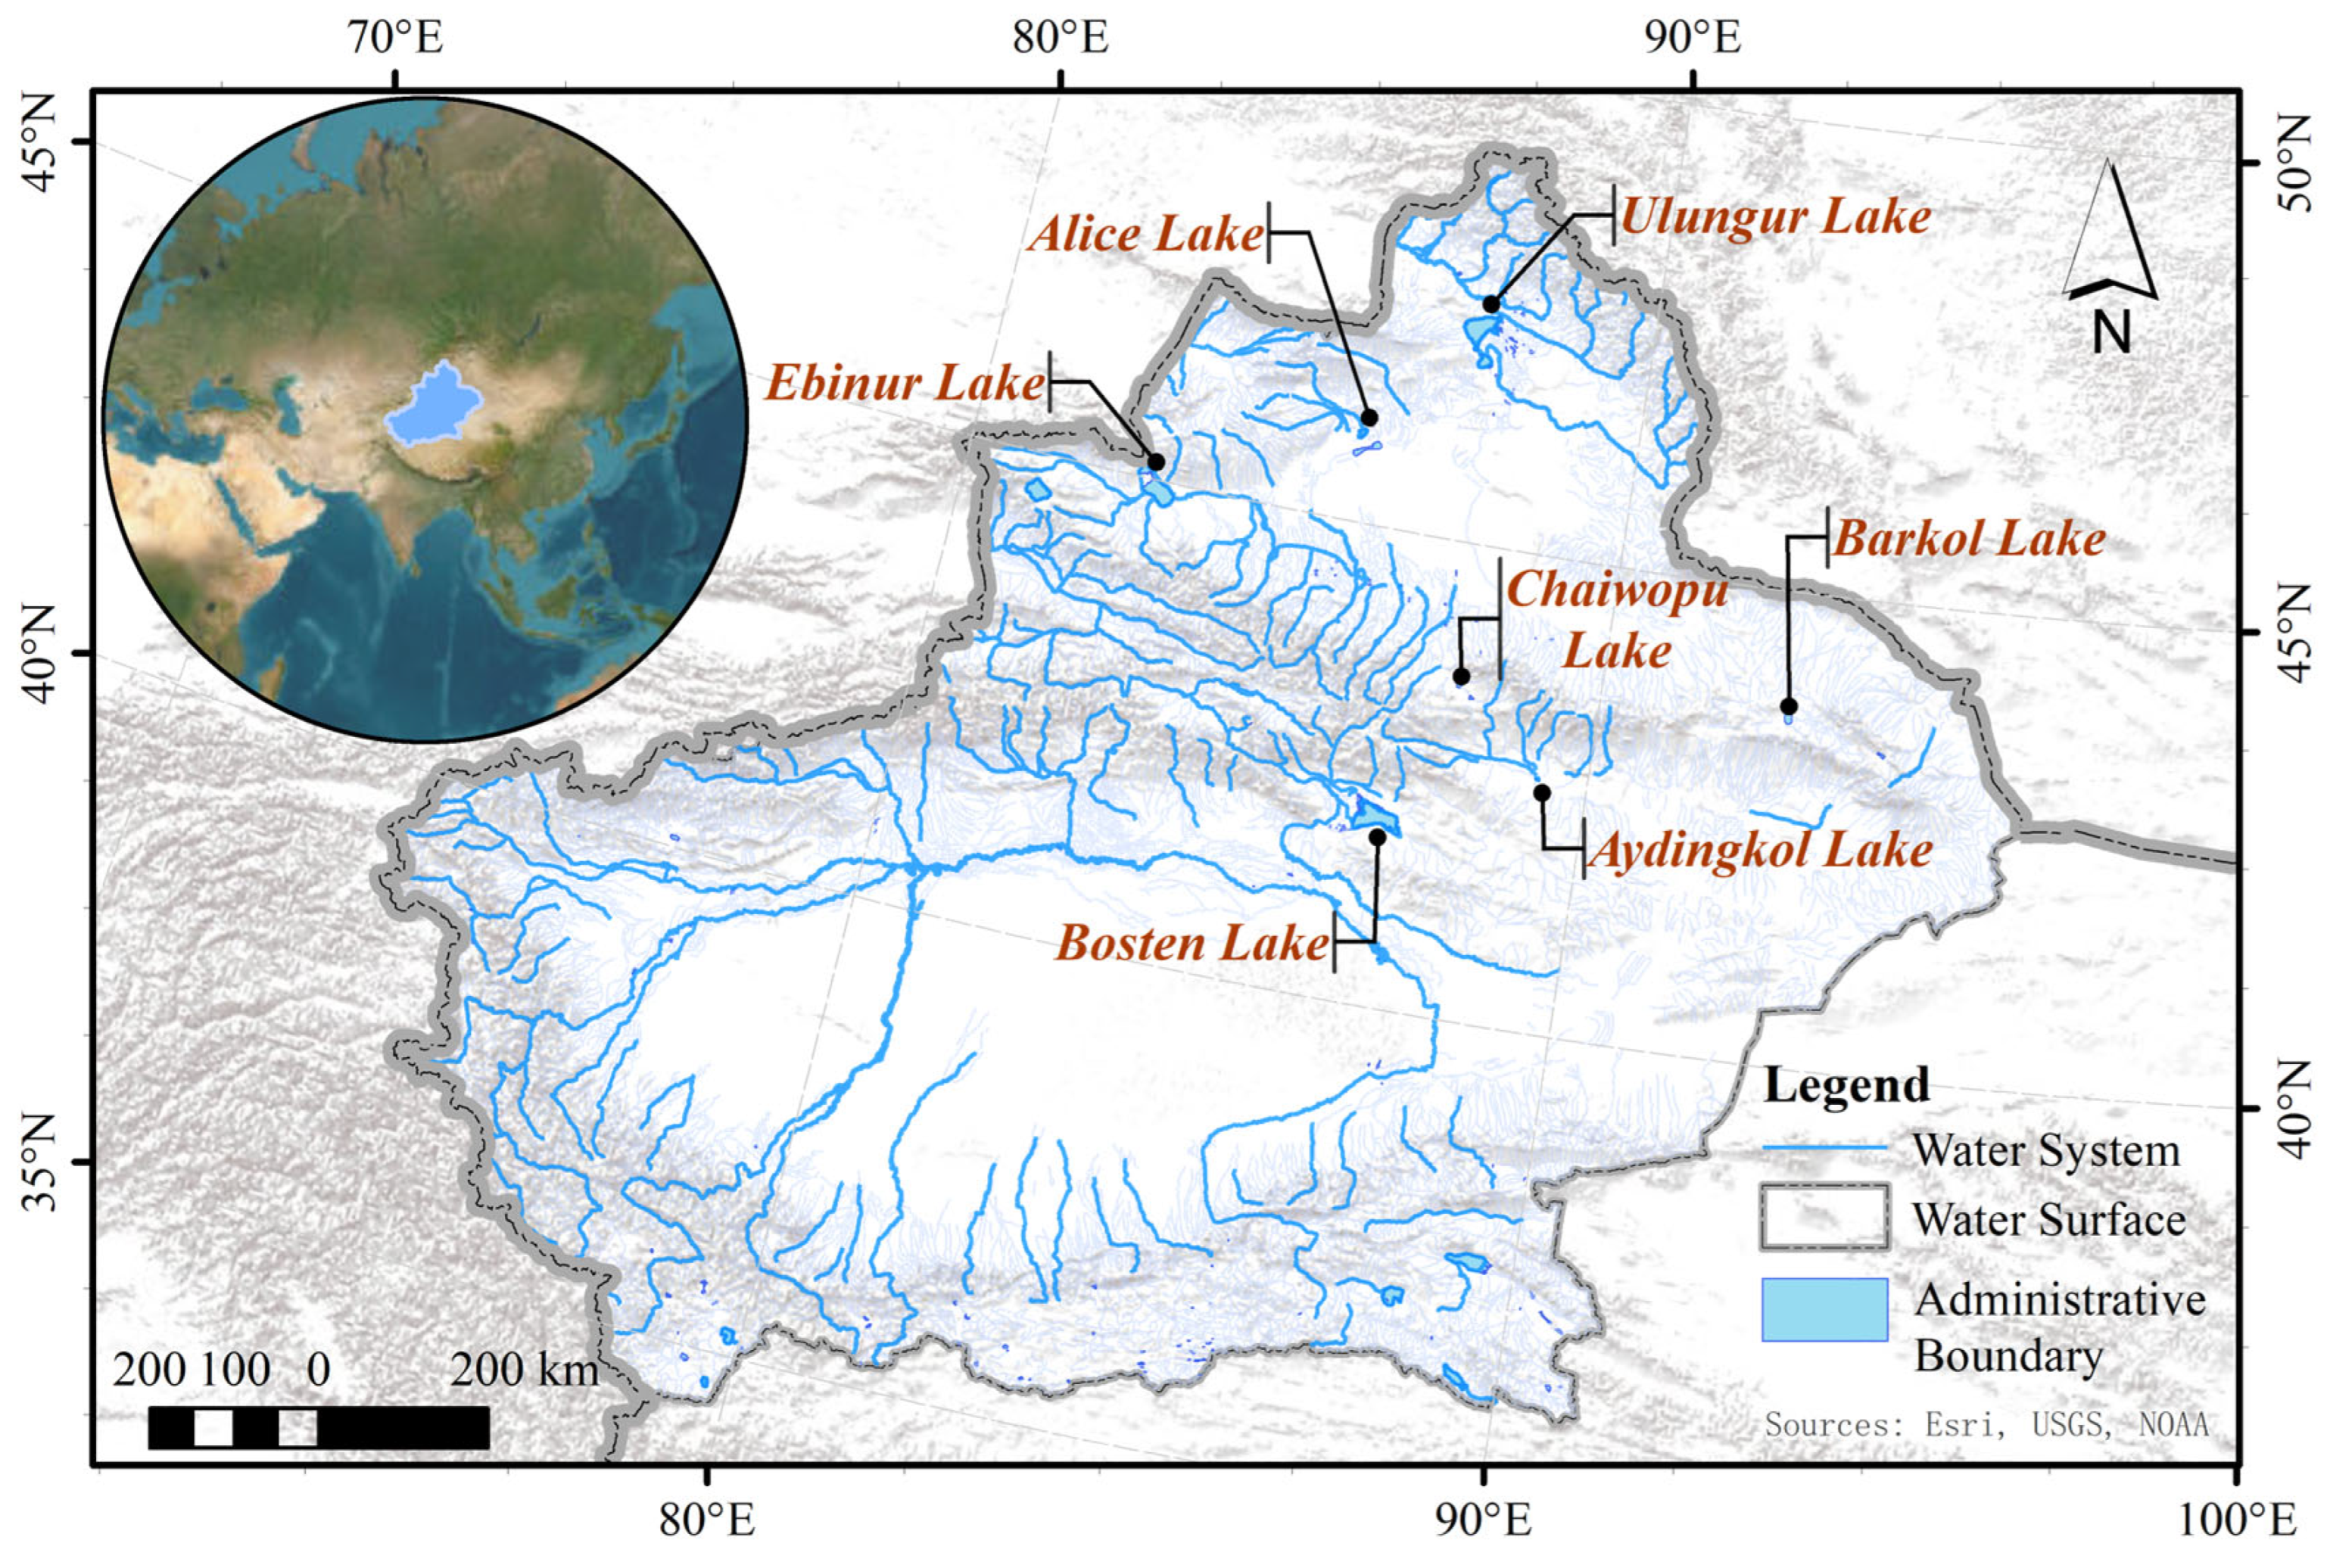
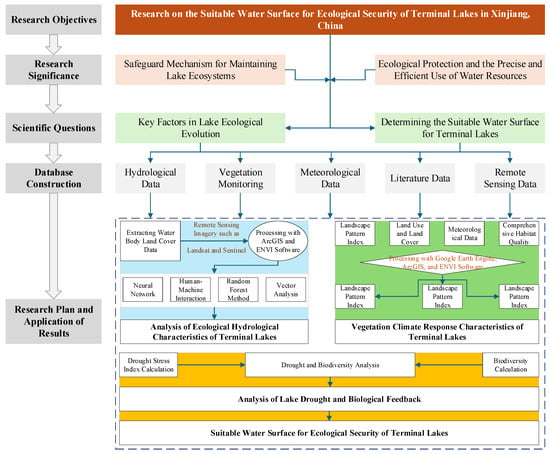
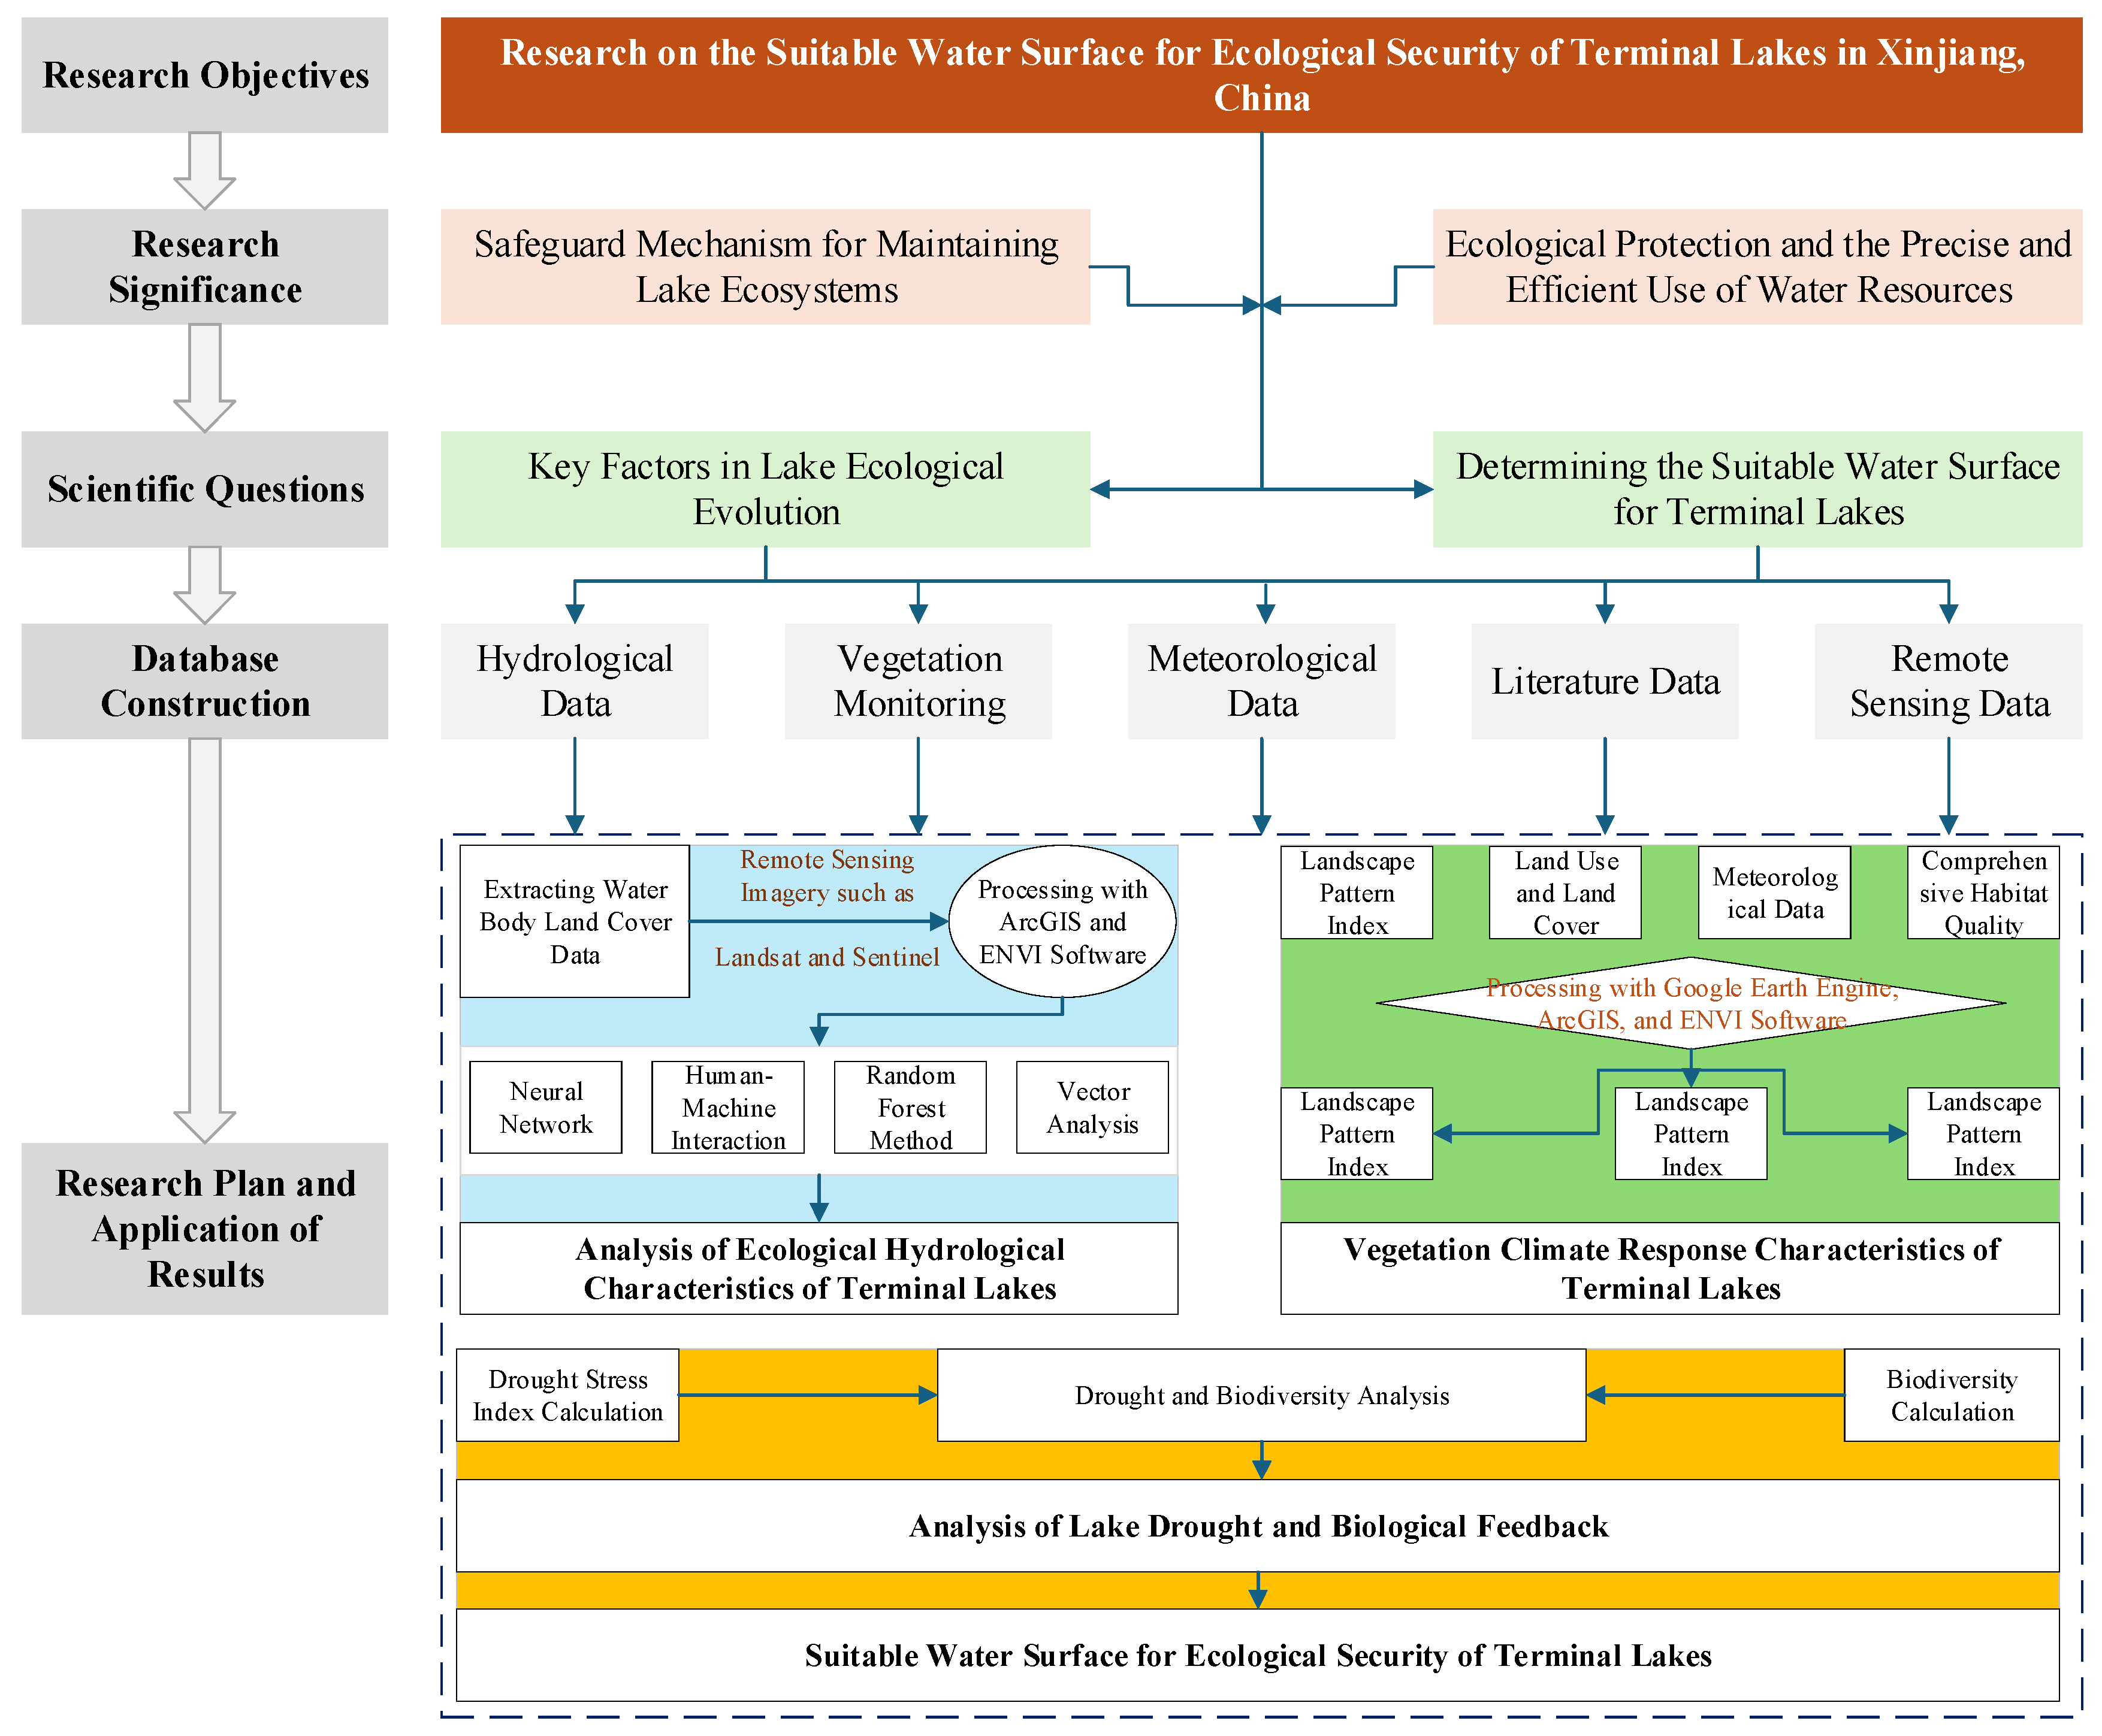
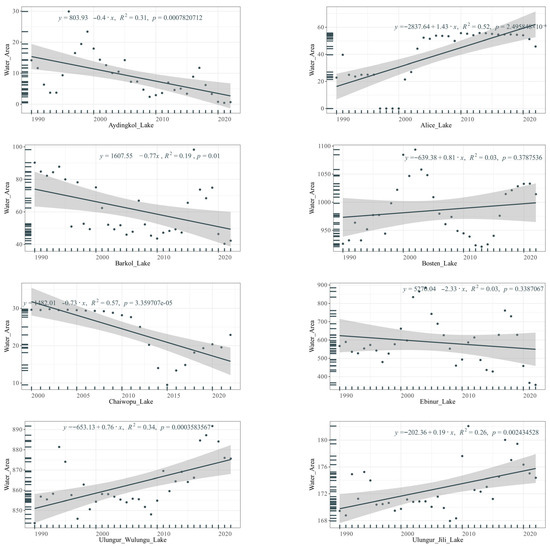
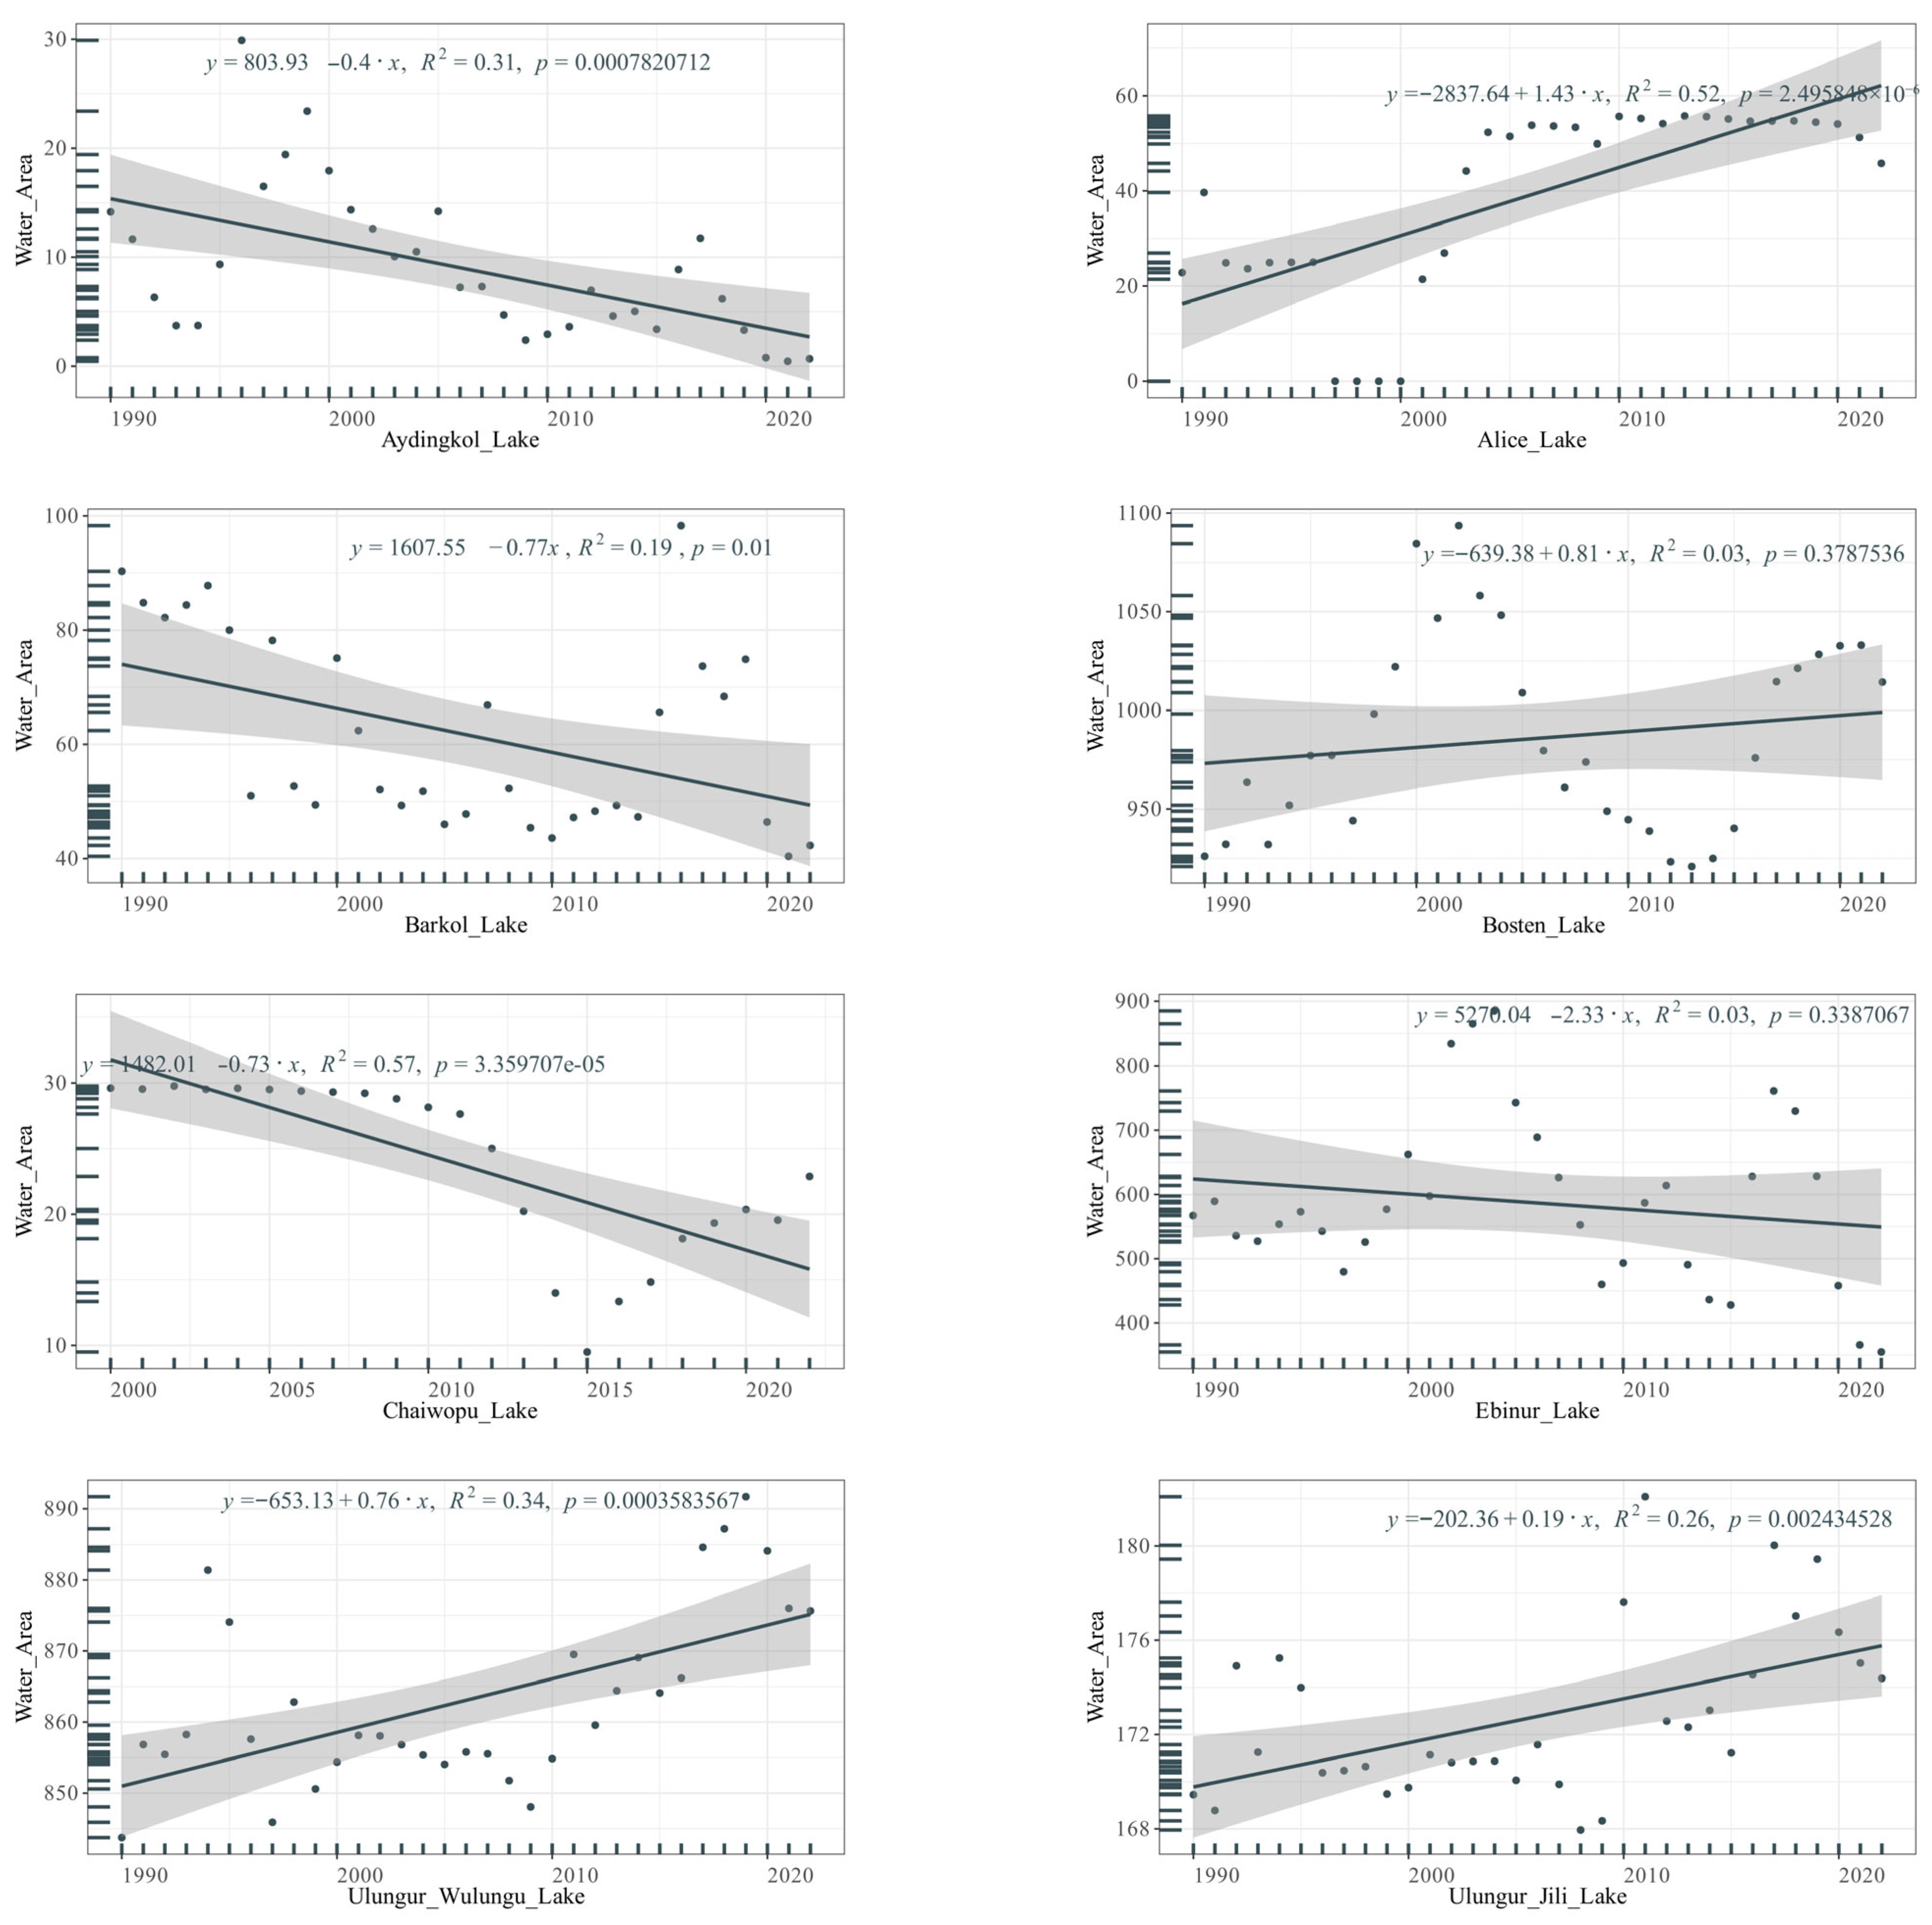
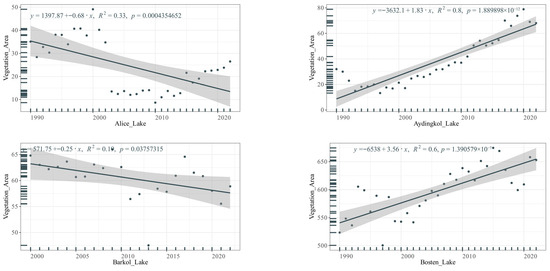
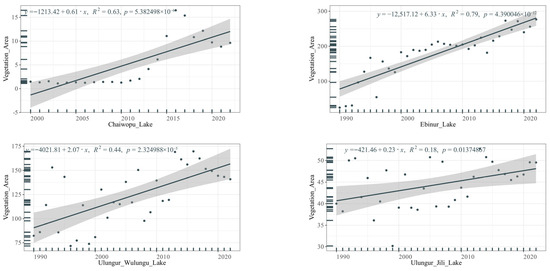
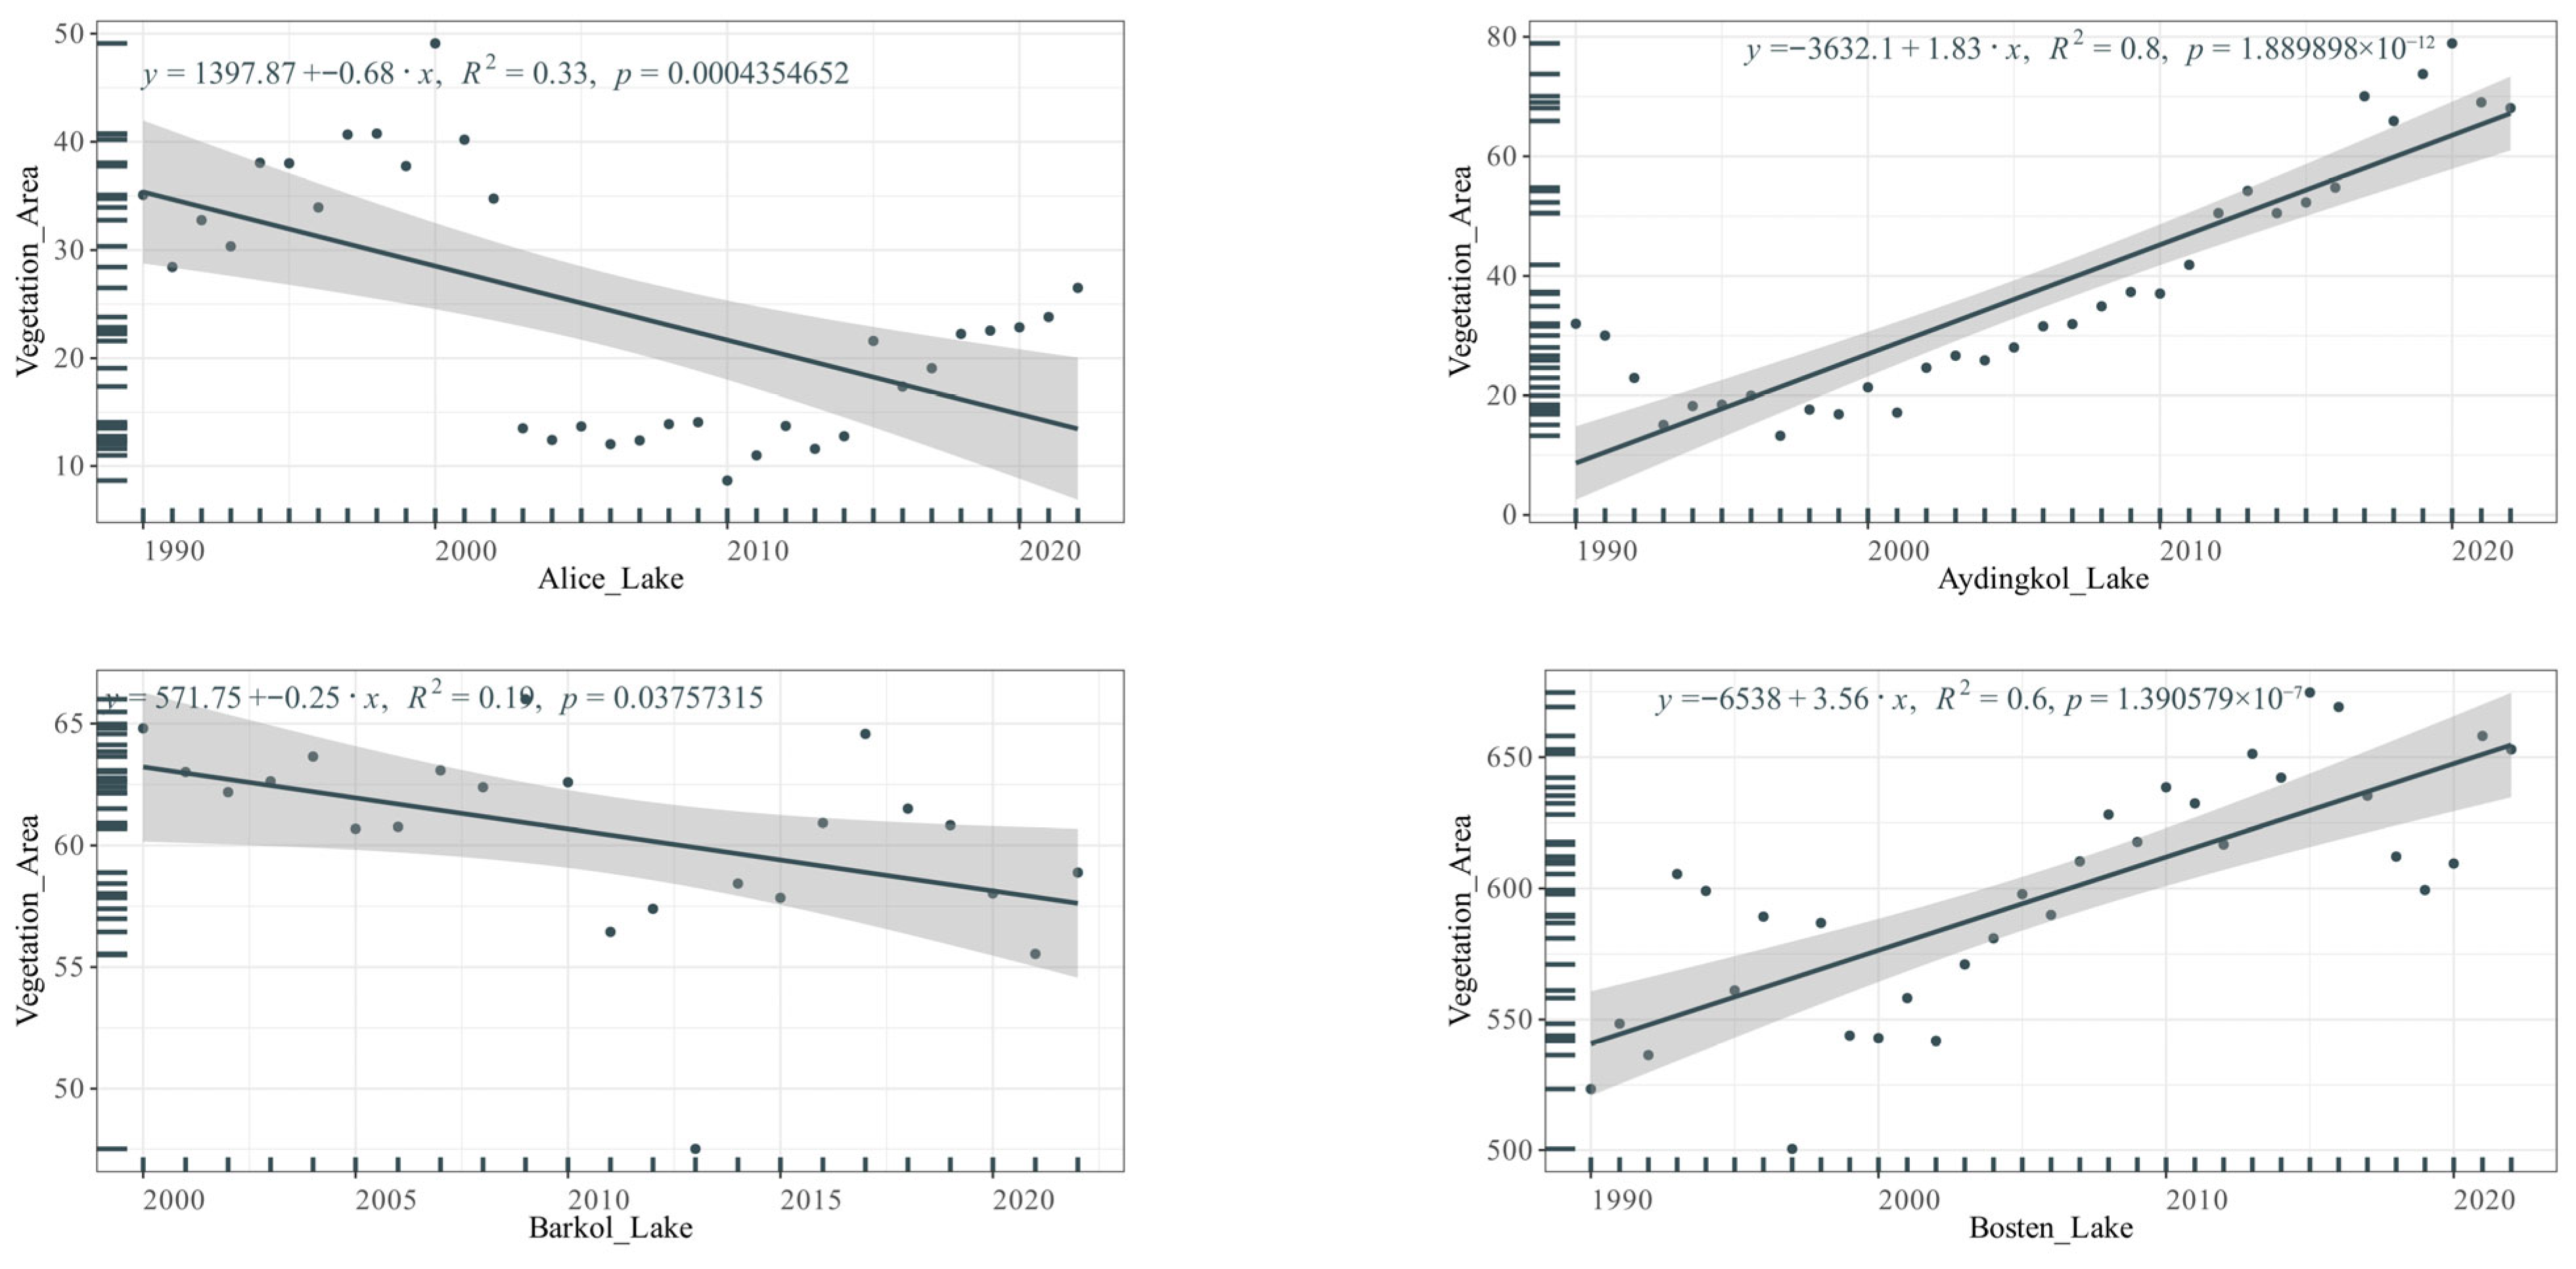
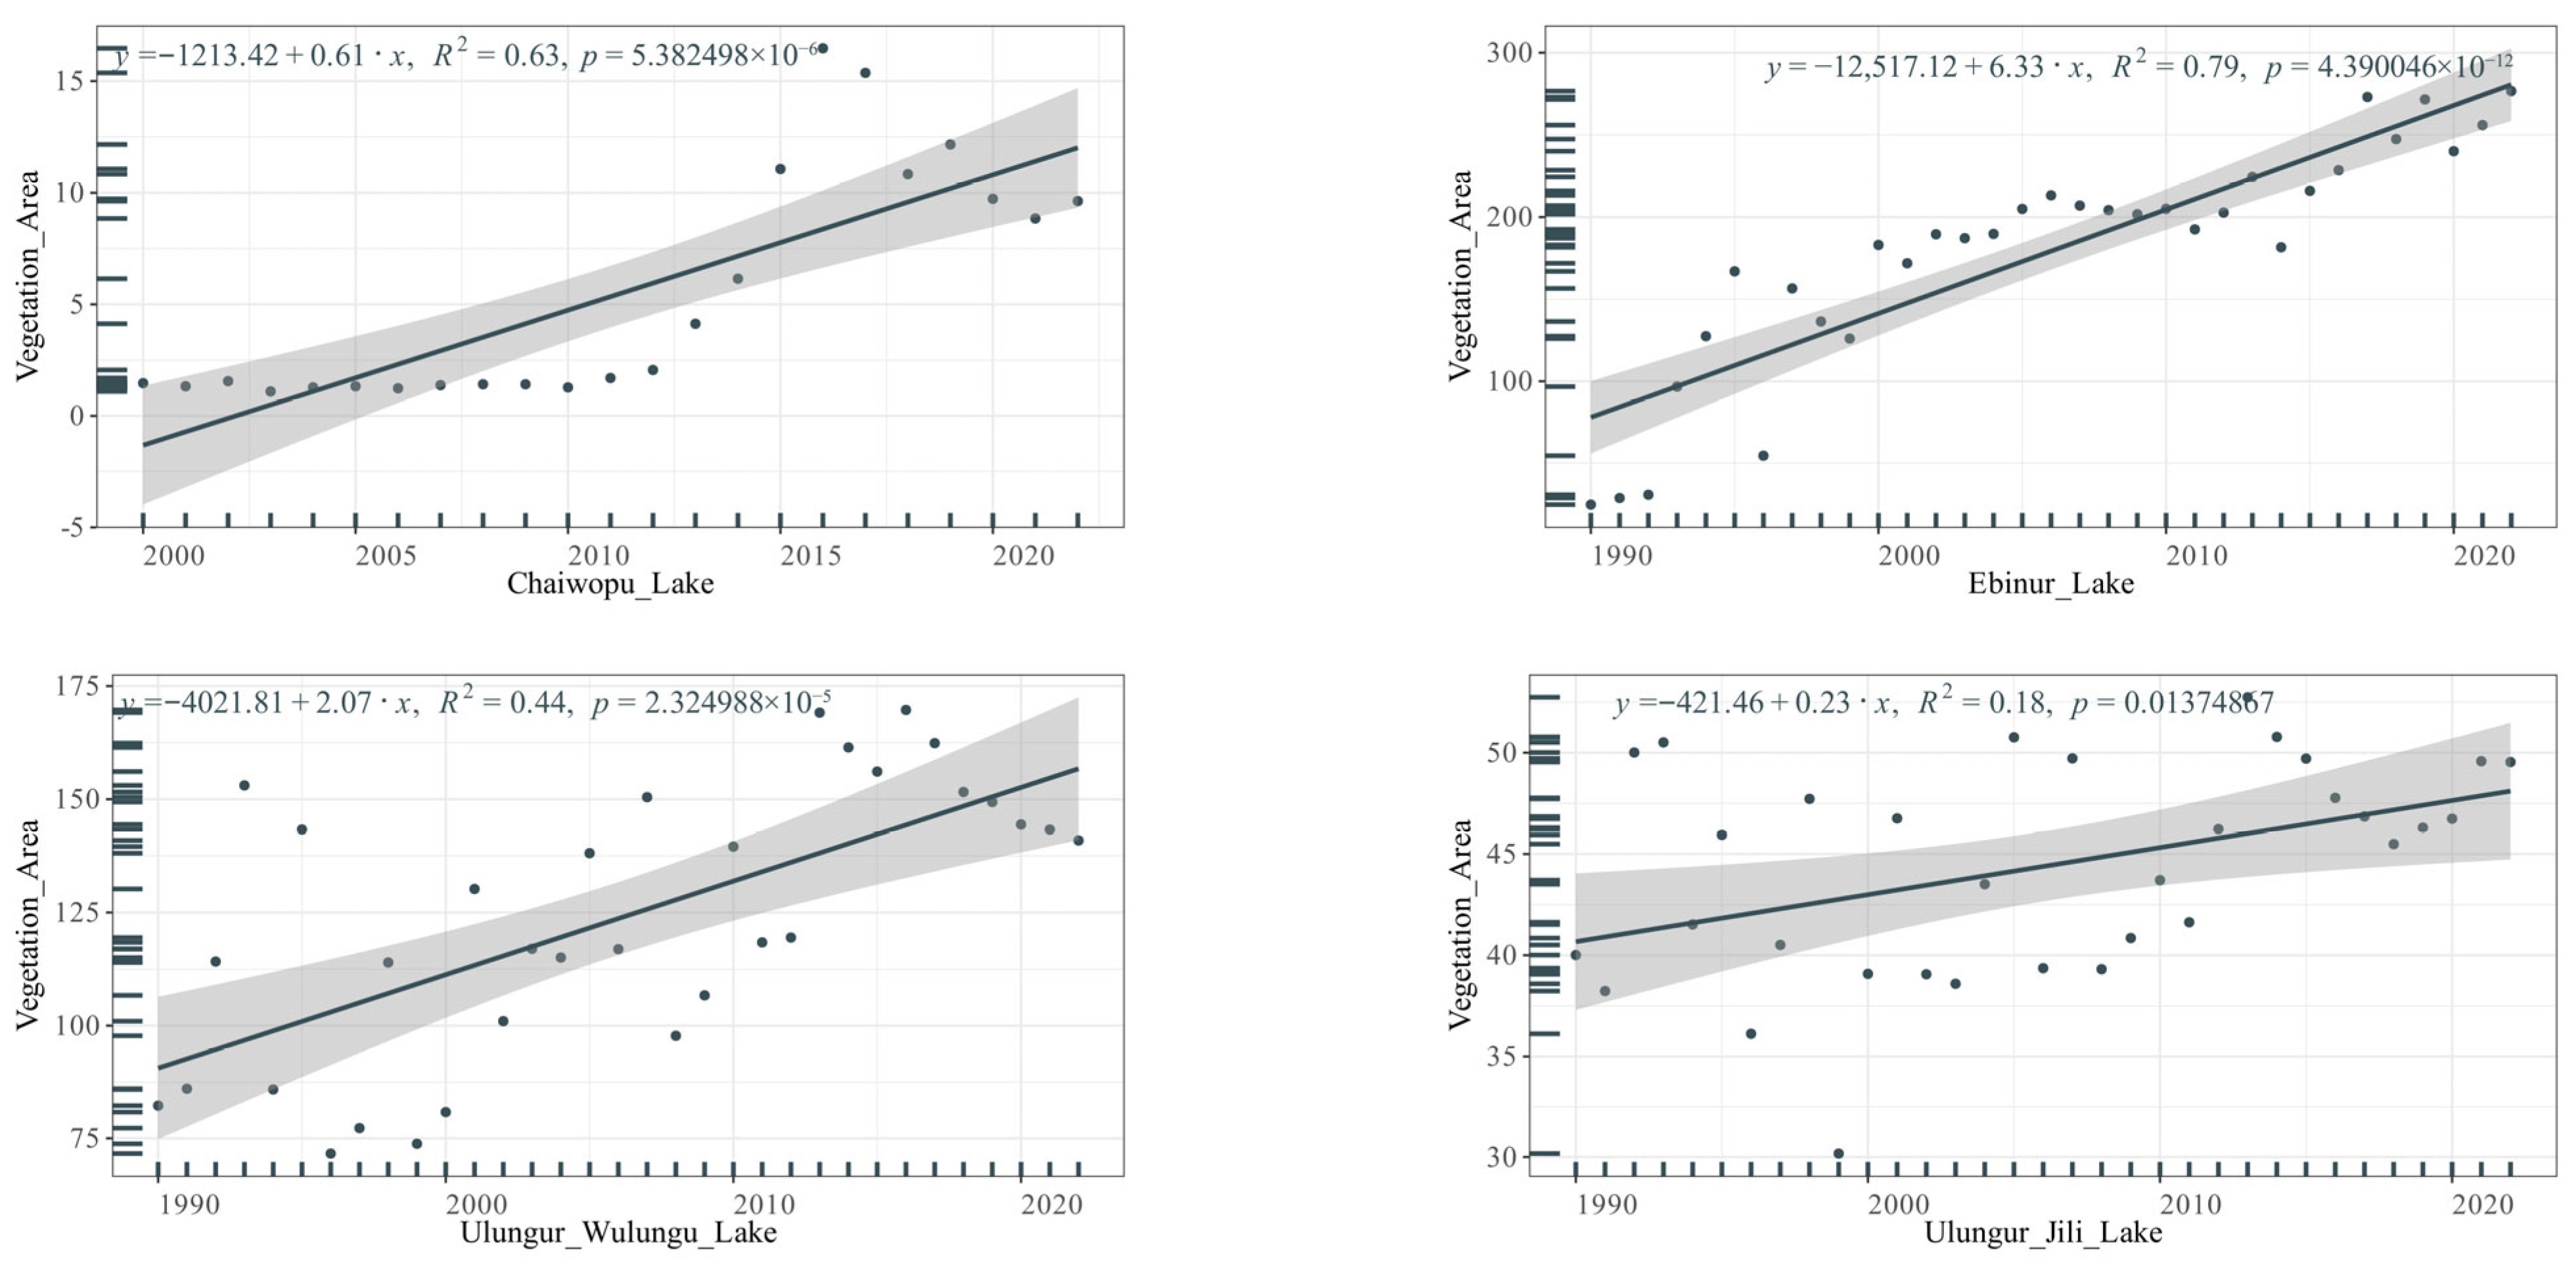
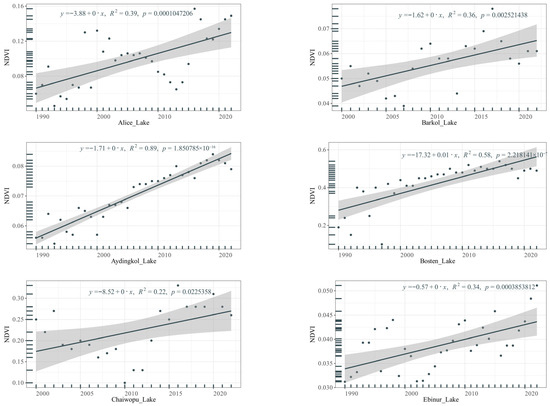
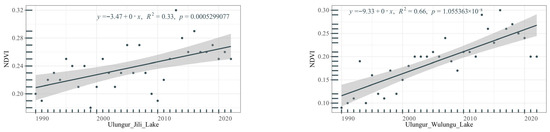
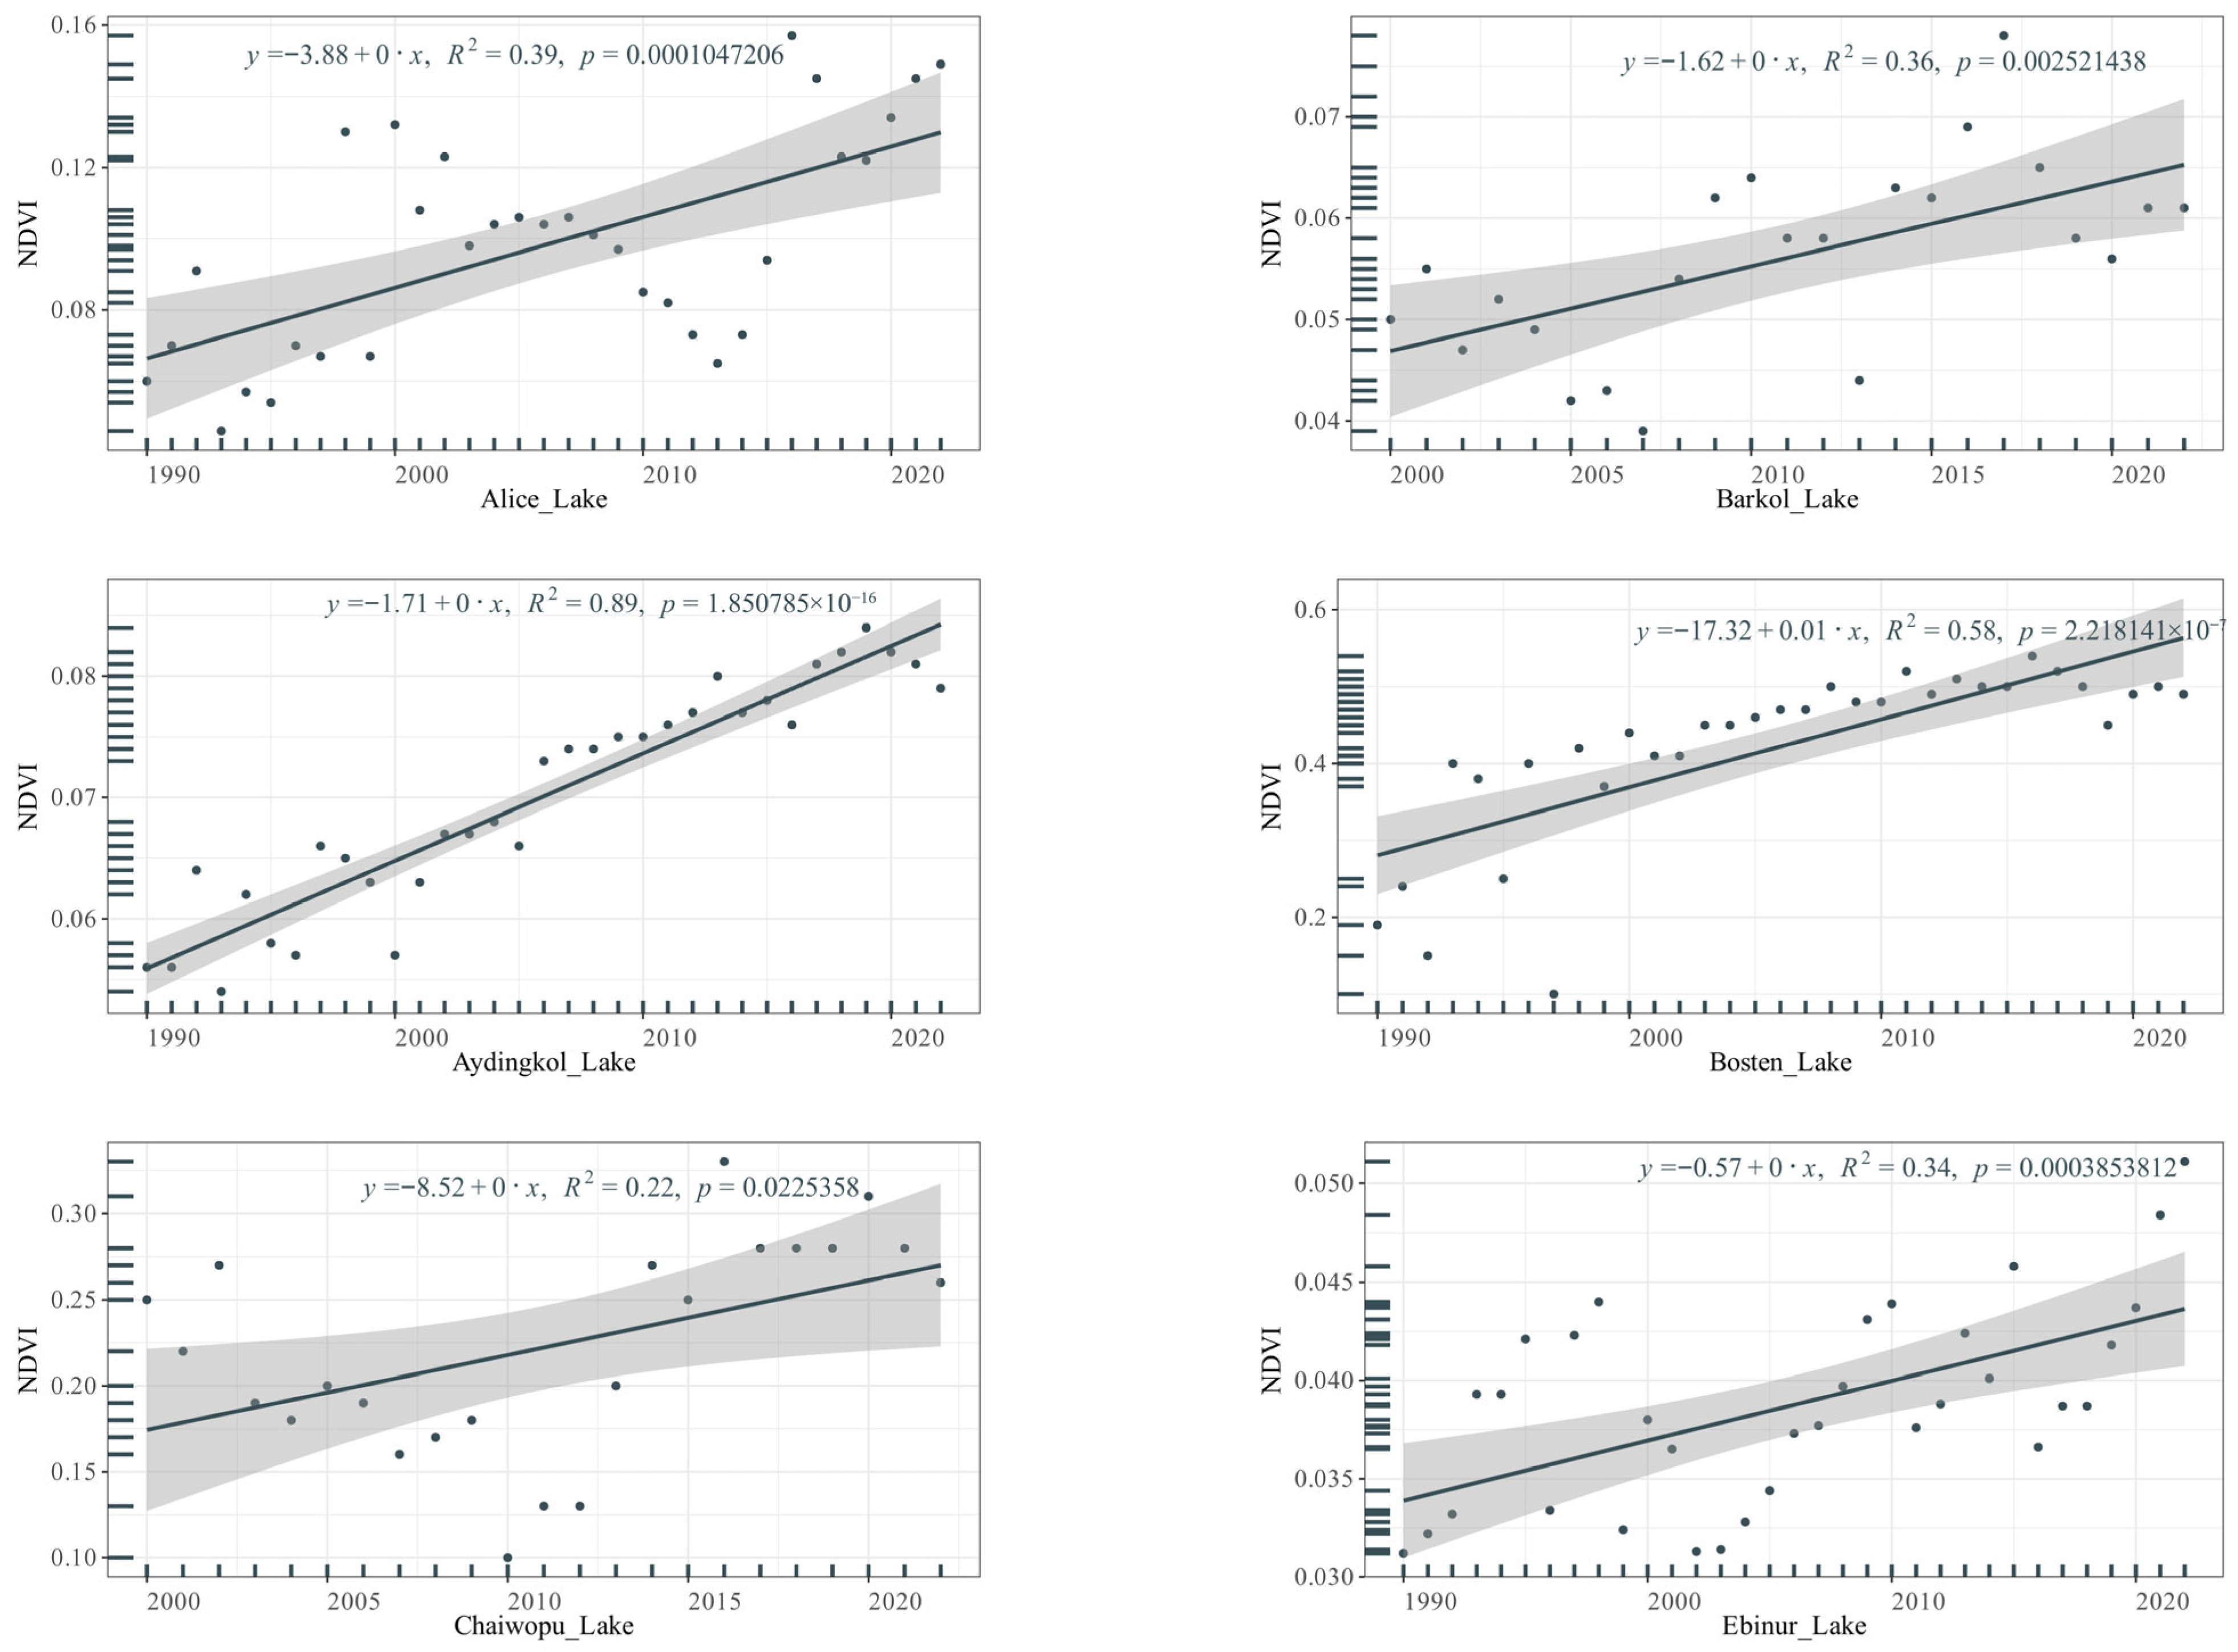
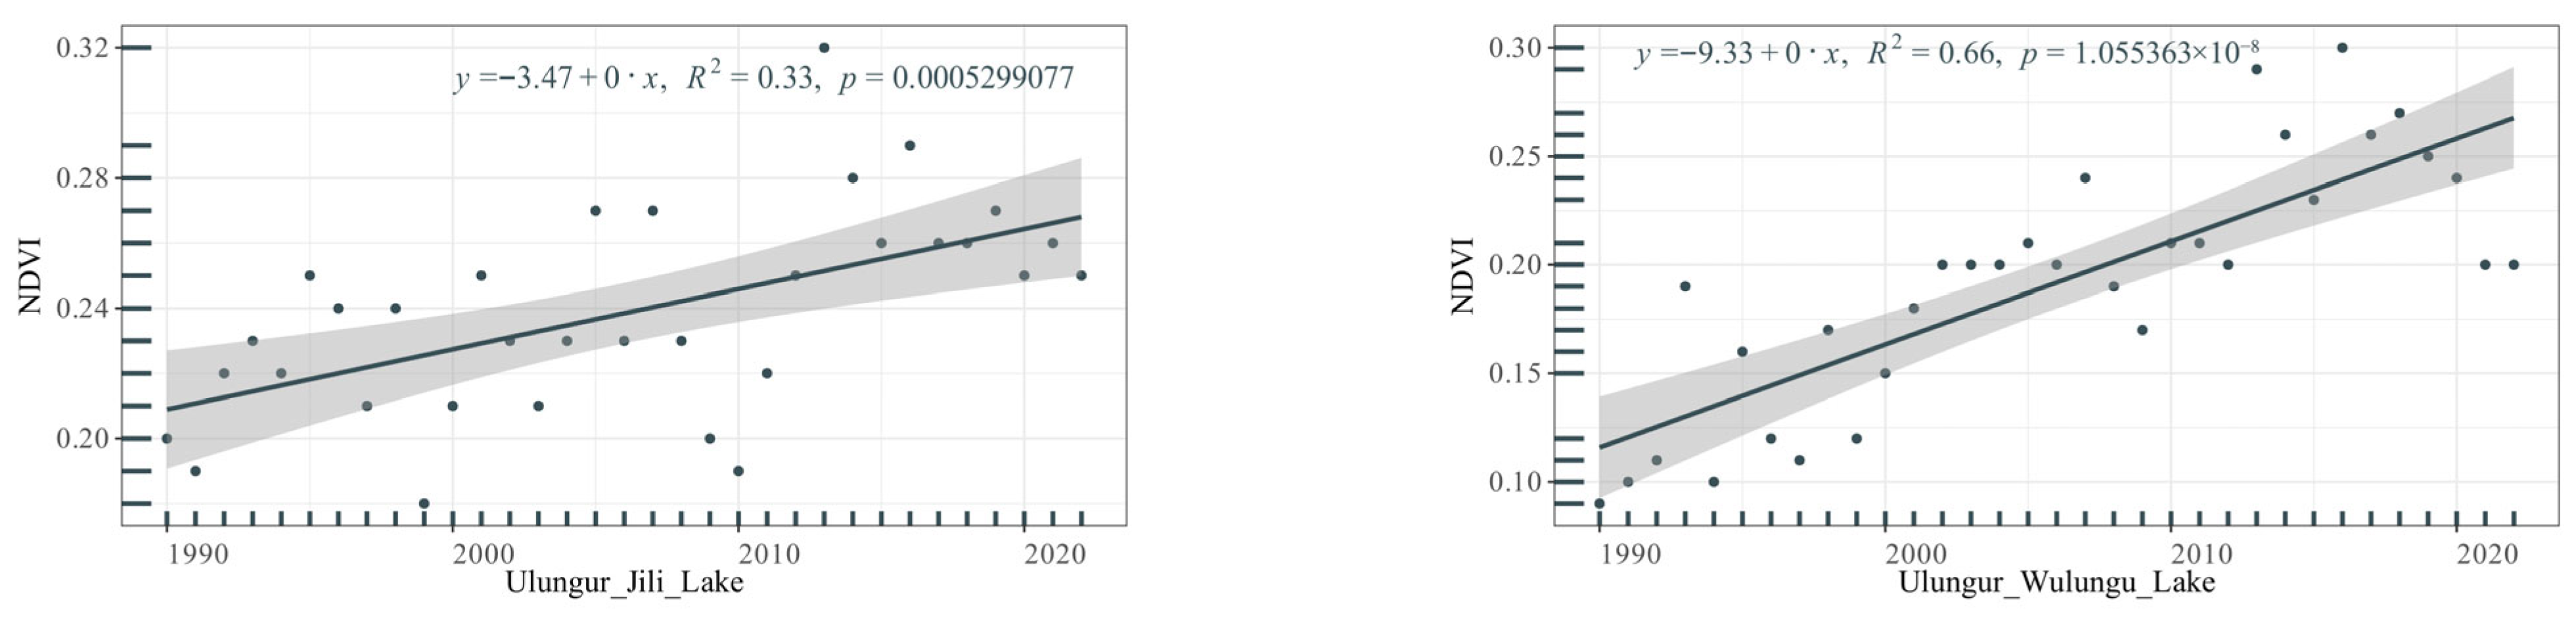
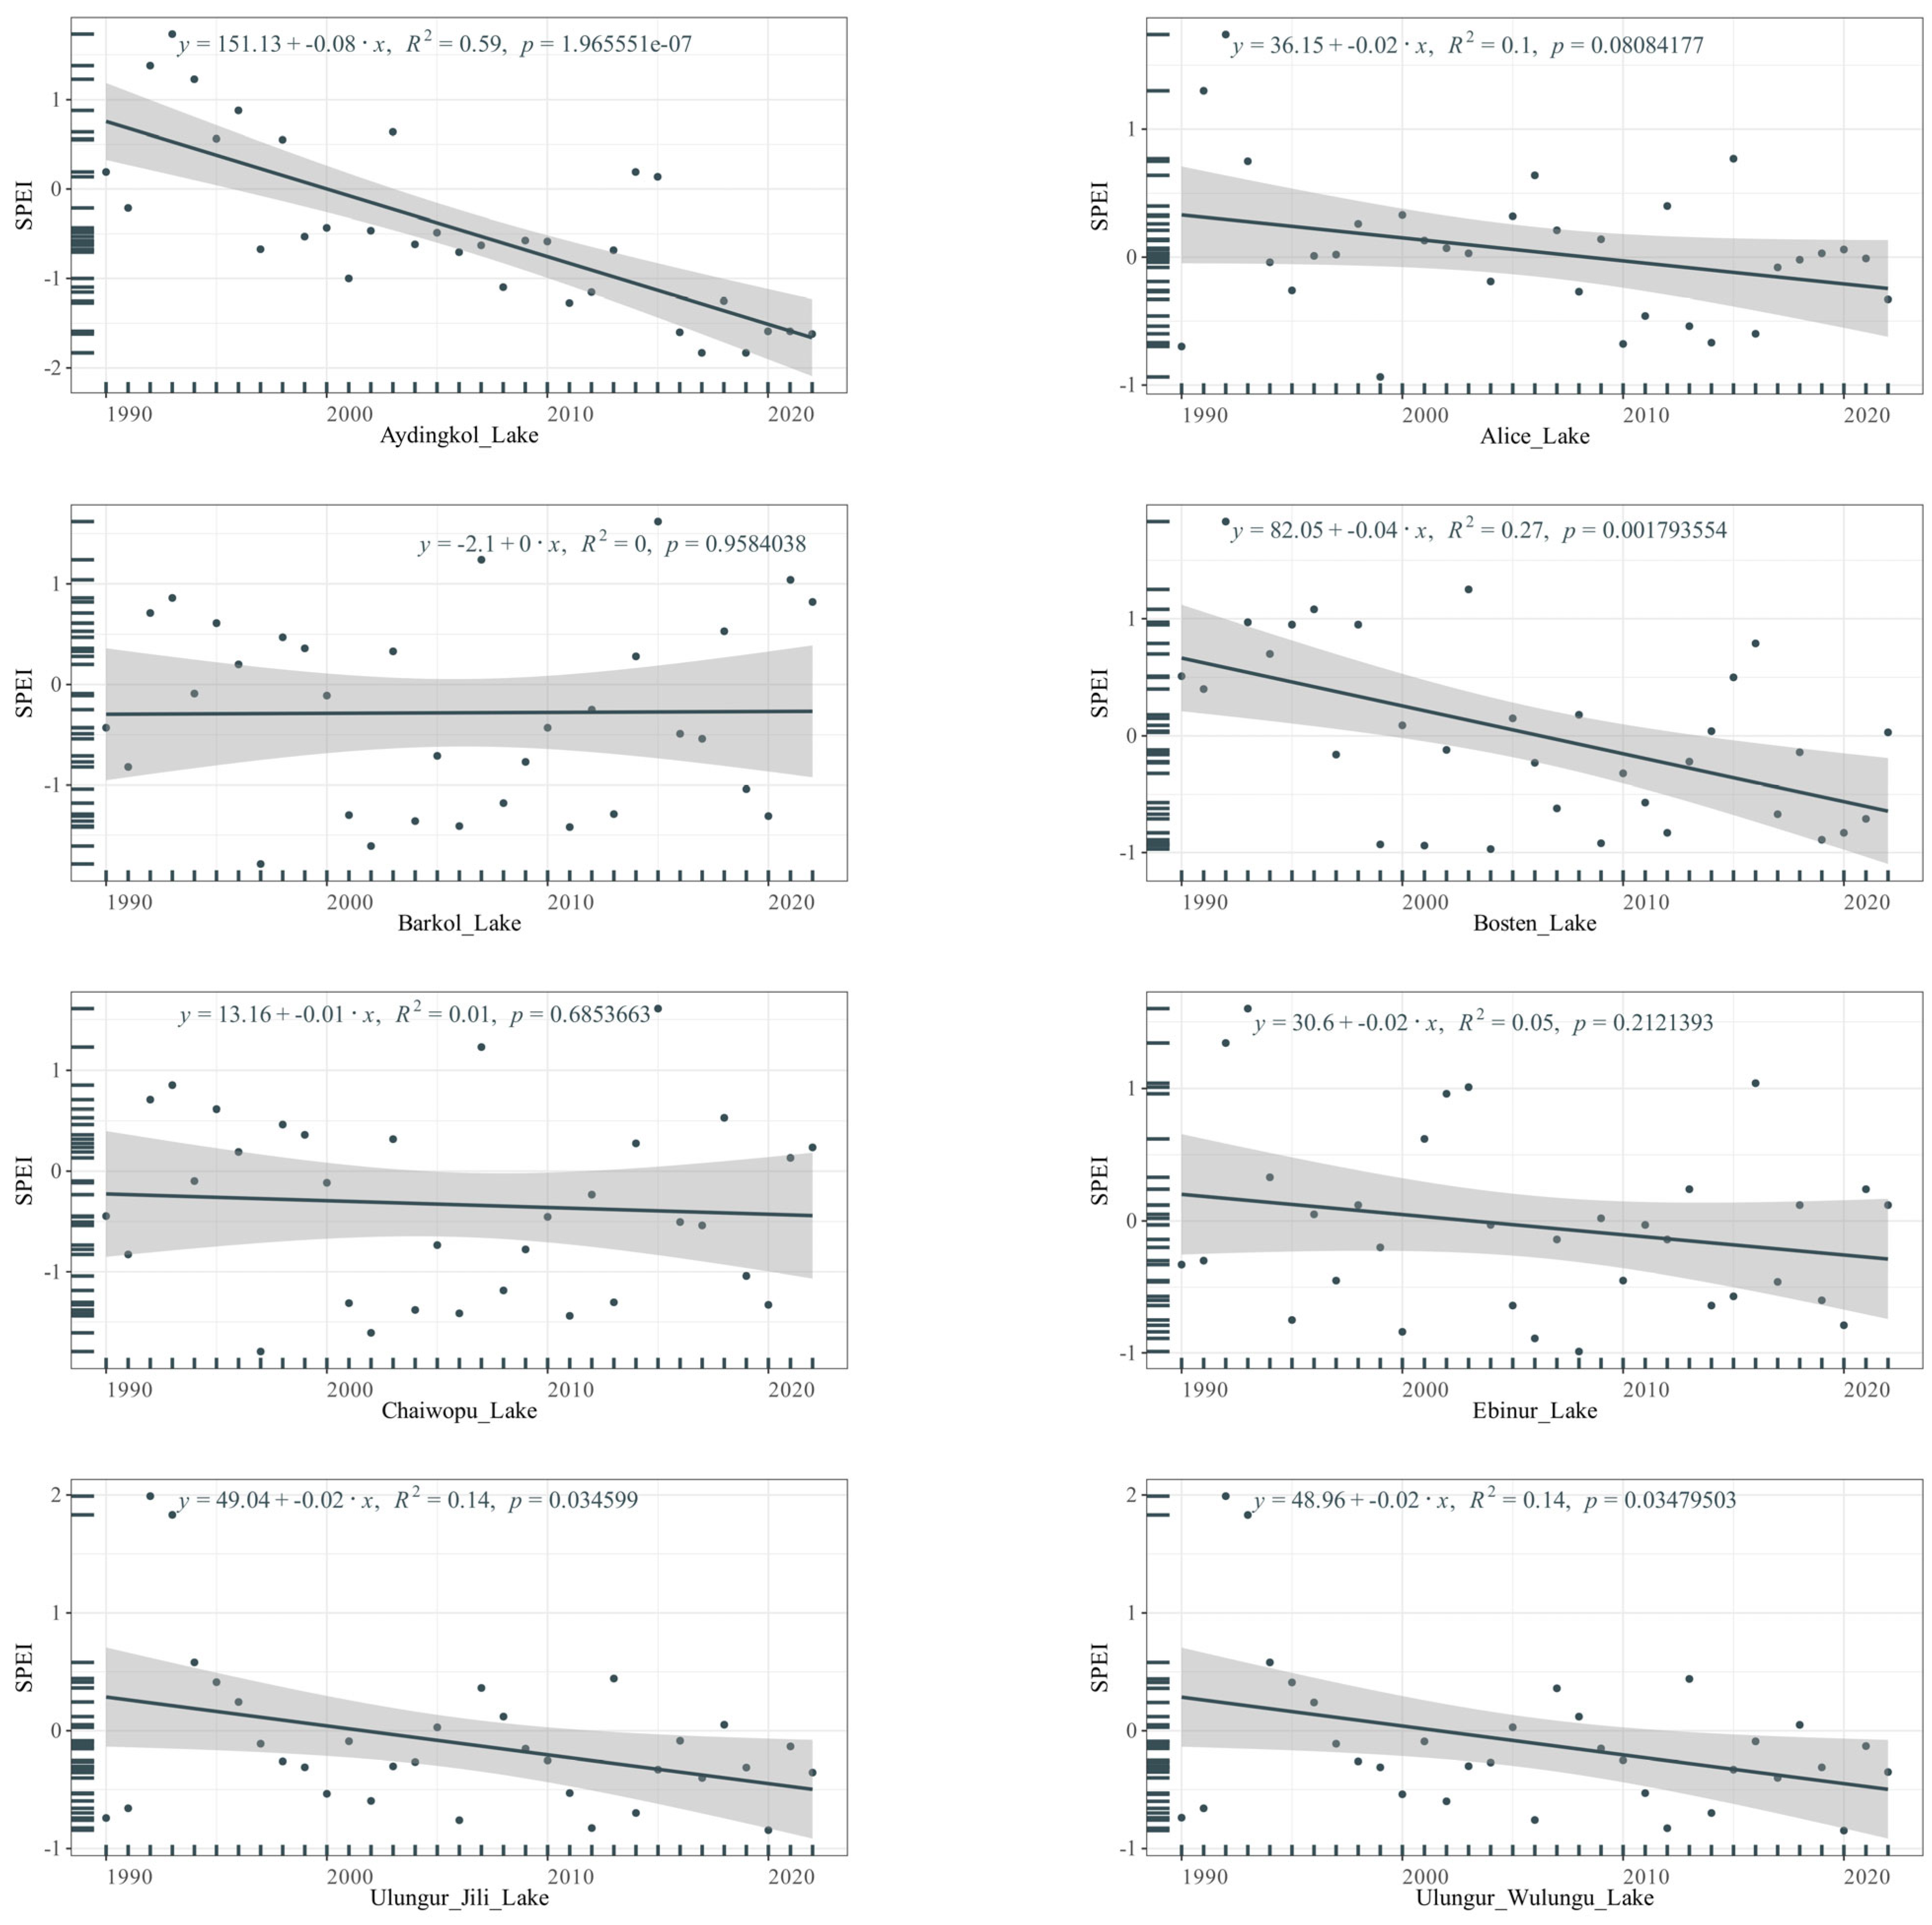
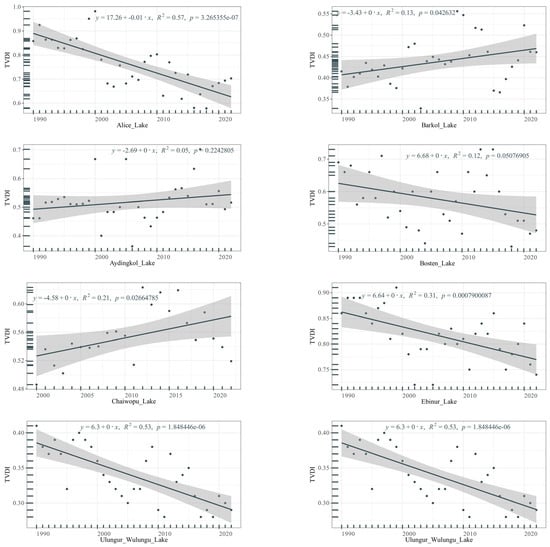
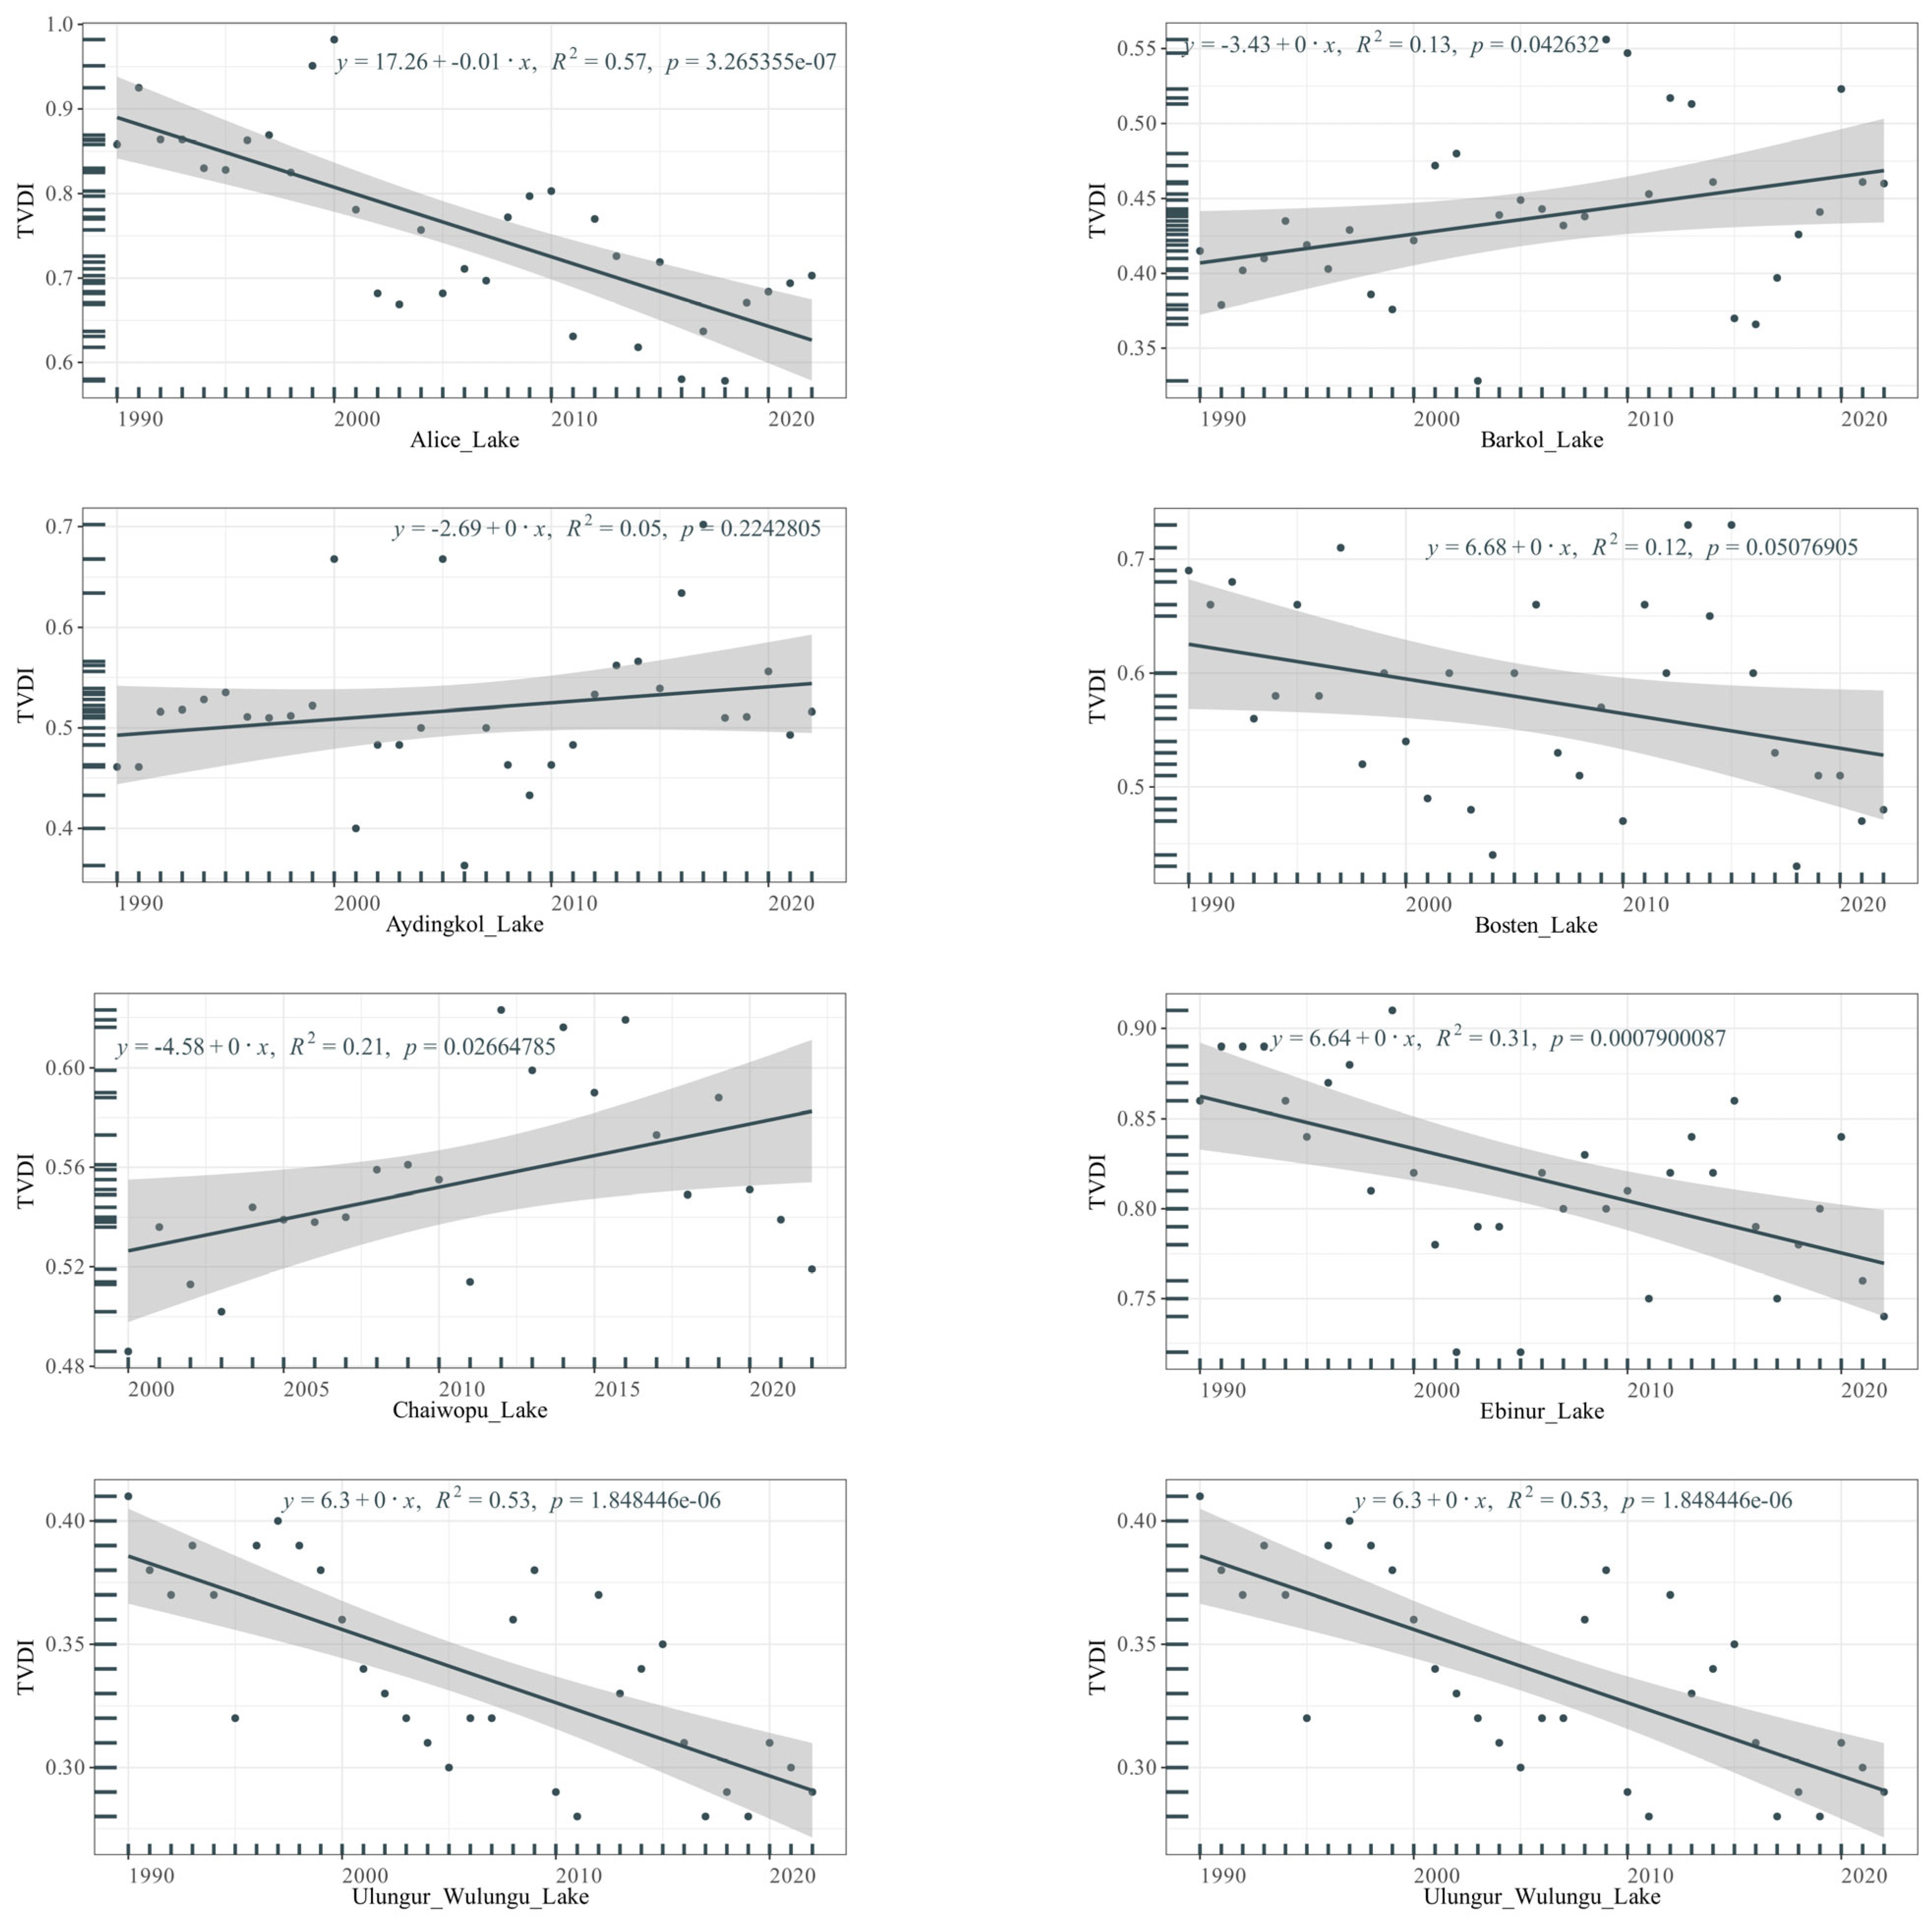
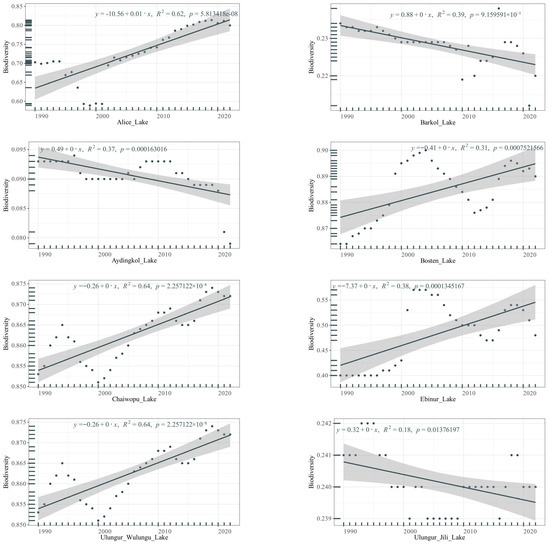
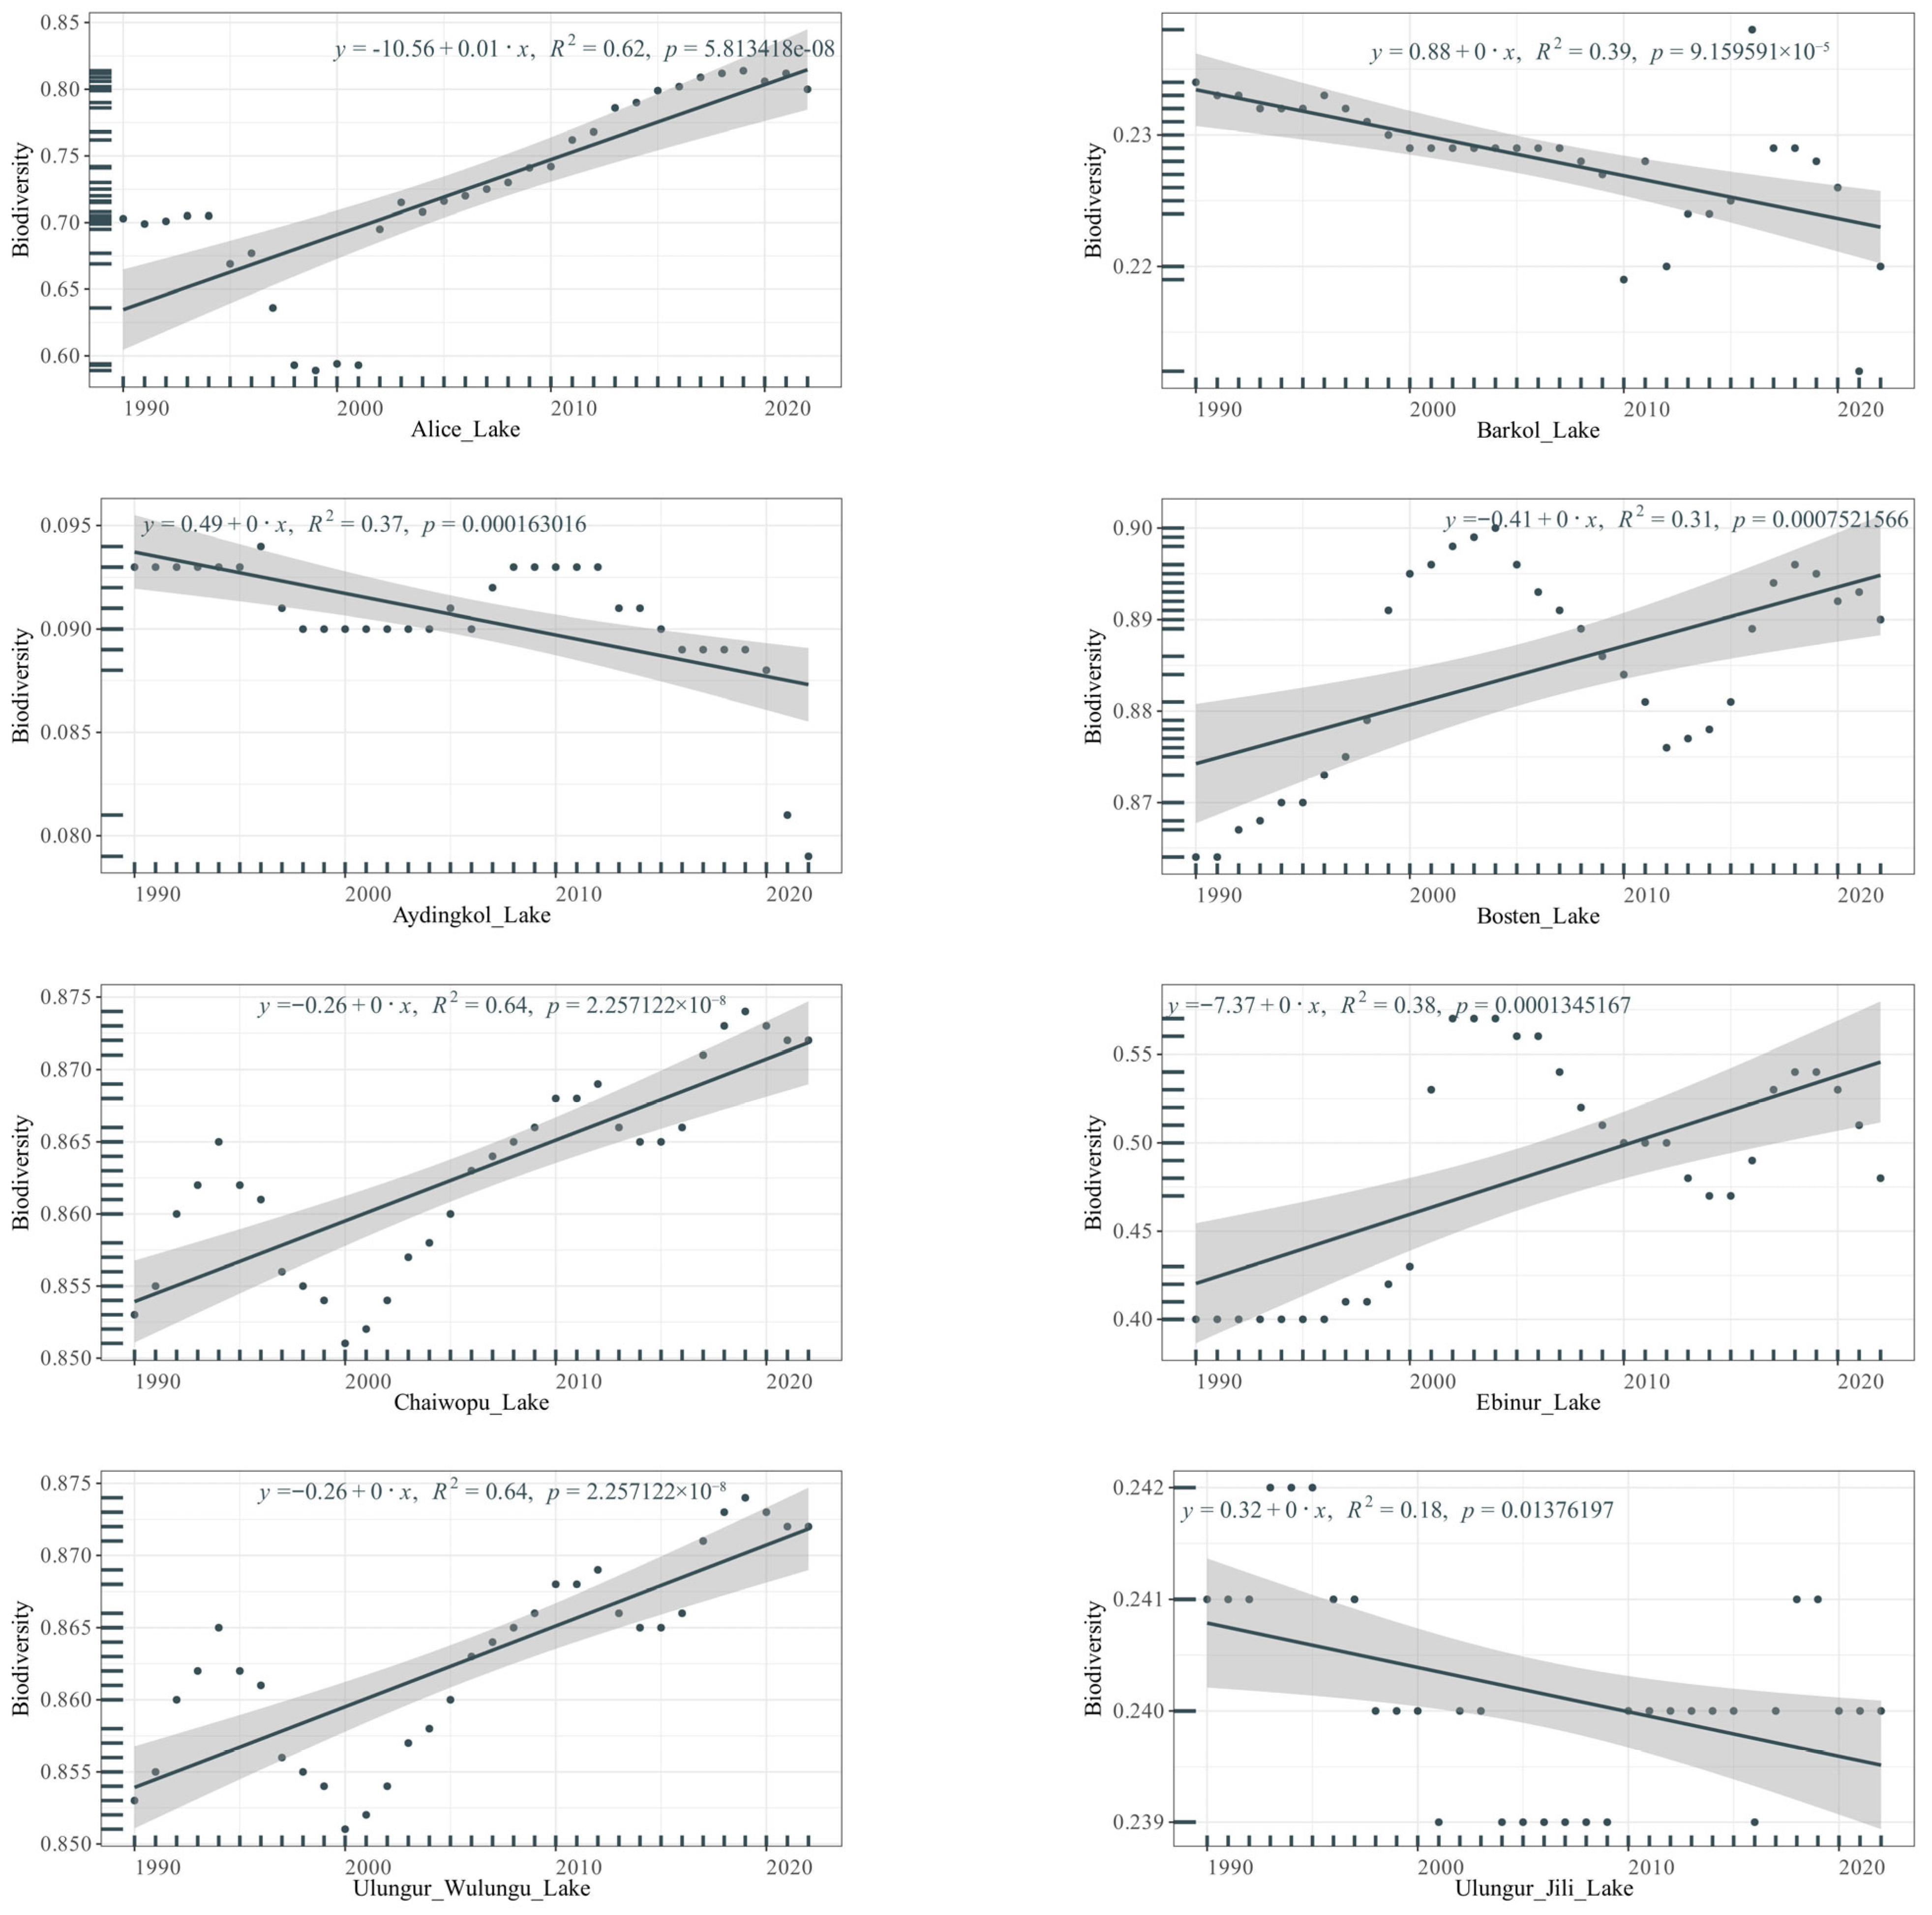
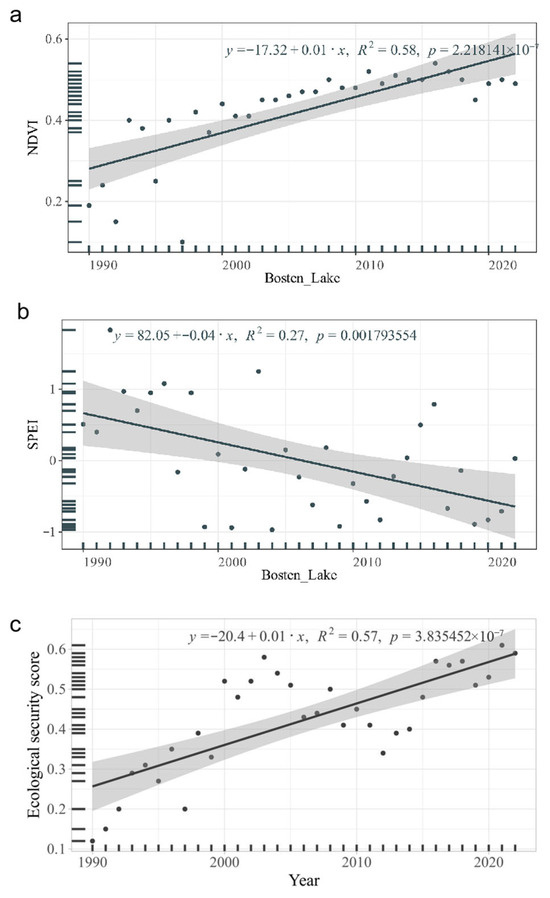
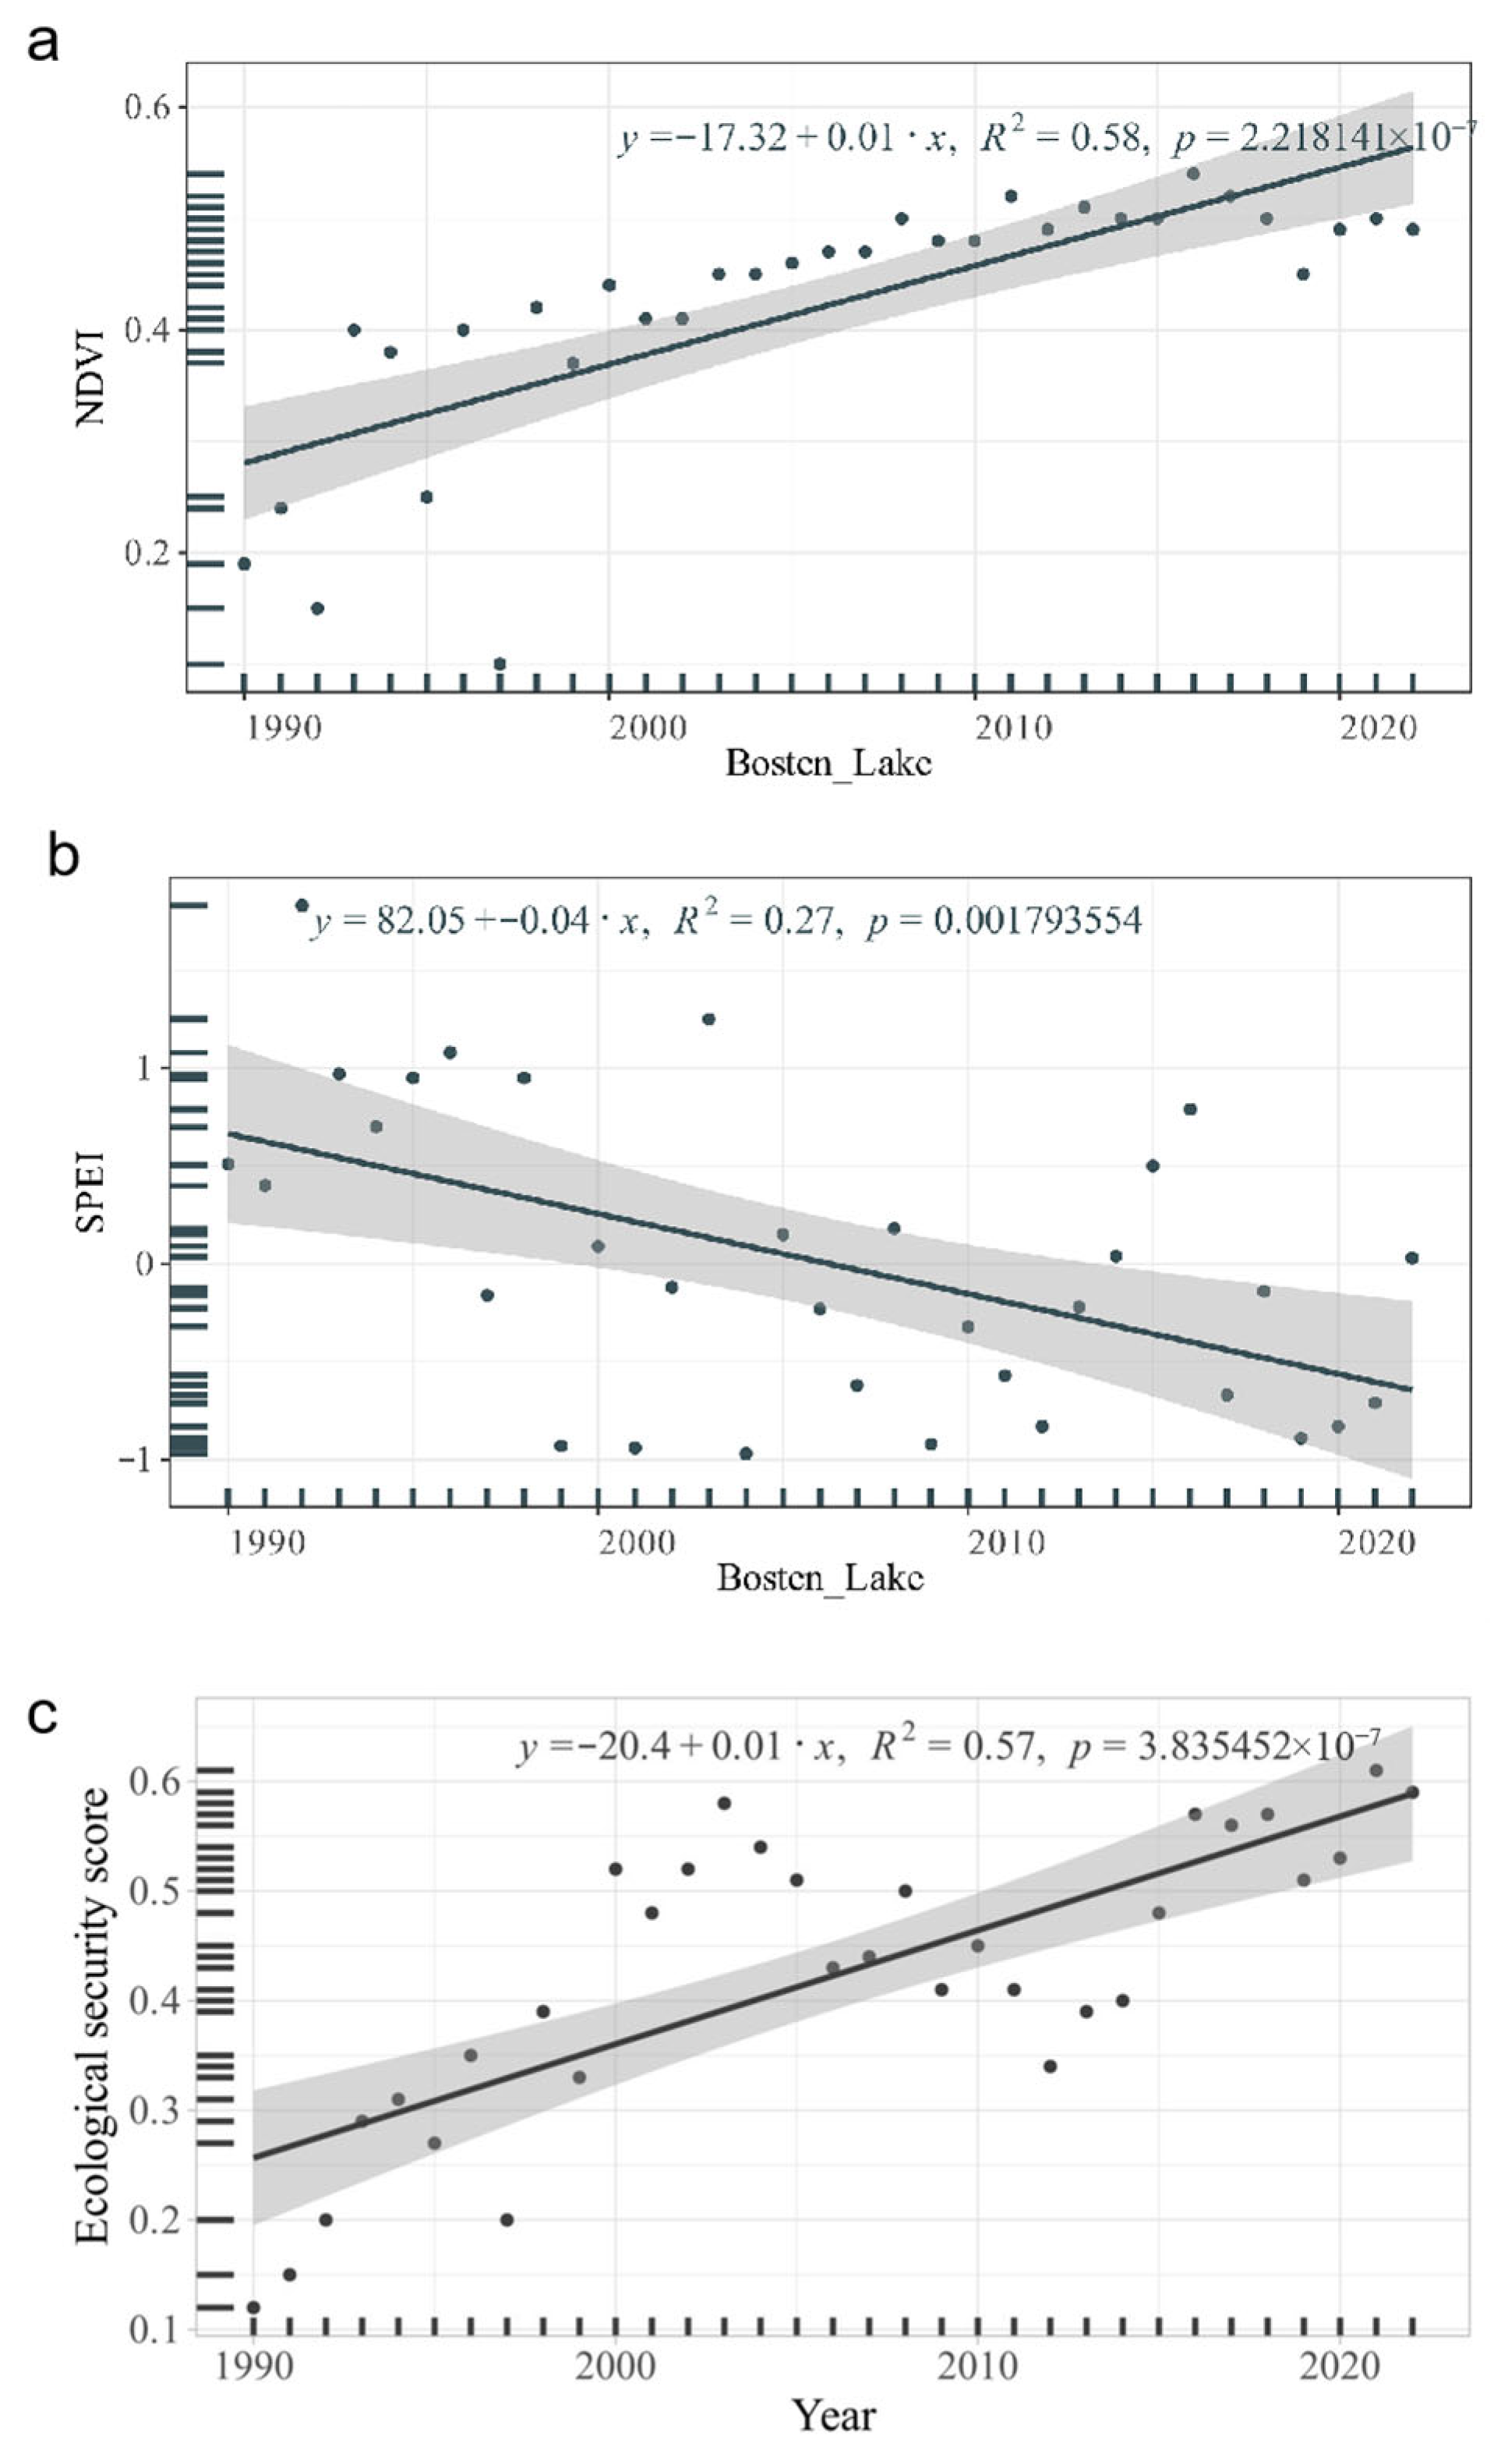







Disclaimer/Publisher’s Note: The statements, opinions and data contained in all publications are solely those of the individual author(s) and contributor(s) and not of MDPI and/or the editor(s). MDPI and/or the editor(s) disclaim responsibility for any injury to people or property resulting from any ideas, methods, instructions or products referred to in the content. |
© 2026 by the authors. Licensee MDPI, Basel, Switzerland. This article is an open access article distributed under the terms and conditions of the Creative Commons Attribution (CC BY) license.