Article

Critical Inflection Points Govern PM2.5 Decline Dynamics in the Guangdong–Hong Kong–Macao Region


1
School of Chemistry and Environmental Engineering, Hanshan Normal University, Chaozhou 521041, China
2
Chaozhou Environmental Information Center, Chaozhou 521011, China
3
Department of Renewable Resources, University of Alberta, Edmonton, AB T6G 2E3, Canada
*
Authors to whom correspondence should be addressed.
Atmosphere 2026, 17(3), 307; https://doi.org/10.3390/atmos17030307
Submission received: 9 January 2026 / Revised: 4 March 2026 / Accepted: 4 March 2026 / Published: 17 March 2026
(This article belongs to the Section Air Quality)

Abstract

The Guangdong–Hong Kong–Macao (GHM) region (especially the Greater Bay Area), a low-lying economic hub in southern China, faces complex particulate matter (PM2.5) pollution dynamics under the combined influence of monsoonal systems and global warming. While long-term PM2.5 reductions are documented, phase-specific trends remain obscured. Here, we analyze high-resolution ChinaHighPM2.5 dataset observations (2000–2023) using moving averages and piecewise regression to quantify abrupt shifts in interannual and seasonal PM2.5 trends across the region. We identify 2014 and 2016 as critical breakpoints for annual PM2.5 concentration (Mean-5y-Year) and its linear acceleration rate (k-5y-Year), respectively. Critical breakpoints delineate phases where declines persisted but decelerated. Prior to 2014, the PM2.5 levels exhibited an upward trend (+0.203 µg·m−3·a−1, p > 0.05), which reversed sharply post-2014 (−2.046 μg·m−3·a−1, p < 0.01). Spatially, breakpoints clustered post-2014 for concentrations, while acceleration rate shifts reveal a latitudinal divergence near 23° N (23.873°~22.812° N); southern areas transitioned earlier (2010–2011) versus post-2014 in the north. Post-inflection declines are strongest toward the GBA urban core, with winter and autumn driving seasonal improvements (winter: steepest decline −2.646 μg·m−3·a−1; autumn: largest trend reversal Δ−3.961 μg·m−3·a−1), while improvement rates narrowed post-2016 (Δk = +0.527 µg·m−3·a−2). This study establishes that apparent regional PM2.5 reductions mask significant spatiotemporal heterogeneity, underscoring the necessity of phase-specific analysis for effective pollution control in climatically vulnerable megaregions.

1. Introduction

Globally, PM2.5 exposure is estimated to contribute to one premature death approximately every seven seconds—a silent biocide claiming 58% of 8.1 million annual air pollution deaths. Particles infiltrate deep into the respiratory system and enter systemic circulation, triggering widespread physiological damage [1,2]. These particles readily infiltrate human tissues via the respiratory tract and systemic circulation, impairing immune function and severely impacting multiple organ systems, including the respiratory, cardiovascular, and neurological systems [3,4,5,6,7,8,9,10]. Exposure to PM2.5 is associated with numerous adverse health outcomes. These include respiratory diseases, cardiovascular impairment, neurological disorders, adverse reproductive outcomes, and the acceleration of conditions such as lung cancer progression, brain aging, Alzheimer’s disease, and Lewy body dementia [4,5,6,7,8,9,10,11,12]. China bears a disproportionate burden, experiencing approximately 40% of these PM2.5-linked fatalities [13]. The dose–response tyranny remains unequivocal across continents, as each 10 µg·m−3 increment elevates mortality risk by ~8% [14]. Specifically, it increases all-cause mortality by 4% and cardiopulmonary deaths by 7–10% [15]. Pascal et al.’s analysis of 25 European cities confirms achieving WHO PM2.5 guidelines (10 µg·m−3) would extend life expectancy by ≥22 months in adults ≥30 years. This intervention would avert 19,000 premature deaths annually [16].
Spatially, 99% of the global population resides in areas exceeding recommended air quality standards [17]. The spatiotemporal heterogeneity of PM2.5 concentrations is profound, varying significantly across global, national, regional, and urban scales [1,18,19,20,21,22,23]. Stark disparities exist between developed and developing nations, with intensifying gradients observed in regions like South and Southeast Asia [18,19,20,21]. PM2.5 distribution obeys orographic sentencing dictated by China’s Hu Huanyong Line—higher concentrations dominate the eastern and northern regions compared to the west and south [24,25,26]. Major pollution hotspots include the Beijing–Tianjin–Hebei (BTH), Yangtze River Delta (YRD), and Pearl River Delta (PRD) regions [24,25,27,28], with the PRD typically exhibiting lower levels than the BTH and the YRD [29,30,31,32]. Intra-regional variations are also significant; the PRD shows a decreasing gradient inland to coastal [33,34,35], while urban areas consistently exceed rural concentrations in eastern provinces [36]. The Chengdu–Chongqing Economic Circle (CCEC) peaks in its central basin [37]. Pronounced seasonal cycles are universal, with winter concentrations consistently highest nationwide, followed by spring, autumn, and summer [21,24,26,38], a pattern replicated in key regions like BTH, Bohai Rim, CCEC, and PRD [34,35,37,39,40]. Winter concentrations persistently reach 2.0× summer levels under atmospheric stagnation [1,35].
Longitudinal trends reveal complex dynamics. While significant national increases were reported between 1999 and 2011 [28], contrasting trends emerged later, with marked increases in southern China (1980–2016) contrasting relative northern stability [31]. An inverted U-curve relationship between economic development and PM2.5 is theorized [25,41], with evidence of subsequent decoupling—declining PM2.5 despite continued growth—observed in developed regions (Europe, Australia, North America) [19] and increasingly reported within China [42,43,44]. This decoupling is demonstrably driven by effective mitigation policies. Significant reductions have been achieved in the US (e.g., 42% in California) [45], the EU (e.g., 0.4 μg·m−3 annual decrease at traffic/industrial sites) [46], and Japan (e.g., 3.7% annual reduction in Amagasaki) [47]. China’s stringent policies, notably the Air Pollution Prevention and Control Action Plan and the Three–Year Action Plan for Winning the Blue Sky Defense War, have yielded substantial improvements [3,25,38,41,48,49,50,51,52]. Between 2013 and 2016, average PM2.5 decreased by ~29% in key cities [47], ~33% in BTH, ~31% in YRD, and ~32% in PRD [29]. By 2023, reductions relative to 2013 reached 58% (BTH), 59% (YRD), and 55% (PRD) [29,30], translating to a 17.1% decrease in PM2.5-related health impacts in BTHS and FWP between 2015 and 2020 [51].
The Guangdong–Hong Kong–Macao (GHM) region, especially the Greater Bay Area (GBA), a vital economic hub in southern China [34,53], presents a compelling microcosm for studying PM2.5 dynamics. Its complex topography (189:1 elevational gradient)—featuring dramatic elevational gradients from coastal plains (PRD, Chaoshan Plain) to mountainous peaks exceeding 1900 m (Nanling Mountains, Figure 1a)—interacts dynamically with the East Asian/South Asian Monsoons, local land–sea breezes [54], and global climate warming. This confluence creates significant spatiotemporal variability in PM2.5. Understanding these patterns is scientifically critical, underscored by findings that PM2.5-related premature mortality within the PRD concentrates in densely populated, highly polluted urban cores [33,35], and holds vital theoretical significance for regional sustainability. However, a critical knowledge gap persists. PM2.5 evolution occurs in non-linear phases driven by emissions (e.g., policy interventions) and meteorology. Constant trends obscure accelerating/decelerating regimes (k-variation). These phases exhibit divergent long-term trends and acceleration patterns (rates of change). Previous studies exhibit two limitations: focusing on overall trends [36,49,55] or employing arbitrary temporal segmentation (e.g., fixed 5-year [35,51,56] or 10-year intervals [12,25,55] or maxima). These approaches potentially obscure nuanced phase transitions and their drivers. Therefore, this study addresses two pivotal questions: (1) How can significant breakpoints in PM2.5 levels and their spatial characteristics be objectively identified? (2) How can the quantitative evolution of spatiotemporal patterns before and after these breakpoints be characterized? To address this gap and accurately characterize the spatiotemporal dynamics of PM2.5 across the GHM since 2000, we thus deploy F-test-validated breakpoints (α = 0.05) objectively identifying inflection years [57]. This approach enables us to identify significant breakpoints in annual mean concentrations and their trend slopes (k), quantify shifts in spatial heterogeneity across these transitions, and provide a robust analytical framework for deciphering non-linear pollution dynamics globally, offering essential insights for targeted mitigation strategies and advancing environmental sustainability science.

2. Materials and Methods

2.1. Study Area Overview

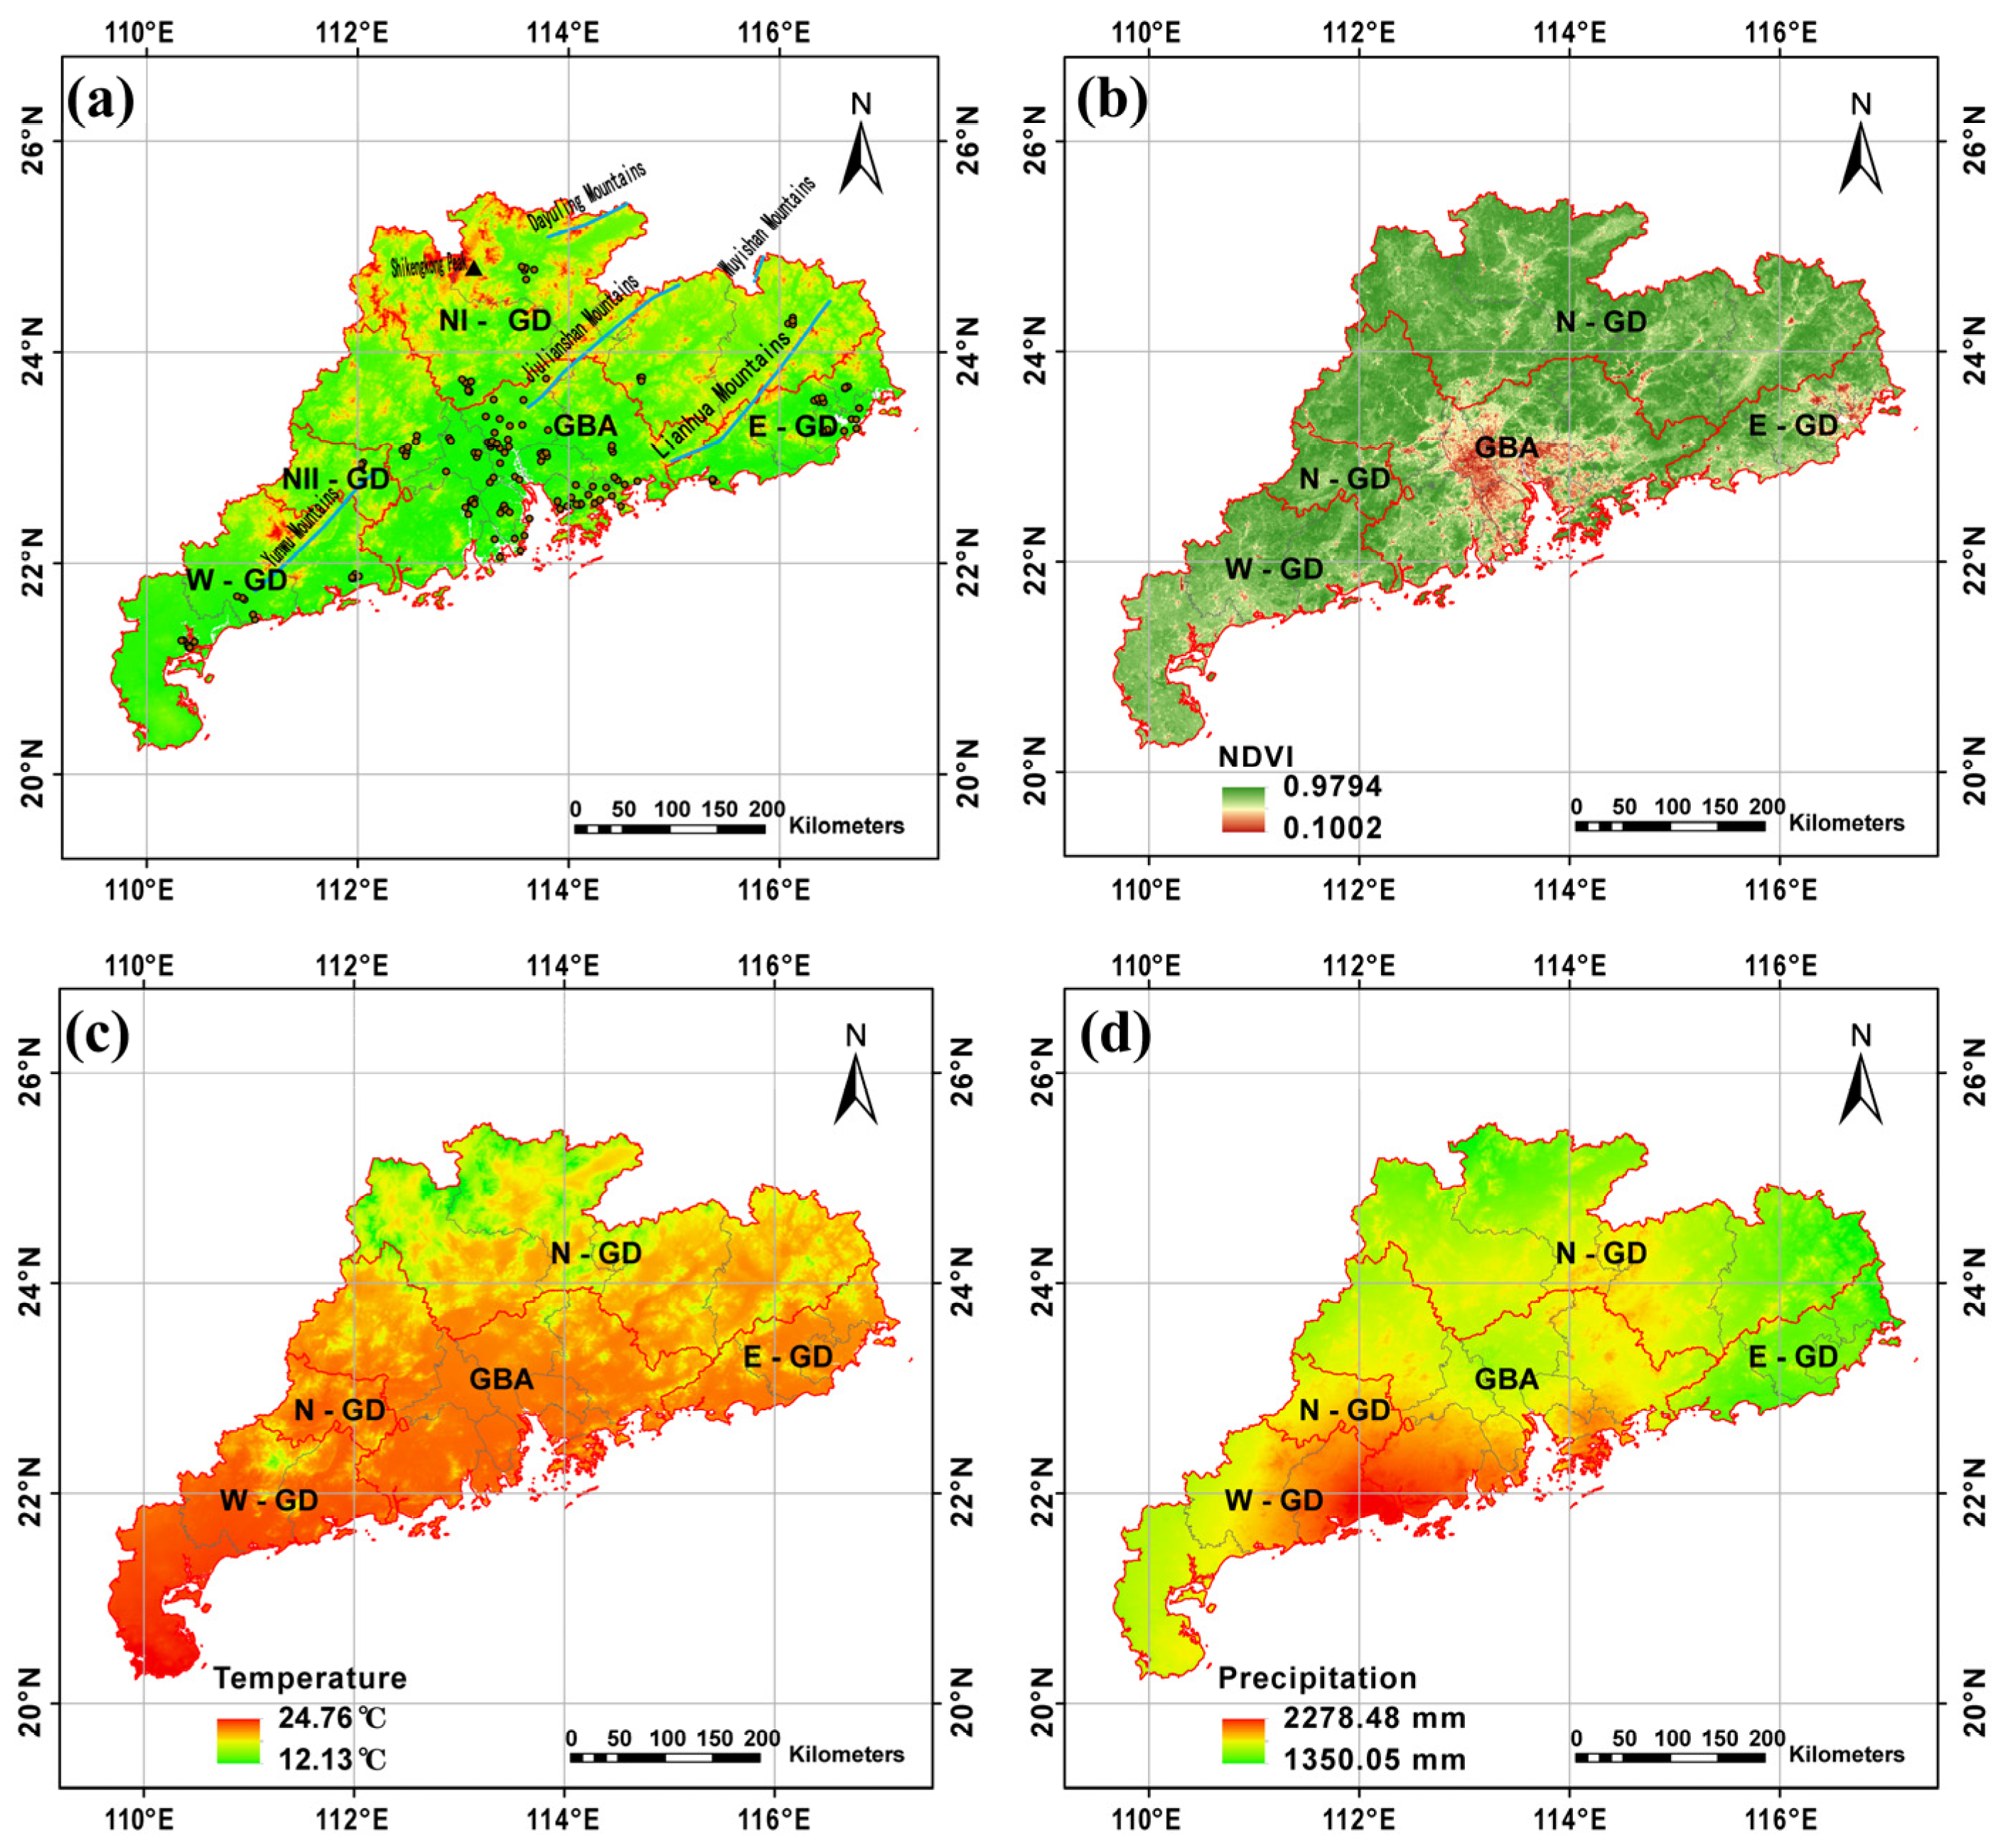
Our investigation focuses on southern China, encompassing Guangdong Province, the Hong Kong Special Administrative Region, and the Macau Special Administrative Region (20°09′ N–25°31′ N, 109°45′ E–117°20′ E). This region is globally significant as a critical PM2.5 research crucible due to its complex interplay of geography, intense anthropogenic activity, and unique atmospheric dynamics [12,21,33]. Administratively cohesive yet geographically diverse, the study area was subdivided into four subregions: the intensely developed Pearl River Delta region forming the core of the Greater Bay Area (GBA), Eastern Guangdong (E-GD), Western Guangdong (W-GD), and Northern Guangdong (N-GD), with N-GD further partitioned (NI-GD/NII-GD) based on topography [12,53]. The terrain exhibits a pronounced north–south gradient, dominated by the elevated Nanling Mountains in the north, descending through hills and terraces to coastal plains in the south (Figure 1a) [54]. This structure profoundly influences regional climate and pollutant dispersion [58]. The GBA, as southern China’s primary economic engine, hosts dense industry, major transportation networks, and large populations, resulting in significant PM2.5 emissions [34,53]. Critically, the northern Nanling Mountains act as a partial barrier to cold air masses, while the region sits at the confluence of the East Asian and South Asian Monsoons, compounded by local land–sea breeze circulations [58]. These factors create complex, often stagnant, atmospheric conditions conducive to PM2.5 accumulation and intricate spatiotemporal variability, making the GBA a focal point for atmospheric research [12,21,33,34,35,53,58,59,60]. The climate is subtropical monsoonal, characterized by warm, wet summers and mild, drier winters. Annual mean temperatures range from ~12 °C to ~25 °C, with January (the coldest month) averaging 2–18 °C and July (the warmest) exceeding 28 °C (Figure 1c). Precipitation is abundant (1350–2280 mm annually) but highly seasonal, with approximately 80% falling during the wet season (April–September, Figure 1d) [53]. Prevailing winter northerlies contrast with dominant summer southerlies, further influencing pollution transport patterns [58]. Consequently, accurately characterizing the complex multi-scale spatiotemporal variations in PM2.5 concentrations across this diverse and dynamic region is essential for understanding regional air quality challenges and their drivers [12,21,33,59].

2.2. Research Data Acquisition and Analysis

2.2.1. Data Acquisition

All geospatial datasets (1 km resolution) were sourced from authoritative repositories. Key datasets are summarized in Table 1.
PM2.5 Concentrations: Annual/monthly PM2.5 data (2000–2023) were obtained from the ChinaHighPM2.5 dataset [61] via the National Tibetan Plateau Environment Data Center (Table 1). This product integrates multi-source observations and model outputs. Spatial clipping (ArcGIS 10.6) and format conversion (MATLAB R2019a) were applied.
Topography: A 1 km Digital Elevation Model (DEM) for China (Table 1) was ac-quired from the Resource and Environmental Science Data Platform and clipped to the study area (Figure 1a).
Vegetation Index: Annual Normalized Difference Vegetation Index (NDVI) data (2000–2023) (Table 1) were sourced from the Resource and Environmental Science Data Platform. To characterize long-term vegetation spatial patterns as biogeographical context for PM2.5 analysis, we first computed annual mean NDVI from monthly data for each year. These annual means were then averaged over 2000–2023 to generate a long-term NDVI map (Figure 1b).
Climate Data: Monthly 1 km temperature and precipitation data (2000–2023) were acquired from the National Tibetan Plateau Data Center (Table 1). Similarly, to establish long-term climatic spatial patterns as climate zones for PM2.5 analysis, we derived annual mean temperature and cumulative precipitation from monthly data for each year. These annual values were averaged over 2000–2023 to produce the long-term mean temperature and mean cumulative precipitation maps (Figure 1c,d).

2.2.2. PM2.5 Data Validation

ChinaHighPM2.5 data integrate ground-based observations, satellite remote sensing, atmospheric reanalysis, and model simulations to ensure high resolution, quality, and full spatial coverage [61]. Within the study area, the data were validated against ground observations from China’s Ministry of Ecology and Environment (MEE) using 12,399 monthly and 1062 annual datapoints (excluding Hong Kong/Macao).
Monthly: R2 = 0.982, RMSE = 1.635 μg·m−3, MAE = 1.021 μg·m−3, MRE = 4.000%;
Annual: R2 = 0.978, RMSE = 1.062 μg·m−3, MAE = 0.725 μg·m−3, MRE = 2.668% (Appendix A).
Validation confirms high reliability of the 2000–2023 ChinaHighPM2.5 data for spatiotemporal analysis.

2.2.3. Statistical Trend Analysis

Moving Average Smoothing
This technique reduces measurement fluctuations by averaging values within a local window, thereby generating a smoother PM2.5 time series [62]. This enhances trend discernibility according to Equation (1):
p j ¯ = i = j i + L 1 x i L
where L denotes the window length, i represents the sequence index, and j = L 1 2 + i . x i denotes raw PM2.5 concentrations. In accordance with China’s Ambient Air Quality Assessment Technical Specification (HJ 663–2013) [63], we employed L = 5 years. Smoothed values were assigned to the terminal year of each overlapping window (e.g., 2000–2004 → 2004).
Linear Trend Quantification
Grid-scale trends in annual/seasonal PM2.5 were quantified via ordinary least squares (OLS) regression [64]. Key parameters included multi–year averages (Mean-5y: Mean-5y-Year and Mean-5y-Season) and their rates of change (k-5y: k-5y-Year and k-5y-Season). The slope (denoted k) of the fitted equation represents both the intensity of PM2.5 change and its acceleration-like behavior [64]. The slope was computed as
s l o p e = n i = 1 n i x i i = 1 n i i = 1 n x i n i = 1 n i 2 i = 1 n i 2
where n is the study period length and x i denotes the mean value (Mean-5y-Year, Mean-5y-Season) or rate of change (k-5y-Year, k-5y-Season) for the i-th interval. Significance was evaluated using a two-tailed t-test:
t = R x y 1 R x y 2 n m 1
where n is the sample size and m is the number of independent variables.
Using Equations (1) and (2), we calculated 5-year average PM2.5 concentrations ( x i ) and rates of change ( x k i ) for each overlapping interval (2000–2004, 2001–2005, …, 2019–2023). These results were assigned to their terminal years (2004–2023), forming new time series: ( x 2004 ,   x 2005 , …,   x 2023 ) and ( x k 2004 ,   x k 2005 , …,   x k 2023 ).
Note: Throughout this paper, labels such as 2004, 2005, …, 2023 refer to data derived from the corresponding overlapping 5-year windows (2000–2004, 2001–2005, …, 2019–2023).
Piecewise Linear Regression
To better capture changes in longer-term trends that might be obscured by a single linear model, piecewise linear regression was applied, which provides a more intuitive representation of shifts in the time series pattern, a methodology widely applied across diverse fields [57,64,65,66]. This approach fits distinct linear segments to the data before and after a breakpoint year (α). The optimal α is determined by minimizing the combined residual sum of squares (RSS) [57]. The regression is calculated using the following piecewise function:
y = b 0 + k 1 t + ε                             t α     b 0 + k 1 t + k 2 t t α + ε     t > α    
where t denotes the year, y represents the PM2.5 variable (specifically, Mean-5y-Year, Mean-5y-Season, k-5y-Year, k-5y-Season), α signifies the changepoint year, b0, k1, and k2 are regression coefficients, and ε is the residual error. Given the relatively short time period, which could limit trend representation, the changepoint year α was constrained to the interval 2004 ≤ α ≤ 2019. This constraint ensures a minimum of five years of data both before and after the changepoint, enabling reliable segment fitting.
Significance of the turning point (α) was evaluated using an F-test:
F = R S S s l R S S p l / 1 R S S p l / n 3
where n represents the sample size. R S S s l denotes the residual sum of squares for a simple linear regression model fitted to the entire dataset. R S S p l is the residual sum of squares for the piecewise linear regression model, calculated as the combined RSS from the two linear segments fitted before and after the turning point (α). A turning point was considered statistically significant at the F0.05 level if the calculated F-value exceeded the critical value F0.05 (1, n − 3) = 4.45.
All significant turning points reported for the piecewise regressions met this criterion (F-value > F0.05 (1, n − 3) = 4.45). For other statistical tests (e.g., t-tests on coefficients), significance levels are denoted as follows: p < 0.05 and p < 0.01.

3. Results

3.1. Spatiotemporal Patterns of PM2.5

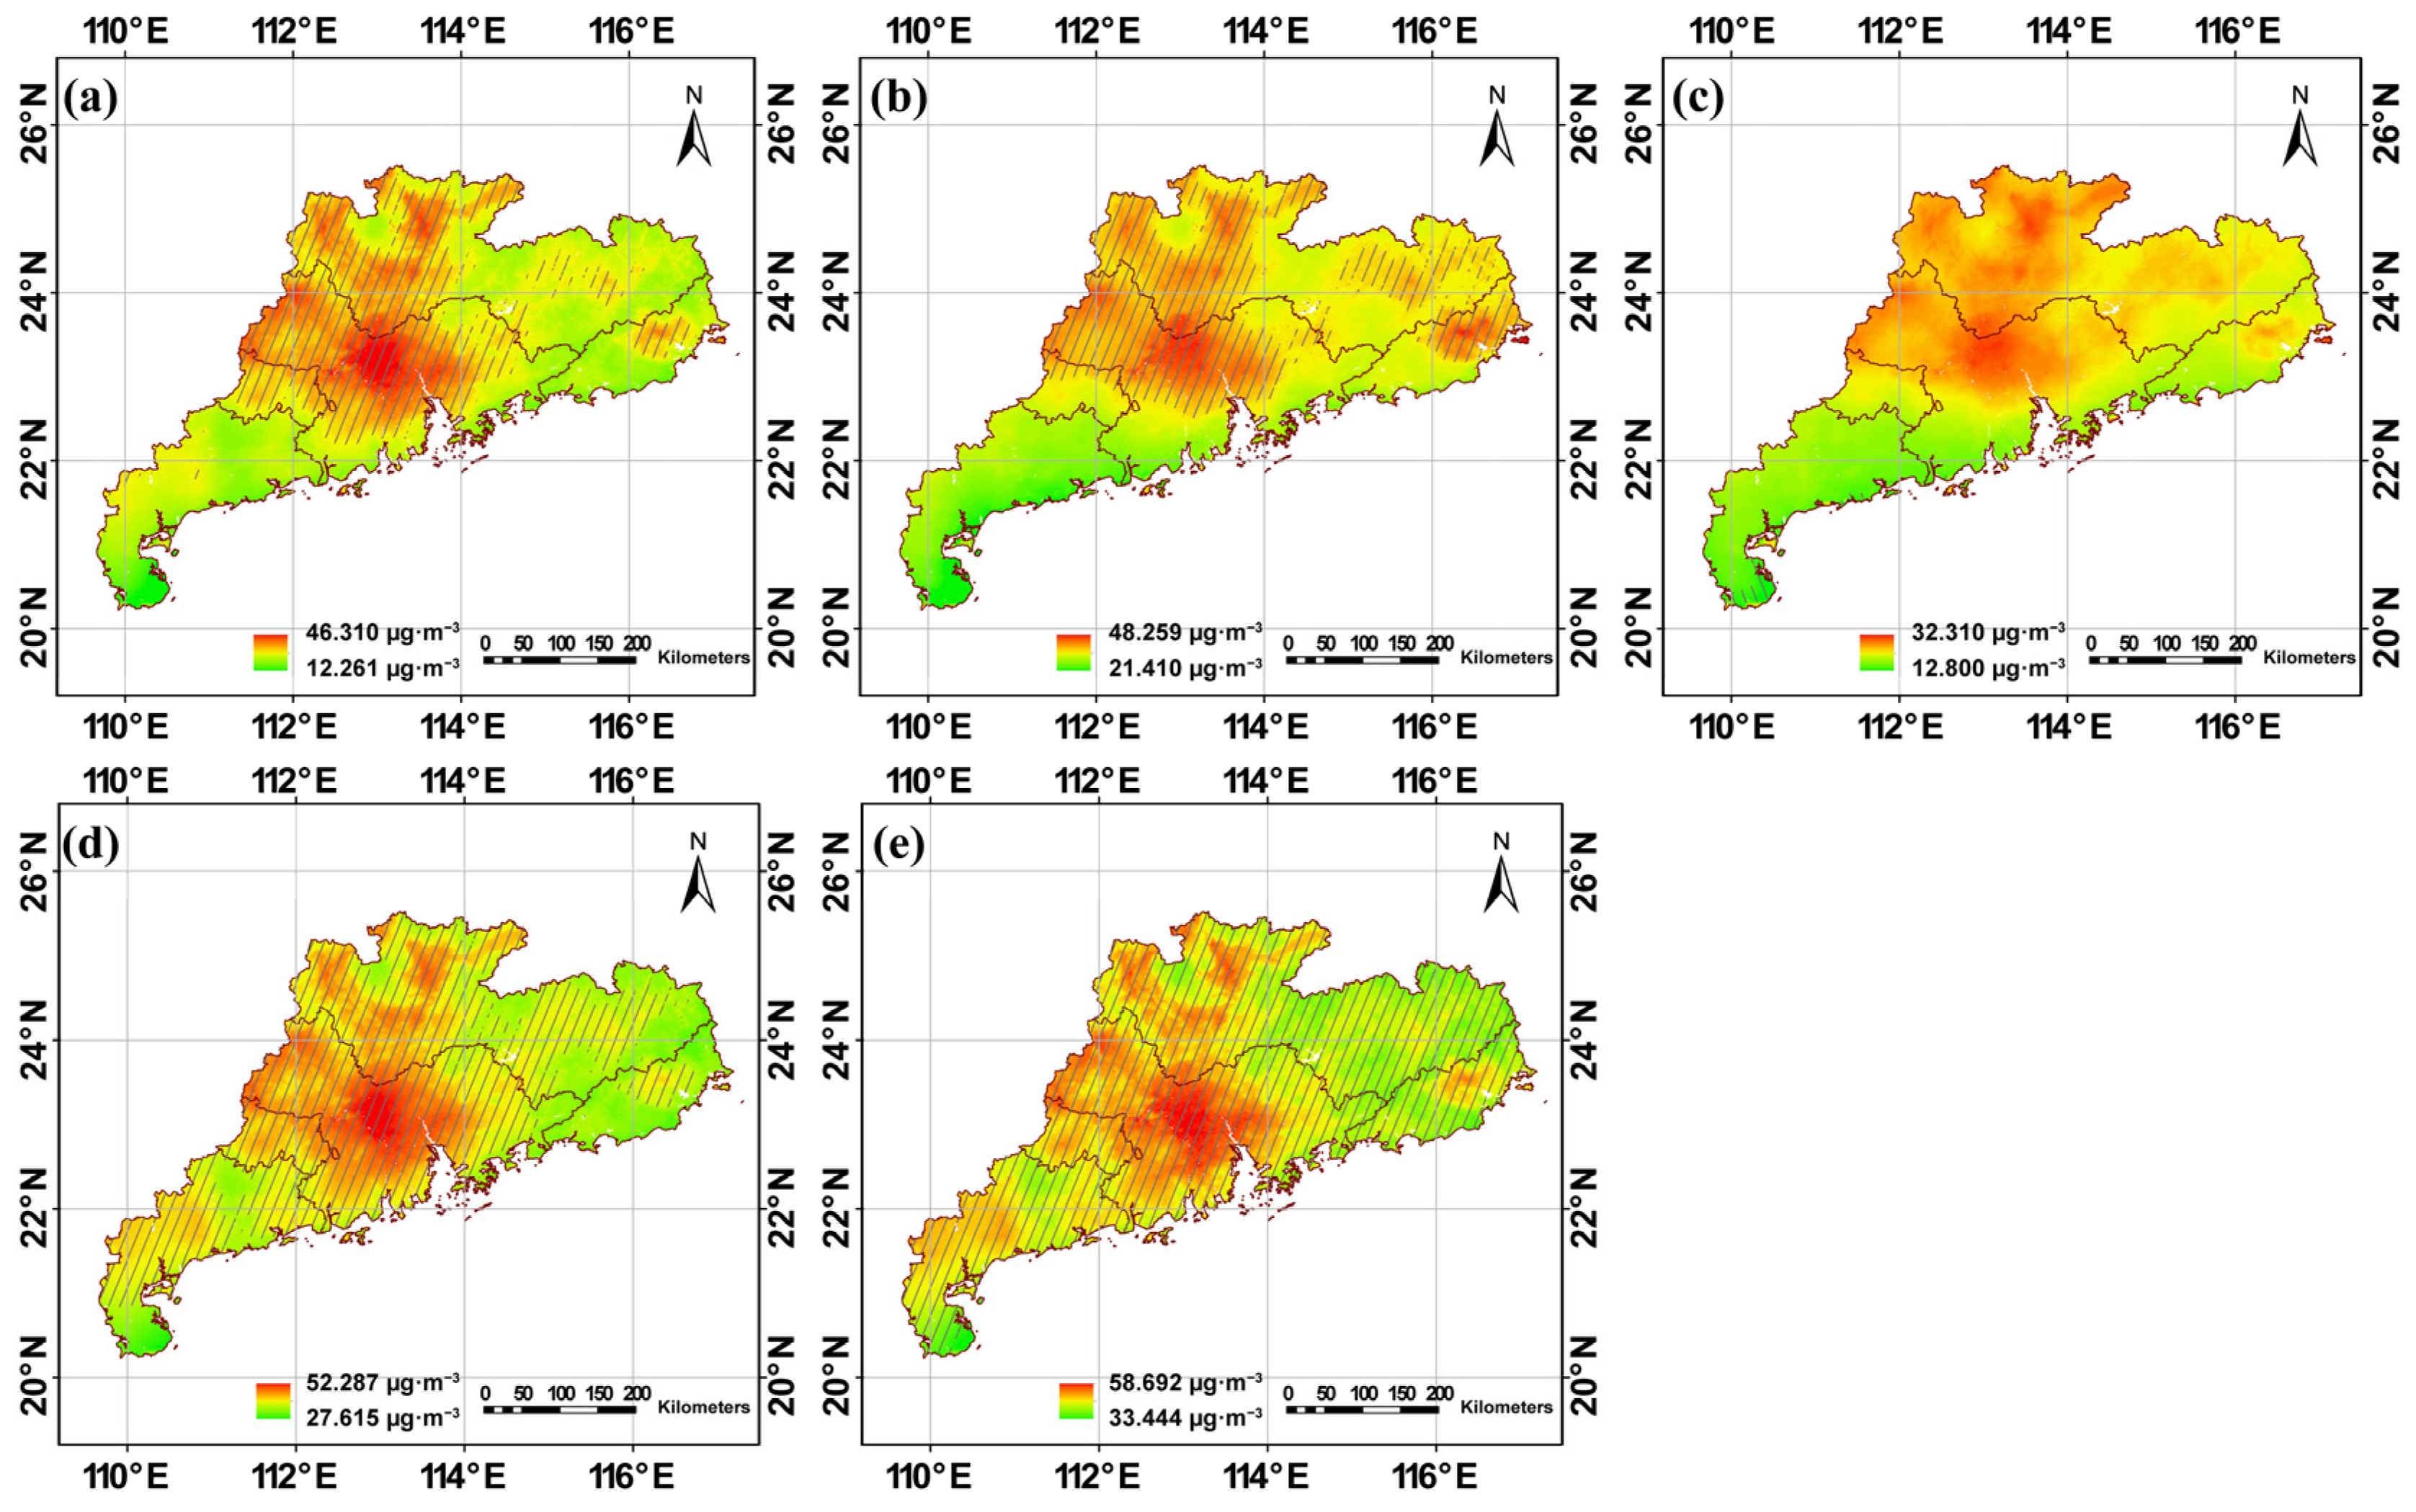
Long-term mean PM2.5 concentrations across China’s GHM regions exhibited pronounced seasonal heterogeneity (Figure 2). Winter displayed the highest pollution levels (mean: 45.18 μg·m−3), exceeding summer concentrations (21.80 μg·m−3) by a factor of 2.07, while autumn, annual, and spring averages were 38.64, 35.14, and 34.32 μg·m−3, respectively. Summer consistently complied with China’s Ambient Air Quality Standard Grade II (AAQS-II, 35 μg·m−3), with 1.35% of southern regions (notably W–G) meeting the stricter Grade I (AAQS-I). In stark contrast, winter exhibited near-universal non-compliance (99.70% exceedance), followed by autumn (77.17%), annual (44.36%), and spring (42.16%). Peak winter concentrations reached 58.69 μg·m−3, highlighting severe cold-season pollution. Spatially, AAQS-II-compliant zones in autumn (22.83%) clustered in eastern NI–G and southern/northern E–G, while annual and spring exceedances showed substantial spatial overlap, driven predominantly by autumn and winter contributions (Table A2).

3.2. Decadal Decline and Policy-Linked Inflection Points

3.2.1. Temporal Dynamics and Trend Reversal

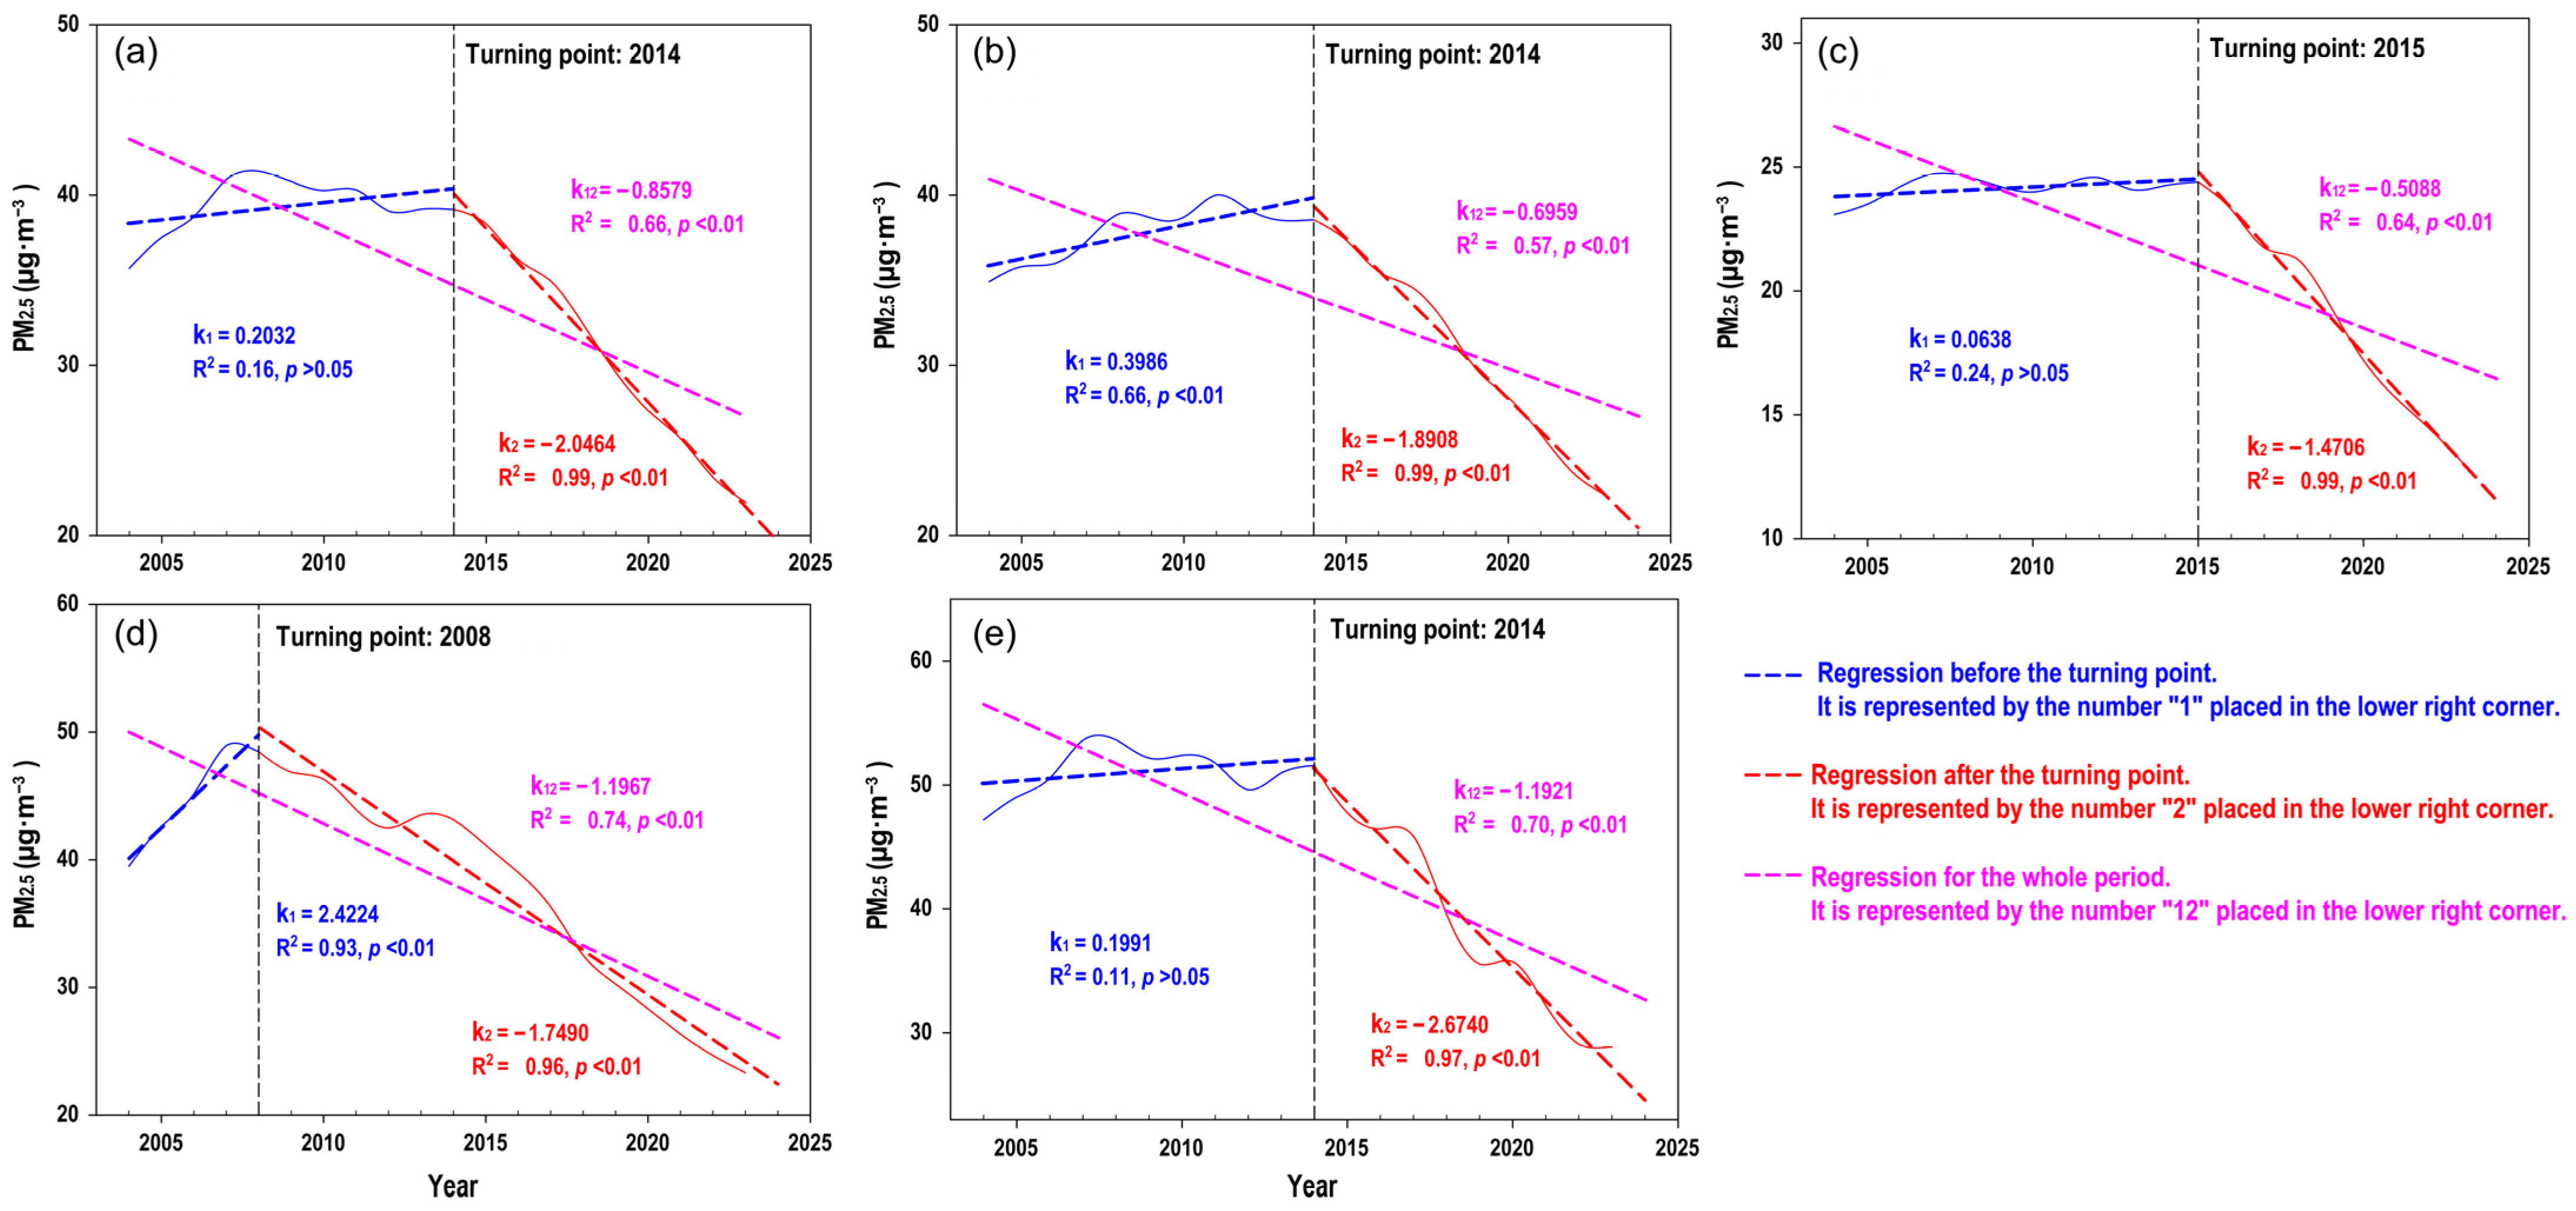
Significant decreasing trends (p < 0.01) characterize PM2.5 concentrations over the past two decades (Figure 3). Compliance with AAQS Grade II commenced in 2017 (annual: 34.94 μg·m−3; spring: 34.63 μg·m−3), 2018 (autumn: 32.52 μg·m−3), and 2021 (winter: 32.19 μg·m−3), with summer achieving Grade I after 2022. Mean decline rates are steepest in autumn (−1.197 μg·m−3·a−1) and winter (−1.192 μg·m−3·a−1). A pivotal inflection point occurs around 2014–2015 (except 2008 for autumn), demarcating distinct phases: pre-inflection increases in autumn (+2.422 μg·m−3·a−1, p < 0.01) and spring (+0.399 μg·m−3·a−1, p < 0.01) transition to accelerated declines. Post-inflection declines were −1.471 to −2.674 μg·m−3·a−1—rates 1.5–2.9 times faster than long-term averages. This reversal reveals that net improvements mask an initial pollution increase. Subsequent rapid post-2014 mitigation was predominantly driven by autumn and winter reductions. Sequential compliance milestones confirm this shift: annual/spring standards were met by 2017, autumn by 2018, and winter—historically the most polluted season—by 2021. The outsized contribution of autumn/winter reflects their higher initial pollution baselines (Section 3.1). It also indicates stronger sensitivity to emission control policies targeting seasonal sources like agricultural biomass burning [26,67]. Summer consistently meets Grade II and achieves Grade I post-2022. Record-low concentrations occurred uniformly in 2023 (e.g., winter: 28.86 μg·m−3). This contrasts sharply with peak pollution during 2007–2011 (e.g., winter 2008: 53.65 μg·m−3).

3.2.2. Spatial Gradients in Response Timing and Magnitude

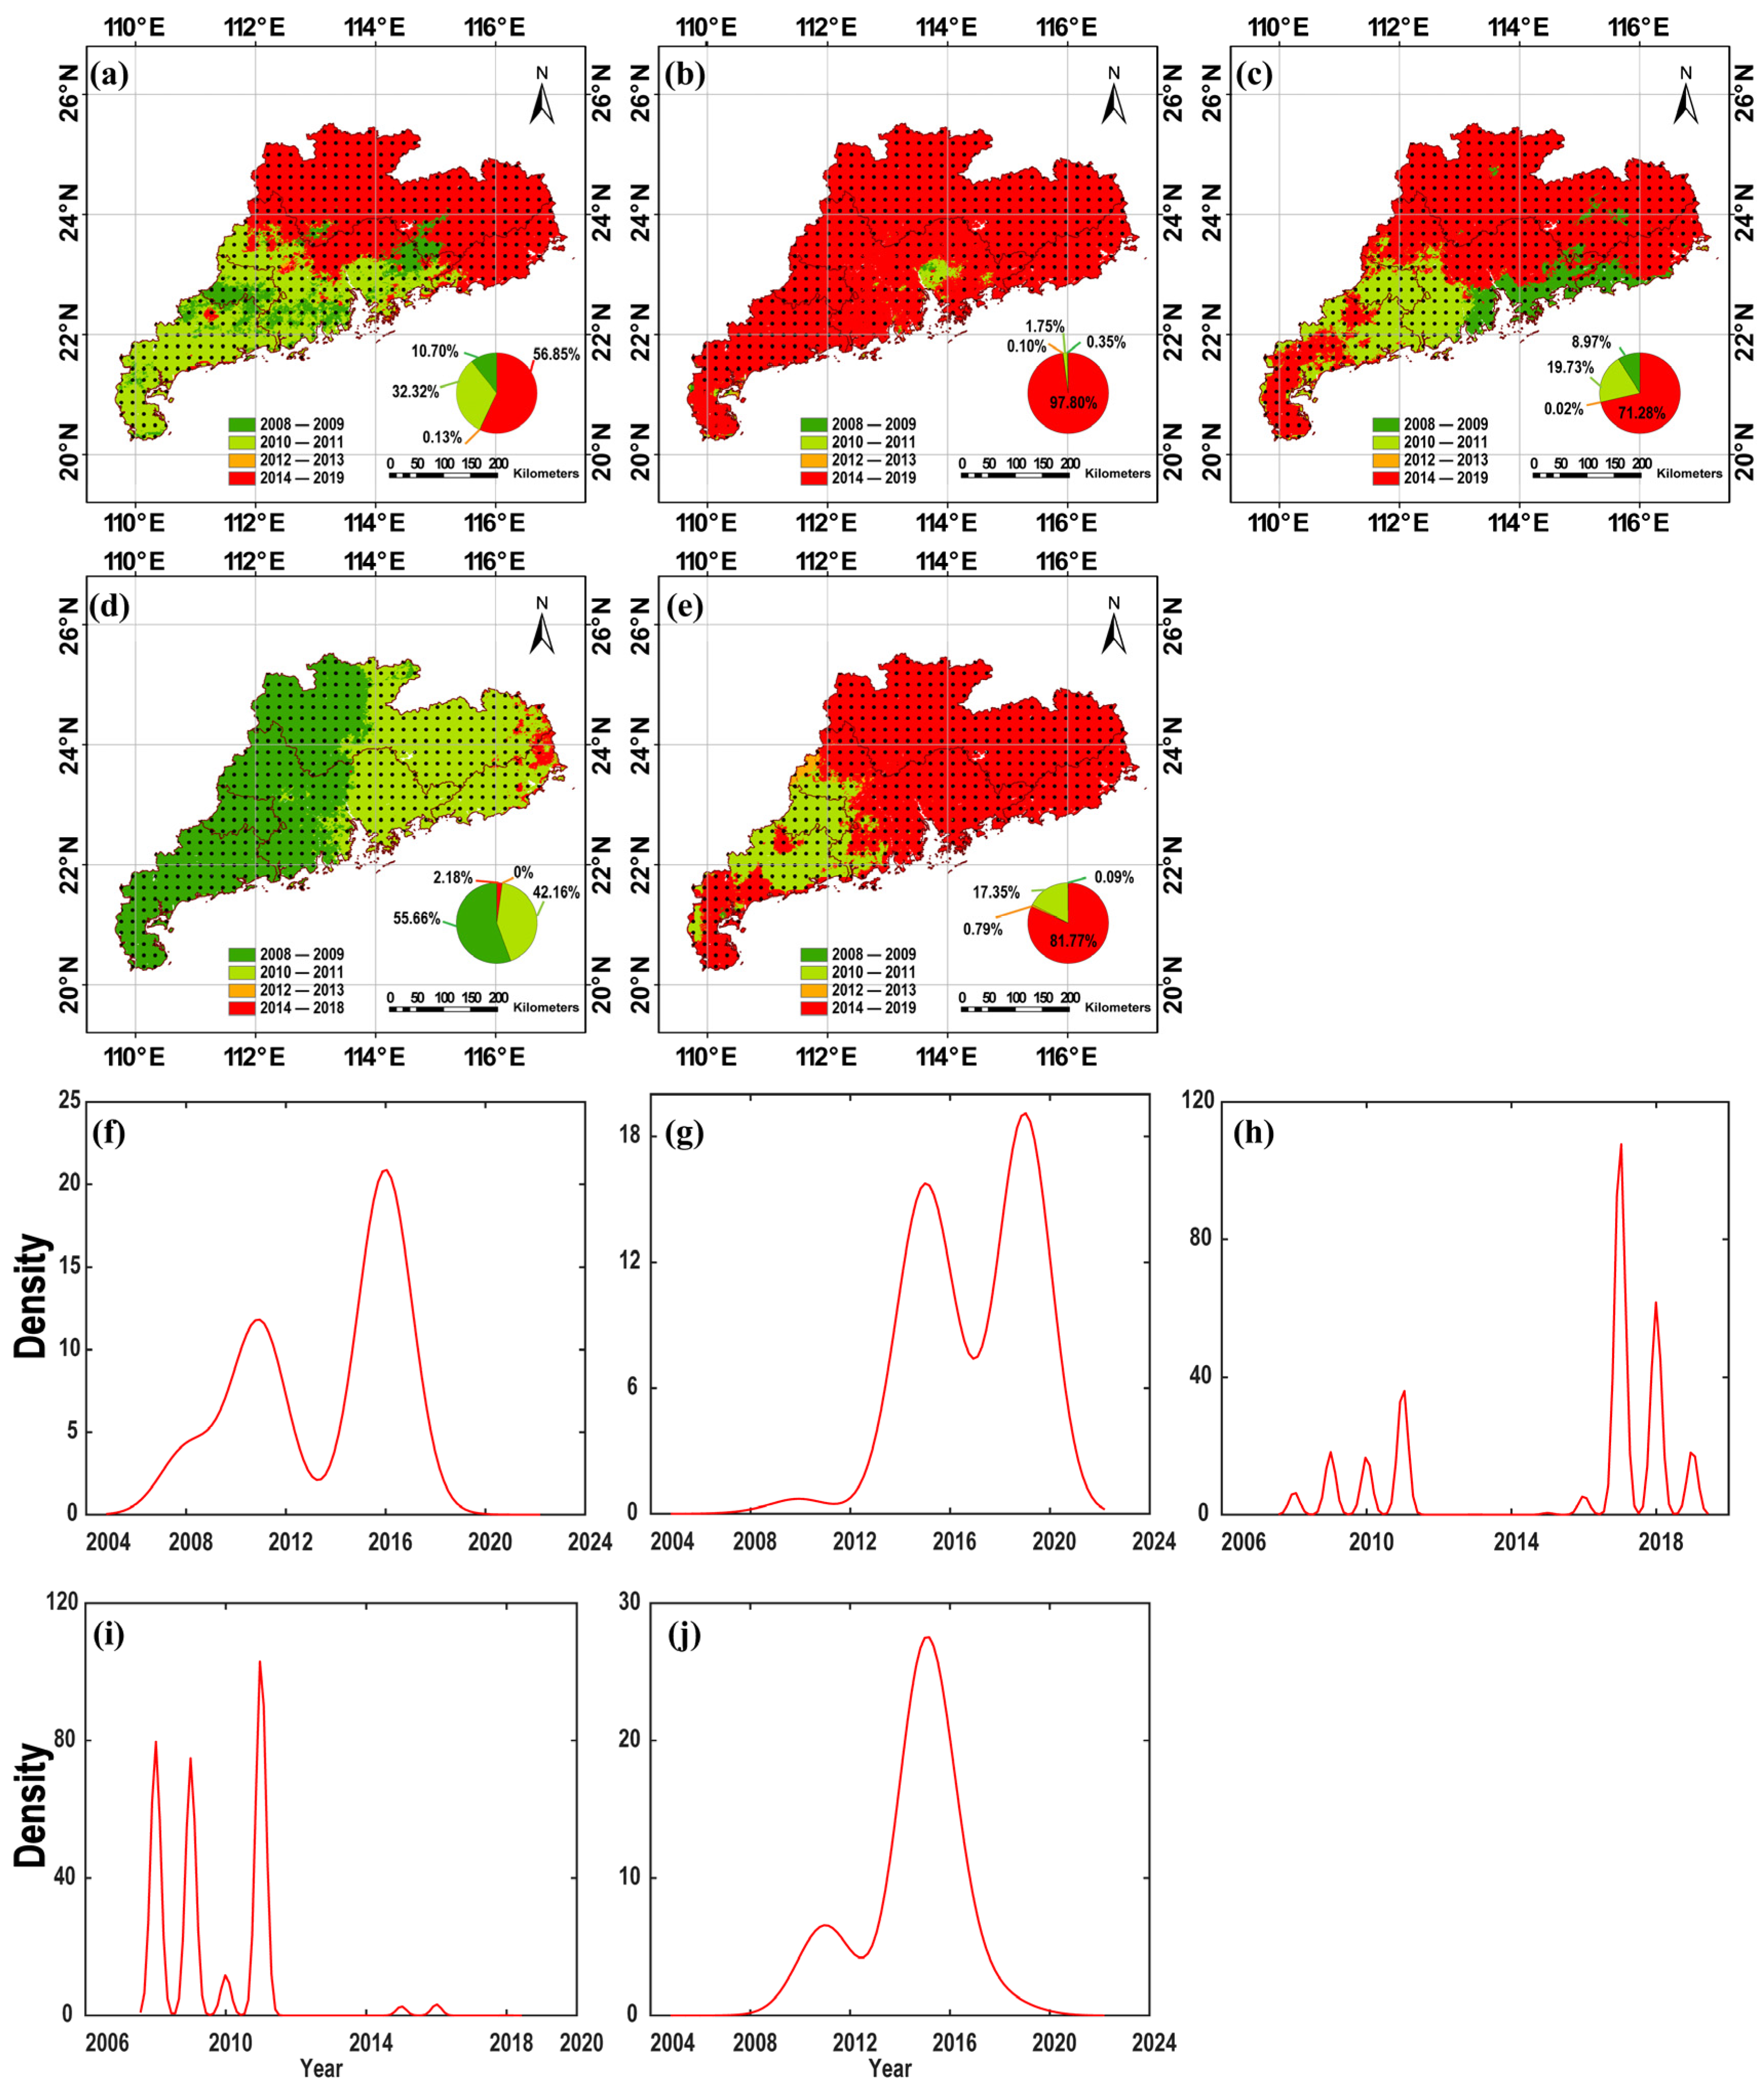
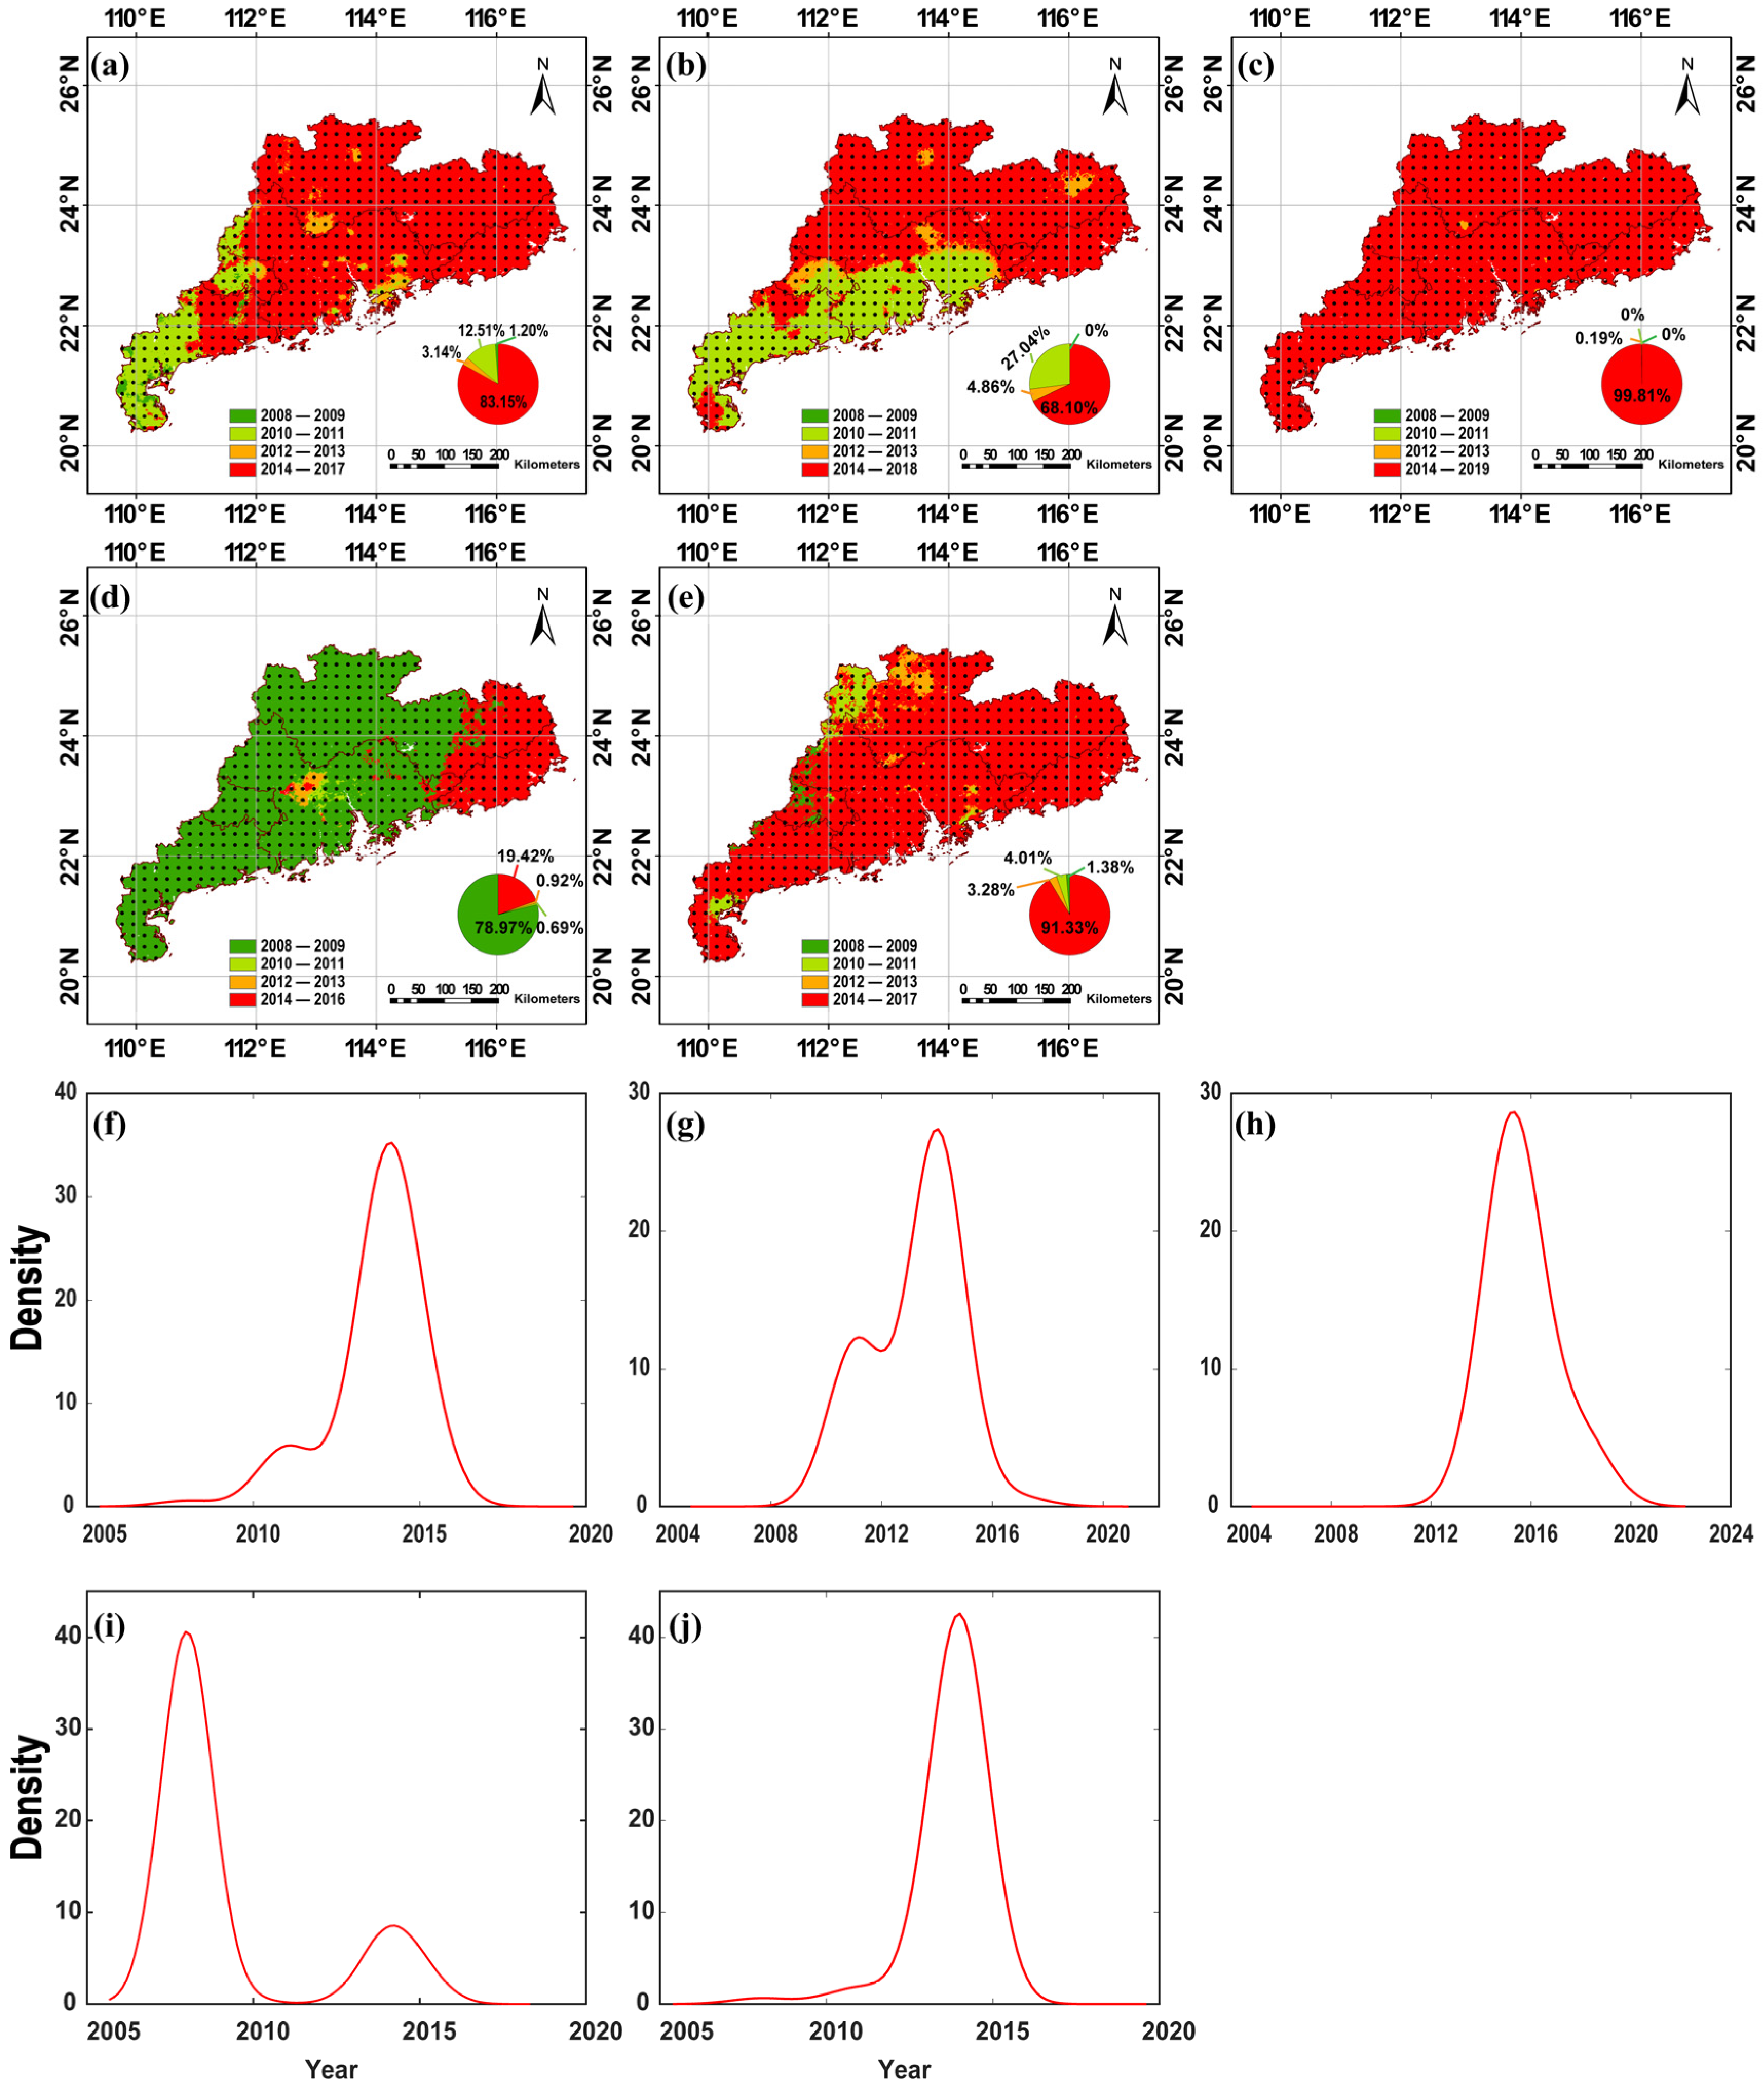
The timing of pollution trend reversals exhibits marked spatial organization (Figure 4). Autumn inflections cluster early (2008–2009; 78.97%), while annual and other seasonal breakpoints concentrate post-2014 (68.10–99.81%). Spatially, early annual reversals localize in western peripheries (W-G, NII-G), with the core GHM regions (eastern W-G, N-G, GBA) transitioning later (2014–2017; 83.15%). Density distributions confirm distinct clustering (e.g., autumn: distinct peak at 2007.98 about 40.58%; annual: peak at 2014.15).
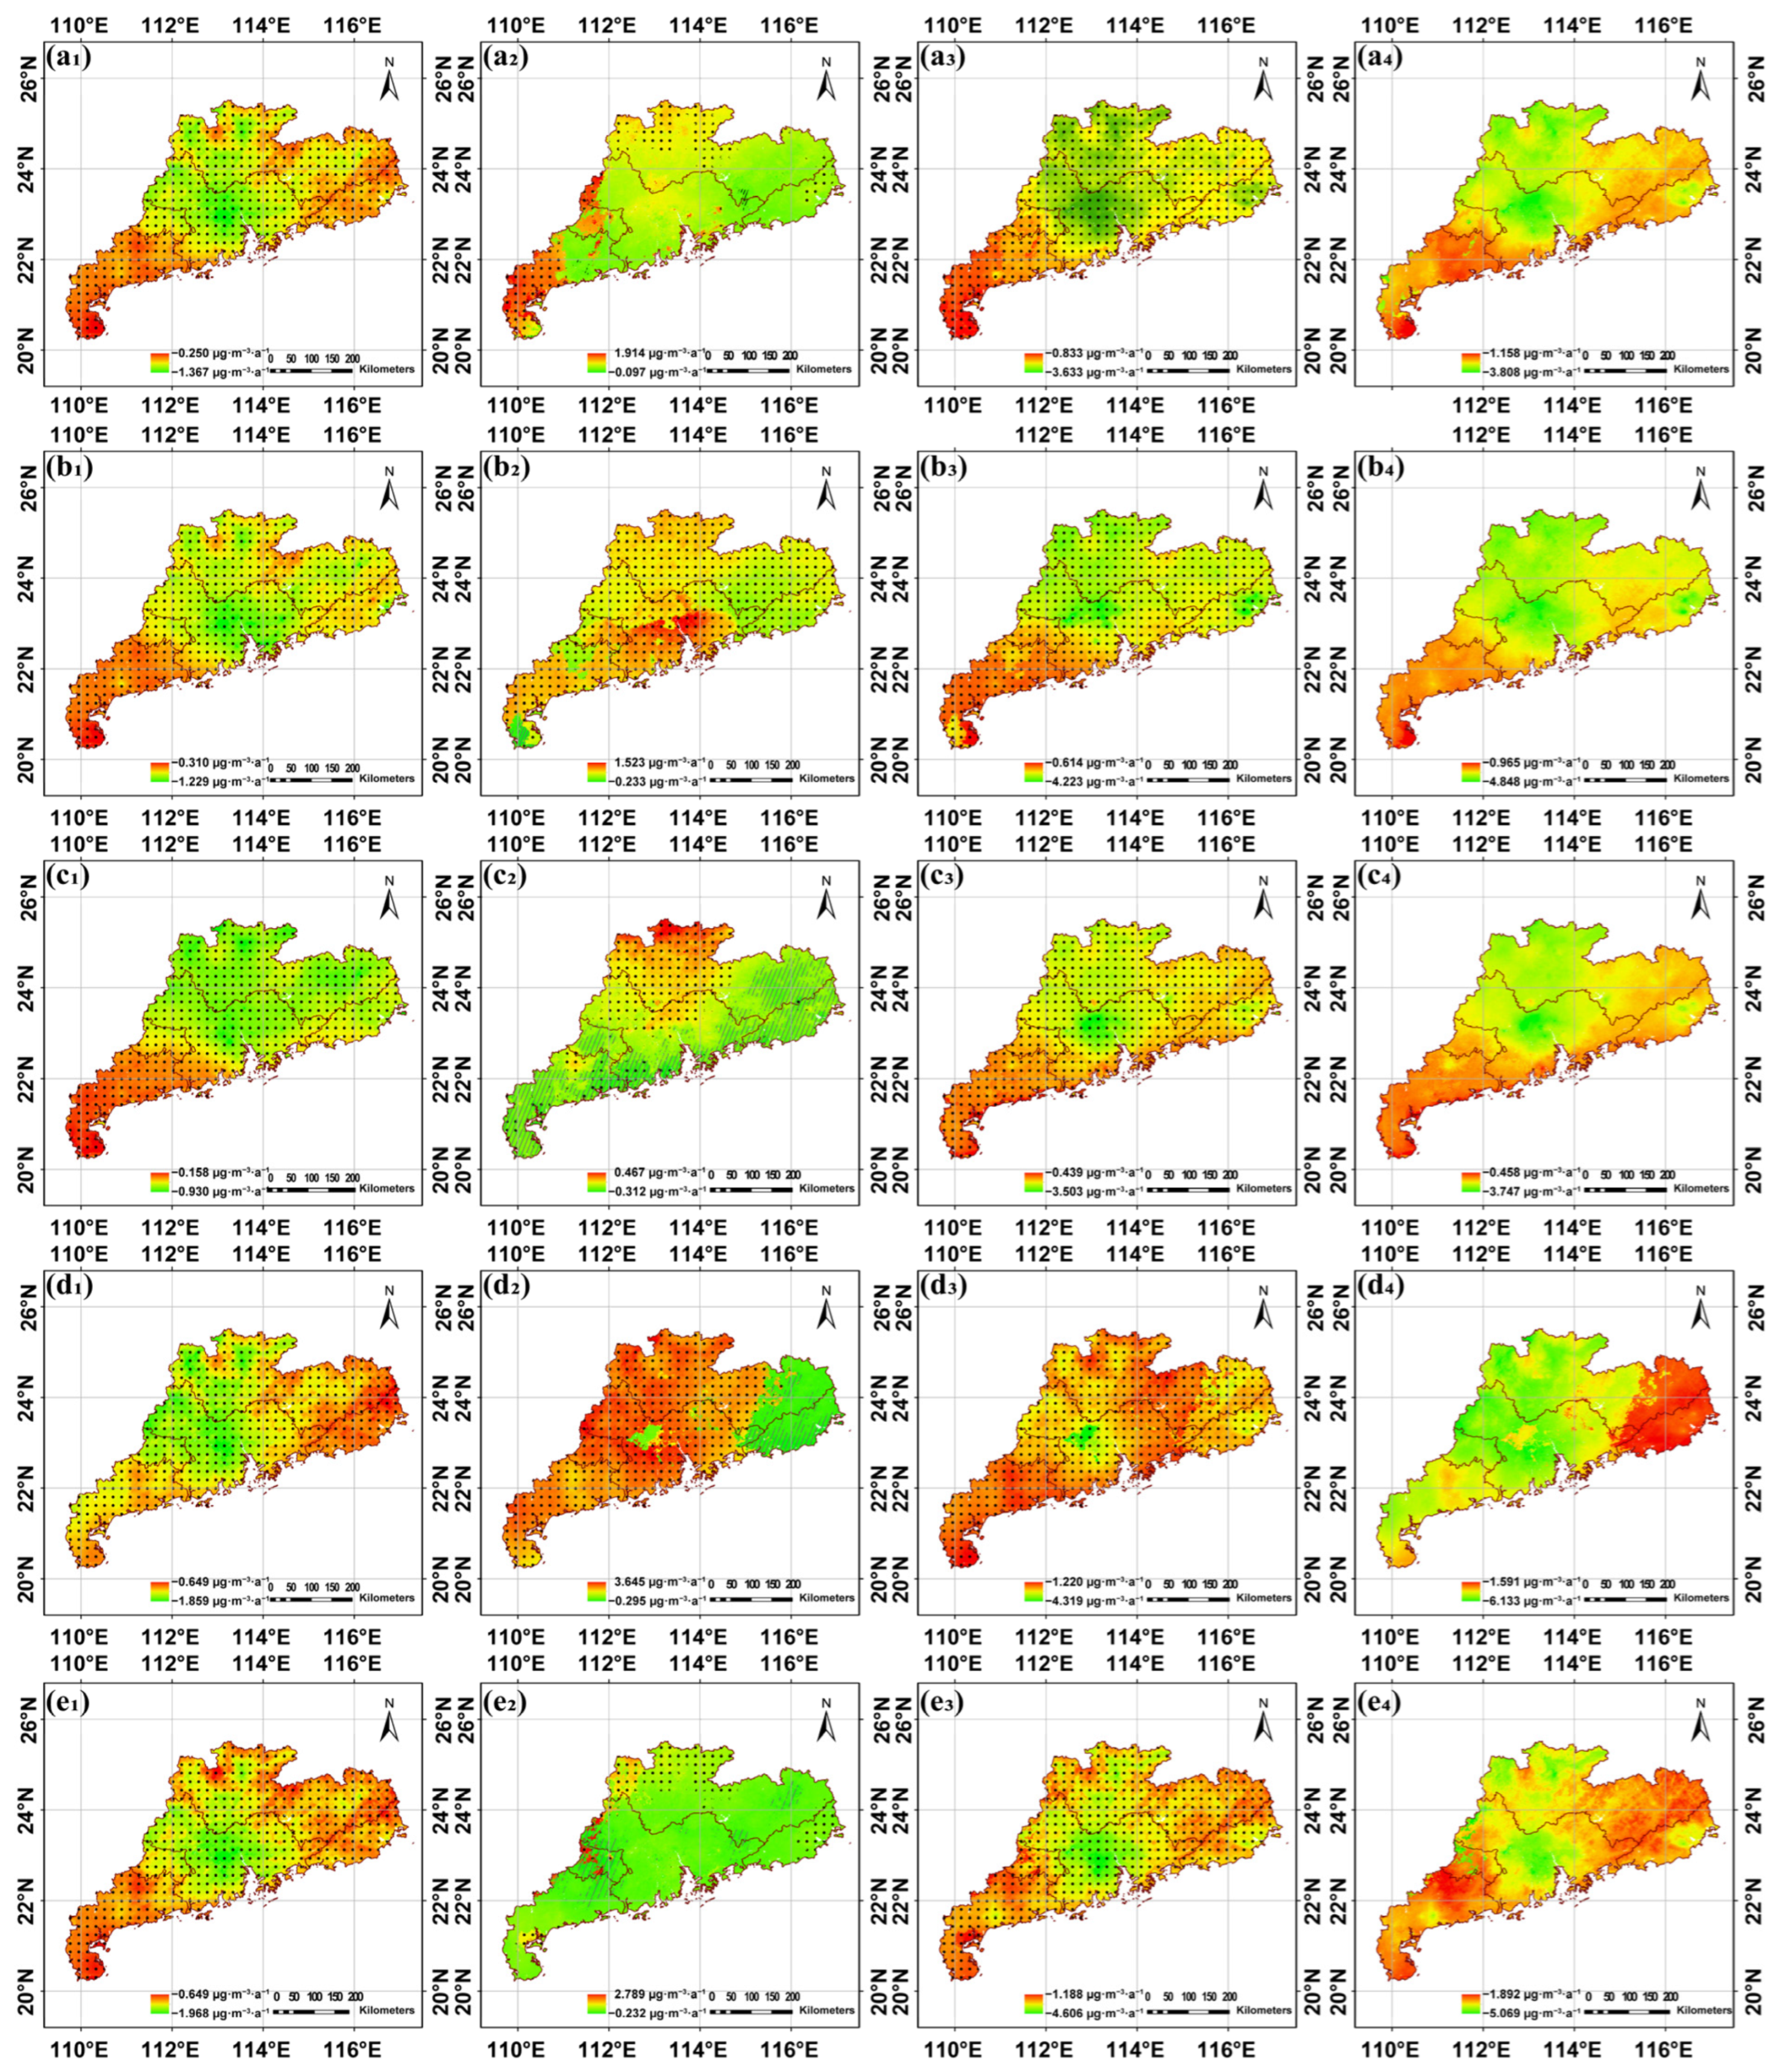
A consistent spatial gradient emerges in decline intensity; PM2.5 reduction rates amplify progressively from peripheral zones (E-G, W-G, N-G) to the GBA geometric core (Figure 5). Post-2014 declines intensified radially toward the GBA geometric center, with winter reductions being most extensive (79.26% of areas exceeding −1.0 μg·m−3·a−1). Autumn exhibited the largest absolute trend reversal (−3.961 μg·m−3·a−1), while winter showed the fastest post-inflection decline (−2.646 μg·m−3·a−1). Pre-inflection pollution increases dominated 91.36–99.57% (except 62.28% for summer) of the region, contrasting sharply with universal post-inflection declines. Maximum rate changes clustered near the GBA core, reaching −6.133 μg·m−3·a−1 (autumn) and −5.069 μg·m−3·a−1 (winter) (Table A3). Regions peripheral to the GBA (e.g., E-G, W-G, N-G) exhibited milder reductions, confirming the GBA as the epicenter of pollution mitigation. We also observed that regions west of 114.8–115.5° E (including western GBA, NI–G, and NII–G) experienced the strongest autumn reversals. This pattern links to interactions between prevailing monsoonal wind patterns and the Lianhua Mountains’ topography, which can enhance pollutant dispersion or accumulation depending on season and location [26,58]. The mountains disrupt easterly/southeasterly flows, promoting localized stagnation west of the ridge (≈114.5–115.5° E). This enhances PM2.5 accumulation in peripheral emission zones.

3.3. Evolving Dynamics in Pollution Decline Acceleration

3.3.1. Acceleration Trends and Critical Transitions

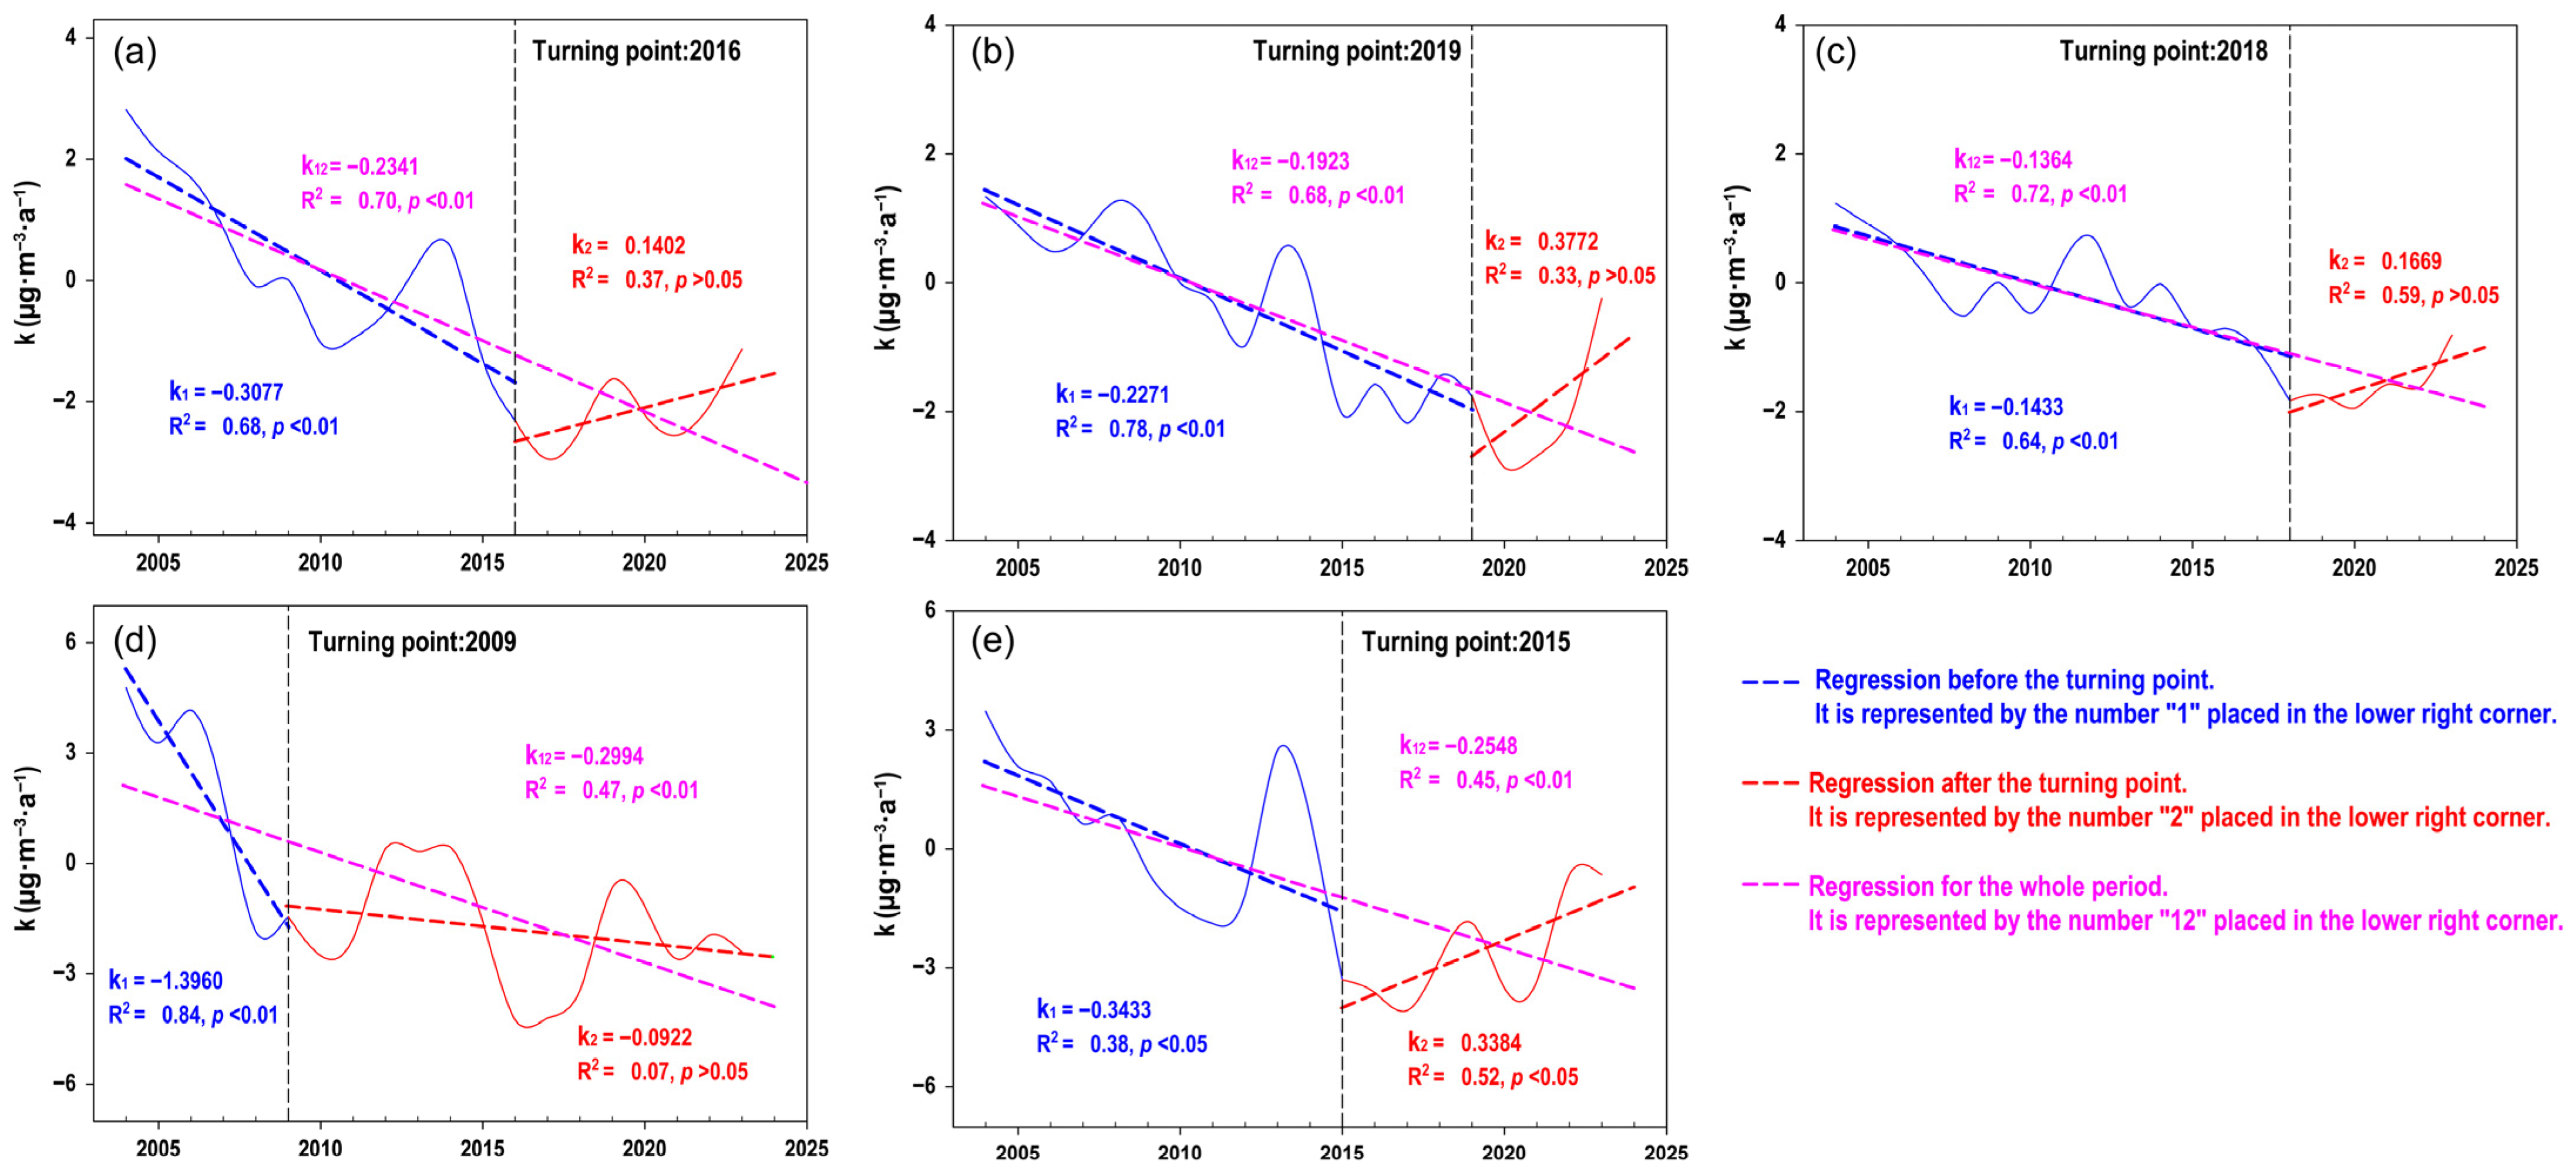
Temporal analysis of the acceleration (the temporal rate of change in the five-year moving average decline rate, k-5y) revealed increasingly rapid declines over the 20-year period (p < 0.01, Figure 6). Mean annual acceleration was −0.234 µg·m−3·a−2, driven by autumn (−0.299 µg·m−3·a−2) and winter (−0.255 µg·m−3·a−2). Critical transitions occurred at identified breakpoints (2015–2019, except for 2009 for autumn), marking distinct shifts in acceleration patterns. Pre-inflection acceleration pattern: During the pre-inflection period, all seasons exhibited acceleration in the decline (negative k-5y trends), meaning the rate of PM2.5 reduction was progressively speeding up. This phenomenon was most pronounced in autumn, where pre-inflection acceleration was 366% stronger than the 20-year mean acceleration. Post-inflection acceleration pattern: Following their respective inflection points, a dramatic reversal occurred in all seasons except for autumn. Winter, spring, summer, and the annual mean all shifted to positive k-5y trends—indicating a deceleration in the long-term improvement rate (i.e., the rate of PM2.5 reduction began to slow down). For example, winter experienced a significant shift to an increasing trend in k-5y (+0.338 μg·m−3·a−2, p < 0.05). Autumn alone maintained negative acceleration post-inflection (−0.092 µg·m−3·a−2), signifying that it continued to accelerate, albeit at a substantially reduced pace (69% slower than during the pre-inflection phase). Crucially, these findings demonstrate that long-term averages mask directional shifts and magnitude differences between the pre-inflection (universal acceleration) and post-inflection (near-universal deceleration except for autumn) periods.

3.3.2. Spatially Structured Acceleration Shifts

Spatiotemporal patterns in acceleration inflection points are highly structured at 99.78% for annual and 84.46–98.62% for seasonal statistical significance (Figure 7). The timing of the acceleration phase shift (from acceleration to deceleration or sustained acceleration at a reduced rate) showed strong regional organization. Autumn k-5y transitions concentrate in 2008–2011 (97.82%), contrasting sharply with post-2014 dominance for other seasons (56.85–97.80%). A latitudinal demarcation near the Tropic of Cancer (≈23° N, 23.873°~22.812° N) organizes annual k-5y timing. Southern regions inflect earlier (2010–2011; 32.32%) and northern regions later (post-2014; 56.85%). Density distributions confirm distinct clustering (e.g., annual: bimodal peaks at 2010.95 and 2016.05; autumn: unimodal early peak).
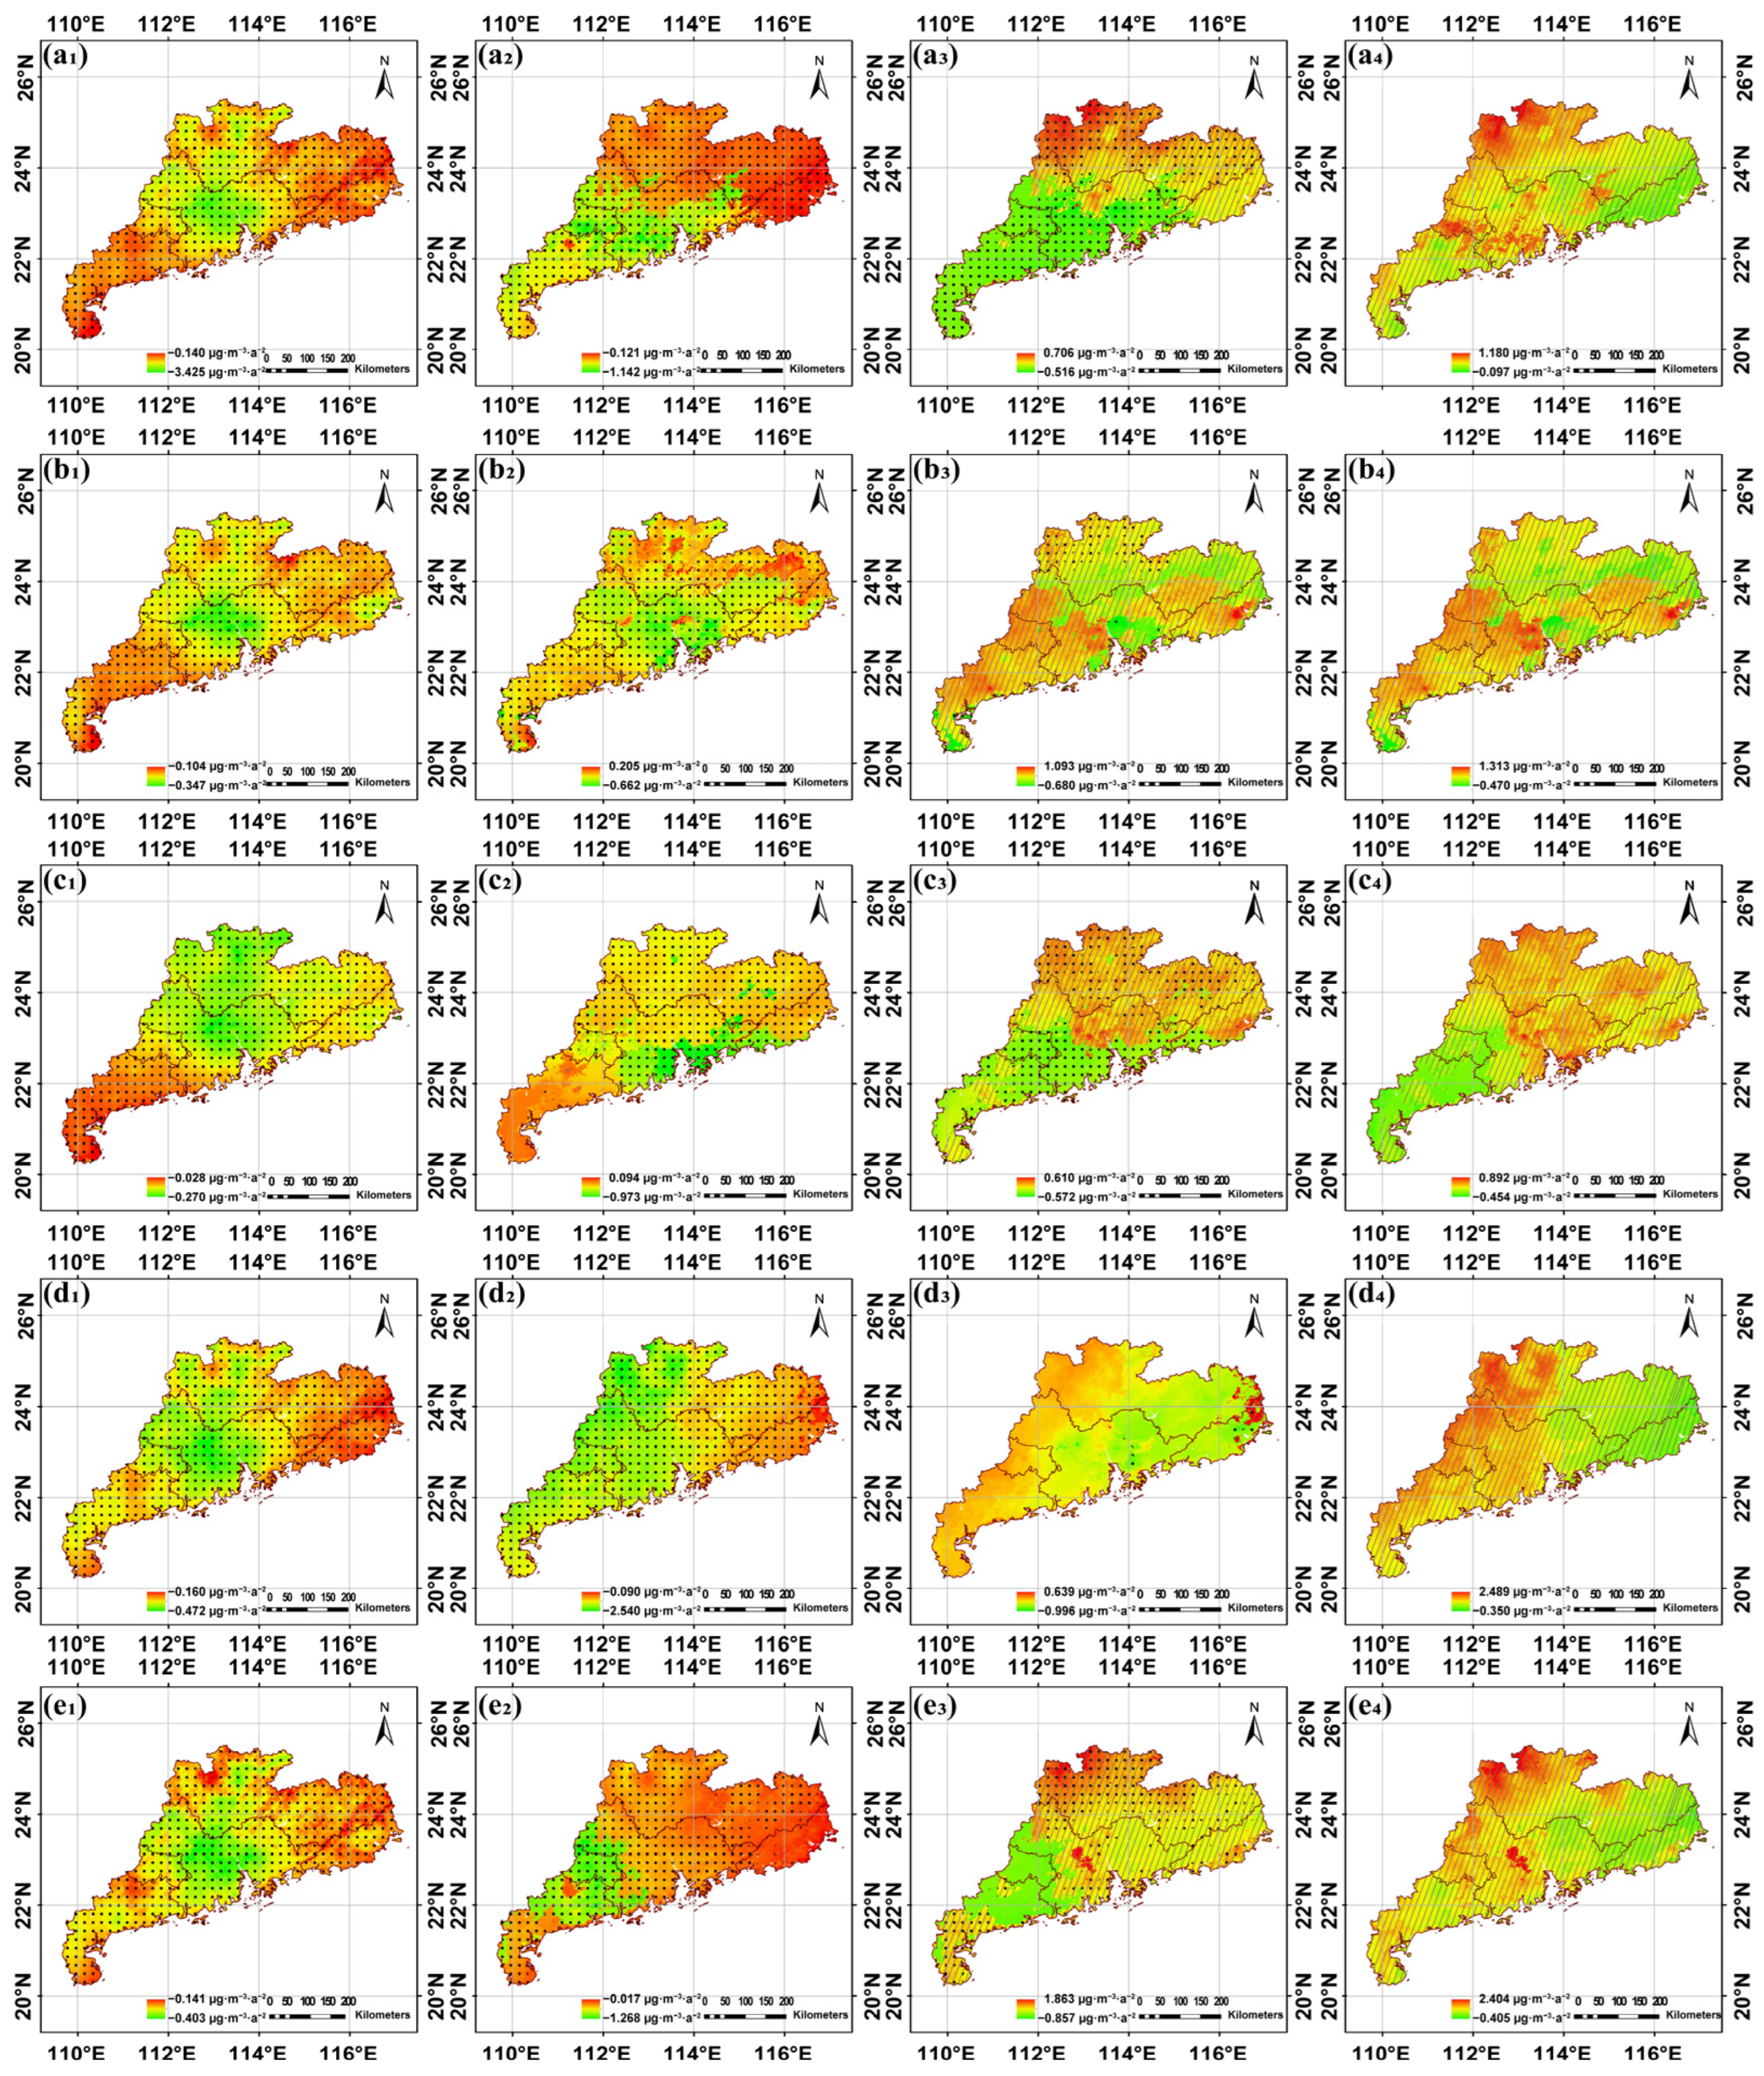
Statistically significant negative (p < 0.05) k-5y trends (indicating accelerating decline) were observed pre-inflection throughout the study area (Figure 8), with peak intensity near the GBA geometric center. Annual, spring, autumn, and winter trends displayed decreasing magnitudes (i.e., increasingly negative trends) from the E–G, W–G, and N–G regions to the GBA center, and summer had trends decreasing from eastern and southeastern regions to both the GBA center and northwestern NI–G.
Pre-inflection, accelerating decline (negative k) was near-ubiquitous (covered 99.85–100%), which peaked near the geometric center of the GBA. Post-inflection, the pattern reversed dramatically: Over 87.75% of regions exhibited positive k-5y trends, signifying widespread reduction in acceleration (i.e., deceleration of the improvement rate). This was particularly intense near GBA core and/or western NI-G, with winter showing the strongest deceleration (largest mean post-inflection increase: +0.293 µg·m−3·a−2). Only autumn sustained mean negative acceleration post-inflection (−0.116 μg·m−3·a−2), although this was much weaker than pre-inflection levels. Autumn also showed the greatest absolute change in acceleration magnitude across the transition (Δk = +1.297 μg·m−3·a−2). This spatially structured pattern—widespread post-inflection deceleration except for sustained (but weakened) acceleration in autumn—suggests regional saturation of pollution mitigation gains outside of the autumn season, highlighting evolving regional sensitivities in pollution control efficacy.

4. Discussion

4.1. Policy Efficacy and the 2014 Inflection Point

Our study establishes 2014 as a statistically definitive inflection point (F-test, p < 0.05) for PM2.5 reduction in the GHM region. Quantified evidence demonstrates synchronized declines in national emissions: SO2 decreased by 70%, NOx by 28%, and PM2.5 by 44% during 2013–2020 [68]. Notably, these reductions translated regionally into a 41–55% decline in PM2.5 concentrations over the PRD directly attributable to local emission controls, while nationwide mitigation efforts (excluding the PRD) contributed an additional 10–28% reduction [69]. This dual-scale forcing drove pre-2014 non-significant increases (+0.203 µg·m−3·a−1, p > 0.05) to transition into sharp post-2014 declines (−2.046 µg·m−3·a−1, p < 0.01)—a rate 2.39 times faster than the 2000–2023 trend (−0.858 µg·m−3·a−1). This transition distinguishes GHM from broader Chinese trends where PM2.5 rose during overlapping periods [28,31], resolving temporal inconsistencies through rigorous breakpoint analysis. Unlike earlier breakpoints identified elsewhere (e.g., 2005–2011, 2005 [31], 2006 [70], 2007 [3,71], 2008 [53,72], 2011 [37]) via peak detection alone, our methodologically robust validation confirms 2014 as the onset of sustained improvement.
The inflection’s timing aligns precisely with the enforcement crescendo of China’s integrated clean air policies: the Air Pollution Prevention and Control Action Plan (2013–2017) intensified source-specific controls [49], while Guangdong’s 2014 regulatory surge—including real-time monitoring transparency, industrial emission crackdowns, and cross-jurisdictional coordination with Hong Kong/Macao [71,73]—catalyzed regional mitigation. Post-2014 acceleration exemplifies the “high-baseline advantage”: the urbanized GHM core achieved rapid initial reductions (−2.046 µg·m−3·a−1, p < 0.01) due to elevated precursor emissions [36,45,47,49]. However, curvature analysis (k-5y-Year = −0.234 µg·m−3·a−2, p < 0.01) revealed a critical non-linear dynamic—the improvement rate decelerated post-2016 as lower-baseline subregions (E/W/N-GD) faced rising marginal costs [26,49]. This deceleration pattern directly signals the need for adaptive policy reinvention: as concentrations decline, future mitigation strategies must prioritize cost-effective technologies (e.g., ultra-low industrial emissions retrofits) and regional compensation mechanisms to overcome diminishing returns.
This trajectory mirrors the Environmental Kuznets Curve (EKC) inflection [25,41]. GHM’s decoupling of GDP growth from PM2.5 post-2014 signifies a transition beyond the pollution peak, positioning it as a model for industrializing megaregions [19,42,43,44]. Yet the persistence of k-5y deceleration underscores a pivotal challenge: sustaining improvement rates requires dynamic policy reinvention as concentrations decline [49,74].

4.2. Spatiotemporal Heterogeneity and Seasonal Bottlenecks

A persistent radial PM2.5 gradient emerged across the GHM region over the past two decades, intensifying from peripheral areas (E/W/N-GD) to the urbanized GBA core (p < 0.05, Figure 8a). This spatial pattern stems from triple constraints: northern mountain barriers (e.g., Nanling Range) restrict atmospheric ventilation [26,33,34,35,59]; urban “heat-pollution islands” concentrate emissions through intensified industrial activity and energy consumption [41,42,48,75]; and declining vegetation coverage (NDVI) (Figure 1b) toward the core reduces natural particle adsorption [25,41,76]. Crucially, post-2014 reductions accelerated radially toward the highest-pollution core (intensification gradient: −2.303 µg·m−3·a−1, Figure 4), demonstrating that initial emission density governs mitigation efficiency [47,49].
Extreme seasonality further complicates reduction efforts; winter concentrations peaked at 2.07× summer minima (99.70% vs. 0% exceedance areas), with autumn similarly burdened (77.17% exceedance) [12,21,24,34,35,60]. This bipolar pattern reflects the East Asian Monsoon’s dual role: summer oceanic flows deliver high humidity (44% annual rainfall) that enhances wet scavenging and typhoon dispersion [21,35,59,77], whereas winter continental winds induce stable boundary layers, temperature inversions, and suppressed rainfall (7.5% annual), synergistically trapping pollutants [21,25,35,70]. Consequently, seasonal compliance diverged markedly—summer achieved China’s strictest Grade I standard (15 µg·m−3) by 2022, while winter lagged at the Grade II standard (35 µg·m−3) until 2021.
Curvature analysis of reduction trends (k-5y) reveals a critical bottleneck in decoupling dynamics. Spatial deceleration: Improvement rates slowed most prominently in the GBA core (post-transition Δk = +0.527 µg·m−3·a−2, Figure 7), reflecting rising marginal costs at lower concentrations [29,30,49]. Seasonal asymmetry: Autumn and winter PM2.5 drove 73.95% of the annual slowdown magnitude. Paradoxically, winter delivered the largest absolute reductions (−2.646 µg·m−3·a−1) yet exhibited the strongest deceleration, while autumn recorded the largest absolute magnitude difference in pre- and post-inflection values (−3.961 μg·m−3·a−1). These asymmetric deceleration patterns necessitate seasonally stratified policies. Winter demands enhanced emission lockdown protocols during inversion episodes, while autumn requires preemptive controls targeting monsoon transition biomass burning and secondary aerosol formation. Autumn acceleration: As the only season maintaining negative k-5y-Season (−0.116 µg·m−3·a−2), autumn’s delayed policy focus highlights untapped mitigation potential during monsoon transitions. Policy Imperative: The rate of annual decline is now slowing (increasing k-5y-Year values) [29,30,49], driven primarily by deceleration in autumn/winter reductions [49]. This underscores that future improvements necessitate intensified seasonally targeted controls during high-pollution periods.

4.3. Considerations and Future Directions

Despite the remarkable progress evidenced by annual means meeting China’s Grade II NAAQS (35 µg·m−3) in 2017 and all seasonal means reaching record lows by 2023 (>40% below peak concentrations), significant challenges remain. The slowing rate of improvement, particularly during the high-burden autumn and winter seasons, necessitates intensified, regionally tailored control measures targeting these critical periods. Further improvements are inherently constrained by the lower baseline concentrations now prevailing, making equivalent percentage reductions more costly and technically demanding [49,74]. Deceleration (rising k-5y) must drive next-generation policies, such as emission trading for non-point sources, dynamic industry standards during stagnation, and AI-enhanced early-warning systems.
Our analysis also highlights limitations inherent in ground-level PM2.5 monitoring within the GHM. Nationwide ground monitoring began only in 2013, necessitating satellite-derived PM2.5 (e.g., ChinaHighPM2.5 from MODIS MAIAC AOD) [62,78,79,80,81,82]. Sparse station coverage (143 stations, 84 in GBA core) underrepresents rural/peripheral areas (Figure 1a) [48,78,83]. MODIS retrievals face challenges, including bright surfaces (urban/winter), clouds/fog, and aerosol physics [62,78,80,81,82]. Future work must address peak/minimum concentration dynamics, potential multi-inflection sequences, and optimized monitoring network design.
Sustaining and accelerating air quality gains in the GHM will require overcoming these seasonal bottlenecks and spatial heterogeneities through innovative, targeted policies that address the increasingly complex challenges of pollution reduction at lower concentration levels.

5. Conclusions

The GHM region exemplifies a policy-driven pollution reversal, with 2014 marking a statistically verified inflection point (p < 0.01) toward sustained PM2.5 reduction. This transition reveals two cardinal principles. 1. Pollution reduction efficiency scales with initial concentration—urban cores achieved rapid declines but face diminishing returns. 2. Meteorological constraints dictate mitigation ceilings—winter stagnation and autumn transitions concentrated 73.95% of deceleration forces (k-5y-Year).
Spatiotemporally, reductions followed radial decay gradients from urban centers, modulated by topography and monsoon phase. Latitudinal divergence in transition timing (earlier south of 23° N, 23.873°~22.812° N) further underscores climate regulation. Critically, linear projections obscure non-linear reality: improvement rates narrowed post-2016 (Δk = +0.527 µg·m−3·a−2), signaling escalating effort per unit gain.
Policy Imperatives: We require advanced strategies tailored to these critical periods (winter and autumn) and for regions now facing diminishing marginal returns.
For coastal megaregions, GHM’s trajectory delivers a pivotal lesson: sustainable decoupling demands transcending annual averages to conquer climatic frontiers.

Author Contributions

Conceptualization, M.W.; methodology, M.W., Z.A. and Z.H.; software, M.W.; validation, M.W., Z.H. and Z.A.; formal analysis, M.W. and Z.H.; investigation, M.W. and Z.H.; resources, M.W. and Z.H.; data curation, M.W. and Z.H.; writing—original draft preparation, M.W., Z.A., Z.H., W.L. and Y.J.; writing—review and editing, M.W., Z.A., Z.H., W.L. and Y.J.; visualization, M.W.; supervision, M.W.; project administration, M.W.; funding acquisition, M.W. All authors have read and agreed to the published version of the manuscript.

Funding

This research was funded by the Project of the Educational Commission of Guangdong Province of China, grant number 2023KCXTD023, and the Chaozhou Special Fund for Human Resource Development, grant number 2026.

Institutional Review Board Statement

Not applicable.

Informed Consent Statement

Not applicable.

Data Availability Statement

The ChinaHighPM2.5 data were obtained from https://data.tpdc.ac.cn/zh-hans/data/6168e75d-93ab-4e4a-b7ff-33152e49d0bf, accessed on 15 September 2024.

Acknowledgments

An AI-assisted language tool [DeepSeek, R1] was used to improve the clarity and organization of the manuscript [text editing (e.g., grammar, spelling, and punctuation)]. All scientific content, interpretations, and conclusions were reviewed and verified by the authors, who take full responsibility for the final manuscript.

Conflicts of Interest

The authors declare no conflicts of interest.

Appendix A

Table A1. Dataset accuracy verification table.
ScaleYearEffective PointsR2RMSE
(µg⸱m−3)
MAE
(µg⸱m−3)
MRE (%)
Month20147700.975 2.539 1.790 6.303
201511560.967 2.414 1.484 4.665
201611660.969 1.894 1.232 4.226
201711740.978 1.879 1.259 4.014
201811760.978 1.733 1.177 3.888
201911830.980 1.563 0.988 3.762
202011880.982 1.197 0.747 3.501
202115310.990 0.982 0.641 3.053
202215250.979 1.077 0.728 4.019
202315300.982 1.071 0.734 3.742
Total12,3990.982 1.635 1.021 4.000
Annual2014960.957 1.287 0.990 2.858
2015960.929 1.329 0.999 2.916
2016970.930 1.352 0.830 2.698
2017960.934 1.325 0.911 2.749
2018980.952 1.174 0.841 2.713
2019980.910 1.079 0.680 2.465
2020990.936 0.778 0.544 2.428
20211270.951 0.687 0.511 2.384
20221280.923 0.780 0.565 2.872
20231270.940 0.774 0.556 2.642
Total10620.978 1.062 0.725 2.668
Table A2. Seasonal compliance with AAQS-II Standards (Mean–5y).
SeasonMean Concentration (μg·m−3)Compliance Rate (%)Exceedance Rate (%)
Winter45.180.3099.70
Autumn38.6422.8377.17
Summer21.80100.000.00
Spring34.3257.8442.16
Annual35.1455.6444.36
Table A3. Trend reversal magnitudes (pre- vs. post-inflection).
Temporal ScalePre-Inflection Trend (μg·m−3·a−1)Post-Inflection Trend (μg·m−3·a−1)Change
(μg·m−3·a−1)
Winter+0.263−2.646−2.909
Autumn+2.061−1.900−3.961
Summer+0.058−1.537−1.595
Spring+0.528−1.842−2.370
Annual+0.281−2.021−2.303

References

  1. State of Global Air 2024. Available online: https://www.stateofglobalair.org/resources/report/state-global-air-report-2024 (accessed on 31 December 2024).
  2. Cohen, A.J.; Brauer, M.; Burnett, R.; Anderson, H.R.; Frostad, J.; Estep, K.; Balakrishnan, K.; Brunekreef, B.; Dandona, L.; Dandona, R.; et al. Estimates and 25-year trends of the global burden of disease attributable to ambient air pollution: An analysis of data from the global burden of diseases study 2015. Lancet 2017, 389, 1907–1918. [Google Scholar] [CrossRef] [Scilit] [PubMed]
  3. Wu, S.; Li, H.; He, Y.; Zhou, Y. Detection of PM2.5 spatiotemporal patterns and driving factors in urban agglomerations in China. Atmos. Pollut. Res. 2023, 14, 101881. [Google Scholar] [CrossRef] [Scilit]
  4. Shamsollahi, H.R.; Yunesian, M.; Kharrazi, S.; Jahanbin, B.; Nazmara, S.; Rafieian, S.; Dehghani, M.H. Characterization of persistent materials of deposited PM2.5 in the human lung. Chemosphere 2022, 301, 134774. [Google Scholar] [CrossRef] [Scilit]
  5. Liu, Y.; Yuan, Q.; Zhang, X.; Chen, Z.; Jia, X.; Wang, M.; Xu, T.; Wang, Z.; Jiang, J.; Ma, Q.; et al. Fine particulate matter (PM2.5) induces inhibitory memory alveolar macrophages through the AhR/IL-33 pathway. Cell. Immunol. 2023, 386, 104694. [Google Scholar] [CrossRef] [Scilit]
  6. Wang, R.; Kang, N.; Zhang, W.; Chen, B.; Xu, S.; Wu, L. The developmental toxicity of PM2.5 on the early stages of fetal lung with human lung bud tip progenitor organoids. Environ. Pollut. 2023, 330, 121764. [Google Scholar] [CrossRef] [Scilit]
  7. Health and Environmental Effects of Particulate Matter (PM). Available online: https://www.epa.gov/pm-pollution/health-and-environmental-effects-particulate-matter-pm (accessed on 16 July 2024).
  8. Hill, W.; Lim, E.L.; Weeden, C.E.; Lee, C.; Augustine, M.; Chen, K.; Kuan, F.C.; Marongiu, F.; Evans, E.J., Jr.; Moore, D.A.; et al. Lung adenocarcinoma promotion by air pollutants. Nature 2023, 616, 159–167. [Google Scholar] [CrossRef] [Scilit] [PubMed]
  9. Huang, X.; Steinmetz, J.; Marsh, E.K.; Aravkin, A.Y.; Ashbaugh, C.; Murray, C.J.L.; Yang, F.; Ji, J.S.; Zheng, P.; Sorensen, R.J.D.; et al. A systematic review with a Burden of Proof meta-analysis of health effects of long-term ambient fine particulate matter (PM2.5) exposure on dementia. Nat. Aging 2025, 5, 897–908. [Google Scholar] [CrossRef] [Scilit]
  10. Zhang, X.; Liu, H.; Wu, X.; Jia, L.; Gadhave, K.; Wang, L.; Zhang, K.; Li, H.; Chen, R.; Kumbhar, R.; et al. Lewy body dementia promotion by air pollutants. Science 2025, 389, eadu4132. [Google Scholar] [CrossRef] [Scilit]
  11. Gu, B.; Zhang, L.; van Dingenen, R.; Vieno, M.; van Grinsven, H.J.; Zhang, X.; Zhang, S.; Chen, Y.; Wang, S.; Ren, C.; et al. Abating ammonia is more cost-effective than nitrogen oxides for mitigating PM2.5 air pollution. Science 2021, 374, 758–762. [Google Scholar] [CrossRef] [Scilit]
  12. Chow, W.S.; Liao, K.; Huang, X.H.H.; Leung, K.F.; Lau, A.K.H.; Yu, J.Z. Measurement report: The 10-year trend of PM2.5 major components and source tracers from 2008 to 2017 in an urban site of Hong Kong, China. Atmos. Chem. Phys. 2022, 22, 11557–11577. [Google Scholar] [CrossRef] [Scilit]
  13. Yin, P.; Brauer, M.; Cohen, A.J.; Wang, H.D.; Li, J.; Burnett, R.T.; Stanaway, J.D.; Causey, K.; Larson, S.; Godwin, W.; et al. The effect of air pollution on deaths, disease burden, and life expectancy across China and its provinces, 1990–2017: An analysis for the Global Burden of Disease Study 2017. Lancet Planet. Health 2020, 4, e386–e398. [Google Scholar] [CrossRef] [Scilit] [PubMed]
  14. Chen, C.; Gao, B.; Xu, M.; Liu, S.; Zhu, D.; Yang, J.; Chen, Z. The spatiotemporal variation of PM2.5-O3 association and its influencing factors across China: Dynamic Simil-Hu lines. Sci. Total Environ. 2023, 880, 163346. [Google Scholar] [CrossRef] [Scilit]
  15. Pope, C.A., III; Burnett, R.T.; Thun, M.J.; Calle, E.E.; Krewski, D.; Ito, K.; Thurston, G.D. Lung cancer, cardiopulmonary mortality, and long-term exposure to fine particulate air pollution. JAMA—J. Am. Med. Assoc. 2002, 287, 1132–1141. [Google Scholar] [CrossRef] [Scilit] [PubMed]
  16. Pascal, M.; Corso, M.; Chanel, O.; Declercq, C.; Badaloni, C.; Cesaroni, G.; Henschel, S.; Meister, K.; Haluza, D.; Martin-Olmedo, P.; et al. Assessing the public health impacts of urban air pollution in 25 European cities: Results of the Aphekom project. Sci. Total Environ. 2013, 449, 390–400. [Google Scholar] [CrossRef] [Scilit]
  17. Ambient (Outdoor) Air Quality and Health. Available online: https://www.who.int/news-room/fact-sheets/detail/ambient-(outdoor)-air-quality-and-health (accessed on 24 October 2024).
  18. Cao, S.S.; Zhao, W.J.; Guan, H.L.; Hu, D.Y.; Mo, Y.; Zhao, W.H.; Li, S.S. Comparison of remotely sensed PM2.5 concentrations between developed and developing countries: Results from the US, Europe, China, and India. J. Clean. Prod. 2018, 182, 672–681. [Google Scholar] [CrossRef] [Scilit]
  19. Lim, C.H.; Ryu, J.; Choi, Y.; Jeon, S.W.; Lee, W.K. Understanding global PM2.5 concentrations and their drivers in recent decades (1998–2016). Environ. Int. 2020, 144, 106011. [Google Scholar] [CrossRef] [Scilit]
  20. Shi, Y.S.; Matsunaga, T.; Yamaguchi, Y.; Li, Z.Q.; Gu, X.F.; Chen, X.H. Long-term trends and spatial patterns of satellite-retrieved PM2.5 concentrations in South and Southeast Asia from 1999 to 2014. Sci. Total Environ. 2018, 615, 177–186. [Google Scholar] [CrossRef] [Scilit]
  21. Yang, H.; Yao, R.; Sun, P.; Ge, C.; Ma, Z.; Bian, Y.; Liu, R. Spatiotemporal Evolution and Driving Forces of PM2.5 in Urban Agglomerations in China. Int. J. Environ. Res. Public Health 2023, 20, 2316. [Google Scholar] [CrossRef] [Scilit]
  22. Lelieveld, J.; Evans, J.S.; Fnais, M.; Giannadaki, D.; Pozzer, A. The contribution of outdoor air pollution sources to premature mortality on a global scale. Nature 2015, 525, 367–371. [Google Scholar] [CrossRef] [Scilit]
  23. Li, J.; Han, X.; Jin, M.; Zhang, X.; Wang, S. Globally analysing spatiotemporal trends of anthropogenic PM2.5 concentration and population’s PM2.5 exposure from 1998 to 2016. Environ. Int. 2019, 128, 46–62. [Google Scholar] [CrossRef] [Scilit]
  24. Zhang, Y.L.; Cao, F. Fine particulate matter (PM2.5) in China at a city level. Sci. Rep. 2015, 5, 14884. [Google Scholar] [CrossRef] [Scilit] [PubMed]
  25. Miao, Y.; Geng, C.; Ji, Y.; Wang, S.; Wang, L.; Yang, W. Understanding the Dynamics of PM2.5 Concentration Levels in China: A Comprehensive Study of Spatio-Temporal Patterns, Driving Factors, and Implications for Environmental Sustainability. Sustainability 2025, 17, 1742. [Google Scholar] [CrossRef] [Scilit]
  26. Chen, Z.Y.; Chen, D.L.; Zhao, C.F.; Kwan, M.P.; Cai, J.; Zhuang, Y.; Zhao, B.; Wang, X.Y.; Chen, B.; Yang, J.; et al. Influence of meteorological conditions on PM2.5 concentrations across China: A review of methodology and mechanism. Environ. Int. 2020, 139, 105558. [Google Scholar] [CrossRef] [Scilit]
  27. Chen, L.; Shit, M.S.; Li, S.H.; Gao, S.; Zhang, H.; Sun, Y.L.; Mao, J.; Bai, Z.P.; Wang, Z.L.; Zhou, J. Quantifying public health benefits of environmental strategy of PM2.5 air quality management in Beijing–Tianjin–Hebei region, China. J. Environ. Sci. 2017, 57, 33–40. [Google Scholar] [CrossRef] [Scilit] [PubMed]
  28. Peng, J.; Chen, S.; Lü, H.; Liu, Y.; Wu, J. Spatiotemporal patterns of remotely sensed PM2.5 concentration in China from 1999 to 2011. Remote Sens. Environ. 2016, 174, 109–121. [Google Scholar] [CrossRef] [Scilit]
  29. China Ecological and Environmental Status Bulletin. Available online: https://www.mee.gov.cn/hjzl/sthjzk/zghjzkgb/index.shtml (accessed on 4 June 2025).
  30. Report on the State of Guangdong Provincial Ecology and Environment. Available online: https://gdee.gd.gov.cn/hjzkgb/index.html (accessed on 18 July 2025).
  31. Xia, W.H. Spatio-Temporal Pattern Analysis of Meteorological-Data-Based PM2.5 Concentrations in China: 1980–2016. Master’s Thesis, Wuhan University, Wuhan, China, 2019. (In Chinese) [Google Scholar]
  32. Wang, Y.; Gao, W.; Wang, S.; Song, T.; Gong, Z.; Ji, D.; Wang, L.; Liu, Z.; Tang, G.; Huo, Y.; et al. Contrasting trends of PM2.5 and surface-ozone concentrations in China from 2013 to 2017. Natl. Sci. Rev. 2020, 7, 1331–1339. [Google Scholar] [CrossRef] [Scilit]
  33. Cai, Q.N.; Che, Y.Z.; Sun, L.Y.; Tian, J.X.; Fang, D.L.; Chen, B.; Luo, M. PM2.5 concentration prediction and its health effect in the Pearl River Delta of China. Acta Ecol. Sinica 2021, 41, 8977–8990. (In Chinese) [Google Scholar]
  34. Weng, L.T.; Wang, P.; Xiao, R.B.; Bai, J.J.; Zhong, J.H. Spatial-Temporal Distribution Characteristics of PM2.5 and O3 in the Pearl River Delta Urban Agglomeration and Corresponding Influence Factors. Ecol. Environ. 2025, 34, 268–278. (In Chinese) [Google Scholar] [CrossRef]
  35. Li, C.; Wang, J.Y.; Zhao, H. Atmospheric Composite Pollution Trends and Population Health Impacts in the Guangdong–Hong Kong–Macao Pearl River Delta Region. Environ. Sci. Res. 2024, 37, 1378–1388. (In Chinese) [Google Scholar]
  36. Liu, B.; Wang, L.; Zhang, L.; Bai, K.; Chen, X.; Zhao, G.; Yin, H.T.; Chen, N.; Li, R.; Xin, J.Y.; et al. Evaluating urban and nonurban PM2.5 variability under clean air actions in China during 2010–2022 based on a new high-quality dataset. Int. J. Digit. Earth 2024, 17, 2310734. [Google Scholar] [CrossRef] [Scilit]
  37. Cai, K.; Zhang, Q.; Li, S.; Li, Y.; Ge, W. Spatial-Temporal Variations in NO2 and PM2.5 over the Chengdu–Chongqing Economic Zone in China during 2005–2015 Based on Satellite Remote Sensing. Sensors 2018, 18, 3950. [Google Scholar] [CrossRef] [Scilit]
  38. Zhao, C.; Pan, Y.; Teng, Y.; Baqa, M.F.; Guo, W. Air Quality Improvement in China: Evidence from PM2.5 Concentrations in Five Urban Agglomerations, 2000–2021. Atmosphere 2022, 13, 1839. [Google Scholar] [CrossRef] [Scilit]
  39. Xu, Y.; Guo, Z.; Zheng, Z.; Dai, Q.; Zhao, C.; Huang, W. Study of the PM2.5 Concentration Variation and its Influencing Factors in the Beijing–Tianjin–Hebei Urban Agglomeration Using Geo-Detector. Environ. Sci. Res. 2023, 36, 649–659. (In Chinese) [Google Scholar]
  40. Wang, Z.B.; Fang, C.L. Spatial-temporal characteristics and determinants of PM2.5 in the Bohai Rim Urban Agglomeration. Chemosphere 2016, 148, 148–162. [Google Scholar] [CrossRef] [Scilit]
  41. Li, X.; Wu, C.; Meadows, M.E.; Zhang, Z.; Lin, X.; Zhang, Z.; Chi, Y.; Feng, M.; Li, E.; Hu, Y. Factors Underlying Spatiotemporal Variations in Atmospheric PM2.5 Concentrations in Zhejiang Province, China. Remote Sens. 2021, 13, 3011. [Google Scholar] [CrossRef] [Scilit]
  42. Fang, D.; Yu, B. Driving mechanism and decoupling effect of PM2.5 emissions: Empirical evidence from China’s industrial sector. Energy Policy 2021, 149, 112017. [Google Scholar] [CrossRef] [Scilit]
  43. Huang, H.; Jiang, P.; Chen, Y. Analysis of the Social and Economic Factors Influencing PM2.5 Emissions at the City Level in China. Sustainability 2023, 15, 16335. [Google Scholar] [CrossRef] [Scilit]
  44. Xie, Q.C.; Xu, X.; Liu, X.Q. Is there an EKC between economic growth and smog pollution in China? New evidence from semiparametric spatial autoregressive models. J. Clean. Prod. 2019, 220, 873–883. [Google Scholar] [CrossRef] [Scilit]
  45. Particulate Matter (PM2.5) Trends. Available online: https://www.epa.gov/air-trends/particulate-matter-pm25-trends (accessed on 10 April 2018).
  46. European Environment Agency. Air Quality in Europe—2014 Report; European Environment Agency: Copenhagen, Denmark, 2014.
  47. Meng, L.L.; Shan, C.Y.; Bai, Z.P.; Ren, L.H.; Wu, X.X.; Zhao, J.J.; Chen, Y.; Li, Y.Y. Phased-in Targets of PM2. 5 Air Quality Improvement in Chinese Cities. Environ. Monit. China 2017, 33, 1–10. (In Chinese) [Google Scholar]
  48. Hou, Y.L.; Wang, Q.W.; Tan, T. Evaluating drivers of PM2.5 air pollution at urban scales using interpretable machine learning. Waste Manag. 2025, 192, 114–124. [Google Scholar] [CrossRef] [Scilit]
  49. Geng, G.; Liu, Y.; Liu, Y.; Liu, S.; Cheng, J.; Yan, L.; Wu, N.; Hu, H.; Tong, D.; Zheng, B.; et al. Efficacy of China’s clean air actions to tackle PM2.5 pollution between 2013 and 2020. Nat. Geosci. 2024, 17, 987–994. [Google Scholar] [CrossRef] [Scilit]
  50. Zhang, Q.; Zheng, Y.; Tong, D.; Shao, M.; Wang, S.; Zhang, Y.; Xu, X.; Wang, J.; He, H.; Liu, W.; et al. Drivers of improved PM2.5 air quality in China from 2013 to 2017. Proc. Natl. Acad. Sci. USA 2019, 116, 24463–24469. [Google Scholar] [CrossRef] [Scilit] [PubMed]
  51. Guan, Y.; Xiao, Y.; Rong, B.; Zhang, N.; Chu, C. Long-term health impacts attributable to PM2.5 and ozone pollution in China’s most polluted region during 2015–2020. J. Clean. Prod. 2021, 321, 128970. [Google Scholar] [CrossRef] [Scilit]
  52. Liu, Q.; Wu, R.; Zhang, W.; Li, W.; Wang, S. The varying driving forces of PM2.5 concentrations in Chinese cities: Insights from a geographically and temporally weighted regression model. Environ. Int. 2020, 145, 106168. [Google Scholar] [CrossRef] [Scilit] [PubMed]
  53. Zhang, Y.L.; Sui, J.L.; Wu, X.; Lin, M.X.; Chen, L.; Chen, T.Y. Temporal and spatial distribution characteristics of PM2.5 and its relationship with meteorological factors in Guangdong–Hong Kong–Macao Greater Bay Area. Acta Ecol. Sinica 2021, 41, 2272–2281. (In Chinese) [Google Scholar]
  54. Chen, P.; Ma, Y.J.; Zhang, M.Y.; Chen, W.T.; Jiang, X.P. Analysis of Vegetation Dynamic in Guangdong Province Based on kNDVI. Ecol. Environ. 2025, 34, 499–510. (In Chinese) [Google Scholar]
  55. Lv, Z.; Ju, T.; Li, B.; Li, C.; Cao, Y.; Wang, L. Assessment of PM2.5 pollution features and health advantages in Northwest China. Environ. Monit. Assess. 2024, 196, 1189. [Google Scholar] [CrossRef] [Scilit]
  56. Sharma, M.; Singh, K.; Gautam, A.S.; Gautam, S. Longitudinal Study of Air Pollutants in Indian Metropolises: Seasonal Patterns and Urban Variability. Aerosol Sci. Eng. 2025, 9, 320–335. [Google Scholar] [CrossRef] [Scilit]
  57. Wang, S.P.; Wang, Z.H.; Piao, S.L.; Fang, J.Y. Regional differences in the timing of recent air warming during the past four decades in China. Chin. Sci. Bull. 2010, 55, 1968–1973. [Google Scholar] [CrossRef] [Scilit]
  58. Wu, D.; Lau, A.K.; Leung, Y.K.; Bi, X.Y.; Li, F.; Tan, H.B.; Liao, B.T.; Chen, H.Z. Hazy weather formation and visibility deterioration resulted from fine particulate (PM2.5) pollutions in Guangdong and Hong Kong. Acta Sci. Circum. 2012, 32, 2660–2669. (In Chinese) [Google Scholar]
  59. Wang, H.C.; Chen, X.R.; Li, L.; Lu, X.; Lu, K.D.; Fan, S.J. Rapid increase in spring ozone in the Pearl River Delta, China during 2013-2022. npj Clim. Atmos. Sci. 2024, 7, 309. [Google Scholar] [CrossRef] [Scilit]
  60. Zhang, Y.; Zhao, Y. Characteristics and Spatiotemporal Patterns of PM2.5 Concentrations in the Pearl River Delta Region. Sci. Technol. Innov. 2017, 13, 138–139. (In Chinese) [Google Scholar]
  61. Wei, J.; Li, Z. ChinaHighPM2.5: High-Resolution and High-Quality Ground-Level PM2.5 Dataset for China (2000–2023); National Tibetan Plateau/Third Pole Environment Data Center: Beijing, China, 2023. [Google Scholar] [CrossRef] [Scilit]
  62. Wang, M.; An, Z.F.; Wang, S. The Time Lag Effect Improves Prediction of the Effects of Climate Change on Vegetation Growth in Southwest China. Remote Sens. 2022, 14, 5580. [Google Scholar] [CrossRef] [Scilit]
  63. HJ 663—2013; Technical Regulation for Ambient Air Quality Assessment (on Trial). Ministry of Ecology and Environment of the People’s Republic of China: Beijing, China, 2013.
  64. Wang, M.; Jiang, C.; Sun, O.J. Spatially differentiated changes in regional climate and underlying drivers in southwestern China. J. For. Res. 2022, 33, 755–765. [Google Scholar] [CrossRef] [Scilit]
  65. Wang, M.; Wang, S.; An, Z. Quantifying the Spatio-Temporal Pattern Differences in Climate Change before and after the Turning Year in Southwest China over the Past 120 Years. Atmosphere 2023, 14, 940. [Google Scholar] [CrossRef] [Scilit]
  66. Wang, X.H.; Piao, S.L.; Ciais, P.; Li, J.S.; Friedlingstein, P.; Koven, C.D.; Chen, A.P. Spring temperature change and its impli-cation in the change of vegetation growth in North America from 1982 to 2006. Proc. Natl. Acad. Sci. USA 2011, 108, 1240–1245. [Google Scholar] [CrossRef] [Scilit]
  67. Li, M.; Wang, L.; Liu, J.; Gao, W.; Song, T.; Sun, Y.; Li, L.; Li, X.; Wang, Y.; Liu, L.; et al. Exploring the regional pollution characteristics and meteorological formation mechanism of PM2.5 in North China during 2013–2017. Environ. Int. 2019, 134, 105283. [Google Scholar] [CrossRef] [Scilit] [PubMed]
  68. Zhang, Q.; Yin, Z.; Lu, X.; Gong, J.; Lei, Y.; Cai, B.; Cai, C.; Chai, Q.; Chen, H.; Dai, H.; et al. Synergetic roadmap of carbon neutrality and clean air for China. Environ. Sci. Ecotechnol. 2023, 16, 100280. [Google Scholar] [CrossRef] [Scilit]
  69. Zhang, J.; Huang, Y.; Zhou, N.; Huang, Z.; Shi, B.; Yuan, X.; Sheng, L.; Zhang, A.; You, Y.; Chen, D.; et al. Contribution of anthropogenic emission changes to the evolution of PM2.5 concentrations and composition in the pearl river delta during the period of 2006–2020. Atmos. Environ. 2024, 318, 120228. [Google Scholar] [CrossRef] [Scilit]
  70. Geng, G.N.; Xiao, Q.Y.; Liu, S.G.; Liu, X.D.; Cheng, J.; Zheng, Y.X.; Xue, T.; Tong, D.; Zheng, B.; Peng, Y.R.; et al. Tracking Air Pollution in China: Near Real-Time PM2.5 Retrievals from Multisource Data Fusion. Environ. Sci. Technol. 2021, 55, 12106–12115. [Google Scholar] [CrossRef] [Scilit]
  71. Li, G.Q.; Qin, J.H.; He, R.W. Spatial-Temporal Evolution and Influencing Factors of China’s PM2.5 Pollution. Econ. Geogr. 2018, 38, 11–18. (In Chinese) [Google Scholar]
  72. Wang, G.L. Spatiotemporal Evolution of PM2.5 Pollution in the Urbanizating Cities of China. Mt. Res. Dev. 2024, 42, 880–894. (In Chinese) [Google Scholar] [CrossRef]
  73. A Concise Guide to the Air Pollution Control Ordinance. Available online: https://www.epd.gov.hk/epd/english/environmentinhk/air/guide_ref/guide_apco.html#introduction (accessed on 26 June 2024).
  74. Yue, H.; He, C.; Huang, Q.; Zhang, D.; Shi, P.; Moallemi, E.A.; Xu, F.; Yang, Y.; Qi, X.; Ma, Q.; et al. Substantially reducing global PM2.5-related deaths under SDG3.9 requires better air pollution control and healthcare. Nat. Commun. 2024, 15, 2729. [Google Scholar] [CrossRef] [Scilit]
  75. Manoli, G.; Fatichi, S.; Schläpfer, M.; Yu, K.L.; Crowther, T.W.; Meili, N.; Burlando, P.; Katul, G.G.; Bou-Zeid, E. Magnitude of urban heat islands largely explained by climate and population. Nature 2019, 573, 55–60. [Google Scholar] [CrossRef] [Scilit] [PubMed]
  76. Shen, J.W.; Cui, P.Y.; Huang, Y.D.; Luo, Y.; Guan, J. New insights into quantifying deposition and aerodynamic characteristics of PM2.5 removal by different tree leaves. Air Qual. Atmos. Health 2022, 15, 1341–1356. [Google Scholar] [CrossRef] [Scilit]
  77. Wang, X.Y.; Dickinson, R.E.; Su, L.Y.; Zhou, C.L.; Wang, K.C. PM2.5 pollution in China and how it has been exacerbated by terrain and meteorological conditions. Bull. Am. Meteorol. Soc. 2018, 99, 105–119. [Google Scholar] [CrossRef] [Scilit]
  78. Song, T.; Liu, J.Z.; Hu, T.T.; Sheng, S.J.; Yan, F.; Dong, M.; Zhou, W.L. Application of Atmospheric Particles Monitoring based on MODIS Aerosol Optical Thickness Products and Laser Radar. Remote Sens. Technol. Appl. 2016, 31, 397–404. (In Chinese) [Google Scholar]
  79. Zhang, X.; Wang, H.; Che, H.Z.; Tan, S.C.; Shi, G.Y.; Yao, X.P.; Zhao, H.J. Improvement of snow/haze confusion data gaps in MODIS Dark Target aerosol retrievals in East China. Atmos. Res. 2020, 245, 105063. [Google Scholar] [CrossRef] [Scilit]
  80. Li, P.; Peng, C.; Wang, M.; Luo, Y.; Li, M.; Zhang, K.; Zhang, D.; Zhu, Q. Dynamics of vegetation autumn phenology and its response to multiple environmental factors from 1982 to 2012 on Qinghai-Tibetan Plateau in China. Sci. Total Environ. 2018, 637–638, 855–864. [Google Scholar] [CrossRef] [Scilit] [PubMed]
  81. White, W.H.; Roberts, P.T. On the Nature and Origins of Visibility-Reducing Aerosols in the Los Angeles Air Basin. Atmos. Environ. 1977, 11, 803–812. [Google Scholar] [CrossRef] [Scilit]
  82. Xiao, Q.; Wang, Y.; Chang, H.H.; Meng, X.; Geng, G.; Lyapustin, A.; Liu, Y. Full-coverage high-resolution daily PM2.5 estimation using MAIAC AOD in the Yangtze River Delta of China. Remote Sens. Environ. 2017, 199, 437–446. [Google Scholar] [CrossRef] [Scilit]
  83. Zhou, C.; Gao, M.; Li, J.; Bai, K.; Tang, X.; Lu, X.; Liu, C.; Wang, Z.; Guo, Y. Optimal Planning of Air Quality-Monitoring Sites for Better Depiction of PM 2.5 Pollution across China. ACS Environ. Au 2022, 2, 314–323. [Google Scholar] [CrossRef] [Scilit]
Figure 1. Spatial characteristics of the study area. (a) Topography and administrative boundaries, highlighting the north–south elevational gradient. (b) Normalized Difference Vegetation Index (NDVI) depicting land cover heterogeneity. (c) Annual mean temperature distribution. (d) Annual precipitation patterns, with wet season (April–September) dominance. Gray lines: municipal boundaries; red lines: sub-regional boundaries (GBA, E-GD, W-GD, N-GD).
Atmosphere 17 00307 g001
Figure 2. Spatiotemporal patterns of PM2.5 concentrations (2000–2023). Five-year moving averages for (a) annual, (b) spring, (c) summer, (d) autumn, and (e) winter PM2.5 across China’s GHM regions. Right-diagonal shading: exceedance of AAQS-II threshold (35 μg·m−3); left-diagonal shading: compliance with AAQS-I (15 μg·m−3). Winter shows peak pollution (45.18 μg·m−3), while summer consistently meets air quality standards.
Atmosphere 17 00307 g002
Figure 3. Long-term trends and policy-driven breakpoints in PM2.5. (a) Annual and (be) seasonal five-year moving averages. Dashed vertical lines mark breakpoints (2014–2015, 2008) identified through piecewise regression [57]. Key findings: (1) Accelerated post-2014 declines (e.g., winter: −2.67 μg·m−3·a−1); (2) 2023 records lowest concentrations (e.g., winter: 28.86 μg·m−3); (3) summer achieved AAQS-I compliance by 2022.
Atmosphere 17 00307 g003
Figure 4. Regional heterogeneity in pollution trend reversals. (ae) Spatial distribution and (fj) density of breakpoints for (a,f) annual, (b,g) spring, (c,h) summer, (d,i) autumn, and (e,j) winter PM2.5. Gray dots: statistically significant transitions (F-test, p < 0.05). Autumn shifts concentrated in 2008–2009 (78.97%), while other seasons pivoted post-2014 (68.10–99.81% coverage), signaling earlier mitigation efficacy in western regions.
Atmosphere 17 00307 g004
Figure 5. Magnitude shifts in PM2.5 trends before vs. after breakpoints. (ae) For annual and each season: Panel (1) (overall trend), Panel (2) (pre-inflection), Panel (3) (post-inflection), Panel (4) (difference). Hatched areas: declining trends. Critical insights: (1) post-inflection declines intensified toward the GBA core (e.g., autumn: −3.961 μg·m−3·a−1 change); (2) winter exhibited fastest post-2014 reduction (−2.646 μg·m−3·a−1).
Atmosphere 17 00307 g005
Figure 6. Acceleration of PM2.5 reduction rates (k-5y, defined as the temporal change in the five-year moving average decline rate). (a) Annual and (be) seasonal trends in decline acceleration. Dashed lines mark breakpoints (e.g., 2009 for autumn). Pre-inflection, both autumn (−0.299) and winter (−0.255 µg·m−3·a−2) exhibited strong acceleration. However, post-inflection reversals occurred in most seasons (e.g., winter shifted to +0.338 μg·m−3·a−2 after 2015), indicating regional deceleration in long-term improvement rates.
Atmosphere 17 00307 g006
Figure 7. Spatiotemporal transitions in PM2.5 decline acceleration (k-5y breakpoints). (ae) Spatial patterns and (fj) density of breakpoints for k-5y trends. Gray dots: significant transitions (p < 0.05). Notable clusters: Autumn experienced its acceleration transition earliest (2008–2011, 97.82% coverage), while other seasons changed post-2014. The Tropic of Cancer (≈23° N, 23.873°~22.812° N) delineated transition timing between northern and southern zones.
Atmosphere 17 00307 g007
Figure 8. Phase reversals in PM2.5 decline acceleration. (ae) For annual and each season: Panel (1) (overall k-5y), Panel (2) (pre-inflection), Panel (3) (post-inflection), Panel (4) (difference). Hatched areas: positive k-5y (indicating deceleration of the improvement rate/reduced mitigation momentum). Post-inflection, acceleration weakened (shifted toward positive values) in 87.75–100% of regions for annual, spring, summer, and winter, signifying deceleration. Only autumn sustained a mean negative acceleration post-inflection (−0.116 μg·m−3·a−2), indicating continued (albeit reduced) acceleration of decline.
Atmosphere 17 00307 g008
Table 1. Key data and descriptions.
DatasetSource RepositoryResolutionAccess URLAccess DateFormat
DEMResource and Environmental Science Data Platform1 × 1 kmhttps://www.resdc.cn/data.aspx?DATAID=12315 September 2024GRID
ChinaHighPM2.5National Tibetan Plateau Environment Data Center1 × 1 kmhttps://data.tpdc.ac.cn/zh-hans/data/6168e75d-93ab-4e4a-b7ff-33152e49d0bf15 September 2024.nc
NDVIResource and Environmental Science Data Platform1 × 1 kmhttps://www.resdc.cn/DOI/DOI.aspx?DOIID=4911 August 2025GRID
PrecipitationNational Tibetan Plateau Environment Data Center1 × 1 kmhttps://data.tpdc.ac.cn/zh-hans/data/faae7605-a0f2-4d18-b28f-5cee413766a211 August 2025.nc
TemperatureNational Tibetan Plateau Environment Data Center1 × 1 kmhttps://data.tpdc.ac.cn/zh-hans/data/71ab4677-b66c-4fd1-a004-b2a541c4d5bf11 August 2025.nc
Disclaimer/Publisher’s Note: The statements, opinions and data contained in all publications are solely those of the individual author(s) and contributor(s) and not of MDPI and/or the editor(s). MDPI and/or the editor(s) disclaim responsibility for any injury to people or property resulting from any ideas, methods, instructions or products referred to in the content.