


Abstract
This study introduces a novel approach to 3-hourly and daily precipitation estimation over northern Algeria. The novel approach benefits from the classification capabilities of Random Forest (RF) and the predictive power of Convolutional Long Short-Term Memory (ConvLSTM) regression, with multi-temporal observations from the SEVIRI radiometer onboard the Meteosat Second Generation (MSG) satellite. The approach is a two-stage process: A Random Forest classifier is first used to provide a probabilistic characterization of precipitation occurrence and rainfall regimes. The ConvLSTM model then applies spatio-temporal regression to estimate rainfall intensities by analyzing multi-channel temporal sequences. The hybrid model produces spatially and temporally consistent precipitation fields by taking advantage of the spatio-temporal correlations of meteorological events, with the aim of obtaining accurate 3-hourly and daily rainfall accumulations for Northern Algeria. Results show a dramatic improvement over the reference RF-based technique, with correlation coefficients reaching 0.89 for 3-hourly accumulations and 0.91 for daily rainfall.
1. Introduction
Water is an important natural resource that is mostly replenished through rain and is a crucial part of the global hydrological cycle [1]. The amount, spatio-temporal distribution, and intensity of rainfall are critical parameters that directly influence hydrological processes and govern many socio-economic sectors, including agriculture, water resource management, hydroelectric energy production, transportation, and public health [2,3].
In northern Algeria, where the climate is Mediterranean with rainy winters but also very vulnerable to extremes like long droughts and flash floods, knowing exactly when it rains is very important for long-term development, planning for agriculture, and reducing the risk of natural disasters [4]. Precise estimation of precipitation is a crucial aspect in this region, which faces significant socio-economic challenges associated with the variability and extremes of rainfall [5].
Precipitation has traditionally been monitored using ground-based instruments such as rain gauges and weather radars. Rain gauges are great for taking precise point measurements, but they do not perform well over vast or mixed areas. This makes it hard and often wrong to use them to fill in the gaps [6,7]. Weather radars, on the other hand, can follow storms as they happen across a greater area [8]. However, setting up radar is still expensive, keeping it running is technically hard, and things like geography, beam blockage, or attenuation can impact the quality of the signal [9,10]. These limitations are particularly evident in mountainous or inadequately instrumented regions, such as much of northern Algeria, where significant observational gaps exist.
In this setting, satellite remote sensing has become an essential and supplemental tool. Meteosat and other geostationary meteorological satellites provide continuous observations of the atmosphere with high temporal resolution and wide spatial coverage. This helps us keep watch of cloud systems on both a regional and global scale [8]. The Spinning Enhanced Visible and InfraRed Imager (SEVIRI) aboard the Meteosat Second Generation (MSG) satellite collects images in both visible and infrared bands. These observations provide information on key cloud-top properties such as temperature, phase, optical thickness, and temporal evolution, which are indirectly linked to precipitation processes [11,12]. Using this kind of data, a variety of satellite-based rainfall retrieval algorithms have been built that can make quasi-global precipitation fields with considerably greater resolution than conventional networks [13,14]. These developments have generated unique options for hydrological modeling, water resource management, and operational meteorology, especially in places with limited in situ networks.
However, many satellite-based precipitation estimation approaches rely on empirical or statistical relationships between cloud-top infrared brightness temperature and surface precipitation intensity [15]. Although computationally efficient, these methods oversimplify the delicate physical processes involved, resulting in systematic biases, particularly in convective environments or during extreme occurrences [16].
To address these limits, the past twenty years have seen a paradigm shift towards the use of machine learning (ML) approaches in precipitation estimation. Support Vector Machines (SVM), Artificial Neural Networks (ANN), and Random Forests (RF) are examples of algorithms that have shown promise in capturing non-linear and high-dimensional correlations between cloud characteristics and precipitation. These algorithms work better than simply empirical methods [12,17,18].
Of them, Random Forests (RF) have become a very useful and strong approach to classify objects. RF can operate with vast, heterogeneous datasets, locate the most effective predictors, and produce unbiased error estimates [19] by combining together the best parts of decision trees in an ensemble learning framework. RF has been extensively applied in hydrology and atmospheric sciences, encompassing rainfall/no-rain detection, cloud-type classification, and precipitation estimation [12,20]. Also, Random Forest Classifiers prove to be very efficient for the estimation purposes of satellite-based precipitation, considering their capabilities to efficiently handle noisy data, missing data, and different conditions such as day and night.
Deep learning algorithms have concurrently changed the analysis of sequential and spatio-temporal data. Recurrent Neural Networks (RNN), notably Long Short-Term Memory (LSTM) networks, have been demonstrated to operate very well for simulating temporal sequences in hydrometeorological contexts [21,22]. Their application to spatiotemporal data via Convolutional LSTM (ConvLSTM) architectures has permitted the concurrent modeling of both geographical and temporal relationships, essential for precipitation processes. ConvLSTM was first designed for radar echo nowcasting [21], and it has demonstrated to be superior to classical sequence models or optical flow techniques at capturing the progression of rainfall and the movement of storms. Recent studies have also found that architectures incorporating ConvLSTMs can potentially outperform the traditional, non-temporal models by specifically taking into account cloud development processes, which improve the results of precipitation estimation [23,24]. Nevertheless, despite their proven effectiveness, ConvLSTMs remain computationally feasible for implementation within satellite-based systems of precipitation estimation.
A hybrid satellite precipitation estimation scheme incorporating Random Forest classification and Convolutional LSTM regression, using multispectral MSG-SEVIRI satellite data for the region of northern Algeria, has been proposed. The RF scheme has been utilized initially for the classification of precipitation types, which include no rainfall, stratiform precipitation, and convective precipitation, using spectral and temporal parameters of clouds, where the corresponding precipitation types are identified using only the respective weather radar measures. Rather than applying a strict separation between rainfall types, the probabilistic outputs of the RF classifier are used as continuous auxiliary inputs to the ConvLSTM regression model. The scheme has been developed to work equally well during the night and day as well as in places where ground observation points are limited. This study investigates the added value of spatio-temporal deep learning for satellite precipitation estimation by comparing a hybrid RF–ConvLSTM framework with a conventional RF-based approach.
This paper’s structure is as follows: Section 2 describes the region of study and its precipitation patterns. Section 3 describes the satellite, radar, and rain gauge datasets. Section 4 describes the proposed hybrid RF-ConvLSTM approach. Section 5 presents the classification and estimation outcomes. Section 6 discusses performance enhancements. Finally, Section 7 provides a summary of this paper.
2. Study Area
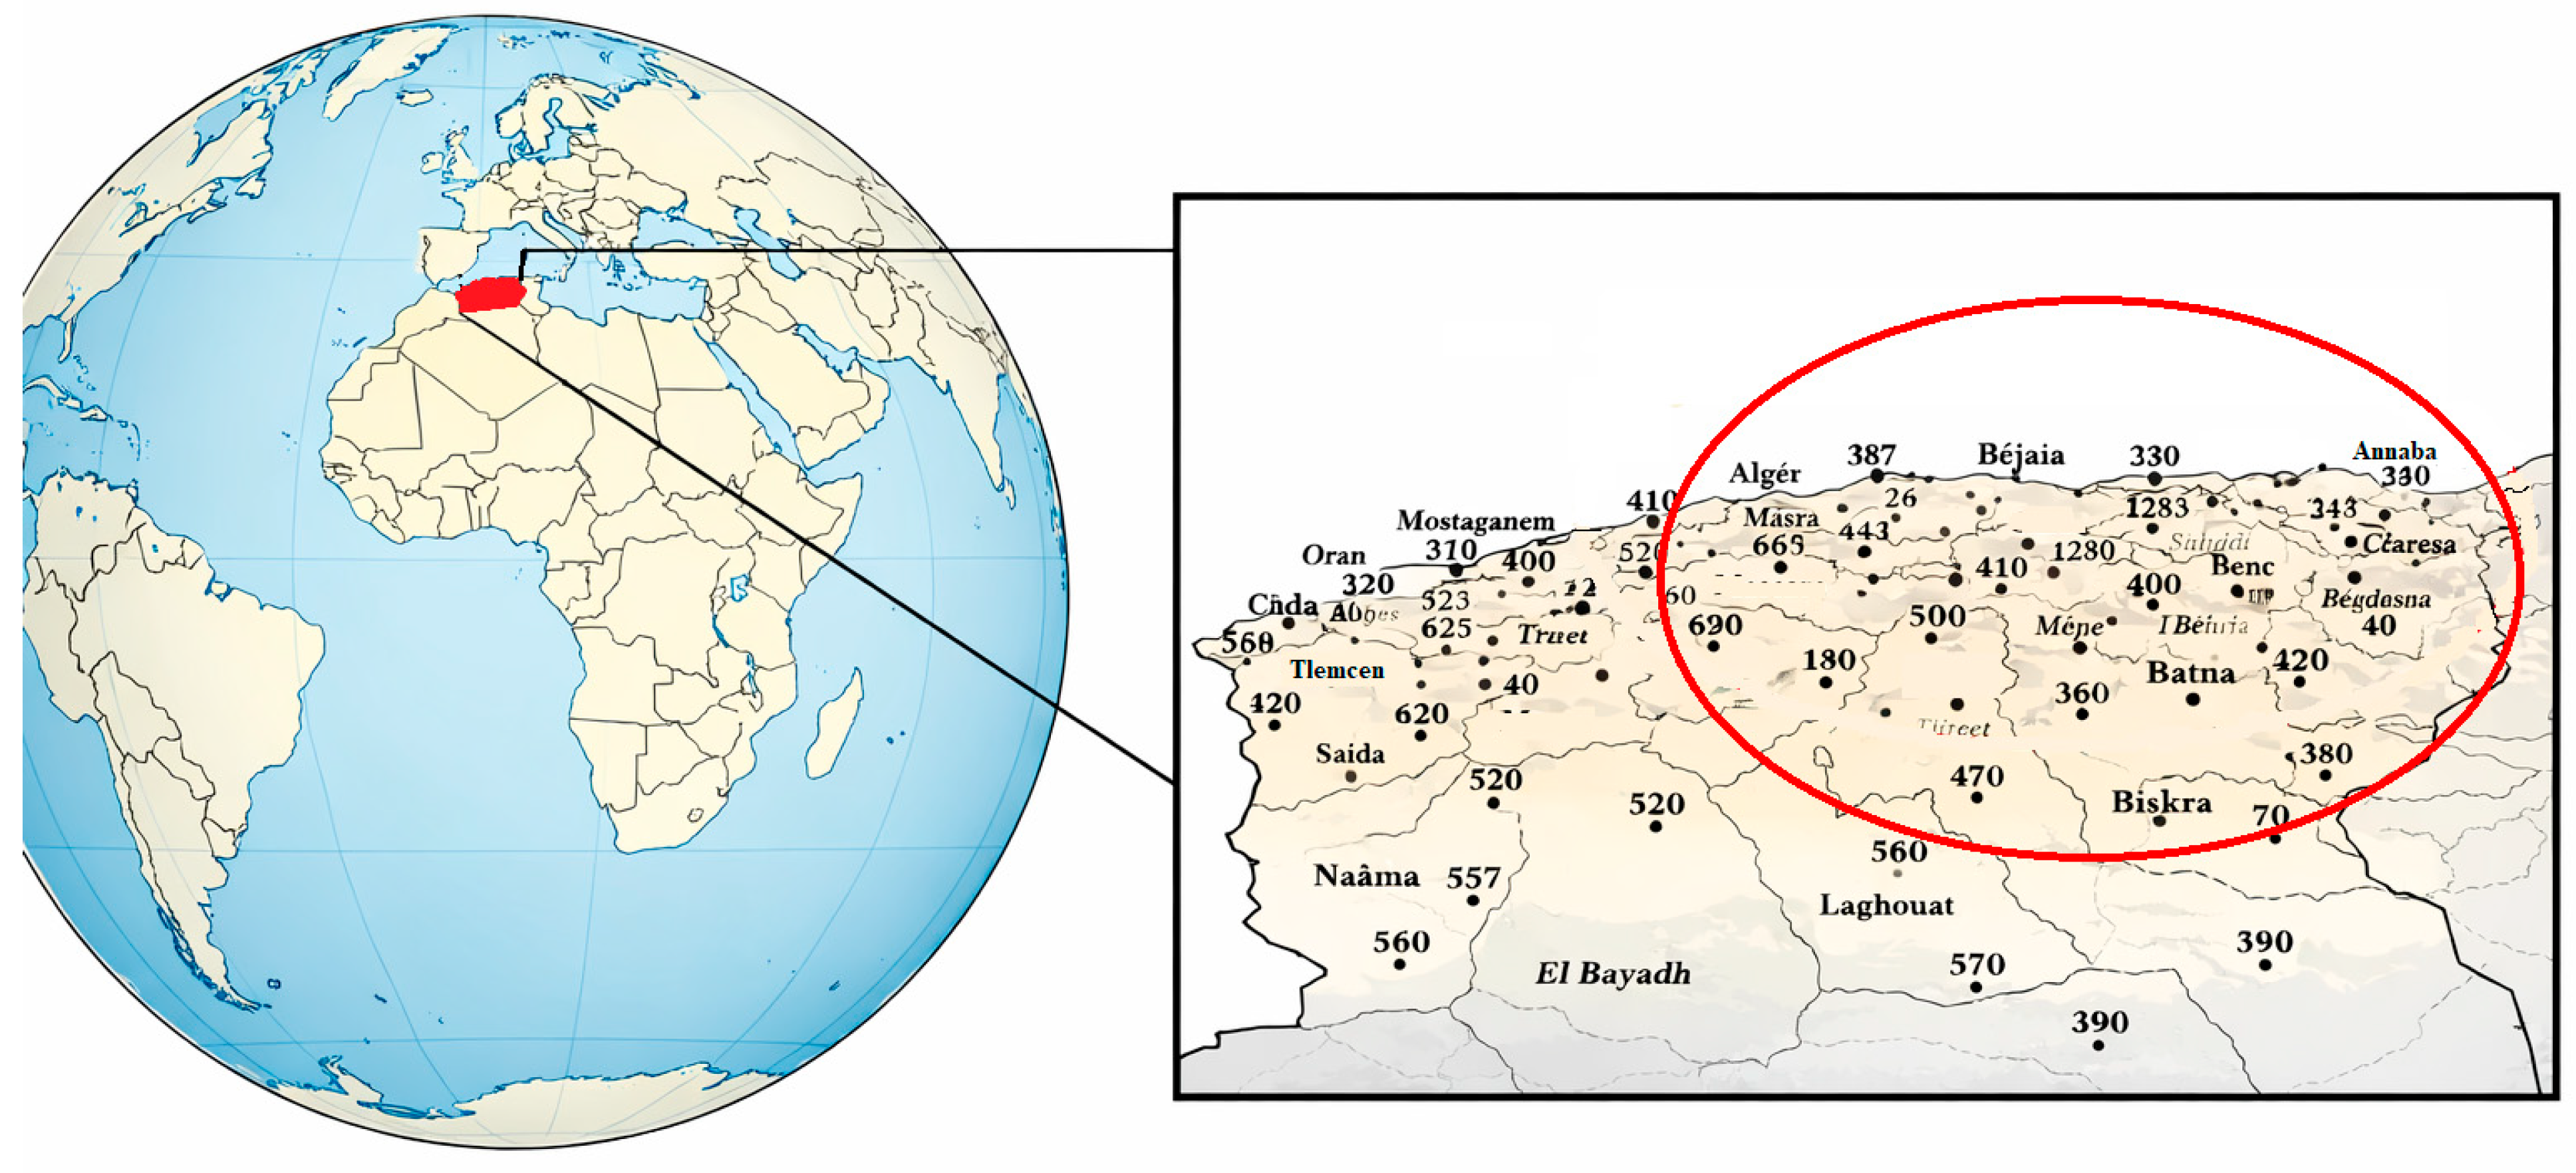
The study region is located in northern Algeria (Figure 1), a broad territory lying along the southern Mediterranean shore and distinguished by a climatic transition from subtropical circumstances in the north to scorching Saharan conditions in the south. Geographically, the territory extends between longitudes 2° W and 9° E and latitudes 32° N and 37° N, covering approximately 800 km from west to east and 400 km from north to south. It is bounded by the Mediterranean Sea to the north, Tunisia to the east, and Morocco to the west. The red circle in Figure 1 delineates the approximate coverage area of the Sétif weather radar used in this study.
Figure 1.
Study area with distribution of rain gauges and Sétif radar coverage.
From the perspective of precipitation estimation, this region is extremely difficult and of scientific interest due to both the scarcity of conventional in situ data and the substantial spatio-temporal variability of rainfall events, which makes satellite-based approaches important.
Northern Algeria has a substantial north–south precipitation gradient. Rainfall is generally more abundant in the coastal and northern mountain regions, largely impacted by Atlantic and Mediterranean weather systems, and reduces progressively toward the interior and southern sections. The climate is mainly Mediterranean, with cool and rainy winters and scorching summers, during which precipitation becomes limited or altogether absent in certain regions [25].
A distinctive element of this study area is the coexistence of two main rainfall regimes. On the one hand, a sub-Saharan regime is characterized by isolated and intense convective systems, mainly during late summer and autumn. On the other hand, a mid-altitude Mediterranean climate is characterized by stratiform systems of continuous but low-to-moderate strength, with the rainy season spanning largely from November to March [26]. This dual climatic influence creates intricate precipitation dynamics, encompassing both short-lived, high-intensity convective storms and longer-duration stratiform systems, thereby posing major challenges for reliable rainfall detection and quantitative estimation.
3. Data
Two hydrological years were selected: the 2008/2009 season for model training and calibration, and the 2009/2010 season for independent validation. Although the training period is limited to a single hydrological year (2008/2009), it encompasses a representative diversity of precipitation regimes observed across northern Algeria. These include intense convective situations, such as autumn thunderstorms associated with upper-level cold air intrusions or local thermal forcing, as well as winter stratiform precipitation linked to Atlantic or Mediterranean frontal disturbances.
Furthermore, the learning process is performed at the pixel scale rather than on aggregated large-scale atmospheric situations. Each pixel is treated as an independent sample, which effectively results in a very large training database and enhances the statistical representativeness of the model.
3.1. MSG Data
The MSG satellite enables continuous observation of the study area, giving pictures every 15 min across 12 spectral channels ranging from the visible (VIS) to the thermal infrared (IR) domains [8]. The native spatial resolution of SEVIRI images is 3 × 3 km2 at the sub-satellite point. However, because of the oblique viewing angle of the satellite over northern Algeria, the effective spatial resolution reduces to around 4 × 5 km2. Each pixel is encoded at 10-bit depth, enabling the translation of raw digital counts into brightness temperatures (Kelvin) for the infrared and water vapor channels and into reflectance values for the visible channels.
Among the 12 SEVIRI channels, eight are particularly relevant for deriving cloud optical and microphysical properties, as well as the vertical extent and thermodynamic characteristics of cloud tops: two visible channels (VIS0.6, NIR1.6), one near-infrared channel (IR3.9), two water vapor channels (WV6.2, WV7.3) and three thermal infrared channels (IR8.7, IR10.8, IR12.0).
From these channels, various spectral characteristics were obtained to define cloud features and their link to precipitation processes. These include Cloud Top Temperature (CTT), Cloud Top Height (CTH), Cloud Water Path (CWP), and Cloud Phase (CP), which have been widely recognized as essential predictors for satellite-based precipitation estimation [12,18].
The different MSG features utilized for daytime and nighttime in this study are summarized in Table 1.
Table 1.
MSG features for daytime and nighttime.
The availability and importance of various spectral channels vary dramatically between daylight and nighttime settings, principally due to the presence and intensity of solar radiation.
During daytime, the visible channels VIS0.6 and NIR1.6 are critical for extracting information on cloud optical thickness and effective particle radius, which are key inputs for the computation of the Cloud Water Path (CWP).
At night, the visible channels (VIS0.6 and NIR1.6) are no longer available. Instead, changes in brightness temperature such as ΔT3.9–10.8 and ΔT3.9–7.3 are utilized to infer information on the CWP and cloud microphysical features [27,28]. These multispectral differences have been frequently exploited to discern between water and ice cloud phases, as well as to characterize cloud particle size distributions.
In addition to spectral features, temporal features were also explored. The temporal difference in brightness temperature from the IR10.8 channel (ΔIR10.8) provides useful insights into the life cycle of clouds, notably addressing their growth and dissipation stages [14]. Such temporal changes are critical for correlating cloud dynamics with precipitation incidence and severity.
3.2. Setif Radar Data
Radar data from the C-band weather radar (AWSR-81, 5.6 GHz, 250 kW) located at Sétif is used as reference data for classification. It produces 15 min plan position indicator (PPI) data with 1 km resolution (512 × 512 pixels, 4 bits per pixel for reflectivity data).
Following established investigations in Algeria [18], a threshold of 42 dBZ is used to separate convective (Z > 42 dBZ) from stratiform (4 dBZ < Z ≤ 42 dBZ) precipitation, with Z ≤ 4 dBZ indicating no rain.
Although weather radar provides high-resolution rainfall measurements, C-band radar is subject to several sources of uncertainty, including attenuation in heavy rainfall, partial beam blockage by orography, bright band effects in stratiform precipitation, ground clutter, and variability in drop size distribution. Under typical operating conditions, reflectivity uncertainty ranges between ±1 and ±2 dBZ [16,17,29].
In this study, radar data are used for precipitation regime classification (no-rain, stratiform, convective) rather than for rainfall calibration. The regression step relies exclusively on rain gauge accumulations, thereby limiting the impact of radar-related biases on quantitative estimates. Moreover, since the largest uncertainties mainly affect intense convective rainfall, they rarely alter the regime classification itself.
3.3. Rain Gauge Network
The reference data for the regression and rainfall estimation stage were gathered from a dense network of 146 rain gauges distributed across the study area. These data and coordinates of each rain gauge are provided by the National Meteorological Office (ONM). These ground-based equipment provide direct and very accurate measurements of precipitation amounts, making them crucial for both the calibration and validation of satellite-derived rainfall products [6].
3.4. Data Colocation
To effectively integrate and compare the heterogeneous data from satellite, radar, and rain gauges, rigorous spatiotemporal pre-processing steps were implemented.
To ensure a physically consistent aggregation for precipitation regime classification, the radar reflectivity values are first converted from the logarithmic unit (dBZ) to the linear reflectivity unit (Z) [30]. Spatial averaging is then performed over 3 × 3 or 5 × 5 pixel regions, after which the values are converted back to the logarithmic unit (dBZ) for subsequent analysis. Using the linear unit for averaging avoids systematic biases that would arise if averaging were performed directly in dBZ.
Sensitivity tests indicate that the maximum aggregation method, often used to estimate the intensity and spatial extent of convective cores, tends to overestimate values, whereas linear averaging provides more reliable and representative results, consistent with the spatial resolution of MSG imagery.
Since the temporal offset between MSG and radar data is usually not more than 3 min, which is negligible compared to the typical timescales of precipitating cloud systems, no further temporal interpolation was needed for instantaneous analysis.
The matching of point measurements from rain gauges with satellite data is carried out using the rain gauges’ precise geographic coordinates to associate them with the corresponding MSG pixels. To minimize localization errors and maximize correspondence, the satellite pixel value is obtained by calculating the average of a 5 × 5 pixel window centered above the rain gauge for all MSG channels. This spatial averaging accounts for the representativeness mismatch between point-scale rain gauge measurements and pixel-scale satellite observations, while remaining consistent with the effective spatial resolution of MSG-SEVIRI data.
However, for comparisons with rain gauge measurements, the rain gauge data are accumulated over defined periods (day, night, monthly, or seasonal). These accumulations are then compared to the average of the MSG satellite observations collected during the same periods. Since MSG provides one image every 15 min, each 3 h interval includes 12 MSG acquisitions and each 24 h interval includes 96 acquisitions. This approach helps to reduce the error inherent in the temporal shift between a point measurement on the ground and an instantaneous satellite observation.
4. Methodology
In this study, we propose a hybrid machine learning framework for satellite-based precipitation estimation over northern Algeria using data from the Meteosat Second Generation (MSG) SEVIRI instrument operated by the European Organisation for the Exploitation of Meteorological Satellites (EUMETSAT, Darmstadt, Germany). The proposed methodology consists of two complementary modeling stages:
- -
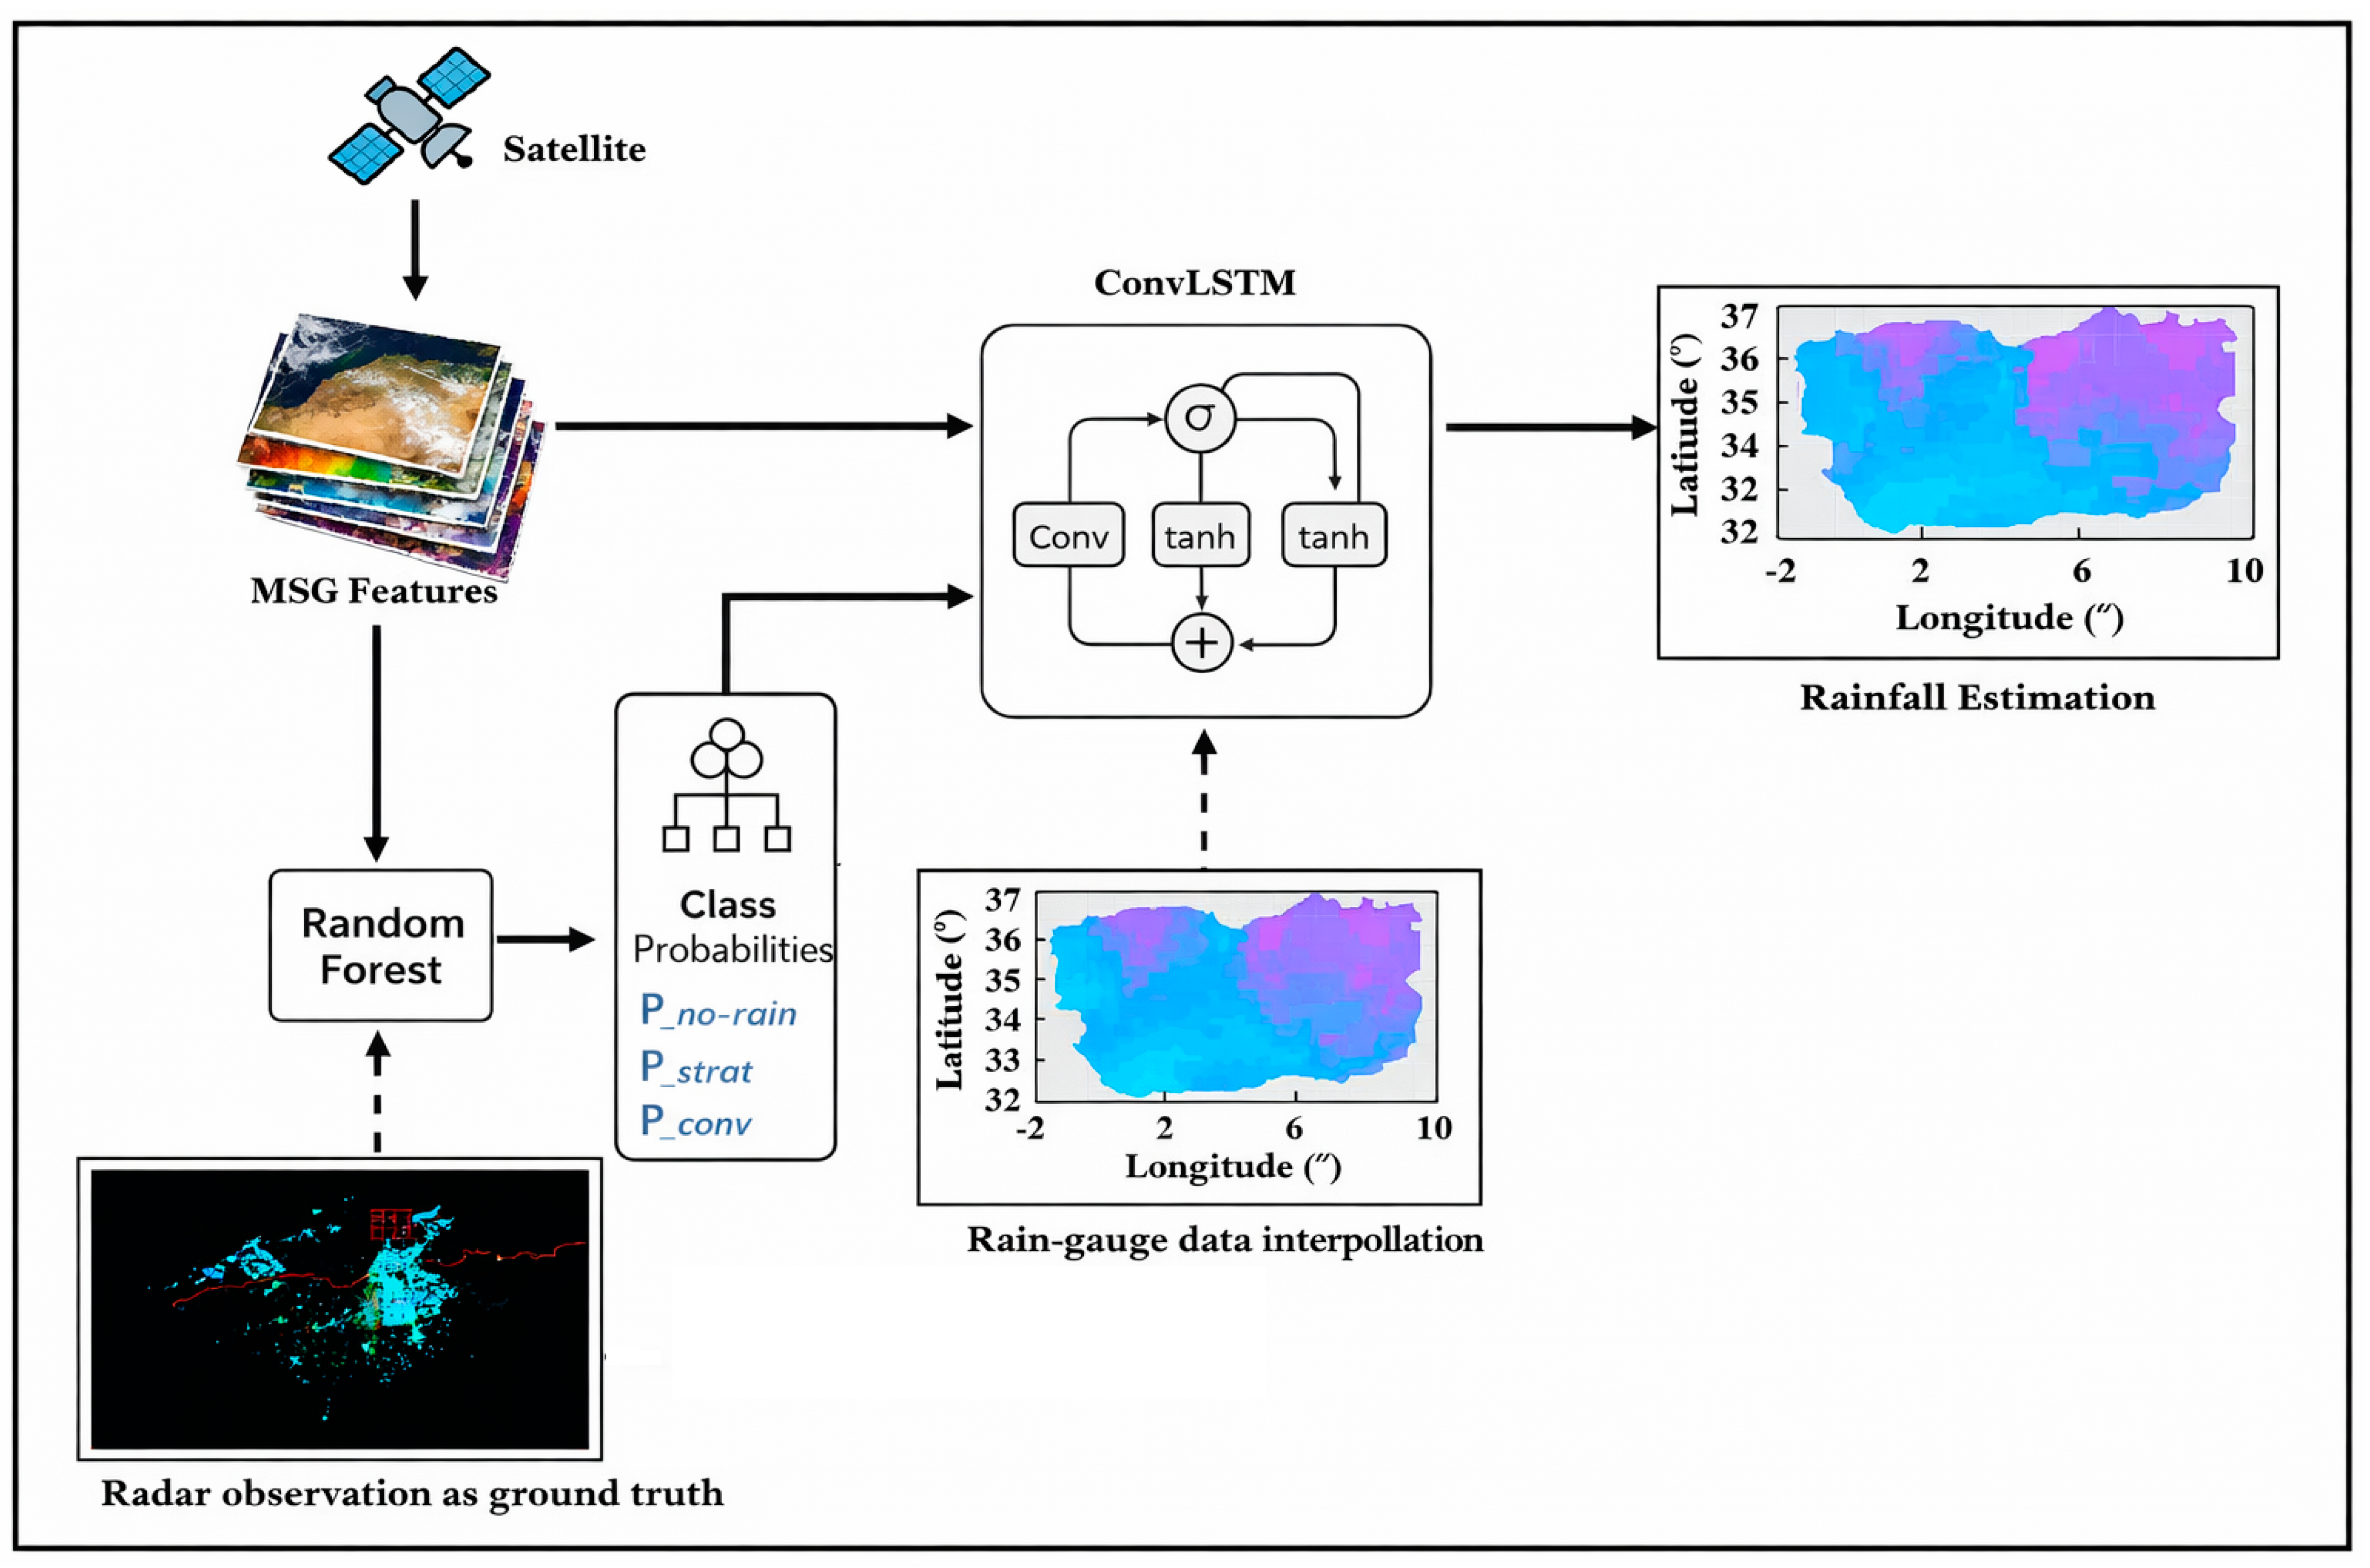
- A Random Forest (RF) classifier identifies precipitation regimes (no rain, stratiform, convective) using labels from the Sétif weather radar. The resulting posterior class probabilities are used as auxiliary inputs to the ConvLSTM regression model.
- -
- Convolutional Long Short-Term Memory (ConvLSTM) for quantitative precipitation estimation, with the posterior class probabilities from the RF classifier as continuous auxiliary input channels in addition to MSG spectral and temporal features. The regression is calibrated using rain gauge observations for 3 h and 24 h accumulations.
To enhance the robustness of the ConvLSTM training process and to explicitly account for uncertainties in precipitation occurrence, pixels were treated in a differentiated manner based on the posterior no-rain probabilities provided by the Random Forest classifier, in conjunction with rain gauge observations:
- -
- Pixels with high probability of no rain (P(no-rain) ≥ 0.9) and zero-gauge rainfall were not included in the training data.
- -
- Pixels with intermediate probability values (0.5 < P(no-rain) < 0.9) were included using a probability-weighted scheme based on the Random Forest (RF) model.
- -
- Pixels with low probability of no rain (P(no-rain) ≤ 0.5) were completely included, as they mostly represented rainfall events.
Figure 2 shows a flowchart illustrating the overall process.
Figure 2.
Schematic diagram of the hybrid method coverage.
4.1. Precipitation Event Classification Using Random Forest
The Random Forest model (RF) [19] is employed for probabilistic classification of precipitation regimes identified as no rain, stratiform rain, and convective rain. The classification features are spectral and temporal features derived from the SEVIRI instrument. The posterior probabilities are used directly as continuous inputs to the ConvLSTM stage.
The RF model was configured with the following hyperparameters, which were carefully empirically selected through an iterative tuning step to optimize its performance for precipitation classification:
- -
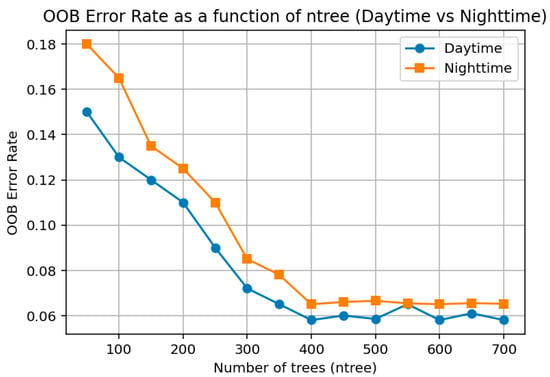
- Number of trees (ntree): This parameter was determined by analyzing the Out-Of-Bag (OOB) error curve. The Out-Of-Bag (OOB) error, evaluated on one-third of the bootstrap samples excluded from the training process, is given by the following:
The OOB error stabilized when the number of trees exceeded approximately 400 (see Figure 3).
Figure 3.
Effect of number of trees (ntree) on OOB error.
- -
- Number of features per split (max_features or mtry): Optimized to 5. With ntree fixed at 400, mtry was varied from 1 to 12 and the Out-Of-Bag (OOB) classification error was evaluated. The value of 5 produced the lowest OOB misclassification rate under both daytime and nighttime conditions.
- -
- Maximum depth (max_depth): Left unlimited. This configuration allows trees to grow until maximum leaf purity is achieved. Regularization is implicitly ensured by the split criterion and the random feature sampling mechanism, thus helping to prevent overfitting.
- -
- Split criterion: The Gini index was used as the split criterion.
Besides the discrete classification result obtained by majority voting, the Random Forest classifier provides the posterior probabilities of each pixel/step for the three rainfall types analyzed throughout the study: no rainfall, stratiform rainfall, and convective rainfall. These values are proportionate to the number of trees supporting each class. The class with the greatest value corresponds to the evaluation of the final classification. However, in the new hybrid approach, the complete probabilistic result of the RF classifier is used as part of the solution. Specifically, the three values are used as continuous auxiliary variables to the ConvLSTM regression model, together with the spectral and temporal variables of MSG-SEVIRI.
This allows the regression stage to incorporate the precipitation regimes explicitly rather than simply separating rainy pixels categorically. The probabilities obtained from the RF serve as a soft conditioning method that conveys information to the ConvLSTM layer about the likely rainfall type and uncertainty level, providing physically realistic estimates of precipitation over space and time.
4.2. Precipitation Accumulation Regression Using ConvLSTM
The ConvLSTM [21] is an extension of the traditional Long Short-Term Memory (LSTM) architecture [31], which introduces convolutional layers to improve the model’s capacity in dealing with the limitations of the traditional LSTM model in handling gridded data such as satellite images. The model is able to concurrently handle the spatial features of the data, such as the texture and shape of the clouds, and the temporal features of the data, such as the evolution of the system, without losing long-term memory. Therefore, the ConvLSTM model is suitable in the estimation of 3 and 24 h precipitation accumulations in the region of northern Algeria.
Our network architecture consists of two stacked ConvLSTM layers, which allows the model to learn increasingly abstract spatio-temporal feature hierarchies. The first layer captures low-level features, while the second processes them to identify more complex patterns. The core mechanism of a ConvLSTM unit at time t is governed by a series of convolutional operations on the input feature map xt and the previous hidden state ht−1. The internal logic, which allows for modeling temporal dependencies while preserving spatial structure, relies on a system of gates and a cell state.
The ConvLSTM architecture follows the formulation introduced by Shi et al. [21].
Model training was performed by minimizing the mean square error (MSE) loss function, while performance evaluation relied on the correlation coefficient (R) and root mean square error (RMSE).
The sensitivity analysis revealed that model skill was primarily influenced by two hyperparameters: the number of filters and the kernel size. These parameters were therefore subjected to detailed evaluation, while others (dropout, batch size, optimizer settings) were adjusted following standard practices in deep learning for spatio-temporal modeling.
The number of filters directly controls the model’s capacity to extract spatial features. As shown in Table 2, increasing the number of filters from 32 to 64 improved RMSE and correlation. However, a further increase to 128 introduced overfitting without significant accuracy gains. The optimal configuration retained 64 filters in the first ConvLSTM layer and 32 in the second, balancing expressiveness and computational cost.
Table 2.
Sensitivity of ConvLSTM performance to the number of filters.
The kernel size defines the receptive field of convolutional operations. A kernel size of 3 × 3 was found optimal, as larger kernels (5 × 5) excessively smoothed convective structures, whereas smaller ones (1 × 1) failed to capture mesoscale organization (see Table 3).
Table 3.
Sensitivity of ConvLSTM performance to the kernel size.
To enhance generalization, dropout (0.3) and batch normalization were applied after each ConvLSTM layer. A dense regression layer with linear activation produced the final precipitation estimates in millimeters. Training employed the Adam optimizer (initial learning rate = 0.001) with a scheduler reducing the rate by a factor of 0.5 after five stagnant epochs. The Mean Squared Error (MSE) was used as the loss function, directly aligned with the RMSE evaluation metric. Early stopping (patience = 10 epochs) prevented overfitting, while L2 regularization (10−4) further stabilized training. The batch size of 32 ensured efficient memory usage and gradient stability.
5. Results
5.1. Performance of the Precipitation Regime Classification
To provide a robust evaluation of the proposed classification approach, the Random Forest (RF) model was compared with two commonly used machine learning classifiers in satellite precipitation studies: Artificial Neural Networks (ANN) and Support Vector Machines (SVMs) [17,32]. Each classification system was tested with the same set of input variables outlined in Section 3, for both day and night scenarios. This will guarantee that any disparity in system performance is not caused by any difference in the data used but rather by the inherent strengths and limitations of each classification system.
The design and implementation of the ANN classifier used a conventional feed-forward multilayer perceptron neural network with a single hidden layer. The input layer took in the same set of MSG SEVIRI spectral and temporal features used in the RF classifier to ensure model homogeneity. Non-linear activation functions were used in the hidden layer and softmax activation functions in the output layer to provide posterior probabilities corresponding to the three classes of precipitation: no rain, stratiform rain, and convective rain. Training was done using the cross-entropy loss function with regularization and early stopping to prevent overfitting.
The SVM classifier was set up with a radial basis function (RBF) kernel, which is particularly efficient in modeling the non-linear boundaries of classes in a high-dimensional space of features. Similar to the ANN and RF classifiers, the SVM was also fed only the MSG-SEVIRI spectral and temporal features for the nighttime and daytime scenarios. The multi-class classification task was handled by the SVM using the one-versus-one approach, and the model parameters were tuned using cross-validation on the training set.
5.1.1. Qualitative Assessment
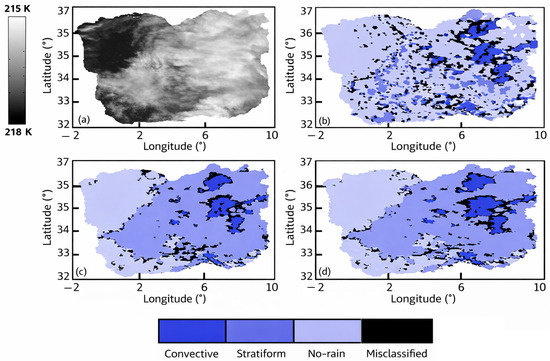
The performance of three classification methods, Random Forest (RF), Support Vector Machine (SVM), and Artificial Neural Network (ANN), was evaluated for rainfall events occurring on 9 January 2010 at 09:00. The result of the classification performed by the three methods is shown in Figure 4.
Figure 4.
Classification results, (a) original IR10.8 image, (b) classification using ANN, (c) classification using SVM, (d) classification using RF.
It can be seen that the performance of the RF method was significantly better than SVM and ANN for both convective and stratiform precipitation types. Indeed, the pixels misclassified by SVM and ANN in Figure 4c,d were largely converted into their correct categories by the RF method.
5.1.2. Quantitative Evaluation
A variety of statistical parameters calculated from confusion matrices have been used to allow for a detailed evaluation of the performance of the classifiers. The overall accuracy (OA) has been calculated for the three precipitation types and presented separately for daytime and nighttime. Moreover, event verification parameters were also used. The Probability of Detection (POD) was calculated separately for convective and stratiform precipitation, using a one-against-all approach. The False Alarm Ratio (FAR) and Critical Success Index (CSI) are calculated from a binary matrix.
For a particular class, the true positive (TP), false positive (FP), false negative (FN), and true negative (TN) instances are described. These measures can be written as follows:
OA = (TP + TN)/(TP + FP + FN + TN)
POD, computed separately for convective and stratiform precipitation, is expressed by the following:
POD = TP/(TP + FN)
The FAR is described as follows:
FAR = FP/(TP + FP)
Finally, CSI is now expressed as follows:
CSI = TP/(TP + FP + FN)
Combined, these indicators allow a well-rounded and comprehensive assessment of classification quality instead of relying on a single criterion of overall accuracy and are effective in analyzing precipitation using satellite data in regions of large rainfall variability.
The overall statistical results by applying the different techniques are shown in Table 4.
Table 4.
Comparison of classification performance between RF, ANN, and SVM for daytime and nighttime conditions.
As evident in Table 4, it is clear that RF performs better than both competitors for all metrics, irrespective of day and night. Although SVM performs slightly better than ANN for a few parameters (convective recall and POD), it is always inferior to RF, which offers a better compromise between detection skills and alarms.
The RF classifier performs best in terms of overall accuracy (0.96 for day and 0.95 for night) compared with ANN (0.91 day, 0.89 night) and SVM (0.90 day, 0.88 night). Furthermore, it performs better in terms of class balance and robustness with respect to the three types of rainfall. The recall value for convective systems (0.84 day, 0.82 night) and stratiform systems (0.76 day, 0.80 night) is considerably higher for RF, which tends to avoid missing occurrences of rainfall, whereas precision sustains a low rate of false alarms.
These results are confirmed by binary verification scores, Probability of Detection (POD = 0.86 day, 0.84 night), False Alarm Ratio (FAR = 0.19 day, 0.21 night), and Critical Success Index (CSI = 0.78 day, 0.77 night), which are all higher than those yielded by ANN and SVM.
5.2. Precipitation Estimation Performance
Regarding precipitation estimation, we compared the performance between RF regression and ConvLSTM regression (hybrid) models on raining pixels.
The process of assessment is divided into two phases. In the first phase, the comparison between the 3 h and 24 h rainfall estimates obtained from the RF-RF baseline method and the RF-ConvLSTM hybrid model is performed. This is done by visual assessment of the estimates.
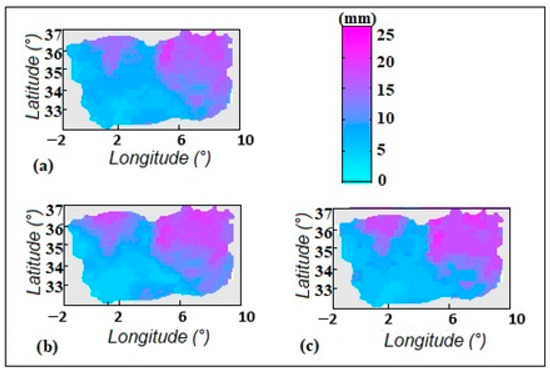
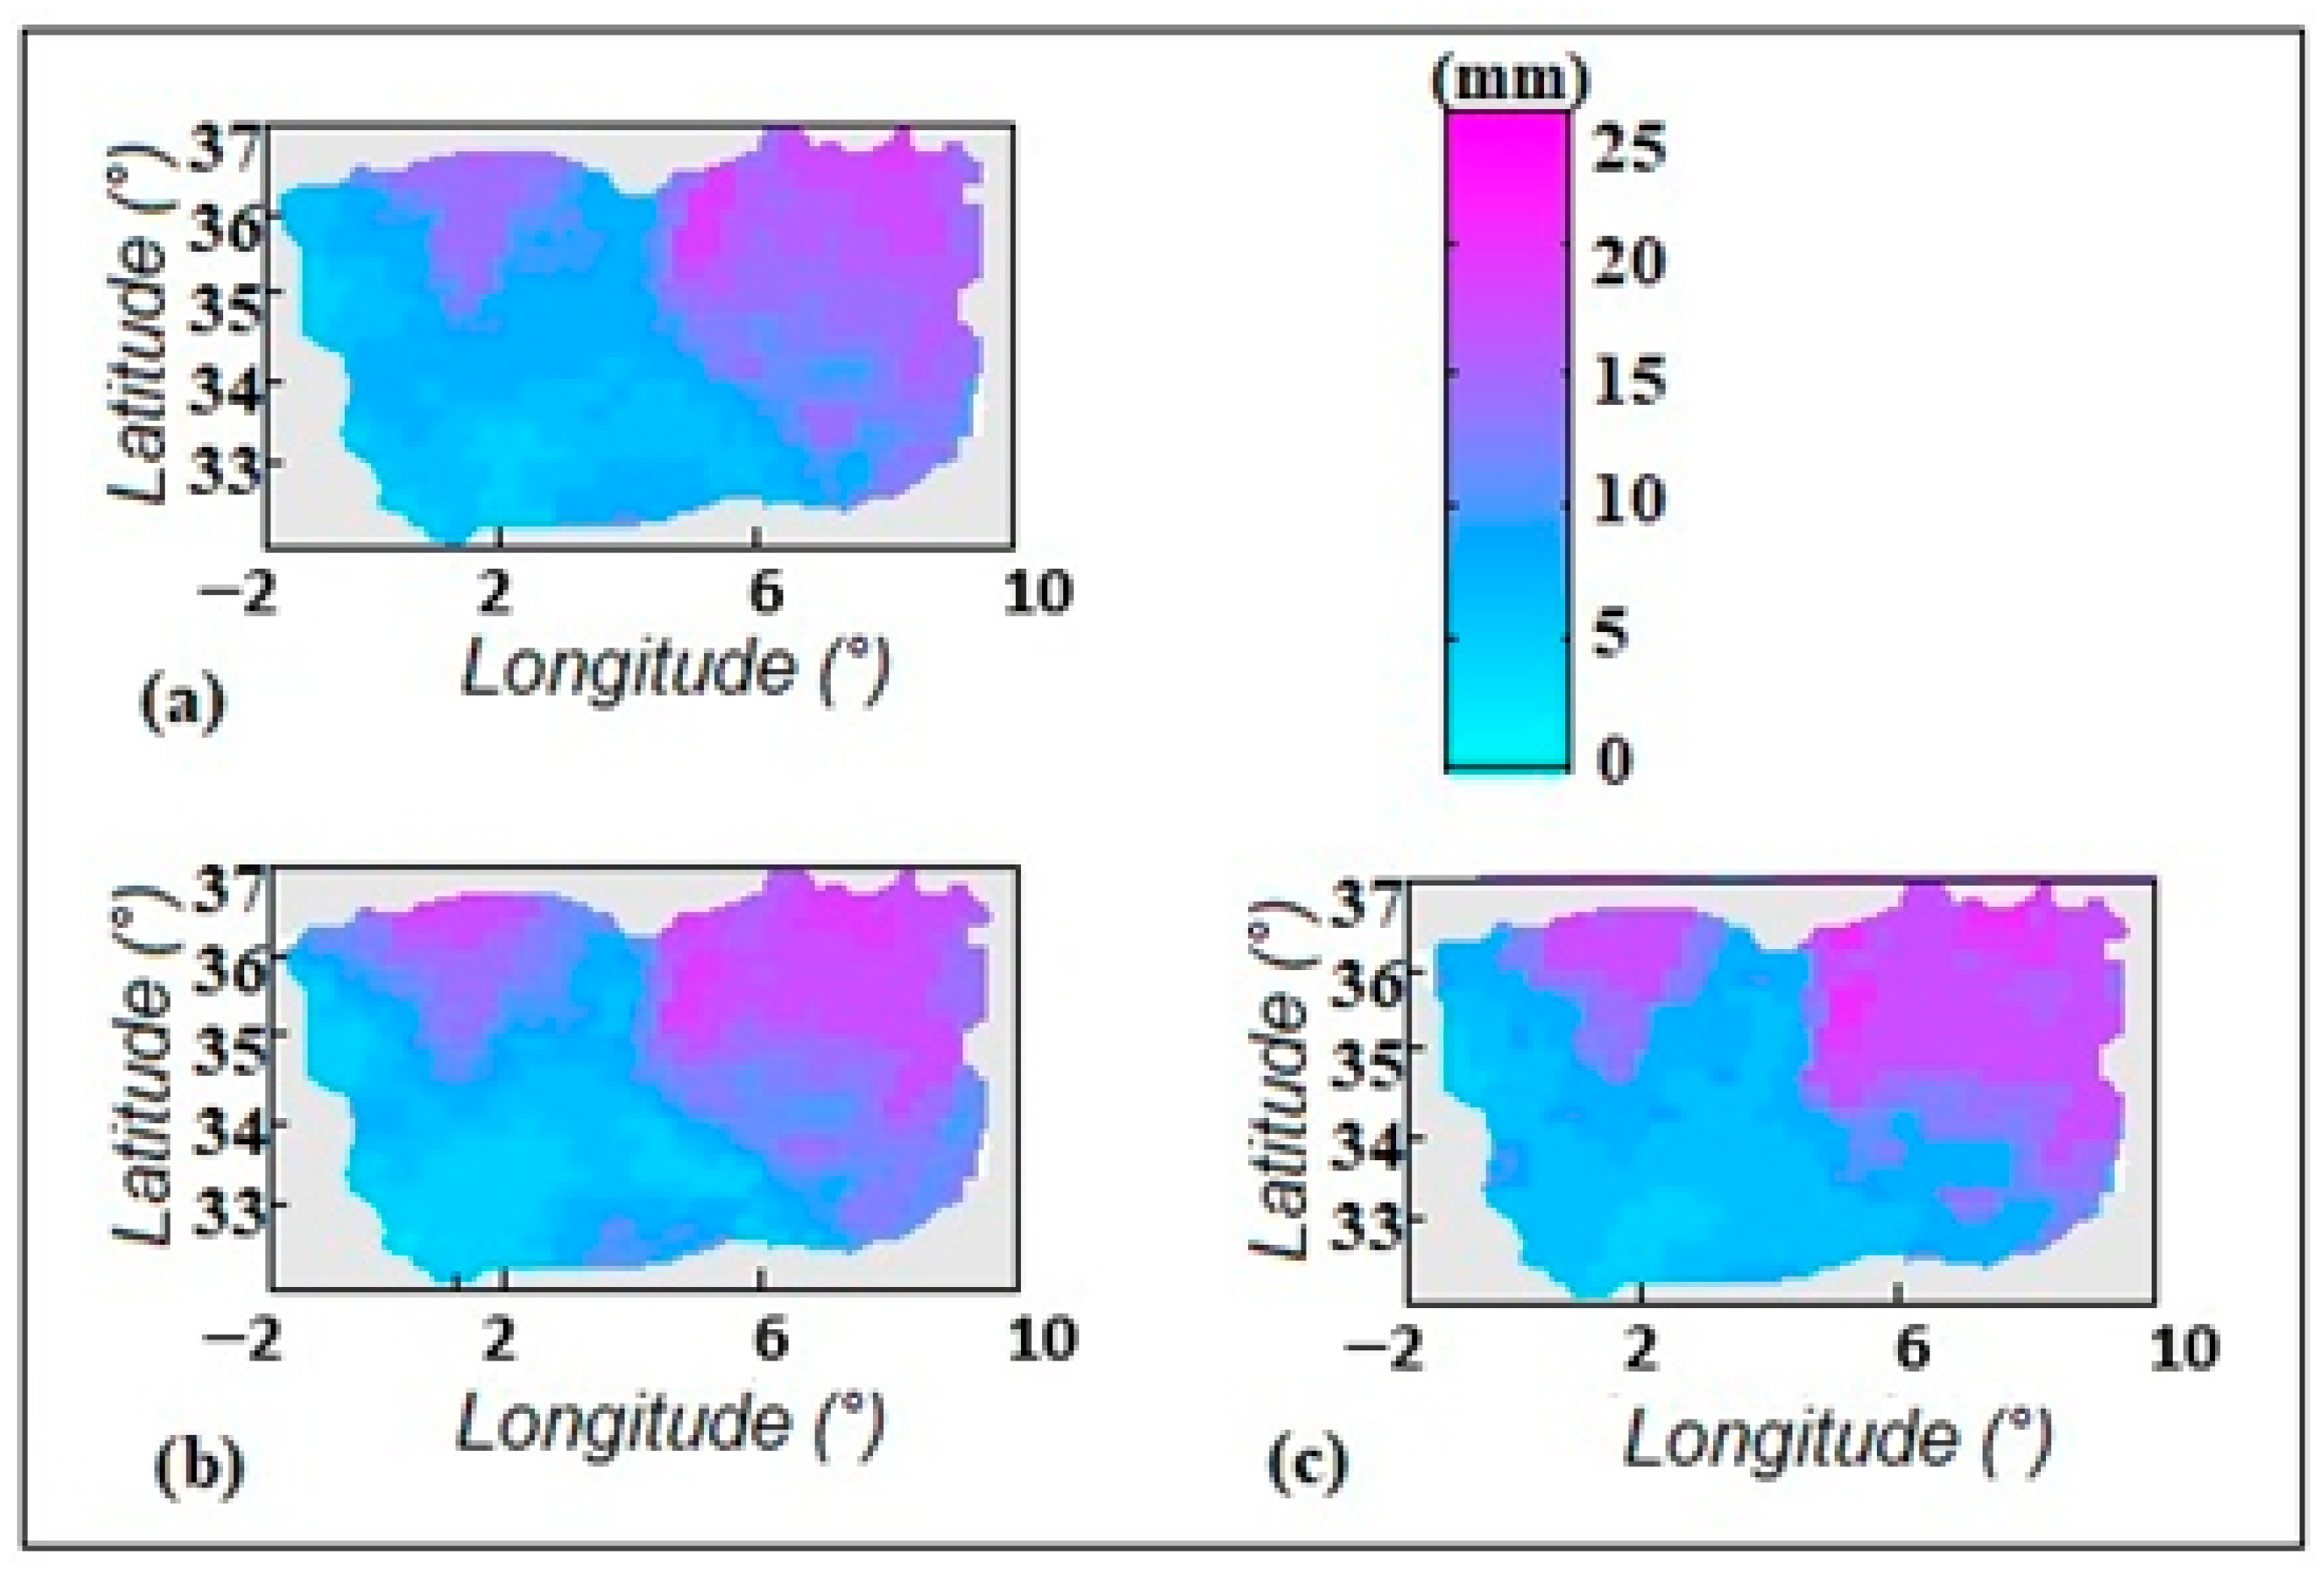
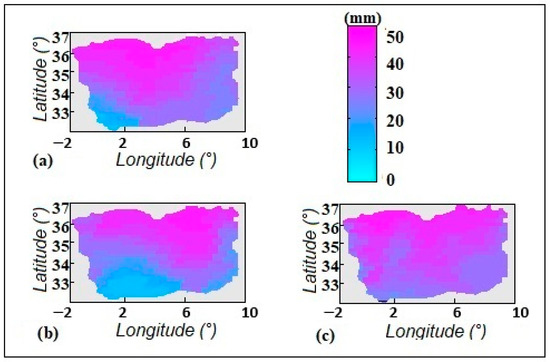
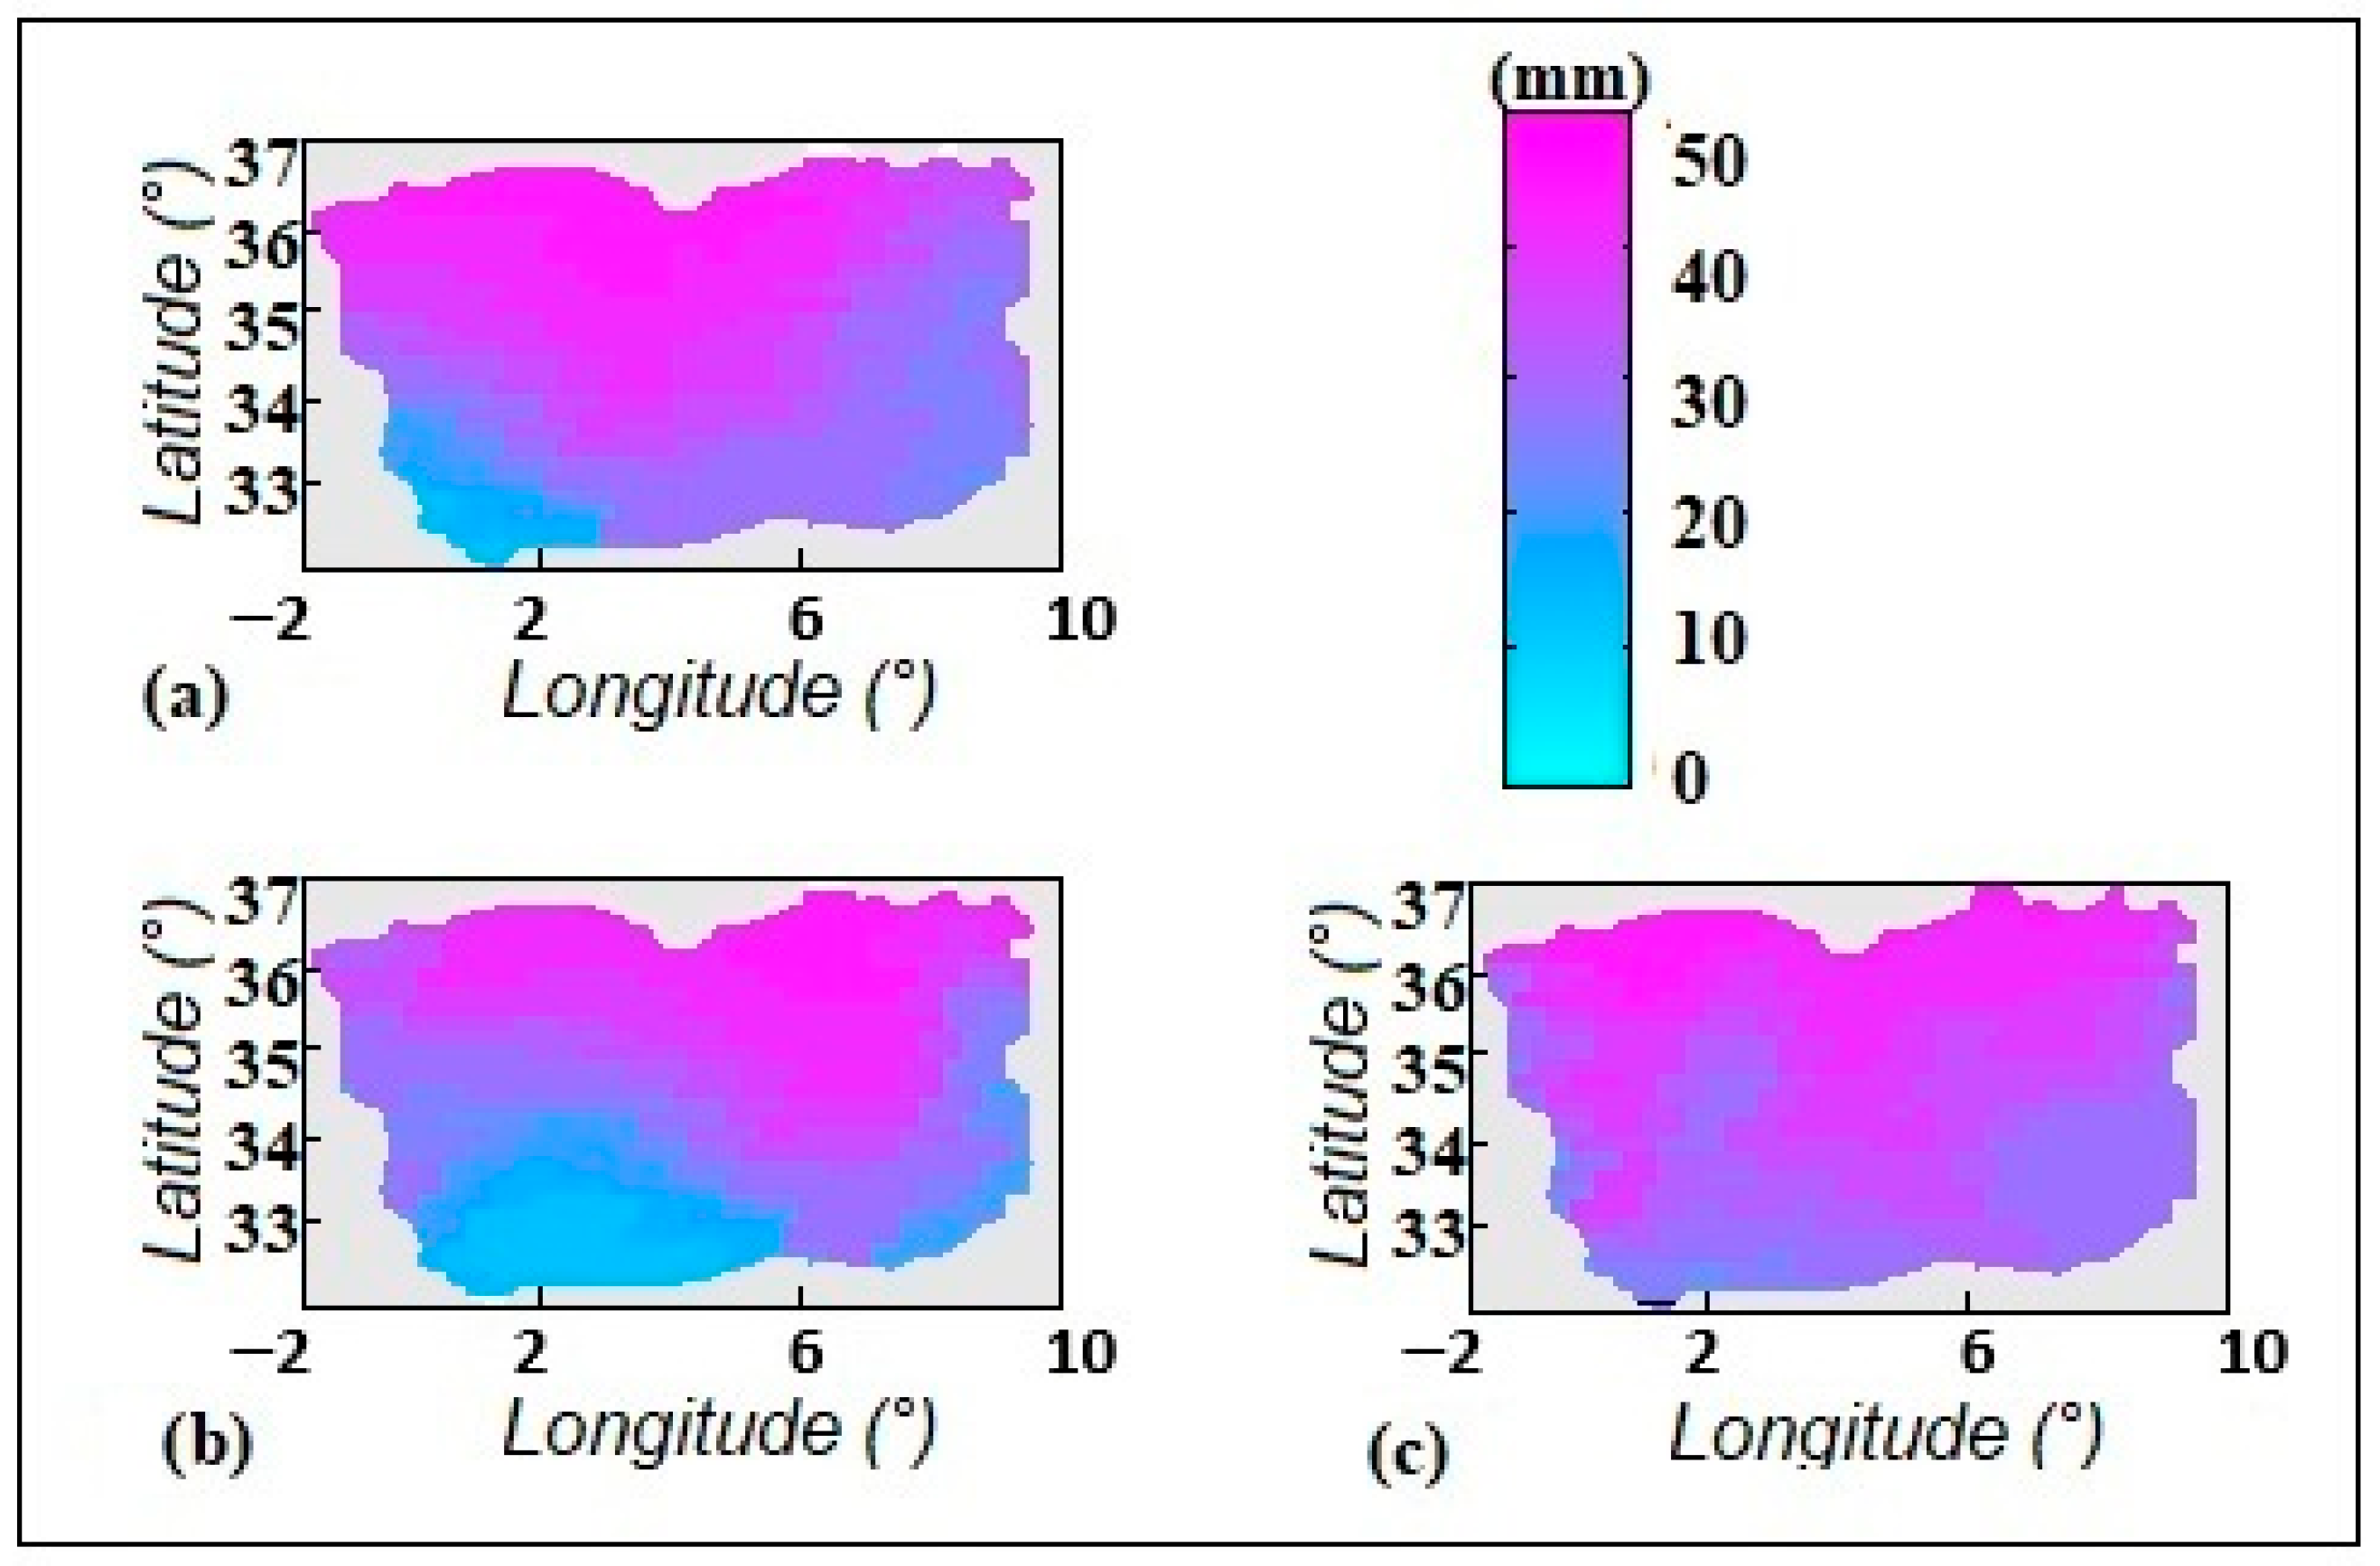
In order to obtain the rainfall field on a satellite pixel basis from an irregularly spaced rainfall gauge network, the rainfall data at the gauge locations were interpolated by an inverse-distance-weighting scheme. In this scheme, the precipitation value at each satellite pixel is determined by a weighted average of the rainfall measurements at the nearby rainfall gauges, with the weights being inversely proportional to the distances to the gauges, as in the inverse-distance-weighting scheme. This scheme has been in wide use in hydrology to interpolate rainfall data to derive a rainfall field with spatial continuity [32,33,34]. The results of this interpolation are shown in Figure 5a and Figure 6a. This approach allows the estimation of rainfall data in the ungauged area, facilitating a more accurate comparison with the model-derived estimates.
Figure 5.
Spatial estimation of 3 h precipitation (mm) over the study area using (a) rain-gauge data interpolation, (b) the RF–ConvLSTM technique, and (c) the RF–RF technique.
Figure 6.
Spatial estimation of 24 h precipitation (mm) over the study area using (a) rain-gauge data interpolation, (b) the RF–ConvLSTM technique, and (c) the RF–RF technique.
The RF–ConvLSTM results, shown in Figure 5b and Figure 6b, exhibit rainfall patterns that are visually realistic. It can be observed that, compared to the RF–RF baseline approach (Figure 5c and Figure 6c), the estimates produced by the developed RF–ConvLSTM technique are visually closer to the measurements recorded by the rain gauges.
To support and quantify these observations, we also performed an objective evaluation of the developed technique and employed these following evaluation criteria for regression:
- -
- Root mean square error (RMSE), which facilitates estimation of the average difference between actual and predicted observations.
- -
- The Pearson correlation coefficient (R) used to determine the linear association between actual and predicted values.
- -
- Mean Absolute Error (MAE), which gives you information about how far apart on average each point is.
The following is Table 5, illustrating how both approaches (RF-RF and RF-ConvLSTM) performed in estimating precipitation for 3 and 24 h.
Table 5.
Performance comparison of rainfall estimation methods at different accumulation periods.
The results in Table 5 clearly demonstrate the superiority of the proposed RF-ConvLSTM model over the conventional RF-RF model for all accumulation periods.
The proposed RF-ConvLSTM model is much better than the RF-RF model for 3 h forecasting. The value of RMSE significantly reduces (reduces from 3.5 mm to 2.1 mm for day and 4.1 mm to 2.5 mm for night), while the amount of correlation value (R) greatly increases to 0.89 for day. This improvement is much more significant for night forecasting, where only infrared information is available. Of course, this improvement is due to ConvLSTM’s ability to model clouds’ dynamic behaviors to compensate for loss of textural information in visible channels.
The effectiveness of the proposed RF-ConvLSTM model is much more significant for 24 h forecasting, where amount of correlation reaches the highest value 0.91. The value of RMSE substantially lowers (lowers down from 7.9 mm to 5.4 mm), and the value of the correlation coefficient increases (increases from 0.84 to 0.91). Such an enormous difference in performance is a clear manifestation of ConvLSTM’s ability to model long-term dependencies, which is impossible for the static RF-RF model. The proposed RF-ConvLSTM technique outperforms the RF-RF model due to its inherent ability to model space–time behaviors of precipitation systems, which is not true for the RF-RF model. Indeed, the RF model treats each time step and each spatial index separately.
6. Discussion
The results obtained in this study validate the potential of the proposed hybrid approach, which combines a Random Forest (RF) classifier with a ConvLSTM regression model to estimate precipitation using satellite images over northern Algeria. This framework integrates probabilistic precipitation classification with spatio-temporal rainfall estimation, capturing both local and temporal dependencies in precipitation patterns.
In the interpretation of the classification results, the outperformance of the RF model can be explained by the ensemble learning paradigm that it follows. This results in the reduction in variance and the avoidance of overfitting, thereby making the RF model more robust than the Artificial Neural Network (ANN) and Support Vector Machine (SVM) models. Its ability to deal with high-dimensional and noisy MSG-SEVIRI feature spaces makes it more effective in the discrimination between convective and stratiform precipitation regimes.
These findings are consistent with previous studies highlighting the robustness of ensemble learning methods for environmental prediction problems, including the classification of the probability of precipitation, as the Random Forest model has already demonstrated good performance in solving problems of precipitation classification due to its ability to deal with non-linear relationships and complex multispectral satellite feature spaces [21,35].
The improvement observed in the results for 3 h rainfall accumulations indicates the contribution of the inclusion of spatio-temporal memory in the estimation process. Unlike the RF-RF baseline, where the process is performed independently for individual time steps, the inclusion of the ConvLSTM component in the model accounts for the reduction in the root mean square error (RMSE) and the increase in correlation coefficients for both daytime and nighttime conditions.
Like the 3 h rainfall accumulation results, the enhancement that is seen in the daily accumulation results is an indication of the contribution that is made by the inclusion of long-term temporal dependencies in the estimation process. This is because the ConvLSTM approach is able to retain information over long time scales using the memory gates in the model, thus enabling the consideration of cloud formation, propagation, and dissipation stages. This is particularly important for the 24 h accumulation results, where static regression models do not account for the cumulative atmospheric effects.
These results are consistent with recent studies demonstrating that deep learning architectures designed for spatio-temporal modeling, such as ConvLSTM networks, are particularly effective in representing the temporal evolution of precipitation systems derived from satellite observations [21,24,36].
Another important feature of the proposed hybrid model is its capacity to maintain spatial coherence through convolutional operations. This is particularly relevant in Mediterranean environments such as northern Algeria, where precipitation systems often exhibit strong spatial gradients and rapid temporal evolution.
7. Summary and Conclusions
This work offers a novel tool for satellite precipitation estimation over Northern Algeria through the use of Random Forest classification in combination with the ConvLSTM spatio-temporal regression model, based on multispectral data from the MSG SEVIRI satellite sensor. This approach can solve several long-standing issues in satellite precipitation estimation, existing in Mediterranean and semi-arid regions, in which precipitation patterns are characterized by the presence of rapidly developing convective systems, as well as longer-term stratiform systems, along with the lack of terrestrial observation networks.
The first novelty of this study arises from the establishment of a reliable classification scheme that can distinguish between non-rainy, stratiform, and convective conditions based on the spectral and temporal characteristics available in SEVIRI imagery. The Random Forest model was significantly superior to classic machine learning algorithms like ANN and SVM in terms of accuracy, performing close to 96% in daylight hours and 95% accuracy at night. The most important aspect here is the potential of the model to correctly distinguish between convective systems, which shape the hydrologic extremes in the Mediterranean region, while maintaining a low False Alarm Ratio. This clearly emphasizes the strength of ensemble learning in the context of diverse, high-dimensional satellite datasets.
The second key result pertains to the utilization of the ConvLSTM as a regression model in exploiting the inherent spatio-temporal structure of the cloud systems. In particular, the ConvLSTM model simulates the cooling process, vertical development, meso-scale propagation, as well as the dissipation stages of the clouds in a multi-scale fashion, in contrast to the static models that process satellite images as independent instances. The hybrid RF-ConvLSTM model was seen to work significantly better than the RF-RF model in all accumulation time intervals. In the case of the 3 h accumulation window, the error was reduced by as much as 40%, while the correlation values were seen to enhance from 0.82 to 0.89 in the daylight hours. Even more dramatic differences were noticed in the night hours, as well as in the 24 h accumulation window, where the ConvLSTM model reported an R of 0.91, reducing the error from the original values of 7.9 mm to 5.4 mm.
These developments are of particular significance for Northern Algeria, an area where the frequent simultaneous occurrence of rapidly developing localized convective systems, often associated with hydrologic extremes and more prolonged stratiform precipitation events, along with significant spatial gradients in rainfall, are accompanied by limited ground-based observations. The hybrid approach is an important milestone in achieving an operational satellite-based monitoring of the precipitation in the region where data availability can be considered poor. The proposed approach leverages the explainability, generalization, and precision of RF, as well as the long-term dependency and spatial information of ConvLSTM, in order to achieve smoother, less noisy, precipitation maps, so as to enhance the applications of hydrology.
Nonetheless, while the obtained results are extremely promising, there are still some limitations that should be noted. The ConvLSTM algorithm remains computationally intensive, potentially lacking the capacity to describe long-range spatial correlations in the data, as well as non-template weather conditions. Furthermore, while the hybrid model has the potential to learn physically meaningful representation structures, it lacks explicit physical constraints based on the atmosphere, so it could be valuable to research the hybrid physical–AI model in the future. The proposed model could also be improved by adding more geostationary satellites, microwave, or radar composite data in the future. Adding attention mechanisms to the model, like the TrajGRU, MetNet, or transformer models, could also be of use in predicting extreme weather conditions.
In conclusion, this paper has highlighted the effectiveness of the synergy between ensemble learning algorithms and spatiotemporal modeling based on deep networks for the retrieval of precipitation in the Mediterranean region. The hybrid model that integrates Random Forest algorithms and Convolutional LSTM networks can be considered a promising tool for the creation of next-generation precipitation estimation maps in the Mediterranean region, as well as in other regions worldwide, where the lack of reliable precipitation information has long been recognized as a significant barrier for hydrometeorological applications.
Although the hybrid RF-ConvLSTM model has shown robust performance in the identification of local spatio-temporal patterns, it is also important to consider the transformer architecture in the future to address the long-range dependency issues and the computational burden in real-time applications.
Author Contributions
Conceptualization, F.O.; Methodology, F.O.; Software, M.L.; Validation, M.L.; Formal analysis, M.S.; Investigation, Y.M.; Data curation, D.A.; Writing – original draft, F.O.; Writing – review & editing, F.O.; Supervision, K.L. and S.A.; Funding acquisition, S.A. All authors have read and agreed to the published version of the manuscript.
Funding
This research received no external funding.
Institutional Review Board Statement
Not applicable.
Informed Consent Statement
Not applicable.
Data Availability Statement
The original contributions presented in this study are included in the article. Further inquiries can be directed to the corresponding author.
Conflicts of Interest
The authors declare no conflict of interest.
References
- Yang, D.; Yang, Y.; Xia, J. Hydrological cycle and water resources in a changing world: A review. Geogr. Sustain. 2021, 2, 115–122. [Google Scholar] [CrossRef] [Scilit]
- Liu, X.; Zhou, Q.; Ma, Y.; Zhi, Z.; Liu, R.; Ma, W. Temporal and Spatial Variation Characteristics of Precipitation Isohyets on the Qinghai–Tibet Plateau from 1961 to 2023. Atmosphere 2025, 16, 698. [Google Scholar] [CrossRef] [Scilit]
- Zhu, Z.; Peng, C.; Li, X.; Zhang, R.; Dai, X.; Jiang, B.; Chen, J. Remote Sensing-Based Analysis of Precipitation Events: Spatiotemporal Characterization across China. Water 2024, 16, 2345. [Google Scholar] [CrossRef] [Scilit]
- Jahanshahi, A.; Booij, M.J. Quantifying the relative contributions of rainfall and antecedent soil moisture to flood generation: Analysis of 963 Iranian catchments. J. Arid Environ. 2025, 227, 105328. [Google Scholar] [CrossRef] [Scilit]
- Brahimi, S.; Meddi, H.; Meddi, M.; Hallouz, F.; Saaed Hamoudi, A. The Precipitation Concentration in the Cheliff Watershed, Algeria: A Critical Analysis for Sustainable Water Resource Management. Chin. J. Urban Environ. Stud. 2023, 11, 2350013. [Google Scholar] [CrossRef] [Scilit]
- Habib, E.; Krajewski, W.F.; Kruger, A. Sampling Errors of Tipping-Bucket Rain Gauge Measurements. J. Hydrol. Eng. 2001, 6, 159–166. [Google Scholar] [CrossRef] [Scilit]
- Villarini, G.; Mandapaka, P.V.; Krajewski, W.F.; Moore, R.J. Rainfall and sampling uncertainties: A rain gauge perspective. J. Geophys. Res. 2008, 113, D11102. [Google Scholar] [CrossRef] [Scilit]
- Schmetz, J.; Pili, P.; Tjemkes, S.; Just, D.; Kerkmann, J.; Rota, S.; Ratier, A. Supplement to An Introduction to Meteosat Second Generation (MSG): SEVIRI CALIBRATION. Bull. Am. Meteorol. Soc. 2002, 83, 992. [Google Scholar] [CrossRef]
- Krajewski, W.F.; Smith, J.A. Radar hydrology: Rainfall estimation. Adv. Water Resour. 2002, 25, 1387–1394. [Google Scholar] [CrossRef] [Scilit]
- Germann, U.; Joss, J. Operational Measurement of Precipitation in Mountainous Terrain. In Weather Radar; Meischner, P., Ed.; Physics of Earth and Space Environments; Springer: Berlin/Heidelberg, Germany, 2004; pp. 52–77. [Google Scholar] [CrossRef] [Scilit]
- Thies, B.; Nauß, T.; Bendix, J. Precipitation process and rainfall intensity differentiation using Meteosat Second Generation Spinning Enhanced Visible and Infrared Imager data. J. Geophys. Res. 2008, 113, D23206. [Google Scholar] [CrossRef] [Scilit]
- Ouallouche, F.; Lazri, M.; Ameur, S. Improvement of rainfall estimation from MSG data using Random Forests classification and regression. Atmos. Res. 2018, 211, 62–72. [Google Scholar] [CrossRef] [Scilit]
- Joyce, R.J.; Janowiak, J.E.; Arkin, P.A.; Xie, P. CMORPH: A Method that Produces Global Precipitation Estimates from Passive Microwave and Infrared Data at High Spatial and Temporal Resolution. J. Hydrometeorol. 2004, 5, 487–503. [Google Scholar] [CrossRef] [Scilit]
- Kidd, C.; Huffman, G. Global precipitation measurement. Meteorol. Appl. 2011, 18, 334–353. [Google Scholar] [CrossRef] [Scilit]
- Arkin, P.A.; Meisner, B.N. The Relationship between Large-Scale Convective Rainfall and Cold Cloud over the Western Hemisphere during 1982–1984. Mon. Weather. Rev. 1987, 115, 51–74. [Google Scholar] [CrossRef] [Scilit]
- Yano, J.; Geleyn, J.-F.; Köhler, M.; Mironov, D.; Quaas, J.; Soares, P.M.M.; Phillips, V.T.J.; Plant, R.S.; Deluca, A.; Marquet, P.; et al. Basic Concepts for Convection Parameterization in Weather Forecast and Climate Models: COST Action ES0905 Final Report. Atmosphere 2014, 6, 88–147. [Google Scholar] [CrossRef] [Scilit]
- Sehad, M.; Ameur, S. A multilayer perceptron and multiclass support vector machine based high accuracy technique for daily rainfall estimation from MSG SEVIRI data. Adv. Space Res. 2020, 65, 1250–1262. [Google Scholar] [CrossRef] [Scilit]
- Mohia, Y.; Absi, R.; Lazri, M.; Labadi, K.; Ouallouche, F.; Ameur, S. Quantitative Estimation of Rainfall from Remote Sensing Data Using Machine Learning Regression Models. Hydrology 2023, 10, 52. [Google Scholar] [CrossRef] [Scilit]
- Breiman, L. Random Forests. Mach. Learn. 2001, 45, 5–32. [Google Scholar] [CrossRef] [Scilit]
- Narayanan, D.; Bhat, M.; Paul, N.R.S.; Khatri, N.; Saroliya, A. Artificial intelligence driven advances in wastewater treatment: Evaluating techniques for sustainability and efficacy in global facilities. Desalination Water Treat. 2024, 320, 100618. [Google Scholar] [CrossRef] [Scilit]
- Shi, X.; Chen, Z.; Wang, H.; Yeung, D.-Y.; Wong, W.; Woo, W. Convolutional LSTM Network: A Machine Learning Approach for Precipitation Nowcasting. arXiv 2015. [Google Scholar] [CrossRef] [Scilit]
- Kratzert, F.; Klotz, D.; Brenner, C.; Schulz, K.; Herrnegger, M. Rainfall–runoff modelling using Long Short-Term Memory (LSTM) networks. Hydrol. Earth Syst. Sci. 2018, 22, 6005–6022. [Google Scholar] [CrossRef] [Scilit]
- Waqas, M.; Humphries, U.W. A critical review of RNN and LSTM variants in hydrological time series predictions. MethodsX 2024, 13, 102946. [Google Scholar] [CrossRef] [Scilit] [PubMed]
- Leng, J.; Gao, M.; Gong, H.; Chen, B.; Zhou, C.; Shi, M.; Chen, Z.; Li, X. Spatio-temporal prediction of regional land subsidence via ConvLSTM. J. Geogr. Sci. 2023, 33, 2131–2156. [Google Scholar] [CrossRef] [Scilit]
- Meddi, M.; Talia, A.; Martin, C. Évolution récente des conditions climatiques et des écoulements sur le bassin versant de la Macta (Nord-Ouest de l’Algérie). Physio-Geo 2009, 3, 61–84. [Google Scholar] [CrossRef] [Scilit]
- Lazri, M.; Ameur, Z.; Ameur, S.; Mohia, Y.; Brucker, J.M.; Testud, J. Rainfall estimation over a Mediterranean region using a method based on various spectral parameters of SEVIRI-MSG. Adv. Space Res. 2013, 52, 1450–1466. [Google Scholar] [CrossRef] [Scilit]
- Strabala, K.I.; Ackerman, S.A.; Menzel, W.P. Cloud properties inferred from 8–12-µm data. J. Appl. Meteorol. 1994, 33, 212–229. [Google Scholar] [CrossRef] [Scilit]
- Roebeling, R.A.; Holleman, I. SEVIRI rainfall retrieval and validation using weather radar observations. J. Geophys. Res. 2009, 114, D21202. [Google Scholar] [CrossRef] [Scilit]
- Marshall, J.S.; Palmer, W.M.K. The Distribution of Raindrops with Size. J. Meteorol. 1948, 5, 165–166. [Google Scholar] [CrossRef] [Scilit]
- Wilson, J.W.; Brandes, E.A. Radar Measurement of Rainfall—A Summary. Bull. Am. Meteorol. Soc. 1979, 60, 1048–1058. [Google Scholar] [CrossRef] [Scilit]
- Hochreiter, S.; Schmidhuber, J. Long Short-Term Memory. Neural Comput. 1997, 9, 1735–1780. [Google Scholar] [CrossRef] [Scilit]
- Lazri, M.; Ameur, S.; Mohia, Y. Instantaneous rainfall estimation using neural network from multispectral observations of SEVIRI radiometer and its application in estimation of daily and monthly rainfall. Adv. Space Res. 2014, 53, 138–155. [Google Scholar] [CrossRef] [Scilit]
- Shepard, D. A two-dimensional interpolation function for irregularly-spaced data. In Proceedings of the 1968 23rd ACM National Conference; ACM Press: New York, NY, USA, 1968; pp. 517–524. [Google Scholar] [CrossRef] [Scilit]
- Ly, S.; Charles, C.; Degré, A. Different methods for spatial interpolation of rainfall data for operational hydrology and hydrological modeling at watershed scale. A review. Biotechnol. Agron. Soc. Environ. 2013, 17, 392–406. [Google Scholar]
- Wolfensberger, D.; Gabella, M.; Boscacci, M.; Germann, U.; Berne, A. RainForest: A random forest algorithm for quantitative precipitation estimation over Switzerland. Atmos. Meas. Tech. 2021, 14, 3169–3193. [Google Scholar] [CrossRef] [Scilit]
- Liu, W.; Wang, Y.; Zhong, D.; Xie, S.; Xu, J. ConvLSTM Network-Based Rainfall Nowcasting Method with Combined Reflectance and Radar-Retrieved Wind Field as Inputs. Atmosphere 2022, 13, 411. [Google Scholar] [CrossRef] [Scilit]

Disclaimer/Publisher’s Note: The statements, opinions and data contained in all publications are solely those of the individual author(s) and contributor(s) and not of MDPI and/or the editor(s). MDPI and/or the editor(s) disclaim responsibility for any injury to people or property resulting from any ideas, methods, instructions or products referred to in the content. |
© 2026 by the authors. Licensee MDPI, Basel, Switzerland. This article is an open access article distributed under the terms and conditions of the Creative Commons Attribution (CC BY) license.