Article

Algorithms and Models Implemented in ESTE Tool for Rapid Radiological Consequences Assessment After Nuclear Explosion

ABmerit Ltd., 917 01 Trnava, Slovakia
*
Author to whom correspondence should be addressed.
Atmosphere 2026, 17(3), 295; https://doi.org/10.3390/atmos17030295
Submission received: 31 December 2025 / Revised: 10 March 2026 / Accepted: 11 March 2026 / Published: 14 March 2026
(This article belongs to the Special Issue Atmospheric Radioactivity: Monitoring and Measurement)

Abstract

This paper describes a new methodology implemented in the ESTE decision support system for evaluating the source term resulting from a nuclear weapon detonation. The methodology is based on a model of a stabilized radioactive mushroom cloud, parameterized as the source term for a Lagrangian particle dispersion model. It includes radionuclide composition, spatial distribution of aerosol and gaseous particles, and particle size distribution. This method is designed for rapid assessment of radiological impacts primarily at medium- and long-range distances, for example, in neighboring countries. The parametrization has been calibrated and adjusted using data from historical nuclear tests, and its performance is evaluated in terms of impacted area, range, and spatial overlap of fallout regions. A comparison is presented between ESTE calculations and field measurements obtained after the British nuclear tests conducted in the 1950s at the Maralinga Range (Australia), using historical ERA5 meteorological reanalyses from ECMWF.

1. Introduction

Given the current and evolving geopolitical context, the possibility that nuclear weapons may be employed in ongoing or future armed conflicts cannot be excluded. In response to this potential threat, a new module has been implemented within the ESTE decision support system (DSS), a system deployed in nuclear emergency response centers at various levels. For example, ESTE [1] is implemented at the governmental level in Slovakia, the Czech Republic, Austria, and Bulgaria. The DSS is designed to assist crisis managers not only in the management of accidents at nuclear installations, but also in addressing a broad range of radiological emergencies, including scenarios involving the detonation of a nuclear weapon.
The module described in this paper is intended for use by national nuclear emergency response centers for radiological impact assessment and crisis management in the event of atmospheric nuclear weapon detonations. Its primary purpose is to support rapid decision-making regarding protective actions and consequence assessment.
At both national and international levels, a wide range of DSS is used to model the impacts of radiological or nuclear accidents. Examples are HPAC [2], ESTE [1], RODOS [3], ARGOS [4], and others. These systems are mainly focused on events at nuclear installations, such as the Fukushima accident or similar incidents on a smaller scale. Several systems include modules for generating source terms for nuclear detonations involving smaller-scale nuclear weapons (e.g., events initiated as terrorist attacks), such as ESTE, ARGOS or others.
The list of systems with an implemented comprehensive assessment capability for nuclear detonations, coupled with consequent nuclear fallout, is rather limited. Notably, they are (i) Hazard Prediction and Assessment Capability (HPAC) [5], (ii) Defense Land Fallout Interpretative Code DELFIC [6], and (iii) K-Division Defense Nuclear Agency Fallout Code (KDFOC3) of the NARAC system [7]. The model in [6] is a robust nuclear forensics code that numerically computes the cloud rise, growth, stabilization and transport of radioactive particles from a nuclear weapon detonation. KDFOC3 is a specialized, empirical computer model used to predict the deposition of radioactive fallout following a nuclear detonation. A comparison of these systems can be found in [8]. Further systems are ARGOS-MATCH [9], or DISpersion of radioActivity fRom nuclear boMbs (DISARM) [10]. The source description of both systems follows KDFOC3.
The objective of this work is to develop an operationally usable source-term module associated with atmospheric nuclear weapon detonations. Several systems and models exist for simulating nuclear detonations. Our aim was to propose a simplified, yet still fully applicable, theoretical description of the nuclear mushroom cloud. The cloud-height and radius parameterizations follow the empirical curves summarized by Glasstone and Dolan [11]; the full source-term model additionally incorporates standard atmospheric constraints and simplified aerosol parameterizations required for Lagrangian dispersion modeling. The proposed source-term model is comprehensive in that it includes the radionuclide composition, spatial distribution of aerosol and gaseous particles, and particle size distribution. Other relevant types of nuclear detonations include underground bursts; however, these are not covered by the implemented model, as they involve fundamentally different mechanisms of radionuclide release into the environment.
A further objective of this work is to test and simulate the atmospheric transport and dispersion of radionuclides released during atmospheric nuclear detonations. In such events, the resulting mushroom cloud is characterized by a large vertical extent. Explosions with high yield or occurring at higher altitudes lead to an initial vertical distribution of radioactive material spanning most of the troposphere and, in some cases, extending into the lower stratosphere. Atmospheric transport coupled with the implemented mushroom model is simulated using the Lagrangian particle dispersion model (LPM) of the ESTE system [1]. The Lagrangian particle models (see also [12,13]) are among the most commonly used approaches for large-scale and global atmospheric transport modeling. Their use in this work is particularly appropriate, as the simulations encompass multiple atmospheric layers with different characteristics, incorporate derived particle size distributions, and allow assessment of impacts over large distances, such as neighboring countries and regions.
Importantly, a comparison is presented between simulations performed with the ESTE system and field measurements obtained from historical nuclear tests. The analysis focuses on British tests (see [14]) conducted in the 1950s at the Maralinga Range (Australia), using historical ERA5 global meteorological reanalysis data from ECMWF to perform atmospheric transport calculations covering the whole continent of Australia. These nuclear tests, together with publicly available results from radionuclide contamination monitoring across Australia, were used to calibrate and refine the nuclear-blast source-term estimation methodology implemented in the ESTE system.
The overall aim of this study is to develop and validate an operationally usable source term, coupled with an atmospheric dispersion module, for atmospheric nuclear weapon detonations within the ESTE decision support system. The novelty of the work lies partially in a fundamentally new algorithm and partly in (i) the integration of a parameterized mushroom-cloud model and fission-yield-based radionuclide inventory into an existing emergency-response framework, and (ii) the quantitative evaluation of model performance against historical fallout measurements from the British nuclear tests at Maralinga test range.

2. Model for a Nuclear Mushroom Cloud

A basic fission device uses either Pu-239, U-235, or a combination of the two as fissionable fuel (in advanced thermonuclear weapons, U-238 is also used). The fast fission of this fuel results in the production of a wide spectrum of fission and activation products, as well as a significant amount of unfissioned fuel.
In the case of air and surface bursts [11], the extreme energy released in the explosion causes these radionuclides, together with non-radioactive debris, to vaporize into a hot gas bubble. This bubble rises into the atmosphere and stabilizes at a height determined by the weapon yield and height of burst, and constrained by atmospheric stratification (in particular, the tropopause, represented here as a latitude-dependent height). In detonations occurring near the surface, soil and other surface materials may be entrained into the fireball, where they are vaporized and/or mixed with weapon debris and subsequently distributed within the nuclear mushroom cloud.
Cloud rise following a nuclear detonation can be described using entraining thermal and plume models based on Morton–Taylor–Turner model [15], which have been implemented in operational tools such as DELFIC [6] and its modern descendants [9,16]. For the intended application—rapid source-term estimation and sensitivity studies—we adopt a simplified, time-integrated representation of the stabilized mushroom cloud, rather than solving the full transient turbulent cloud-rise equations.
The parametrization is designed to reproduce the dependence of cloud-top height on weapon yield reported by Glasstone and Dolan [11], to provide a geometrically simple description of the cloud volume suitable for sampling particle positions and sizes in fallout and dose calculations using an LPM.
The resulting model is not intended to replace high-fidelity cloud-rise simulations such as DELFIC, but rather to provide a simple, tunable approximation whose parameters can be calibrated against more complex models and observational constraints.

2.1. Cloud-Top Height

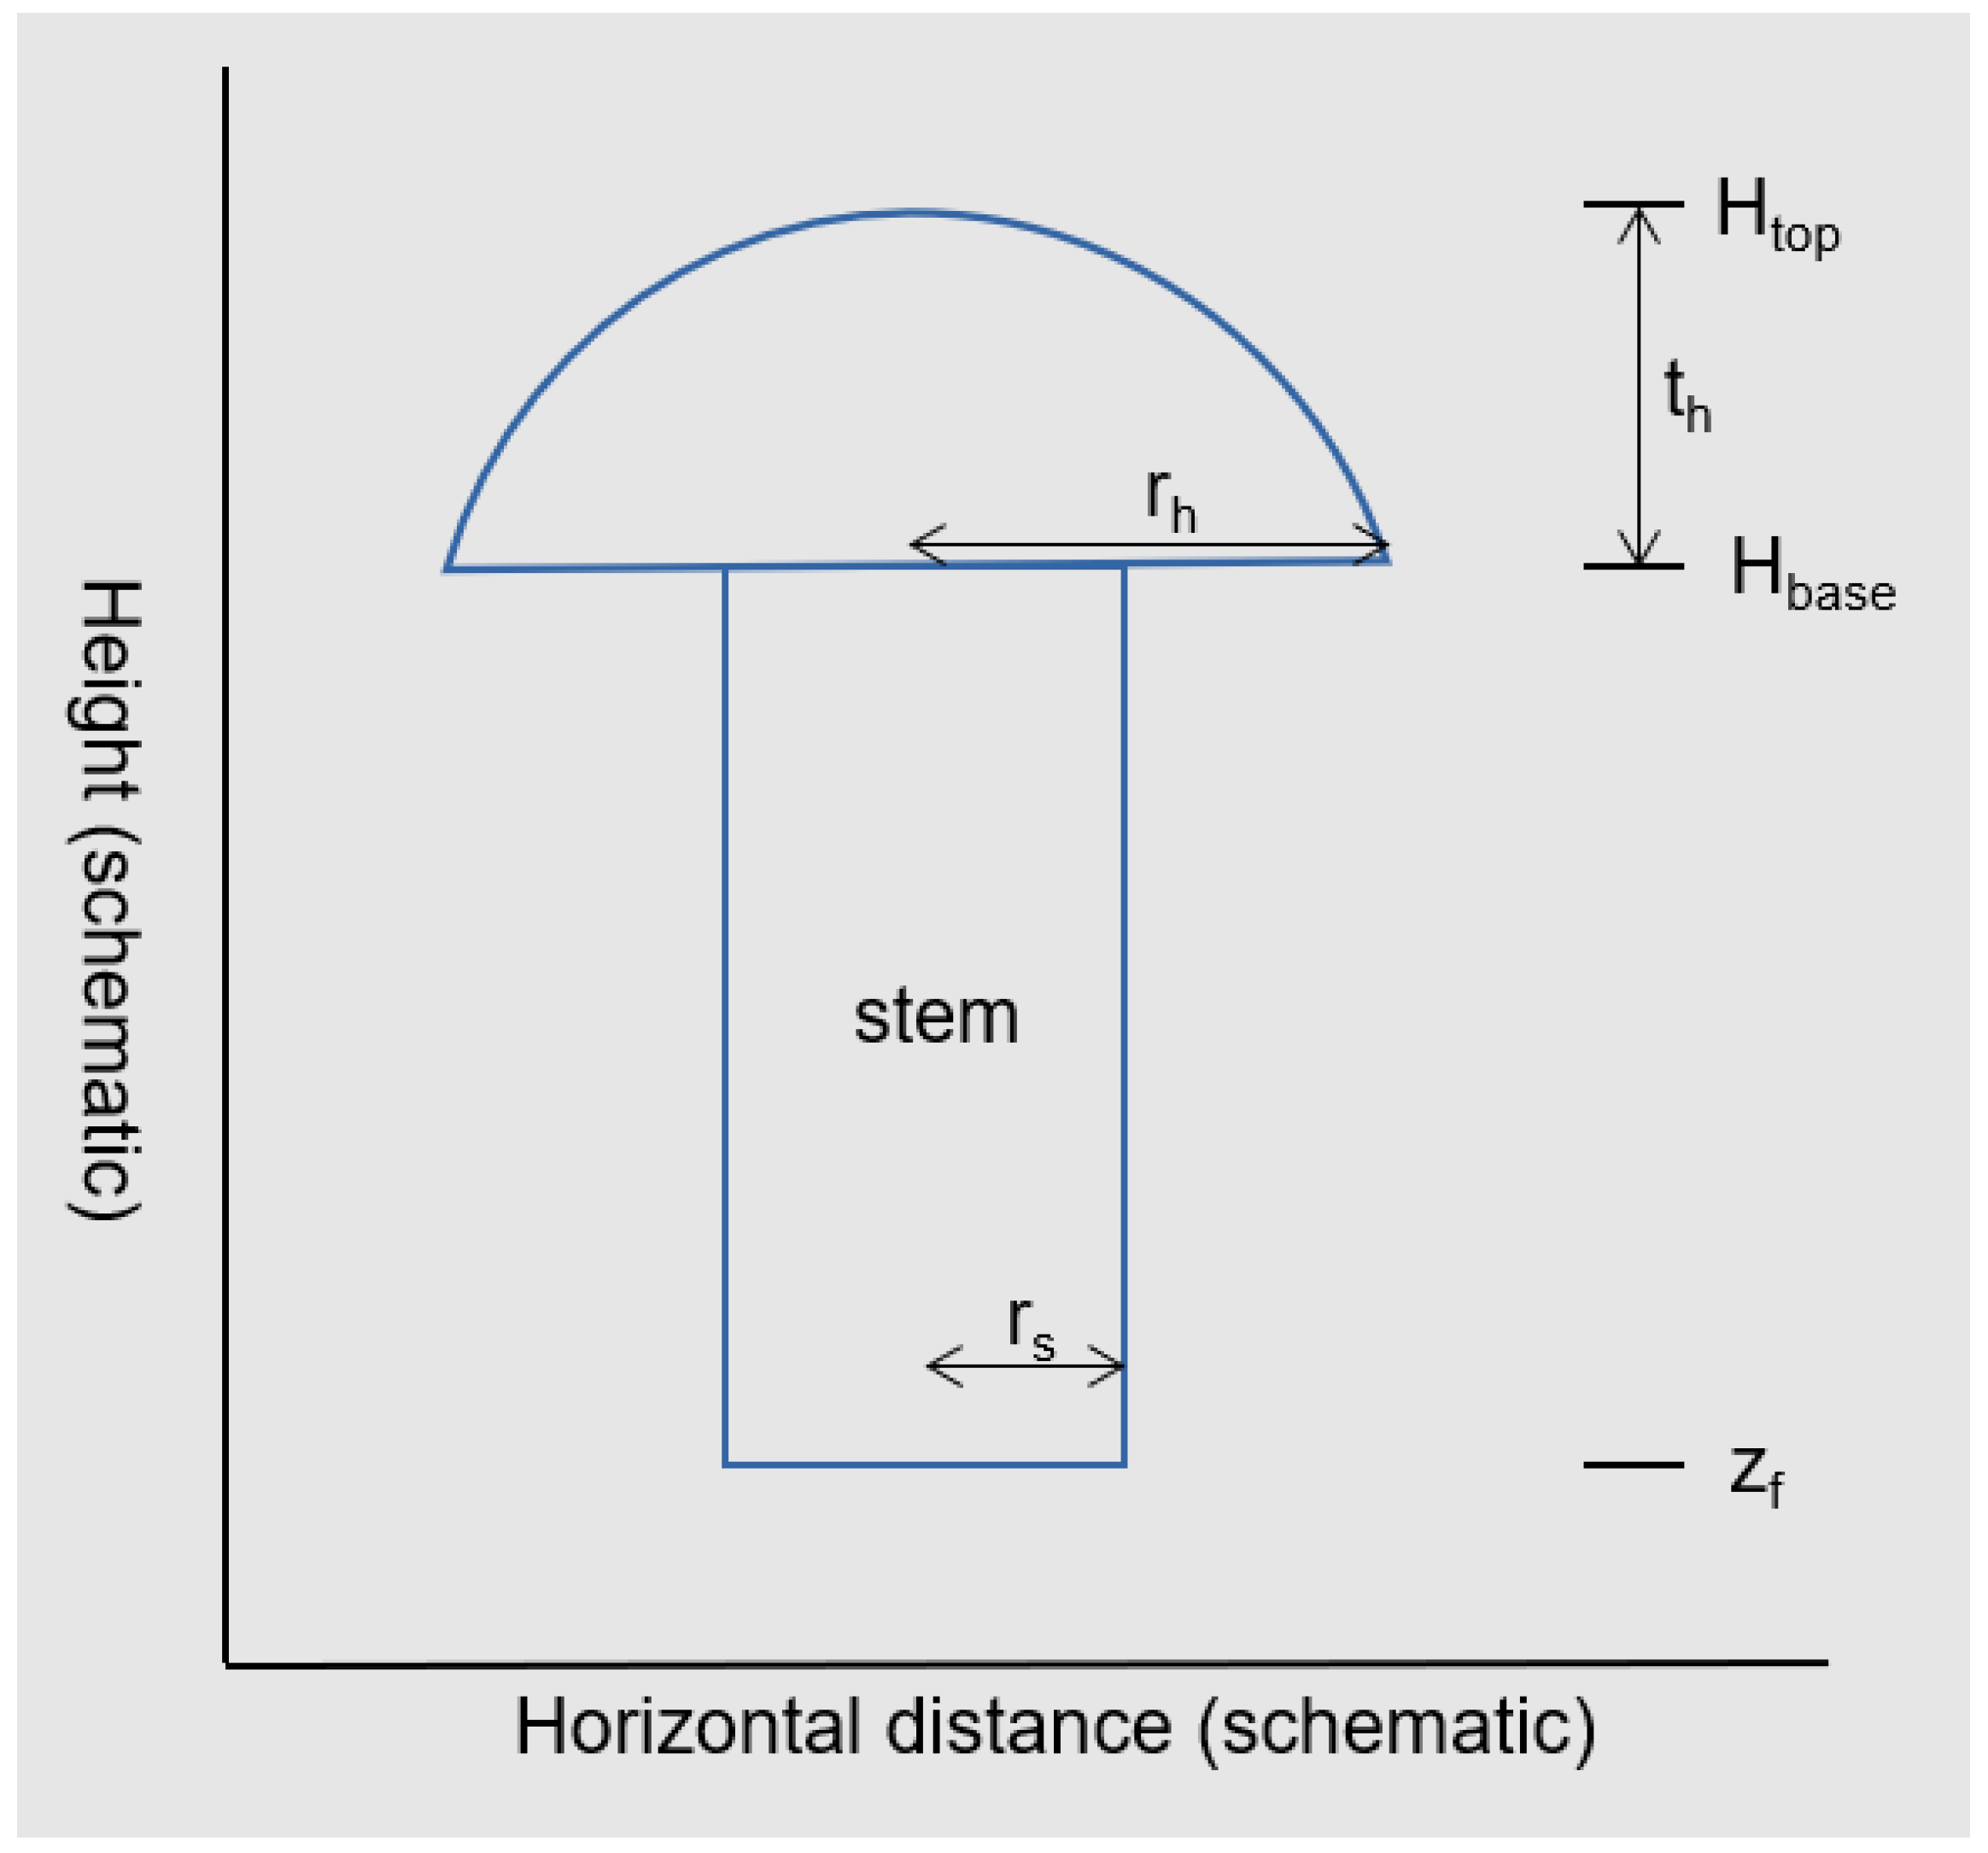
The schematic of the nuclear mushroom cloud, with parameters characterizing its spatial configuration, is shown in Figure 1. The stabilized cloud-top height is described in terms of a free-rise height Hfree. For a surface or low-altitude burst of total yield Y (kt TNT equivalent), the free-rise height (in km) is parameterized following [11]:
H f r e e Y , H b f b H b × 2.6 + 4.7 Y 1 4               ( k m )
Here, Y is the total weapon yield (kt TNT), and Hfree is the free-rise cloud-top height (km). Equation (1) is obtained as a simple least-squares fit to the empirical cloud-height curve presented in [11]. For very low bursts (height of burst Hb < 500 m), a small multiplicative reduction factor 0.95 < fb(Hb) < 1 is applied to represent enhanced entrainment and drag in the boundary layer.
An important atmospheric boundary that influences the cloud rise is the tropopause. The tropopause height Htrop is approximately 17 km at the equator and 10 km at the poles. The presented version of the stabilized mushroom model describes the cloud parameters for HfreeHtrop. In case of tropopause overshooting, the cloud-top height as well as geometric representation have to reflect the passage through the tropopause, which is not fully covered in the mushroom model.
The cloud behaves as a deep tropospheric convective plume, with the stabilized cloud top (Htop) and base (Hbase) given by:
H b a s e = H f r e e / 2 ,   H t o p = H f r e e .

2.2. Geometric Representation of the Mushroom Cloud

The stabilized mushroom cloud is modeled as a cylindrical stem with a spherical head, a simplification consistent with photographic records of nuclear tests.
The head radius, rh, is parameterized as a power law in yield and scaled using a least-squares fit to the empirical cloud-height curve (as presented in [11]):
r h 0.5 Y 0.4       ( k m ) .
The head thickness, th, is taken as a fraction of this radius:
t h = H t o p H b a s e
The head is approximated as a spherical segment extending vertically from z = Hbase to z = Hbase + th. The bulbous upper portion of the stabilized cloud is referred to as the head. For geometric sampling, it is represented as a spherical head of thickness th.
The stem is modeled as a vertical cylinder of radius rs and height Hbasezf, where zf denotes the nominal height of the roll cloud (0.8 km above ground):
r s   =   f Y r h ,     f Y   =   0.5 Y 20 0.2 .
This equation is based on observations of stem radii in [11]. The stem radius is limited to a maximum of half the head radius. This model produces thinner stems for higher-yield events, in agreement with historical observations of large-yield nuclear test mushroom clouds.

2.3. Treatment of Airbursts and Surface Coupling

The development of the mushroom cloud stem and the entrainment of surface material depend on whether the fireball intersects the ground. To distinguish true airbursts from surface or near-surface bursts, we estimate an early-time fireball radius Rf
R f   ~   50   Y 0.4 .
The radius is compared with the burst height, Hb. When Hb > 2Rf, the fireball is considered decoupled from the surface, suppressing the mushroom stem.
For intermediate cases, we introduce a stem factor, sstem, defined as:
s s t e m = 1 ,                                                                                                             i f   H b R f                 0.5 1 + c o s ( H b R f ) / R f , R f < H b < 2 R f 0 ,                                                                                                             i f   H b 2 R f            
The stem factor approximates the transition from surface-coupled bursts (with a fully developed stem) to true airbursts (with a suppressed stem), as a function of burst height relative to the characteristic fireball radius Rf. The cosine form in Equation (7) provides a convenient numerical approximation for this transition.
The stem volume is then replaced by an effective stem volume Vstem,eff = sstemVstem, when sampling the cloud for particle positions. This approach ensures a continuous transition from fully developed mushroom stems in surface bursts to stemless, detached clouds in true airbursts, in line with observations and standard effects handbooks.

2.4. Particle Size Distribution and Spatial Sampling

Fallout and inhalation doses depend strongly on the particle size distribution. Following classic fallout literature and weapons-test syntheses, and consistent with subsequent nuclear-winter and modern fallout modeling studies, we represent the activity-bearing aerosol/dust mixture using a bimodal log-normal distribution [8,17,18,19]:
-
Fine aerosol component: Condensed fission products and vaporized weapon materials with median diameter df ∼ 0.3 μm and geometric standard deviation σg,f ∼ 2. These parameters can be adjusted by the user to modify the aerosol particle generator, allowing simulations to reflect changes in the activity/aerosol distribution (AED) due to atmospheric processes that alter particle size.
-
Coarse debris component: Soil or water droplets carrying condensed activity with median dc ∼ 100 μm and σg,c ∼ 2.5.
The bimodal log-normal distribution is expressed as the sum of two log-normal distributions, ln:
p d r = w r ln d ; d g , c , σ g , c + 1 w r ln ( d ; d g , f , σ g , f )
ln d ; d g , σ g = 1 d ln σ g 2 π exp ln d / d g 2 2   ln σ g 2
The parameter w(r) is the mixture weight (probability) of the coarse log-normal mode in the bimodal particle-size distribution. It is constructed as w(r) ∝ wenv × sstem to enforce expected behavior: (a) for true airbursts, surface coupling is negligible (sstem → 0), and the coarse particle mode vanishes; (b) for surface and near-surface bursts, entrainment increases (wenv → 1) and the coarse particle generation probability rises. The generated particle population generally spans 10 nm to 20 µm, typical of airburst events. Larger particles are not considered, as they do not travel significant distances.
The relative contribution of the coarse mode depends on surface coupling and is parameterized by wenv
w e n v ( H b ) = max 0 ,   1 H b R f , H b < 2   R f , 0 ,                                                             H b 2 R f .
This weight is taken to be larger in the stem than in the head, reflecting stronger local entrainment of ground material in the lower cloud:
p c o a r s e ( s t e m )   1.5 w e n v   s s t e m ,     p c o a r s e h e a d   0.3 w e n v   s s t e m   .
In the present simulations, particle positions are sampled uniformly within the geometric head and stem volumes. The activity carried by the particles is not assumed to be uniform: each particle is assigned an activity weight such that a prescribed fraction of the total activity is placed in the head and the remainder in the stem.
For mass-conserving calculations, the sampling can optionally be re-weighted to follow a prescribed vertical activity profile derived from an entraining plume model.

2.5. Limitations of the Mushroom Cloud Model

The present model is intentionally simple and subject to several limitations:
  • No explicit time dependence: The model represents a single, quasi-steady-state cloud approximately O (10) minutes after the burst. It does not account for transient rise, oscillatory overshoot, or time-dependent detrainment, which can be captured in more complex cloud-rise models such as DELFIC [6].
  • Idealized geometry: The cylindrical-stem/spherical-head approximation neglects wind-induced tilting, wind-shear deformation of the anvil, and multi-lobe structures occasionally observed in test clouds.
  • Simplified atmospheric representation: Real-time weather soundings, wind profiles, humidity, and atmospheric stability profiles are not considered.
  • Overshoot: The tropopause limits the penetration into the lower stratosphere when Hfree > Htrop. The tropopause overshoot, which occurs for explosions with a yield above about 100 kt TNT, is not included in the model. An extension of the model to higher yields should cover this phenomenon.
  • Simplified aerosol physics: The bimodal log-normal representation neglects detailed microphysics of fallout particle generation and subsequent size evolution, including fractionation during the formation and cooling phase, coagulation, hygroscopic growth, phase changes, and chemical speciation.
Despite these limitations, the parameterized mushroom-cloud model provides a computationally inexpensive and physically interpretable framework for exploring how yield, burst height, and latitude influence the vertical distribution of radioactive aerosol and its partitioning between local fallout and long-range transport. It can also be used as an initialization scheme for more complex atmospheric dispersion models when detailed cloud-rise calculations are not available.

3. Modeling Approach

3.1. Source Term

The evaluation of source terms for a nuclear weapon detonation is based on a pre-computed inventory database. The inventories are parameterized by two key variables:
-
Weapon yield, expressed as the total released energy, ranging from 1 kt to 300 kt TNT equivalent.
-
Fission fraction, defined as the fraction of the total yield originating from fission. This parameter distinguishes between pure or boosted fission weapons and thermonuclear devices.
Although no authoritative public data on fission fractions for specific weapon designs are available, one assumes generally that low-yield weapons derive most of their energy from fission, whereas thermonuclear weapons release energy through a combination of deuterium-tritium fusion and fast fission of U-238 induced by fusion neutrons. These design differences lead to variations in the fission product mass spectrum and in the total amount of unspent fissile material, which are implicitly accounted for through the choice of fission fraction in the inventory parametrization.
Radionuclide inventories as a function of weapon yield are calculated based on fission product yield databases, assuming an instantaneous fission burst. Subsequent decay chains are treated using the Bateman equations, yielding the quantities of radiologically important radionuclides at the final stage of mushroom cloud formation.
In the ESTE decision support system, 55 radionuclides (listed in Table 1) are implemented and considered for atmospheric dispersion and radiological consequences assessment. This list includes fission products and selected actinides, covering the radionuclides of greatest radiological significance. The selection of radionuclides represents more than two-thirds of the total radioactivity after 24 h post-detonation in the fallout (compared with an extended set of over 150 radionuclides [8]), and the percentage increases with time.
Activation products generated by neutron capture in surrounding weapon materials or on the surface are not included in the source term. The most notable omission is Na-24, which contributes approximately 10–15% to the source term activity [8]. Inclusion of Na-24 and other ground-activation nuclides would require specific analysis of their estimated abundance in the mushroom cloud, but it does not significantly affect the proposed mushroom cloud model, including its geometry and particle distribution.
The source term is expressed as an equivalent amount of fissioned Pu-239 or U-235 corresponding to the fission-equivalent portion of the total yield. All calculated activities are conservatively assumed to be vaporized and aerosolized into the mushroom cloud, with their spatial distribution and particle size distribution following the parametrization described in the preceding sections. The exceptions are the radionuclides of noble gases, which are considered in gaseous form.

3.2. Atmospheric Transport and Dispersion

The ESTE system performs atmospheric transport and dispersion using the Lagrangian particle dispersion model described in [1]. Radionuclide release during a nuclear weapon detonation differs substantially from that of a nuclear power plant accident. In particular, the nuclide release height is not necessarily near the ground level, and the nearly instantaneous energy release can drive a strong thermal cloud rise, potentially injecting material into the lower stratosphere. To account for these conditions, the Lagrangian particle model in ESTE has been extended with an atmospheric dispersion module applicable to the upper troposphere and stratosphere.
For altitudes above the atmospheric boundary layer (ABL), the turbulent velocity increment on the i-th component is parametrized as:
d u i = D i / Δ t · d W i
Here, Wi is a Gaussian random variable with zero mean, and Di is a diffusivity parameter. For the stratosphere, the vertical component of D is equal to 0.1 m2·s−1 [12,20], while the horizontal components are set to zero [12]. In the troposphere above the ABL, horizontal components of D are set to 50 m2·s−1 [12], and the vertical component is set to zero [12].
During a nuclear explosion, fission products and weapon materials are vaporized and subsequently condense into a broad spectrum of particles with different sizes (see Section 2.4). The Lagrangian particle model in ESTE accounts for gravitational settling and air drag as functions of particle size. Particles are categorized as follows:
-
AED < 12 μm: Particles with aerodynamic equivalent diameter (AED) below 12 μm are transported over long distances, as gravitational settling has a negligible effect. Their atmospheric transport and dispersion follow the methodology in [1], using Equation (12) for altitudes above the ABL. Dry deposition occurs through various surface processes.
-
12 μm ≤ AED ≤ 200 μm: Particles in this range are transported similarly to the smallest particles but are additionally influenced by gravitational settling. Settling is represented as an additional vertical velocity equal to the terminal settling velocity, derived from the balance between gravitational force and air drag (Stokes’ law). The AED range is based on an assumed particle density of 2.5 g·cm−3, following [21].
-
AED > 200 μm: Particles larger than 200 μm [22] undergo minimal atmospheric dispersion. They settle rapidly under gravity and can produce localized “hot spots” of high activity near the detonation site. Despite their limited transport range, these particles may carry a substantial fraction of the local activity and are therefore included in the model.
For biological and radiological impact assessments, particles are assumed to be intercepted by vegetation and to enter the food chain up to an AED of approximately 50 μm. Additionally, particles are considered respirable and inhalable, contributing to committed doses by inhalation for AEDs, approximately up to 10–50 μm.

4. Comparison

4.1. Cloud Height Analysis

Four nuclear weapon tests were used to validate the implemented mushroom cloud model. These tests were conducted in Australia in 1956 and 1957 as part of the British nuclear test series Buffalo and Antler. Each series comprised multiple rounds: Buffalo included four rounds, and Antler consisted of three. Throughout this work, individual tests are identified by their series name followed by the round number. The basic specifications and parameters of the selected test rounds, taken from [14], are summarized in Table 2.
As a first step in the validation, the stabilized cloud heights were analyzed. In several tests, two distinct clouds formed instead of a single cloud. The heights of all observed clouds are listed in Table 2; for the purpose of cloud-height analysis, their mean value was used. At the same time, the observed cloud heights show that no tropopause overshooting was present in the cloud rise.
The implemented model computes the stabilized cloud-top height as a function of explosion altitude and yield, using Equations (1)–(4). The resulting cloud-top heights are 4800 m for Antler 2, 8100 m for Antler 3, 3600 m for Buffalo 3, and 5800 m for Buffalo 4. Interpretation of these results is complicated by the fact that, in several tests, more than one distinct cloud was observed (one upper and one lower). For the air-burst cases (Antler 3 and Buffalo 3), the calculated cloud-top heights are approximately equal to the height of the upper cloud of the two observed clouds. In contrast, for the ground-burst cases (Antler 2 and Buffalo 4), the calculated cloud-top heights are underestimated and are approximately half of the observed values. As a consequence, better agreement in ground deposition is expected for air bursts. In contrast, for ground bursts, the model likely overestimates near-field deposition due to insufficient transport of activity to higher altitudes. These discrepancies in cloud height may also reduce the spatial overlap between the calculated and observed impacted areas, analyzed in the next section.

4.2. Weather Data Test and Trajectory Analysis

Atmospheric transport calculations were performed using historical ERA5 reanalysis data from ECMWF for September and October of 1956 and 1957. The meteorological fields include pressure levels up to 1 hPa, with a temporal resolution of 1 h and a horizontal resolution of 0.25°. The model domain spans longitudes from 110° to 155° E and latitudes from 10° S to 45° S, thereby covering the entire Australian continent.
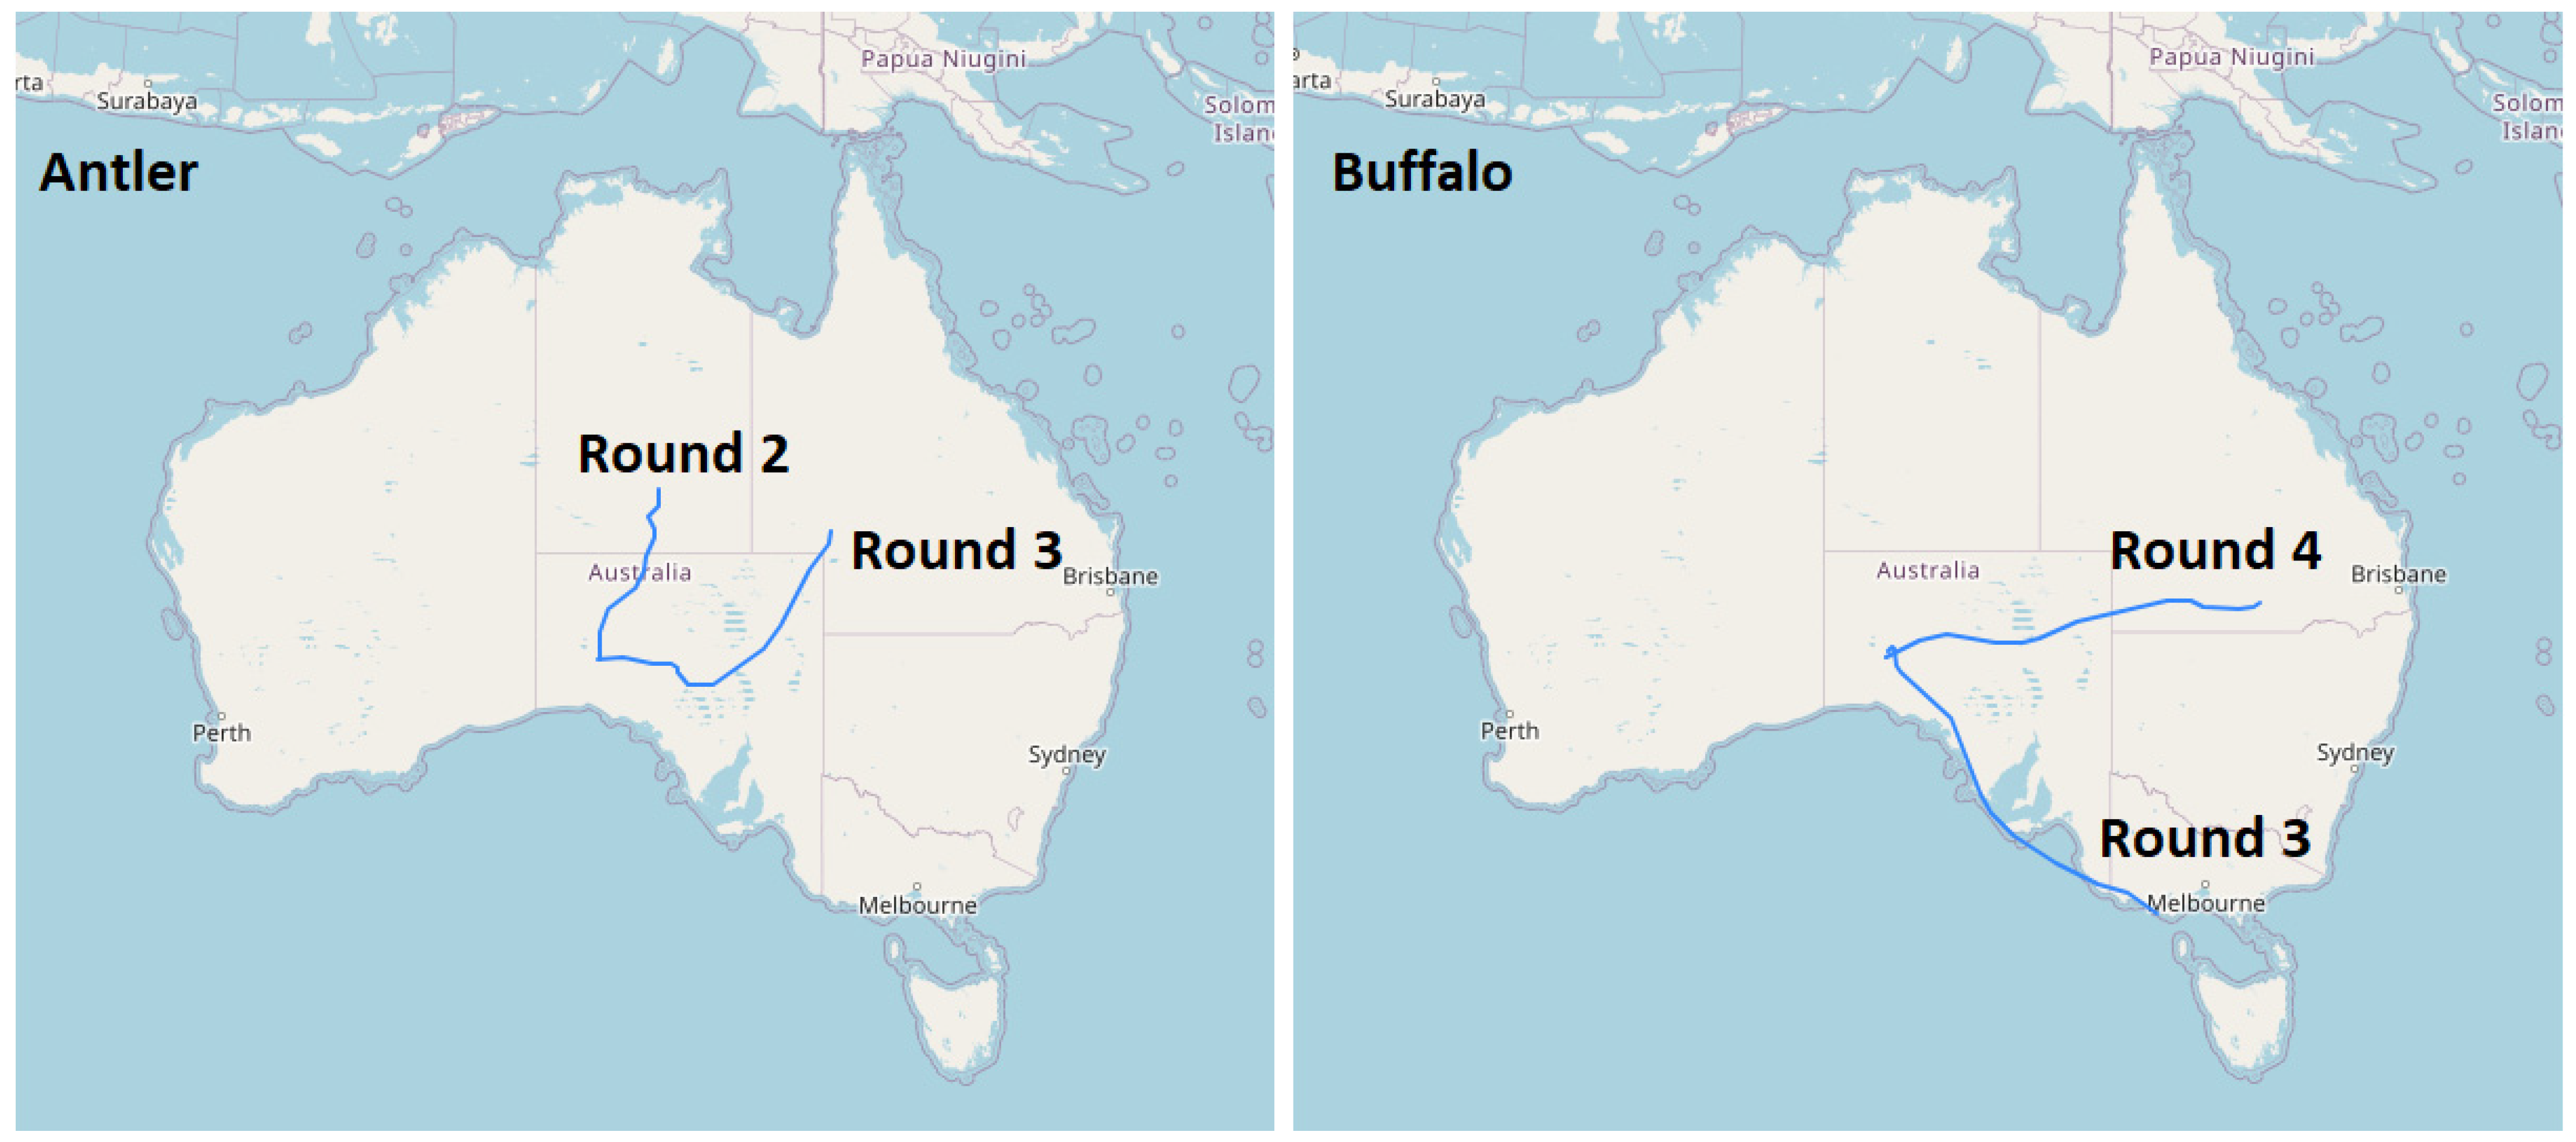
Radiological impact analysis was used both to adjust selected model parameters and to validate mushroom cloud parametrization. The applied ERA5 data correspond to periods when meteorological observations were less comprehensive than in recent decades; nevertheless, the reanalysis assimilates the available measurements and provides a dynamically consistent basis for retrospective simulations. Prior to direct comparison of calculated and measured ground deposition, the historical meteorological fields were evaluated using integrated wind-field trajectories as a simplified tracer-transport diagnostic. in order to assess their suitability for model validation. The trajectories were initialized at the time and location of each nuclear test. Because the implemented mushroom cloud model produces particles over a vertical range extending from approximately 800 m above ground to the calculated cloud top, the trajectories were constrained to a constant height of 1500 m above ground level. This height was chosen to represent a mean transport level for particles originating from the lower portion of the cloud.
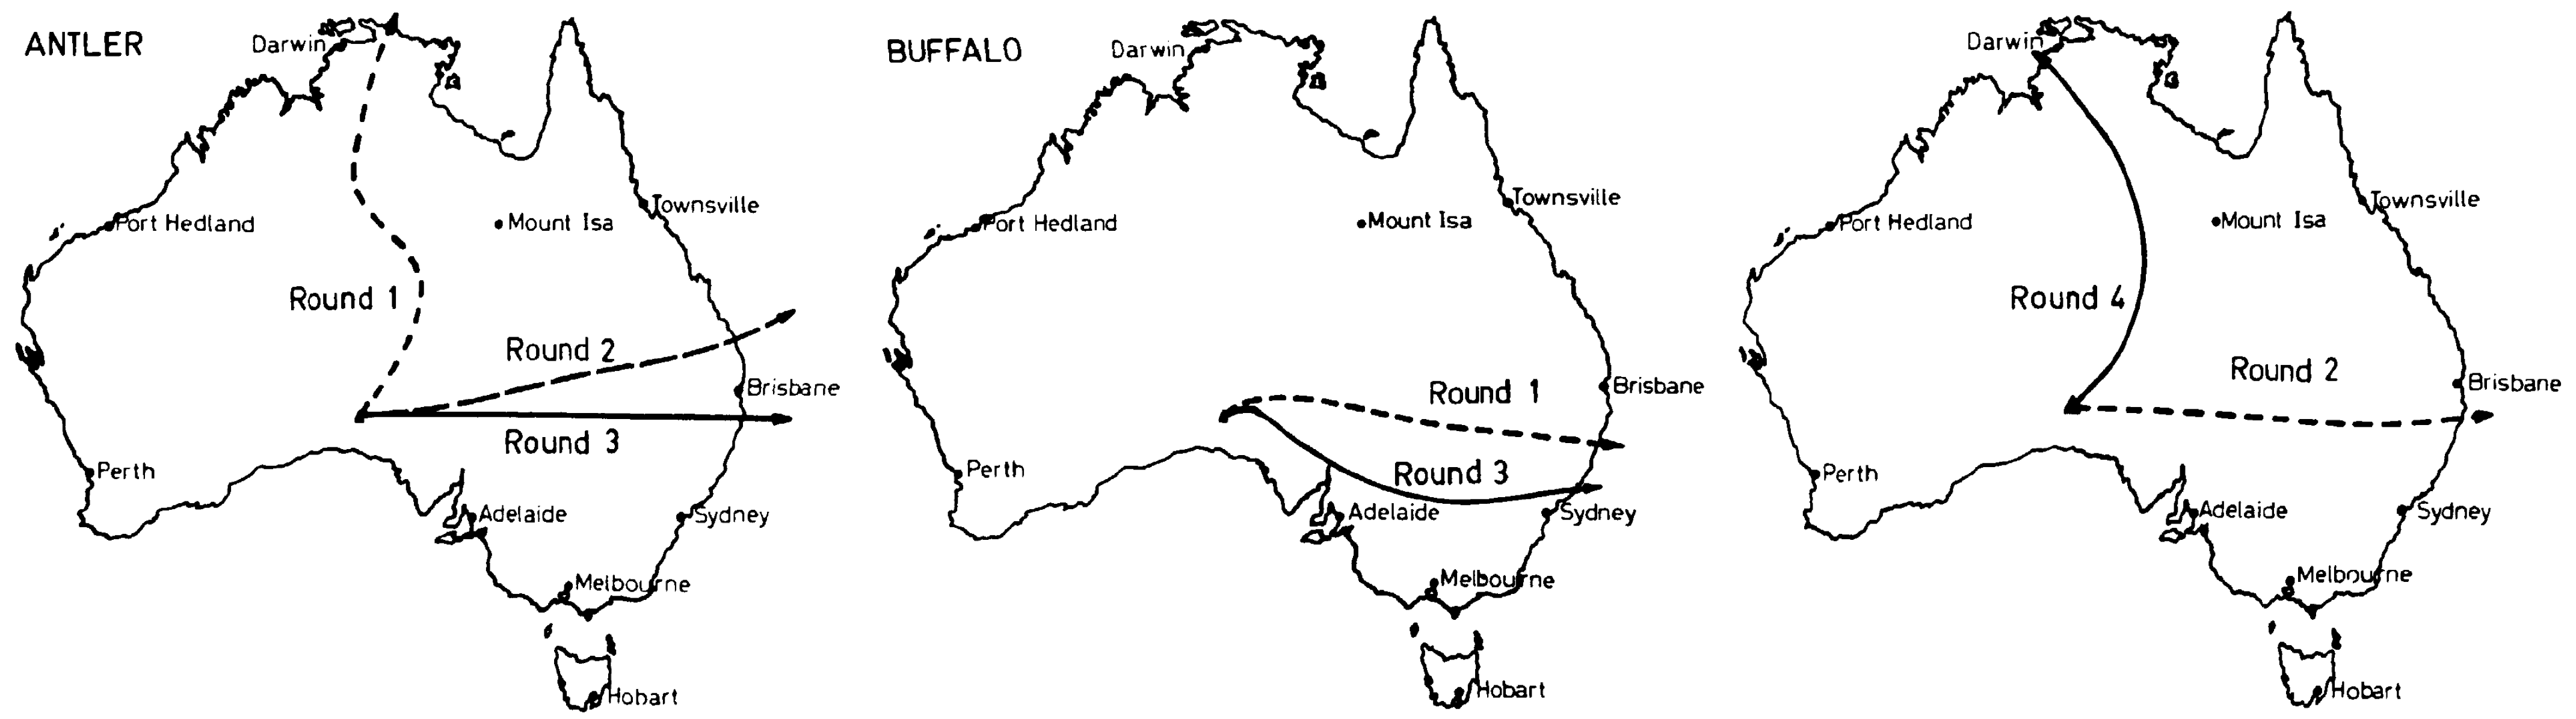
The calculated trajectories are shown in Figure 2 and are compared with observed cloud trajectories depicted in Figure 3. For all trajectories, we determined the transport direction as the vector starting at the test location and ending at the borders of South Australia (corresponding to downwind distances of approximately equal to 500–1000 km). The comparison was based on the absolute value of the angle difference between vectors of the calculated and observed trajectories. For Buffalo 3 and Antler 3, the modeled and observed trajectories show good agreement, with directional differences of less than approximately 25°. In contrast, for Antler 2 and Buffalo 4, the discrepancies are larger, on the order of 65°.
These two tests also exhibited the highest observed cloud tops, indicating that the chosen comparison height of 1500 m was likely not optimal for these cases. Overall, this simplified trajectory analysis indicates that the ERA5 meteorological data are suitable for model–measurement comparison, particularly for the free air-burst events. Consequently, the model-measurement comparison is conducted at the level of regional patterns, defined by isolines. A point-by-point comparison is not pursued, as the uncertainties associated with historical meteorological data at that scale are considered too large.

4.3. Nuclear Fall-Out Analysis

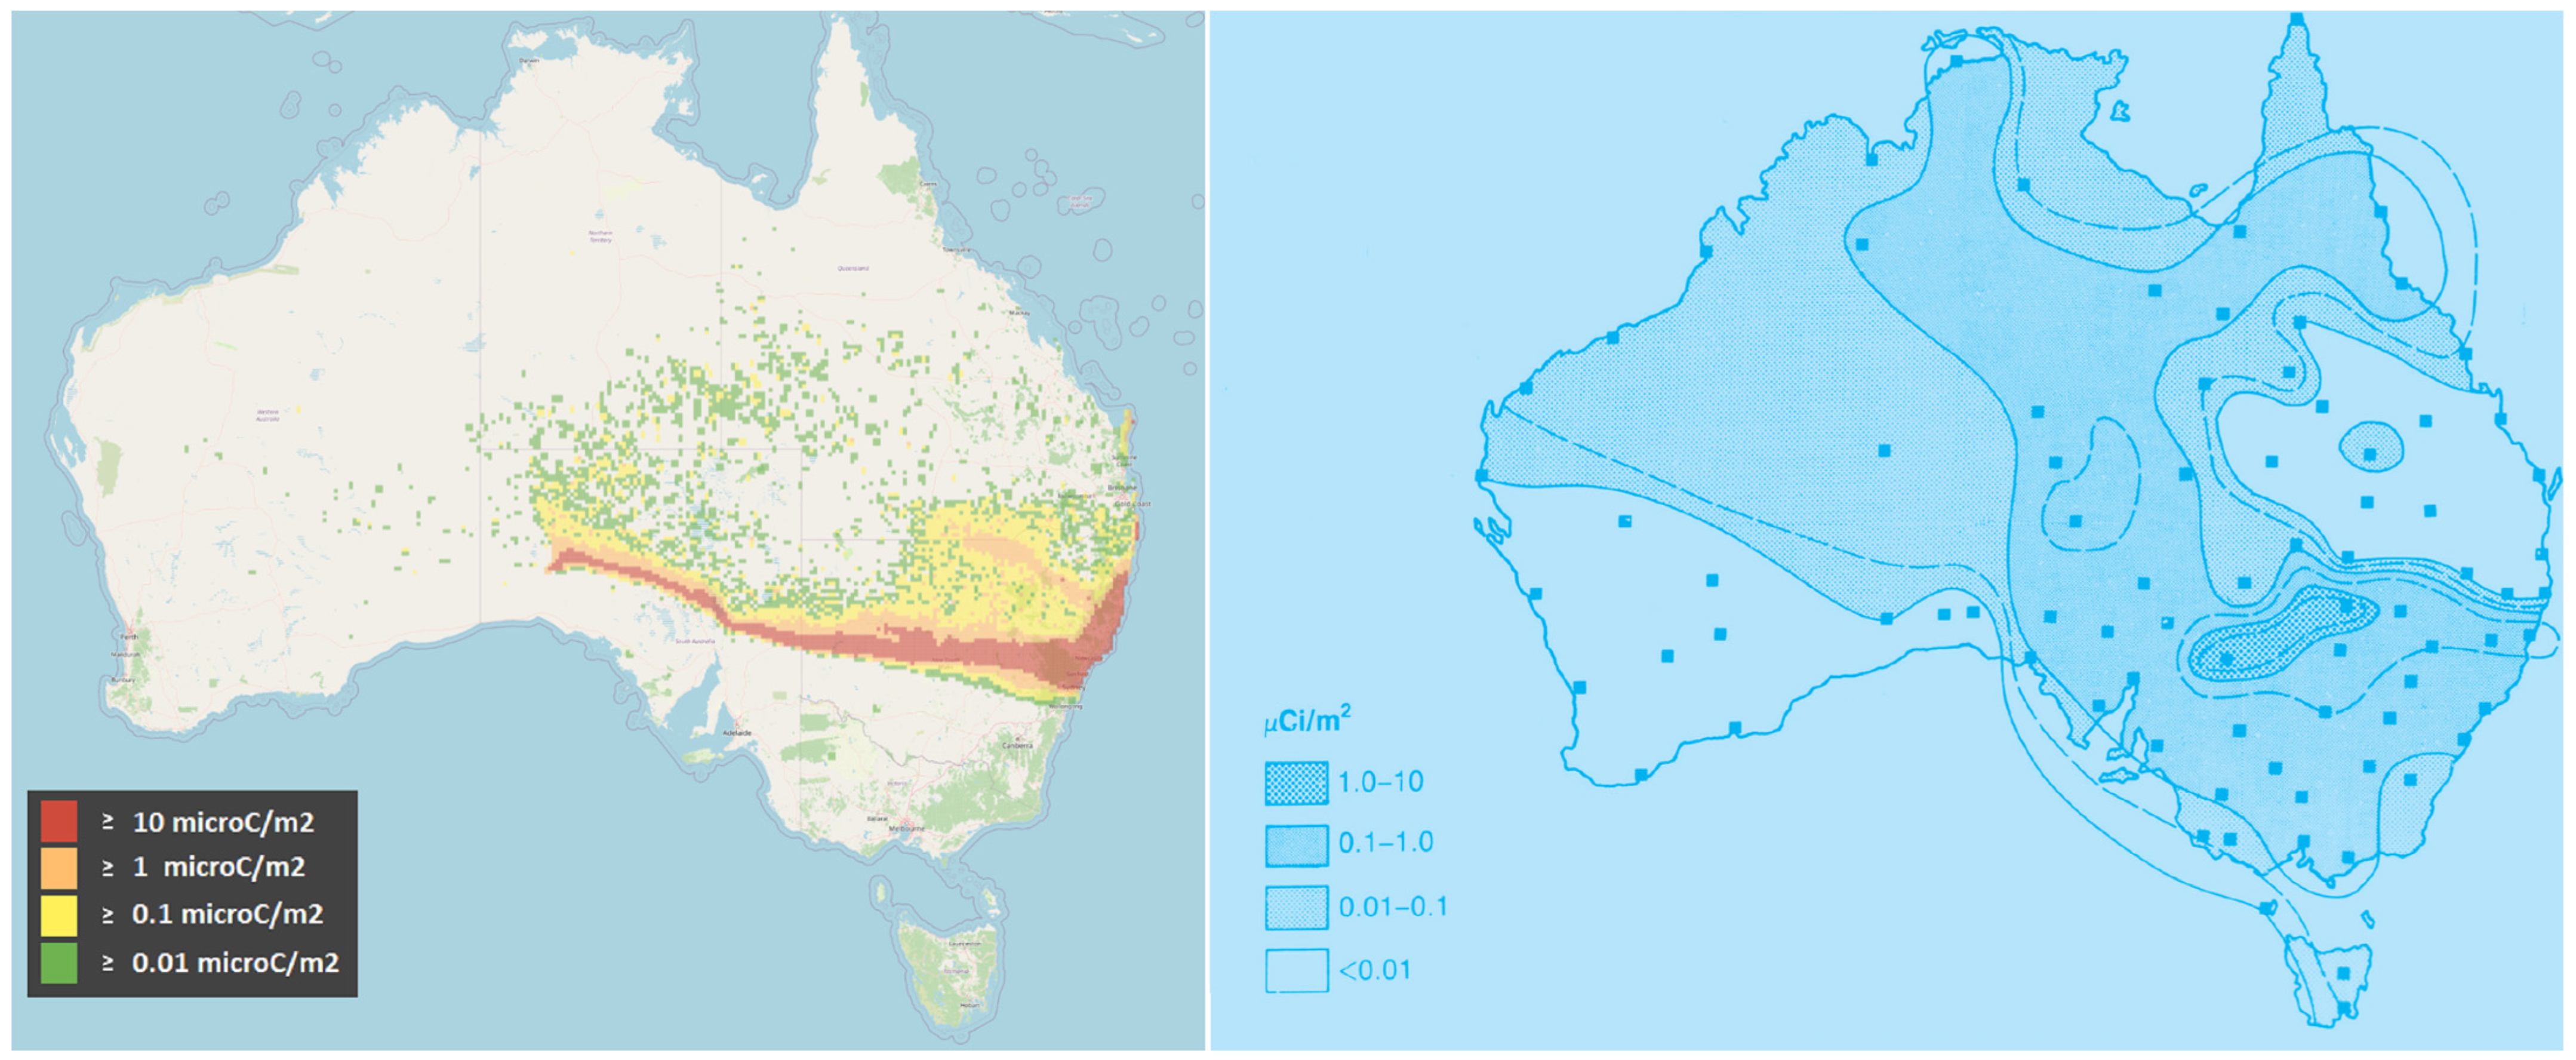
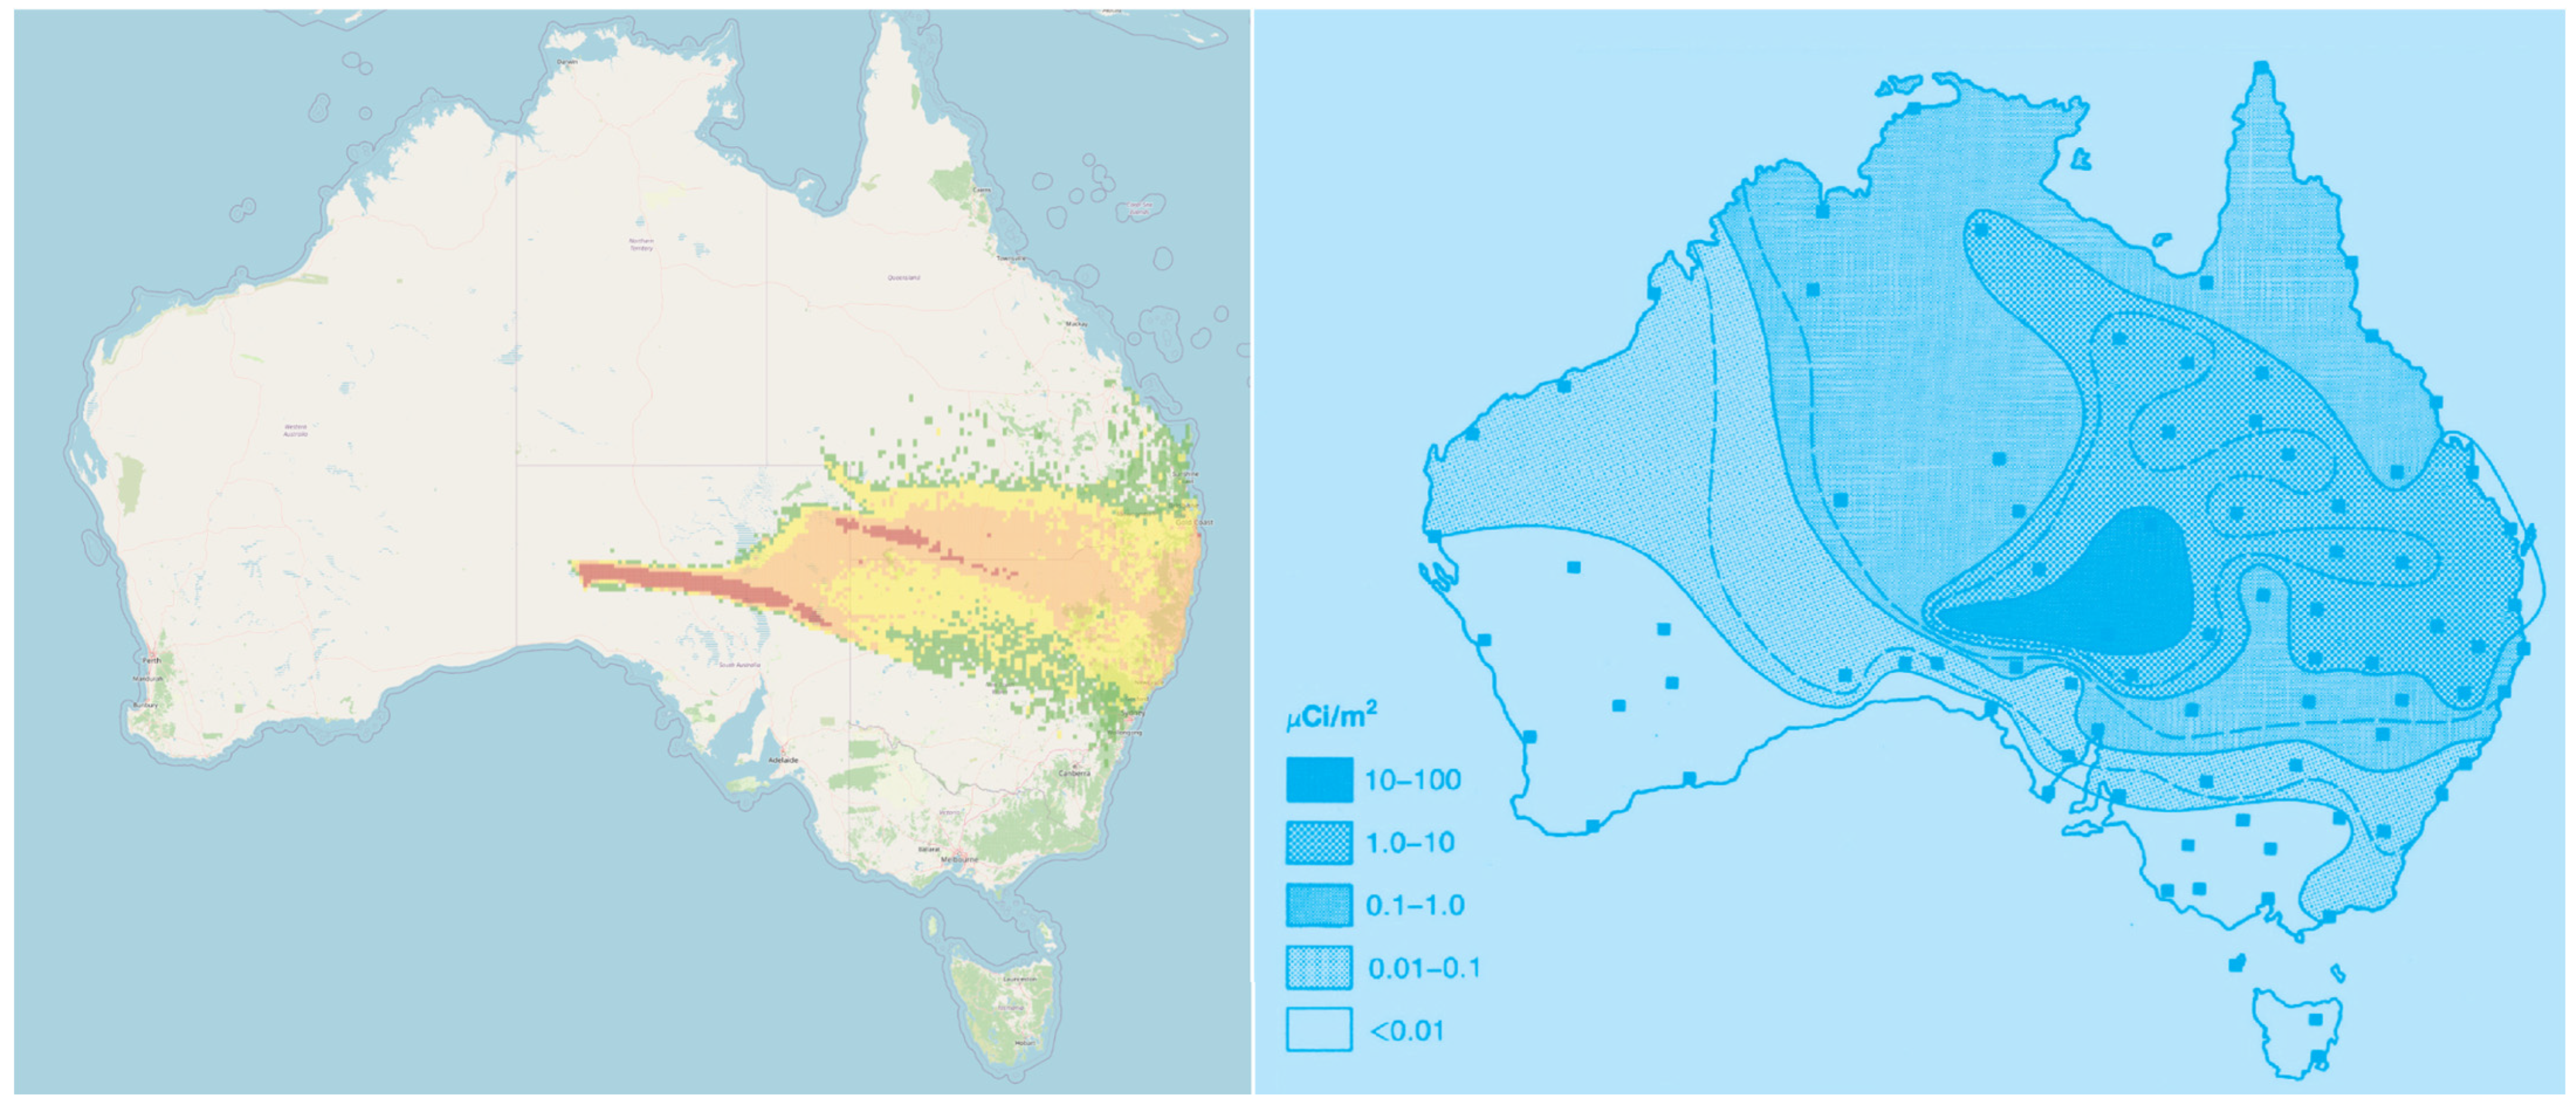
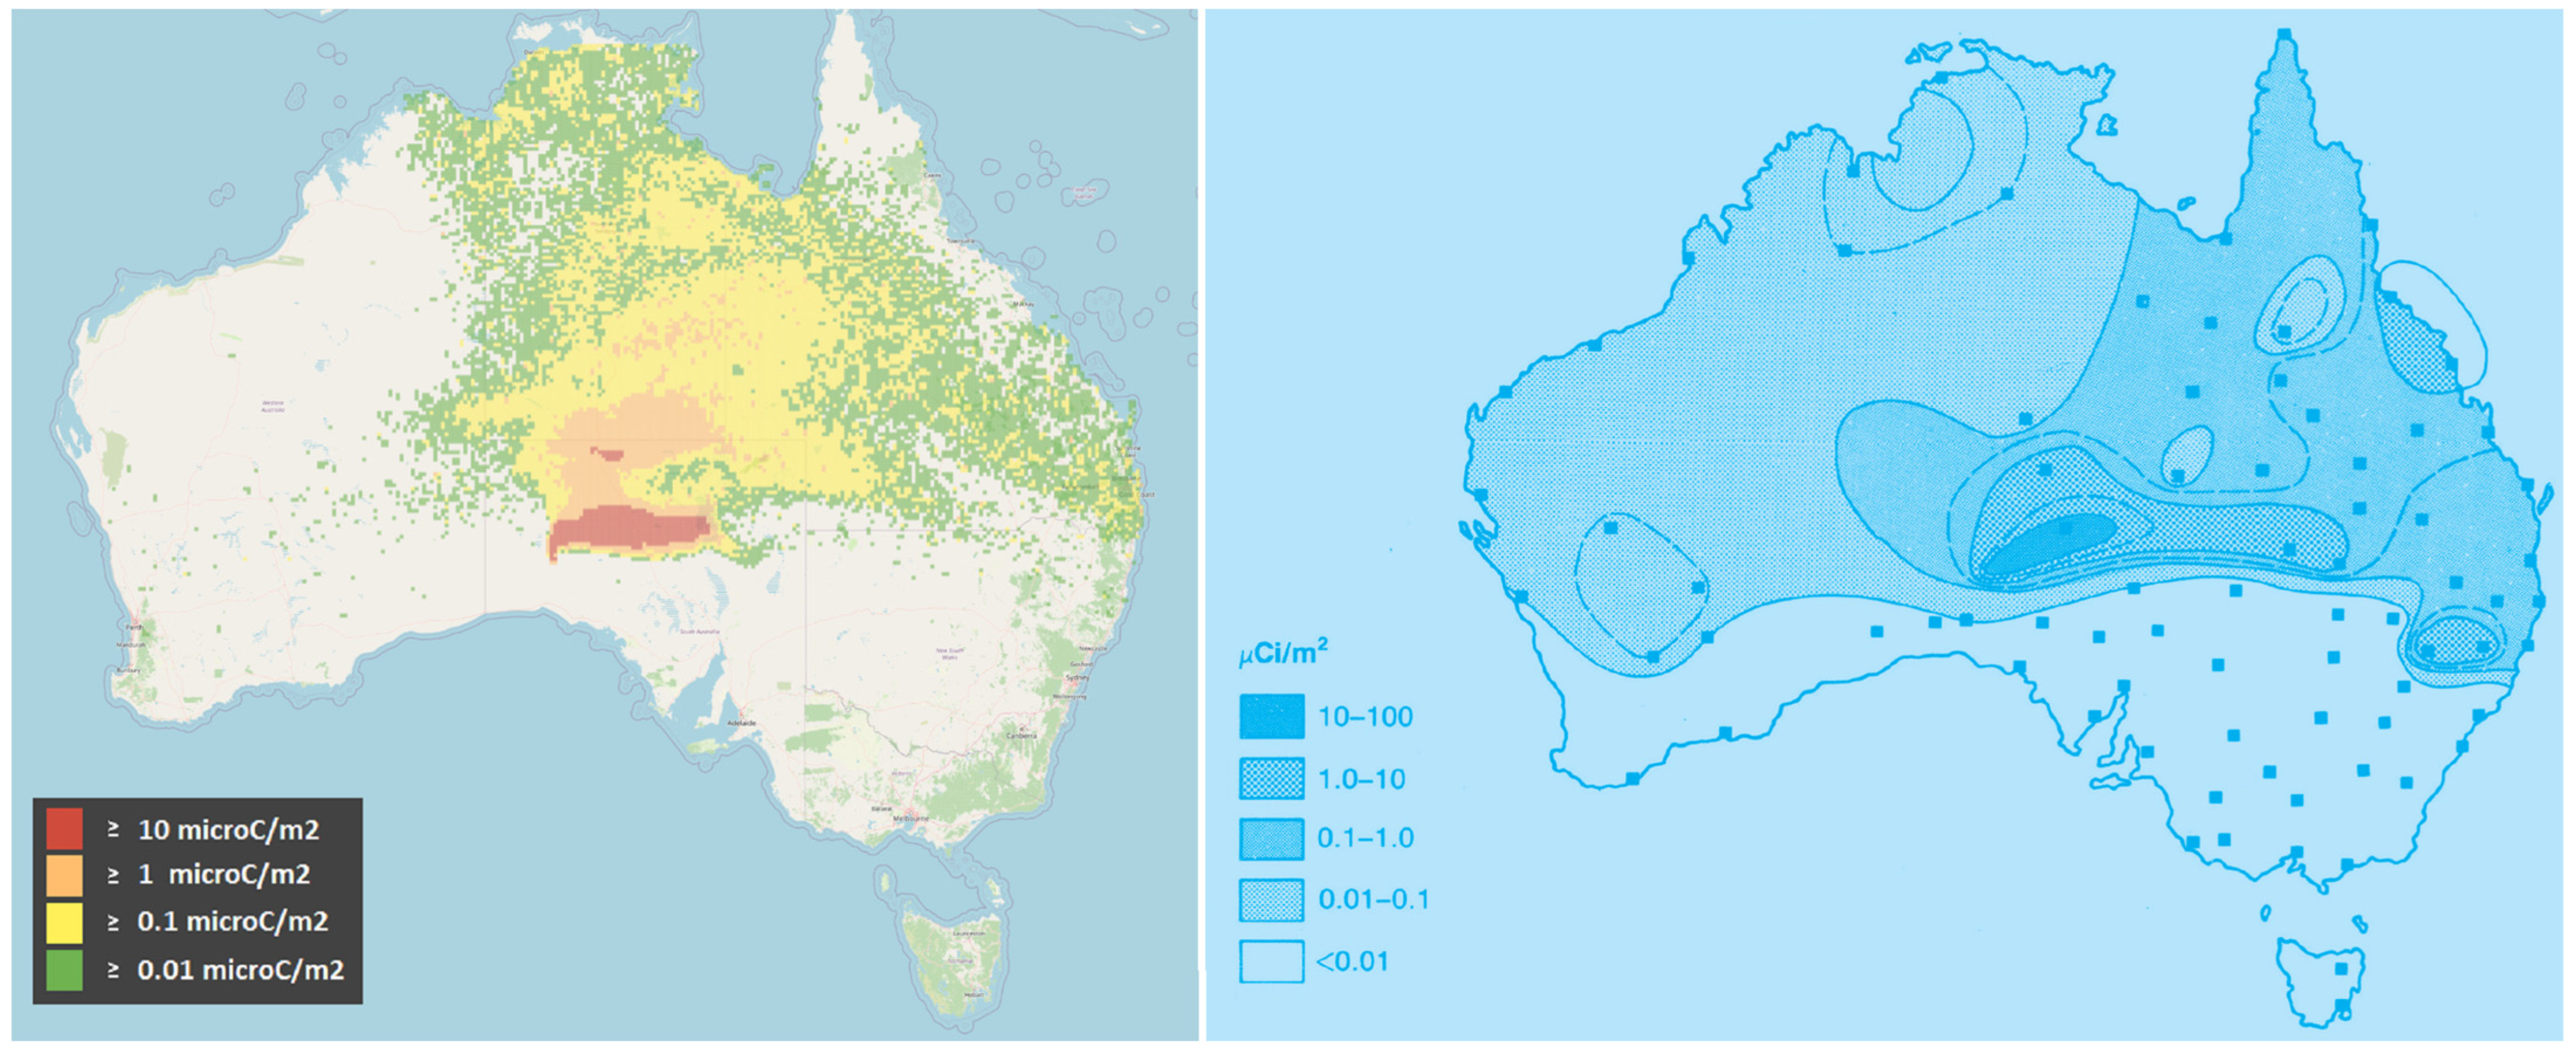
The comparison of the implemented mushroom cloud model with historical nuclear tests is based on measured radioactive fallout extending from the near field around ground zero to distances of approximately 1000–2000 km. Fallout measurements were collected as daily samples at 85 population centers during the Buffalo and Antler test series. These centers are displayed as dots on the right-hand sides of Figure 4, Figure 5, Figure 6 and Figure 7. Deposition was measured by exposing a horizontal strip of adhesive film for a 24 h period. This sampling method has several limitations, including a relatively small collection area, which introduces variability in the measured activity, and reduced collection efficiency during rainfall. Nevertheless, the measurements covered the entire Australian continent and were performed consistently for all tests. The reported fallout values can therefore be interpreted as representing the total deposited activity, summed over all radionuclides.
For model comparison, we use the total integrated ground deposition, summed over all radionuclides and simulated over the terrain. Deposition was modeled for a period of 7 days following each detonation, corresponding to the interval during which nearly all measurable fallout activity was deposited. The modeled deposit is underestimated by about 20–30% due to the limited number of included radionuclides, as explained earlier.
The atmospheric transport calculations were performed using the Lagrangian particle model implemented in the ESTE system. The horizontal resolution was set to 13.5 km, and 1.1 million computational particles were used. The comparison focuses on three aspects relevant to emergency response:
  • Comparison of the sizes of impacted regions
  • Comparison of geographical location, quantified by the spatial overlap between modeled and observed impacted regions.
  • Comparison of transport distances, defined by the maximum extent of impacted areas from the test site
The second analysis addresses the geographical overlap between calculated and observed impacted areas. This overlap for a threshold level thr is defined as:
O V   ( t h r ) = Area m o d e l   t h r     Area m e a s   ( t h r ) Area m e a s   ( t h r )   .
Here, Areameas (thr) is the area where the measured values exceed the threshold level thr. Areamodel (thr) is the area where the modeled values exceed the threshold level thr. The numerator represents the area of the region where both the measured and modeled values exceed the threshold level thr.
Published maps of impacted regions [23,24] were used at three levels of surface contamination: 10–100 μCi·m−2, 1–10 μCi·m−2, and 0.1–1 μCi·m−2. The conversion factor used is 1 Ci = 3.7 × 10¹⁰ Bq.
The proposed mushroom cloud model includes two particle size distributions; however, for pure air-burst cases (Antler 3 and Buffalo 3), only a single distribution is present. Initial assumptions for the median diameter and geometric standard deviation of this distribution resulted in poor agreement with the observed fallout patterns. One plausible explanation is that interactions between particles in the mushroom cloud during atmospheric transport modify the initial size spectrum, leading to an effective size distribution that differs from that at formation.
In the present work, this complexity is represented in a simplified manner by retaining a fixed geometric standard deviation and varying only the median particle diameter. The results obtained for various median particle diameters are summarized in Table 3, with the average overlap between calculated and observed impacted regions, and the average ratios of modeled to observed impacted area (both parameters aggregated over the three contamination levels). The best agreement with observations was obtained for median aerodynamic diameters in the range 3–5 μm.
For the ground-burst cases, using the originally assumed coarse-debris size distribution with a median diameter of 100 μm again resulted in very low overlap between the calculated and observed fallout patterns. The main discrepancy arose from the presence of very large particles, which deposited substantial activity in the immediate vicinity of ground zero but contributed very little deposition at greater distances. To better understand this behavior, we analyzed the sensitivity of the calculated fallout to the median diameter of the coarse-debris mode. The fine-aerosol component, which is also present in ground bursts, was kept fixed at the values determined by the air-burst analysis.
Similar to the fine-aerosol component, the coarse-debris distribution provided the best agreement with observed ground-fallout patterns when a median diameter of 4.0 μm was assumed. This indicates that the effective median diameter of particles transported over large distances is substantially smaller than the initially assumed coarse-debris value. Our findings suggest a more complex behavior within the mushroom cloud: the activity-bearing aerosol effectively follows a single size distribution, and very large particles, if present, carry only a minor fraction of the total activity, as they deposit rapidly near ground zero.
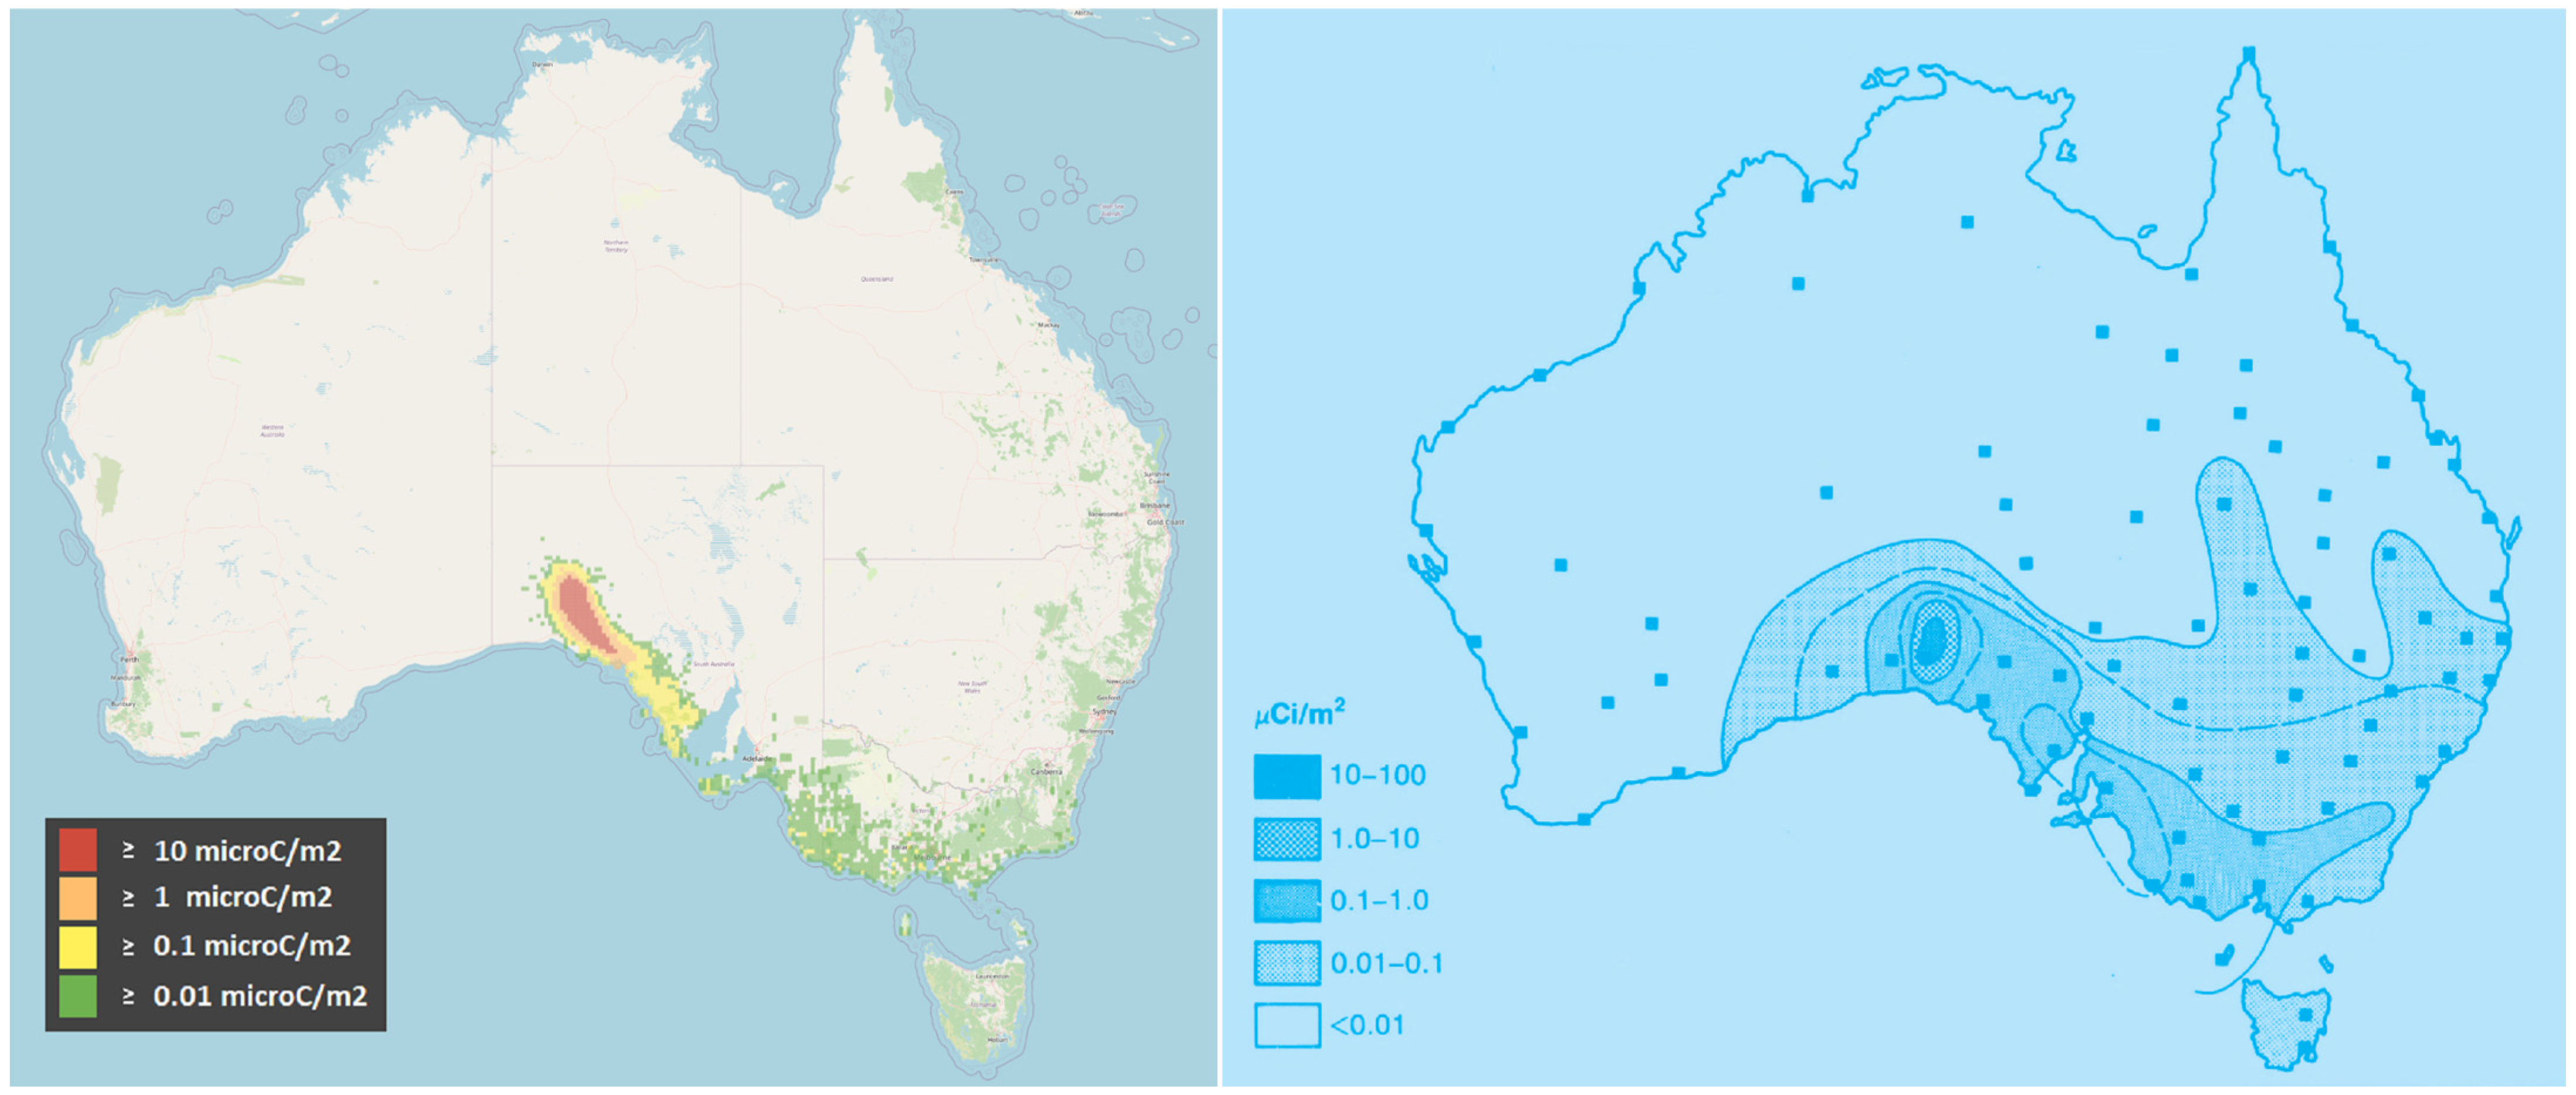
The overall model–measurement comparisons are summarized in Table 4, Table 5 and Table 6. Table 4 lists the calculated impacted areas for all three fallout levels. Averaged over all four tests, the ratio of modeled to observed impacted area is 0.8, indicating an average underestimation of approximately 20%. This suggests that the model slightly underestimates the spatial extent of contaminated regions. In the specific case of Buffalo 4, the calculated impacted region is substantially narrower than observed, corresponding to modeled areas that are roughly 3–5 times smaller than the observed ones. The calculated and observed geographical distributions of the radioactive fallout for all four nuclear tests are shown in Figure 4, Figure 5, Figure 6 and Figure 7, highlighting both the agreement and discrepancies between modeled and measured deposition patterns.
The overlap analysis is summarized for each fallout level and nuclear test in Table 5. The mean overlap across all tests is 0.3. Although low in absolute terms, this value can still be considered acceptable given that this type of comparison is very stringent. Achieving values near 1.0 (i.e., near-complete spatial agreement) would require that all model parameters and the meteorological data are based on ERA5 reanalyses for 1956–1957, a period without modern observing systems such as satellites. Despite these limitations, the air-burst cases, Buffalo 3 and Antler 3, reach overlap values approaching 0.5, whereas Buffalo 4 and Antler 2 again exhibit lower agreement with observations (approaching the value of 0.2).
The final analysis examines calculated impact distances, evaluated for all three fallout levels and summarized in Table 6. Unlike area and overlap comparisons, which rely solely on land-based measurements, distances are constrained by the finite size of Australia. While this limits assessment in some directions, the resulting values remain comparable and do not indicate major inconsistencies. For regions where deposition would likely have extended beyond the coastline but was unmeasured over the ocean, the symbol “>2000” is used in the table.
For Buffalo 3, modeled distances are generally slightly overestimated by a factor of 2. In contrast, Antler 2 and Buffalo 4 show an underestimation of impact distances by approximately 30%. The only notable discrepancy occurs for Antler 3 at the highest contamination level (>10.0 μCi·m−2), where the model predicts fallout that is not observed in the measurement data.
In summary, (i) the modeled impacted areas are underestimated by 20%, on average; (ii) the overlap is approaching 0.5 for regions with higher fallout, and it is decreasing for regions with lower fallout; and (iii) distances are, on average, underestimated by about 30%. That is, the calculated contaminated regions are generally smaller and shorter than observed. Despite this systematic bias, the results are considered acceptable, as the mean behavior remains within a factor of two. Two notable discrepancies were identified: for Antler 3, the model predicts fallout levels above 10.0 μCi·m−2 that are not supported by the measurements, representing an overestimation; for Buffalo 4, the calculated impacted regions are substantially narrower and smaller than observed, constituting a clear underestimation of the fallout footprint.
The main sources of uncertainty include: (i) limited observational basis and the associated uncertainties in the ERA5 reanalysis fields for 1956–1957; (ii) the simplified, time-integrated mushroom-cloud parametrization, which employs a single effective particle-size distribution and idealized geometry; and (iii) measurement limitations, such as restricted spatial coverage and the collection efficiency of the fallout sampling strips. Sensitivity tests indicate that the assumed median aerodynamic diameter of the activity-bearing aerosol (1–5 μm) and the cloud-top height parametrization are particularly influential for the spatial extent of deposition. Given these uncertainties, agreement within approximately a factor of two in both impacted area and distance is considered adequate for applications such as emergency response and cross-border impact assessment, rather than for detailed forensic reconstruction of individual tests.

5. Summary

A parameterized methodology for modeling the source term of atmospheric nuclear weapon detonations has been developed and implemented in the ESTE decision support system. The approach combines a simplified but physically based mushroom cloud model, a pre-calculated radionuclide inventory parameterized by total yield and fission fraction, and a Lagrangian particle dispersion model extended to the upper troposphere and lower stratosphere. The present module is not intended for detailed, case-specific forensic reconstructions of historical nuclear tests, nor for resolving near-field blast or prompt radiation effects.
The model was evaluated against four British nuclear tests from the Buffalo and Antler series at Maralinga in the 1950s, using ERA5 reanalysis data to drive transport. Calculated cloud-top heights were of the correct order of magnitude, with better agreement for air bursts than for ground bursts—a conservative outcome with respect to near-field deposition. Comparison of simulated seven-day integrated ground deposition with historical fallout measurements across Australia showed reasonable agreement in impacted area, range, and spatial overlap, particularly when an aerosol median AED of about 4 μm was used for the air-burst cases.
From a modeling perspective, three main features stand out. First, air-burst cases are reproduced more accurately than ground bursts, reflecting limitations of the simple cloud-top parametrization for strongly surface-coupled events. Second, the originally assumed particle size distributions (as found in earlier works) are not necessarily adequate particle size distributions for atmospheric transport modeling on large distances (beyond the distance of 20–50 km), especially when not exactly considering (i) the interaction with surface materials, and (ii) potential further atmospheric interaction within the stabilizing cloud. The particle size distribution for transport modeling in the presented work was adjusted to provide the best compromise between impacted area, range, and spatial overlap. Third, the model performance within a factor of approximately two in impacted area and range (with a systematic underestimation of about 30%) is sufficient for rapid screening, prioritization of protective actions, and international notifications under realistic uncertainty conditions.
In further improvement of the model, we also identified the need for extension of the list of considered radionuclides (especially considering the ground-activation nuclides and also short-lived fission products) to reduce the underestimation of the calculated fallout and radiological parameters, mainly within the first 24 h after the event. It also includes an improved ground-interaction description for ground bursts, which would provide a better understanding of particle size distribution. Furthermore, a principal enhancement of the model towards intermediate yields (above 100 kt TNT) is expected, solving the mushroom cloud penetration into the lower stratosphere, i.e., tropopause overshoot, whose validation goes beyond the scope of the Maralinga nuclear tests, though.
The presented results indicate that the implemented source-term and mushroom-cloud model provides a computationally efficient and physically consistent framework for rapid assessment of medium and long-range radiological consequences of atmospheric nuclear detonations. It is particularly suitable for governmental emergency response at regional to continental scales, while detailed near-field effects, particle-size evolution, and fine-scale meteorology remain outside its scope and should be addressed with more specialized models where required.

Author Contributions

Conceptualization, M.M. (Michal Marčišovský), Ľ.L., P.Č., E.F., M.M. (Mária Marčišovská), M.C. and M.K.; methodology, M.M. (Michal Marčišovský), Ľ.L. and P.Č.; software, Ľ.L., M.C. and P.Č.; validation, M.M. (Michal Marčišovský), Ľ.L., P.Č. and E.F.; formal analysis, M.M. (Michal Marčišovský), Ľ.L., P.Č., E.F., M.M. (Mária Marčišovská) and M.K.; investigation, M.M. (Michal Marčišovský), Ľ.L., P.Č., E.F., M.M. (Mária Marčišovská) and M.K.; resources, M.M. (Michal Marčišovský), Ľ.L., P.Č., E.F. and M.M. (Mária Marčišovská); writing—original draft preparation, Ľ.L., M.M. (Michal Marčišovský), P.Č., E.F., M.M. (Mária Marčišovská) and M.K.; visualization, Ľ.L., E.F. and M.C.; supervision, M.M. (Michal Marčišovský), Ľ.L., P.Č., E.F. and M.M. (Mária Marčišovská). All authors have read and agreed to the published version of the manuscript.

Funding

This research was funded by the Slovak Research and Development Agency (The Ministry of Education, Research, Development and Youth of the Slovak Republic), grant number APVV-23-0667. The research was also co-funded by internal resources of the company ABmerit, Ltd., where the authors are employed.

Institutional Review Board Statement

Not applicable.

Informed Consent Statement

Not applicable.

Data Availability Statement

The data of this analysis are not publicly available.

Conflicts of Interest

All authors were employed by the company ABmerit Ltd. The authors declare no conflicts of interest.

Abbreviations

The following abbreviations are used in this manuscript:
ABLAtmospheric Boundary Layer
AEDAerodynamic Equivalent Diameter
DSSDecision support system
ECMWFEuropean Center for Medium-Range Weather Forecasts
ERA5ECMWF Reanalysis 5th generation
ESTEEmergency Source Term Evaluation decision support system
LPMLagrangian Particle Model

References

  1. Lipták, Ľ.; Fojcíková, E.; Krpelanová, M.; Fabová, V.; Čarný, P. The ESTE Decision Support System for Nuclear and Radiological Emergencies: Atmospheric Dispersion Models. Atmosphere 2021, 12, 204. [Google Scholar] [CrossRef] [Scilit]
  2. Defense Threat Reduction Agency. HPAC User’s Guide; DTRA: Alexandria, VA, USA, 2001. [Google Scholar]
  3. Ehrhardt, J. The RODOS System: Decision Support for Off-Site Emergency Management in Europe. Radiat. Prot. Dosim. 1997, 73, 35–40. [Google Scholar] [CrossRef] [Scilit]
  4. Hoe, S.; McGinnity, P.; Charnock, T.; Gering, F.; Schou Jacobsen, L.H.; Havskov Sørensen, J.; Andersson, K.G.; Astrup, P. ARGOS Decision Support System for Emergency Management. In Proceedings of the 12th International Congress of the International Radiation Protection Association; Argentine Radiation Protection Society: Buenos Aires, Argentina, 2009. [Google Scholar]
  5. Chancellor, R.W. A Comparison of Hazard Predication and Assessment Capability (HPAC) Software Dose-Rate Contour Plots to a Sample of Local Fallout Data from Test Detonations in the Continental United States, 1945–1962. Ph.D. Thesis, Air Force Institute of Technology (AFIT), Dayton, OH, USA, 2005; p. 3735. Available online: https://scholar.afit.edu/etd/3735 (accessed on 10 March 2026).
  6. Norment, H.G. DELFIC: Department of Defense Fallout Prediction System. Volume I—Fundamentals; DNA 5159F-1; Atmospheric Science Associates: Bedford, MA, USA, 1979. [Google Scholar]
  7. Sugiyama, G.; Nasstrom, J.; Baskett, R.; Simpson, M. National Atmospheric Release Advisory Center (NARAC) Capabilities for Homeland Security; No. LLNL-CONF-425248; Lawrence Livermore National Laboratory (LLNL): Livermore, CA, USA, 2010. Available online: https://www.osti.gov/biblio/992759 (accessed on 10 March 2026).
  8. Axelsson, A.; Kock, P.; Johansson, J.; Lindgren, J.; Blixt Buhr, A.M.; Boson, J.; Bäverstam, U.; Karlsson, S. Radiological Consequences of Fallout from Nuclear Explosions; Report; Swedish Radiation Safety Authority: Stockholm, Sweden, 2023. [Google Scholar]
  9. Auxier, J.P.; Auxier, J.D.; Hall, H.L. Review of current nuclear fallout codes. J. Environ. Radioact. 2017, 171, 246–252. [Google Scholar] [CrossRef] [Scilit] [PubMed]
  10. Sørensen, J.H.; Møller, K.H.; Tølløse, K.S.; Robertson, L.; Persson, L.Å.; Vågberg, D.; Pehrsson, J.; Roed, H.; Senstius, E.P.; Syed, N.U.; et al. DISpersion of radioActivity fRom Nuclear boMbs (DISARM)—Final Report of Nordic Nuclear Safety Research, NKS-498; Nordic Nuclear Safety Research (NKS): Roskilde, Denmark, 2025; ISBN 978-87-7893-596-0. Available online: https://www.nks.org/en/nks_reports/view_document.htm?id=111010214699052 (accessed on 10 March 2026).
  11. Samuel, G.; Dolan Philip, J. The Effects of Nuclear Weapons; United States Department of Defense and the Energy Research and Development Administration: Washington, DC, USA, 1977; Available online: https://www.deepspace.ucsb.edu/wp-content/uploads/2013/01/Effects-of-Nuclear-Weapons-1977-3rd-edition-complete.pdf (accessed on 10 March 2026).
  12. Stohl, A.; Forster, C.; Frank, A.; Seibert, P.; Wotawa, G. Technical note: The Lagrangian particle dispersion model FLEXPART version 6.2. Atmos. Chem. Phys. 2005, 5, 2461–2474. [Google Scholar] [CrossRef] [Scilit]
  13. Stein, A.F.; Draxler, R.R.; Rolph, G.D.; Stunder, B.J.B.; Cohen, M.D.; Ngan, F. NOAA’s HYSPLIT atmospheric transport and dispersion modeling system. Bull. Amer. Meteor. Soc. 2015, 96, 2059–2077. [Google Scholar] [CrossRef] [Scilit]
  14. Wise, K.N.; Moroney, J.R. Public Health Impact of Fallout from British Nuclear Weapons Testsin Australia, 1952–1957; ARL/Tr105; Australian Radiation Laboratory: Yallambie, Australia, 1992. [Google Scholar]
  15. Morton, B.R.; Taylor, G.I.; Turner, J.S. Turbulent gravitational convection from maintained and instantaneous sources. Proc. A 1956, 234, 1–23. [Google Scholar] [CrossRef] [Scilit]
  16. Arthur, R.S.; Lundquist, K.A.; Mirocha, J.D.; Neuscamman, S.; Kanarska, Y.; Nasstrom, J.S. Simulating nuclear cloud rise within a realistic atmosphere using the Weather Research and Forecasting model. Atmos. Environ. 2021, 254, 118363. [Google Scholar] [CrossRef] [Scilit]
  17. Storebo, P.B. Formation of radioactivity size distributions in nuclear bomb debris. J. Aerosol Sci. 1974, 5, 557–577. [Google Scholar] [CrossRef] [Scilit]
  18. Turco, R.P.; Toon, O.B.; Ackerman, T.P.; Pollack, J.B.; Sagan, C. Nuclear winter: Global consequences of multiple nuclear explosions. Science 1983, 222, 1283–1292. [Google Scholar] [CrossRef] [Scilit] [PubMed]
  19. McGuffin, D.L.; Lucas, D.D.; Langer, B.; Knight, K.B. Super-Droplet Method to Simulate Lagrangian Microphysics of Nuclear Fallout in a Homogeneous Cloud. J. Geophys. Res. Atmos. 2022, 127, e2022JD036599. [Google Scholar] [CrossRef] [Scilit]
  20. Legras, B.; Joseph, B.; Lefevre, F. Vertical diffusivity in the lower stratosphere from Lagrangian back-trajectory reconstructions of ozone profiles. J. Geophys. Res. Atmos. 2003, 108, 4562. [Google Scholar] [CrossRef] [Scilit]
  21. Beck, H.L.; Bouville, A.; Simon, S.L.; Anspaugh, L.R.; Thiessen, K.M.; Shinkarev, S.; Gordeev, K. A Method for Estimating the Deposition Density of Fallout on the Ground and on Vegetation from a Low-yield, Low-altitude Nuclear Detonation. Health Phys. 2022, 122, 21–53. [Google Scholar] [CrossRef] [Scilit] [PubMed] [PubMed Central]
  22. Hanna, S.R.; Briggs, G.A.; Hosker, R.P. Handbook on Atmospheric Diffusion; Tech Rep DOE-TIC-11223; Office of Energy Research, U.S. Department of Energy: Washington, DC, USA, 1982. [Google Scholar]
  23. Butement, W.A.S.; Dwyer, L.J.; Martin, L.H.; Stevens, D.J.; Titterton, E.W. Radioactive fallout in Australia from Operation Buffalo. Aust. J. Sci. 1958, 21, 63. [Google Scholar]
  24. Dwyer, L.J.; Martin, J.H.; Stevens, D.J.; Titterton, E.W. Radioactive fallout in Australia from operation ‘ANTLER’. Aust. J. Sci. 1959, 22, 97–106. [Google Scholar]
Figure 1. Schematic representation of the nuclear mushroom cloud.
Atmosphere 17 00295 g001
Figure 2. Integrated wind-field trajectories at 1500 m above ground level, initialized at the locations and times of the studied tests using ECMWF ERA5 reanalysis data.
Atmosphere 17 00295 g002
Figure 3. Observed trajectories of radioactive clouds across Australia during the Antler and Buffalo test series, as reported in [11].
Atmosphere 17 00295 g003
Figure 4. Modeled (left) and observed (right) geographical patterns of radioactive fallout following the Buffalo 3 test. The squares on the right side are measurement points.
Atmosphere 17 00295 g004
Figure 5. Modeled (left) and observed (right) geographical patterns of radioactive fallout following the Antler 3 test. The squares on the right side are measurement points.
Atmosphere 17 00295 g005
Figure 6. Modeled (left) and observed (right) geographical patterns of radioactive fallout following the Buffalo 4 test. The squares on the right side are measurement points.
Atmosphere 17 00295 g006
Figure 7. Modeled (left) and observed (right) geographical patterns of radioactive fallout following the Antler 2 test. The squares on the right side are measurement points.
Atmosphere 17 00295 g007
Table 1. List of radionuclides considered in radiological impact calculations.
Kr85mSr89Zr95Ru105Te127I132Xe133Cs137Ce143Pu241
Kr85Sr90Zr97Ru106Te129mI133Xe135Cs138Ce144
Kr87Sr91Nb95Rh103mTe129I134Xe135mBa140Np239
Kr88Y90Mo99Rh105Te131mI135Xe138La140Pu238
Rb86Y91mTc99mSb127Te132Xe131mCs134Pr143Pu239
Rb88Y91Ru103Sb129I131Xe133mCs136Ce141Pu240
Table 2. Basic parameters and specifications of the nuclear tests used in the model validation, taken from [14]. The corresponding calculated cloud heights are included for comparison.
Series + RoundDate and Time (UTC)Altitude [m]Yield
[kt TNT]
Observed Cloud Height [m]Calculated Cloud Height [m]
Antler 225 September 1957, 0:30:003164600 m and 7300 m4800 m
Antler 39 October 1957, 6:45:0030026.63000 m and 7000 m8100 m
Buffalo 311 October 1956, 5:57:0015032100 m and 3700 m3600 m
Buffalo 421 October 1956, 14:35:00311011,000 m5800 m
Table 3. The evaluated overlap between calculated and observed impacted regions, and the evaluated average ratios of modeled to observed impacted area mean overlap ratio as a function of median particle diameter (aggregated over the three contamination levels and over Buffalo 3 and Antler 3).
Median   d g , f [µm]Mean Area Ratio Mean Overlap Ratio
10.010.003
20.40.01
31.30.16
41.20.43
50.90.33
60.60.22
Table 4. Calculated areas of radioactive fallout deposition for multiple contamination levels, and their comparison with the observed impacted regions. Simulations were performed using a particle distribution with a median aerodynamic diameter of 4 μm.
Above 10.0 µC/m2 Above 1.0 µC/m2Above 0.1 µC/m2
Series + RoundCalculated Area [km2]Compared to ObservationCalculated Area [km2]Compared to ObservationCalculated Area [km2]Compared to Observation
Antler 269,1001.3318,6000.51,566,1000.6
Antler 3168,000-335,3003.0695,5000.2
Buffalo 322,2001.742,7001.0103,2000.2
Buffalo 463,4000.3467,5000.2859,1000.2
Table 5. Geographical overlap OV (as defined in Equation (13)) between calculated and observed impacted regions for different surface contamination levels.
Series + RoundAbove 10.0 µC/m2 Above 1.0 µC/m2Above 0.1 µC/m2
Antler 20.20.30.2
Antler 3-0.40.2
Buffalo 30.80.60.1
Buffalo 40.10.20.2
Mean0.40.40.2
Table 6. Modeled and observed transport distances (in km) of impacted regions at different contamination levels.
Above 10.0 µC/m2 Above 1.0 µC/m2Above 0.1 µC/m2
Series + RoundModeledObservedModeledObservedModeledObserved
Antler 25706701200>2000>1800>2000
Antler 3>2000->2000≈1500>2000>2000
Buffalo 3280≈100340≈17012001850
Buffalo 41200950>2000>2000>2000>2000
Disclaimer/Publisher’s Note: The statements, opinions and data contained in all publications are solely those of the individual author(s) and contributor(s) and not of MDPI and/or the editor(s). MDPI and/or the editor(s) disclaim responsibility for any injury to people or property resulting from any ideas, methods, instructions or products referred to in the content.