


Abstract
Day-to-day temperature variability (DTD) significantly affects human health and ecosystems, yet its representation in major reanalysis datasets has not been systematically evaluated. This study assesses the ability of four widely used reanalysis datasets, namely ERA-Interim, ERA5, JRA-55, and MERRA-2, against station observations to capture DTD’s spatial and temporal characteristics. All four datasets broadly reproduce the observed spatial pattern of DTD but generally underestimate its magnitude globally, except over eastern China. JRA-55 performs better at low-to-mid latitudes, while other datasets show closer agreement with observations at high latitudes. Regarding long-term trends, the reanalyses generally capture the observed pattern of decreasing DTD at high latitudes and increasing DTD at mid-low latitudes, but they show trends opposite to observations in summer over Eurasia, the low latitudes, and the Southern Hemisphere. Skill is highest in winter and lowest in summer, with ERA5 and ERA-Interim performing the best overall. Using ERA5 for further analysis, it is suggested that the recent weakening in global extreme DTD intensity is offset by an increase in extreme-event frequency, with both exhibiting substantial regional and seasonal variability. These findings advance understanding of short-term temperature variability and provide guidance for risk assessment, early warning, and mitigation.
1. Introduction
Day-to-day temperature variability (DTD), an important indicator of short-term temperature variation within the climate system [1], exerts substantial influences on ecosystems, agricultural production, and human activities [2]. Notably, changes in DTD have been associated with increased mortality rates, with the magnitude of impact differing across latitudinal zones [3]. Despite these significant implications, previous studies have predominantly focused on long-term trends in mean temperature [4,5] or extreme temperature events [6,7], leaving DTD comparatively underexplored.
Multiple indicators have been developed to quantify the DTD, each reflecting different aspects of temperature fluctuations [8]. Common measures include the standard deviation, reflecting the overall spread of daily temperature [9], the one-day lagged autocorrelation, the measuring of temperature persistence [8,10], and the day-to-day temperature difference, defined as the change in temperature between two consecutive days [9,10]. Among these, the latter represents a particularly intuitive and informative measure, as it not only constitutes an essential component of the public perception of climate variability and change, but also demonstrates superior capability in characterizing short-term temperature variability, especially under a changing climate [1,10].
Both observations and reanalyses consistently reveal that the climatology of mean absolute DTD exhibits distinct zonal and seasonal patterns, with greater variability at high latitudes than at low latitudes and stronger variability in winter and spring than in other seasons [1,11]. This latitudinal amplification of DTD is primarily attributable to stronger wind and enhanced temperature advection in extratropical regions [10]. In addition, underlying surface properties, such as land–water contrasts [12], urbanization [13], and land-use changes [14], also modulate DTD. A particularly important yet underexamined factor is elevation. Compared to low-elevation regions, high-altitude environments often feature more heterogeneous boundary-layer regimes, enhanced free-tropospheric and synoptic influence, and snow-related changes in land–atmosphere coupling [15,16]. These factors may jointly yield a spatially dependent and potentially non-monotonic DTD–elevation relationship, warranting further investigation.
Regarding long-term trends in DTD, numerous studies [11,17] have documented a decreasing tendency at northern mid-to-high latitudes, accompanied by an increase at low-to-mid latitudes. This polarized trend structure is largely attributed to the anthropogenic increase in greenhouse gas (GHG) concentration, which weakens meridional temperature gradients [11]. At the regional scale, most of Europe [18] and northern China [9] exhibit an increasing DTD in summer but decreasing DTD in winter, whereas North America has experienced a consistent weakening trend in both seasons [19]. Moreover, recent research has extended trend analysis to extreme DTD events [20,21]. Zhou et al. [20], for instance, defined extreme DTD as DTD exceeding 10 °C and observed a significant decline in such events across most mid-to-high-latitude regions, except the central United States. However, given the substantial spatial heterogeneity inherent to DTD, fixed absolute thresholds are inadequate for global-scale analysis of extremes. Alternatively, the percentile-based threshold approach [22] provides a relative and spatially consistent metric that more effectively captures the spatiotemporal characteristics of extreme DTD events worldwide.
The assessment of temperature variability is highly sensitive to data sources, often leading to substantial discrepancies in spatiotemporal patterns. This data dependency has been well-documented in studies of both mean temperature [23] and temperature extremes [24]. While in situ observations are generally considered more reliable, their inherent limitations—such as sparse spatial coverage, temporal gaps, and uneven distribution—constrain their utility for global-scale analyses [25]. Reanalysis datasets, which integrate multi-source observations through data assimilation, have therefore become a widely adopted alternative for studying temperature variability and extremes across the globe [26]. However, significant inter-dataset differences arise from variations in assimilation methods, model physics, and input data sources [27]. Previous studies have compared reanalysis data with observations on a regional scale, providing useful insights [28,29], but a comprehensive understanding of how each dataset captures the characteristics of DTD remains an important unresolved issue at the global scale.
This study systematically compares multiple reanalysis datasets with station observations to evaluate their ability to represent day-to-day temperature variability (DTD) and characterize related extremes and topographic dependencies. We test three hypotheses (H): H1: Relative to point-based station observations, reanalyses tend to underestimate DTD magnitude because grid-box averaging and effective smoothing in gridded products can damp sharp spatial gradients and localized day-to-day temperature jumps. H2: Reanalysis skill in representing DTD shows pronounced latitudinal and seasonal dependence, and the performance of different reanalysis products varies across latitude bands. H3: DTD–elevation relationships are regime-dependent and may be non-monotonic, reflecting elevation-driven differences in boundary-layer structure and snow-related surface energetics.
The paper is structured as follows: Section 2 describes the datasets and methodologies employed. Section 3 evaluates the capability of reanalysis datasets to reproduce global land DTD characteristics in terms of climatology, long-term trends, and probability density functions, and further examines the elevation dependence of DTD and the characteristics of extreme DTD events. Section 4 addresses uncertainties in the observational data and discusses the potential drivers of DTD changes. Section 5 provides the limitations of this study. Finally, Section 6 summarizes the principal findings of the study.
2. Materials and Methods
2.1. Station-Based Observations
To comprehensively analyze the global DTD characteristics, this study utilizes a merged dataset derived from three station-based observational datasets to represent real observed values, including the China Meteorological Administration (CMA) (https://data.cma.cn/en (accessed on 17 January 2026)), the Global Surface Summary of the Day (GSOD) provided by the National Centers for Environmental Information (NCEI) (https://www.ncei.noaa.gov/data/global-summary-of-the-day/ (accessed on 17 January 2026)), and the Global Historical Climatology Network Daily (GHCND) from the National Oceanic and Atmospheric Administration (NOAA) (https://www.ncei.noaa.gov/data/global-historical-climatology-network-daily/ (accessed on 17 January 2026)) [30]. All station datasets were used following the official quality-control procedures implemented by the data providers; however, no further homogenization was performed in this study.
The preprocessing of the dataset involved several steps to ensure data consistency and quality. First, we examined the temporal coverage and completeness of records for all stations in each dataset, retaining only those with continuous records within the study period from 1 January 1980 to 31 December 2020. We defined a year as valid if it had fewer than 38 missing days, and ultimately retained only stations with more than 37 valid years (i.e., data coverage greater than 90%). Next, we selected land stations and eliminated duplicate records. For stations appearing across multiple datasets, the version with the most complete data was retained. After these preprocessing steps, a total of 5032 valid stations worldwide were included in the merged dataset (Figure S1), with 2308 stations from CMA, 2271 from GSOD, and 1336 from GHCN.
To address missing data within the merged dataset, we employed an interpolation method based on adjacent years. Specifically, for missing values on a given day, we first imputed the value using the average of the same date from the preceding and following years. If this value was unavailable, we sequentially searched forward or backward through the dataset until a valid record was found. Near the beginning or end of a station record, we used the mean of the nearest two subsequent (or prior) years, respectively.
To quantify the potential influence of imputation on DTD, we assessed the fraction of imputed daily values across the 5032 stations used in this study. The imputation ratio is small for the vast majority of stations: 4853 stations (96.4%) have an imputation ratio < 5%, 171 stations (3.4%) fall between 5% and 10%, and only eight stations (0.2%) exceed 10%. We further conducted a sensitivity analysis by recomputing DTD after excluding all day-to-day differences that involve any imputed day (“no-imputation”). As shown in Figures S2 and S3, the multi-annual climatology and trend patterns remain broadly consistent at large scales, and magnitude differences are generally small. We therefore retain the imputed dataset for the primary analyses to preserve continuous daily sampling, while documenting the robustness of the results to the imputation treatment.
2.2. Multi-Reanalysis Datasets
Four widely used reanalysis datasets, namely the third-generation (ERA-Interim) [31] and fifth-generation (ERA5) [32] global atmospheric reanalysis produced by the European Center for Medium-Range Weather Forecasts (ECMWF), the second Modern-Era Retrospective analysis for Research and Applications (MERRA-2) [33] released by NASA, and the Japanese 55-Year Reanalysis (JRA-55) [34] from the Japan Meteorological Agency, are evaluated in this study to benchmark their ability to capture short-term temperature variability.
These datasets employ distinct data assimilation systems and span different spatiotemporal ranges. Both ERA-Interim and ERA5 utilize a four-dimensional variational (4D-Var) method that integrates diverse satellite and in situ observations. ERA-Interim provides global data at 6-hourly intervals from 1979 to 2019, with a spatial resolution of 1.5° × 1.5°, while ERA5 represents a significant enhancement, offering hourly data on a 0.25° × 0.25° grid from 1940 to the present. MERRA-2, using the Goddard Earth Observing System (GEOS-5) for data assimilation, incorporates satellite-based aerosol observations to reduce biases in atmospheric parameters, particularly in regions with limited ground-based data. It provides hourly data at a spatial resolution of 0.5° × 0.625° from 1980 onward. JRA-55 also employs a 4D-Var system, augmented with variational bias correction, and offers data from 1958 to the present at a spatial resolution of 1.25° × 1.25°. Detailed information about these datasets is presented in Table 1.
Table 1.
Overview of the reanalysis datasets used in this study.
To facilitate a consistent comparison between reanalysis products and the merged station dataset, we sampled all reanalysis fields at the 5032 station locations using nearest-neighbor interpolation. This approach avoids additional spatial smoothing introduced by averaging across surrounding grid cells. A sensitivity test using ERA5 indicates that differences in DTD climatology between nearest-neighbor and bilinear interpolation are generally within ±0.1 °C (Figure S4). We therefore retain nearest-neighbor interpolation in the primary analysis, given its minimal sensitivity and its avoidance of interpolation-induced smoothing.
2.3. Methods
2.3.1. Day-to-Day Temperature Variability
Following the studies by Wu et al. [9] and Hamal and Pfahl [10], the day-to-day temperature variability (DTD) at a given station is defined as the difference between the near-surface daily mean air temperature of two consecutive days, and its climatological average () is calculated as the mean of the absolute differences in DTD over a specified period, because its absolute value quantifies the magnitude of intense synoptic- or mesoscale-driven temperature changes regardless of sign. Thus, provides an appropriate baseline measure of the overall strength of short-term temperature variability.
where and represent the near-surface daily mean air temperatures on day d and the previous day d − 1, respectively. n denotes the number of days within the specified time period.
2.3.2. Frequency and Intensity of Extreme DTD Events
Following the definition of extreme climate indices [35], values below the fifth percentile (DTD5) and above the 95th percentile (DTD95) at each grid point over 1980–2022 are used as thresholds for sudden day-to-day temperature decrease (DTDD) and increase (DTDI) events, respectively. For each year with days, let represent the daily DTD value (i = 1, …, ). The indicator function is defined as follows:
where takes the value five or 95. The number of extreme events and the intensity are then given by the following:
When = 5, and represent the number and mean intensity of DTDD, respectively. When 5, and represent the number and mean intensity of DTDI. Note that baseline choices can influence diagnosed trends [36] and the trends reported here for DTDD/DTDI; therefore, quantify changes in exceedance relative to the fixed 1980–2020 reference period, rather than implying stationarity of extremes.
Furthermore, to quantify the long-term changes in DTD indices from 1980 to 2020, we calculated the linear trends using ordinary least square (OLS) regression. The statistical significance of these trends was assessed by Student’s t-test at the 95% confidence level (p < 0.05).
3. Results
3.1. Climatology Mean
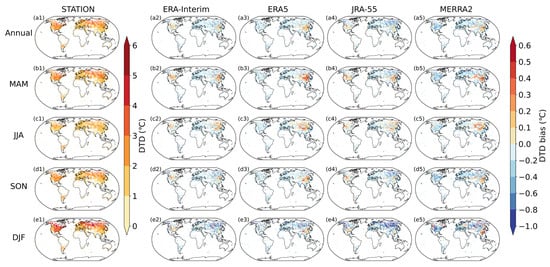
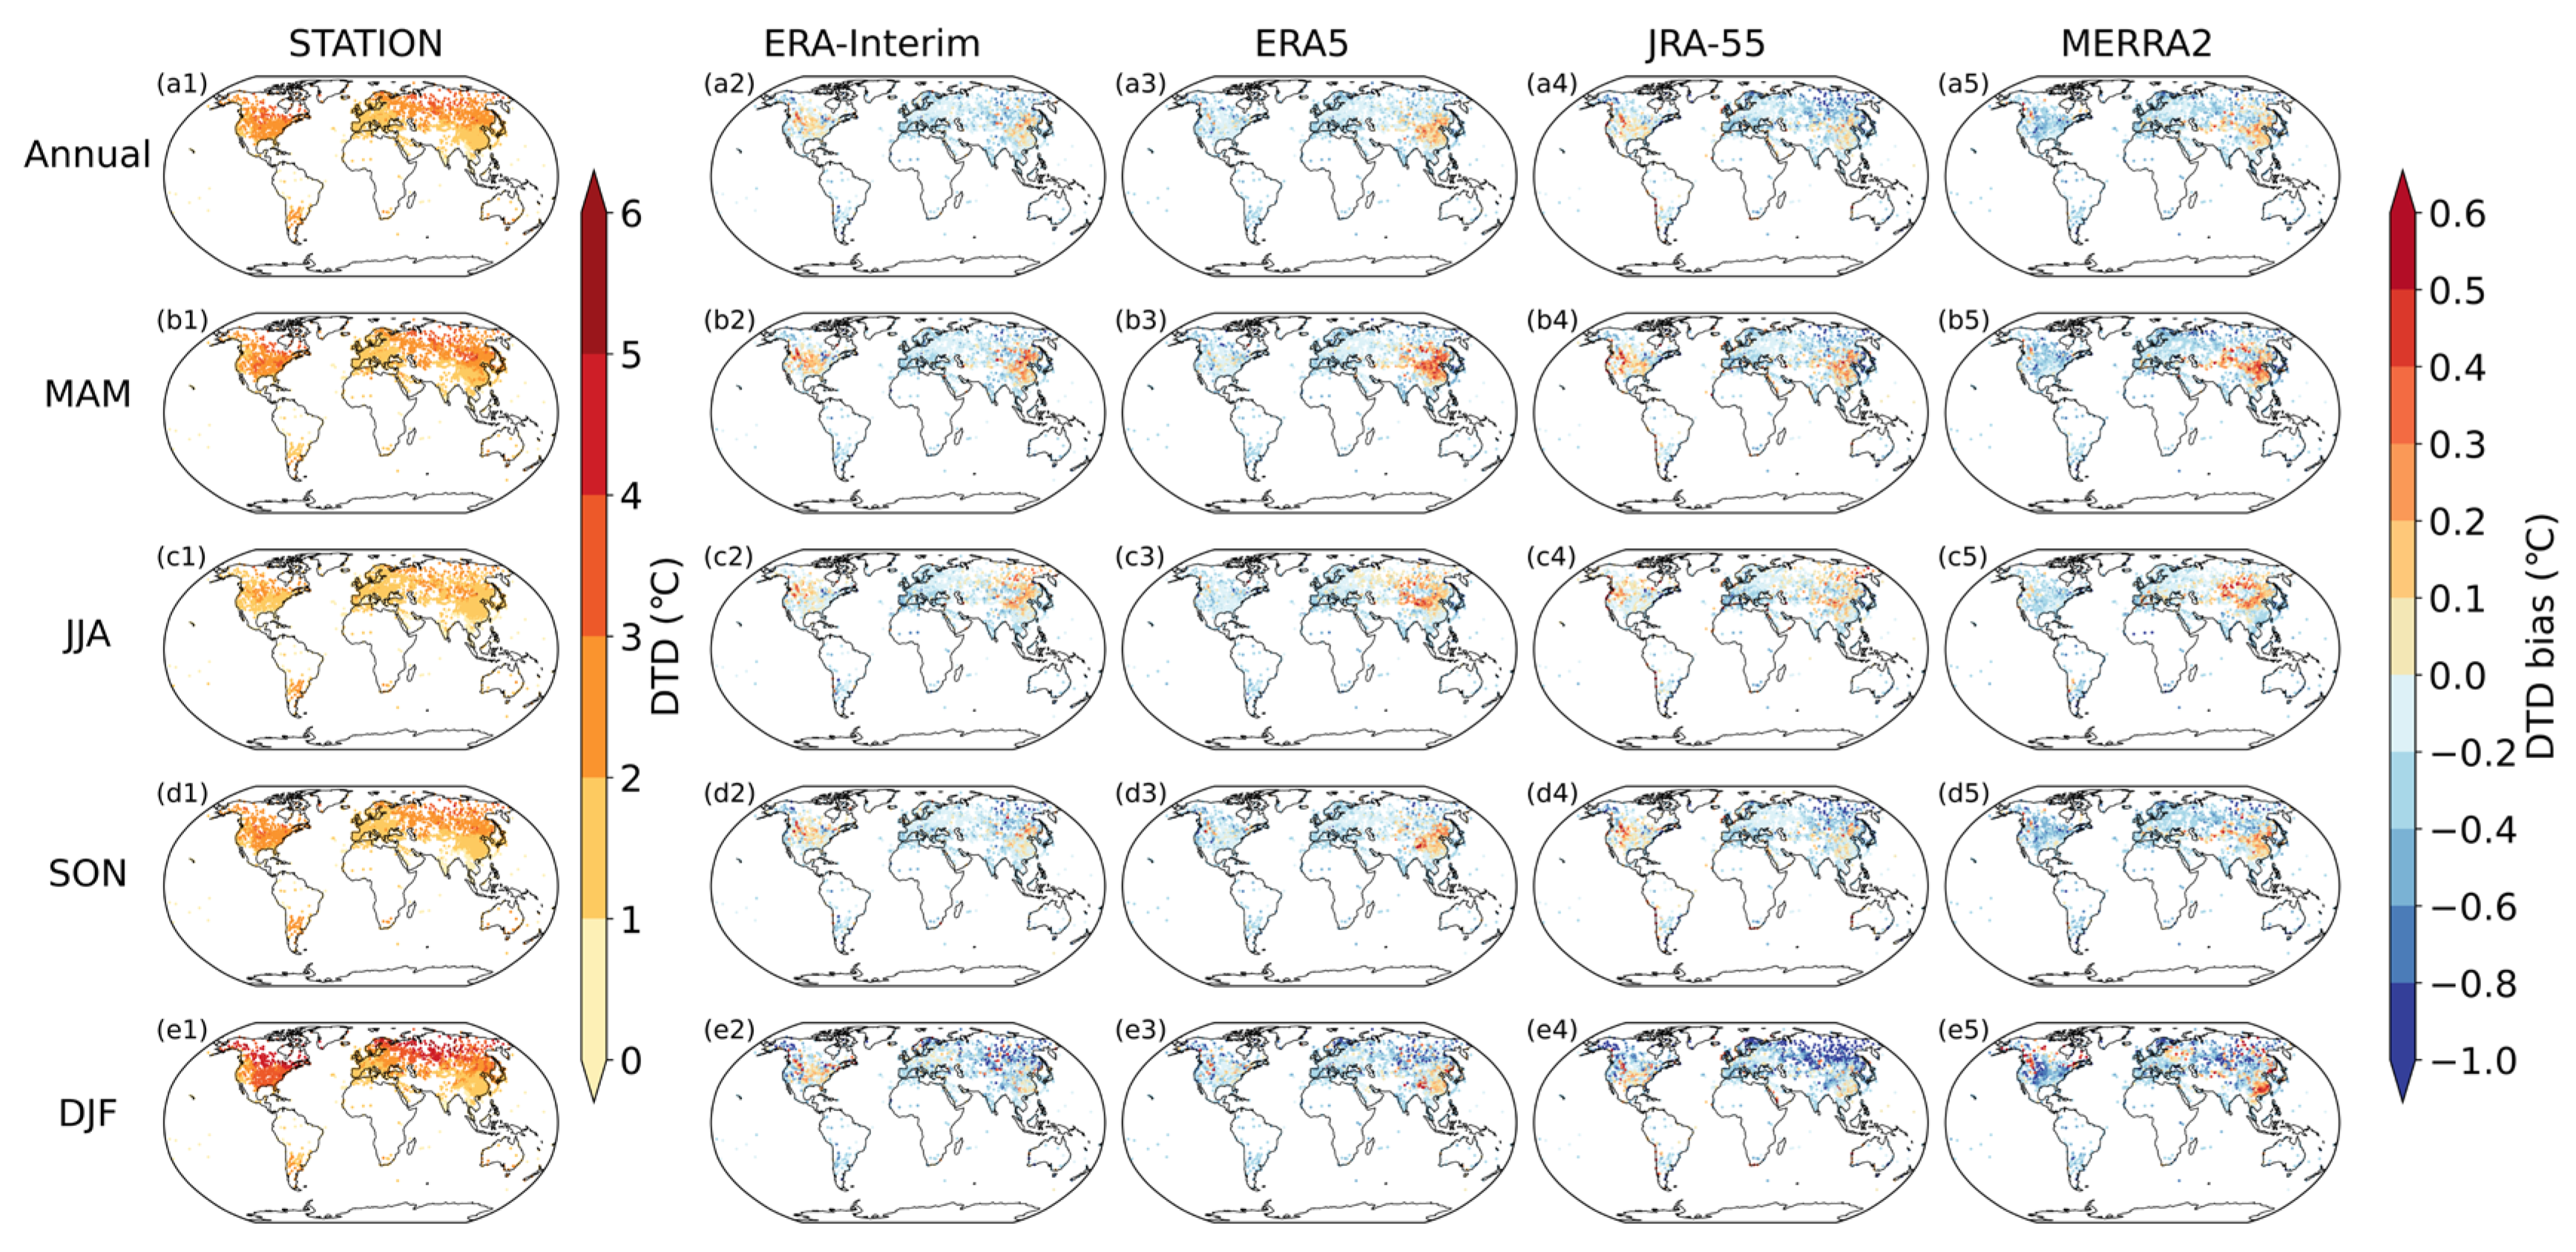
Figure 1 depicts the global climatology of the DTD derived from station observations and four reanalysis datasets (ERA-Interim, ERA5, JRA-55, and MERRA-2). Note that because ERA-Interim is only available through 2019, so its climatology is calculated for the period 1980–2019, while the other datasets span 1980–2020. The DTD exhibits a pronounced latitudinal dependence, increasing poleward to a maxima of approximately 3–4 °C over high-latitude continental interiors such as central Eurasia and northeastern North America, in contrast to the lower values of 1–2 °C prevalent in the subtropics. Superimposed on this zonal pattern are notable longitudinal asymmetries. For example, Europe consistently displays lower DTD than the zonal mean, while the mid-latitude continental United States generally exhibit higher DTD relative to other areas at similar latitudes. A distinct seasonal cycle is also observed, with DTD typically reaching its maximum in winter and minimum in summer. Notably, the amplitude of this seasonal cycle is considerably weaker across Europe.
Figure 1.
Climatological mean DTD (unit: °C) from station observations versus biases of four reanalysis datasets (ERA-Interim, ERA5, JRA-55, MERRA-2) for the annual mean (a1–a5) and four seasons ((b1–e5): MAM (spring), JJA (summer), SON (autumn), DJF (winter)) during 1980–2020. Observations are shown in the first column; reanalysis biases are shown in columns 2–5, respectively.
All four reanalysis datasets can capture the broad spatial patterns of annual and seasonal mean DTD reasonably well, though systematic biases are apparent when validated against station observations (Figure 1). Globally, the datasets consistently underestimate DTD, with eastern China representing a notable exception where overestimation occurs. A different bias pattern is observed over North America among datasets, with ERA-Interim and JRA-55 showing overestimations, while ERA5 and MERRA-2 exhibit underestimations. Among the datasets, JRA-55 shows the closest agreement with observations across East Asia, while ERA5 shows comparatively smaller biases in most other regions. Seasonal analysis reveals that the underestimation is more pronounced during winter, with JRA-55, for instance, exhibiting deviations exceeding 0.8 °C in northern Asia. In contrast, the systematic cold bias weakens considerably in summer, with certain regions of northern Asia even displaying positive deviations.
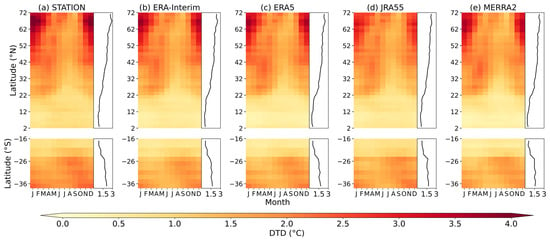
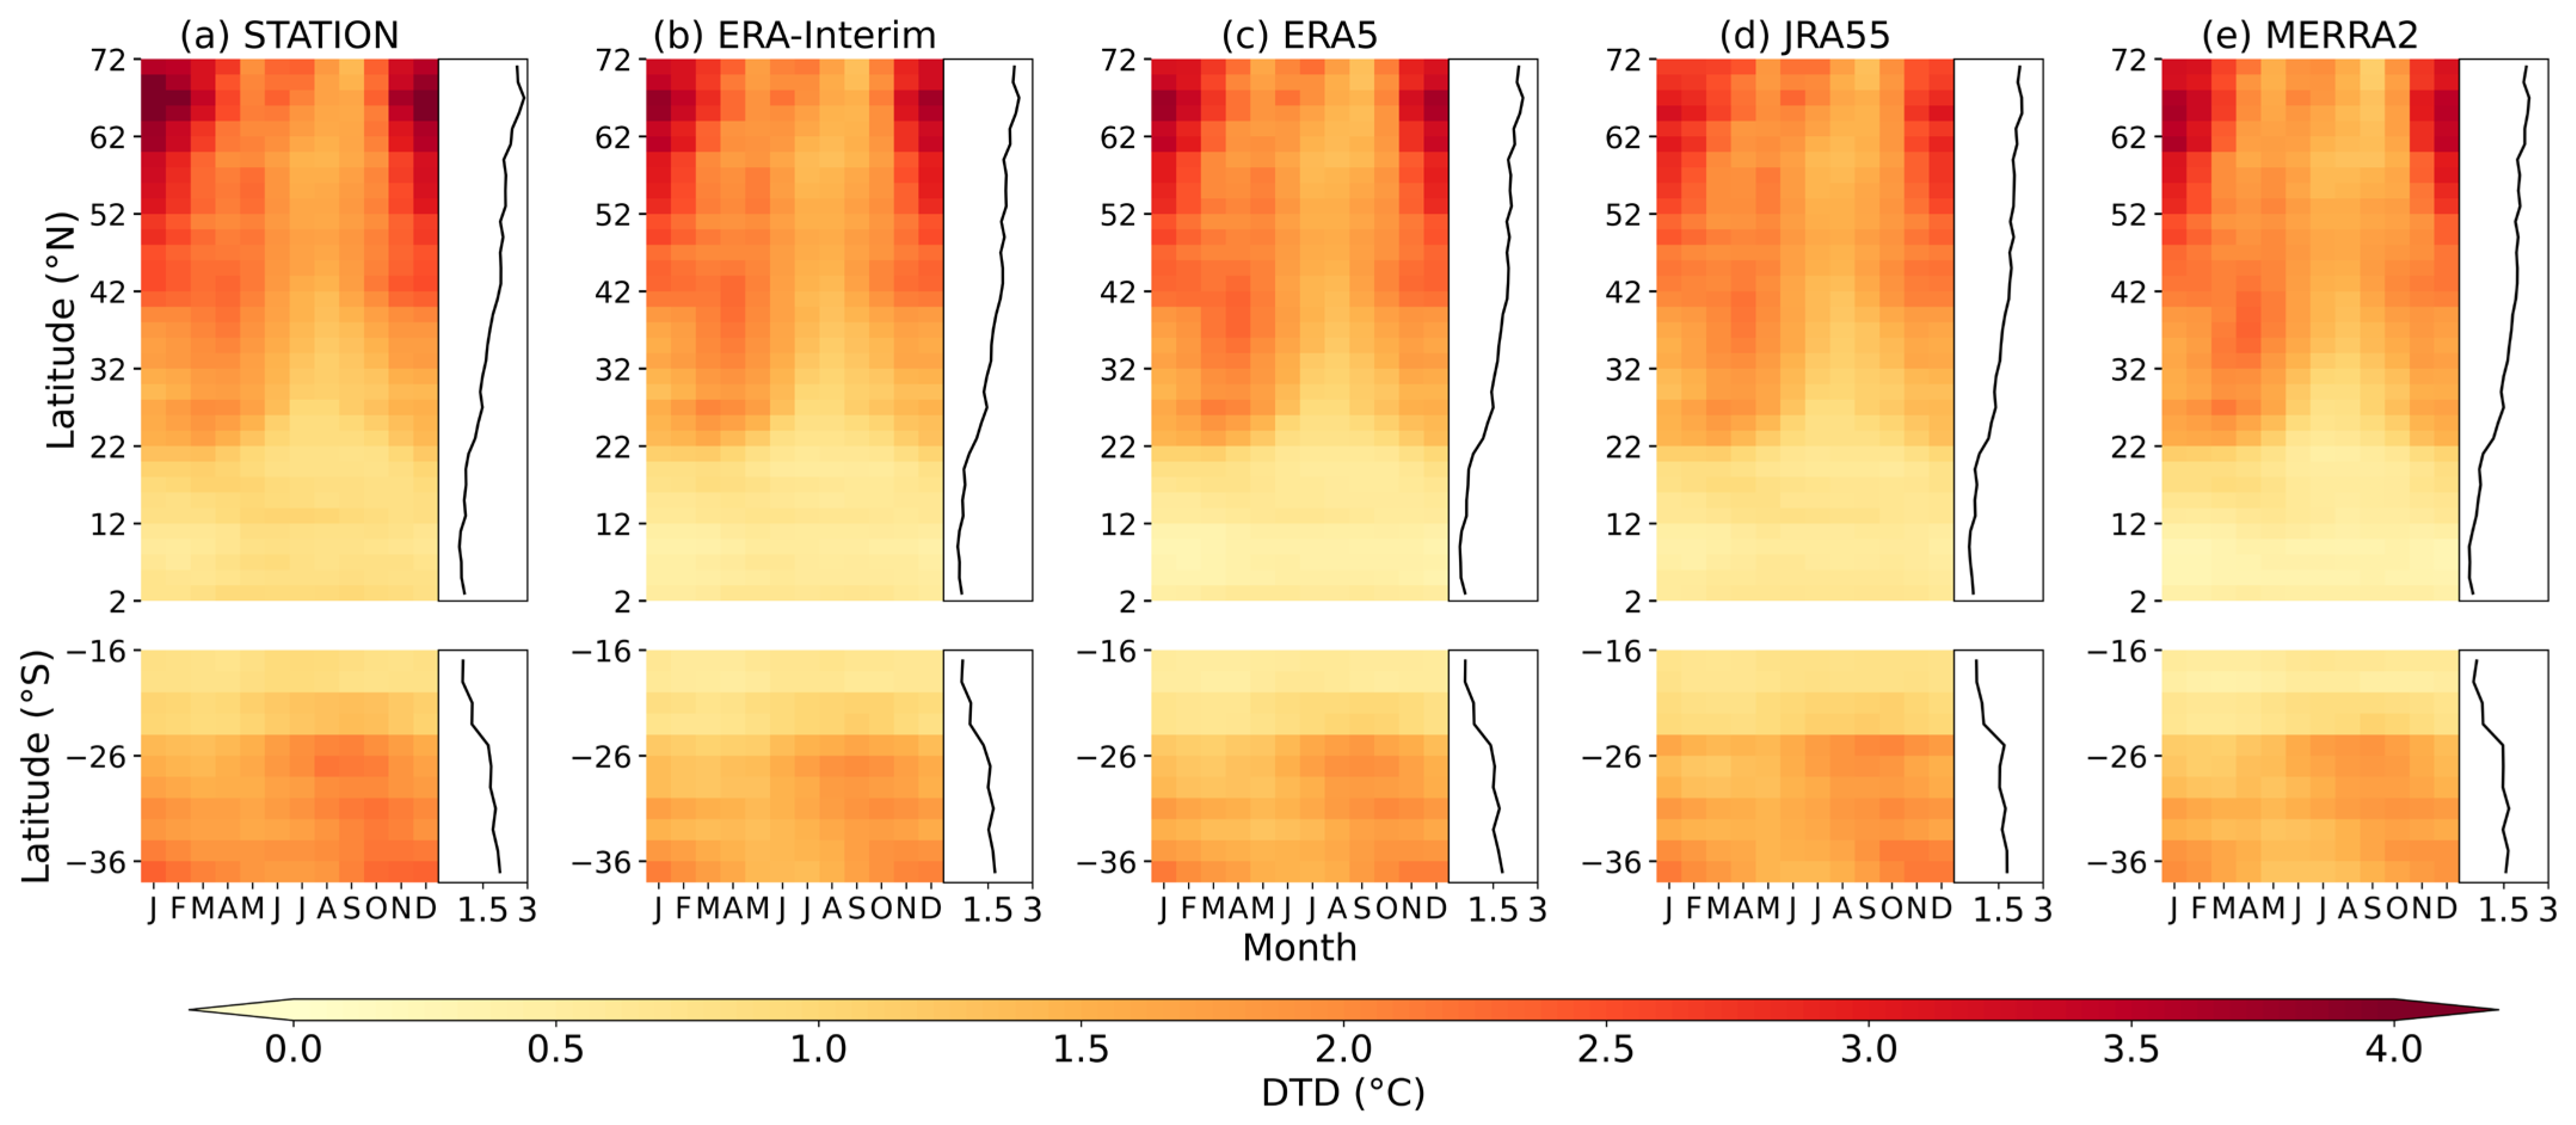
To better understand the latitudinal and seasonal evolution of DTD, the Hovmöller diagram showing the monthly climatological distribution of DTD across latitudes is presented in Figure 2. Because station coverage is extremely sparse at high southern latitudes and near the equator, we show only 16–36° S in the Southern Hemisphere and 2–72° N in the Northern Hemisphere. In situ observations identify a clear meridional gradient and distinct seasonal migration of the maximum, which is located north of 32° N in winter, shifts to 11–32° N in spring, and further migrates to 2–11° N in summer. This latitudinal progression suggests that DTD seasonality intensifies with increasing latitude in the Northern Hemisphere. In contrast, the Southern Hemisphere exhibits significantly weaker DTD magnitudes and seasonal variability, supporting the conclusions of Hamal and Pfahl [10].
Figure 2.
Hovmöller diagram of the monthly climatological DTD latitudinal distribution from station observations (a) and four reanalysis datasets ((b) ERA-Interim; (c) ERA5; (d) JRA-55; (e) MERRA2). The top and bottom panels represent the Northern (2–72° N) and Southern (16–36° S) Hemispheres, respectively. The black vertical lines on the right of each panel indicate the annual mean zonal DTD (unit: °C).
Despite broadly capturing the observed latitudinal and seasonal evolution, the reanalysis datasets exhibit distinct differences in reproducing the magnitude and regional details of DTD. Overall, ERA-Interim and ERA5 show the highest consistency with observations, particularly in replicating the location and intensity of the high-latitude winter peak. However, both exhibit a slight negative bias in the tropics, and ERA5 displays a more subdued seasonal contrast than observed. JRA-55 performs well at low-to-mid latitudes but systematically underestimates the high-latitude maximum by approximately 1 °C. The performance of MERRA-2 is similar to that of ERA5. Notably, all reanalysis products show a widespread systematic low bias in the Southern Hemisphere, which is most pronounced in MERRA-2.
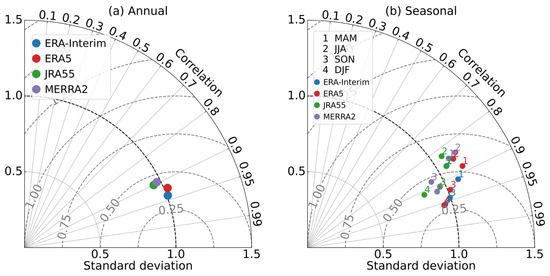
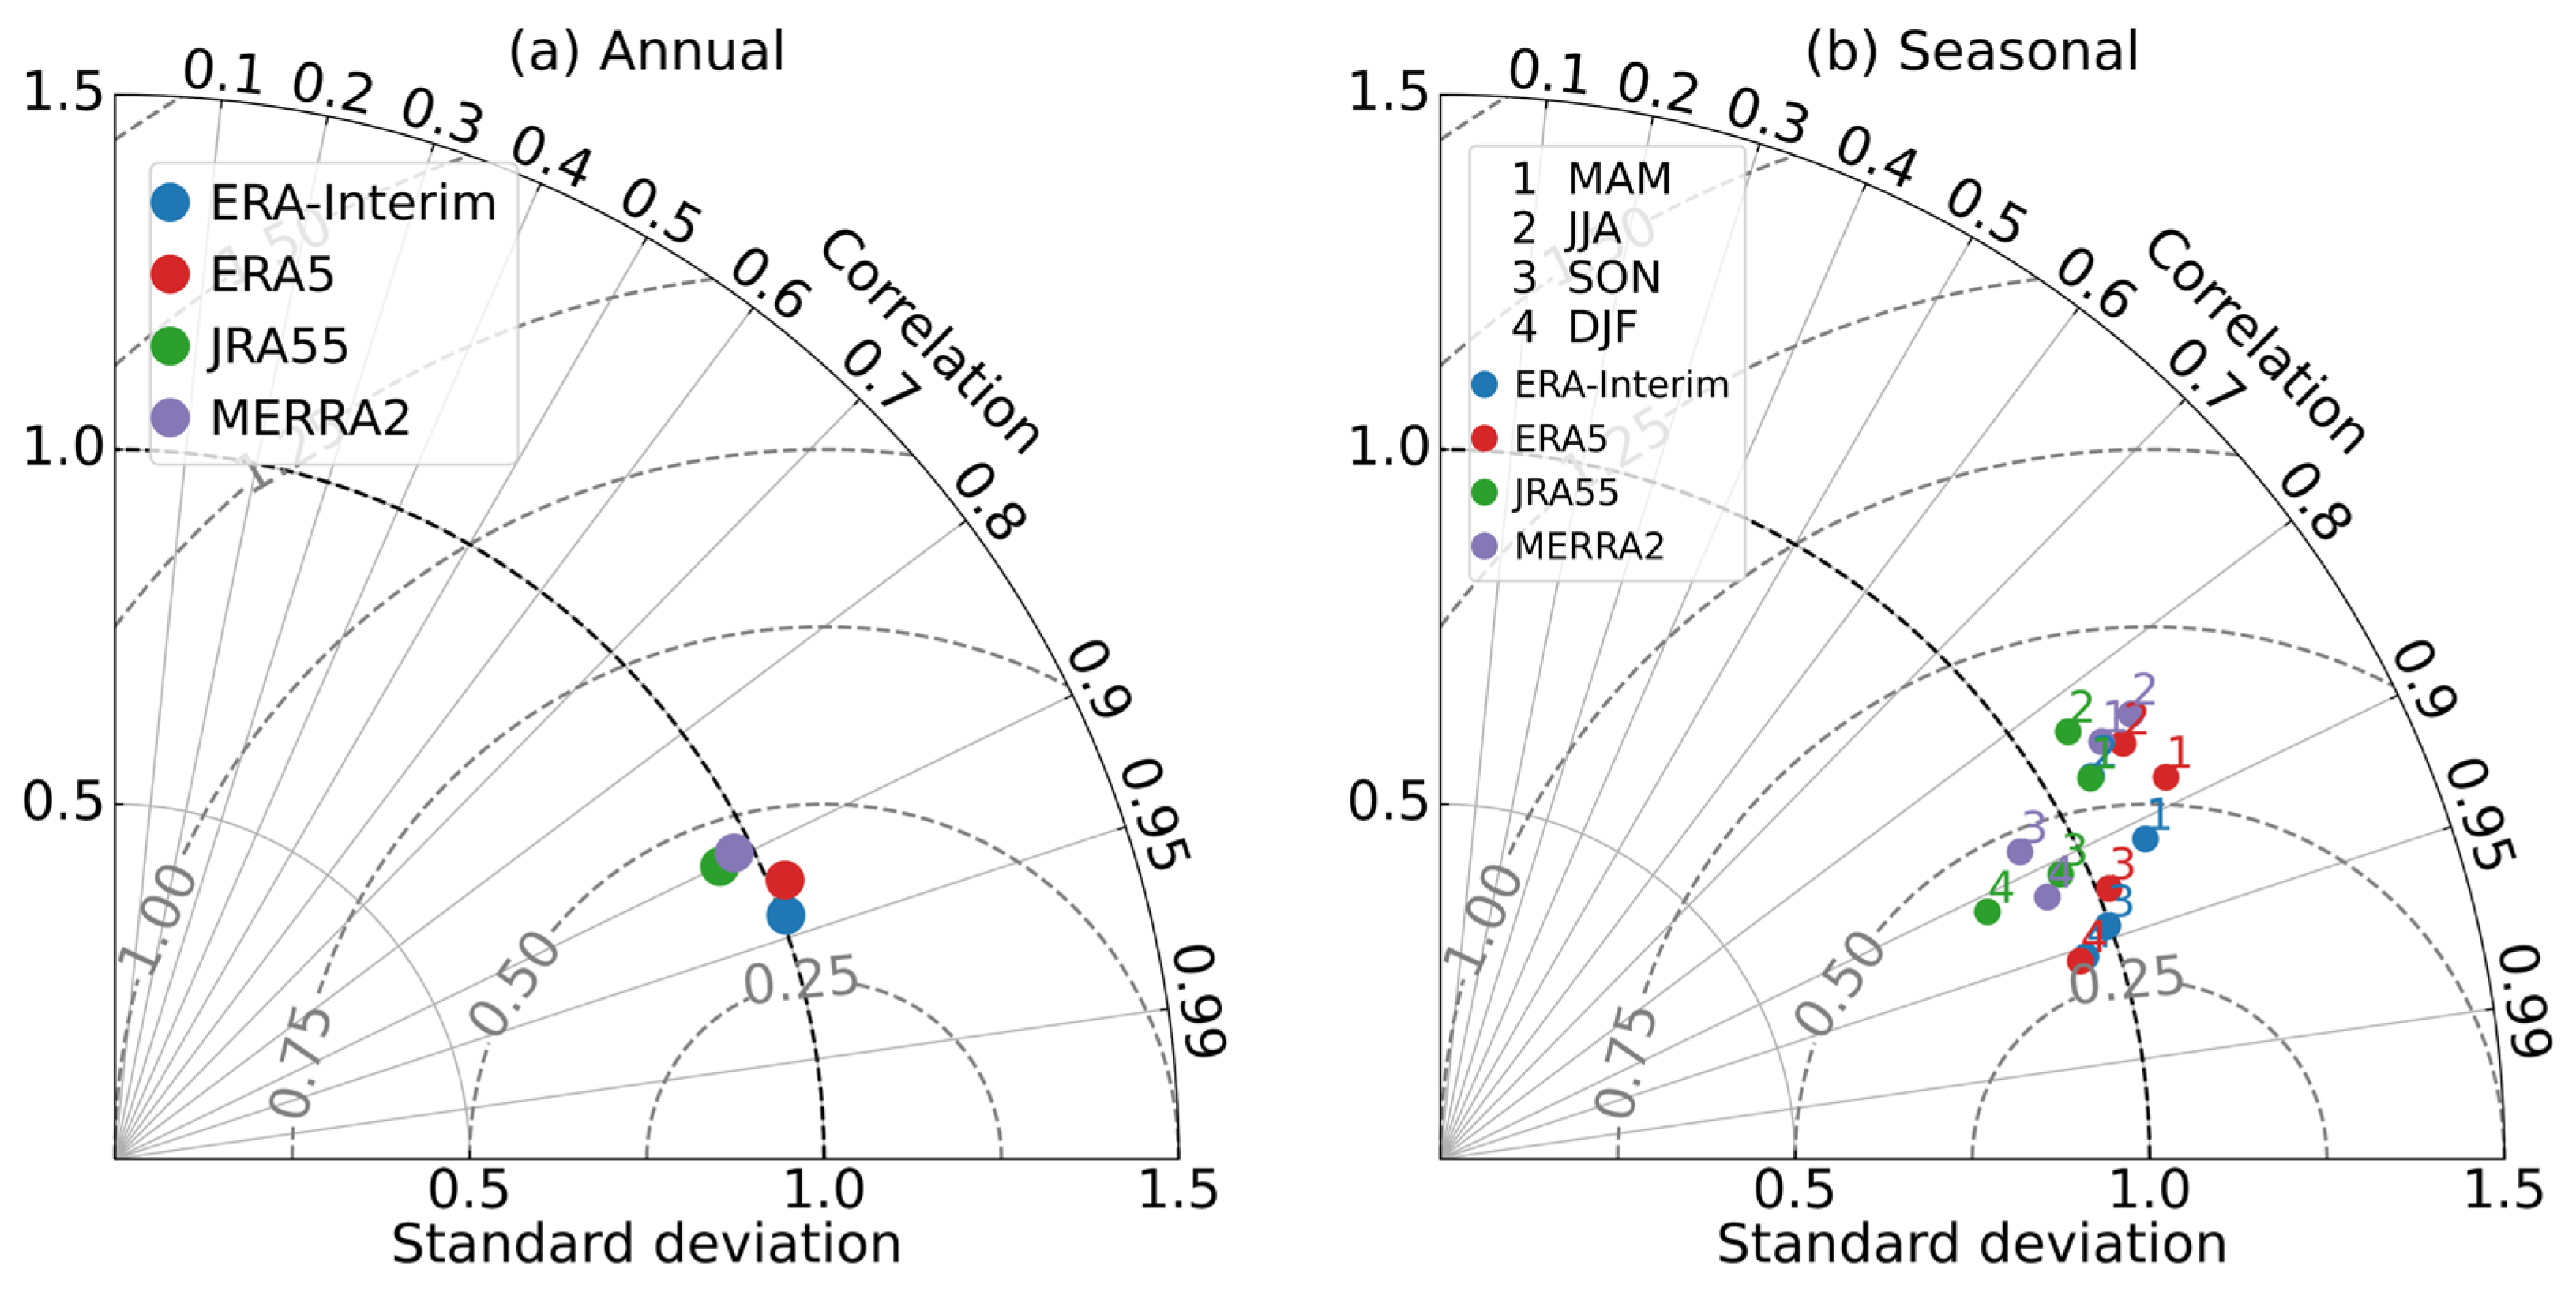
The performance of reanalysis datasets in reproducing DTD is summarized using the Taylor diagram (Figure 3). All datasets exhibit high spatial correlation with station observations, with annual correlation coefficients exceeding 0.89. Among these, ERA-Interim performs the best, achieving the highest correlation (0.94) and a standard deviation (STD) close to one, indicating superior agreement in both spatial pattern and variability magnitude. ERA-Interim and ERA5 have an STD greater than one, suggesting an overestimation of variability amplitude, while MERRA-2 and JRA5-55 show an STD less than one. Seasonal analysis reveals peak performance in autumn and winter (correlations often > 0.9), contrasted with a decline in summer. The transitional seasons (spring and autumn), while maintaining high correlations, are characterized by larger model discrepancies. Overall, ERA-Interim and ERA5 most closely match observations across all seasons, confirming their superior capability in capturing the spatial climatology of DTD.
Figure 3.
Taylor diagrams evaluating the climatological mean DTD from four reanalysis datasets against station observations over global land for (a) annual and (b) seasonal means.
3.2. Long-Term Trends
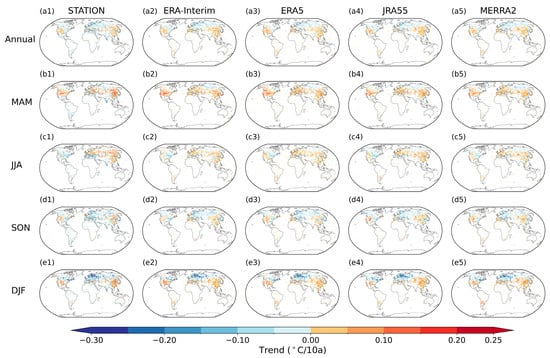
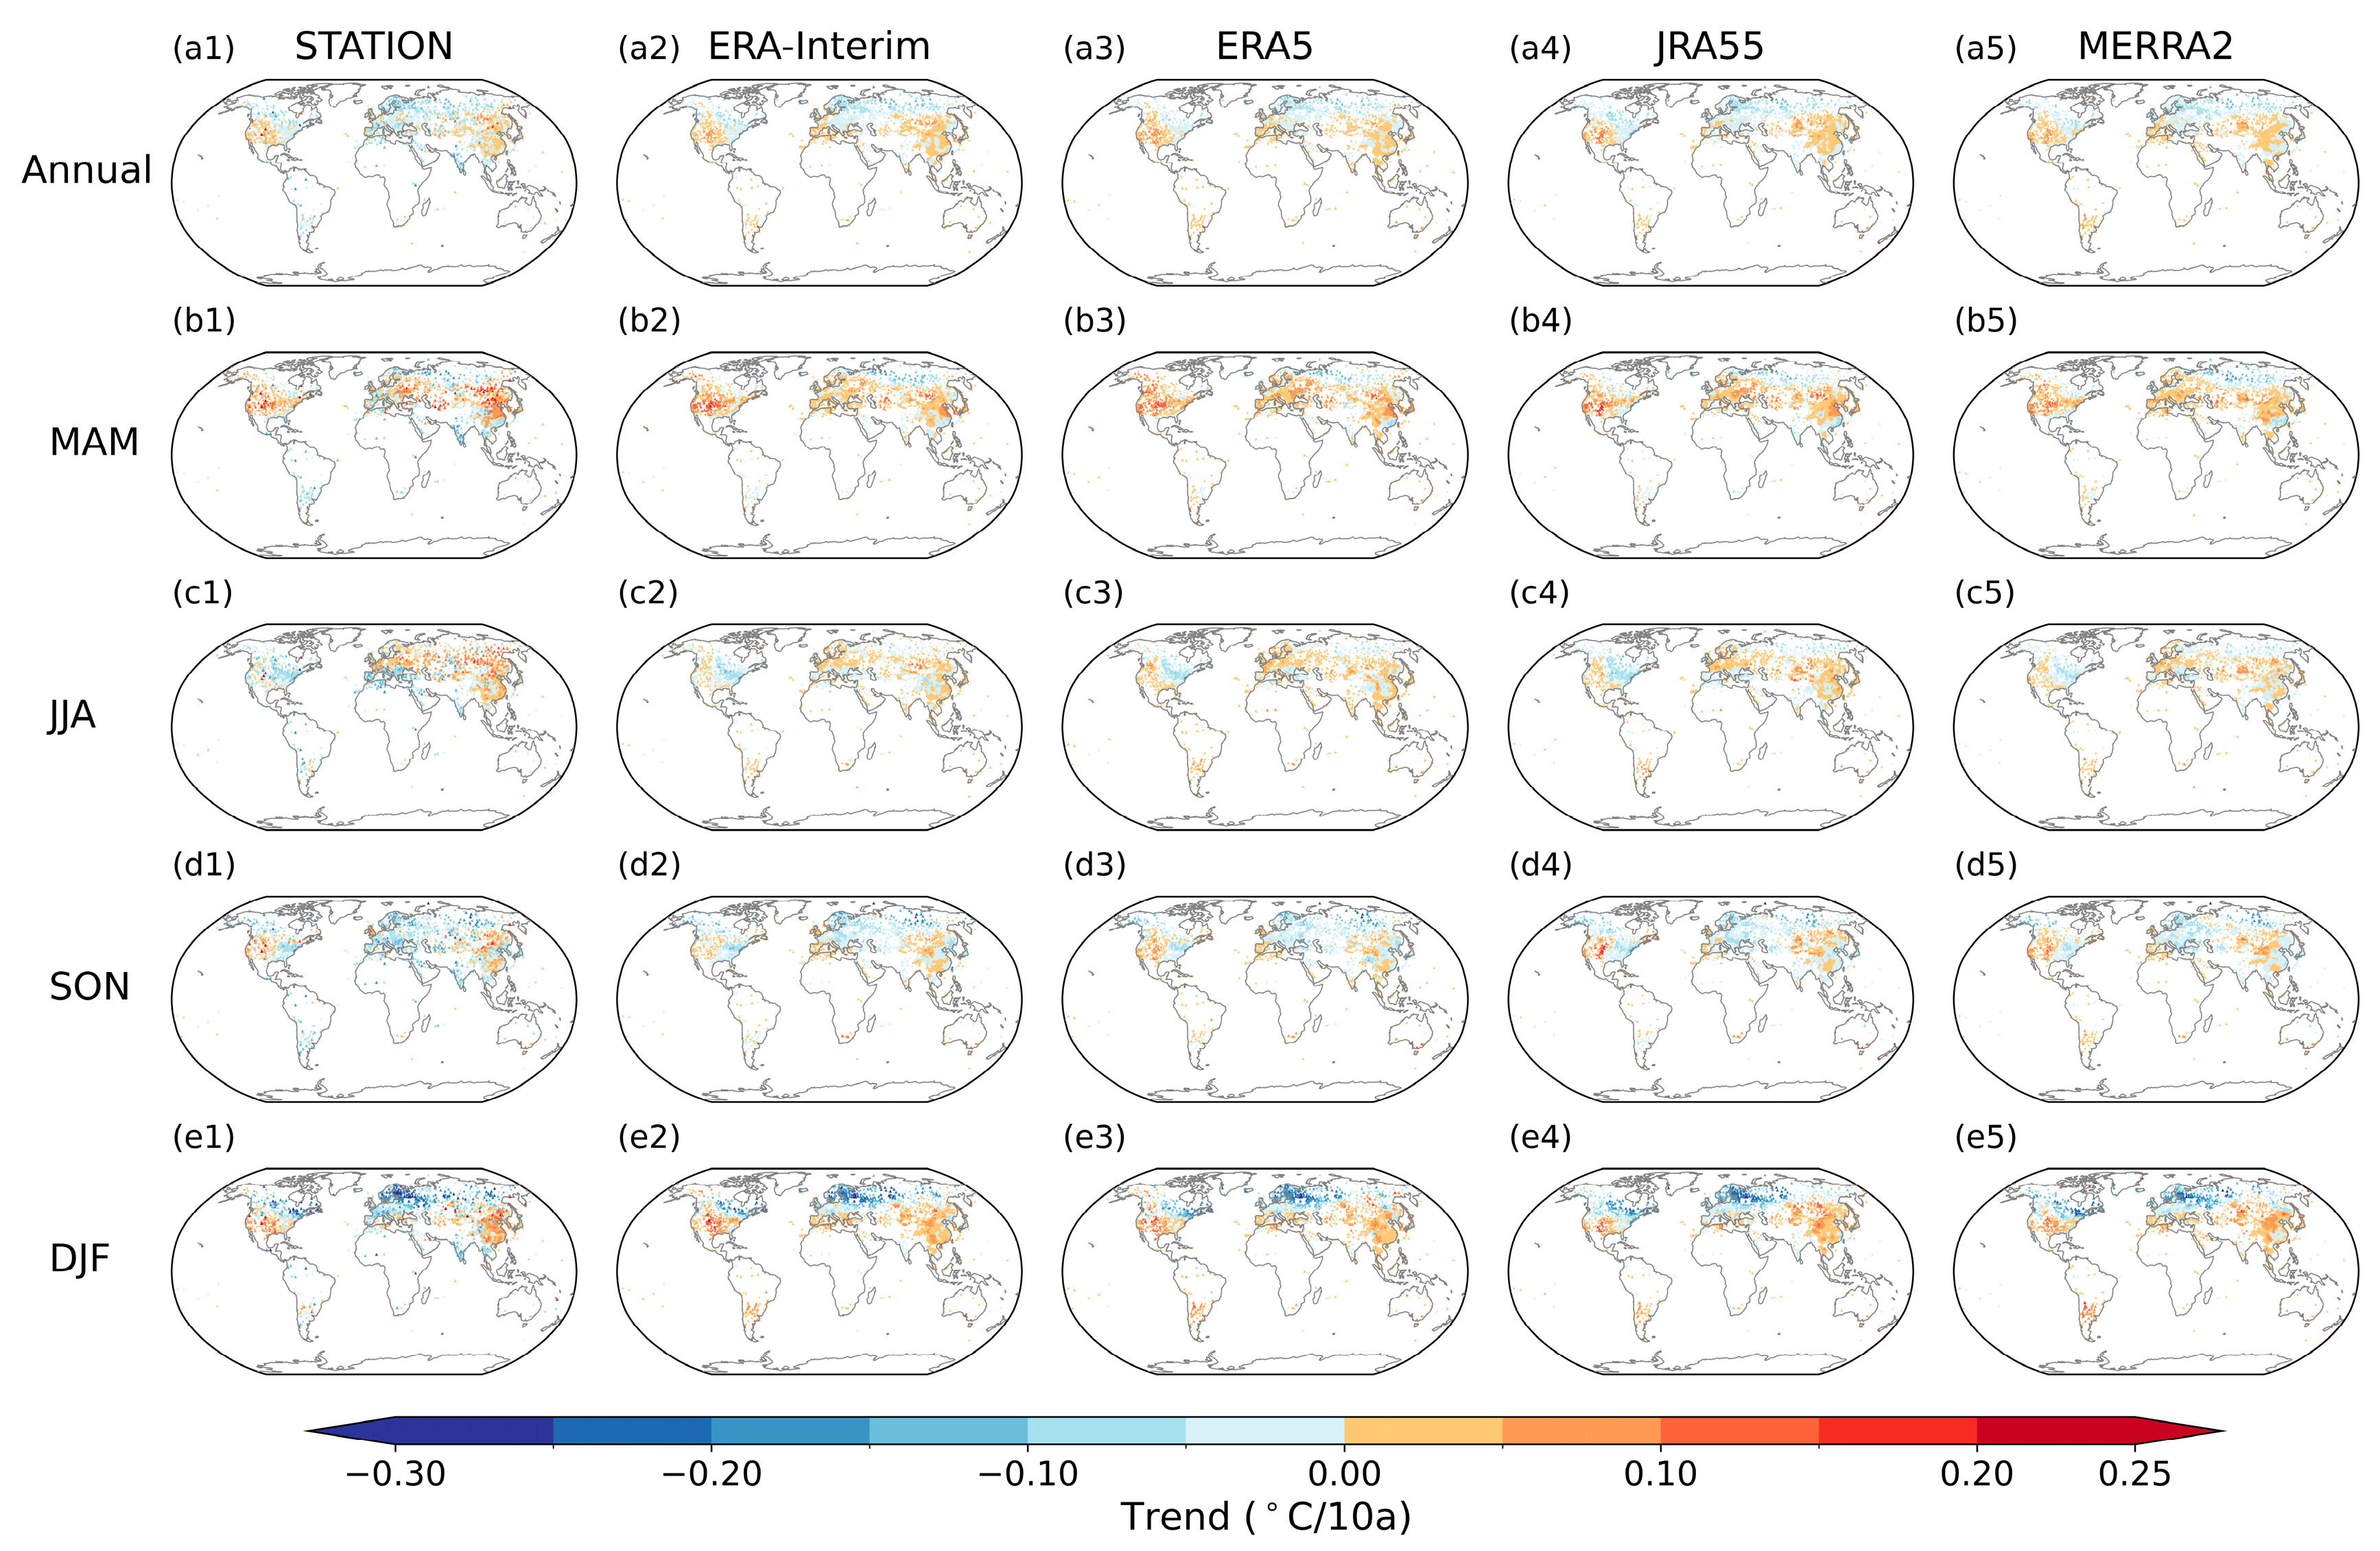
In terms of long-term trends, observational datasets reveal a slight decreasing trend in global DTD in the annual mean as well as during summer, autumn, and winter, with the strongest negative trend occurring in autumn at −0.02 °C per decade. In contrast, a weak increasing trend is found in spring (Figure S5). Spatially (Figure 4), DTD exhibits a pronounced decline across regions north of 50° N in the annual mean and in winter, spring, and autumn, with the largest negative trend in winter, particularly over Northern Europe. During summer, however, most of Eurasia displays increasing DTD, with the strongest rise in central Siberia, reaching up to 0.15 °C per decade. In the mid-low latitudes of the Northern Hemisphere (20–50° N), DTD trends show even stronger spatial heterogeneity. Northeastern China experiences consistent increases in DTD in both the annual mean and all seasons, with the most pronounced rise in spring. Over North America, DTD increases in winter and spring but decreases in summer, and trends in autumn and in the annual mean are negative in the east and positive in the west, forming a clear east–west dipole pattern. Southern Europe generally exhibits increasing DTD in spring and summer but decreasing DTD in autumn and winter. In contrast, most low-latitude regions and the Southern Hemisphere exhibit predominantly slight decreasing DTD trends. These contrasting regional behaviors suggest that the mechanisms regulating DTD, including variability in large-scale circulation, storm-track activity, and land-surface feedbacks, operate differently across climate zones as reported in Wu et al. [9].
Figure 4.
Spatial distributions of trends in DTD (unit: °C/decade) from station observations and four reanalysis datasets for the annual mean (a1–a5) and seasonal means ((b1–e5), namely MAM (spring), JJA (summer), SON (autumn), DJF (winter)) during 1980–2020. Triangles denote stations/grid cells where the trend is statistically significant at the 0.05 level.
The reanalysis datasets generally capture the spatial patterns of DTD trends reasonably well in the mid-to-high latitudes, although they tend to overestimate the magnitude of the changes (Figure 4). However, they show decreasing trends in Siberia and increasing trends in the low latitudes and the Southern Hemisphere, which is opposite to those derived from observations. These discrepancies may reflect a combination of factors, including observational uncertainties in data-sparse regions, possible residual inhomogeneities in station records because no additional homogenization was applied beyond the original quality control, and time-varying observational constraints in the reanalysis systems. Overall, the spatial distribution of DTD trends is best reproduced in winter, with spatial correlation coefficients mostly exceeding 0.5, while performance is weakest in summer, characterized by the lowest correlations and the highest RMSE values (Figure S6). Therefore, conclusions regarding DTD trends in the low latitudes and the Southern Hemisphere should be interpreted with caution when based solely on reanalysis products. Among the datasets examined, ERA5 and ERA-Interim exhibit comparatively better skill in capturing short-term temperature variation.
3.3. Probability Density Functions of DTD
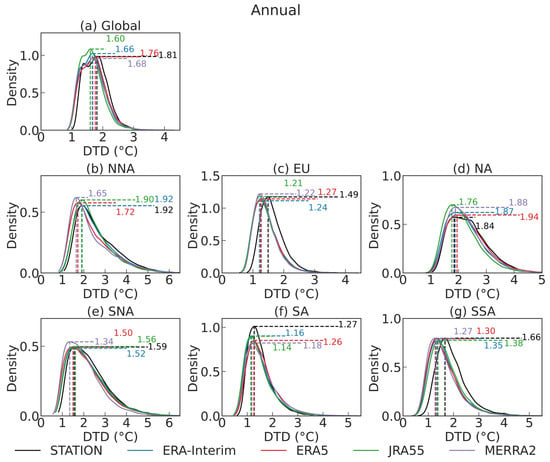
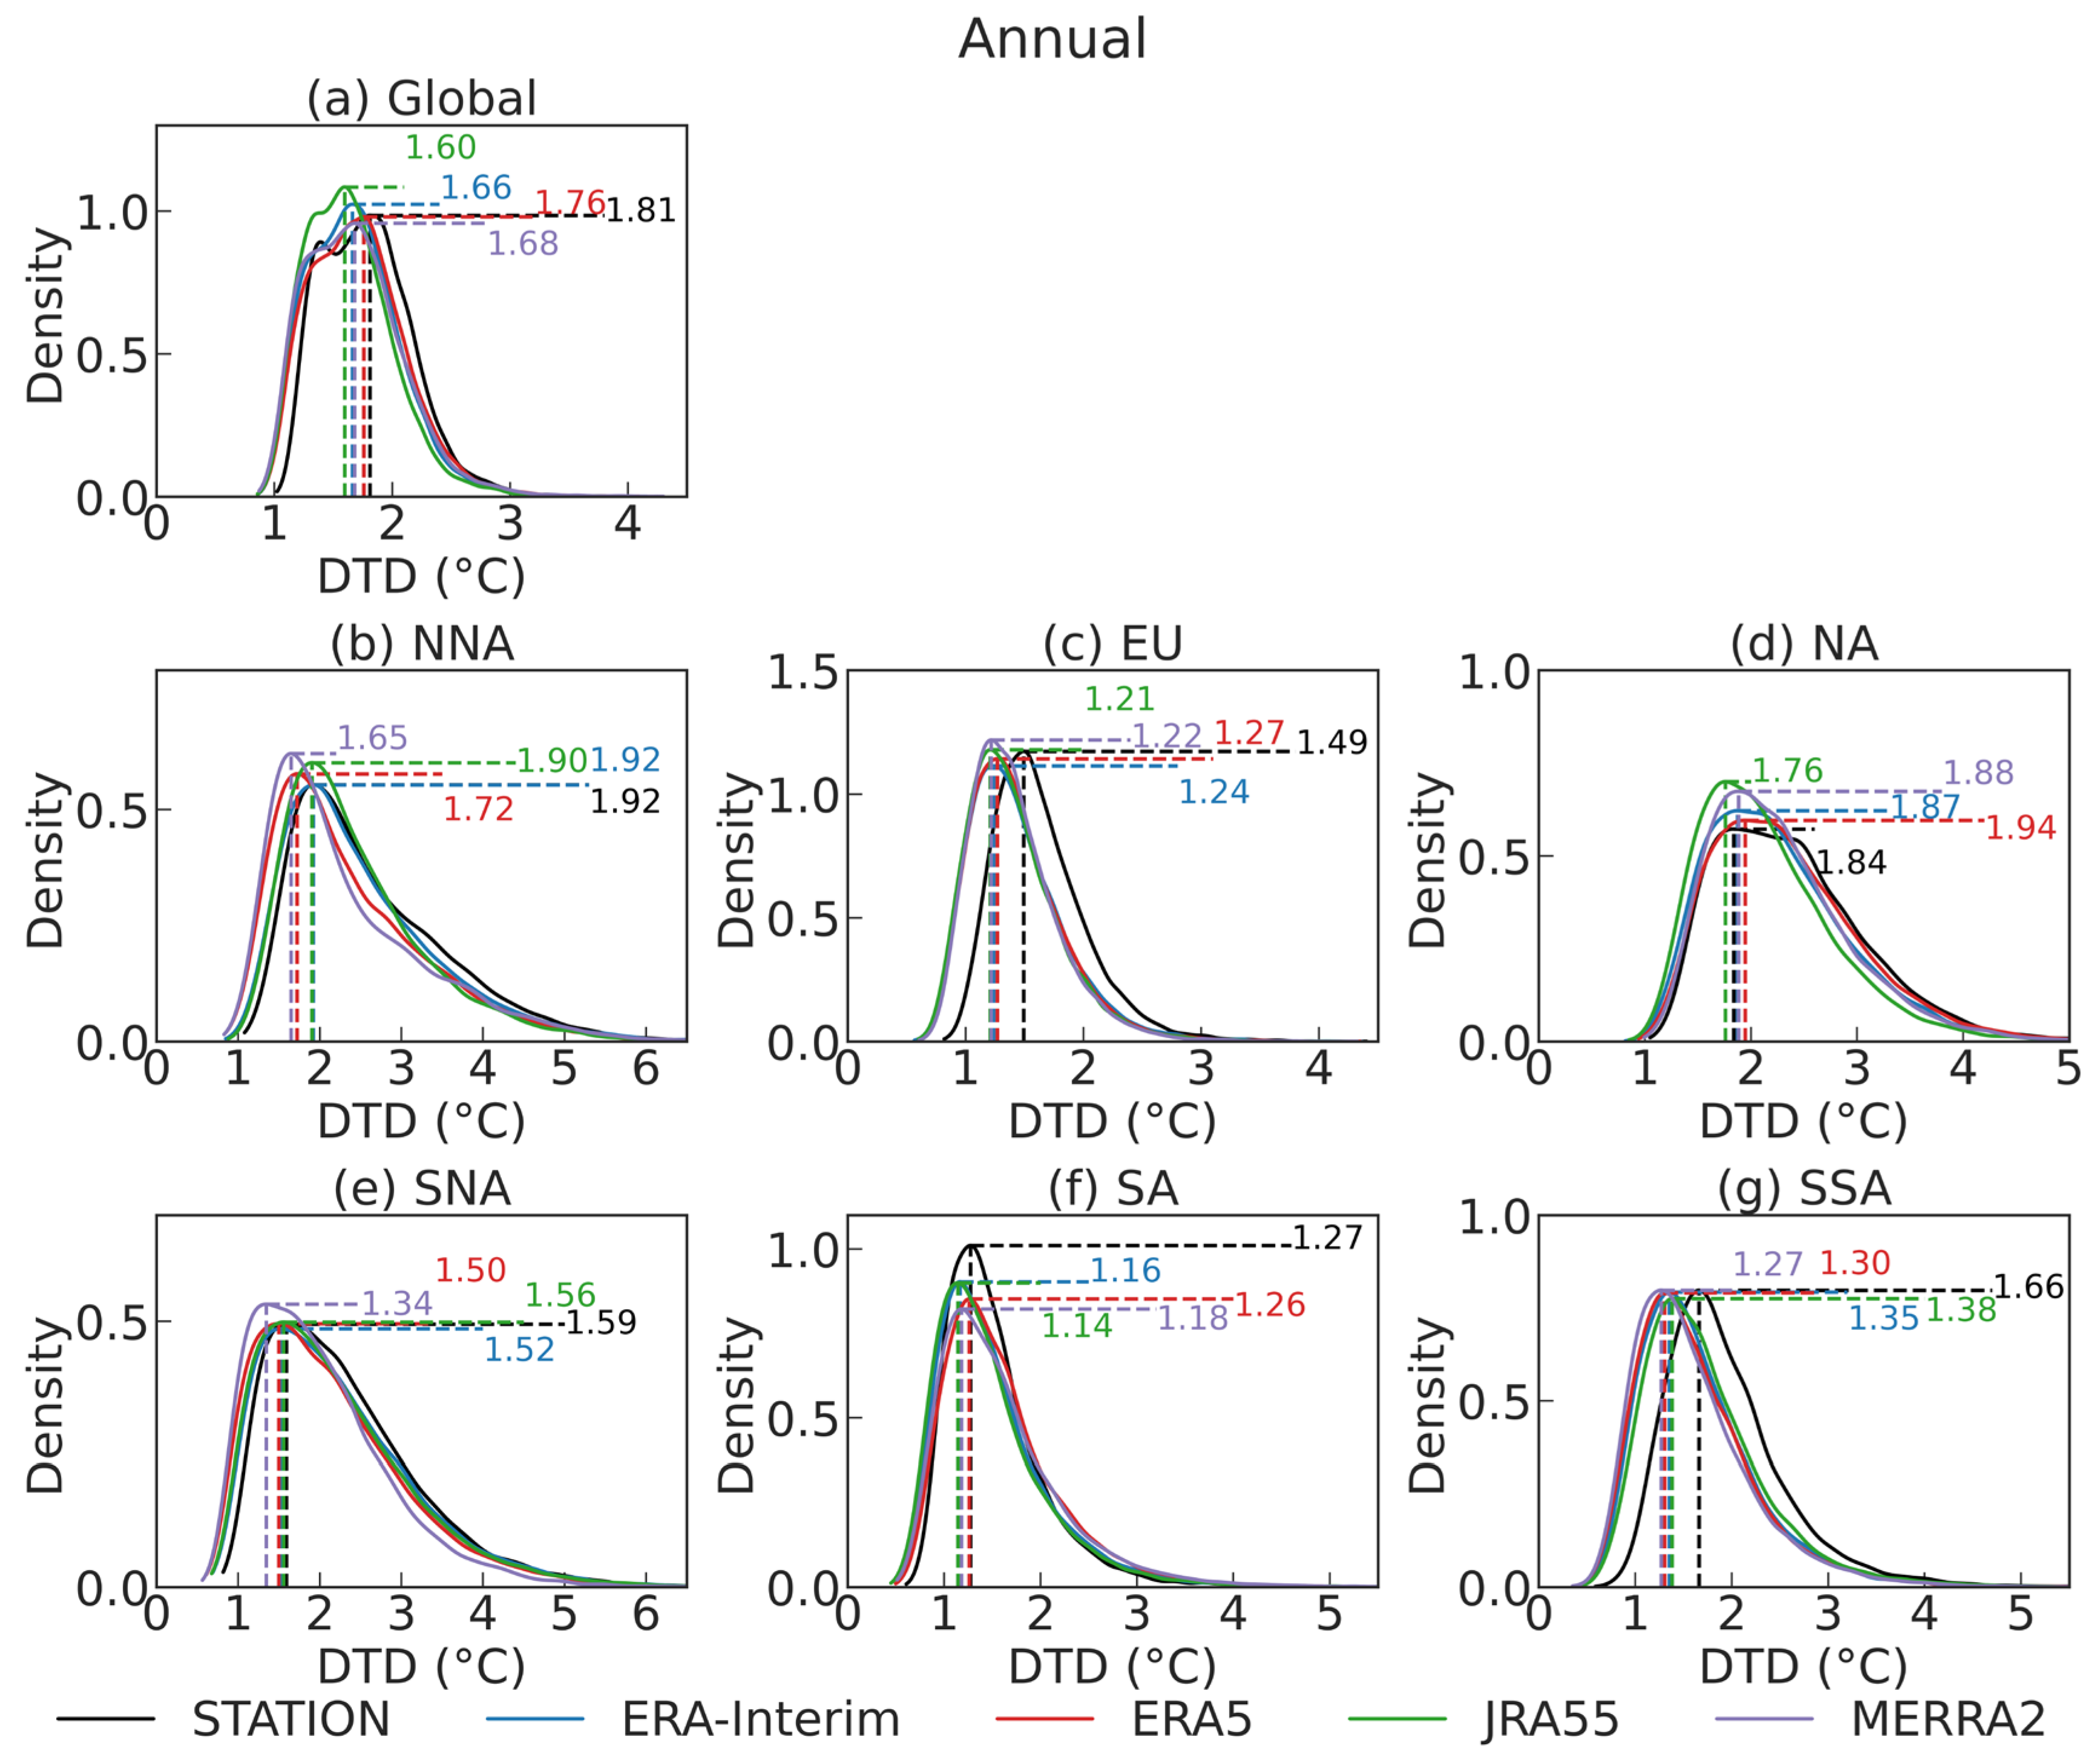
Building on the analysis of long-term trends, which reveals substantial regional differences in the behavior of DTD, the probability density functions (PDFs) provide further insight into how well the reanalysis datasets capture the full statistical structure of short-term temperature variability. While trends describe the long-term evolution of DTD, the PDFs offer a detailed characterization of its distributional features and the frequency of both typical and extreme DTD events. Because the statistics of DTD are strongly influenced by regional climate regimes, the globe is divided into six subregions, including northern North America (NNA), southern North America (SNA), South America (SSA), Europe (EU), northern Asia (NA) and southern Asia (SA). The performance of the reanalysis datasets is therefore assessed separately in each subregion.
As shown in Figure 5, the station observations and the reanalysis datasets share a broadly similar distributional shape at the global scale and across all regions. All datasets exhibit a unimodal and right-skewed distribution, indicating that the reanalyses generally capture the fundamental statistical characteristics of DTD. However, in most regions, the reanalysis products shift the peak of the distribution toward lower DTD values relative to the observations, which confirms that they tend to simulate weaker short-term temperature fluctuations. Additionally, the reanalyses exhibit a higher frequency of weak DTD events and a lower frequency of strong DTD events compared with the observations at both the global scale and in most subregions. An exception is found in SA, where the reanalysis datasets show a higher frequency of large DTD values than observed. These differences demonstrate that the agreement between reanalyses and observations varies substantially across regions. The broader PDFs in the mid-to-high-latitude regions (NNA, EU, and NA) are likely linked to stronger synoptic variability associated with storm-track dynamics, whereas the generally narrower PDFs in lower-latitude regions (SNA, SA, and SSA) are consistent with a stronger influence of moist-convective regimes on temperature variability [37,38].
Figure 5.
Annual probability density functions (PDFs) of DTD for in situ station and reanalysis datasets over the globe (a) and subregions ((b) northern North America (NNA); (c) Europe (EU); (d) northern Asia (NA); (e) southern North America (SNA); (f) southern Asia (SA); (g) South America (SSA)) for the period 1980–2020.
The regional contrasts in performance are particularly evident when examining the individual subregions. For example, ERA5 and MERRA-2 produce PDFs that most closely resemble the observations in NA, while JRA-55 and MERRA-2 provide a better match in NNA. Comparatively, the discrepancies among the discrepancies are relatively small in EU, but more pronounced in NNA. Seasonal differences in reanalysis performance are also evident (Figures S7 and S8). JRA-55, for instance, exhibits a PDF distribution closer to the observations during summer, but it shows the largest bias in winter. Conversely, ERA5 performs better in winter than in summer, highlighting the seasonal dependence of reanalysis ability to represent short-term temperature variability. Hence, the analysis of DTD characteristics should account for the fact that the most suitable reanalysis dataset can differ by region and season.
3.4. Elevation Dependence of DTD
The distribution of DTD is influenced not only by large-scale circulation and regional climate regimes but also by topographic factors that regulate surface–atmosphere interactions [20]. It is therefore necessary to examine the elevation dependence of DTD to determine whether short-term temperature variability exhibits systematic changes across altitude bands. However, the limited number of observational stations in high-elevation regions introduces substantial uncertainty into an analysis based on station observation. Given the comparative performance of the reanalysis datasets, ERA5 is selected for the subsequent investigation of elevation dependence and for assessing the characteristics of extreme DTD events.
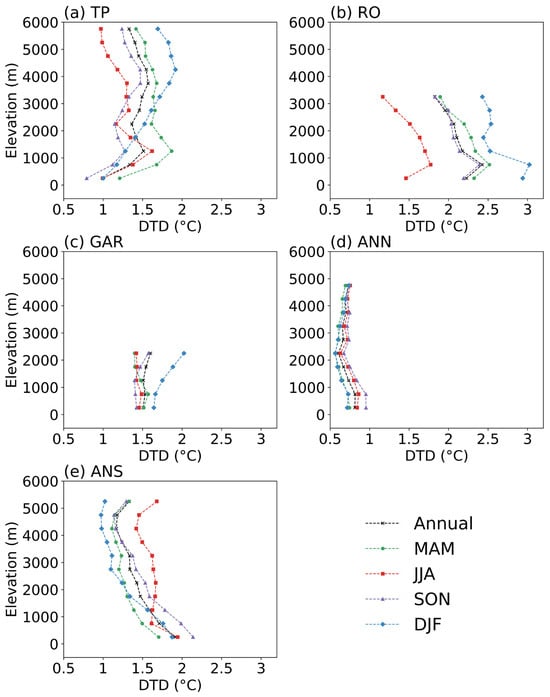
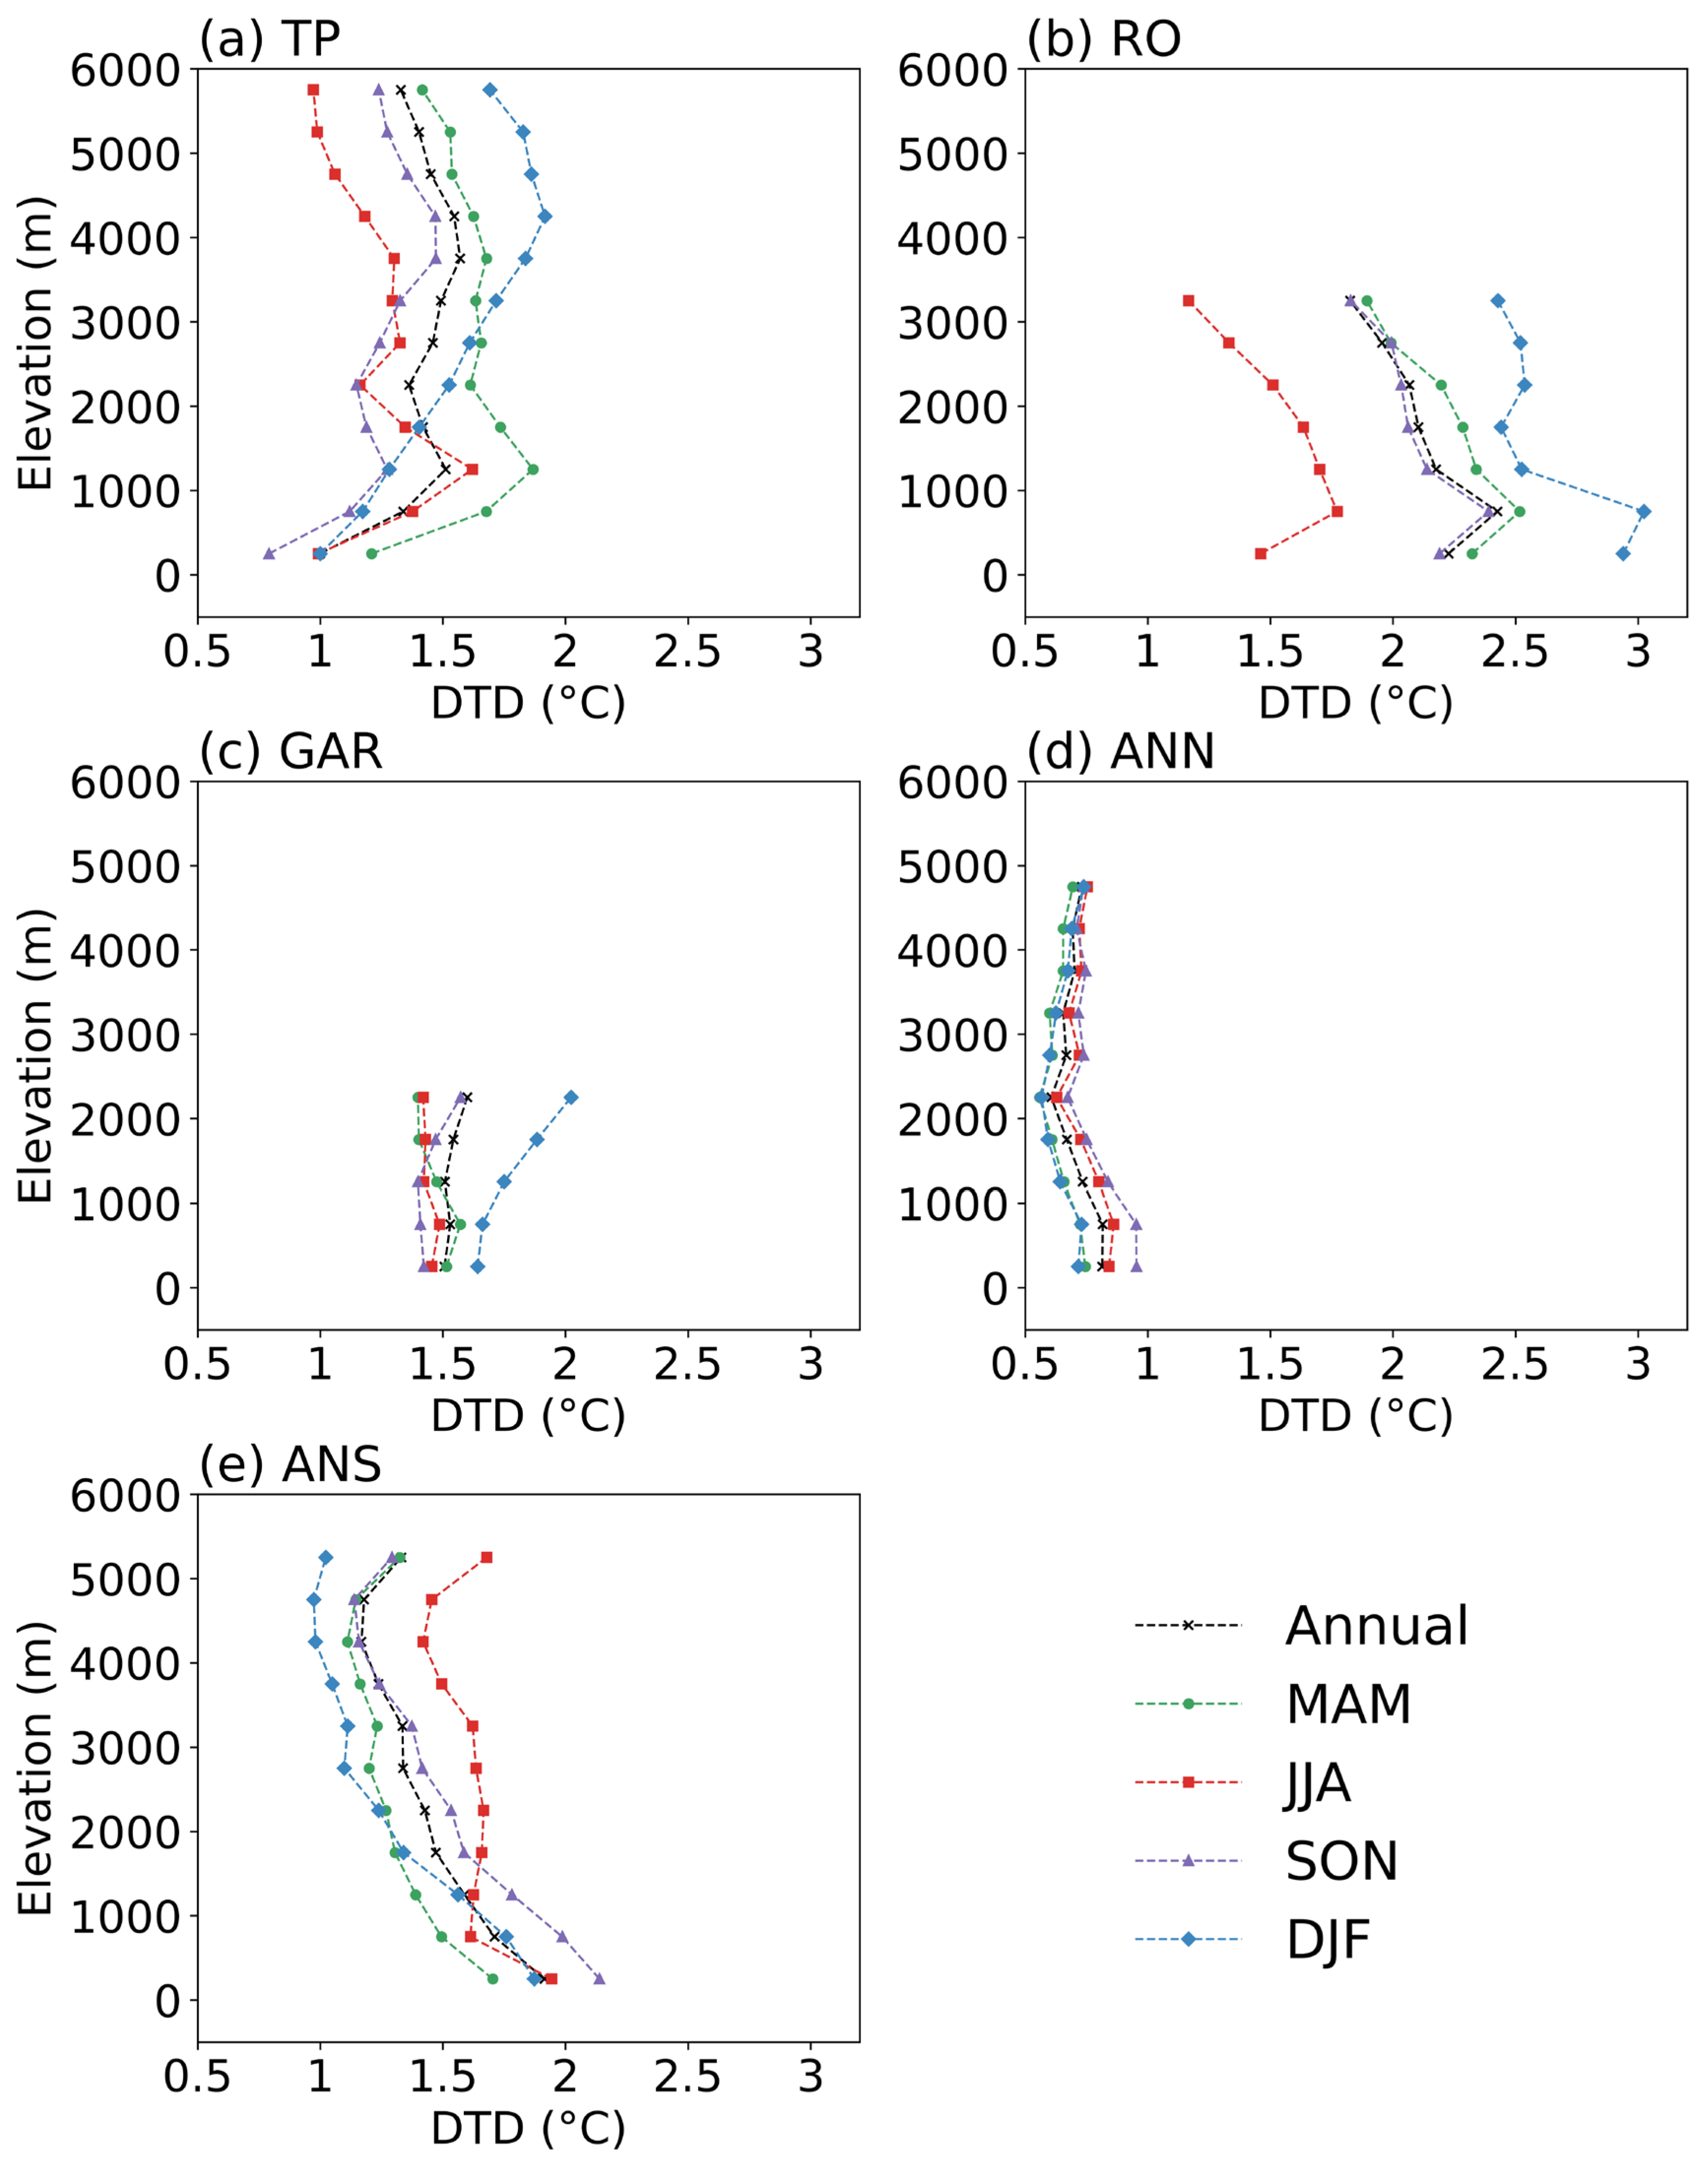
Following the mountain selection criteria outlined in Ferguglia et al. [39], this study focuses on the following key mountain regions: the Tibetan Plateau (TP, 25–42° N, 65–105° E), the Rocky Mountains (RO, 30–50° N, 125–95° W), the northern tropical Andes (ANN, 23–0° S, 80–60° W), the southern Andes (ANS, 40–23° S, 80–60° W), and the European Alps (GAR, 43–49° N, 4–19° E) (Figure S9). Figure 6 illustrates the variation in DTD with altitude across different mountain regions. The relationship between elevation and DTD exhibits distinct regional and seasonal patterns. In the TP, the DTD generally increases with elevation during winter up to approximately 4500 m, after which it begins to decline. During spring and summer, the DTD increases with an altitude below 1500 m, but reverses to a decreasing trend above this threshold. In the ANS, however, the DTD consistently decreases with increasing elevation. The structures of elevation dependence of DTD in the GAR resemble those of the TP, with DTD increasing with elevation during winter but shifting to a decrease above 1000 m in spring. During summer, DTD shows minimal variation between high and low elevations, while during autumn, it remains relatively stable below 1500 m before increasing with elevation above this point. The RO, on the other hand, exhibits a consistent pattern across all seasons, with DTD decreasing above 1000 m as altitude increases. In the ANN, the amplitude of DTD variation is relatively small, with the lowest values typically occurring around 2000 m.
Figure 6.
Elevation dependency of annual and seasonal DTD from ERA5 for the period 1980–2020 across five mountainous regions including (a) the Tibetan Plateau (TP), (b) the Rocky Mountains (RO), (c) the European Alps (GAR), (d) the northern tropical Andes (ANN) and (e) the southern Andes (ANS).
The structure of elevation-dependent DTD over the TP in winter resembles that of elevation-dependent warming, for which snow-albedo feedback has been identified as an important contributor [40]. This resemblance suggests that snow-related radiative effects and phase-change energy buffering may also influence elevation-dependent DTD in winter. Additionally, the relative importance of radiative, turbulent, and advective controls on temperature changes likely varies with region, season, and elevation [41,42], which could contribute to spatially dependent and potentially non-monotonic DTD–elevation relationships. The differing elevation-dependent patterns between the tropical Andes and mid-latitude mountains may reflect distinct dominant processes. In mid-latitude mountains, DTD is often strongly shaped by baroclinic synoptic activity and frontal advection, whereas in equatorial highlands, variability in convection, cloudiness, and associated radiative forcing may play a larger role [10]. These indicated that targeted process-based diagnostics are needed to assess the relative contributions of the underlying mechanisms.
3.5. Characteristics of Extreme DTD Events
A growing body of evidence has linked abrupt temperature fluctuations to elevated mortality, with older adults being particularly vulnerable [43]. Motivated by these pressing public health concerns, this study further investigates the characteristics of extreme DTD events. Following the definition of extreme climate indices, we identify values below the fifth percentile and above the 95th percentile at each grid point as thresholds for DTDD and DTDI events, respectively. To assess the robustness of the reanalysis-based extreme-event diagnostics, we compare ERA5-derived DTDD/DTDI metrics with station-based diagnostics over their common coverage. The resulting large-scale patterns are broadly consistent (Figures S10–S12), supporting the use of ERA5 for characterizing extreme DTD where station coverage is limited.
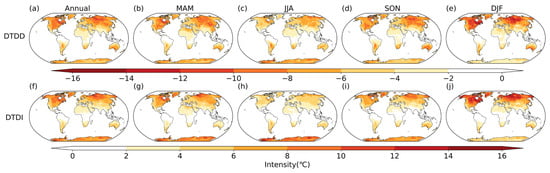
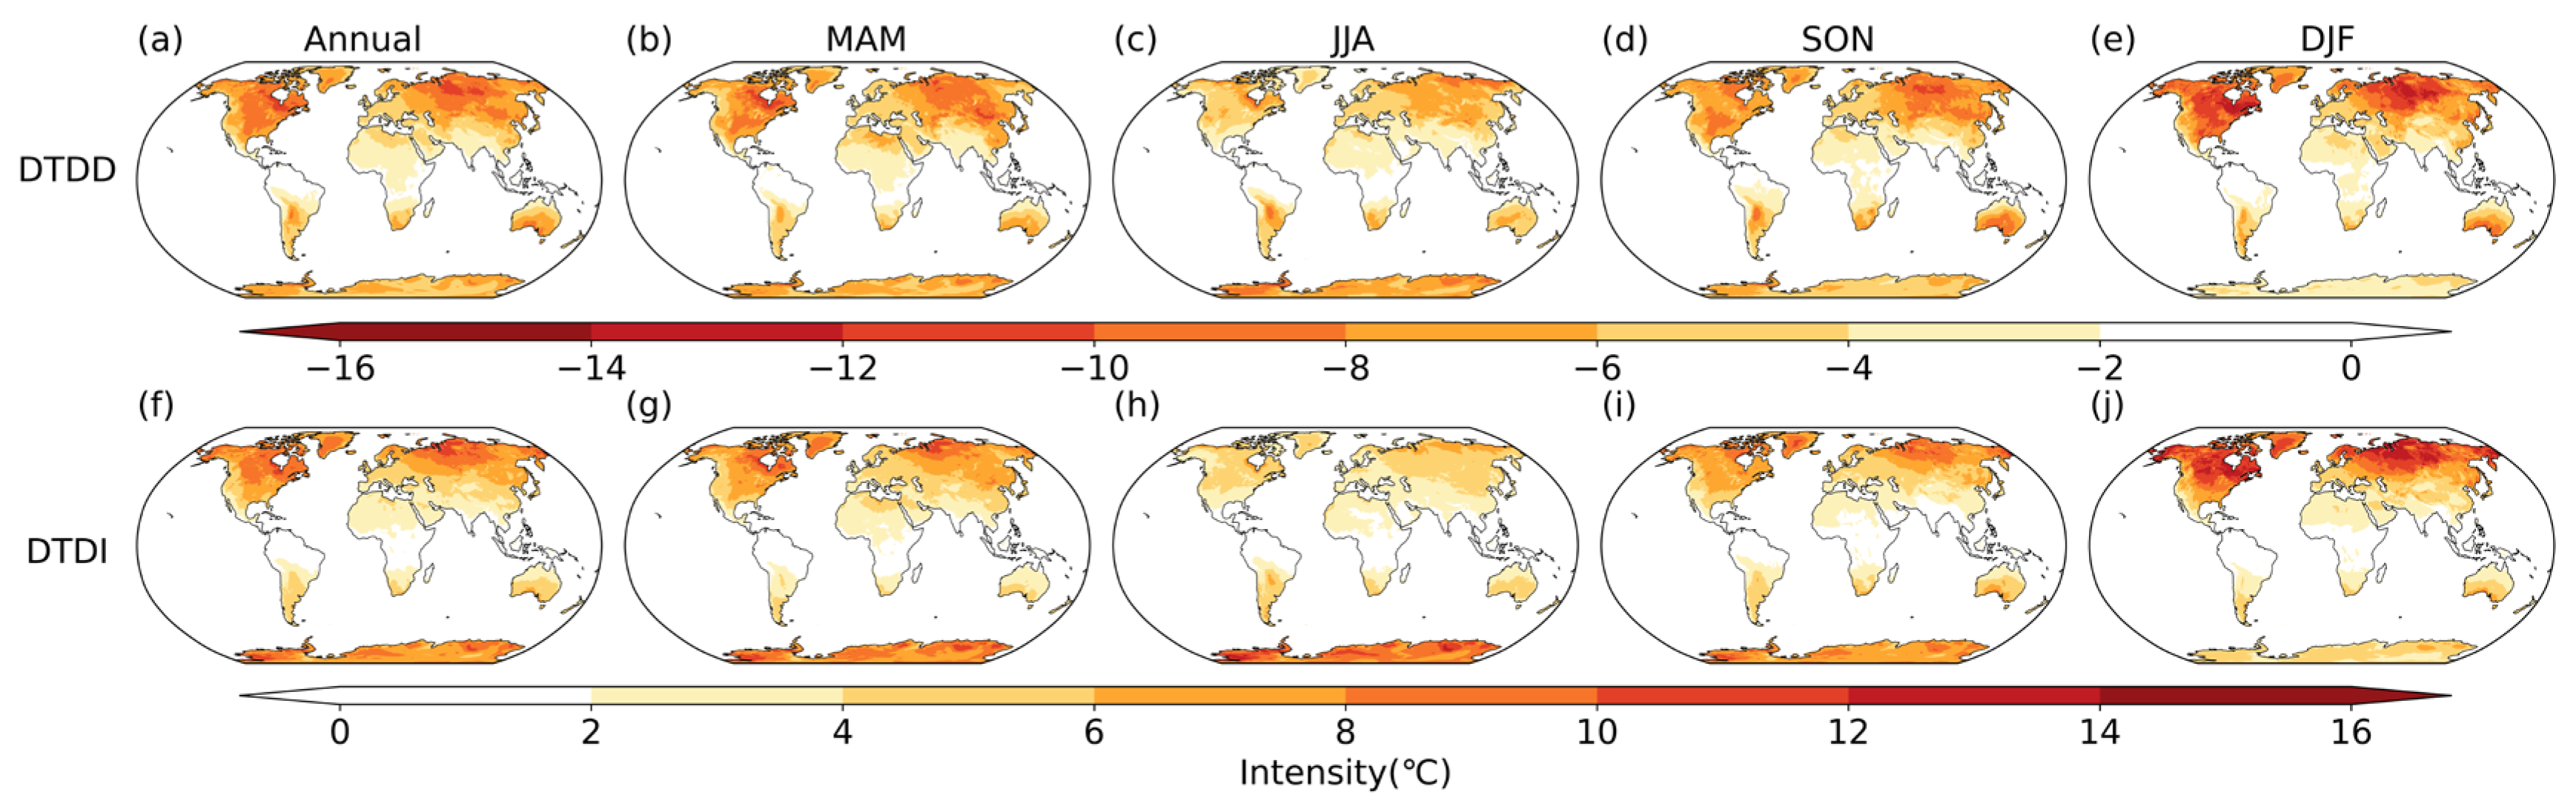
Figure 7 shows the spatial distributions of the average intensity of DTDD and DTDI. The spatial pattern of DTDD is broadly consistent with the climatological mean state. High-intensity regions are mainly found in the mid-to-high latitudes of the Northern Hemisphere, particularly over the West Siberian Plain in Eurasia and the eastern part of North America. The average intensity in these areas generally falls below −8 °C, and can drop to below −12 °C in winter. In the Southern Hemisphere, DTDD is most pronounced during autumn, with intensity generally increasing toward higher latitudes. Over South America, however, the lowest values occur in the central part of the continent, also below −8 °C. The spatial distribution of DTDI is similar to that of DTDD, but with slightly weaker intensity and more concentrated to higher latitudes. A comparison of the two types of extreme events indicates that DTDD is generally more intense than DTDI, suggesting that extreme cooling events exhibit larger amplitudes than warming events. These results are consistent with the findings of Zhou et al. [20], who employed an absolute threshold method to examine sudden day-to-day temperature changes exceeding 10 °C or falling below −10 °C. They argued that topography plays a key role in shaping the spatial distribution of extreme DTD events, with the North American Plains and the West Siberian Plain facilitating cold air outbreaks and thus becoming hotspots for frequent extreme DTD occurrences.
Figure 7.
Spatial distribution of the annual and seasonal climatological intensity of sudden day-to-day temperature decrease (DTDD) (a–e) and increase (DTDI) (f–j) events using ERA5 data from 1980 to 2020.
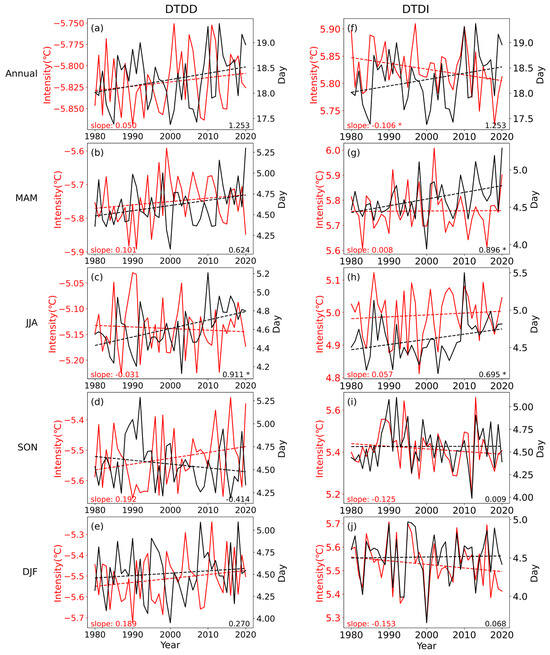
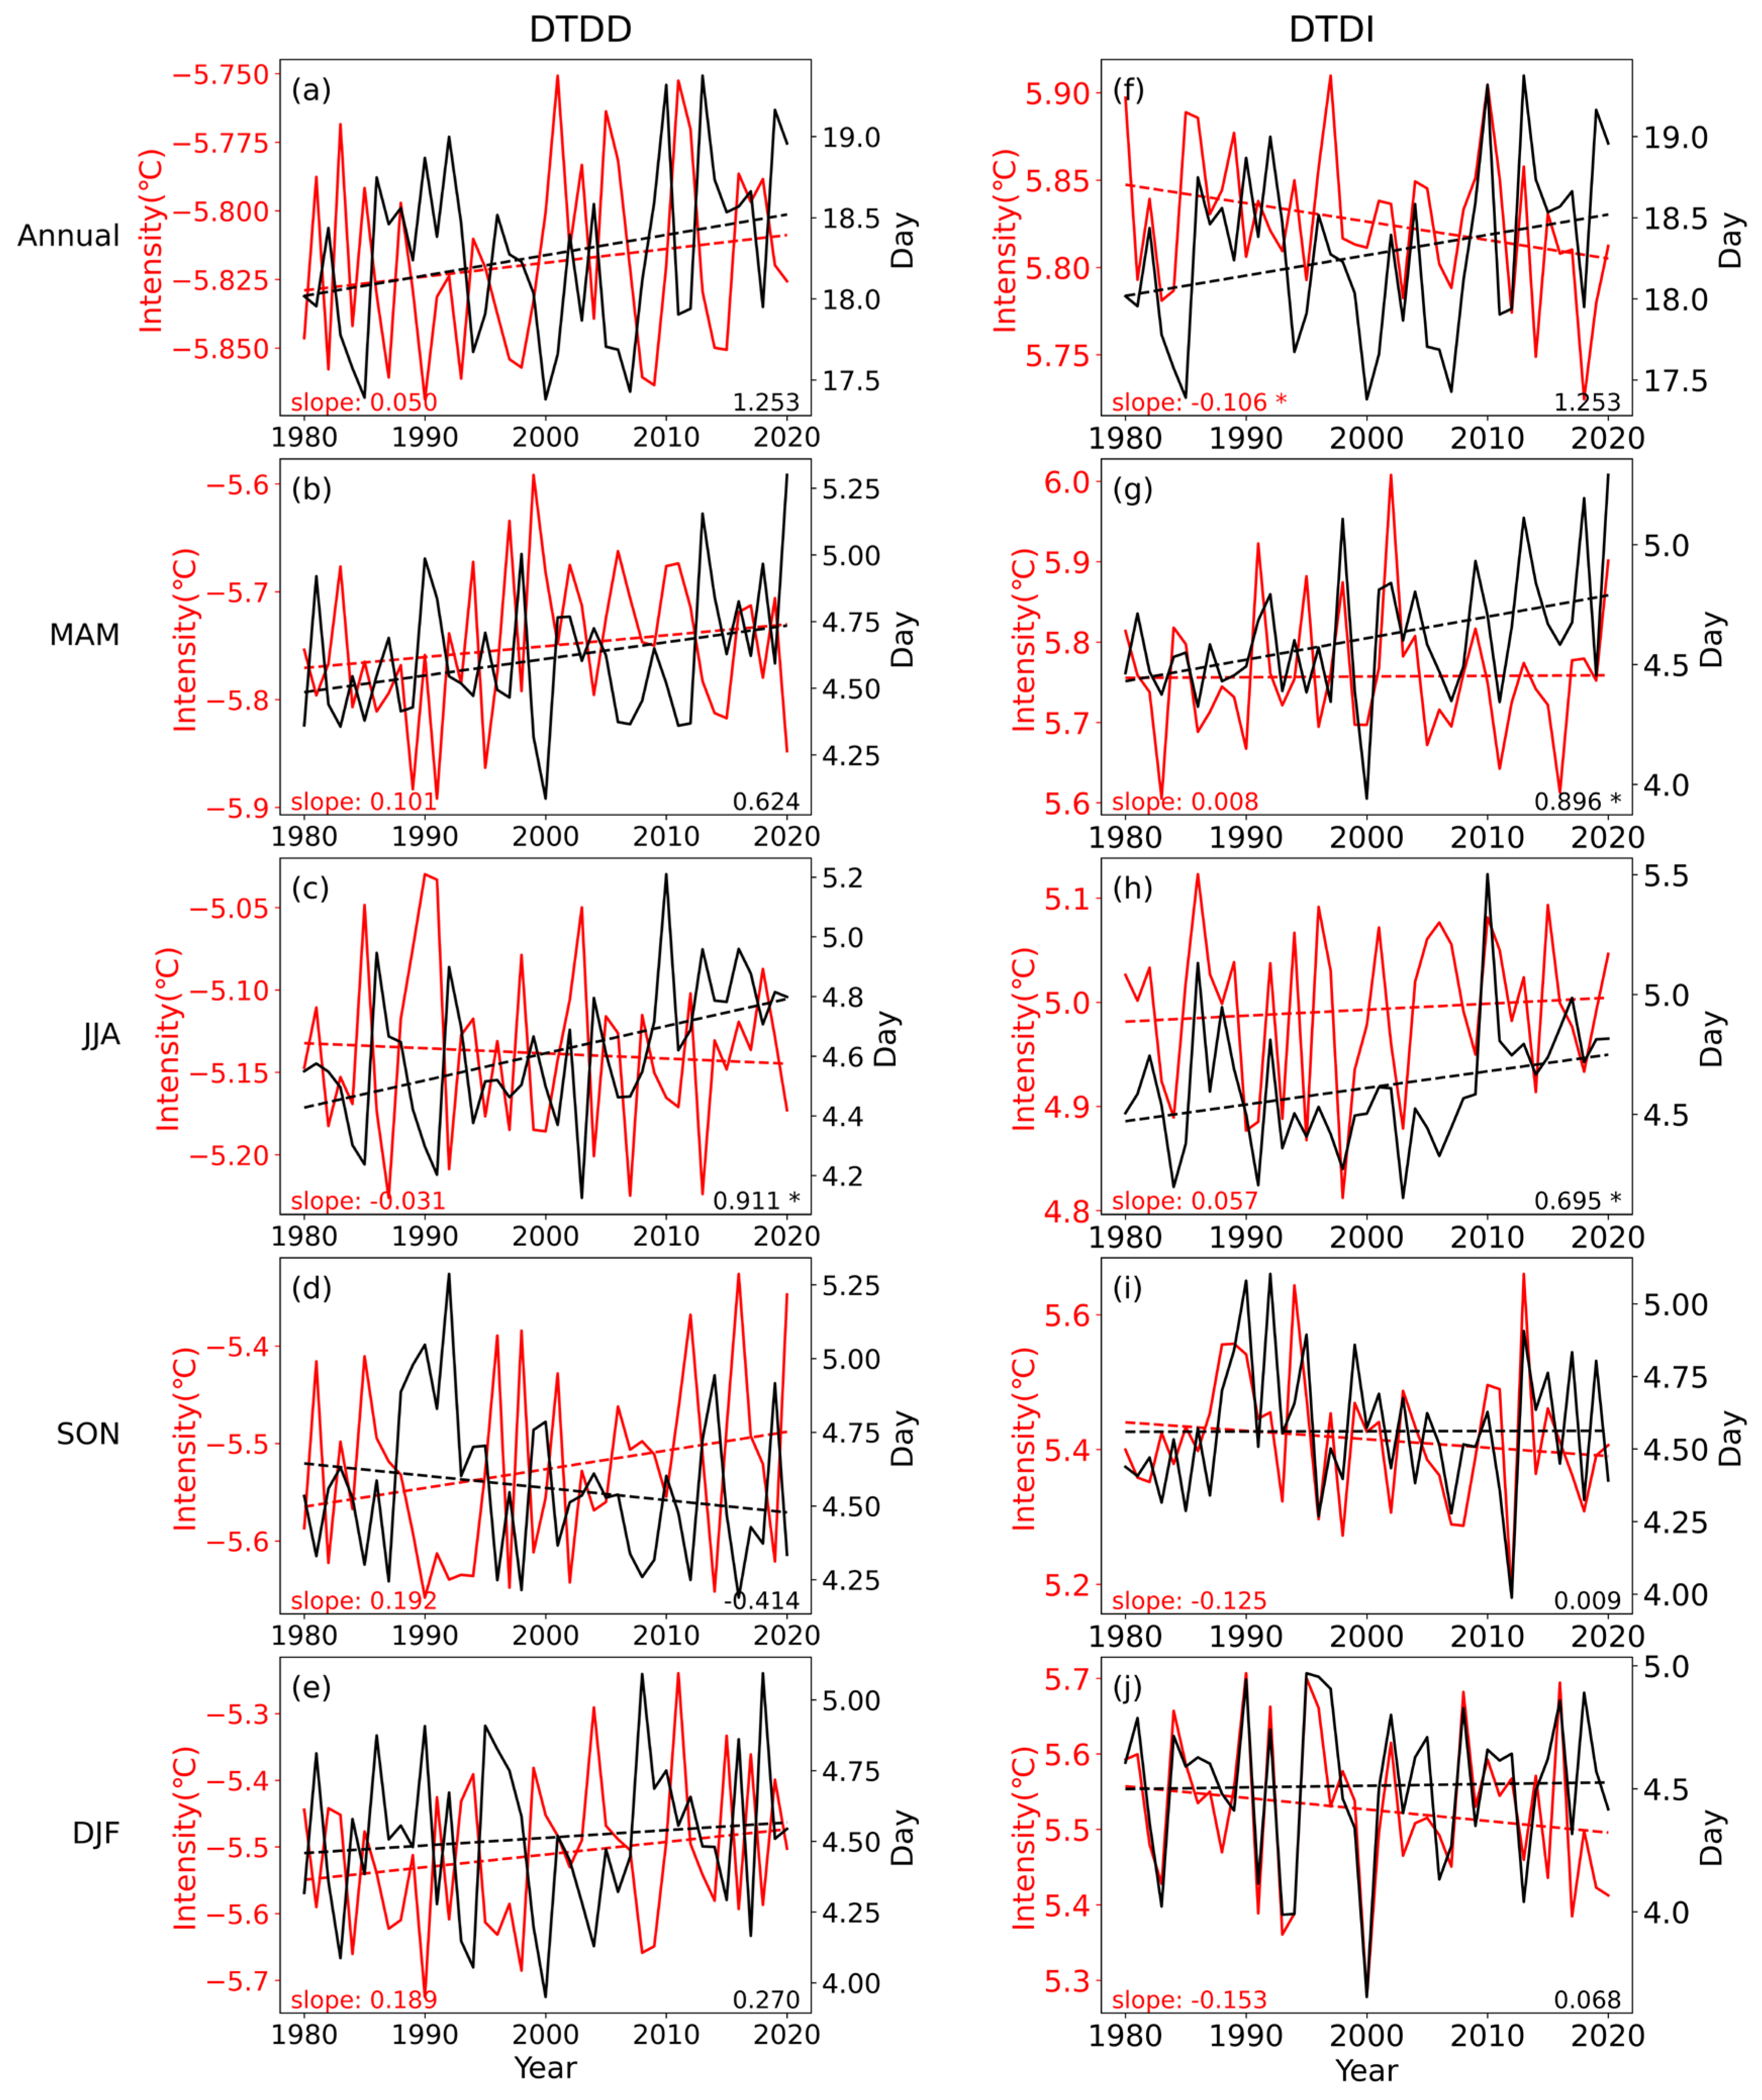
During 1980–2020, both the intensity and frequency of extreme DTD events have undergone considerable changes. As illustrated in Figure 8, the global annual mean frequency of both DTDI and DTDD increased during 1981–2020, while the DTDI intensity decreased significantly and DTDD intensity increased slightly. These patterns indicate that in recent decades, extreme DTD events have become more frequent but generally less intense. Seasonally, changes in the frequency and intensity of DTDD largely mirror the annual pattern, except for a more pronounced increase in intensity in summer and a decrease in frequency in autumn. By contrast, DTDI exhibits distinct seasonal differences, with its frequency increasing significantly in spring and summer without notable change in intensity, whereas in autumn and winter, the frequency remains relatively stable and the intensity decreases markedly.
Figure 8.
Time series of the annual and seasonal intensity (left, unit: °C) and frequency (right, unit: day) of DTDD (a–e) and DTDI (f–j) over global land from 1980 to 2020. Asterisks (*) indicate that the slope is statistically significant at the 0.05 level (p < 0.05).
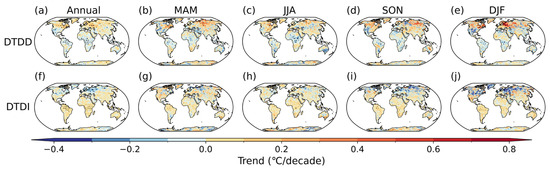
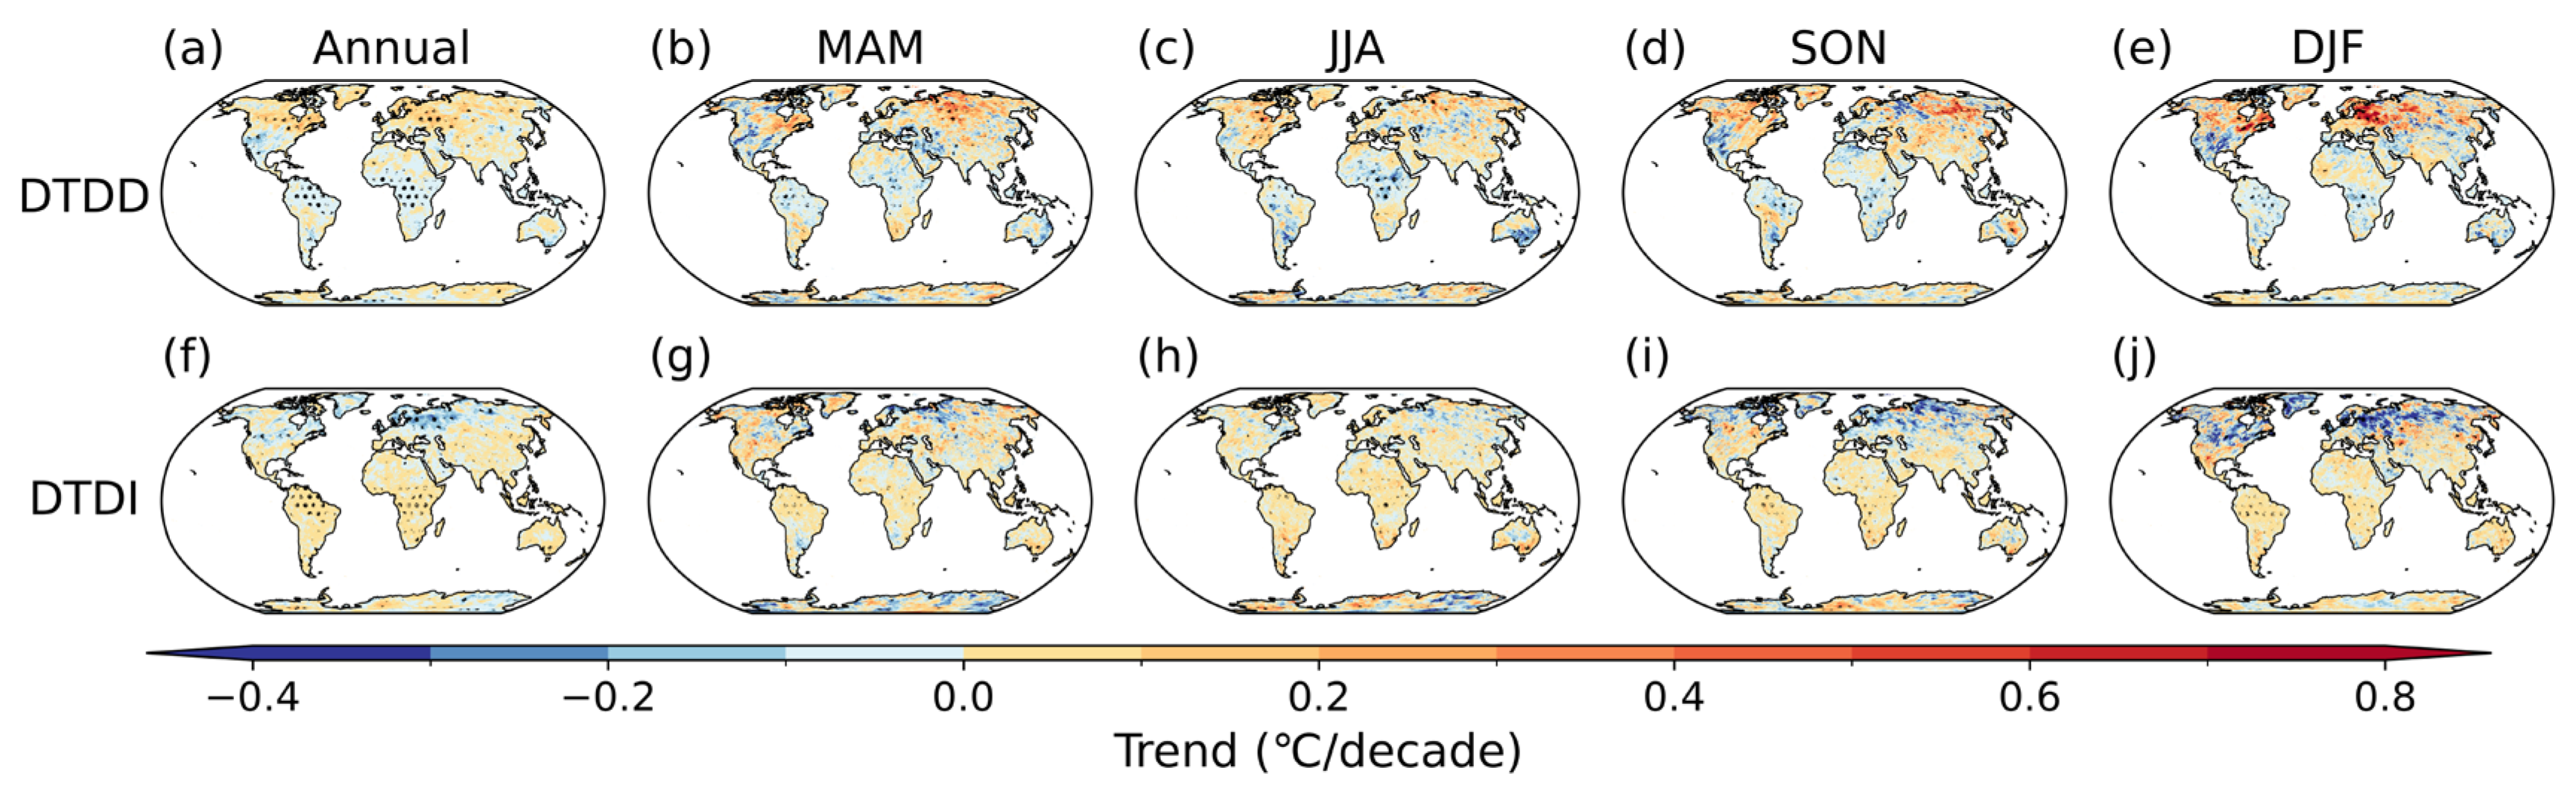
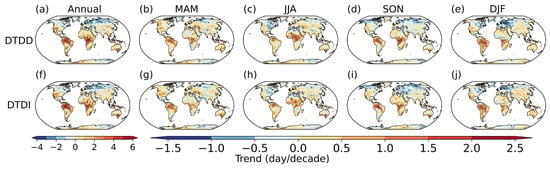
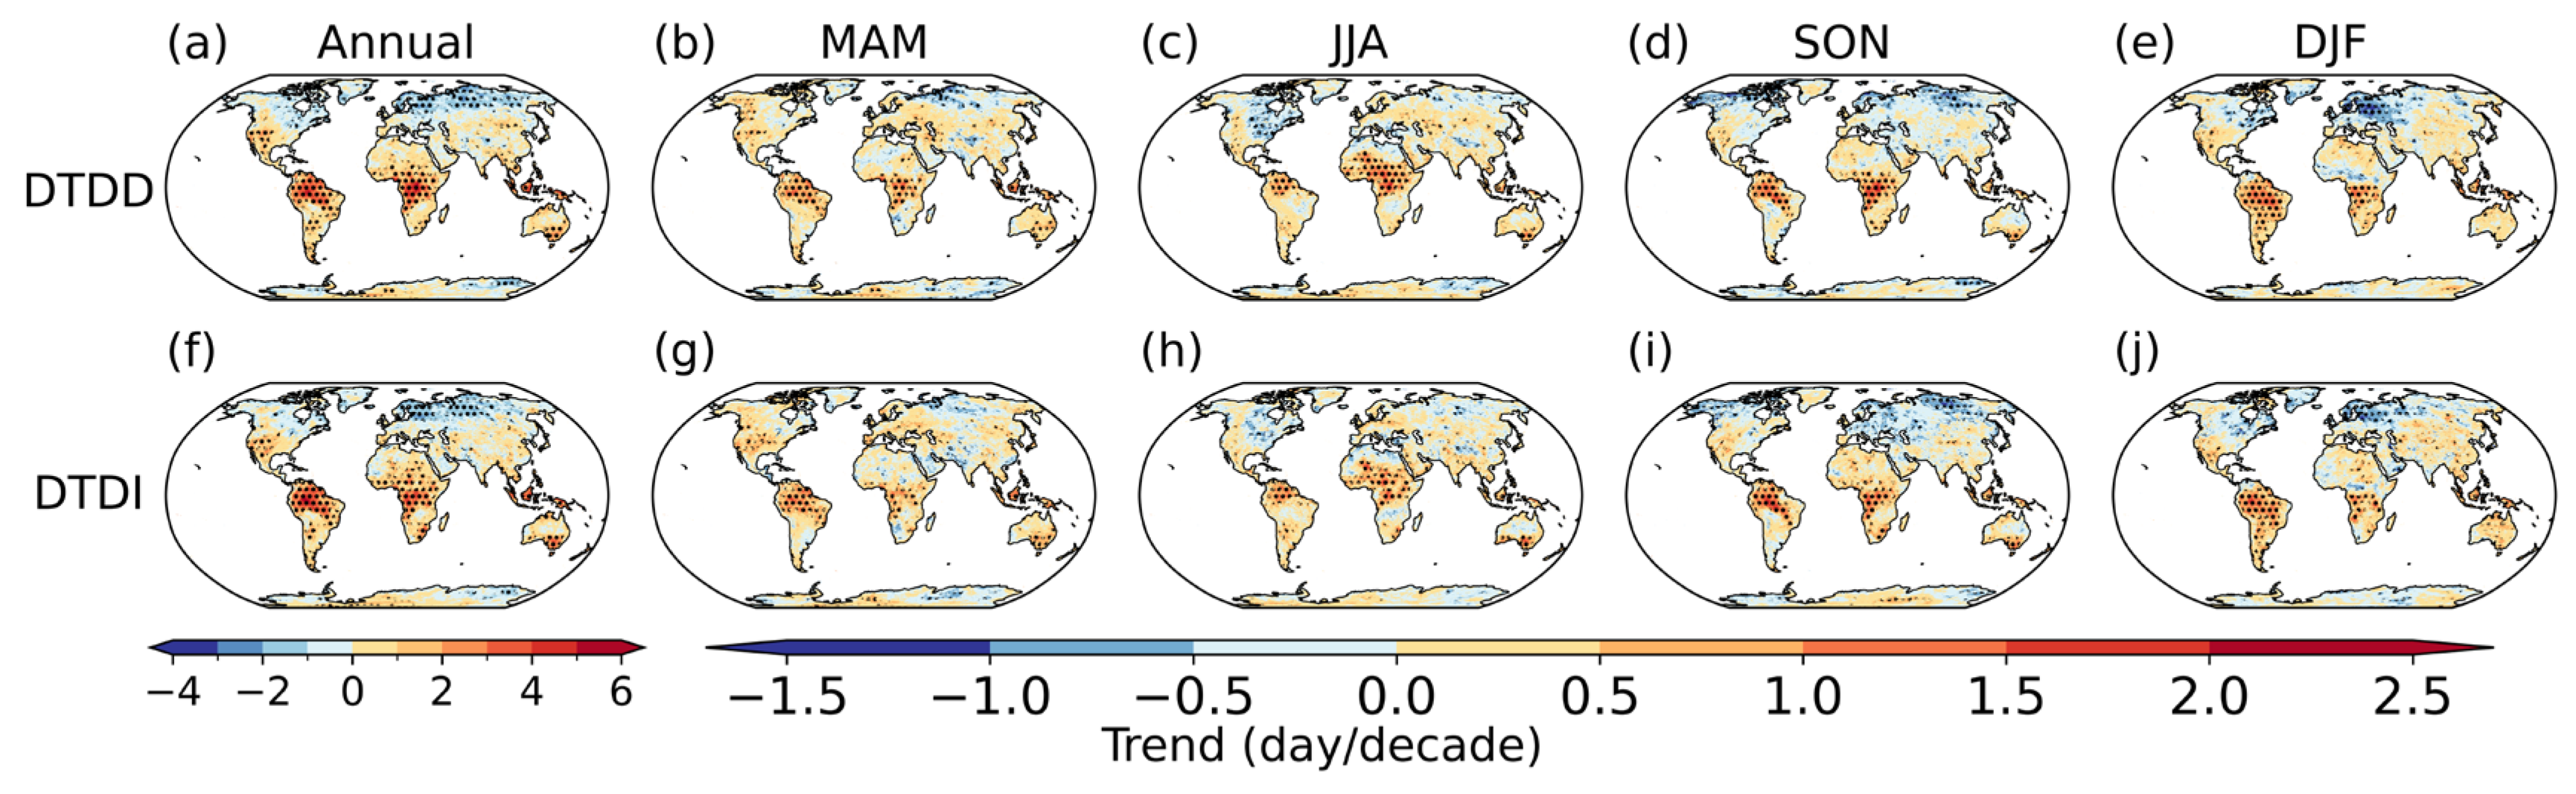
Figure 9 and Figure 10 illustrate the spatial distributions of trends in the intensity and frequency of DTD events during the period 1981–2020, respectively. The frequency trends for both DTDD and DTDI show similar spatial patterns, with decreases in high-latitude regions and increases in low-to-mid latitudes. Seasonally, the most significant increases in frequency occur during the summer in the low-to-mid latitudes of both hemispheres. In contrast, the largest decreases in frequency in the high latitudes of the Northern Hemisphere are observed in the West Siberian Plain during winter and central Siberia in autumn. Notable differences in intensity trends are found. DTDD intensity weakens in tropical regions but strengthens in other areas, particularly in the West Siberian Plain during winter. This indicates that sudden day-to-day temperature decrease events have become more severe in the tropics but less intense in other regions. Conversely, DTDI intensity shows a widespread global strengthening, except for regions in the West Siberian Plain and parts of North America, where weakening is observed. Liu et al. [21] documented a weakening in the intensity and frequency of extreme DTD events at high latitudes alongside an enhancement at low-to-mid latitudes during 1961–2020. While this broad pattern shows some consistency with our findings, certain regional discrepancies exist, potentially due to differences in the analysis periods. These differences show that changes in extreme DTD events may exhibit notable interdecadal variability, warranting further research.
Figure 9.
Spatial distribution of the annual and seasonal trends of the intensity of DTDD ((a–e), unit: °C/decade) and DTDI ((f–j), unit: °C/decade) over global land using ERA5 data from 1980 to 2020.
Figure 10.
Spatial distribution of the annual and seasonal trends of the frequency of DTDD ((a–e), unit: day/decade) and DTDI ((f–j), unit: day/decade) over global land using ERA5 data from 1980 to 2020.
4. Discussions
Surface observations provide a comprehensive record of historical meteorological conditions and are therefore commonly used as the reference dataset in climatological studies. Nevertheless, station observations are not uncertainty-free and may be affected by non-climatic influences, including changes and upgrades in instrumentation over time [44], urbanization effects [45], and station relocations [8]. In recent years, an increasing number of studies have compared regional DTD climatologies across multiple datasets and found that their skill in reproducing regional DTD differs [28,29]. Such cross-dataset comparisons highlight the need for continued evaluation in order to improve the representation of short-term temperature variability in reanalyses. In this study, we extend these assessments to the global scale and demonstrate that, although reanalyses generally capture the spatial and seasonal structure of DTD reasonably well, they still tend to systematically underestimate the magnitude of variability in several regions.
This underestimation may arise from multiple factors. First, compared to point-based observations, grid-cell area averaging smooths sharp spatial gradients and localized temperature jumps [46], thereby damping the amplitude of DTD. Second, biases can arise from the assimilation framework and model characteristics, including imperfect representation of frontal sharpness and boundary-layer processes, and parameterizations of sub-grid-scale variability [47]. More generally, reanalysis uncertainty tends to be larger when and where observations are sparse, implying weaker observational constraints on high-frequency near-surface variability in data-sparse regions [32,48]. Differences between ERA5 and ERA-Interim also reflect product-generation changes, including higher spatiotemporal resolution and updates to the assimilation system and model physics, which can influence the degree of effective smoothing and the representation of boundary-layer and frontal variability [32]. Accordingly, updates from ERA-Interim to ERA5 do not guarantee uniformly better performance across all regions and metrics, and independent evaluations have reported cases in which ERA-Interim is closer to observations than ERA5 [49]. Furthermore, land-surface processes that influence DTD, such as land-use and land-cover change [50], are not fully represented in most reanalysis systems and may further contribute to the underestimation.
Both station observations and the four reanalyses consistently show that DTD exhibits a clear meridional structure, with smaller values in the tropics increasing toward higher latitudes. This meridional gradient reflects fundamental differences in the processes that control short-term temperature variability. Using Lagrangian tracking methods, a recent study by Hamal and Pfahl [10] demonstrated that, in extratropical regions, DTD is primarily driven by horizontal advection associated with air-mass changes, whereas the contributions of adiabatic and diabatic processes are generally minor and spatially heterogeneous. In contrast, winter DTD in the tropics is predominantly governed by local diabatic processes linked to transitions between cloudy, rainy conditions and less cloudy, drier conditions. This interpretation is consistent with theoretical scaling arguments that relate short-term temperature variance to the strength of the meridional temperature gradient and baroclinic activity, both of which are larger at higher latitudes [51]. In addition to the influence of temperature advection, frontal structures are key drivers of DTD variability [52]. Process-based evidence from Central Europe links large DTD to frontal passages across all front types in winter and especially cold fronts in summer, implying that regions with more frequent frontal activity and air-mass exchanges exhibit larger DTD [53]. Taken together, these results indicate that spatial variations in meridional temperature gradient, frontal frequency, and local diabatic processes are key to explaining the observed meridional and regional differences in DTD.
Our results reveal a persistent weakening of DTD in high-latitude regions in recent decades, particularly during winter, whereas low-to-mid latitudes have experienced an overall strengthening of DTD. This pattern is consistent with previous studies [11,21], which attribute the observed DTD trends primarily to anthropogenic increases in global atmospheric greenhouse gas concentrations. The enhanced greenhouse effect reduces the equator-to-pole temperature gradient, thereby dampening DTD at high latitudes [11,21]. In low-to-mid latitudes, anthropogenic warming elevates DTD by intensifying synoptic-scale sea level pressure variability [54], boosting soil moisture variability, and diminishing mean soil moisture [55]. These changes collectively amplify short-term variations in precipitation and downward radiation while reducing surface heat capacity [21]. Future projections further indicate a pronounced weakening of winter DTD in high latitude by the end of the century, alongside a slight intensification in tropical regions [11]. Under carbon-neutral pathways, Wang et al. [56] demonstrate that future reductions in anthropogenic aerosols exert a stronger influence on rapid temperature variability than greenhouse gases or tropospheric ozone, leading to a further suppression of short-term temperature fluctuations—including DTD—across the mid-to-high latitudes of the Northern Hemisphere.
Beyond external forcing, internal climate variability also modulates DTD on inter-annual to decadal timescales. The Arctic Oscillation (AO) significantly correlates with DTD patterns across different regions, exhibiting negative correlations in China, Europe, and North Asia, but positive correlations in the United States [9,20]. Additionally, recent studies reveal that DTD variations over the extratropics are fundamentally driven by synoptic circulation patterns, specifically troughs and ridges in the 500 hPa geopotential height field [10,57]. These synoptic features are in turn modulated by large-scale modes, such as Atlantic Multidecadal Variability, the North Atlantic Oscillation, or Southern Annular Mode. To further explore the decadal evolution of DTD, the analysis period is divided into four distinct sub-periods. It is found that regional asynchrony in DTD trends becomes apparent (Figure S13). For example, Europe exhibits a transition from increasing DTD trends in the 1990s to decreasing trends after the 2000s, while North America shows an increasing trend from 1980 to 1990, followed by a decreasing trend from 1990 to 1999. These divergent regional patterns suggest that the dominant internal variability modes influencing decadal-scale DTD changes vary geographically. Despite these findings, the mechanisms underlying internal variability modulation of DTD at decadal and longer timescales remain poorly understood and merit further investigation. Note that land-surface changes such as deforestation [50] and urbanization [58] also play a non-negligible role in modulating regional DTD.
5. Limitations and Implications for Reanalysis-Based Impact Studies
However, several limitations should be considered when interpreting our evaluation and when applying reanalysis-based DTD metrics in impact-oriented studies. First, the station datasets used here are not homogenized, so non-climatic factors such as instrument changes, urbanization influences, and station relocations may introduce discontinuities and potentially bias local trend estimates. Second, we do not apply an explicit elevation correction when comparing stations with reanalyses. Although a time-invariant lapse-rate adjustment would largely cancel in a day-to-day difference metric such as DTD, we nevertheless conducted a sensitivity test to quantify its potential influence. Using ERA5, we applied a standard constant environmental lapse rate (6.5 K km−1) based on the elevation difference between each station and the corresponding ERA5 grid-cell orography, and then recomputed the 1980–2020 DTD climatology. The lapse-rate-corrected and uncorrected DTD fields are effectively identical at the precision shown (Figure S14), indicating that a conventional constant lapse-rate correction has a negligible impact on our DTD estimates. However, this cancelation does not eliminate other complex-terrain uncertainties beyond a simple constant offset. In mountainous regions, orographic smoothing, grid–station elevation mismatches, and sub-grid heterogeneity can influence near-surface temperature variability by modifying boundary-layer structure, snow cover, and local circulations. These effects can lead to time-varying differences between grid-cell estimates and point-based observations, which do not fully cancel out in DTD. Third, owing to sparse high-elevation station coverage, the elevation-dependence analysis relies primarily on a single reanalysis dataset (ERA5), and whether the ERA5-based DTD–elevation relationship holds in observations requires further validation. Collectively, these limitations imply that reanalysis-based impact assessments may underestimate exposure to rapid DTD changes and could bias risk metrics based on threshold exceedances. We therefore recommend cautious application, particularly in complex terrain and rapidly changing land-surface environments, including bias-aware use of reanalyses, cross-validation with station observations where available, and sensitivity checks using multiple reanalyses when feasible.
6. Conclusions
As a key metric for quantifying short-term temperature variability within the climate system, DTD offers critical insights into the mechanisms driving extreme weather events such as heatwaves and cold surges. Using station observations as a benchmark, this study evaluates the performance of four widely used reanalysis datasets—ERA-Interim, ERA5, JRA-55, and MERRA-2—in representing the spatiotemporal characteristics of DTD.
All datasets reproduce the large-scale spatial structure of DTD, but they consistently underestimate DTD globally, except over eastern China. Overall, the reanalyses shift the DTD probability distribution toward weaker variability, overestimating low-DTD occurrences while underrepresenting strong DTD extremes, with pronounced regional and seasonal dependence. ERA-Interim and ERA5 show the best overall agreement with observations, particularly at high latitudes and in winter, whereas JRA-55 performs better at low-to-mid latitudes. Moreover, reanalysis-based DTD trends contradict station-derived trends over the low latitudes and the Southern Hemisphere, implying that reanalysis-only inferences of DTD changes in data-sparse regions should be treated with caution.
Leveraging the better-performing ERA5 for process-oriented diagnostics, we further reveal that DTD–elevation relationships are highly mountain- and season-dependent, and that extreme DTD events have become more frequent but generally less intense in recent decades. These results highlight that misrepresentation of DTD in reanalyses can propagate into assessments of temperature extremes, compound-event risk, and subseasonal predictability, and may bias climate model evaluation and related projection-based interpretations.
Previous studies have confirmed that DTD can be recognized as an independent health risk factor, distinct from the effects of mean temperature or extreme temperature events [21,59,60]. DTD exhibits significant positive associations with all-cause mortality and is particularly detrimental to vulnerable populations, such as the elderly, by exacerbating risks of cardiovascular and respiratory diseases [21,59,60]. Regions identified in this study as experiencing high or rapidly increasing DTD warrant special attention in future assessments of climate-related health risks.
Supplementary Materials
The following supporting information can be downloaded at https://www.mdpi.com/article/10.3390/atmos17030235/s1; Figure S1: Distribution of in-situ station data over global land. Light yellow dots represent all stations from the original dataset, while dark yellow dots indicate the stations selected for use in this study. The dashed lines represent the boundaries of the subregions: the northern North America (NNA), southern North America (SNA), South America (SSA), Europe (EU), northern Asia (NA), and southern Asia (SA); Figure S2: Climatological mean DTD (°C) from station observations for the annual mean during 1980–2020: (a) computed using temporal interpolation to fill missing values and (b) computed without interpolation (i.e., excluding missing values); Figure S3: Spatial distribution of DTD trends from station observations during 1980–2020 (°C decade−1): (a) computed using temporal interpolation to fill missing values and (b) computed without interpolation (i.e., excluding missing values). Triangles denote stations where the trend is statistically significant at the 0.05 level; Figure S4: Spatial distribution of the difference in climatological mean DTD (unit: °C) between bilinear and nearest-neighbor interpolation methods for the annual mean during 1980–2020; Figure S5: Time series of (a) annual and (b) seasonal DTD from in-situ stations and reanalysis datasets during 1980–2020 (unit: °C); Figure S6: Taylor diagrams evaluating the trend of DTD from four reanalysis datasets against station observations over global land for (a) annual and (b) seasonal means; Figure S7: Summer (JJA) probability density functions (PDFs) of DTD for in-situ station and reanalysis datasets over the globe (a) and subregions (b: Northern North America (NNA); c: Europe (EU); d: northern Asia (NA); e: Southern North America (SNA); f: southern Asia (SA); g: South America (SSA)) for the period 1980–2020; Figure S8: As Figure S7, but for winter (DJF); Figure S9: Global land surface elevation from the ERA5 dataset. The five mountainous study regions are highlighted with rectangles: the Tibetan Plateau (TP, 25–42° N, 65–105° E), the Rocky Mountains (RO, 30–50° N, 125–95° W), the northern tropical Andes (ANN, 23–0° S, 80–60° W), the southern Andes (ANS, 40–23° S, 80–60° W), and the European Alps (GAR, 43–49° N, 4–19° E); Figure S10: Spatial distribution of the annual climatological intensity of sudden day-to-day temperature decrease (DTDD) (a) and increase (DTDI) (b) events using station data from 1980 to 2020.; Figure S11: Spatial distribution of the annual trends of the intensity of DTDD (a, unit: °C/decade) and DTDI (b, unit: °C/decade) over global land using station data during from 1980 to 2020. Triangles denote stations where the trend is statistically significant at the 0.05 level.; Figure S12: As Figure S11, but for frequency (unit: day/decade). Triangles denote stations where the trend is statistically significant at the 0.05 level; Figure S13: Spatial distribution of DTD trends for (a) the full period 1980–2020, compared to decadal periods: (b) 1980–1989, (c) 1990–1999, (d) 2000–2009, and (e) 2010–2020. (Unit: °C/decade) Triangles denote stations where the trend is statistically significant at the 0.05 level; Figure S14: Climatological mean DTD (unit: °C) derived from ERA5 at station locations for the annual mean during 1980–2020: (a) original (no elevation correction) and (b) after lapse-rate correction using a constant environmental lapse rate of 6.5 °C km−1.
Author Contributions
Conceptualization, X.C. and X.N.; methodology, X.C.; software, X.C.; writing—original draft preparation, X.C.; writing—review and editing, X.N., P.L., L.H., J.Z. and Y.M.; visualization, X.C.; supervision, X.N.; project administration, X.N.; funding acquisition, X.N. All authors have read and agreed to the published version of the manuscript.
Funding
The research is supported by China Meteorological Administration Climate Change Special Program (No. QBZ202303) and China University of Geosciences (Wuhan) (CUG2106205).
Institutional Review Board Statement
Not applicable.
Informed Consent Statement
Not applicable.
Data Availability Statement
The observational datasets can be freely accessed from the China Meteorological Administration (CMA) (https://data.cma.cn/en (accessed on 17 January 2026)), the Global Surface Summary of the Day (GSOD) provided by the National Centers for Environmental Information (NCEI) (https://www.ncei.noaa.gov/data/global-summary-of-the-day/ (accessed on 17 January 2026)), and the Global Historical Climatology Network Daily (GHCND) from the National Oceanic and Atmospheric Administration (NOAA) (https://www.ncei.noaa.gov/data/global-historical-climatology-network-daily/ (accessed on 17 January 2026)). The reanalysis datasets, including ERA5 (https://cds.climate.copernicus.eu/ (accessed on 17 January 2026)), JRA-55 (https://climatedataguide.ucar.edu/climate-data/jra-55 (accessed on 17 January 2026)), ERA-Interim (https://www.ecmwf.int/en/forecasts/datasets/reanalysis-datasets/era-interim (accessed on 17 January 2026)), and MERRA-2 (https://gmao.gsfc.nasa.gov/reanalysis/MERRA-2/ (accessed on 17 January 2026)), can also be freely downloaded from their respective portals.
Conflicts of Interest
The authors declare no conflicts of interest.
References
- Liu, Q.; Fu, C.; Xu, Z. Revisiting two indices measuring high-frequency daily variability. Int. J. Climatol. 2024, 44, 2792–2807. [Google Scholar] [CrossRef] [Scilit]
- Xue, T.; Zhu, T.; Zheng, Y.; Zhang, Q. Declines in mental health associated with air pollution and temperature variability in China. Nat. Commun. 2019, 10, 2165. [Google Scholar] [CrossRef] [Scilit] [PubMed]
- Chan, E.Y.Y.; Goggins, W.B.; Kim, J.J.; Griffiths, S.M. A study of intracity variation of temperature-related mortality and socioeconomic status among the Chinese population in Hong Kong. J. Epidemiol. Community Health 2012, 66, 322. [Google Scholar] [CrossRef] [Scilit] [PubMed]
- Jones, M.E.; Bromwich, D.H.; Nicolas, J.P.; Carrasco, J.; Plavcová, E.; Zou, X.; Wang, S. Sixty Years of Widespread Warming in the Southern Middle and High Latitudes (1957–2016). J. Clim. 2019, 32, 6875–6898. [Google Scholar] [CrossRef] [Scilit]
- Li, J.; Thompson, D.W.J. Widespread changes in surface temperature persistence under climate change. Nature 2021, 599, 425–430. [Google Scholar] [CrossRef] [Scilit]
- Qian, C.; Zhang, X.; Li, Z. Linear trends in temperature extremes in China, with an emphasis on non-Gaussian and serially dependent characteristics. Clim. Dyn. 2019, 53, 533–550. [Google Scholar] [CrossRef] [Scilit]
- Byrne, M.P. Amplified warming of extreme temperatures over tropical land. Nat. Geosci. 2021, 14, 837–841. [Google Scholar] [CrossRef] [Scilit]
- Krauskopf, T.; Huth, R. Trends in intraseasonal temperature variability in Europe, 1961–2018. Int. J. Climatol. 2022, 42, 7298–7320. [Google Scholar] [CrossRef] [Scilit]
- Wu, F.; Fu, C.; Qian, Y.; Gao, Y.; Wang, S. High-frequency daily temperature variability in China and its relationship to large-scale circulation. Int. J. Climatol. 2017, 37, 570–582. [Google Scholar] [CrossRef] [Scilit]
- Hamal, K.; Pfahl, S. Physical processes leading to extreme day-to-day temperature change—Part 1: Present-day climate. Weather Clim. Dynam. 2025, 6, 879–899. [Google Scholar] [CrossRef] [Scilit]
- Xu, Z.; Huang, F.; Liu, Q.; Fu, C. Global pattern of historical and future changes in rapid temperature variability. Environ. Res. Lett. 2020, 15, 124073. [Google Scholar] [CrossRef] [Scilit]
- Gough, W.A. Theoretical considerations of day-to-day temperature variability applied to Toronto and Calgary, Canada data. Theor. Appl. Climatol. 2008, 94, 97–105. [Google Scholar] [CrossRef] [Scilit]
- Shi, K.; Wu, Y.; Liu, S.; Chen, Z.; Huang, C.; Cui, Y. Mapping and evaluating global urban entities (2000–2020): A novel perspective to delineate urban entities based on consistent nighttime light data. GIScience Remote Sens. 2023, 60, 2161199. [Google Scholar] [CrossRef] [Scilit]
- Ge, G.; Zhang, J.; Chen, X.; Liu, X.; Hao, Y.; Yang, X.; Kwon, S. Effects of land use and land cover change on ecosystem services in an arid desert-oasis ecotone along the Yellow River of China. Ecol. Eng. 2022, 176, 106512. [Google Scholar] [CrossRef] [Scilit]
- De Wekker, S.F.J.; Kossmann, M. Convective Boundary Layer Heights Over Mountainous Terrain—A Review of Concepts. Front. Earth Sci. 2015, 3, 77. [Google Scholar] [CrossRef] [Scilit]
- Ionita, M.; Cai, D.; Viorica, N. Temperature extremes across elevation gradients: Evidence from two German mountain observatories. Front. Earth Sci. 2025, 13, 1701260. [Google Scholar] [CrossRef] [Scilit]
- Screen, J.A. Arctic amplification decreases temperature variance in northern mid-to high-latitudes. Nat. Clim. Change 2014, 4, 577–582. [Google Scholar] [CrossRef] [Scilit]
- Kotz, M.; Wenz, L.; Stechemesser, A.; Kalkuhl, M.; Levermann, A. Day-to-day temperature variability reduces economic growth. Nat. Clim. Change 2021, 11, 319–325. [Google Scholar] [CrossRef] [Scilit]
- McKinnon, K.A.; Rhines, A.; Tingley, M.P.; Huybers, P. The changing shape of Northern Hemisphere summer temperature distributions. J. Geophys. Res. Atmos. 2016, 121, 8849–8868. [Google Scholar] [CrossRef] [Scilit]
- Zhou, X.; Wang, Q.; Yang, T. Decreases in days with sudden day-to-day temperature change in the warming world. Glob. Planet. Change 2020, 192, 103239. [Google Scholar] [CrossRef] [Scilit]
- Liu, Q.; Fu, C.; Xu, Z.; Ding, A. Global warming intensifies extreme day-to-day temperature changes in mid–low latitudes. Nat. Clim. Change 2025, 16, 69–76. [Google Scholar] [CrossRef] [Scilit]
- Nygård, T.; Papritz, L.; Naakka, T.; Vihma, T. Cold wintertime air masses over Europe: Where do they come from and how do they form? Weather Clim. Dynam. 2023, 4, 943–961. [Google Scholar] [CrossRef] [Scilit]
- Simmons, A.J.; Berrisford, P.; Dee, D.P.; Hersbach, H.; Hirahara, S.; Thépaut, J.N. A reassessment of temperature variations and trends from global reanalyses and monthly surface climatological datasets. Q. J. R. Meteorol. Soc. 2017, 143, 101–119. [Google Scholar] [CrossRef] [Scilit]
- Donat, M.G.; Sillmann, J.; Wild, S.; Alexander, L.V.; Lippmann, T.; Zwiers, F.W. Consistency of temperature and precipitation extremes across various global gridded in situ and reanalysis datasets. J. Clim. 2014, 27, 5019–5035. [Google Scholar] [CrossRef] [Scilit]
- Krauskopf, T.; Huth, R. Temperature trends in Europe: Comparison of different data sources. Theor. Appl. Climatol. 2020, 139, 1305–1316. [Google Scholar] [CrossRef] [Scilit]
- Huntingford, C.; Jones, P.D.; Livina, V.N.; Lenton, T.M.; Cox, P.M. No increase in global temperature variability despite changing regional patterns. Nature 2013, 500, 327–330. [Google Scholar] [CrossRef] [Scilit]
- Martineau, P.; Behera, S.K.; Nonaka, M.; Nakamura, H.; Kosaka, Y. Seasonally dependent increases in subweekly temperature variability over Southern Hemisphere landmasses detected in multiple reanalyses. Weather Clim. Dyn. 2024, 5, 1–15. [Google Scholar] [CrossRef] [Scilit]
- Krauskopf, T.; Huth, R. Trends in intraseasonal temperature variability in Europe: Comparison of station data with gridded data and reanalyses. Int. J. Climatol. 2024, 44, 3054–3074. [Google Scholar] [CrossRef] [Scilit]
- Huth, R.; Krauskopf, T. European Climatology of Day-to-Day Surface Air Temperature Difference in Multiple Data Sets. Int. J. Climatol. 2025, 45, e8839. [Google Scholar] [CrossRef] [Scilit]
- Menne, M.J.; Durre, I.; Vose, R.S.; Gleason, B.E.; Houston, T.G. An Overview of the Global Historical Climatology Network-Daily Database. J. Atmos. Ocean. Technol. 2012, 29, 897–910. [Google Scholar] [CrossRef] [Scilit]
- Dee, D.P.; Uppala, S.M.; Simmons, A.J.; Berrisford, P.; Poli, P.; Kobayashi, S.; Andrae, U.; Balmaseda, M.A.; Balsamo, G.; Bauer, P.; et al. The ERA-Interim reanalysis: Configuration and performance of the data assimilation system. Q. J. R. Meteorol. Soc. 2011, 137, 553–597. [Google Scholar] [CrossRef] [Scilit]
- Hersbach, H.; Bell, B.; Berrisford, P.; Hirahara, S.; Horányi, A.; Muñoz-Sabater, J.; Nicolas, J.; Peubey, C.; Radu, R.; Schepers, D.; et al. The ERA5 global reanalysis. Q. J. R. Meteorol. Soc. 2020, 146, 1999–2049. [Google Scholar] [CrossRef] [Scilit]
- Gelaro, R.; McCarty, W.; Suárez, M.J.; Todling, R.; Molod, A.; Takacs, L.; Randles, C.A.; Darmenov, A.; Bosilovich, M.G.; Reichle, R.; et al. The Modern-Era Retrospective Analysis for Research and Applications, Version 2 (MERRA-2). J. Clim. 2017, 30, 5419–5454. [Google Scholar] [CrossRef] [Scilit]
- Ebita, A.; Kobayashi, S.; Ota, Y.; Moriya, M.; Kumabe, R.; Onogi, K.; Harada, Y.; Yasui, S.; Miyaoka, K.; Takahashi, K.; et al. The Japanese 55-year Reanalysis “JRA-55”: An Interim Report. Sola 2011, 7, 149–152. [Google Scholar] [CrossRef] [Scilit]
- Tank, A.; Zwiers, F.; Zhang, X. Guidelines on Analysis of Extremes in a Changing Climate in Support of Informed Decisions for Adaptation; World Meteorological Organization: Geneva, Switzerland, 2009; pp. 1–49. [Google Scholar]
- Li, L.; Zhou, T.; Zhang, W. Updating the Baseline Period Affects the Detection of Extreme Climate Change in China. J. Geophys. Res. Atmos. 2025, 130, e2024JD042704. [Google Scholar] [CrossRef] [Scilit]
- Nakamura, H.; Sampe, T.; Tanimoto, Y.; Shimpo, A. Observed Associations Among Storm Tracks, Jet Streams and Midlatitude Oceanic Fronts. Earth’s Clim. 2004, 147, 329–345. [Google Scholar]
- Li, Y.; Neelin, J.D.; Kuo, Y.; Hsu, H.; Yu, J. How Close Are Leading Tropical Tropospheric Temperature Perturbations to Those under Convective Quasi Equilibrium? J. Atmos. Sci. 2022, 79, 2307–2321. [Google Scholar] [CrossRef] [Scilit]
- Ferguglia, O.; Palazzi, E.; Arnone, E. Elevation dependent change in ERA5 precipitation and its extremes. Clim. Dyn. 2024, 62, 8137–8153. [Google Scholar] [CrossRef] [Scilit]
- Niu, X.; Tang, J.; Chen, D.; Wang, S.; Ou, T.; Fu, C. The performance of CORDEX-EA-II simulations in simulating seasonal temperature and elevation-dependent warming over the Tibetan Plateau. Clim. Dyn. 2021, 57, 1135–1153. [Google Scholar] [CrossRef] [Scilit]
- Niu, X.; Tang, J.; Chen, D.; Wang, S.; Ou, T. Elevation-Dependent Warming Over the Tibetan Plateau From an Ensemble of CORDEX-EA Regional Climate Simulations. J. Geophys. Res. Atmos. 2021, 126, e2020JD033997. [Google Scholar] [CrossRef] [Scilit]
- Pepin, N.; Bradley, R.S.; Diaz, H.F.; Baraer, M.; Caceres, E.B.; Forsythe, N.; Fowler, H.; Greenwood, G.; Hashmi, M.Z.; Liu, X.D.; et al. Elevation-dependent warming in mountain regions of the world. Nat. Clim. Change 2015, 5, 424–430. [Google Scholar]
- Kim, D.; Deo, R.C.; Chung, J.; Lee, J. Projection of heat wave mortality related to climate change in Korea. Nat. Hazards 2016, 80, 623–637. [Google Scholar] [CrossRef] [Scilit]
- Guttman, N.B.; Baker, C.B. Exploratory Analysis of the Difference between Temperature Observations Recorded by ASOS and Conventional Methods. Bull. Am. Meteorol. Soc. 1996, 77, 2865–2874. [Google Scholar] [CrossRef] [Scilit]
- Shi, T.; Yang, Y.; Sun, D.; Huang, Y.; Shi, C. Influence of Changes in Meteorological Observational Environment on Urbanization Bias in Surface Air Temperature: A Review. Front. Clim. 2022, 3, 781999. [Google Scholar] [CrossRef] [Scilit]
- Director, H.; Bornn, L. Connecting Point-Level and Gridded Moments in the Analysis of Climate Data. J. Clim. 2015, 28, 3496–3510. [Google Scholar] [CrossRef] [Scilit]
- Soster, F.; Parfitt, R. On Objective Identification of Atmospheric Fronts and Frontal Precipitation in Reanalysis Datasets. J. Clim. 2022, 35, 4513–4534. [Google Scholar] [CrossRef] [Scilit]
- Kotlarski, S.; Szabó, P.; Herrera, S.; Räty, O.; Keuler, K.; Soares, P.M.; Cardoso, R.M.; Bosshard, T.; Pagé, C.; Boberg, F.; et al. Observational uncertainty and regional climate model evaluation: A pan-European perspective. Int. J. Climatol. 2019, 39, 3730–3749. [Google Scholar] [CrossRef] [Scilit]
- Virman, M.; Bister, M.; Räisänen, J.; Sinclair, V.; Järvinen, H. Radiosonde comparison of ERA5 and ERA-Interim reanalysis datasets over tropical oceans. Tellus A Dyn. Meteorol. Oceanogr. 2021, 73, 1929752. [Google Scholar] [CrossRef] [Scilit]
- Ge, J.; Liu, Q.; Zan, B.; Lin, Z.; Lu, S.; Qiu, B.; Guo, W. Deforestation intensifies daily temperature variability in the northern extratropics. Nat. Commun. 2022, 13, 5955. [Google Scholar] [CrossRef] [Scilit]
- Schneider, T.; Bischoff, T.; Płotka, H. Physics of Changes in Synoptic Midlatitude Temperature Variability. J. Clim. 2015, 28, 2312–2331. [Google Scholar] [CrossRef] [Scilit]
- Lucarini, V.; Ghil, M. The physics of climate variability and climate change. Rev. Mod. Phys. 2020, 92, 35002. [Google Scholar] [CrossRef] [Scilit]
- Piskala, V.; Huth, R. Asymmetry of day-to-day temperature changes and its causes. Theor. Appl. Climatol. 2020, 140, 683–690. [Google Scholar] [CrossRef] [Scilit]
- Seeley, J.T.; Romps, D.M. Why does tropical convective available potential energy (CAPE) increase with warming? Geophys. Res. Lett. 2015, 42, 10429–10437. [Google Scholar] [CrossRef] [Scilit]
- Wang, Y.; Zuo, Z.; Qiao, L.; Zhang, K.; Chang, M.; Xiao, D.; Lin, Z.; Wang, H. Amplification effect of intra-seasonal variability of soil moisture on heat extremes over Eurasia. Adv. Clim. Change Res. 2024, 15, 1–8. [Google Scholar] [CrossRef] [Scilit]
- Wang, P.; Ye, F.; Yang, Y.; Tang, J.; Liao, H. Mitigated Rapid Temperature Variability in the Northern Mid-High Latitudes Under Carbon Neutrality. Geophys. Res. Lett. 2025, 52, e2025GL118040. [Google Scholar] [CrossRef] [Scilit]
- Wang, X.; Wang, K.; Mao, Y.; Wu, G. Day-to-Day Temperature Variability in Meteorological Observations and Reanalysis Data Over China. Earth Space Sci. 2025, 12, e2025EA004573. [Google Scholar] [CrossRef] [Scilit]
- Tam, B.Y.; Gough, W.A.; Mohsin, T. The impact of urbanization and the urban heat island effect on day to day temperature variation. Urban Clim. 2015, 12, 1–10. [Google Scholar] [CrossRef] [Scilit]
- Liu, Q.; Tan, Z.; Sun, J.; Hou, Y.; Fu, C.; Wu, Z. Changing rapid weather variability increases influenza epidemic risk in a warming climate. Environ. Res. Lett. 2020, 15, 44004. [Google Scholar] [CrossRef] [Scilit]
- Wu, Y.; Li, S.; Zhao, Q.; Wen, B.; Gasparrini, A.; Tong, S.; Overcenco, A.; Urban, A.; Schneider, A.; Entezari, A.; et al. Global, regional, and national burden of mortality associated with short-term temperature variability from 2000–19: A three-stage modelling study. Lancet Planet. Health 2022, 6, e410–e421. [Google Scholar] [CrossRef] [Scilit]

Disclaimer/Publisher’s Note: The statements, opinions and data contained in all publications are solely those of the individual author(s) and contributor(s) and not of MDPI and/or the editor(s). MDPI and/or the editor(s) disclaim responsibility for any injury to people or property resulting from any ideas, methods, instructions or products referred to in the content. |
© 2026 by the authors. Licensee MDPI, Basel, Switzerland. This article is an open access article distributed under the terms and conditions of the Creative Commons Attribution (CC BY) license.