


Abstract
This study investigates the temporal and latitudinal variability of the ionosphere over the Indian longitude region during the intense geomagnetic storm from 1 to 3 June 2025, using GNSS receiver observations and magnetometer recordings, along with space-based measurements from in situ Swarm satellite, COSMIC-2 radio occultation, GUVI/TIMED-derived O/N2 ratios, and model-derived electric fields. This particular event is relatively new and is characterized by the bifurcated variation with two distinct main phases separated by a short-lived recovery phase. The results revealed distinct features associated with the geomagnetic storm, including positive and negative ionospheric phases, thermospheric compositional changes, and the latitudinal propagation of disturbances. On 1 June, the observed strong positive ionospheric storm was driven by Prompt Penetration Electric Fields (PPEFs) and equatorward neutral winds, which triggered the upliftment of F-region plasma to higher altitudes through the enhanced equatorial fountain effect, leading to an unusually long-lasting Total Electron Content (TEC) enhancement from day to night. The analysis also revealed the distinct latitudinal behaviour, exhibiting the clear poleward extension of the Equatorial Ionization Anomaly (EIA) crest and significant TEC enhancements (~150–200% of the quiet day values) from low to mid latitudes as compared to the equatorial location through an efficient plasma redistribution. Conversely, pronounced negative ionospheric storm effect at almost all latitudinal locations on 2 June confirms complex and unusual storm-time dynamics, with inhibited upward plasma drifts due to the presence of Disturbance Dynamo Electric Fields (DDEFs), while the thermospheric O/N2 ratio caused an extensive decrease in electron density over the Indian region. Minor negative storm noticed on 3 June coincides with the storm recovery period, reflecting prolonged disturbance dynamo effects and gradual recovery in thermospheric conditions. Overall, the current study highlights the strong sensitivity of the regional ionosphere to prevailing coupled electrodynamic-thermospheric forcing during the June 2025 geomagnetic storm that has not yet been reported for this event over the Indian longitude sector. Moreover, the findings from this study underscore peculiar storm-time behaviour of summer solstice ionosphere over the Indian longitude sector, driven by complex coupled processes which could be incorporated into ionospheric models and forecasting frameworks.
1. Introduction
The ionosphere is a critical and electrodynamically active region that plays a crucial role in the performance of satellite-based communication and navigation systems. Its plasma composition, electron density, and altitude structure are primarily modulated by solar radiation and geomagnetic forcing. Geomagnetic storms are often triggered by intense solar wind and coronal mass ejections which inject massive energy and charged particles into Earth’s magnetosphere and upper atmosphere. This disrupts the ionosphere’s chemical, dynamical, and electrodynamic balance, causing heating, plasma instabilities, and large-scale currents [1,2,3]. Disturbances in the ionosphere cause serious effects on the radio-wave signals in space-based satellite communication, data transmission and navigation systems as they rely on transionospheric signal propagation. An in-depth understanding of the global as well as regional ionospheric response to the major geomagnetic storms is essential for mitigating their impacts on the modern critical infrastructure [4,5].
During geomagnetic storms, the redistribution of ionospheric electric fields and currents in the equatorial and low latitude region is predominantly governed by the Prompt Penetration Electric Fields (PPEFs) and Disturbance Dynamo Electric Fields (DDEFs), leading to either positive or negative ionospheric storms [6,7,8]. During the main phase of the geomagnetic storm, the convection electric fields are strengthened by the interaction between the solar wind and the magnetosphere, which allows the rapid penetration of high-latitude electric fields to low and equatorial latitudes. This process leads to the development of PPEFs [9,10]. These PPEFs act on a short time scale by abruptly modifying the electrodynamics of the equatorial ionosphere. They cause sudden changes in the distribution of ionospheric plasma by significantly altering vertical plasma drifts and subsequent horizontal transport of plasma to higher latitudes away from the equator [6,11,12]. During the daytime storm, occurrence of PPEFs intensifies the eastward equatorial electric field to cause a stronger Equatorial Electrojet (EEJ). This enhances the regular fountain effect, producing an intensified Equatorial Ionization Anomaly (EIA) crest [13,14,15]. After the initial effects of PPEFs on the ionosphere, DDEFs gradually develop as the secondary effect. These DDEFs are generated by storm-time modifications to neutral winds and altered global ionospheric current systems. The development of DDEFs occurs gradually over several hours and creates westward electric fields that cause downward plasma drifts and ionospheric density depletion during the recovery phase [16,17]. Energy deposition at high latitudes triggers thermospheric heating and expansion. This drives equatorward propagation of neutral winds, which influences the ionosphere by modifying plasma dynamics through ion-neutral collisions. The storm-time thermospheric winds can redistribute ionospheric plasma and strongly influence overall ionospheric response [18]. They also play a critical role in the generation of DDEFs by driving dynamo currents in the ionosphere [19]. In brief, PPEFs, DDEFs, and storm-enhanced thermospheric winds interact dynamically and modulate ionospheric density, composition, and structure during the episode of geomagnetic storms. It is important to understand the abnormal low-latitude ionospheric response to diverse geomagnetic storms, particularly over the Indian longitude sector. This region is highly significant due to its complex electrodynamic processes, driven by EEJ, EIA and the frequent occurrence of post-sunset ionospheric irregularities [20].
Over the past decades, several studies have been conducted across the globe, revealing a diverse set of physical processes governing the storm-time behaviour of the ionosphere [21,22,23,24,25,26]. Hibbert and Rose [21] reported an enhanced TEC and peak electron concentrations over the mid latitudes during the initial phase of the storm, followed by a reduction in magnitude below quiet-time levels before attaining normalcy through a recovery period of one to two days. The results from numerical simulations by Fuller-Rowell et al. [22] demonstrated that geomagnetic storms often trigger Joule heating at high latitudes, causing a rise in thermospheric temperature. The enhanced thermospheric temperature can drive strong neutral winds and manifest as global wind surge and large-scale gravity waves. The storm-induced winds are also capable of altering the atmospheric composition, leading to changes in the ionosphere. These changes are characterized by diurnal variations in ion density and localized positive and negative phases, which are associated with variations in molecular nitrogen and wind-driven composition bulges. Namgaladze et al. [23] demonstrated that the positive ionospheric storm phase is significantly associated with the equatorward transport of F2-region plasma through neutral-wind circulation and the influence of Traveling Atmospheric Disturbances (TIDs). The intense geomagnetic storm of July 2000 (Bastille Day storm) exhibited a distinctive ionospheric response over the Brazilian EIA region, characterized by the prevailing PPEF driving the pronounced fountain effect over the region [27]. They attributed the negative ionospheric response to the depletion in O/N2. Adebiyi et al. [25] highlighted the distinct seasonal and hemispheric asymmetries during geomagnetic storms, wherein TEC variations reflected a strong latitudinal dependence. Their results reveal consistent TEC behaviour at stations in the Northern Hemisphere. In contrast, stations in the Southern Hemisphere exhibited mixed responses, emphasizing the importance of discriminating the global, regional, as well as local time effects on the analysis of storm-time TEC variations. Mannucci and Tsurutani [28] reported that the intense geomagnetic storms could cause widespread hemispheric TEC enhancements, strong spatial gradients and thermospheric effects at mid latitudes due to ion-neutral interactions. Zhai et al. [26] conducted a comprehensive analysis of the negative ionospheric storm effects with a significant decline in TEC during the 4 November 2021 geomagnetic storm. Their study revealed the complex and simultaneous interaction of neutral winds, ∑O/N2 depletion, and temperature enhancements during the period.
Concerning ionospheric variations over the Indian region with the onset of geomagnetic storms of different intensities, several studies documented pronounced ionospheric disturbances such as sudden enhancements and depletions in F-region electron density [20,29,30,31,32]. Such variations are often associated with the individual or combined influence of PPEFs, DDEFs, and thermospheric winds, which drive the enhanced or depleted EIA and plasma distributions. During the 3 November 1993 geomagnetic storm, Sastri et al. [31] reported an unusual increase in foF2 around the magnetic equator under counter-electrojet conditions. They also highlighted the pre-midnight collapse of equatorial F region, caused by equatorward plasma transport. Manju et al. [32] observed the enhancement in TEC due to PPEFs, along with significant short-term fluctuations in ionosonde data. These observations suggested the stronger influence of neutral winds at off-equatorial locations during the 29 October 2003 geomagnetic storm. Consistent with this behaviour, observations from stations across different latitudes during the 26–28 August 2018 storm also showed a strong positive phase in both VTEC and foF2 [33]. Also, Panda et al. [20] reported the TEC enhancements and spatial variability across Indian low latitudes during the 29–31 October 2003 geomagnetic storm. Chakraborty et al. [34] noticed strong VTEC fluctuations during two geomagnetic storms in 2012, driven by PPEF and DDEF, with positive effects at the equator but negative effects at the EIA crests. Findings from Mishra et al. [35] demonstrated that magnetosphere–ionosphere coupling drives strong equatorward surges in winds and electric fields, which caused the intense perturbations in equatorial and low-latitude ionosphere. Several studies also reported drastic reductions in TEC and electron density, attributing the role of thermospheric neutral wind composition changes, particularly the reductions in the O/N2 ratio transported equatorward from high latitudes [36,37,38,39].
The storm events described above highlight the diversity of ionospheric responses and emphasize that no single mechanism dominates across all disturbances. Each geomagnetic storm is driven by specific physical mechanisms, such as rapid penetration of electric fields, precipitation of energetic particles, and alterations in thermospheric composition or their complex combinations. This study addresses the critical need to understand ionospheric responses to geomagnetic storms, specifically over the Indian longitude region. It presents new findings on the 1–3 June 2025 geomagnetic storm, and to the best of our knowledge, these results have not been previously reported or published.
2. Materials and Methods
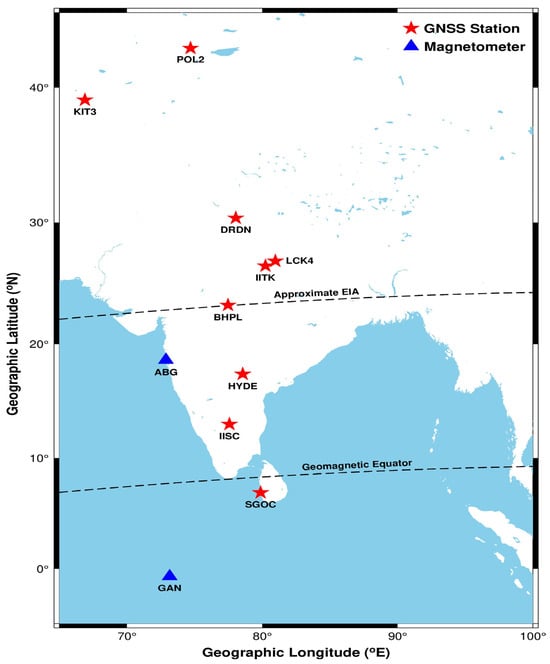
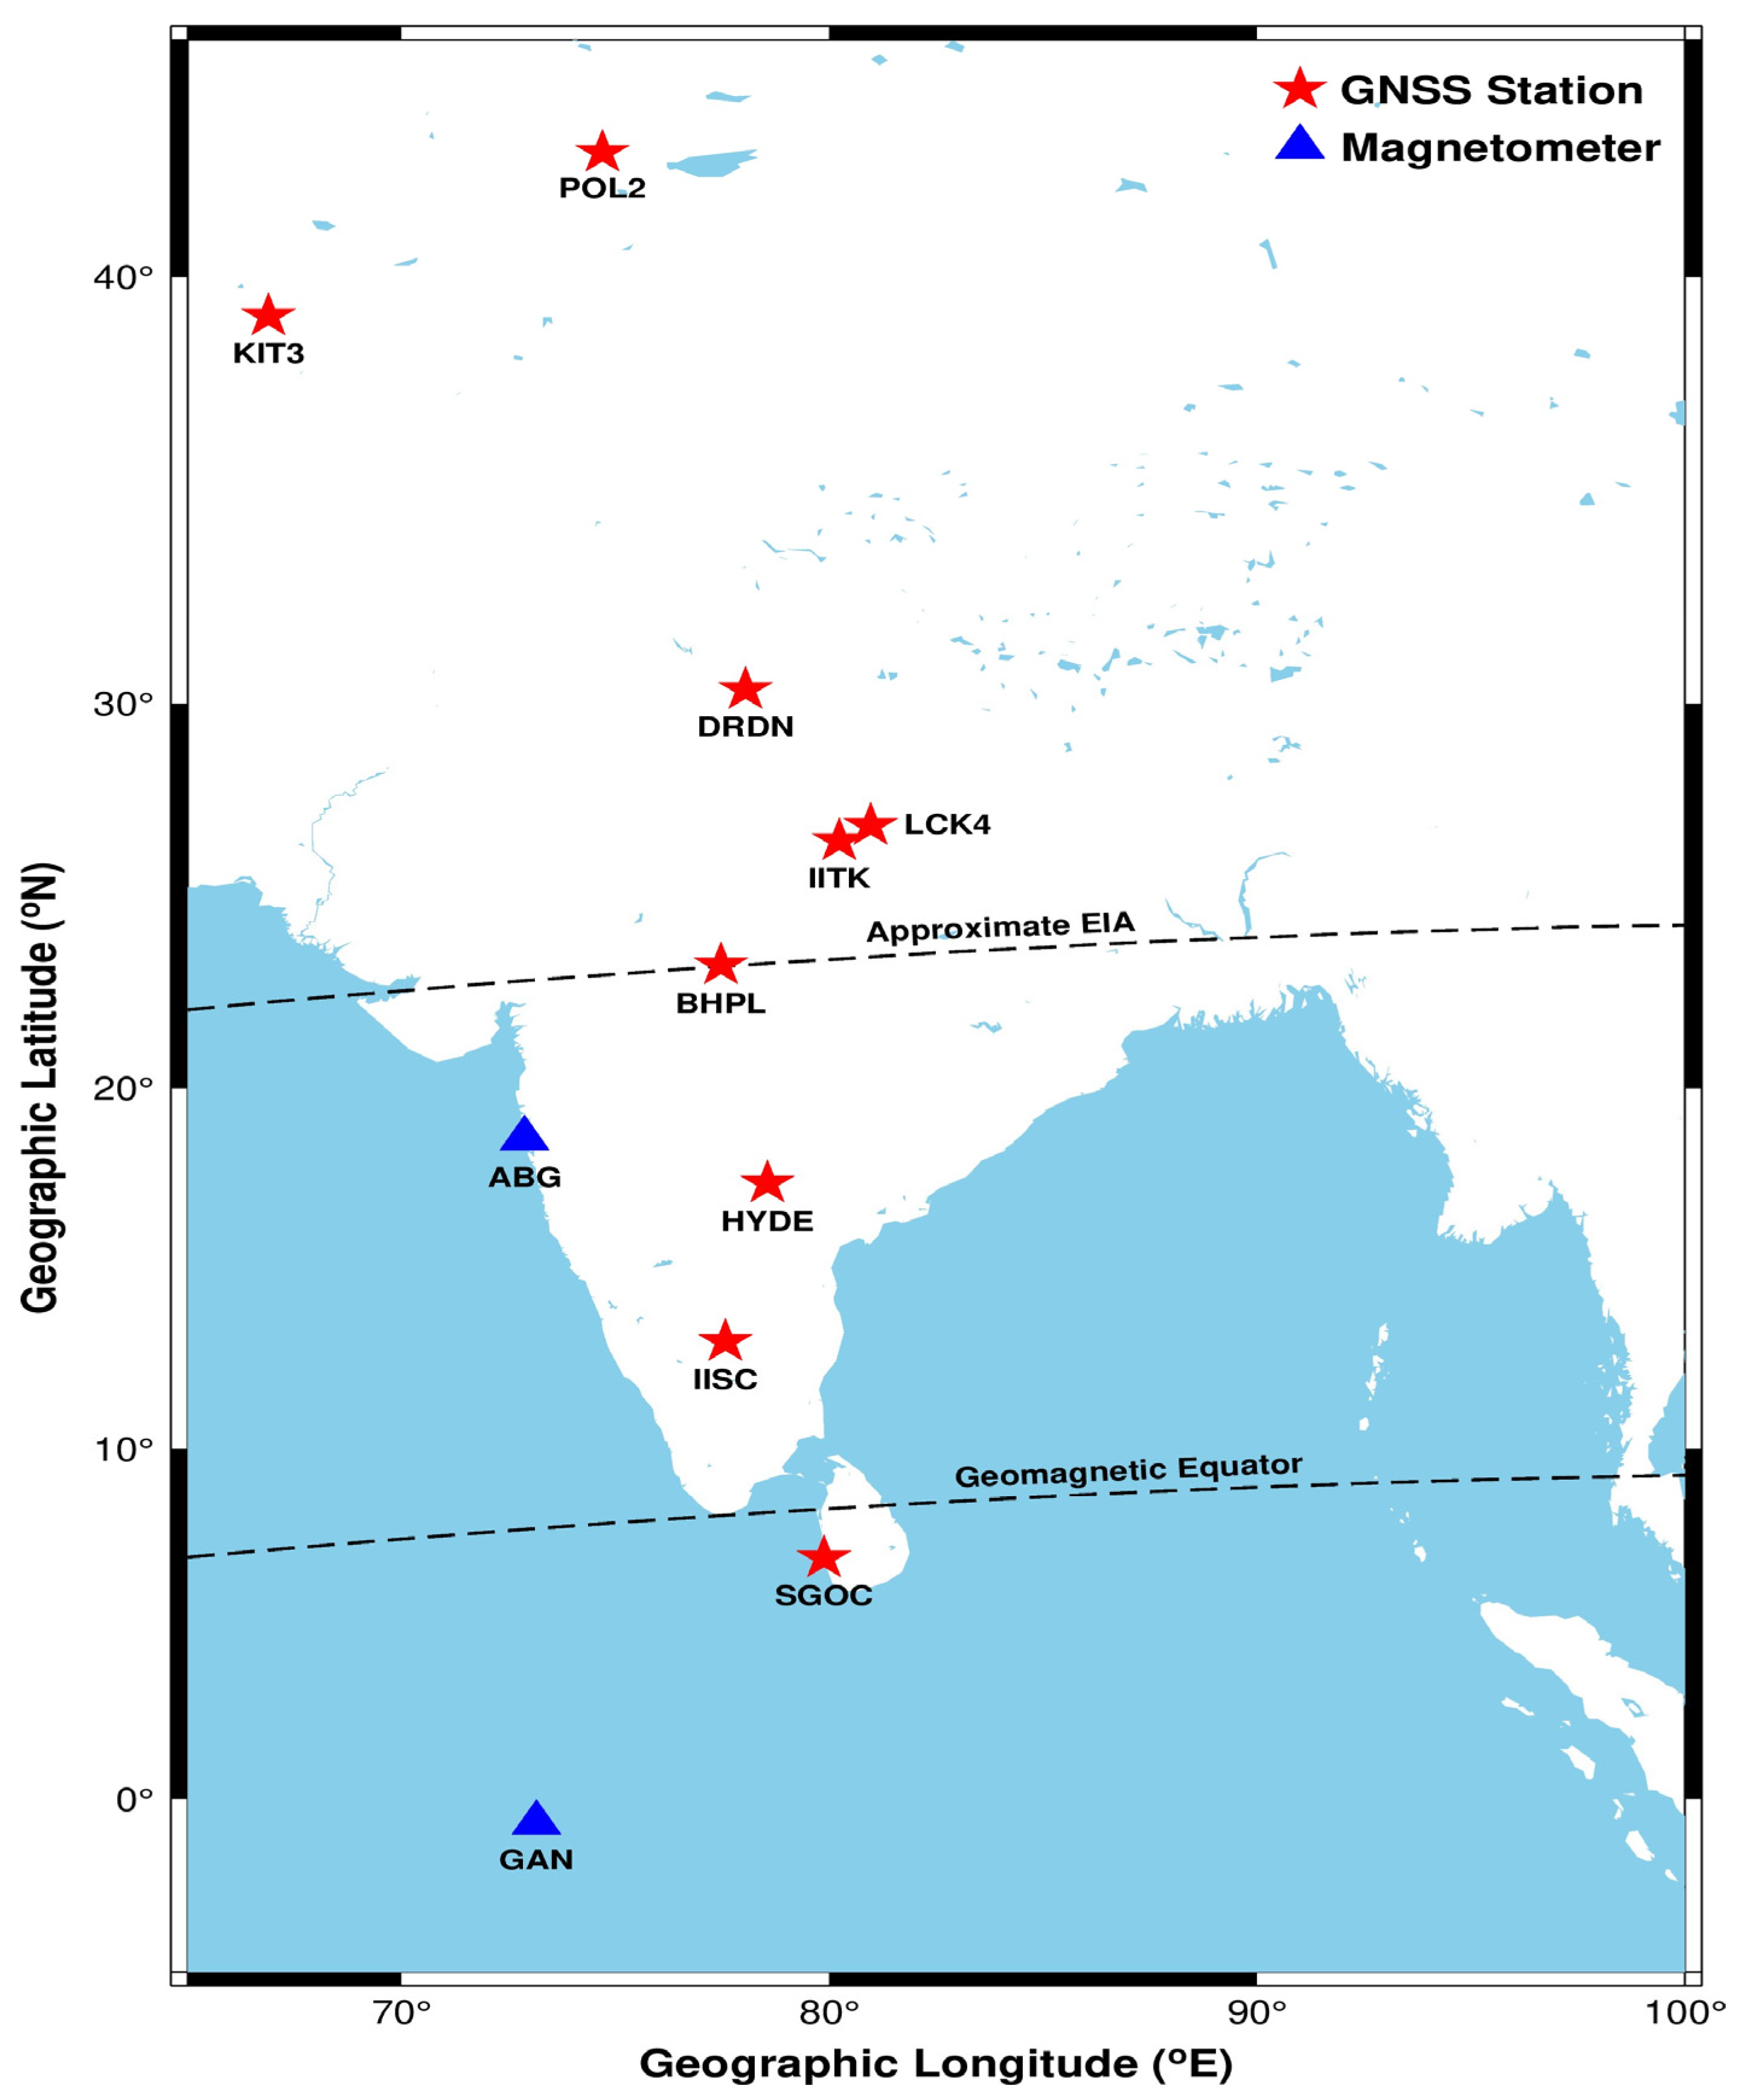
The present study utilizes Global Navigation Satellite System (GNSS) stations latitudinally aligned from approximately 6° to 43° North geographic latitudes, thereby encompassing equatorial to mid-latitude regions comprehensively over the Indian region (Figure 1 and Table 1). This latitudinal coverage enables the detailed spatial analysis of ionospheric responses along the Indian longitude sector by characterizing the driving mechanisms of both equatorial and high latitude influences in the region. Complementary datasets include electron density measurements from the Swarm satellite, COSMIC-2 RO observations, thermospheric O/N2, Magnetometer H-variations and PPEEF model-derived ionospheric electric field data. Together, these datasets facilitate the interpretation of electrodynamic drivers modulating plasma drifts and storm-time ionospheric behaviour.
Figure 1.
Latitudinal distribution of GNSS stations (red stars) utilized in this study, aligned from equatorial to mid-latitude regions. The blue triangles represent the magnetometer locations considered in this study. The two dashed horizontal contour lines indicate the approximate locations of the geomagnetic equator and EIA crest, respectively.
Table 1.
Locations of GNSS and magnetometers in the Indian longitude sector considered in this study.
Slant TEC (STEC) was estimated using both dual-frequency carrier phase (L1, L2) and pseudorange (P1, P2) observables as shown in Equations (1) and (2) [40]. The carrier phase-derived STEC provides high precision but is affected by ambiguity due to unknown integer phase biases. In contrast, pseudorange-derived STEC (STECp) offers unambiguous and robust TEC estimates, although it is inherently noisier. To obtain the correct STEC estimate, the carrier phase-derived STEC is corrected and levelled using the pseudorange-derived STEC. Subsequently, satellite and receiver biases are removed from the corrected STEC. The resultant STEC is then converted to VTEC using the single-layer mapping function as given in Equation (3), with satellite elevation angles (E) more than 20° and an assumed shell height (HIPP) of 350 km.
where M(E) is the ionospheric thin shell model mapping function used to obtain equivalent VTEC from STEC, which can be expressed as
Here, Re = 6371 km.
This study uses the Swarm satellite constellation (A, B, and C) data to capture changes in topside ionospheric electron density during storm periods. With Swarm A and C operating at lower orbit (460 km) and Swarm B at relatively higher orbit (510 km), this unique constellation allows simultaneous observations of the ionosphere at two altitude ranges above the Earth. These satellites are equipped with magnetometers and other payloads for measuring the plasma density, ion drift, and electric fields. This instrumentation allows the direct retrieval of electrodynamic parameters and topside electron density, which are fundamental for analyzing the storm-time variations over the region. Additionally, we considered the available COSMIC-2 RO observations over the region, which provide vertical electron density profile information that may help to understand the altitude-dependent ionospheric electron density during the period. The deployment of the COSMIC-2 mission has significantly boosted the spatial and temporal ionospheric exploration in the regional as well as global low-latitude sector by providing approximately 5000 high-density ionospheric occultation profiles per day, spreading across ±45° geographic latitudes. Its complementary characteristics improve the accuracy and resolution of ionospheric monitoring. Key ionospheric parameters derived from COSMIC-2 RO data included in this study are electron density, foF2 and hmF2. GUVI/TIMED O/N2 data are also used to examine the thermospheric composition changes. The primary objectives of GUVI on the TIMED spacecraft are to map spatial and temporal variations in thermospheric composition (atomic oxygen, molecular nitrogen, and hydrogen) and lower temperatures using emission mechanisms.
The strength of the EEJ was estimated using one-minute horizontal (H) component geomagnetic field measurements from a near-equatorial station in the Maldives and an off-equatorial station at Alibag. For each day, the quiet-time baseline was determined by averaging the H component during the local midnight hours and subtracted from the observed H values to obtain the diurnal variation (ΔH) [41]. This baseline removal isolates storm-time and daytime current variations. The EEJ intensity was then calculated as the difference between the baseline-corrected H components at the two stations (EEJ = ΔH_Maldives − ΔH_Alibag). This differencing technique effectively removes the contribution of the large-scale solar quiet (Sq) current system observed at the off-equatorial station, thereby isolating the localized overhead EEJ current near the magnetic dip equator. In addition, this study incorporated model-derived electric field estimates at 1 min temporal resolution over the 77-degree longitude region from the PPEEF model to assess penetration electric fields affecting equatorial plasma uplift. The model integrates the transfer-function approach, which maps IEF measurements obtained from ACE and DSCOVR spacecraft to the ionosphere, with the climatological component. The transfer-function methodology incorporates propagation delays from L1 to the magnetospheric bow shock, and it provides the electric field measurements [42].
3. Results
3.1. Temporal Variations in Interplanetary and Geomagnetic Parameters During 31 May 2025 to 4 June 2025
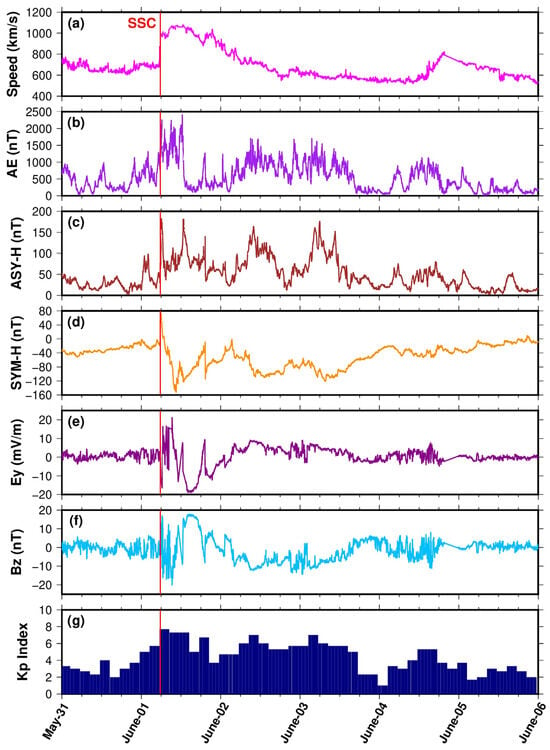
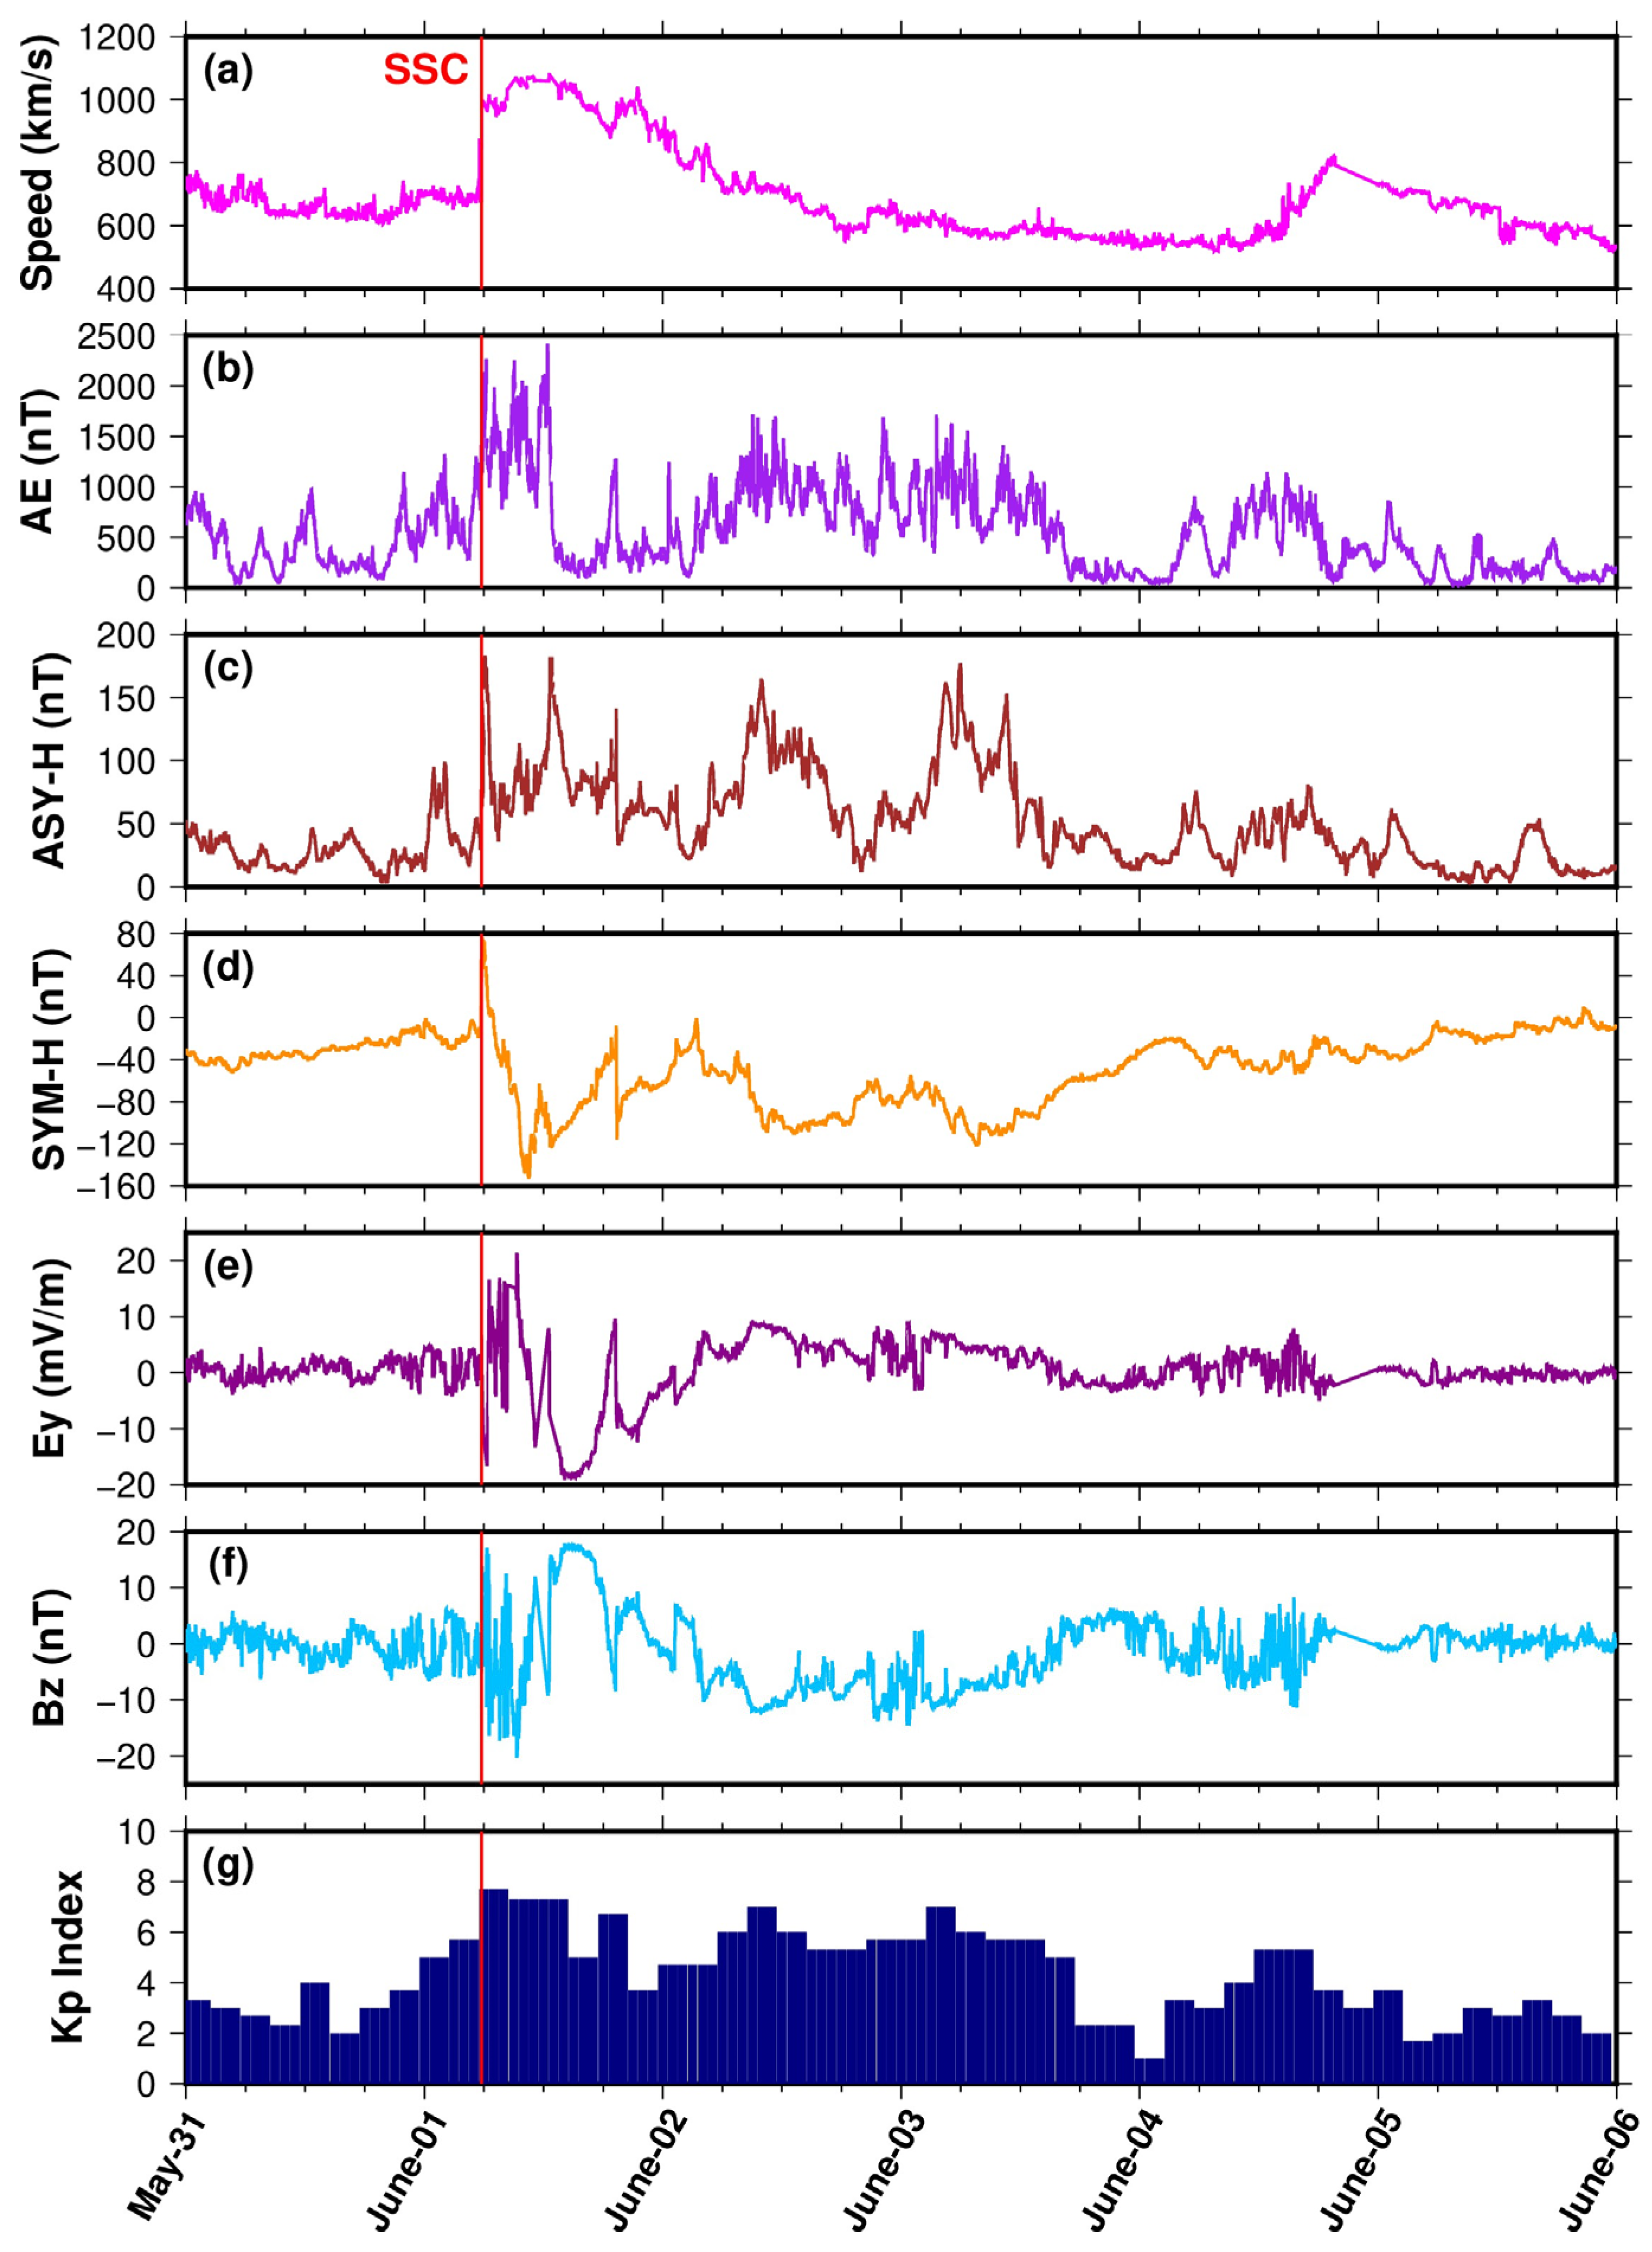
Figure 2 shows the temporal variations of (a) solar wind speed (km/s), (b) AE index, (c) ASY-H (nT), (d) SYM-H (nT), (e) Ey (mV/m), (f) IMF-Bz (nT), and (g) Kp index (from top to bottom) during 31 May to 4 June 2025. This geomagnetic disturbance was triggered by CMEs released from the Sun on 29 May 2025, exhibiting noticeable variations in geomagnetic parameters, which is evidenced by distinct phases during the event. It can be observed from Figure 2c that initially the ASY-H index exhibited a sudden rise in value above 150 nT around 0000 UT on 1 June, corresponding to the local early hours (0530 LT) in the Indian sector, reflecting signatures of intensified substorm activity at high-latitude auroral region associated with the enhancement of asymmetric ring current due to disturbances in the magnetospheric current system shortly before storm commencement. The peak value of the ASY-H index was seen between 0600 and 1200 UT on both 2 and 3 June, indicating sustained substorm activities. The solar wind speed also showed a marked enhancement (~1000 km/s) around 0600 UT (Figure 2a), aligned with the enhancement in the AE index (>2000 nT) that sustained at an elevated level of around 1500 nT for an extended period of time (nearly six hours). The high value of the AE index indicated evidence of intense auroral electrojet currents capable of intensifying Joule heating and the neutral wind variations. The SYM-H index showed a sudden flipping around 0600 UT (1130 LT) on 1 June, confirming the commencement of the storm’s main phase, which rapidly decreased to −152 nT around 1031 UT (1601 LT) on 1 June. The simultaneous fluctuations in Ey (oriented westward) and IMF-Bz (oriented southward), coinciding with SSC, indicate the triggering of storm development through magnetic reconnection, enabling an efficient solar–wind–magnetosphere coupling to drive ring current intensification. Both Ey and IMF-Bz exhibited significant fluctuations throughout the first main phase, with the IMF Bz reaching −20.29 nT at 0919 UT (1449 LT) on 1 June 2025 and a concurrent increase in Kp to a scale of 8, as shown in Figure 2g. Interestingly, the SYM-H index began a brief recovery after ~4–5 h of the initial main phase but exhibited the onset of a second main phase by dropping again to ~−116 nT at 1923 UT (0053 LT on 2 June), before attaining normalcy. Although SYM-H followed a gradual recovery since around 0700 UT (1230 LT) on 3 June, it encountered multiple fluctuations throughout the succeeding two days. Overall, the storm is characterized by prolonged energy input at high latitude, intense substorm activity, and a two-stage main phase, followed by a slow recovery period, indicating it to be a significant event for probing the associated magnetosphere–ionosphere–thermosphere coupling processes to strengthen the understanding of low-latitude ionospheric dynamics.
Figure 2.
Variations in the (a) solar wind speed (km/s), (b) AE index, (c) ASY-H (nT), (d) SYM-H (nT), (e) Ey (mV/m), (f) IMF-Bz (nT), and (g) Kp index for the period from 31 May to 4 June 2025 (top to the bottom). The vertical red line in each of the subfigures represents the time of arrival of SSC on 1 June 2025.
3.2. GPS-TEC Variations During the Storm Period of 1–3 June 2025
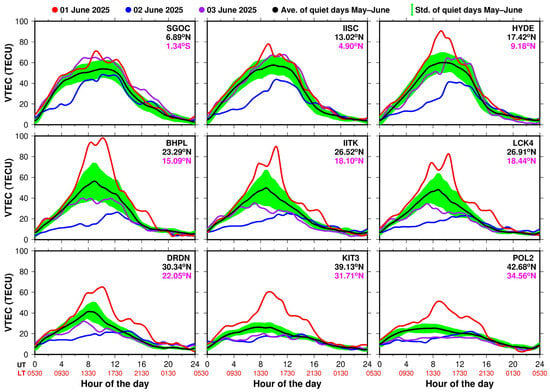
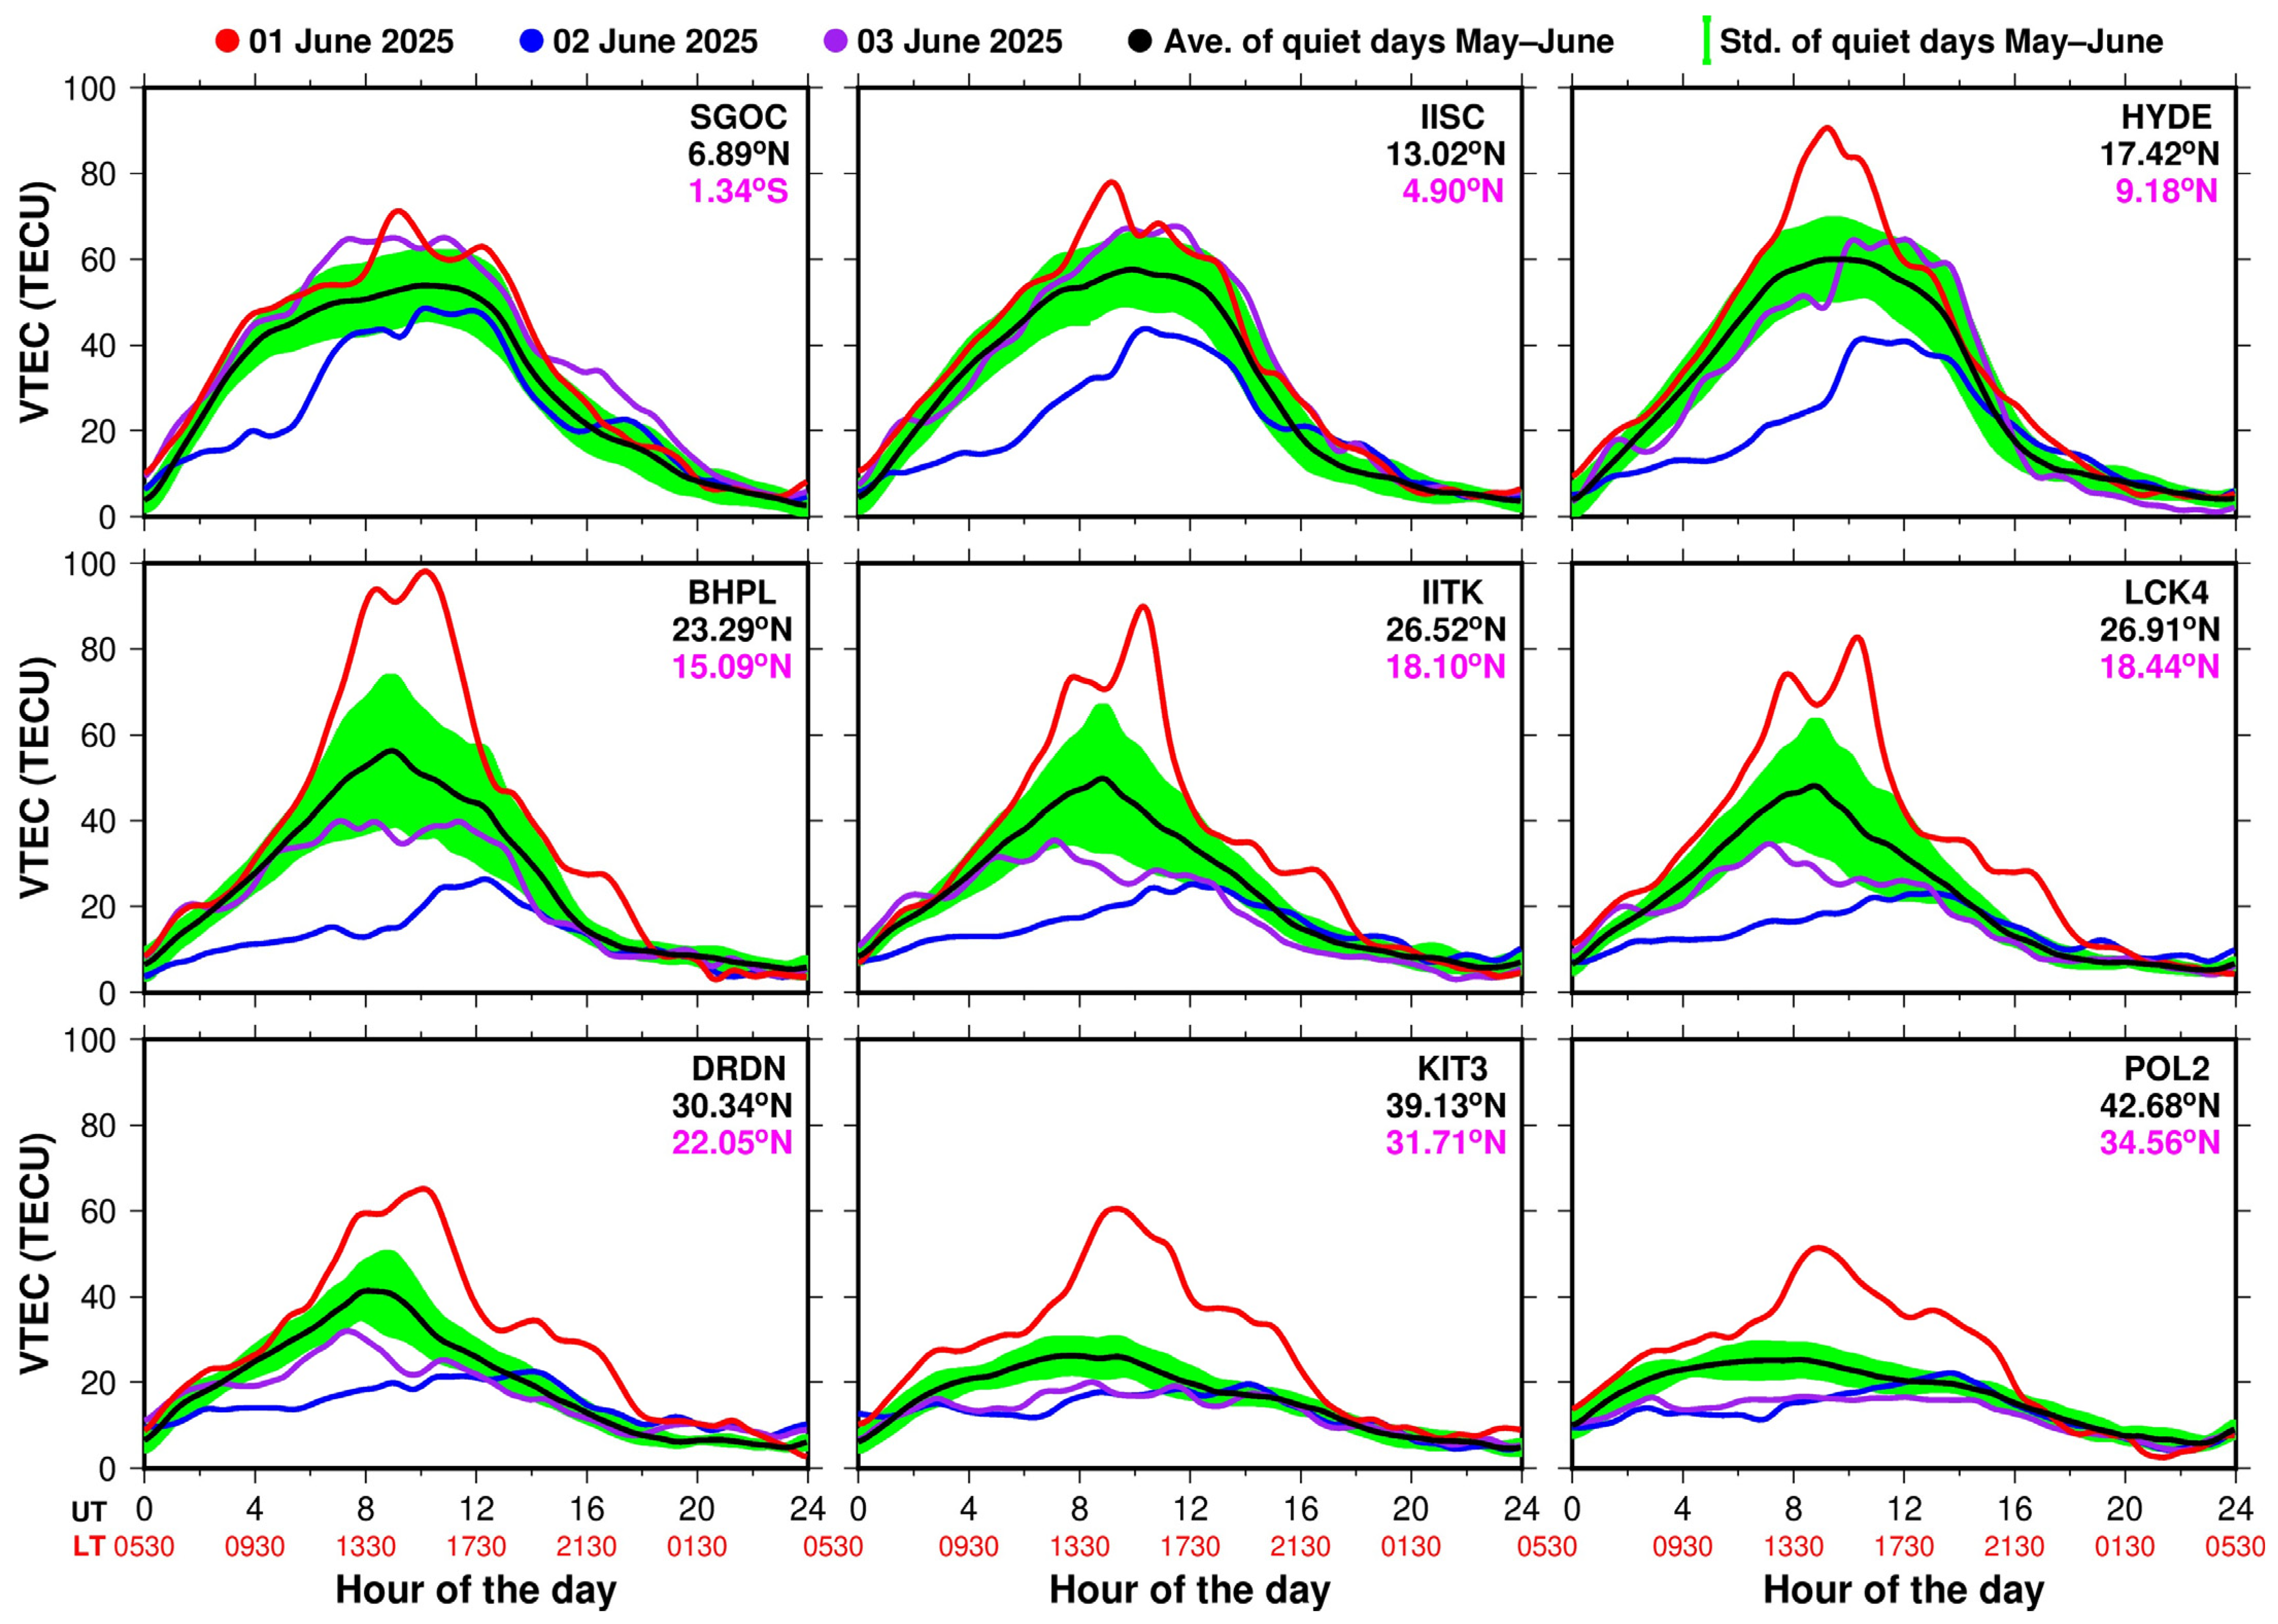
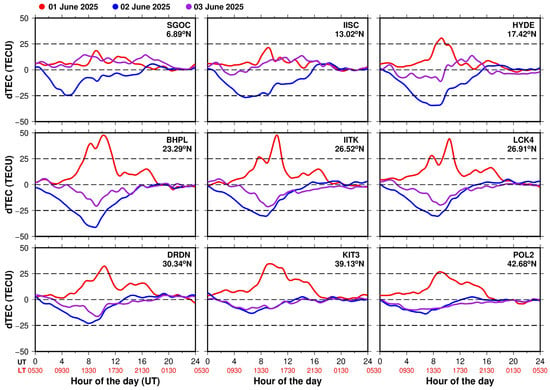
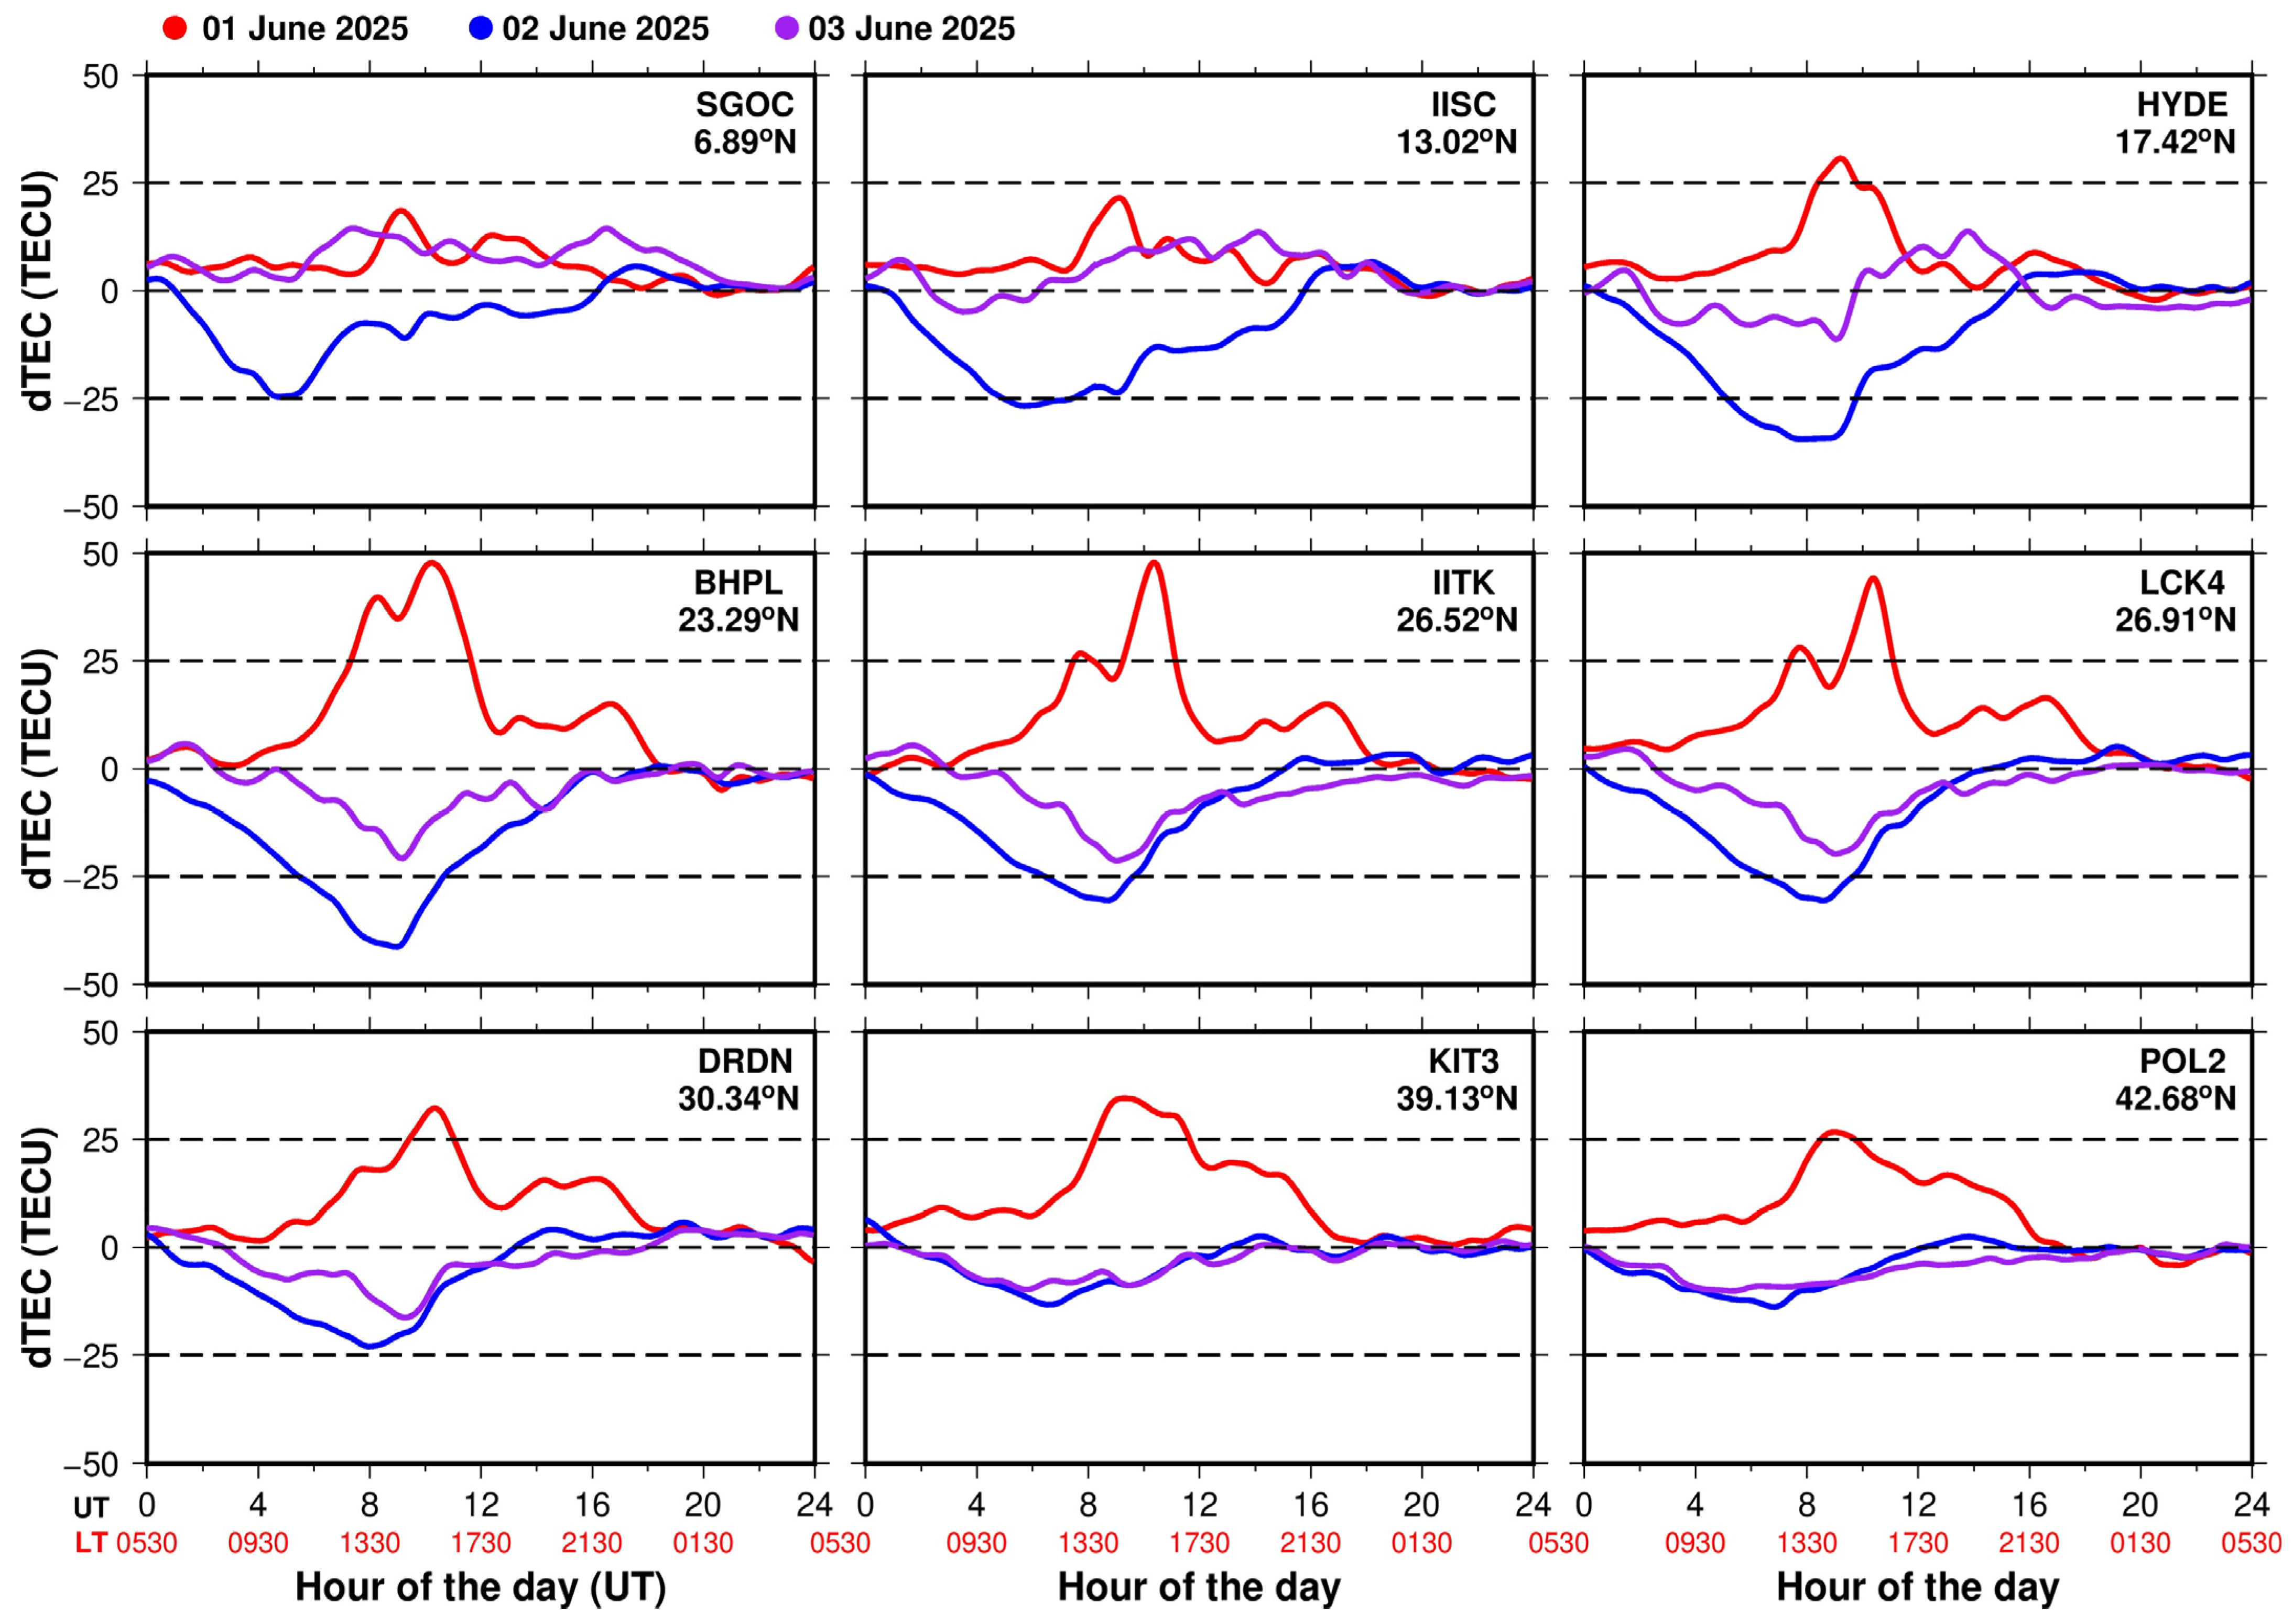
Figure 3 illustrates the variation in VTEC from 1 to 3 June 2025, with the red, blue, and violet curves representing the respective days. The quiet-day mean is indicated by the black line, and its standard deviation is shown as the green shaded region. Station codes are displayed at the top-right corner of each panel along with the geographic (black) and geomagnetic (magenta) latitudes. On 1 June, corresponding to the storm’s main phase, a significant enhancement in daytime VTEC was observed at most stations between 0630 and 1200 UT, with the magnitude of enhancement varying by location. Stations within the EIA region (HYDE and BHPL), at the poleward edge of the EIA region (IITK and LCK4), and in the mid-latitude region (DRDN, KIT3, and POL2) exhibited VTEC values nearly twice those recorded on quiet days. In contrast, equatorial stations SGOC and IISC showed no notable enhancement, with SGOC displaying minimal variation. Figure 4 presents the differential TEC (dTEC), calculated by subtracting the quiet-day mean VTEC from the storm-day VTEC values. The maximum TEC enhancement occurred at BHPL, IITK, and LCK4, where dTEC values exceeded 45 TECU, whereas HYDE, DRDN, KIT3, and POL2 stations showed dTEC values around 30 TECU. Near-equatorial stations SGOC and IISC exhibited dTEC values below 25 TECU. Stations from the EIA region to mid latitudes displayed double peaks in VTEC enhancement between 0630 and 1200 UT, likely associated with the propagation of Travelling Ionospheric Disturbances (TIDs). During intervals of extremely high AE index values (above 1500 nT), intense high-latitude energy input generates large-scale TIDs (LSTIDs) with sufficient amplitude to propagate equatorward and penetrate low-latitude regions (~10–20° MLAT). As these gravity wave-driven disturbances travel equatorward, they modulate the background ionosphere by altering vertical plasma drifts and redistributing electron density. This leads to observable TEC oscillations and perturbations in the EIA region. Furthermore, these regions also showed noticeable post-sunset TEC enhancement from 1300 to 1800 UT, with dTEC values increasing to 15–20 TECU.
Figure 3.
GPS-TEC variations at different latitudinal locations in the Indian longitude sector during the storm period of 1–3 June 2025, along with the quiet days average (black) of May–June 2025. The green shaded region represents the standard deviation of the average values.
Figure 4.
The dTEC variations observed at various latitudinal stations during the geomagnetic storm of 1–3 June 2025.
On 2 June, a prominent reduction in VTEC was observed at all stations throughout the first half of the day, from local morning to evening (0000–1300 UT), after which no major fluctuations occurred. The maximum reduction was recorded at BHPL, where dTEC values reached approximately −40 TECU. Observations at HYDE, IITK, and LCK4 also exhibited notable decreases, with dTEC values near −30 TECU. Equatorial stations SGOC and IISC showed comparatively smaller reductions of about −25 TECU, while mid-latitude stations POL2 and KIT3 recorded minor decreases ranging from −12 to −15 TECU. No significant night-time VTEC variations are detected on 2 June. The maximum negative dTEC values occurred around local noon, between 0600 and 0800 UT at all stations. On 3 June, slight VTEC variations are observed, with minor daytime and evening enhancements at SGOC and IISC. In contrast, stations from the EIA to mid-latitude regions exhibited TEC reductions during both daytime and evening periods. The strong VTEC enhancement on 1 June reflects the positive ionospheric storm effect, while the reductions in VTEC on 2 and 3 June indicate the negative ionospheric storm effect during the storm period.
3.3. Swarm Electron Density Variations from 31 May to 3 June
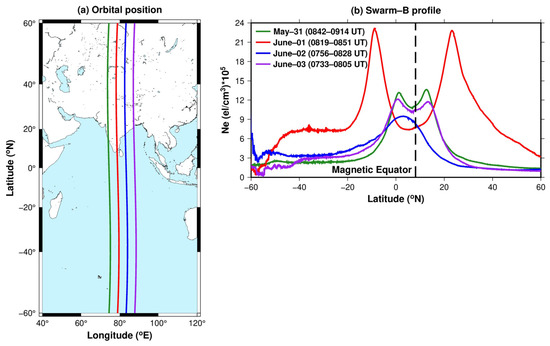
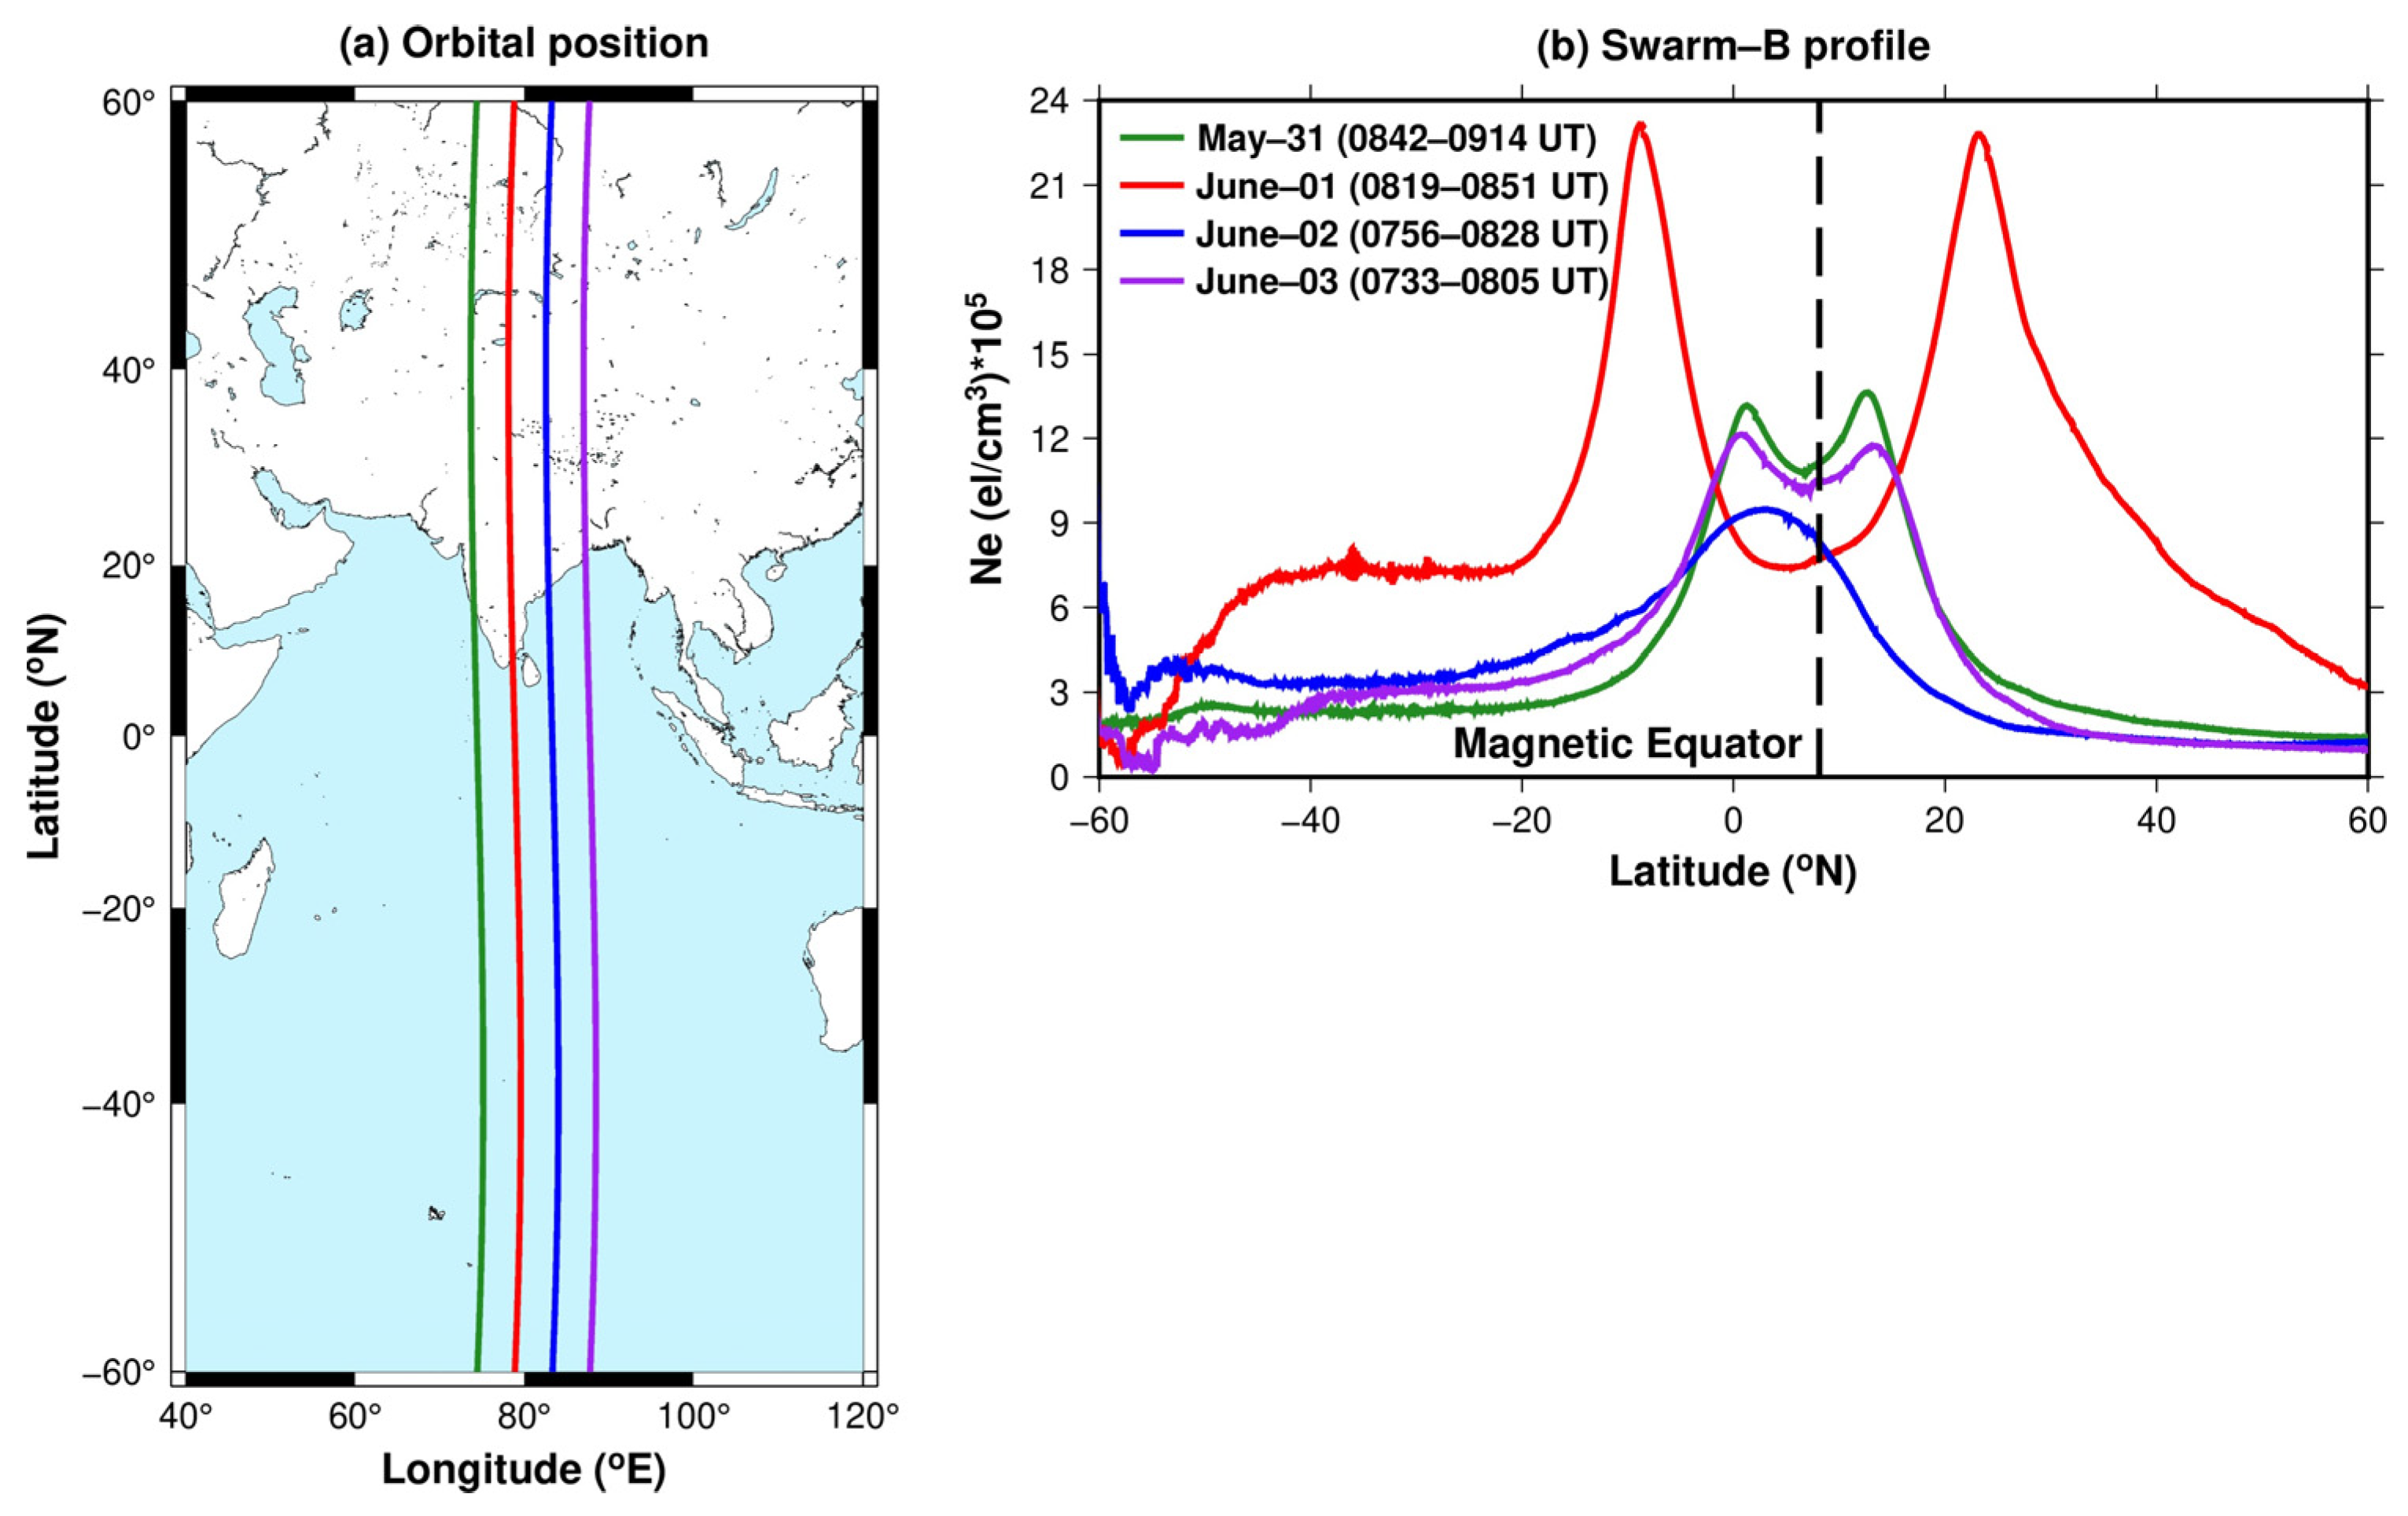
Figure 5 presents the Swarm-B satellite observations of electron density (Ne) profiles panel (b) from 31 May to 3 June, with each day represented by a different colour, alongside the corresponding orbital positions panel (a). Panel (b) depicts the daytime electron density distribution, highlighting two distinct peaks in the low-latitude region on 31 May and 3 June, which are attributed to the fountain effect within the EIA. On these days, the EIA crests are located near ±10° magnetic latitude in both hemispheres. Following the storm onset on 1 June, the EIA region shifted poleward, accompanied by the pronounced increase in electron density to 3.5 × 10⁵ electrons cm−3 during the local noon period. During the main phase of the storm, the EIA crests extend to higher latitudes than usual in both hemispheres, with the northern crest exhibiting the more gradual decline in Ne values and slightly broader latitudinal spread compared to the southern crest. The storm-induced electric fields modified ionospheric electron density by shifting EIA crests to poleward and increasing electron density from low to mid latitudes, which consequently reduced electron density near the magnetic equator. This enhancement was also depicted in GPS-TEC as shown in Figure 3, where VTEC values increased to approximately twice the quiet-time levels. Although Ne attains its peak values on 1 June, the subsequent day of 2 June exhibits distinctly different behaviour. A single crest appears during daytime near the magnetic equator, indicating the absence of EIA formation. Daytime Ne values remain very low, with the gradual increase across southern latitudes and rapid decline in the northern region. This decrease in electron density further confirms the negative storm effect, which was previously observed in Figure 3.
Figure 5.
(a) Orbital tracks of the Swarm-B satellite and (b) corresponding electron density variations from 31 May to 3 June. The black dashed lines in panel (b) indicates the approximate position of the magnetic equator.
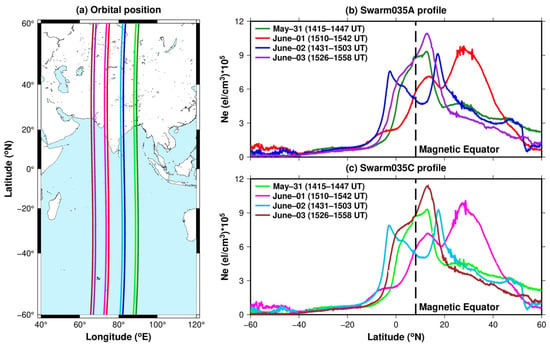
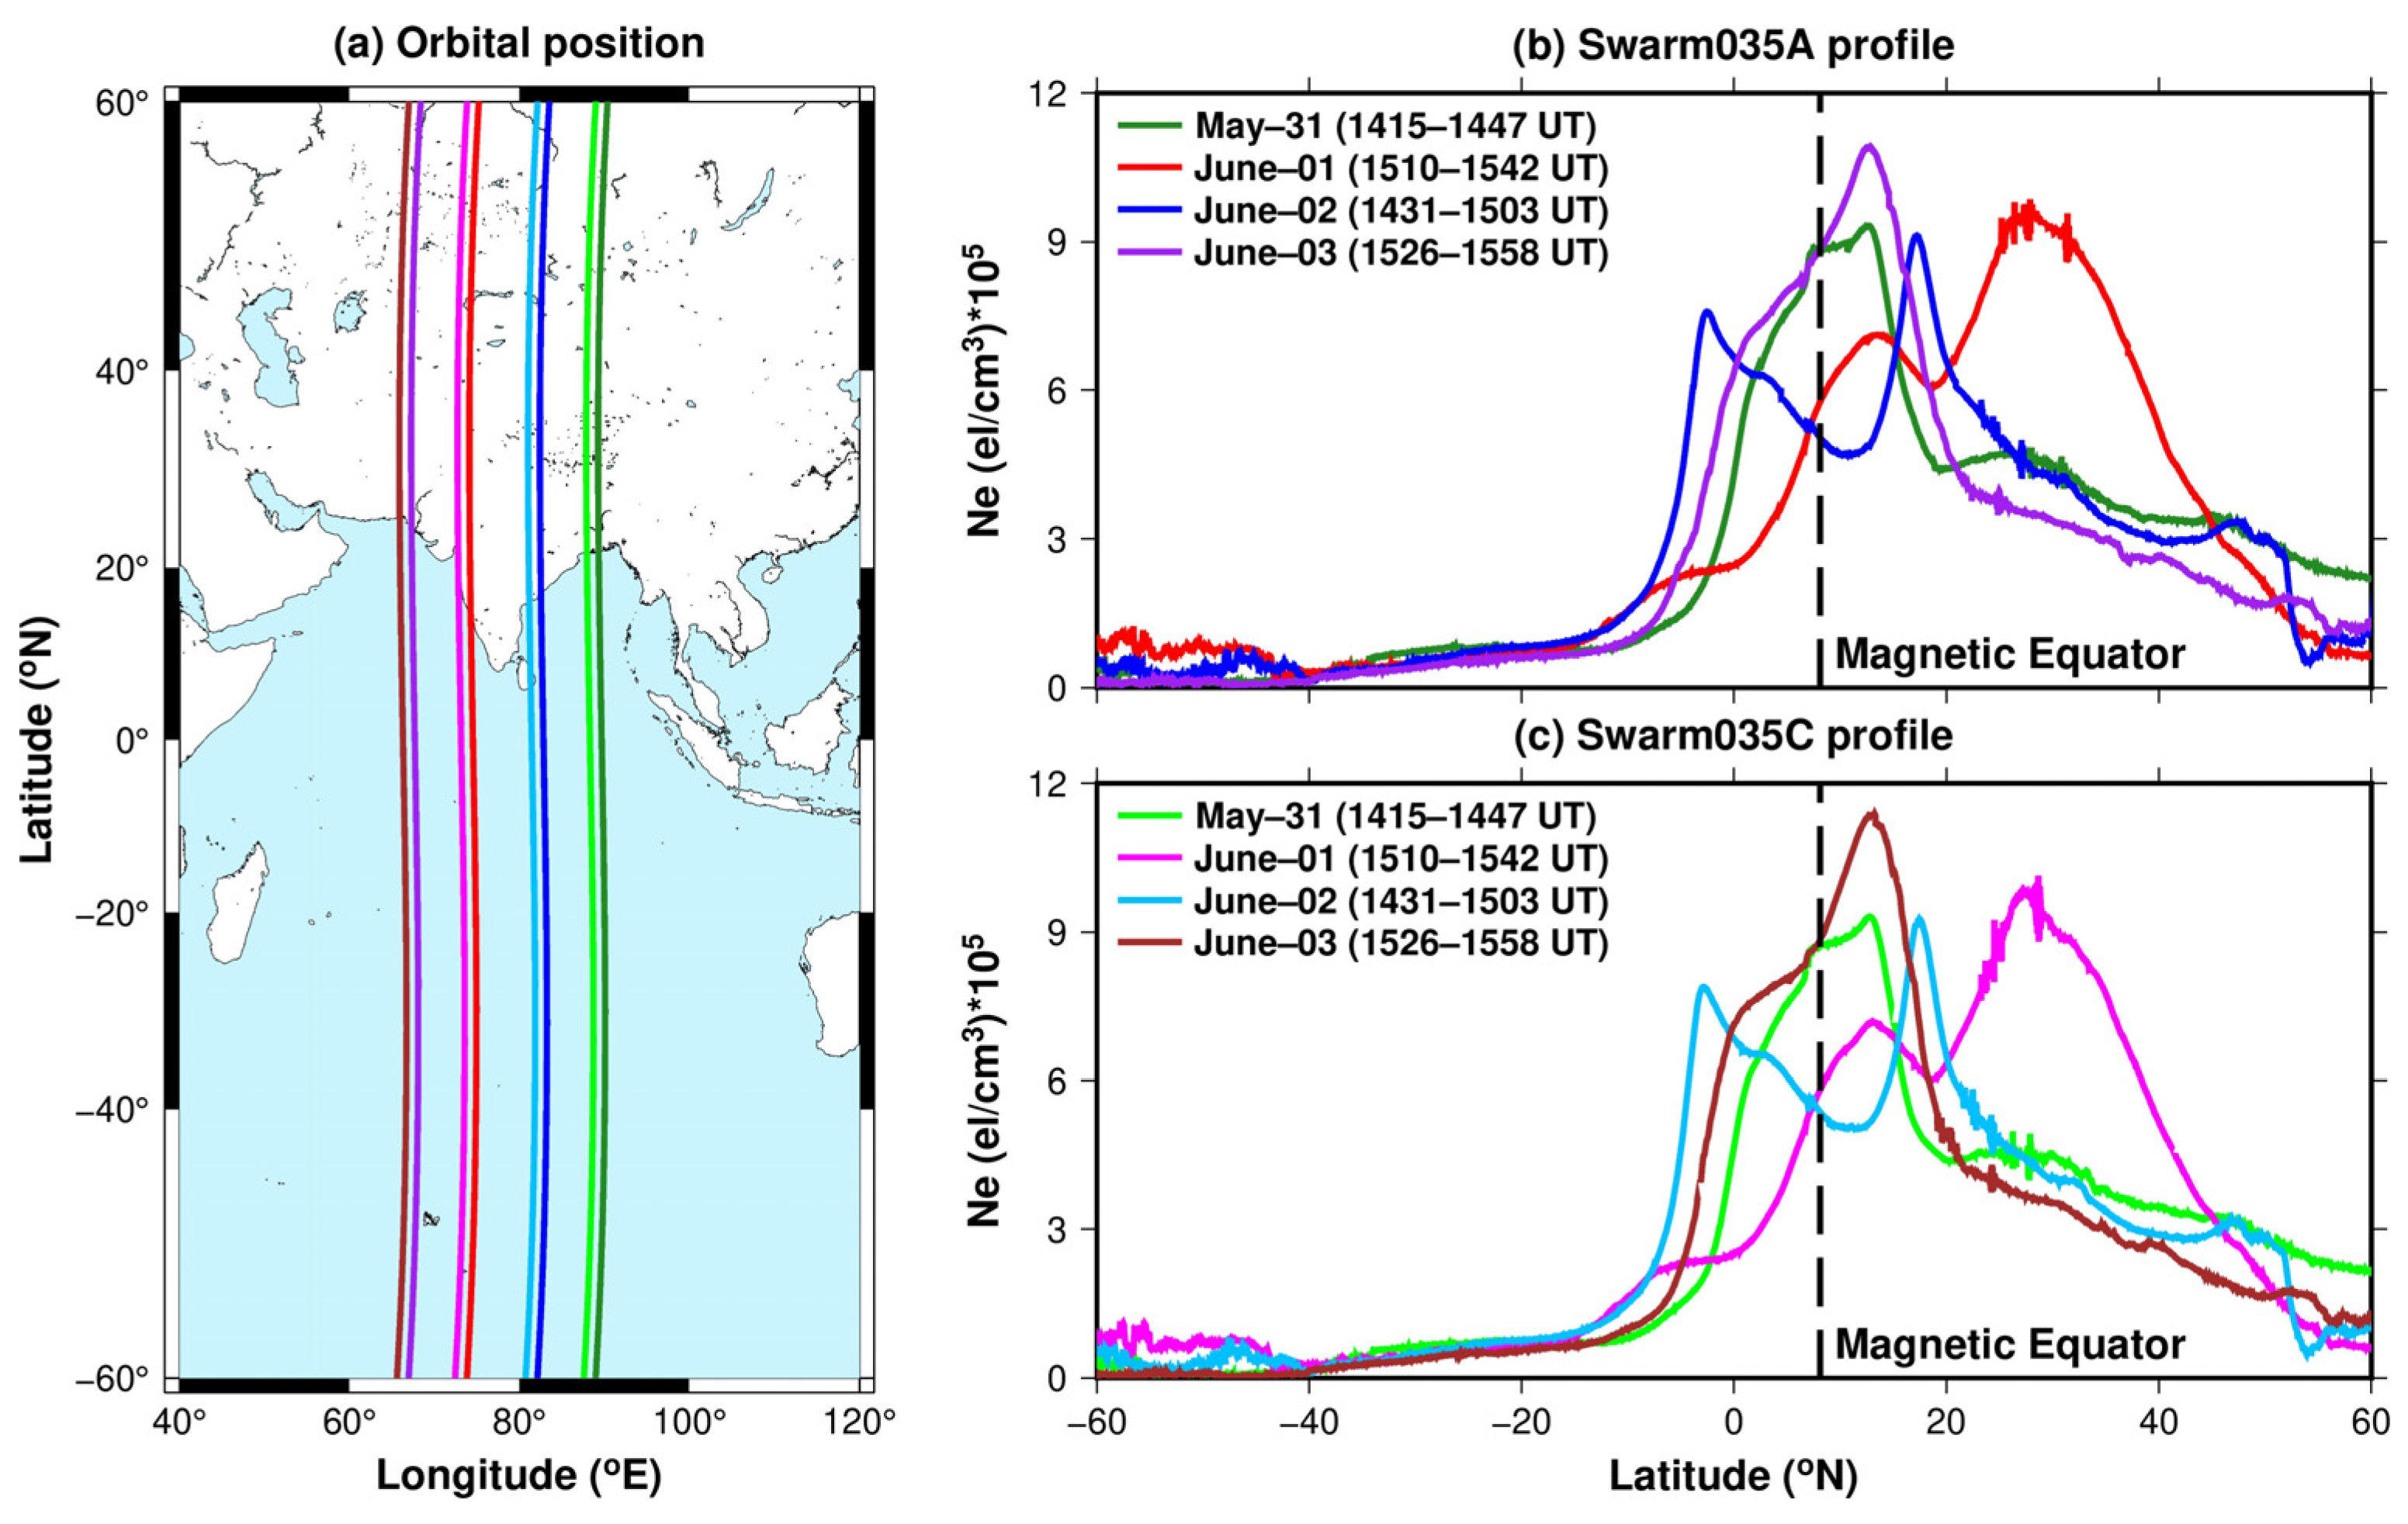
Figure 6 presents the night-time ionospheric electron density profiles from Swarm-A panel (b) and Swarm-C panel (c), along with their corresponding orbital positions, to examine the ionospheric response during the storm period. On 1 June, night-time enhancement in electron density, resembling the daytime-like increase in Ne, was observed over the EIA and adjacent mid-latitude regions, particularly in the Northern Hemisphere. Meanwhile, the Southern Hemisphere exhibits comparatively lower electron density values during the same interval. Although the typical daytime EIA crest formation is absent on 2 June, two weak peaks emerge during the post-sunset hours. These peaks display comparable amplitudes, with the northern peak being greater than the southern one. The Ne peak is observed on 3 June around the magnetic equator, which is consistent with typical ionospheric behaviour during the summer season.
Figure 6.
(a) Orbital tracks of the Swarm-A and Swarm-C satellites and corresponding electron density profiles from (b) Swarm-A and (c) Swarm-C observations during 31 May to 3 June. The black dashed lines in panel (b,c) indicate the approximate position of the magnetic equator.
3.4. COSMIC-2 RO-Derived foF2, hmF2 and Electron Density Profiles During Storm Period
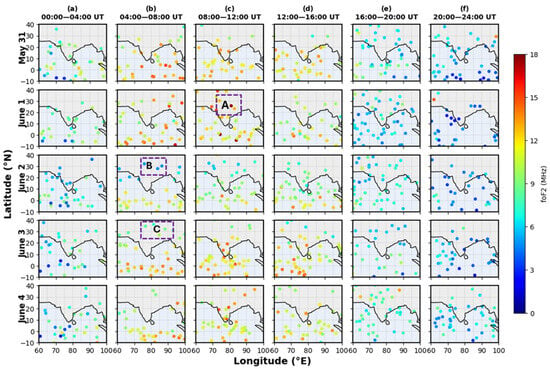
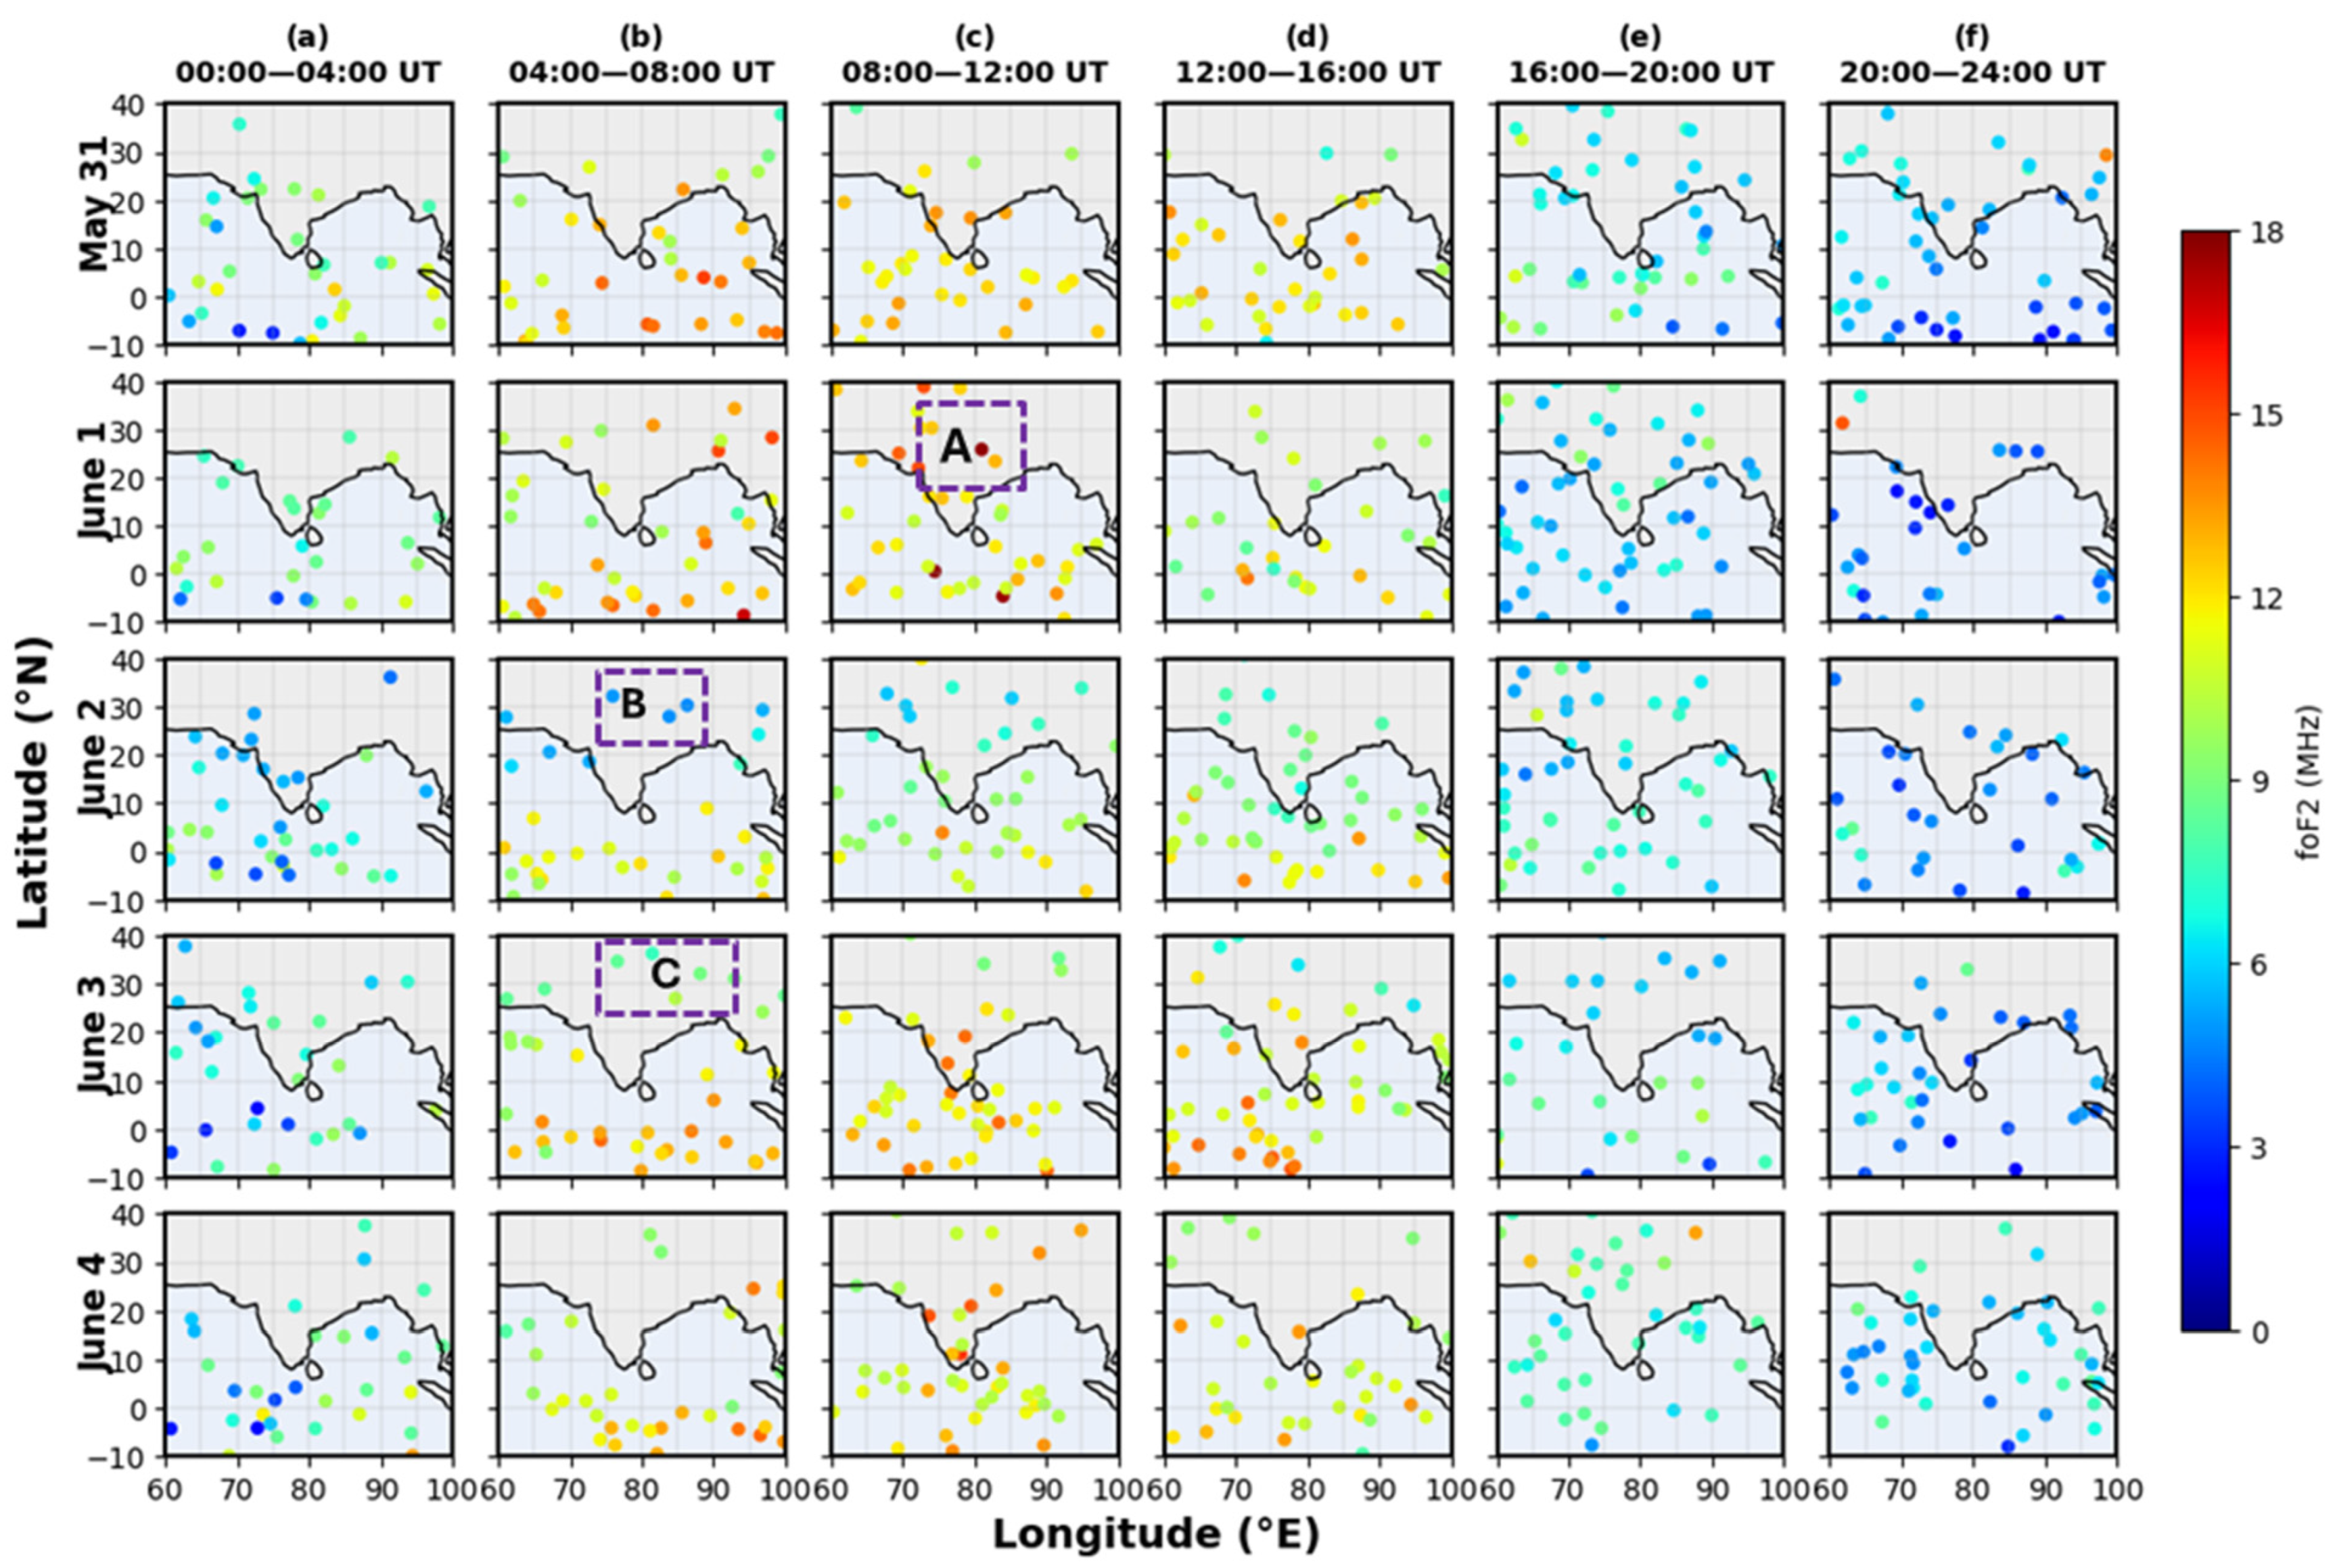
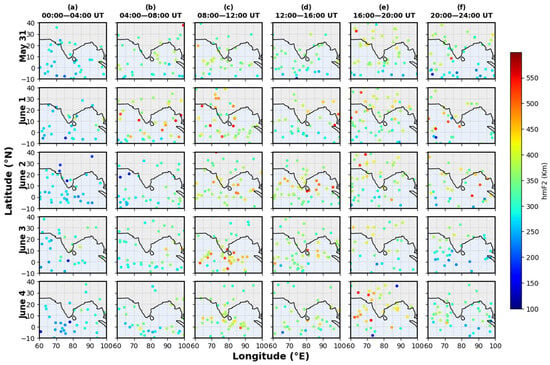
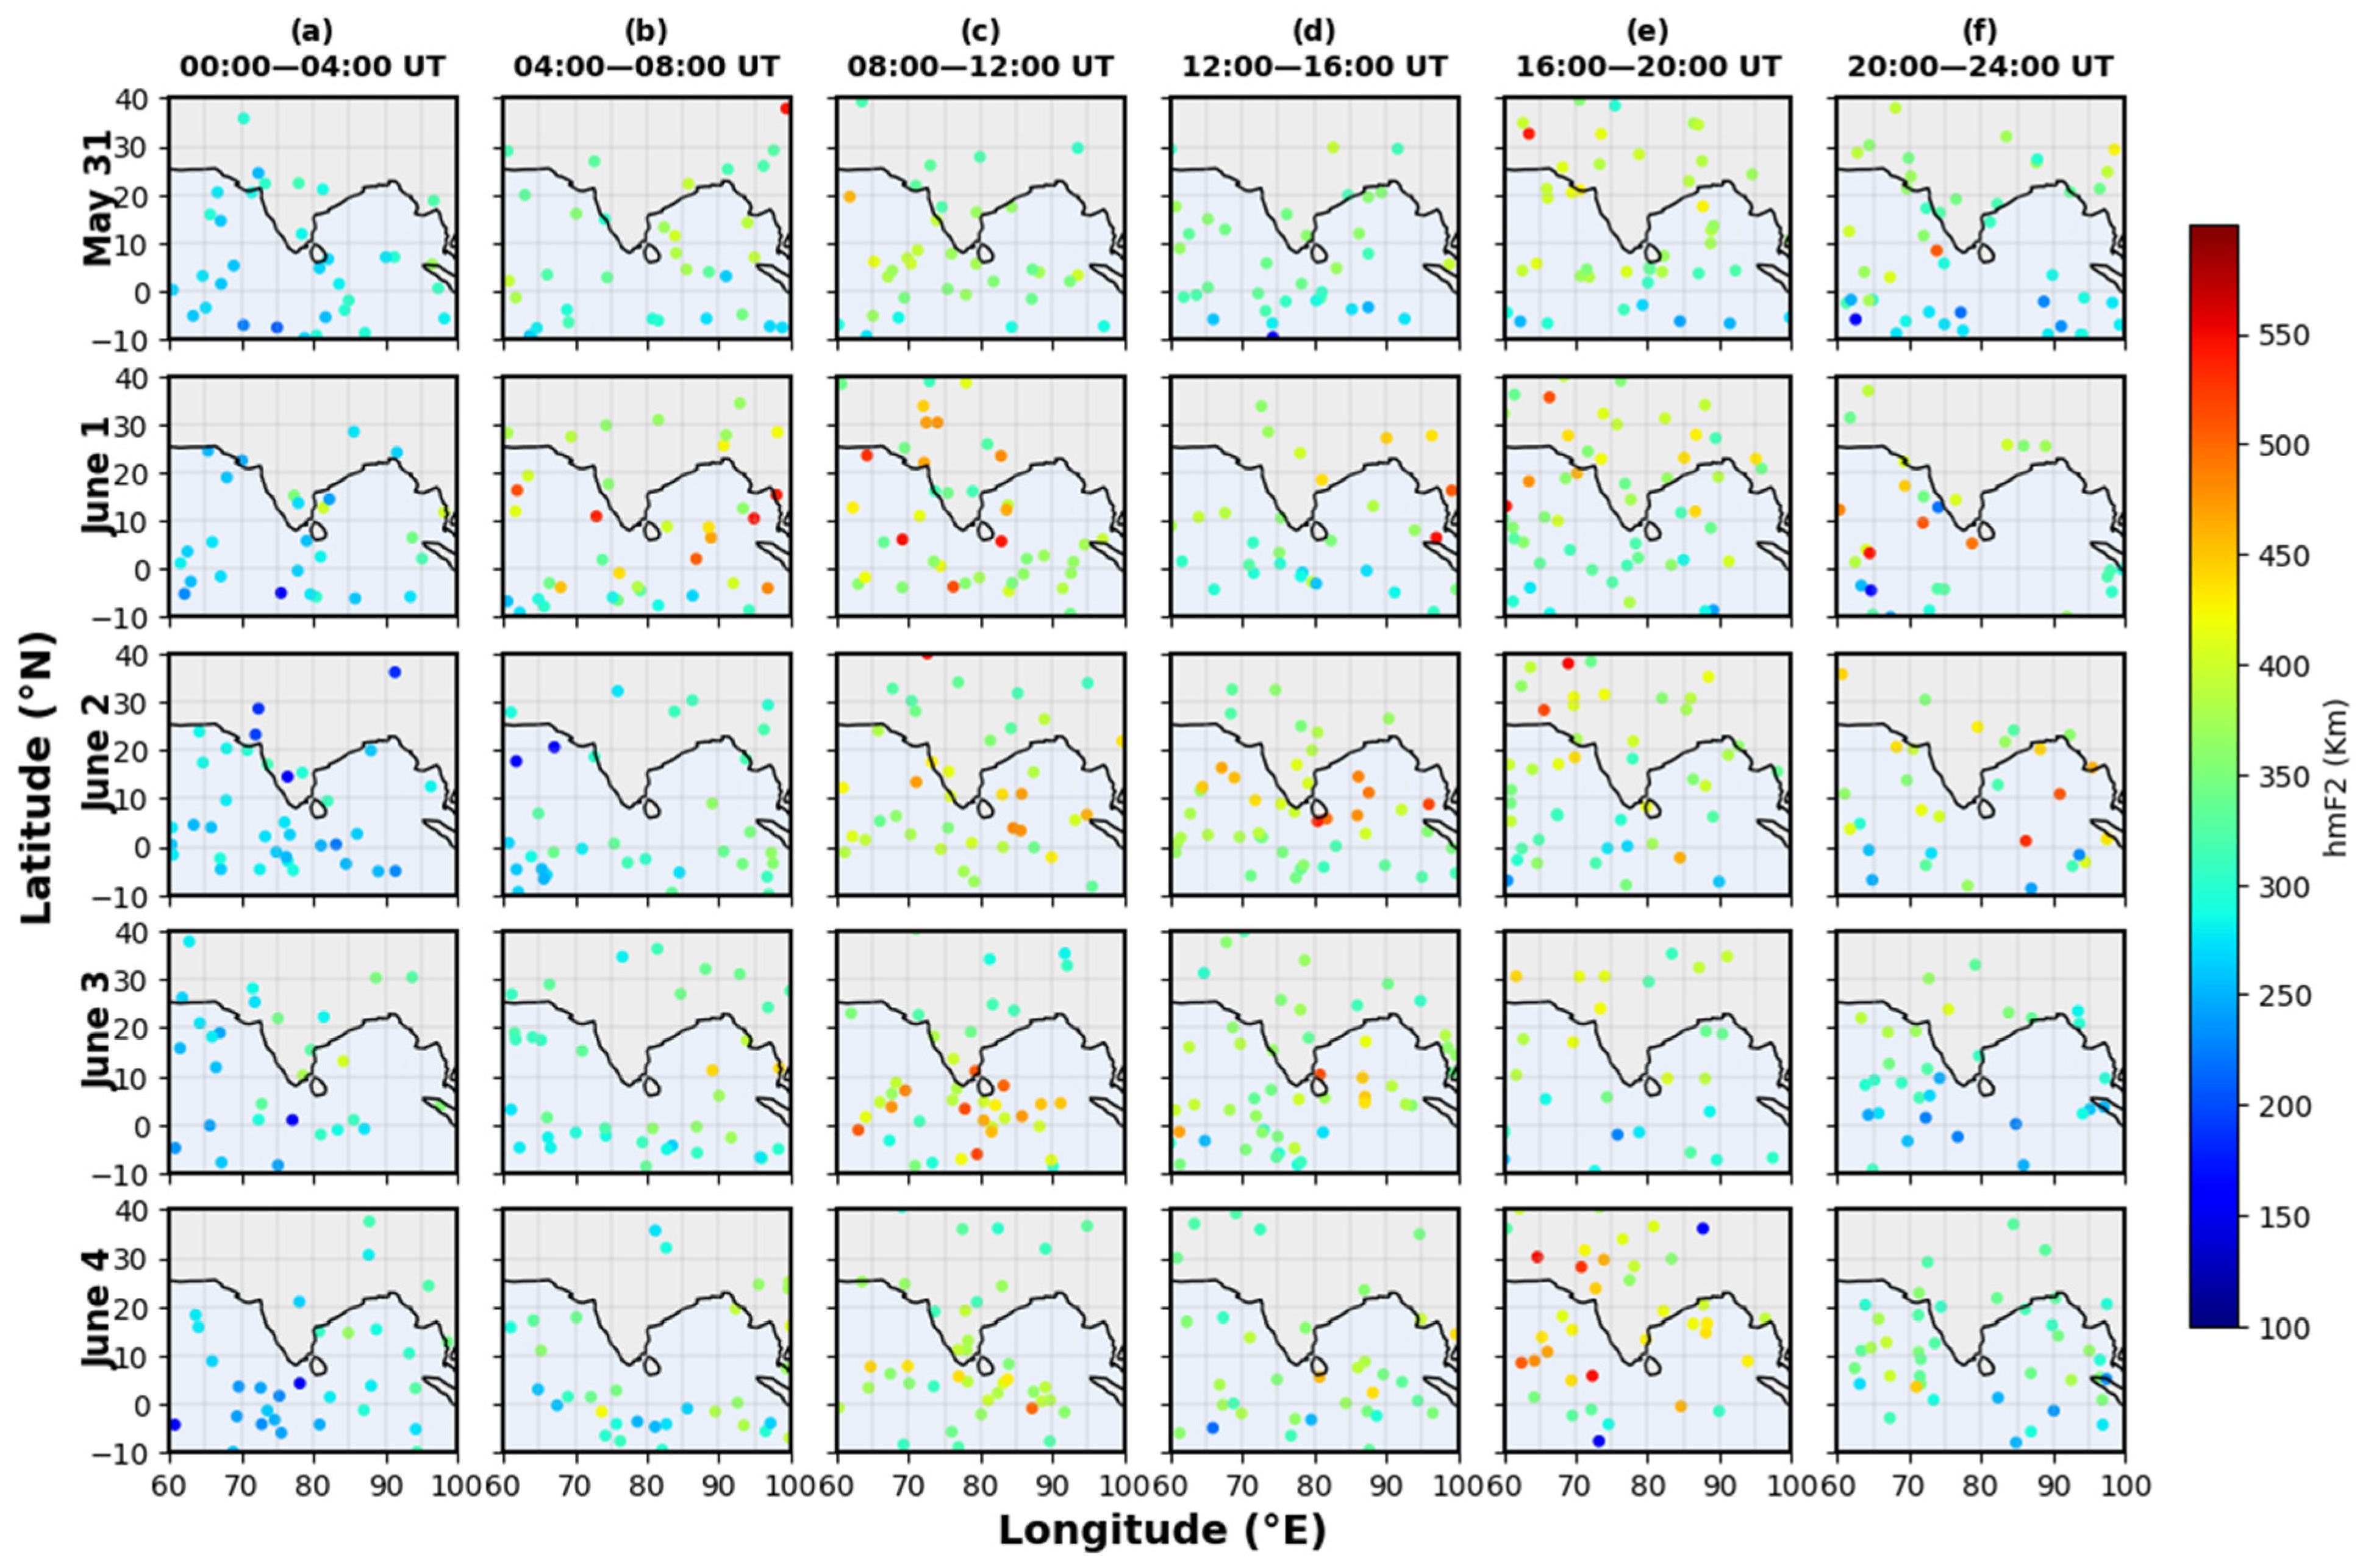
Figure 7 and Figure 8 present the spatial distributions of foF2 and hmF2 from 31 May to 4 June, resolved at 4 h intervals, to illustrate the ionospheric response to storm-time forcing. COSMIC-2 RO will provide high-resolution measurements of ionospheric parameters up to ±45° geographic latitude. A total of 1098 COSMIC-2 RO profiles are examined during the storm period from May 31 to June 4. Under quiet conditions on 31 May, both foF2 and hmF2 exhibited typical diurnal structures, characterized by a maximum value of foF2 around the day-side EIA and that of hmF2 primarily in the afternoon hours. However, on 1 June, a pronounced departure from quiet-time patterns emerged. Between 0800 and 1200 UT, foF2 showed widespread enhancements (~18 MHz), particularly at low and mid latitudes (Figure 7c), while hmF2 (Figure 8c) displayed substantial uplift across much of the day-side hemisphere. The increased hmF2 values exceeding about 450 km from Earth over the EIA regions indicate a plausible enhancement in vertical plasma transport. Further, the rapid decrease in foF2 at low and mid latitudes during night-time hours (after 1600 UT), with corresponding hmF2 remaining at higher altitude, suggests sustained upward plasma motion followed by increased recombination after post-sunset hours. However, a significant decrease (~50% of quiet day values) in dayside foF2 and hmF2 is noticed from 0000 to 0800 UT on 2 June, with foF2 starting to recover towards quiet-time levels over the EIA and mid-latitude regions. These coupled signatures indicate continued storm-related modifications to electrodynamic and thermospheric drivers. On 3 June, during the storm recovery phase, both foF2 and hmF2 exhibited moderate decreases, consistent with the reduction in GPS-TEC. At night (1600–2400 UT) on 2 June and 3 June, foF2 values remained relatively low due to enhanced night-time recombination, whereas hmF2 returned to typical quiet-time altitudes.
Figure 7.
COSMIC-2 derived foF2 (MHz) from 31 May to 4 June (a–f) in four-hour bins. (a) 0000–0400 UT, (b) 0400–0800 UT, (c) 0800–1200 UT, (d) 1200–1600 UT, (e) 1600–2000 UT, and (f) 2000–2400 UT. The marked region A represents increase in foF2 on the storm day whereas the regions B and C represent subsequent decrease in foF2 through the recovery phase of the storm.
Figure 8.
COSMIC-2 derived hmF2 (km) from 31 May to 4 June (a–f) in a four-hour bin. (a) 0000–0400 UT, (b) 0400–0800 UT, (c) 0800–1200 UT, (d) 1200–1600 UT, (e) 1600–2000 UT, and (f) 2000–2400 UT.
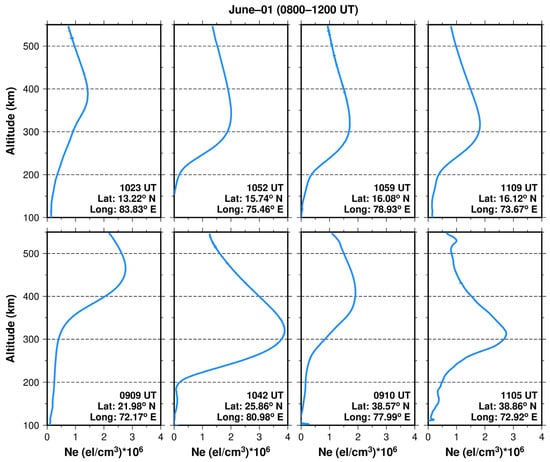
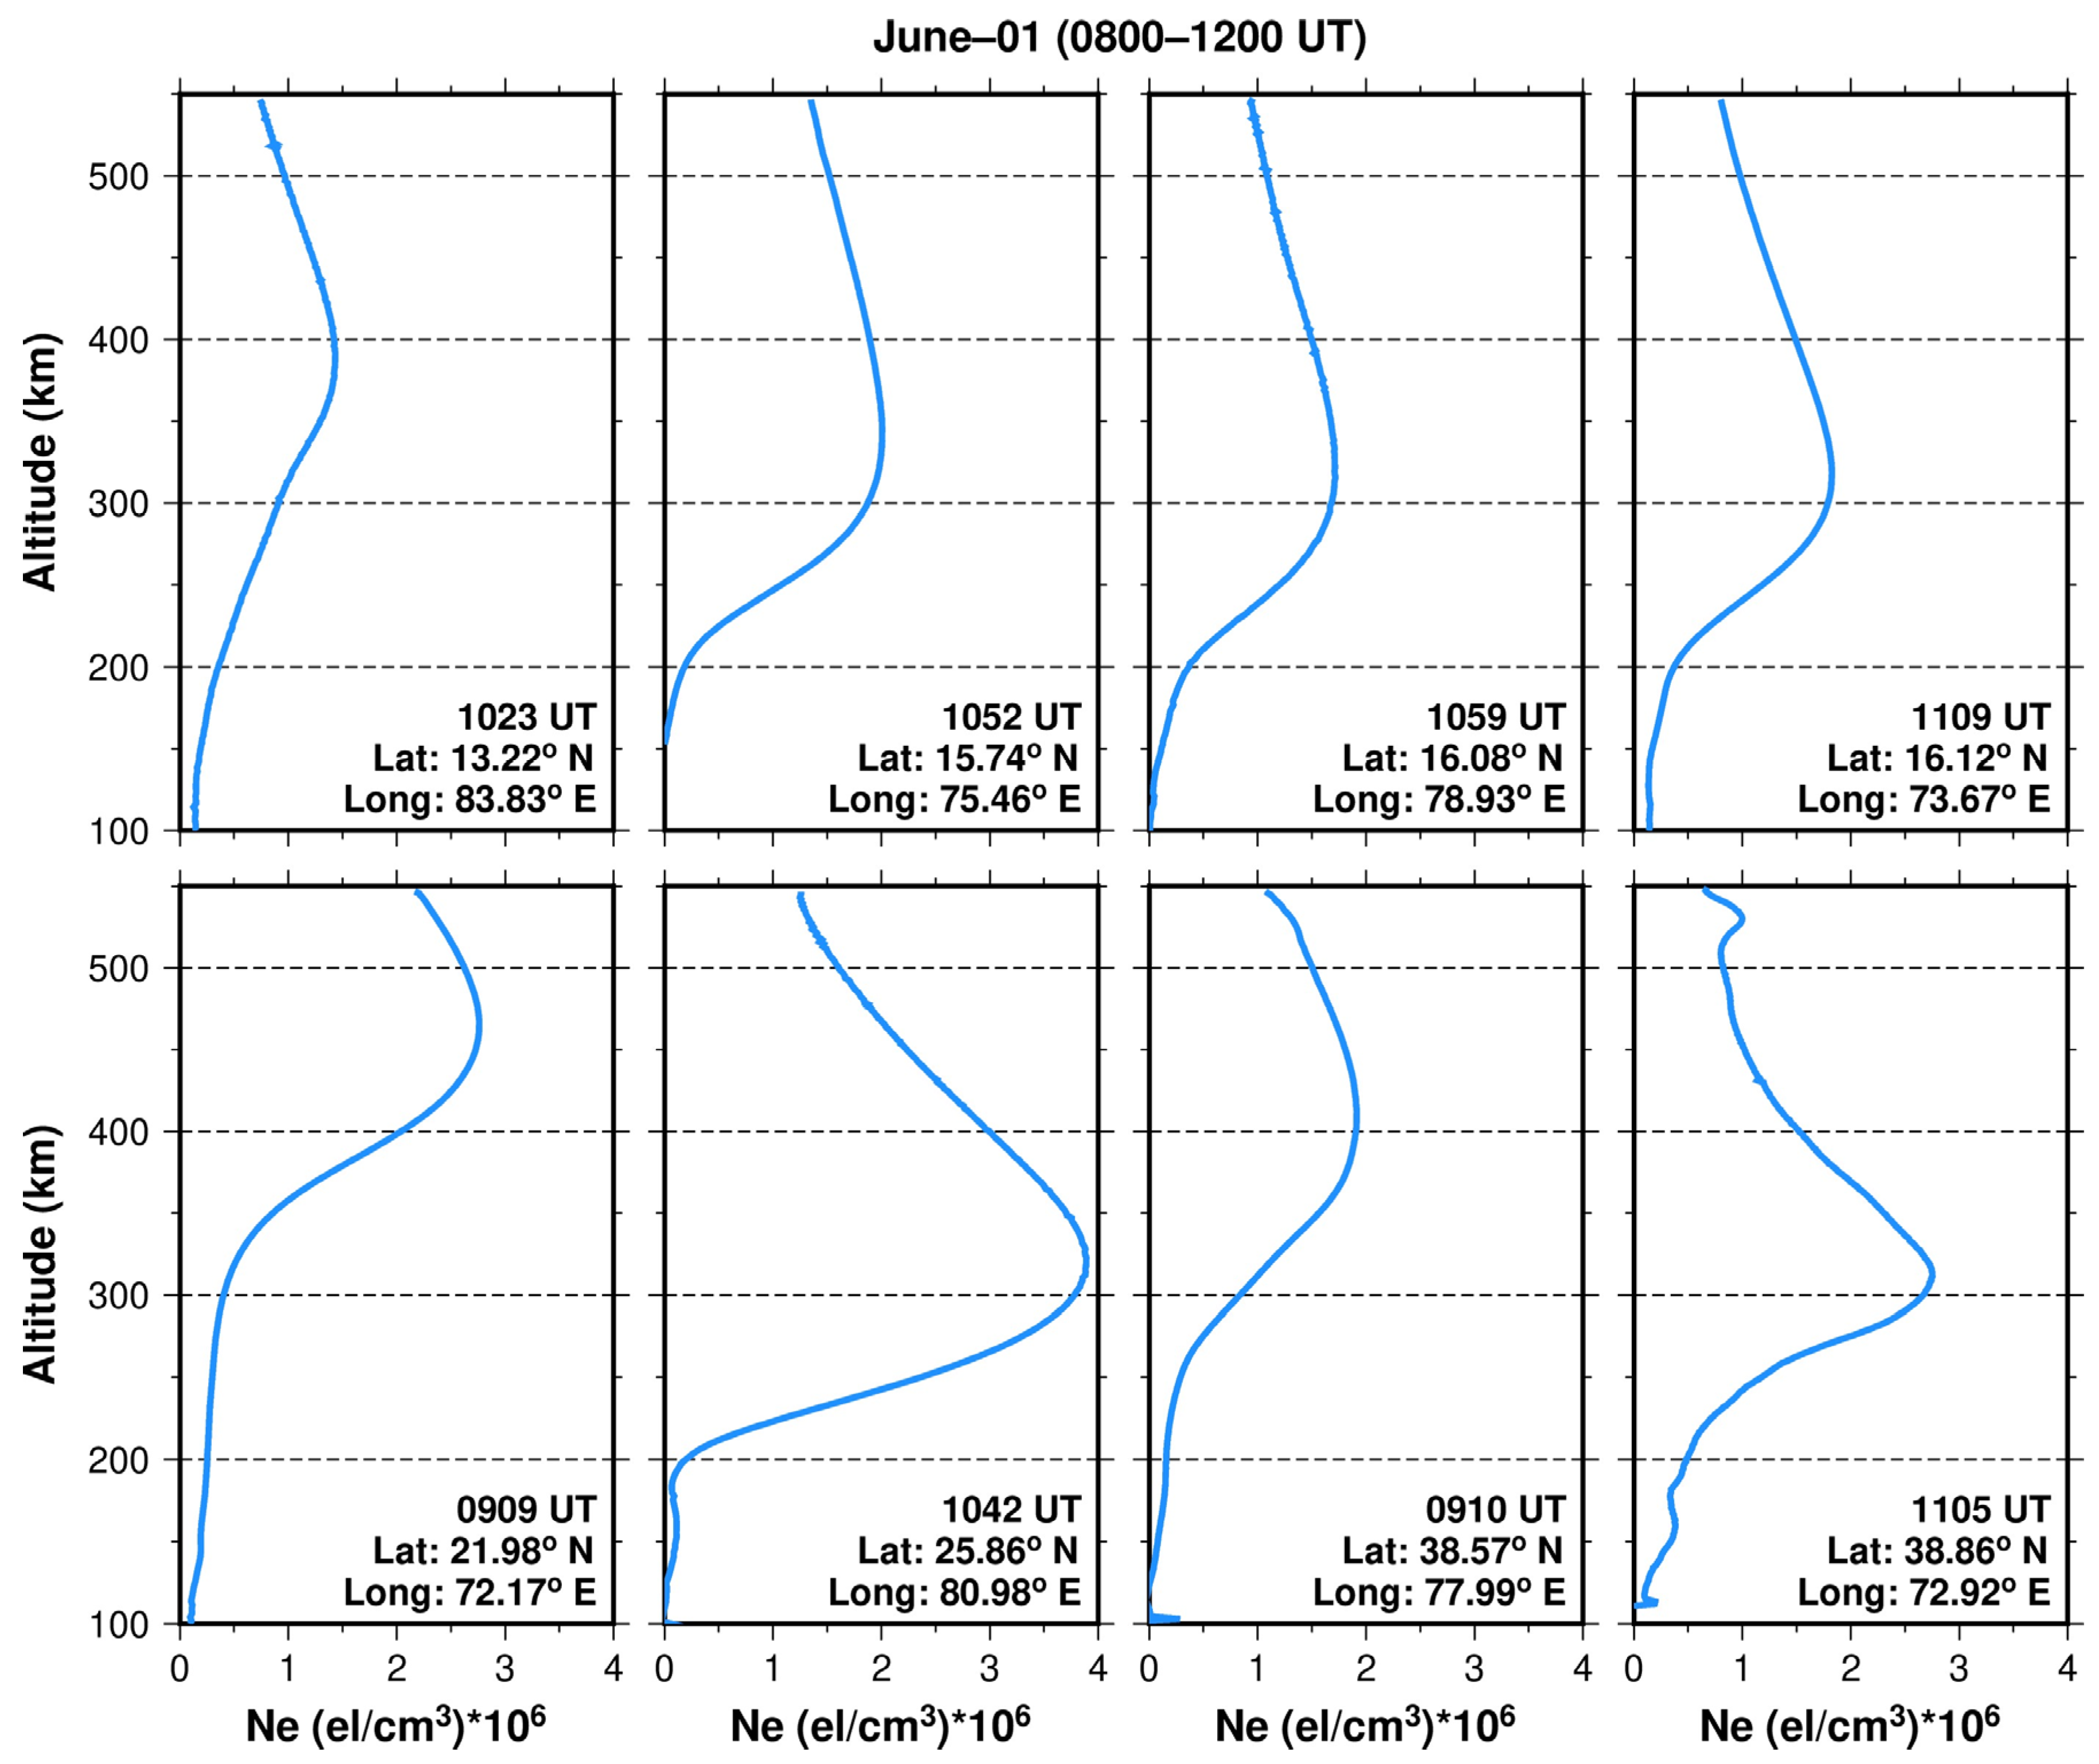
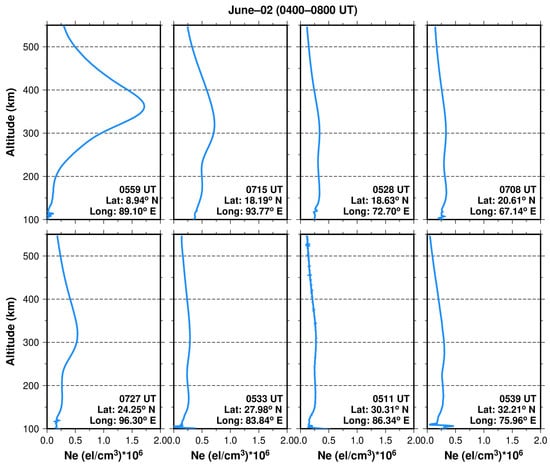
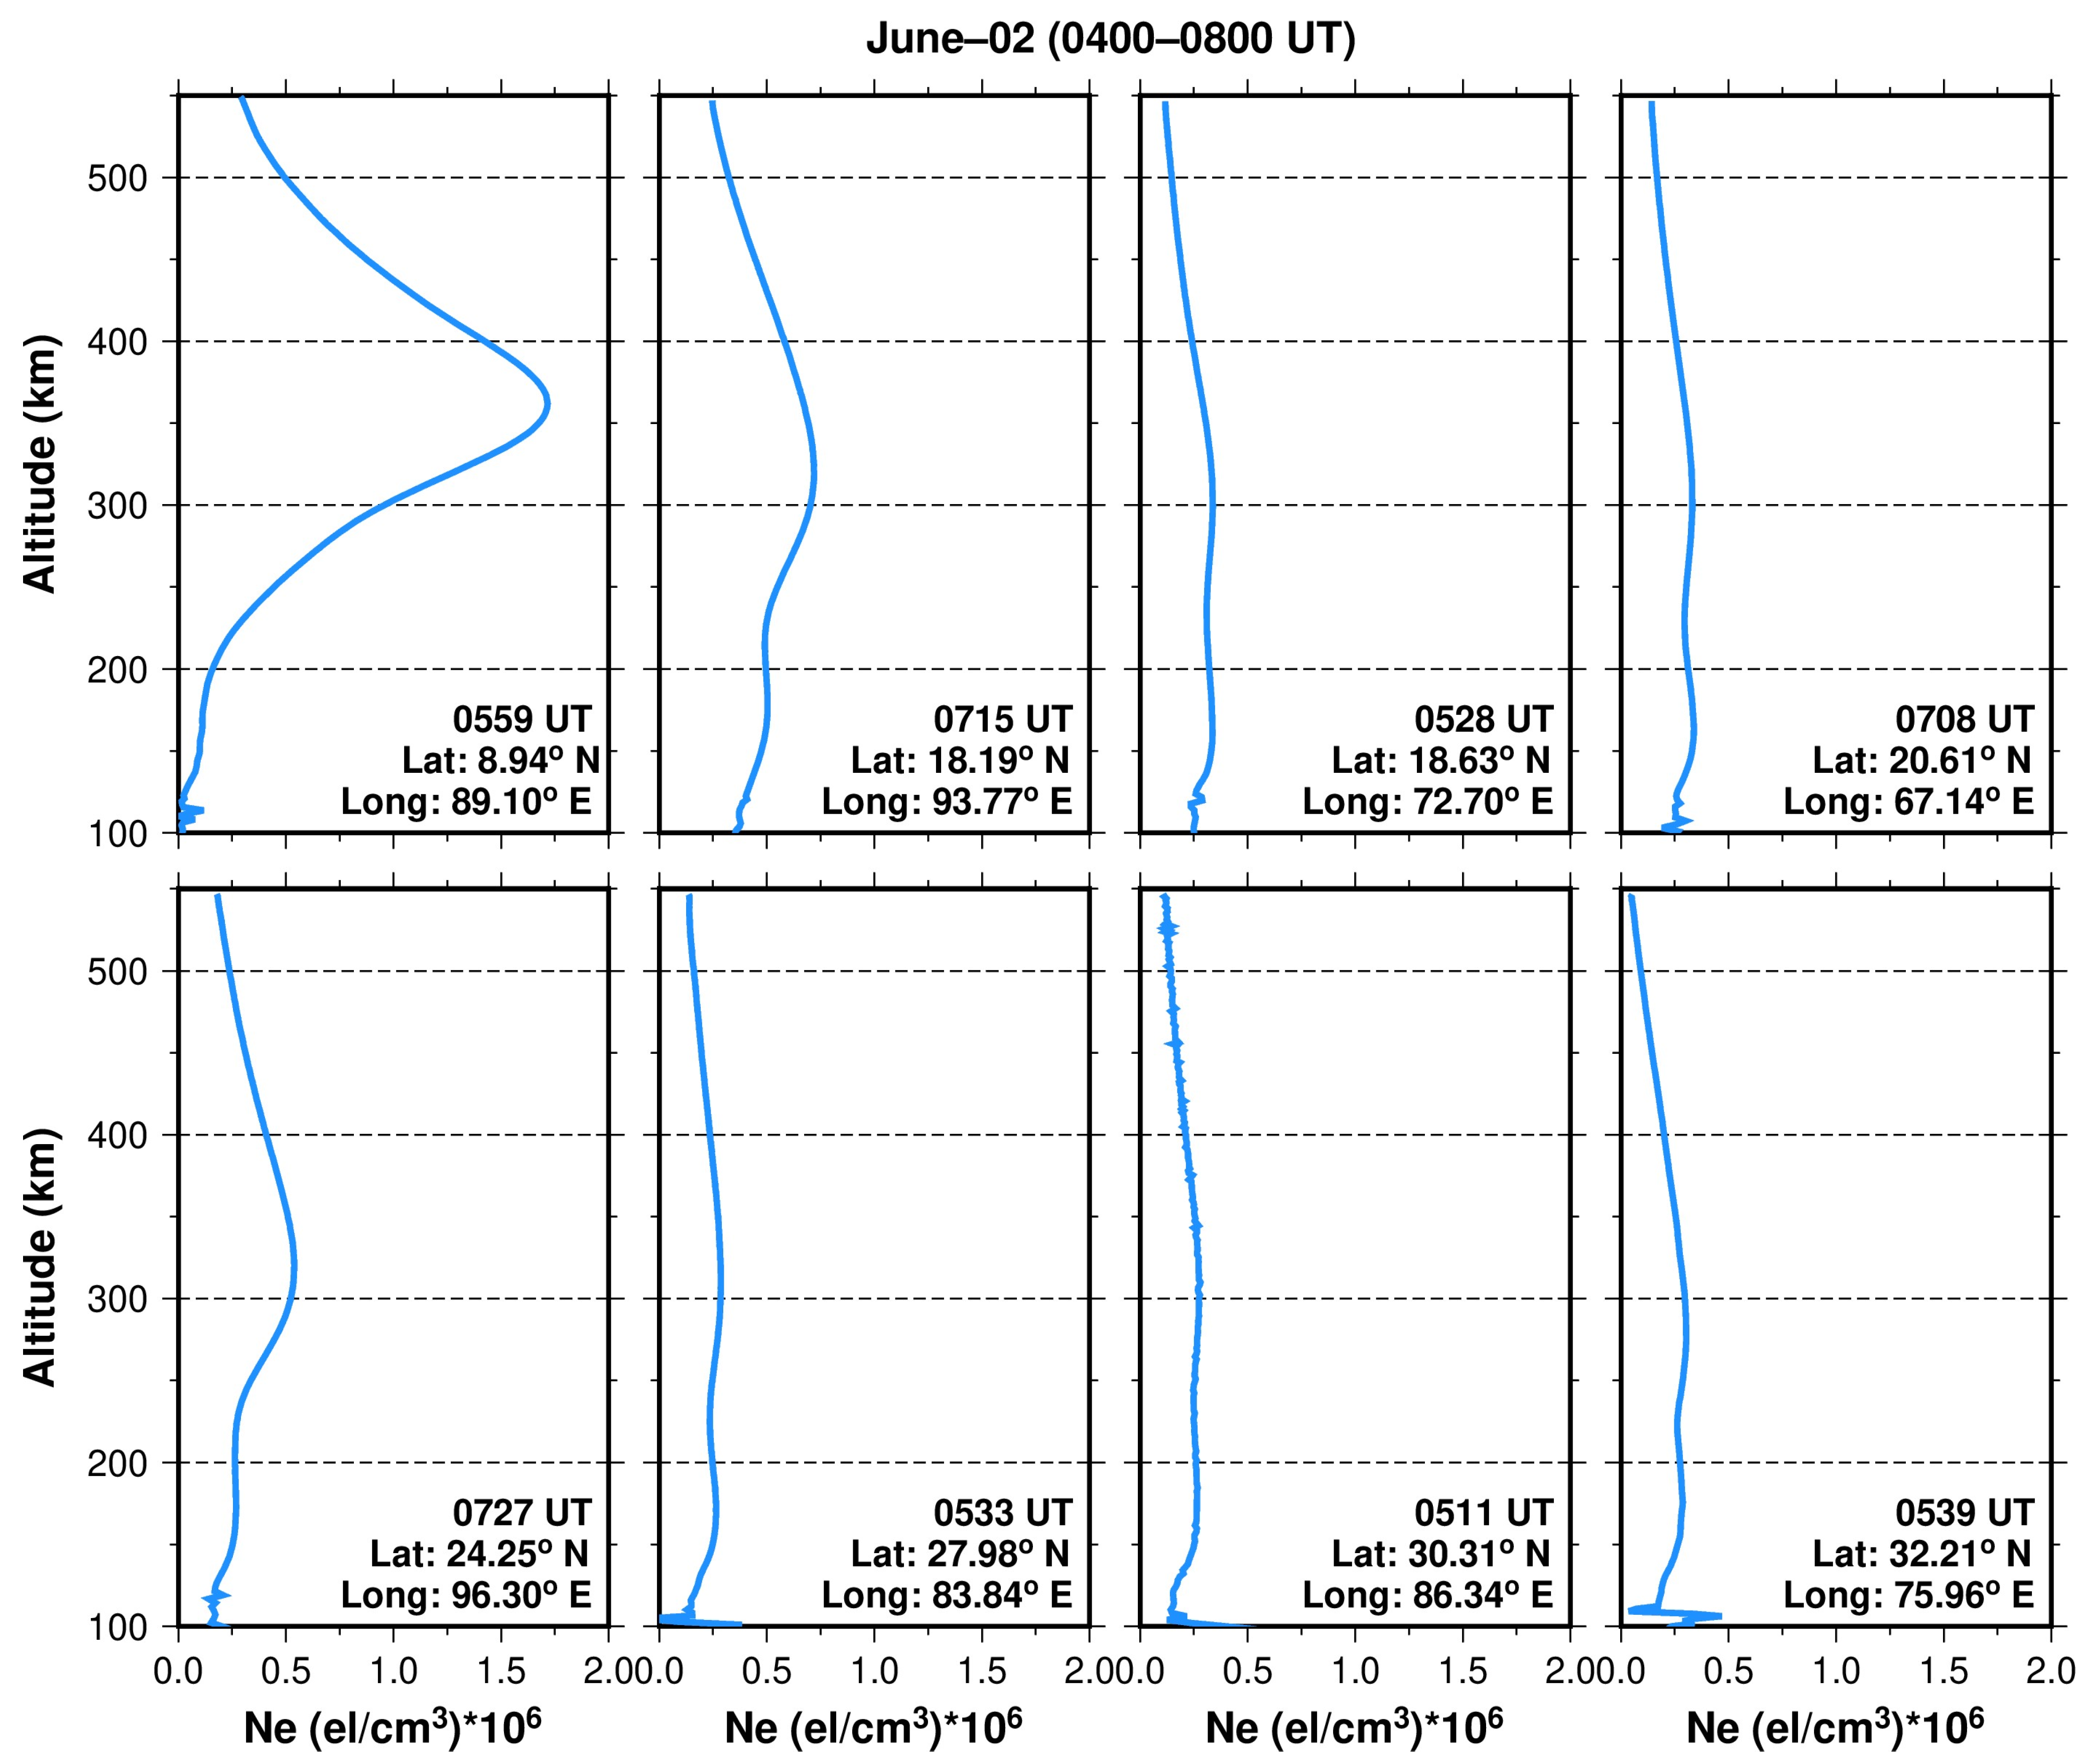
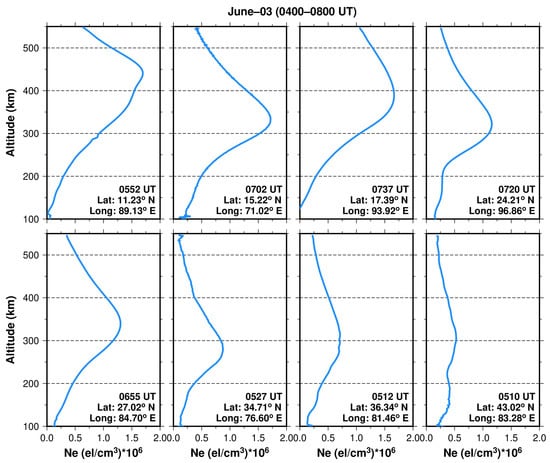
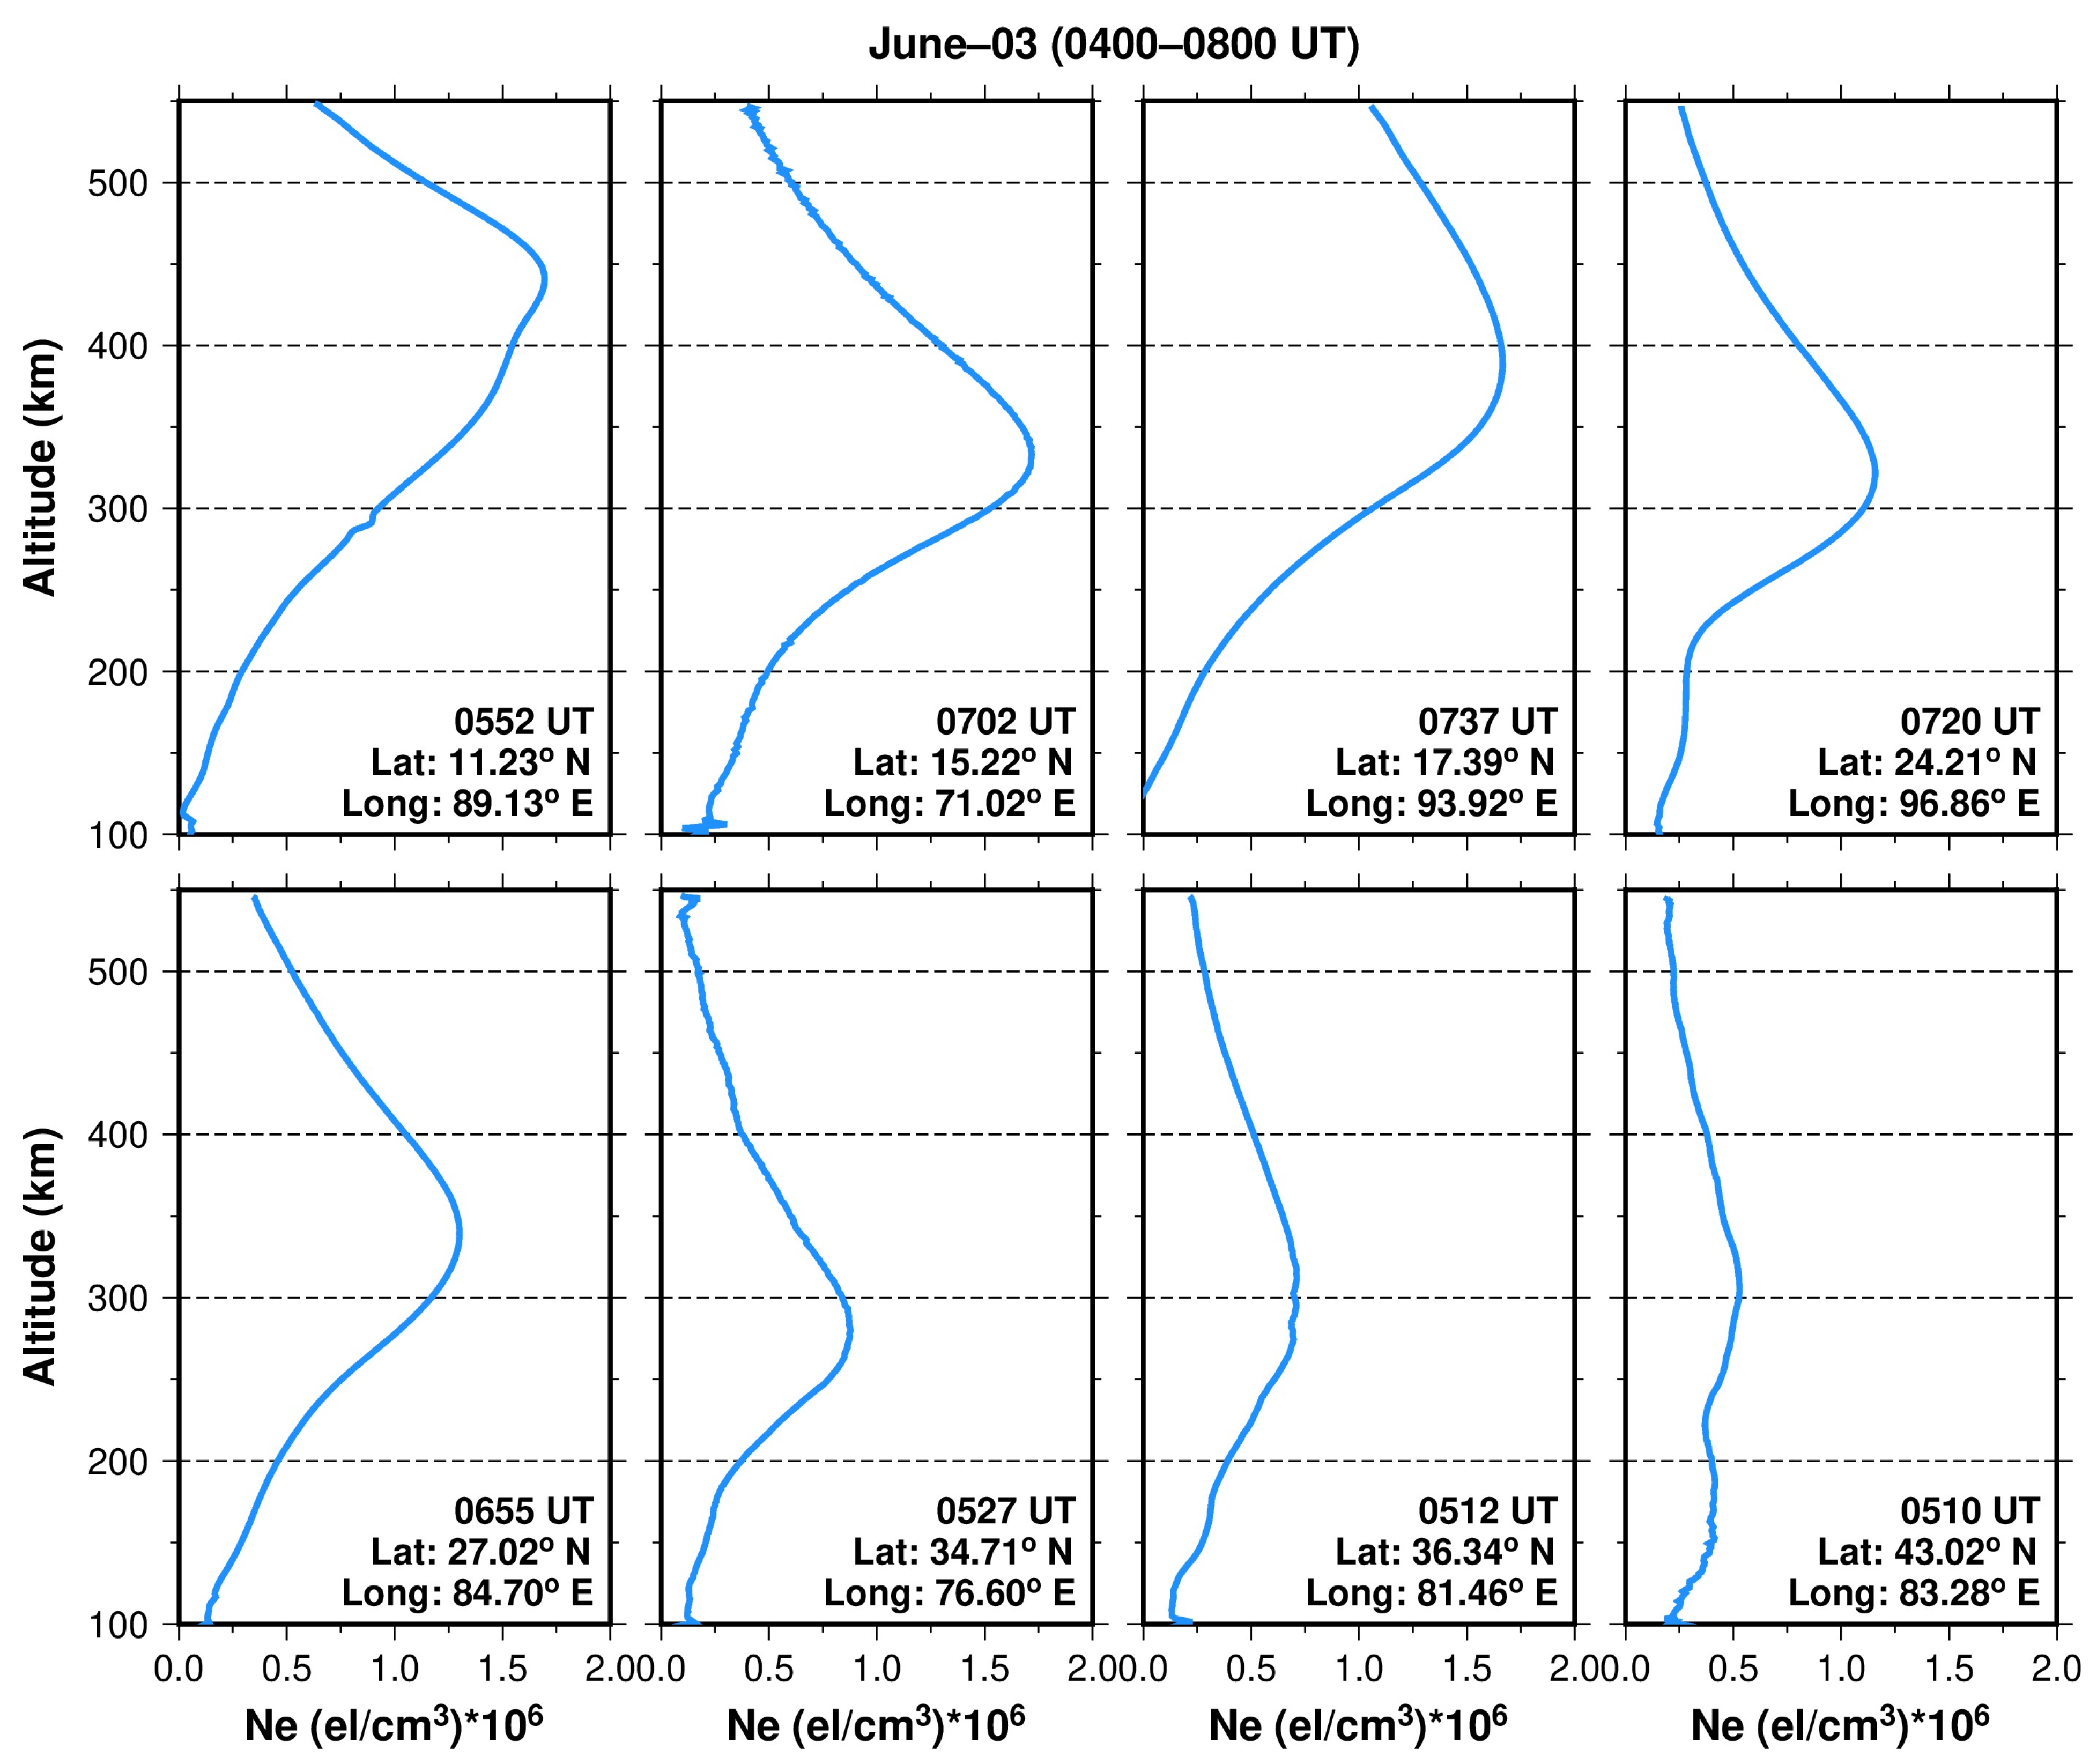
Figure 9, Figure 10 and Figure 11 show the sequence of ionospheric electron density profiles over marked regions in Figure 7 (A, B, and C). These regions are selected based on the increase or decrease in foF2 compared to the regular quiet-time variations. The electron density profiles exhibit several consistent structural features as well as notable temporal variability. Across all eight panels in Figure 9, the F-region peak is clearly identifiable between approximately 370 and 410 km altitude on 1 June from 0800 UT to 1200 UT, with maximum electron densities ranging from ~2.5 × 10⁶ to 3.5 × 10⁶ electrons cm−3. In contrast, on 2 and 3 June between 0400 UT and 0800 UT, a marked decrease in electron density is observed, with peak values reduced to ~1 × 10⁶ to 1.7 × 10⁶ electrons cm−3. During this period, the F-region peak altitude also decreases significantly, lowering to approximately 250–320 km.
Figure 9.
Variation in electron density with altitude for selective ionospheric profiles obtained from COSMIC-2 RO over the region “A” marked during 0800–1200 UT in Figure 7c. The region “A” is identified based on the marked increase in foF2 variations on 1 June 2025.
Figure 10.
Variation in electron density with altitude for selective ionospheric profiles obtained from COSMIC-2 RO over the region “B” marked during 0400–0800 UT in Figure 7b. The region “B” is identified based on the marked decrease in foF2 variations on 2 June 2025.
Figure 11.
Variation in electron density with altitude for selective ionospheric profiles obtained from COSMIC-2 RO over the region “C” marked during 0400–0800 UT in Figure 7b. The region “C” is identified based on the marked decrease in foF2 variations on 3 June 2025.
4. Discussion
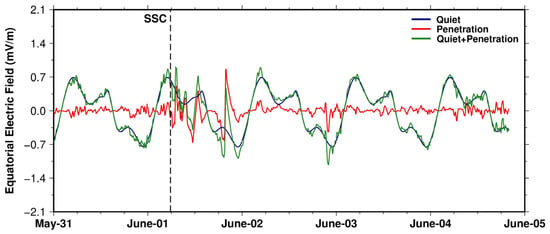
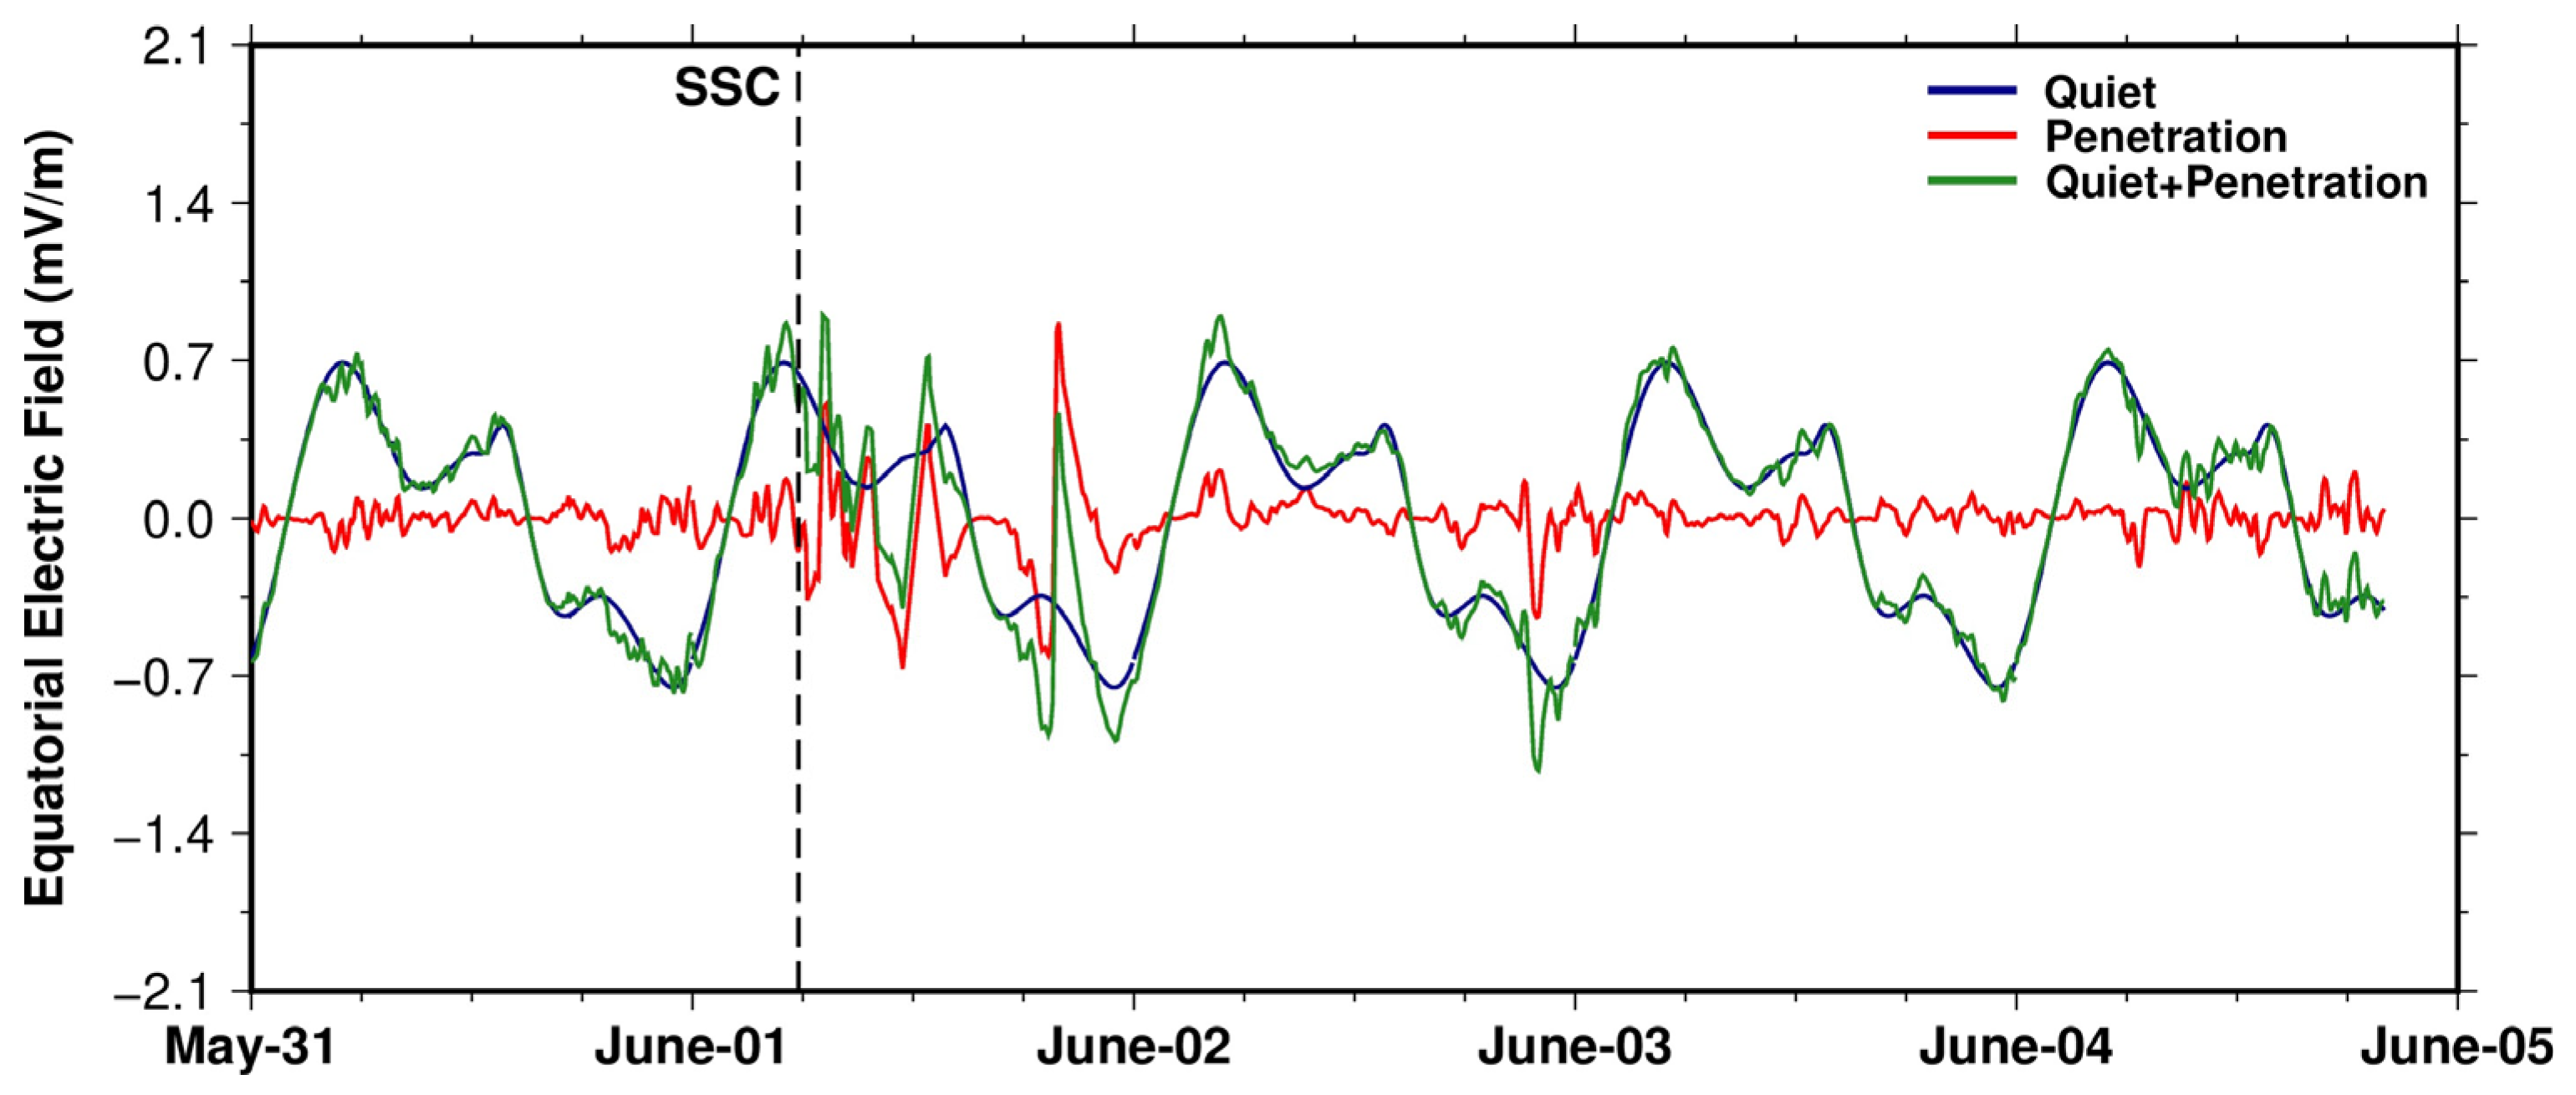
The geomagnetic storm of 1–3 June produced the peculiar and spatially structured ionospheric variations over the Indian longitude sector, as observed through ground-based GPS receivers and Swarm and COSMIC satellite measurements. On the initial day of the storm (1 June), TEC estimated from GPS data and electron density profiles obtained from Swarm in situ measurements and COSMIC radio occultation collectively revealed the pronounced enhancement spanning from equatorial to mid-latitude regions. This enhancement was accompanied by characteristic signatures of uplifted F-region plasma, such as elevated peak heights of the F2 layer (Figure 8). These observed enhancements are primarily attributed to the PPEFs that develop during the main phase of geomagnetic storm associated with southward-oriented IMF-Bz. Figure 12 illustrates model-derived electric fields, which clearly indicate their penetration into the low-latitude ionosphere. PPEFs enhance the equatorial fountain effect by increasing upward E × B plasma drifts, which transport ionospheric plasma away from the magnetic equator, thereby intensifying the EIA [12,43,44,45,46]. Additionally, storm-time equatorward neutral wind surge driven by high-latitude Joule heating played a significant role in sustaining uplifted plasma [22,28,47]. The sudden increase in solar wind speed and intensified AE index confirmed the significant increase in the Joule heating, driven by the enhanced magnetospheric energy input. This, in turn, altered neutral circulation patterns and facilitated the continued uplift of low-latitude ionospheric plasma. These neutral winds transport ionized particles along magnetic field lines to higher altitudes, thereby prolonging the persistence of storm-time ionospheric density [22,48].
Figure 12.
PPEEF model derived eastward electric fields during 31 May to 4 June. The black vertical dashed line indicates the time of SSC arrival.
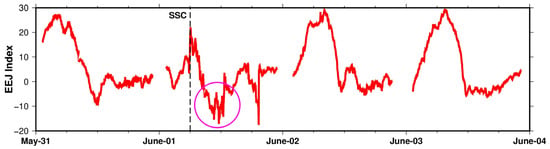
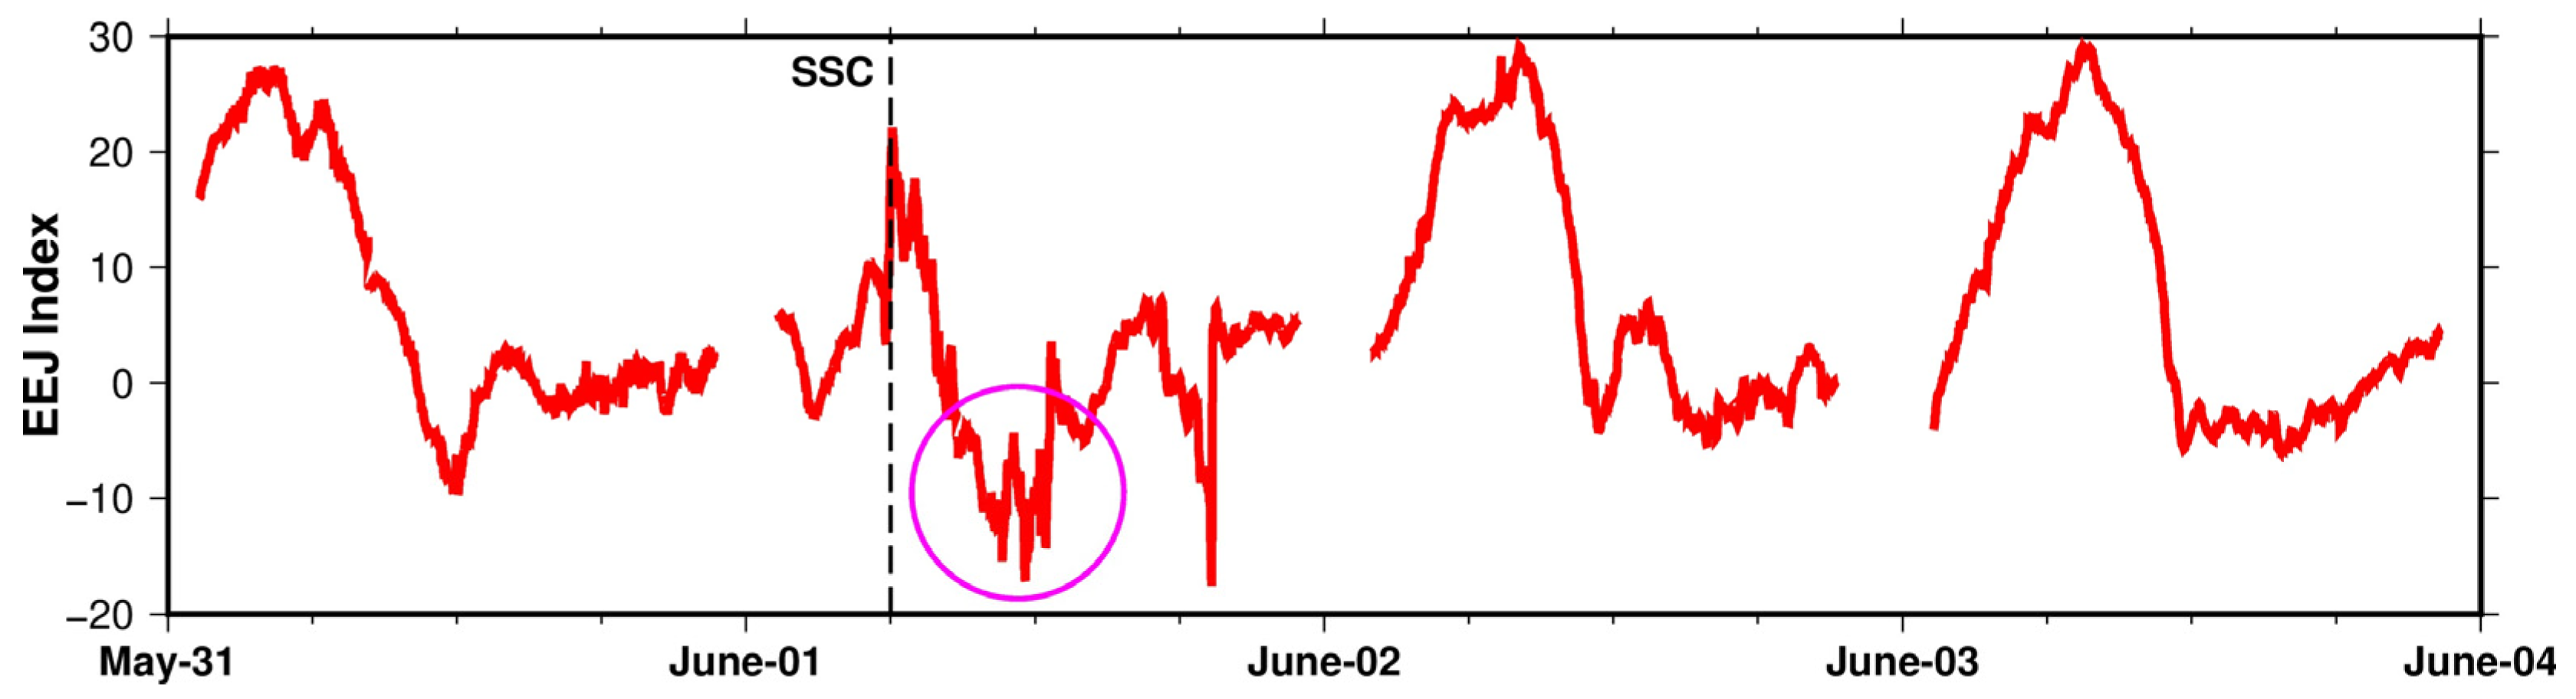
Although the moderate Counter Electrojet (CEJ) signature was observed (Figure 13) and its influence during this storm appeared secondary, causing only minimal modulation of the eastward electric field without dominating the enhancement, rather, the simultaneous effect of PPEF-driven uplift and equatorward neutral wind forcing primarily created the large-scale TEC enhancement observed on the first day. Previous studies have reported similar observations across different longitudinal regions. Goncharenko et al. [49] identified that the positive phase of the ionospheric storm on 10 September 2005 was driven by the combination of mechanisms, including PPEFs, TIDs, and variations in the O/N2 ratio. Lu et al. [50] observed that the strong dayside positive storm phase on the same day was primarily caused by enhanced equatorward meridional winds. These winds are driven by strong pressure gradients resulting from Joule heating at high latitudes. Similarly, De Abreu et al. [51] reported significant and pronounced positive ionospheric storm effects, attributing these to variations in thermospheric wind circulation toward the equator, which are identified as the key mechanism driving the positive ionospheric responses. More recent studies by Tulasi Ram et al. [14] and Bai et al. [52] documented the positive ionospheric storm effect and poleward extension of the EIA during the 2024 Mother’s Day geomagnetic storm. This extension was linked to the joint influence of PPEFs and equatorward-directed neutral winds.
Figure 13.
EEJ index during 31 May to 3 June. The black dashed line represents the SSC onset time, and the purple circle shows the presence of CEJ during the storm period.
The spatial distribution of TEC enhancement on 1 June revealed strong latitudinal gradients along the Indian region, which shows the complex interaction of storm-time electrodynamic and neutral wind processes. Stations located close to the magnetic equator exhibited smaller VTEC enhancements, consistent with the reduced effectiveness of PPEF-driven uplift in the presence of the weakened or disturbed electrojet. In contrast, stations located from the EIA region to mid latitude showed substantially larger TEC enhancements, indicating that the combined influence of PPEFs and storm-time equatorward neutral winds significantly intensified the equatorial fountain effect and transported plasma to higher latitudes [22,30,32]. During geomagnetic storms, penetration electric fields can intensify the fountain to a super-fountain mode, causing the EIA crests to move far beyond their typical quiet-time latitudes [13,15,53]. Also, due to the complex interaction between the penetration electric fields and neutral wind activity, TID signatures could be reflected in the VTEC data and manifested as the double-peak maximum. This is indicative of wave-like perturbations superimposed on the storm-time enhancement. Nevertheless, the multi-peaked TEC structure and propagating TEC perturbations reported during the recent geomagnetic superstorms across different longitude sectors substantiate the derived inferences in the present study [54,55]. The uplifted plasma was transported to higher altitudes, where recombination rates are low, allowing the plasma to accumulate in the anomaly crest region and extend further poleward. This resulted in prolonged enhancements of TEC and electron density from daytime to night-time, referring to the storm-driven F-region uplift that allowed the uplifted ionization long after the weakening of the penetration electric fields [56]. Both Swarm topside electron density measurements and COSMIC-2 derived hmF2 further confirmed that the plasma remained elevated for several hours, supporting the interpretation that the prolonged enhancement originated from the combined vertical transport effects of PPEFs and equatorward winds, rather than solely from local electric field variability. Rout et al. (2025) [57] reported the very strong EIA over Jicamarca during the superstorm of May 2024, lasting for about 12 h. They explained that this long-lasting enhancement resulted from the combined effects of the intensified penetration electric field and meridional winds, which prolonged the activity of the plasma fountain.
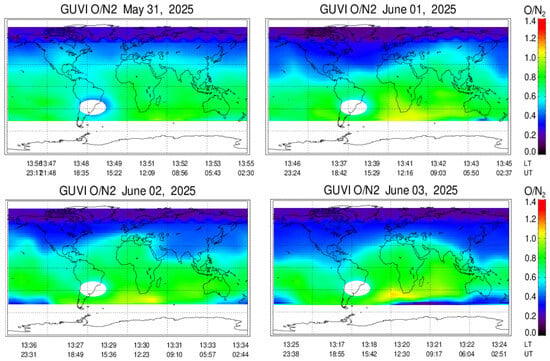
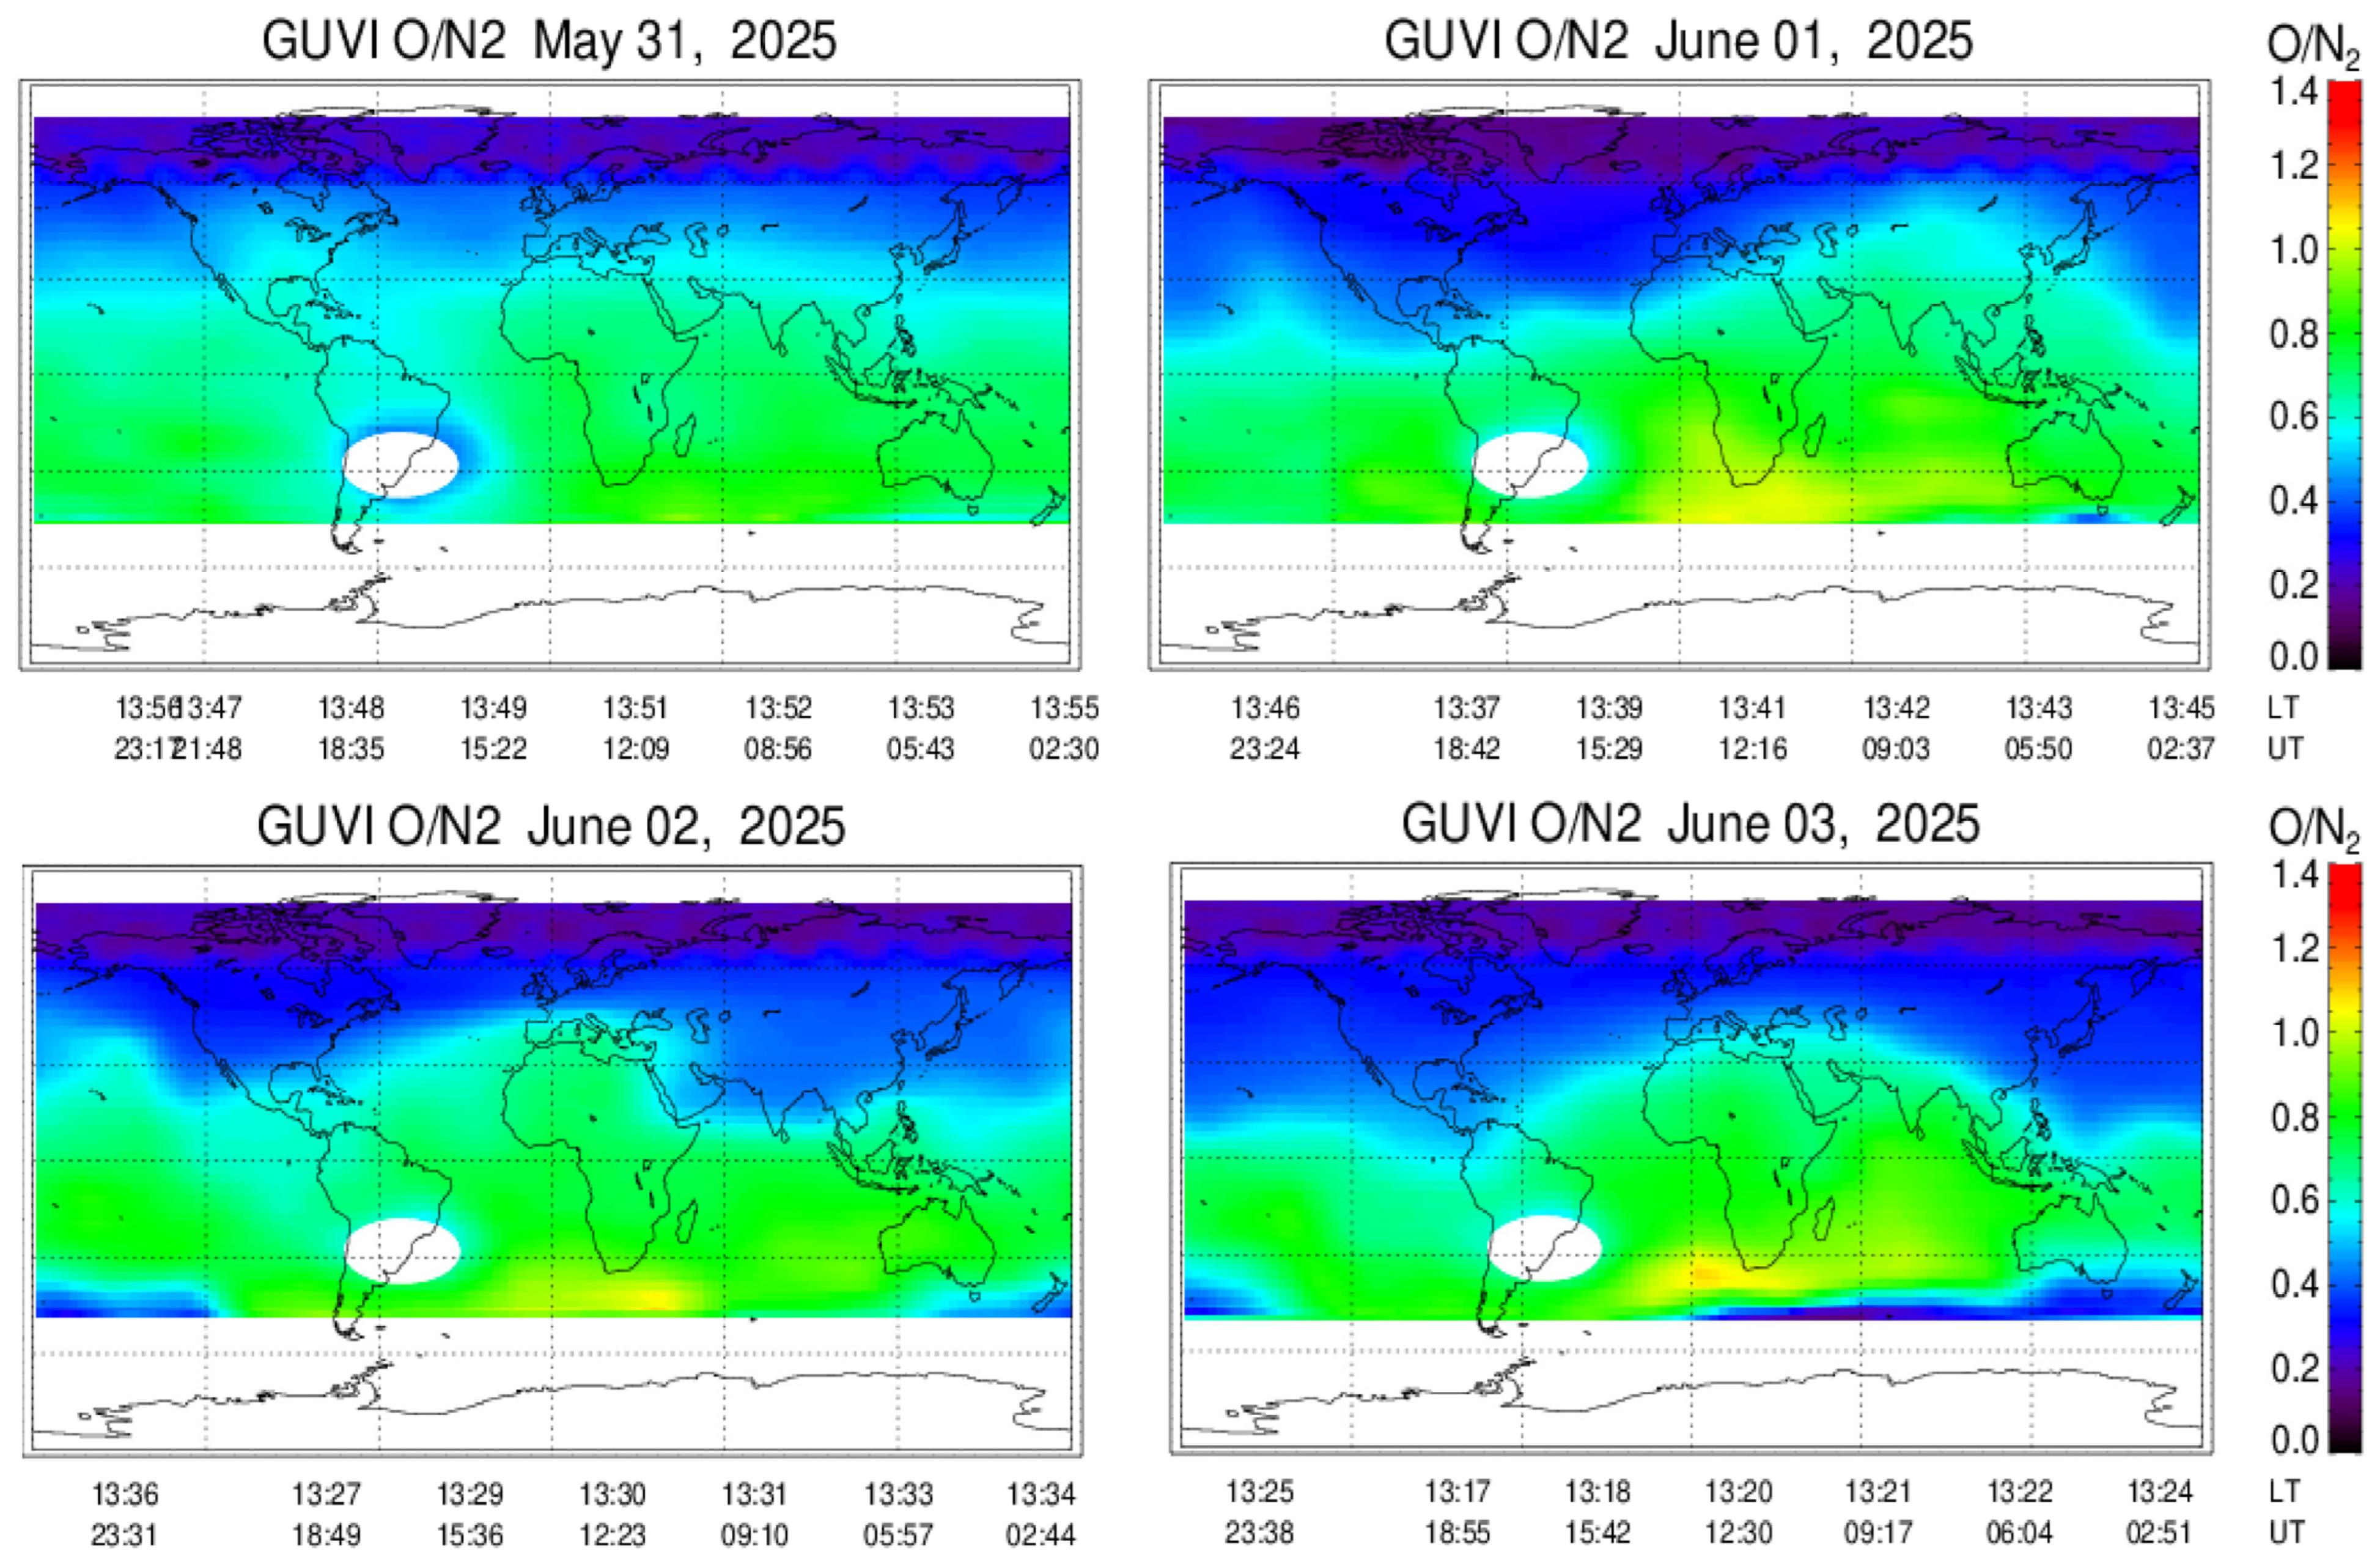
Following the strong positive phase, the ionosphere transitioned into the pronounced negative storm phase on 2 June, characterized by widespread TEC depletion and reductions in both bottom side and topside electron densities, as observed in GPS-derived VTEC, COSMIC-2 and Swarm electron density measurements. The ionosphere will be further influenced by the system through DDEFs during the geomagnetic storm, which develops from Joule heating-induced changes in thermospheric winds and composition that collectively modify the RT instability growth rate [58]. The negative storm effect on 2 June is attributed to the development of dynamo electric fields (DDEFs), which arise several hours after storm onset and induce the westward daytime electric field at low latitudes. This westward electric field reduces upward vertical plasma drifts, causing the F-region ionosphere to descend [11,17]. Concurrently, geomagnetic storms enhance energy input into the high-latitude thermosphere, resulting in the upwelling of molecular-rich N2 and O2 into the lower thermosphere and ionosphere. The increased molecular composition elevates recombination rates, thereby reducing electron density and contributing to the negative ionospheric storm [59]. Figure 14 clearly illustrates reduced O/N2 over the Indian longitude sector. The combined effects of DDEF-driven downward plasma drifts and reduced O/N2 ratio led to severe electron density reductions during the latter part of the storm observed across the Indian equatorial to mid-latitude regions. However, during the negative storm phase on 2 June, the EEJ index exhibits values that are nearly identical to those of the corresponding quiet day, with no pronounced enhancement or suppression observed (Figure 13).
Figure 14.
GUVI/TIMED satellite-derived thermosphere O/N2 during the geomagnetic storm period from 31 May to 3 June 2025.
On 3 June, the ionosphere experienced a minor negative storm phase during the recovery period, aligned with the later stages of storm recovery when thermospheric and electrodynamic effects gradually diminish but do not immediately revert to quiet-time conditions. The observed reductions in TEC and electron density on this day are less pronounced than those on the preceding day but remained noticeable, which showed that the ionosphere was still influenced by storm-time forcing. Swarm topside density measurements and COSMIC-2 profiles from 3 June reflected this partially recovered state, exhibiting shallower F-region heights and reduced electron density compared to the markedly enhanced conditions observed on the initial day of the storm. Although the geomagnetic indices begin to normalize on the third day, underscoring a gradual recovery of the ionosphere, the thermospheric heating and dynamo electric fields continued to modulate the plasma densities, leading to a minor negative storm phase. Overall, the study highlights the effect of the multi-stage geomagnetic storm in the low-latitude ionosphere, thereby emphasizing the analysis of all phases of the geomagnetic storm period.
Moreover, the ionospheric variations observed during 1–3 June 2025 geomagnetic storm accentuate the influence of storm-time complex electrodynamics, PPEFs, DDEFs and equatorward neutral wind, in driving the ionospheric variability across the low and mid latitudes. The pronounced upliftment of plasma and its redistribution during the main phase of the storm, followed by the depletion due to thermospheric compositional changes in the ionosphere on the succeeding days, reaffirms the well-documented understanding of the geomagnetic forcing in the Indian longitude latitude sector. In brief, the storm-driven ionospheric variations are closely associated with the complex changes in thermospheric dynamics and ionospheric electrodynamics. The combined analysis of ground and space-based observations, including GPS, Swarm, COSMIC, Magnetometer, Thermosphere O/N2 and modelled electric fields, offers a comprehensive and multi-dimensional perspective of the processes involved, thereby highlighting the critical importance of multi-technique observations to thoroughly characterize the storm-time ionospheric dynamics over the Indian longitude region.
5. Conclusions
In the present work, we highlight the peculiar ionospheric variations over the Indian longitude sector in response to the geomagnetic storm of 1–3 June 2025, manifesting a distinct multi-stage evolution under the influence of the complex electrodynamic and thermospheric processes. The combined analysis of ground- and space-based measurements provided the comprehensive characterization of the spatiotemporal changes in the regional ionosphere. Additionally, the integration of ground-based magnetometer-derived EEJ estimates with model-derived penetrating electric field parameters allowed us to understand the influence of the prevailing electrodynamic processes during the episode of geomagnetic storm. The key outcomes from this study are listed as follows.
- The strong positive ionospheric storm on 1 June is attributed to the driving PPEFs and storm-time equatorward neutral winds. The combined effects of these processes uplifted and transported the F-region plasma to higher latitudes through intensification of the fountain effect that led to a significant enhancement in TEC (~200% of the quiet day values) at latitudes away from the equator. The slower plasma decay at higher altitudes resulted in sustained TEC and electron density enhancements.
- The latitudinal variation in TEC revealed the poleward extension of EIA due to enhanced fountain effect, with smaller VTEC magnitudes at the equatorial locations that increased significantly towards the EIA and mid latitudes, confirming an efficient plasma redistribution away from the equator.
- The severe negative ionospheric storm on 2 June was primarily driven by DDEFs that suppressed the upward plasma drifts. Additionally, the composition changes in the thermospheric O/N2 contributed to the widespread reductions in electron density across the region.
- The persistence of minor negative storm effects into the recovery phase on 3 June highlights the limited plasma production and vertical transport due to continued influence of the prolonged disturbance dynamo-driven electric fields, gradual restoration of thermospheric composition (O/N2 ratio) and neutral wind circulation. This emphasizes the delayed relaxation of the coupled thermosphere–ionosphere system despite the weakening of the geomagnetic storm.
- The characteristic bifurcated main phase during the storm period underscores the peculiar changes in the ionosphere across the Indian longitude sector under the influence of the complex electrodynamic and thermospheric forcing.
These results illustrate the critical role of electrodynamic and neutral wind processes across latitudes, underscoring the importance of incorporating these effects in models and forecasts of ionospheric behaviour during geomagnetic storms.
Author Contributions
Conceptualization, P.C. and S.S.K.R.; methodology, P.C., S.I. and S.S.K.R.; software, P.C., S.I., S.S.K.R. and S.C.; validation, P.C., S.I., S.S.K.R., D.S. and S.K.P.; formal analysis, P.C., S.I., S.S.K.R., D.S., S.C. and S.K.P.; investigation, D.S., S.K.P., C.G.V., J.R.K.K.D., A.K.M. and S.S.; resources, D.S., S.K.P., C.G.V., J.R.K.K.D., A.K.M. and S.S.; data curation, P.C., S.I., S.S.K.R. and S.C.; writing—original draft preparation, P.C., S.I., S.C. and S.S.K.R.; writing—review and editing, D.S., S.K.P., C.G.V., J.R.K.K.D., A.K.M. and S.S.; visualization, P.C., S.I., C.G.V., J.R.K.K.D., A.K.M., S.S. and S.S.K.R.; supervision, D.S. and S.K.P.; project administration, D.S., S.K.P. and C.G.V.; funding acquisition, D.S., S.K.P., J.R.K.K.D. and C.G.V.; All authors have read and agreed to the published version of the manuscript.
Funding
This research received no external funding.
Institutional Review Board Statement
Not applicable.
Informed Consent Statement
Not applicable.
Data Availability Statement
IGS GNSS data downloaded from the Earthscope and the Crustal Dynamics Data Information System (CDDIS) (https://cddis.nasa.gov/archive/gnss/; Last accessed on 9 August 2025). Interplanetary and geomagnetic parameters used in this study were obtained from the NASA OMNIWeb database (https://omniweb.gsfc.nasa.gov/; last accessed on 2 December 2025). European Space Agency Swarm data obtained via the VIRES platform (https://vires.services/; last accessed on 10 October 2025). Magnetometer observations from the Alibag (India) and Gan International Airport (Maldives) stations were acquired from the INTERMAGNET network (https://www.intermagnet.org; last accessed on 17 November 2025). The Prompt Penetration Equatorial Electric Field Model (PPEEFM) derived real-time eastward equatorial electric field estimates are obtained from https://geomag.colorado.edu/online-calculators/real-time-model-ionospheric-electric-fields (last accessed on 10 October 2025). The GUVI/TIMED O/N2 data were obtained from the GUVI data portal http://guvitimed.jhuapl.edu/guvi-galleryl3on2 (last accessed on 10 October 2025).
Acknowledgments
The authors gratefully acknowledge Smt. Kasturbai Walchand College of Arts and Science, Sangli, for their continued support and encouragement throughout this work. The authors thank the Director, CSIR-4PI, for supporting the GNSS programme.
Conflicts of Interest
The authors declare no conflicts of interest.
References
- Webb, D.F. Coronal Mass Ejections: The Key to Major Interplanetary and Geomagnetic Disturbances. Rev. Geophys. 1995, 33, 577–583. [Google Scholar] [CrossRef] [Scilit]
- Tripathi, S.C.; Haralambous, H.; Biswas, T. Ionospheric Variability During the 10 October 2024 Geomagnetic Storm: A Regional Analysis Across Europe. Atmosphere 2025, 16, 1029. [Google Scholar] [CrossRef] [Scilit]
- Gopalswamy, N. History and Development of Coronal Mass Ejections as a Key Player in Solar Terrestrial Relationship. Geosci. Lett. 2016, 3, 8. [Google Scholar] [CrossRef] [Scilit]
- Blanch, E.; Marsal, S.; Segarra, A.; Torta, J.M.; Altadill, D.; Curto, J.J. Space Weather Effects on Earth’s Environment Associated to the 24–25 October 2011 Geomagnetic Storm. Space Weather 2013, 11, 153–168. [Google Scholar] [CrossRef] [Scilit]
- Zhao, D.; Cui, S.; Zhang, X.; Li, L.; Sun, P.; Bian, C.; Ban, W.; Hancock, C.M.; Wang, Q.; Zhang, K. Analysis of Global Ionospheric Scintillation and GPS Positioning Interference Triggered by Full-Halo CME-Driven Geomagnetic Storm: A Case Study. Adv. Space Res. 2024, 74, 2492–2509. [Google Scholar] [CrossRef] [Scilit]
- Mayer, H.G.; Harris, I.; Spencer, N.W. Some Properties of Upper Atmosphere Dynamics. Rev. Geophys. 1978, 16, 539–565. [Google Scholar] [CrossRef] [Scilit]
- Fejer, B.G. Effects of the Vertical Plasma Drift Velocity on the Generation and Evolution of Equatorial Spread F. J. Geophys. Res. Space Phys. 1999, 104, 19859–19869. [Google Scholar] [CrossRef] [Scilit]
- Gentile, L.C.; Burke, W.J.; Roddy, P.A.; Retterer, J.M.; Tsunoda, R.T. Climatology of Plasma Density Depletions Observed by DMSP in the Dawn Sector. J. Geophys. Res. Space Phys. 2011, 116, A03321. [Google Scholar] [CrossRef] [Scilit]
- Southwood, D.J. The Role of Hot Plasma in Magnetospheric Convection. J. Geophys. Res. 1977, 82, 5512–5520. [Google Scholar] [CrossRef] [Scilit]
- Jaggi, R.K.; Wolf, R.A. Self-Consistent Calculation of the Motion of a Sheet of Ions in the Magnetosphere. J. Geophys. Res. 1973, 78, 2852–2866. [Google Scholar] [CrossRef] [Scilit]
- Fejer, B.G.; Scherliess, L. Time Dependent Response of Equatorial Ionospheric Electric Fields to Magnetospheric Disturbances. Geophys. Res. Lett. 1995, 22, 851–854. [Google Scholar] [CrossRef] [Scilit]
- Fejer, B.G.; Scherliess, L. Empirical Models of Storm Time Equatorial Zonal Electric Fields. J. Geophys. Res. Space Phys. 1997, 102, 24047–24056. [Google Scholar] [CrossRef] [Scilit]
- Ghanshyam; Varshney, K.S.; Gautam, A.S.; Singh, K.; Gautam, S.; Singh, S.P. Analysis of Ionospheric GPS-TEC on Intense Geomagnetic Storms over the Equatorial Ionization Anomaly Region of India during 2015–2020. Astrophys. Space Sci. 2023, 368, 86. [Google Scholar] [CrossRef] [Scilit]
- Tulasi Ram, S.; Veenadhari, B.; Dimri, A.P.; Bulusu, J.; Bagiya, M.; Gurubaran, S.; Parihar, N.; Remya, B.; Seemala, G.; Singh, R.; et al. Super-Intense Geomagnetic Storm on 10–11 May 2024: Possible Mechanisms and Impacts. Space Weather 2024, 22, e2024SW004126. [Google Scholar] [CrossRef] [Scilit]
- Balan, N.; Liu, L.; Le, H. A Brief Review of Equatorial Ionization Anomaly and Ionospheric Irregularities. Earth Planet. Phys. 2018, 2, 257–275. [Google Scholar] [CrossRef] [Scilit]
- Fuller-Rowell, T.J.; Millward, G.H.; Richmond, A.D.; Codrescu, M.V. Storm-Time Changes in the Upper Atmosphere at Low Latitudes. J. Atmos. Sol. Terr. Phys. 2002, 64, 1383–1391. [Google Scholar] [CrossRef] [Scilit]
- Blanc, M.; Richmond, A.D. The Ionospheric Disturbance Dynamo. J. Geophys. Res. 1980, 85, 1669–1686. [Google Scholar] [CrossRef] [Scilit]
- Buonsanto, M.J. Ionospheric Storms—A Review. Space Sci. Rev. 1999, 88, 563–601. [Google Scholar] [CrossRef] [Scilit]
- Hysell, D.L.; Drexler, J.; Shume, E.B.; Chau, J.L.; Scipion, D.E.; Vlasov, M.; Cuevas, R.; Heinselman, C. Combined Radar Observations of Equatorial Electrojet Irregularities at Jicamarca. Ann. Geophys. 2007, 25, 457–473. [Google Scholar] [CrossRef] [Scilit]
- Panda, S.K.; Gedam, S.S.; Rajaram, G.; Sripathi, S.; Pant, T.K.; Das, R.M. A Multi-Technique Study of the 29–31 October 2003 Geomagnetic Storm Effect on Low Latitude Ionosphere over Indian Region with Magnetometer, Ionosonde, and GPS Observations. Astrophys. Space Sci. 2014, 354, 267–274. [Google Scholar] [CrossRef] [Scilit]
- Hibberd, F.H.; Ross, W.J. Variations in Total Electron Content and Other Ionospheric Parameters Associated with Magnetic Storms. J. Geophys. Res. 1967, 72, 5331–5337. [Google Scholar] [CrossRef] [Scilit]
- Fuller-Rowell, T.J.; Codrescu, M.V.; Moffett, R.J.; Quegan, S. Response of the Thermosphere and Ionosphere to Geomagnetic Storms. J. Geophys. Res. Space Phys. 1994, 99, 3893–3914. [Google Scholar] [CrossRef] [Scilit]
- Namgaladze, A.A.; Foè Rster, M.; Yurik, R.Y. Analysis of the Positive Ionospheric Response to a Moderate Geomagnetic Storm Using a Global Numerical Model. Ann. Geophys. 2000, 18, 461–477. [Google Scholar] [CrossRef]
- Jin, S.; Jin, R.; Kutoglu, H. Positive and Negative Ionospheric Responses to the March 2015 Geomagnetic Storm from BDS Observations. J. Geod. 2017, 91, 613–626. [Google Scholar] [CrossRef] [Scilit]
- Adebiyi, S.J.; Adimula, I.A.; Oladipo, O.A. Investigation on Mid-Latitude Stations to Storm-Time Variations of GPS-TEC. Adv. Space Res. 2015, 55, 1339–1348. [Google Scholar] [CrossRef] [Scilit]
- Zhai, C.; Cai, X.; Yu, T.; Peng, W.; Cheng, X.; Yue, D.; Cai, L. A Complete Chain of the Generating Processes of Ionospheric Negative Storm Over the North America. J. Geophys. Res. Space Phys. 2024, 129, e2024JA033091. [Google Scholar] [CrossRef] [Scilit]
- Becker-Guedes, F.; Sahai, Y.; Fagundes, P.R.; Espinoza, E.S.; Pillat, V.G.; Lima, W.L.C.; Basu, S.; Basu, S.; Otsuka, Y.; Shiokawa, K.; et al. The Ionospheric Response in the Brazilian Sector During the Super Geomagnetic Storm on 20 November 2003. Ann. Geophys. 2007, 25, 863–873. [Google Scholar] [CrossRef] [Scilit]
- Mannucci, A.J.; Tsurutani, B.T. Chapter 20—Ionosphere and Thermosphere Responses to Extreme Geomagnetic Storms. In Extreme Events in Geospace; Elsevier: Amsterdam, The Netherlands, 2018; pp. 493–511. ISBN 9780128127001. [Google Scholar] [CrossRef] [Scilit]
- Simi, K.G.; Manju, G.; Haridas, M.K.M.; Nayar, S.R.P.; Pant, T.K.; Alex, S. Ionospheric Response to a Geomagnetic Storm During November 8–10, 2004. Earth Planets Space 2013, 65, 343–350. [Google Scholar] [CrossRef] [Scilit]
- Yadav, S.; Das, R.M.; Dabas, R.S.; Subrahmanyam, P.; Gwal, A.K. Response of Low-Latitude Ionosphere of the Indian Region During the Supergeomagnetic Storm of 31 March 2001. J. Geophys. Res. Space Phys. 2011, 116, A08311. [Google Scholar] [CrossRef] [Scilit]
- Sastri, J.H.; Jyoti, N.; Somayajulu, V.V.; Chandra, H.; Devasia, C.V. Ionospheric Storm of Early November 1993 in the Indian Equatorial Region. J. Geophys. Res. Space Phys. 2000, 105, 18443–18455. [Google Scholar] [CrossRef] [Scilit]
- Manju, G.; Kumar Pant, T.; Ravindran, S.; Sridharan, R. On the Response of the Equatorial and Low Latitude Ionospheric Regions in the Indian Sector to the Large Magnetic Disturbance of 29 October 2003. Ann. Geophys. 2009, 27, 2539–2544. [Google Scholar] [CrossRef] [Scilit]
- Mansilla, G.A.; Zossi, M.M. Ionospheric Response to the 26 August 2018 Geomagnetic Storm along 280° E and 316° E in the South American Sector. Adv. Space Res. 2022, 69, 48–58. [Google Scholar] [CrossRef] [Scilit]
- Chakraborty, M.; Kumar, S.; De, B.K.; Guha, A. Effects of Geomagnetic Storm on Low Latitude Ionospheric Total Electron Content: A Case Study from Indian Sector. J. Earth Syst. Sci. 2015, 124, 1115–1126. [Google Scholar] [CrossRef] [Scilit]
- Mishra, R.K.; Adhikari, B.; Chapagain, N.P.; Baral, R.; Das, P.K.; Klausner, V.; Sharma, M. Variation on Solar Wind Parameters and Total Electron Content Over Middle- to Low-Latitude Regions During Intense Geomagnetic Storms. Radio. Sci. 2020, 55, e2020RS007129. [Google Scholar] [CrossRef] [Scilit]
- Barad, R.K.; Sripathi, S.; Singh, R.; Gayathri, B.; Abadi, P. Observations and Modeling Investigations of Ionospheric Response to 23–24 April 2023, G4-Class Geomagnetic Storm Over Indian Sector. Space Weather 2025, 23, e2024SW004253. [Google Scholar] [CrossRef] [Scilit]
- Chougule, S.; Shetti, D.; Fleury, R.; Venkatesh, K.; Chougule, P. Study of Intense Space Weather Effects of May 2024 on the Ionosphere over the Indian Region Using IRNSS/NavIC. Adv. Space Res. 2025, 76, 7471–7488. [Google Scholar] [CrossRef] [Scilit]
- Chougule, P.; Shetti, D.; Venkatesh, K.; Seemala, G.K.; Chougule, S. A Study of the Ionospheric Response during Intense Geomagnetic Storms over the Indian Low-Latitude Region during the Period 2017–2023. Adv. Space Res. 2025; in press. [CrossRef] [Scilit]
- Rajana, S.S.K.; Panda, S.K.; Jade, S.; Vivek, C.G.; Upadhayaya, A.K.; Bhardwaj, A.; Jorphail, S.; Seemala, G.K. Impact of Two Severe Geomagnetic Storms on the Ionosphere over Indian Longitude Sector during March–April 2023. Astrophys. Space Sci. 2024, 369, 3. [Google Scholar] [CrossRef] [Scilit]
- Seemala, G.K. Chapter 4—Estimation of ionospheric total electron content (TEC) from GNSS observations. In Atmospheric Remote Sensing: Principles and Applications; Elsevier: Amsterdam, The Netherlands, 2022; pp. 63–84. ISBN 9780323992626. [Google Scholar] [CrossRef] [Scilit]
- Zhang, K.; Wang, H.; Song, H. The Polarity Oscillations of the Equatorial Electrojet in Response to the Geomagnetic Storm on 1 December 2023. J. Geophys. Res. Space Phys. 2024, 129, e2024JA032978. [Google Scholar] [CrossRef] [Scilit]
- Manoj, C.; Maus, S.; Lühr, H.; Alken, P. Penetration Characteristics of the Interplanetary Electric Field to the Daytime Equatorial Ionosphere. J. Geophys. Res. Space Phys. 2008, 113, A12310. [Google Scholar] [CrossRef] [Scilit]
- Paul, K.S.; Moses, M.; Haralambous, H.; Oikonomou, C. Effects of the Mother’s Day Superstorm (10–11 May 2024) over the Global Ionosphere. Remote Sens. 2025, 17, 859. [Google Scholar] [CrossRef] [Scilit]
- Tsurutani, B.T.; Verkhoglyadova, O.P.; Mannucci, A.J.; Saito, A.; Araki, T.; Yumoto, K.; Tsuda, T.; Abdu, M.A.; Sobral, J.H.A.; Gonzalez, W.D.; et al. Prompt Penetration Electric Fields (PPEFs) and Their Ionospheric Effects during the Great Magnetic Storm of 30–31 October 2003. J. Geophys. Res. Space Phys. 2008, 113, A05311. [Google Scholar] [CrossRef] [Scilit]
- Carmo, C.S.; Dai, L.; Wrasse, C.M.; Barros, D.; Takahashi, H.; Figueiredo, C.A.O.B.; Wang, C.; Li, H.; Liu, Z. Ionospheric Response to the Extreme 2024 Mother’s Day Geomagnetic Storm Over the Latin American Sector. Space Weather 2024, 22, e2024SW004054. [Google Scholar] [CrossRef] [Scilit]
- Tsurutani, B.; Mannucci, A.; Iijima, B.; Abdu, M.A.; Sobral, J.H.A.; Gonzalez, W.; Guarnieri, F.; Tsuda, T.; Saito, A.; Yumoto, K.; et al. Global Dayside Ionospheric Uplift and Enhancement Associated with Interplanetary Electric Fields. J. Geophys. Res. Space Phys. 2004, 109, A08302. [Google Scholar] [CrossRef] [Scilit]
- Shreedevi, P.R.; Thampi, S.V.; Chakrabarty, D.; Choudhary, R.K.; Pant, T.K.; Bhardwaj, A.; Mukherjee, S. On the Latitudinal Changes in Ionospheric Electrodynamics and Composition Based on Observations over the 76–77°E Meridian from Both Hemispheres During a Geomagnetic Storm. J. Geophys. Res. Space Phys. 2016, 121, 1557–1568. [Google Scholar] [CrossRef] [Scilit]
- Abdu, M.A. Equatorial Ionosphere-Thermosphere System: Electrodynamics and Irregularities. Adv. Space Res. 2005, 35, 771–787. [Google Scholar] [CrossRef] [Scilit]
- Goncharenko, L.P.; Foster, J.C.; Coster, A.J.; Huang, C.; Aponte, N.; Paxton, L.J. Observations of a Positive Storm Phase on September 10, 2005. J. Atmos. Sol. Terr. Phys. 2007, 69, 1253–1272. [Google Scholar] [CrossRef] [Scilit]
- Lu, G.; Goncharenko, L.P.; Richmond, A.D.; Roble, R.G.; Aponte, N. A Dayside Ionospheric Positive Storm Phase Driven by Neutral Winds. J. Geophys. Res. Space Phys. 2008, 113, A08304. [Google Scholar] [CrossRef] [Scilit]
- De Abreu, A.J.; Fagundes, P.R.; Gende, M.; Bolaji, O.S.; De Jesus, R.; Brunini, C. Investigation of Ionospheric Response to Two Moderate Geomagnetic Storms Using GPS-TEC Measurements in the South American and African Sectors During the Ascending Phase of Solar Cycle 24. Adv. Space Res. 2014, 53, 1313–1328. [Google Scholar] [CrossRef] [Scilit]
- Bai, D.; Fu, Y.; Yang, C.; Zhang, K.; Cui, Y. The Poleward Shift of the Equatorial Ionization Anomaly During the Main Phase of the Superstorm on 10 May 2024. Remote Sens. 2025, 17, 2616. [Google Scholar] [CrossRef] [Scilit]
- Venkatesh, K.; Tulasi Ram, S.; Fagundes, P.R.; Seemala, G.K.; Batista, I.S. Electrodynamic Disturbances in the Brazilian Equatorial and Low-Latitude Ionosphere on St. Patrick’s Day Storm of 17 March 2015. J. Geophys. Res. Space Phys. 2017, 122, 4553–4570. [Google Scholar] [CrossRef] [Scilit]
- Paul, K.S.; Haralambous, H.; Moses, M.; Oikonomou, C.; Potirakis, S.M.; Bergeot, N.; Chevalier, J.M. Investigation of the Ionospheric Response on Mother’s Day 2024 Geomagnetic Superstorm over the European Sector. Atmosphere 2025, 16, 180. [Google Scholar] [CrossRef] [Scilit]
- Sun, W.; Li, G.; Zhang, S.-R.; Zhao, B.; Li, Y.; Tariq, M.A.; Aa, E.; Liu, L.; Le, H.; Ding, F.; et al. Complex Ionospheric Fluctuations Over East and Southeast Asia During the May 2024 Super Geomagnetic Storm. J. Geophys. Res. Space Phys. 2024, 129, e2024JA033096. [Google Scholar] [CrossRef] [Scilit]
- Burns, A.G.; Killeen, T.L.; Deng, W.; Carignan, G.R.; Roble, R.G. Geomagnetic Storm Effects in the Low- to Middle-latitude Upper Thermosphere. J. Geophys. Res. Space Phys. 1995, 100, 14673–14691. [Google Scholar] [CrossRef] [Scilit]
- Rout, D.; Kumar, A.; Singh, R.; Patra, S.; Karan, D.K.; Chakraborty, S.; Scipion, D.; Chakrabarty, D.; Riccobono, J. Evidence of Unusually Strong Equatorial Ionization Anomaly at Three Local Time Sectors During the Mother’s Day Geomagnetic Storm On 10–11 May 2024. Geophys. Res. Lett. 2025, 52, e2024GL111269. [Google Scholar] [CrossRef] [Scilit]
- Balan, N.; Otsuka, Y.; Nishioka, M.; Liu, J.Y.; Bailey, G.J. Physical Mechanisms of the Ionospheric Storms at Equatorial and Higher Latitudes during the Recovery Phase of Geomagnetic Storms. J. Geophys. Res. Space Phys. 2013, 118, 2660–2669. [Google Scholar] [CrossRef] [Scilit]
- Sreeja, V.; Ravindran, S.; Pant, T.K.; Devasia, C.V.; Paxton, L.J. Equatorial and Low-Latitude Ionosphere-Thermosphere System Response to the Space Weather Event of August 2005. J. Geophys. Res. Space Phys. 2009, 114, A12307. [Google Scholar] [CrossRef] [Scilit]

Disclaimer/Publisher’s Note: The statements, opinions and data contained in all publications are solely those of the individual author(s) and contributor(s) and not of MDPI and/or the editor(s). MDPI and/or the editor(s) disclaim responsibility for any injury to people or property resulting from any ideas, methods, instructions or products referred to in the content. |
© 2026 by the authors. Licensee MDPI, Basel, Switzerland. This article is an open access article distributed under the terms and conditions of the Creative Commons Attribution (CC BY) license.