


Abstract
Acoustic precipitation enhancement (APE) is an emerging non-chemical weather-modification technique, yet quantitative three-dimensional evidence of its impact on rainy clouds remains scarce. This study investigates a stratiform precipitation event over the Bayinbuluke Basin in the central Tianshan Mountains of northwestern China, 29–30 August 2024, using an X-band phased-array weather radar (X-PAR) coordinated with an upward-directed acoustic source. Rapid volumetric scans and sector-aligned range-height indicators were combined to reconstruct the three-dimensional cloud structure before, during, and after acoustic operation. During acoustic operation, the results were stronger and more persistent than during the non-operation period, with localized values exceeding 40 dBZ. Within the 3 km influence zone, low-level reflectivity increased across all azimuthal sectors with clear directional dependence. Dual-ratio analysis showed statistically significant enhancement in the windward sector (247°, = 1.91, = 0.0004) and the leeward sector (137°, = 1.51, = 0.008), indicating that acoustic-induced responses extended beyond the primary radiation sector and propagated downstream with cloud advection. These results, based on a single stratiform precipitation case, demonstrate that volumetric X-PAR observations can detect localized cloud-structure responses during acoustic operation.
1. Introduction
Water scarcity in arid and semi-arid regions has become a pressing global concern [1]. The pronounced spatiotemporal variability of precipitation, coupled with the high sensitivity of local ecosystems to moisture changes, places sustained stress on water security in these areas [2]. Weather modification has therefore been widely implemented in many countries as a means to enhance the availability of water resources [3]. However, traditional cloud-seeding techniques based on silver iodide or dry ice are increasingly constrained by airspace management, environmental considerations, and meteorological conditions, particularly in ecologically sensitive regions [4]. These limitations have created a growing demand for non-airspace-occupying, non-chemical, environmentally friendly, and sustainable approaches to precipitation enhancement [5].
Among these, acoustic precipitation enhancement (APE) has emerged as a promising alternative [6]. Existing studies indicate that acoustic forcing can enhance cloud microphysical processes through several mechanisms, including orthokinetic interactions, acoustic wake effects and possible acoustically induced turbulence [7,8], which collectively increase droplet collision–coalescence efficiency and accelerate the growth of cloud droplets and the formation of raindrops. Laboratory experiments and numerical simulations further demonstrate that strong low-frequency acoustic waves, typically within the 50–150 Hz range and sound pressure levels exceeding 100 dB, can substantially modulate warm-rain microphysics [9,10,11,12].
Some field experiments have been reported to validate APE’s effect on increased precipitation [13,14,15]. Despite these encouraging signals, the scientific understanding of APE remains preliminary. Most existing studies rely heavily on surface rainfall statistics or limited vertical profiling [16,17,18], which are insufficient to capture the APE’s influence occurring on rainy clouds. Consequently, direct three-dimensional (3D) observational evidence documenting the structural evolution induced by acoustic forcing is still rare, posing a major barrier to clarifying the cloud response of APE. This challenge is particularly pronounced for APE, because acoustic forcing does not introduce visible tracers and acts primarily through subtle microphysical and structural modifications within existing cloud systems.
Recent advancements in cloud and precipitation observing technologies have enabled the development of multi-source, physics-based evaluation frameworks for weather modification. Integrated measurements from surface station networks, radiosondes, ground-based radars, satellite remote sensing, and spectral instruments now provide increasingly comprehensive descriptions of cloud structures and hydrometeor evolution [19]. Current physical evaluation methods generally follow two approaches: the self-comparison method, which assesses changes in cloud microphysical and dynamical properties before and after seeding within the same region; and the target–control (dual-ratio) method, which statistically quantifies differences in cloud parameters between the seeded and non-seeded areas [20,21]. The dual-ratio approach tends to yield stronger physical evidence. For example, French et al. [22] documented a complete microphysical pathway of orographic cloud seeding using coordinated radar and airborne in situ observations. However, applications of such high-resolution, three-dimensional evaluation techniques remain scarce in studies of acoustic precipitation enhancement, where 3D localized responses are particularly difficult to detect.
The influence of acoustic forcing is typically localized, transient, and directionally dependent, occurring on spatial scales of several kilometers and temporal scales of minutes [23]. Capturing such subtle and rapidly evolving cloud responses requires observational systems with both high temporal resolution and sensitivity to weak stratiform precipitation structures. However, conventional mechanically scanning weather radars, with volume-scan cycles on the order of several minutes, are often unable to resolve such a rapid structural response. In contrast, X-band phased-array radar (X-PAR) offers distinct advantages: electronic beam steering enables rapid volume scans on the order of seconds with high spatial resolution, and sensitivity to weak echoes is superior. These capabilities make X-PAR particularly well-suited for monitoring the fine-scale evolution of stratiform and shallow precipitation, while its sector-scanning mode allows precise coordination with the acoustic beam direction [24]. Despite its demonstrated value in studies of convective initiation, melting-layer structure, and shallow precipitation, X-PAR has seldom been applied to evaluate APE, leaving a clear knowledge gap.
Against this background, the present study investigates a typical stratiform precipitation event over the Bayanbulak region by integrating ground-based acoustic rainfall-enhancement operations with three-dimensional observations from a nearby X-PAR. Using multi-sector volumetric scan data, the three-dimensional reflectivity structures before, during, and after acoustic forcing are reconstructed to elucidate the cloud-structure responses to acoustic perturbation. The Double Ratio metric and Mann–Whitney U test are further employed to quantify the significance and spatial patterns of the enhancement signals. The structure of this paper is as follows: Section 2 introduces the study area and observational system, Section 3 describes the data and methodology, Section 4 presents and discusses the main results, and Section 5 provides the conclusions.
2. Materials and Methods
2.1. Study Area and Meteorological Background
The field experiment was conducted in the Bayinbuluke Basin of the central Tianshan Mountains, a high-altitude inland basin situated at ~2400 m amsl and surrounded by mountain ranges exceeding 4000 m. This semi-enclosed orographic configuration promotes the formation and maintenance of persistent stratiform cloud systems. The region is characterized by a cold alpine climate, with most precipitation occurring between May and September.
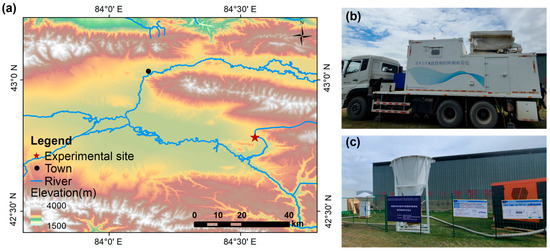
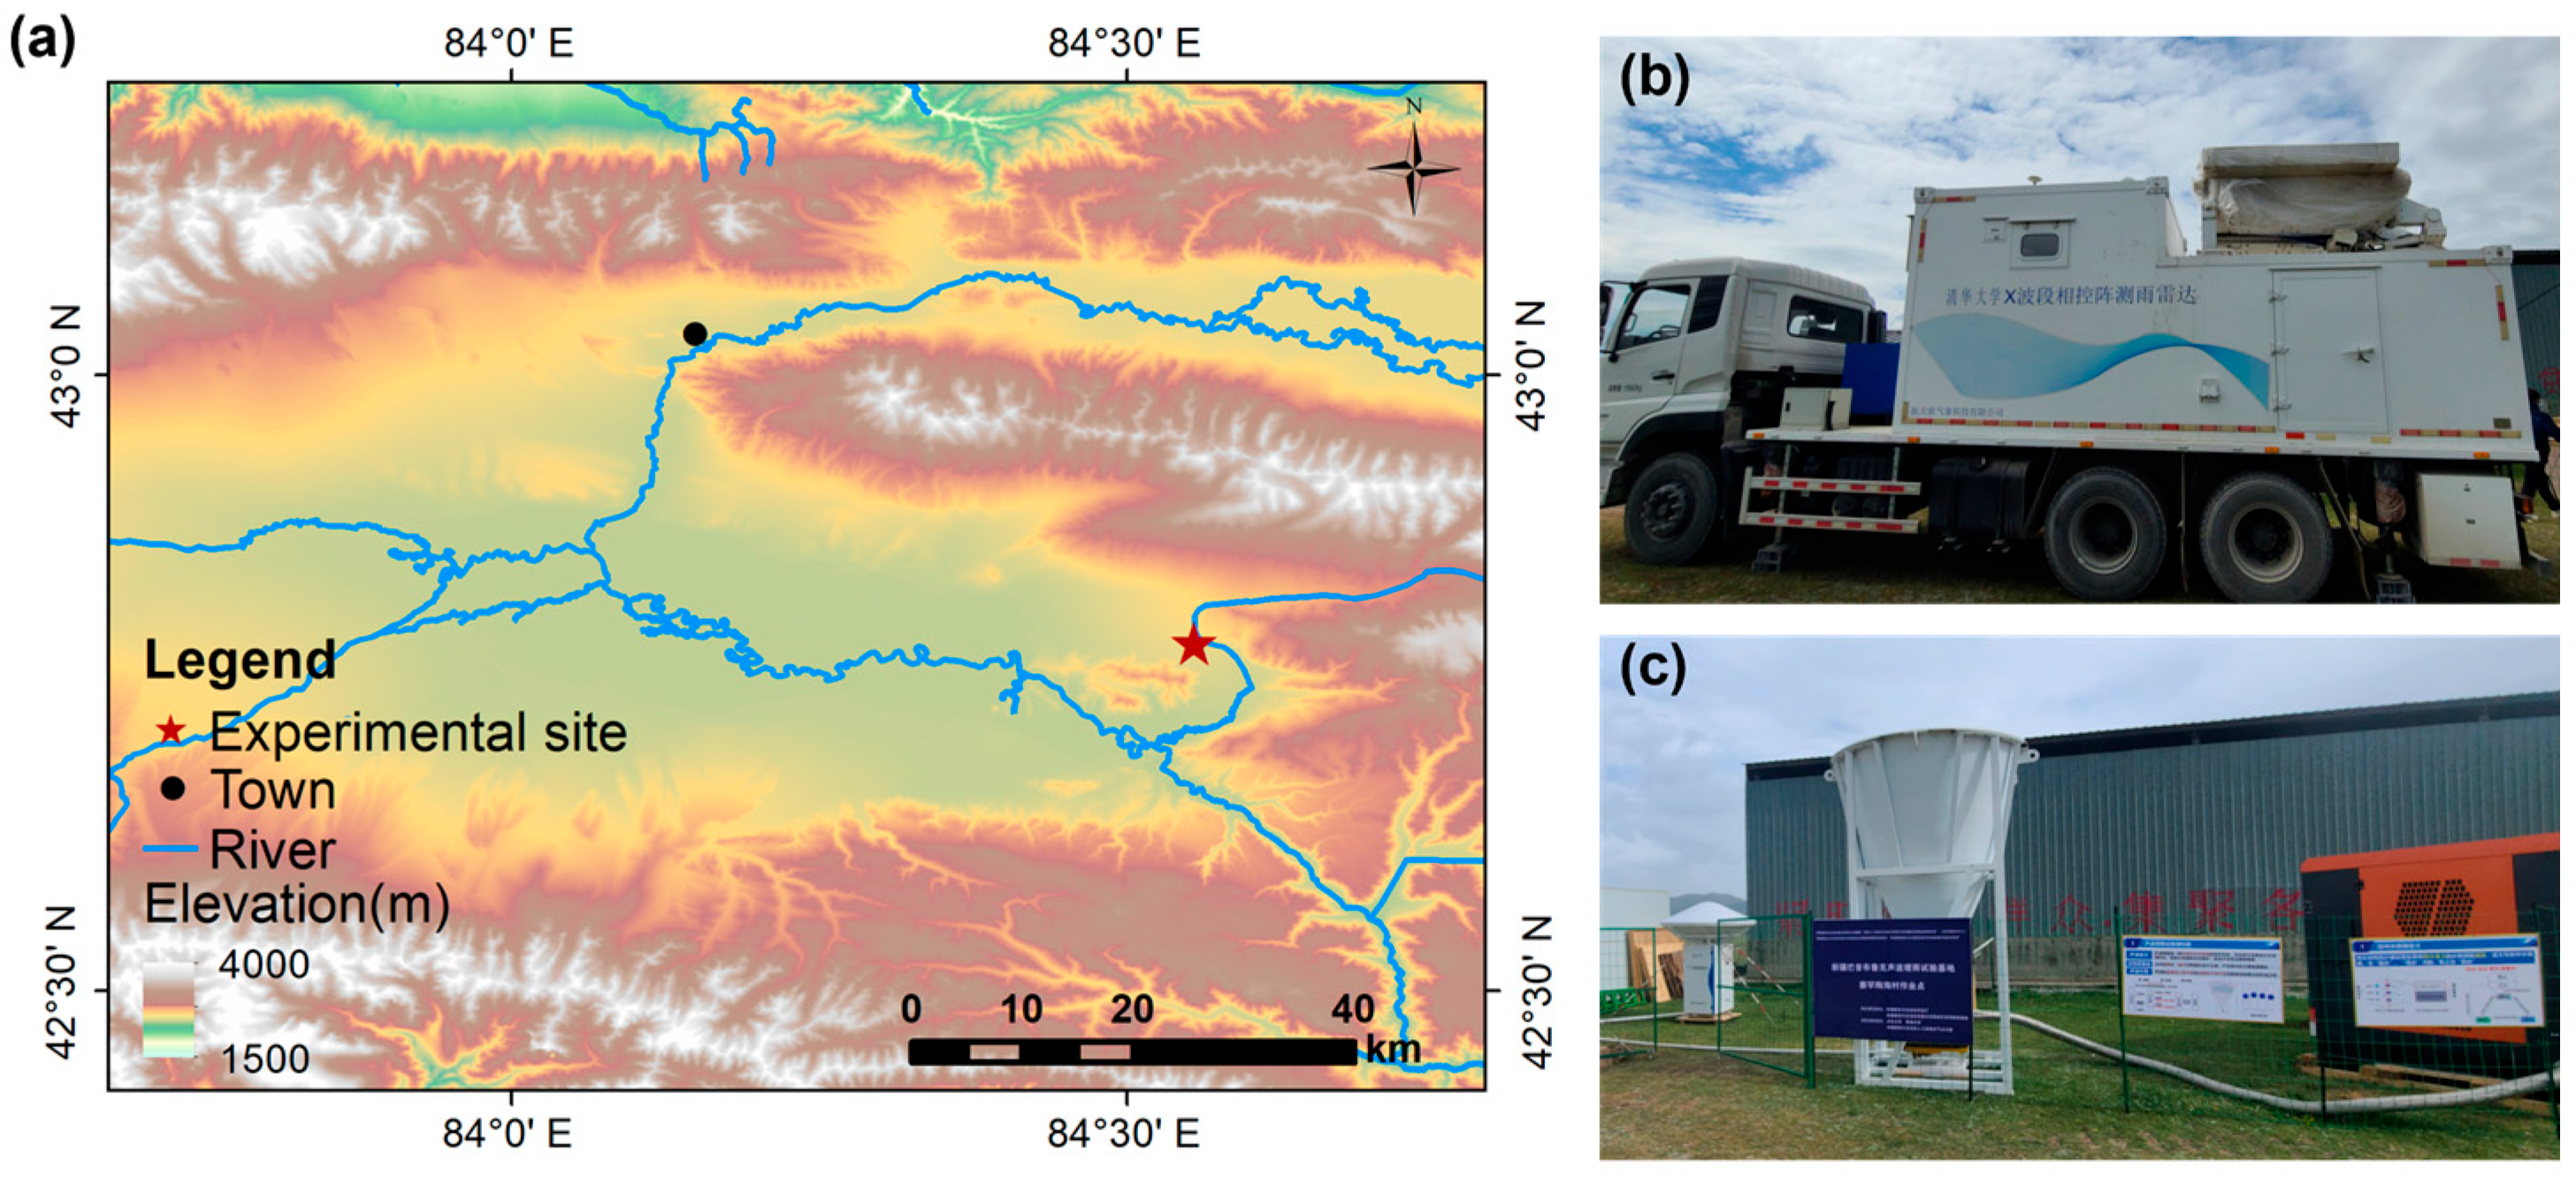
The experimental site lies near the Sailimu River on the eastern edge of the Bayinbuluke Basin (84.55° E, 42.78° N; 2507 m amsl), bounded by mountains on three sides and creating a northwest-southeast oriented corridor. Under the prevailing mid-latitude westerlies, moisture is transported eastward and frequently uplifted by terrain, giving rise to recurrent stratiform and orographic precipitation [25]. This stable moisture-transport pattern provides a favorable environment for APE experiments. The field campaign was conducted during July–August, the local wet season, when stratiform cloud layers are most frequent and well developed (Figure 1).
Figure 1.
Overview of the experimental site. (a) Bayinbuluke experiment location; (b) X-band phased-array radar (X-PAR); (c) Acoustic generator.
2.2. Acoustic Source
The acoustic forcing was produced by a self-developed system developed by Tsinghua University, Beijing, China. The system consists of a pneumatic siren mounted within a resonant horn. In this system, the siren’s periodic shock waves are transformed into high-intensity, monochromatic waves at a fixed frequency. In this study, the acoustic frequency was fixed at 125 Hz, and the sound pressure level (SPL) at the center of the horn outlet, 1 m away, was 147 dB. With its main lobe directed upward to the sky at a beam angle of ~86° [26], the acoustic energy was thus confined primarily to a vertical cone, resulting in very limited lateral emission at ground level. Therefore, the acoustic forcing is effective in enhancing droplet collision-coalescence processes in clouds, as shown in our previous work [27], while remaining environmentally benign at ground level. Our field observations indicated that its audible sound does not extend beyond a radius of approximately 500 m at ground level.
2.3. Multi-Instrument Observational Setup
A multi-instrument observational system was deployed to observe and record the cloud and precipitation evolution during acoustic operation, as well as in control days. The system included an X-PAR [28] and a Ka-band cloud profiling radar [29], both manufactured by Aerospace Xin Meteorological Technology Co., Ltd., Wuxi, China.
The X-PAR is a dual-linear polarized, fully coherent pulse-Doppler system equipped with active electronic beam steering. It uses four transmit beams and sixty-four receive beams to perform an electronic scan in elevation from 0° to 90°, combined with a 360° mechanical azimuth scan, completing a full volume rapid scan every 12 s with a spatial resolution of 30 m. Therefore, it is designed for rapid volumetric observations of cloud and precipitation systems at high spatial and temporal resolutions, which is essential for capturing the localized and short-lived responses of stratiform clouds under acoustic forcing. The key technical specifications of the X-PAR are summarized in Table 1.
Table 1.
Technical specifications of the X-band dual-polarization phased-array weather radar.
Additional precipitation microphysical observations were obtained using a Micro Rain Radar (MRR) [30] manufactured by METEK Meteorologische Messtechnik GmbH, Elmshorn, Germany, as well as ground-based Parsivel2 disdrometers [31] manufactured by OTT Hydromet GmbH, Kempten, Germany. The Ka-band cloud radar, MRR, and disdrometers were jointly used to characterize background cloud structures and to verify the occurrence of stratiform precipitation. The Ka-band radar provides a vertical range resolution of approximately 30 m, while the MRR operates with a vertical resolution of 100 m; both instruments have a temporal resolution of 1 min, enabling a detailed depiction of the evolution of the 0–3 km hydrometeor layer. In addition, a dense rain-gauge network extending to a radius of 10 km with a 1 min sampling interval was deployed to provide spatial ground-based validation of precipitation variability.
3. Data and Methodology
3.1. Experimental Design and Operation Procedure
The APE experiment in Bayinbuluke Basin adopted a date-alternating experimental design to randomize the assignment of acoustic-treated and control samples. Odd-numbered days were designated as treatment days, during which the acoustic generator was activated whenever suitable cloud conditions developed, while even-numbered days served as control days with no acoustic operation. This design leverages random day-to-day meteorological variability to minimize subjective bias and provide comparable synoptic backgrounds between treatment and control samples.
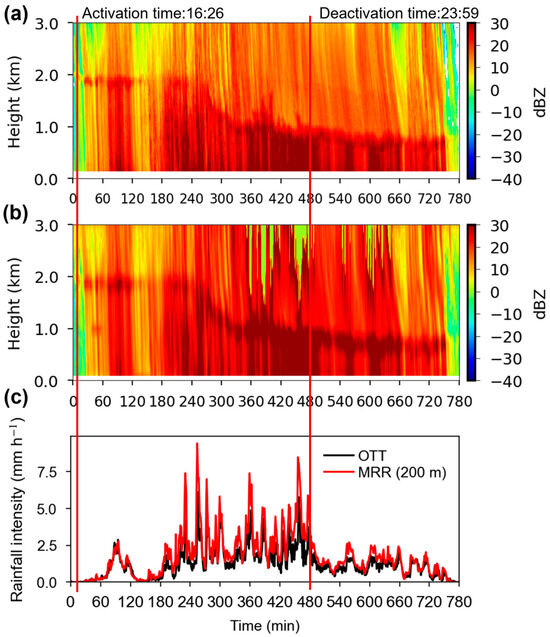
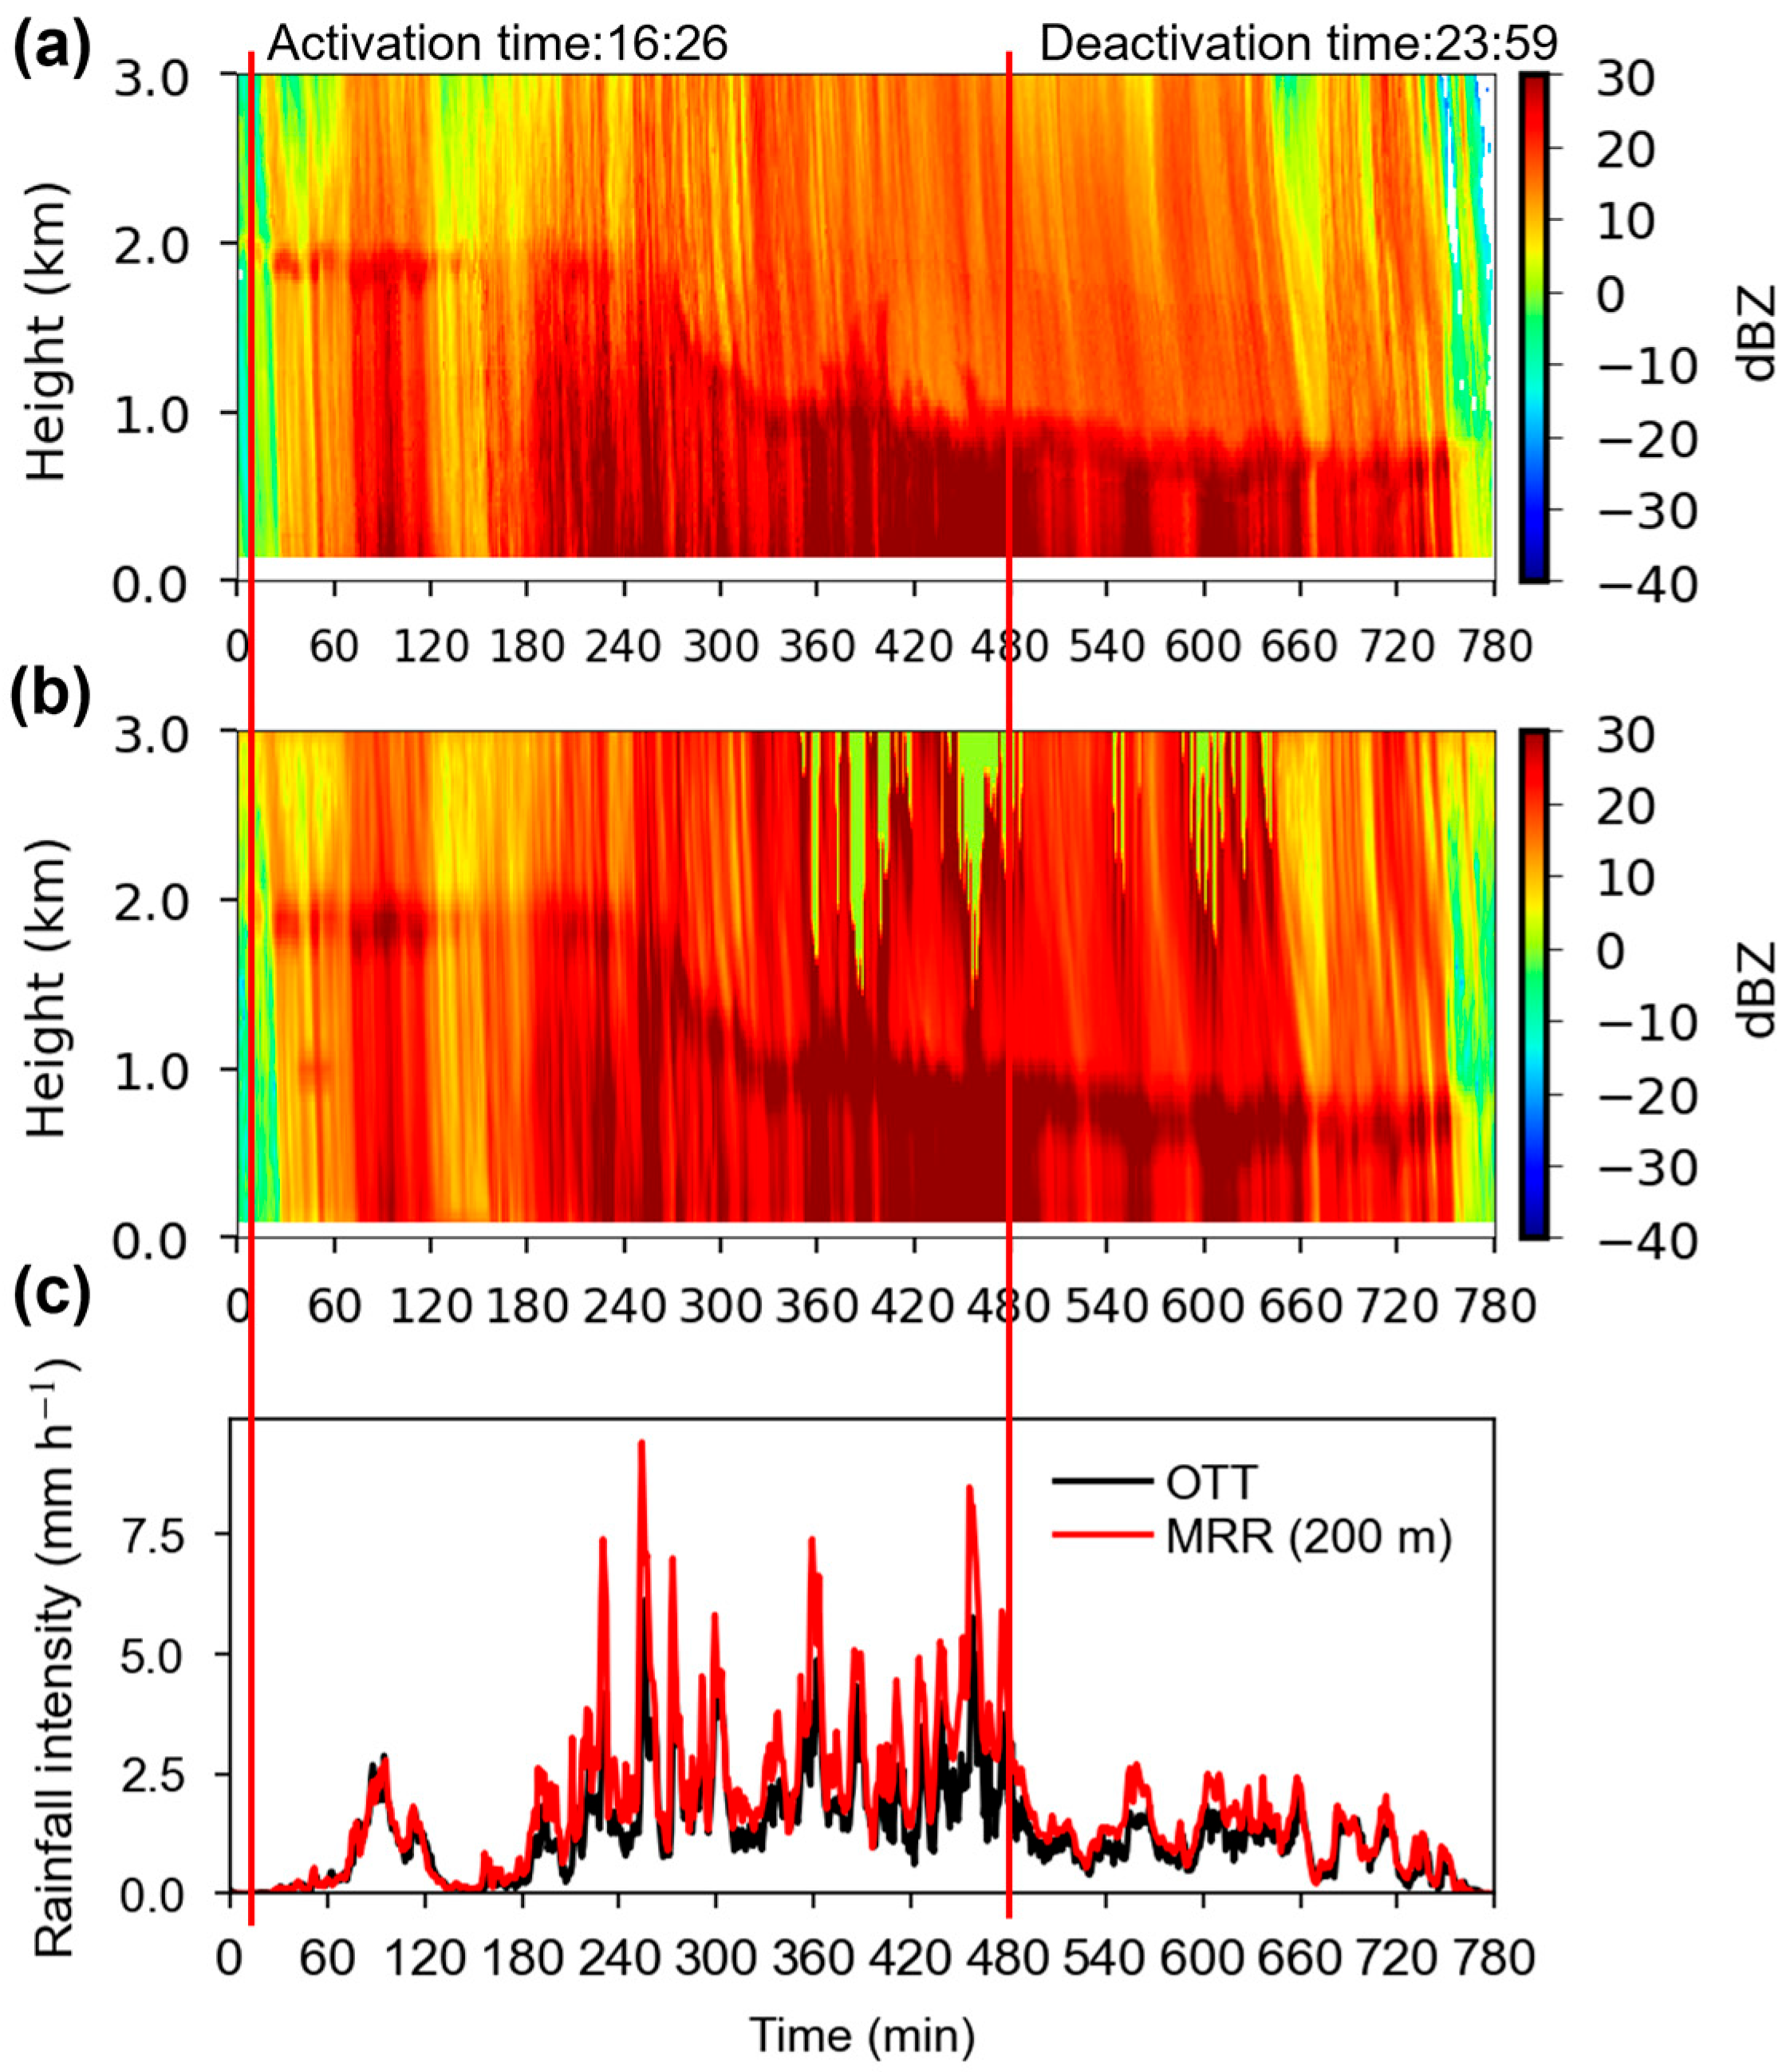
Acoustic operation was conducted only when the overlying cloud field exhibited sufficient precipitation potential, which was monitored by the radars shown in Figure 2. Eligible cloud types included stratiform, cumulus, and stratocumulus clouds with cloud-base heights below 2 km above ground level (AGL) and a total thickness exceeding 1 km. Central radar reflectivity was required to exceed 5 dBZ, and fractional cloud cover to exceed two-thirds, indicating a well-developed hydrometeor-rich cloud layer susceptible to acoustic action. The threshold of 5 dBZ was adopted as an operational radar-based criterion to characterize the onset of radar-detectable precipitation, rather than a strict microphysical phase transition. As shown in Figure 3, when surface rainfall intensity recorded by the disdrometer becomes greater than zero, the corresponding reflectivity observed by the Ka-band radar and the micro rain radar (MRR) typically increases to approximately 5 dBZ, providing multi-instrument observational support for the selected threshold.
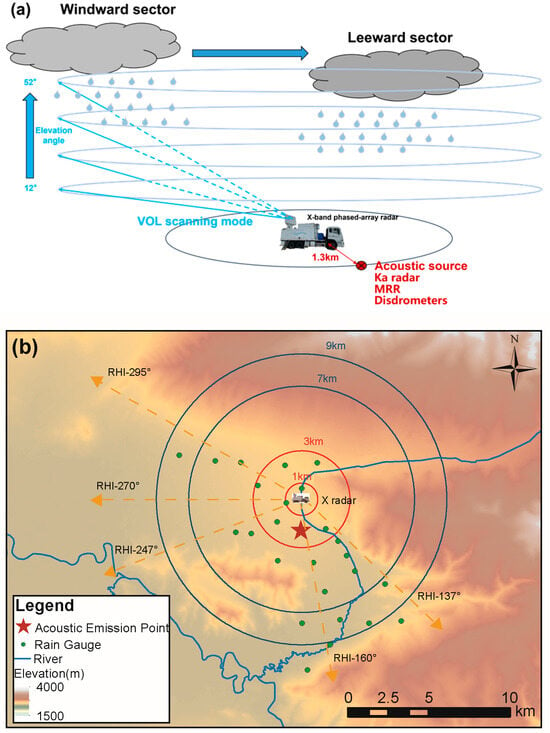
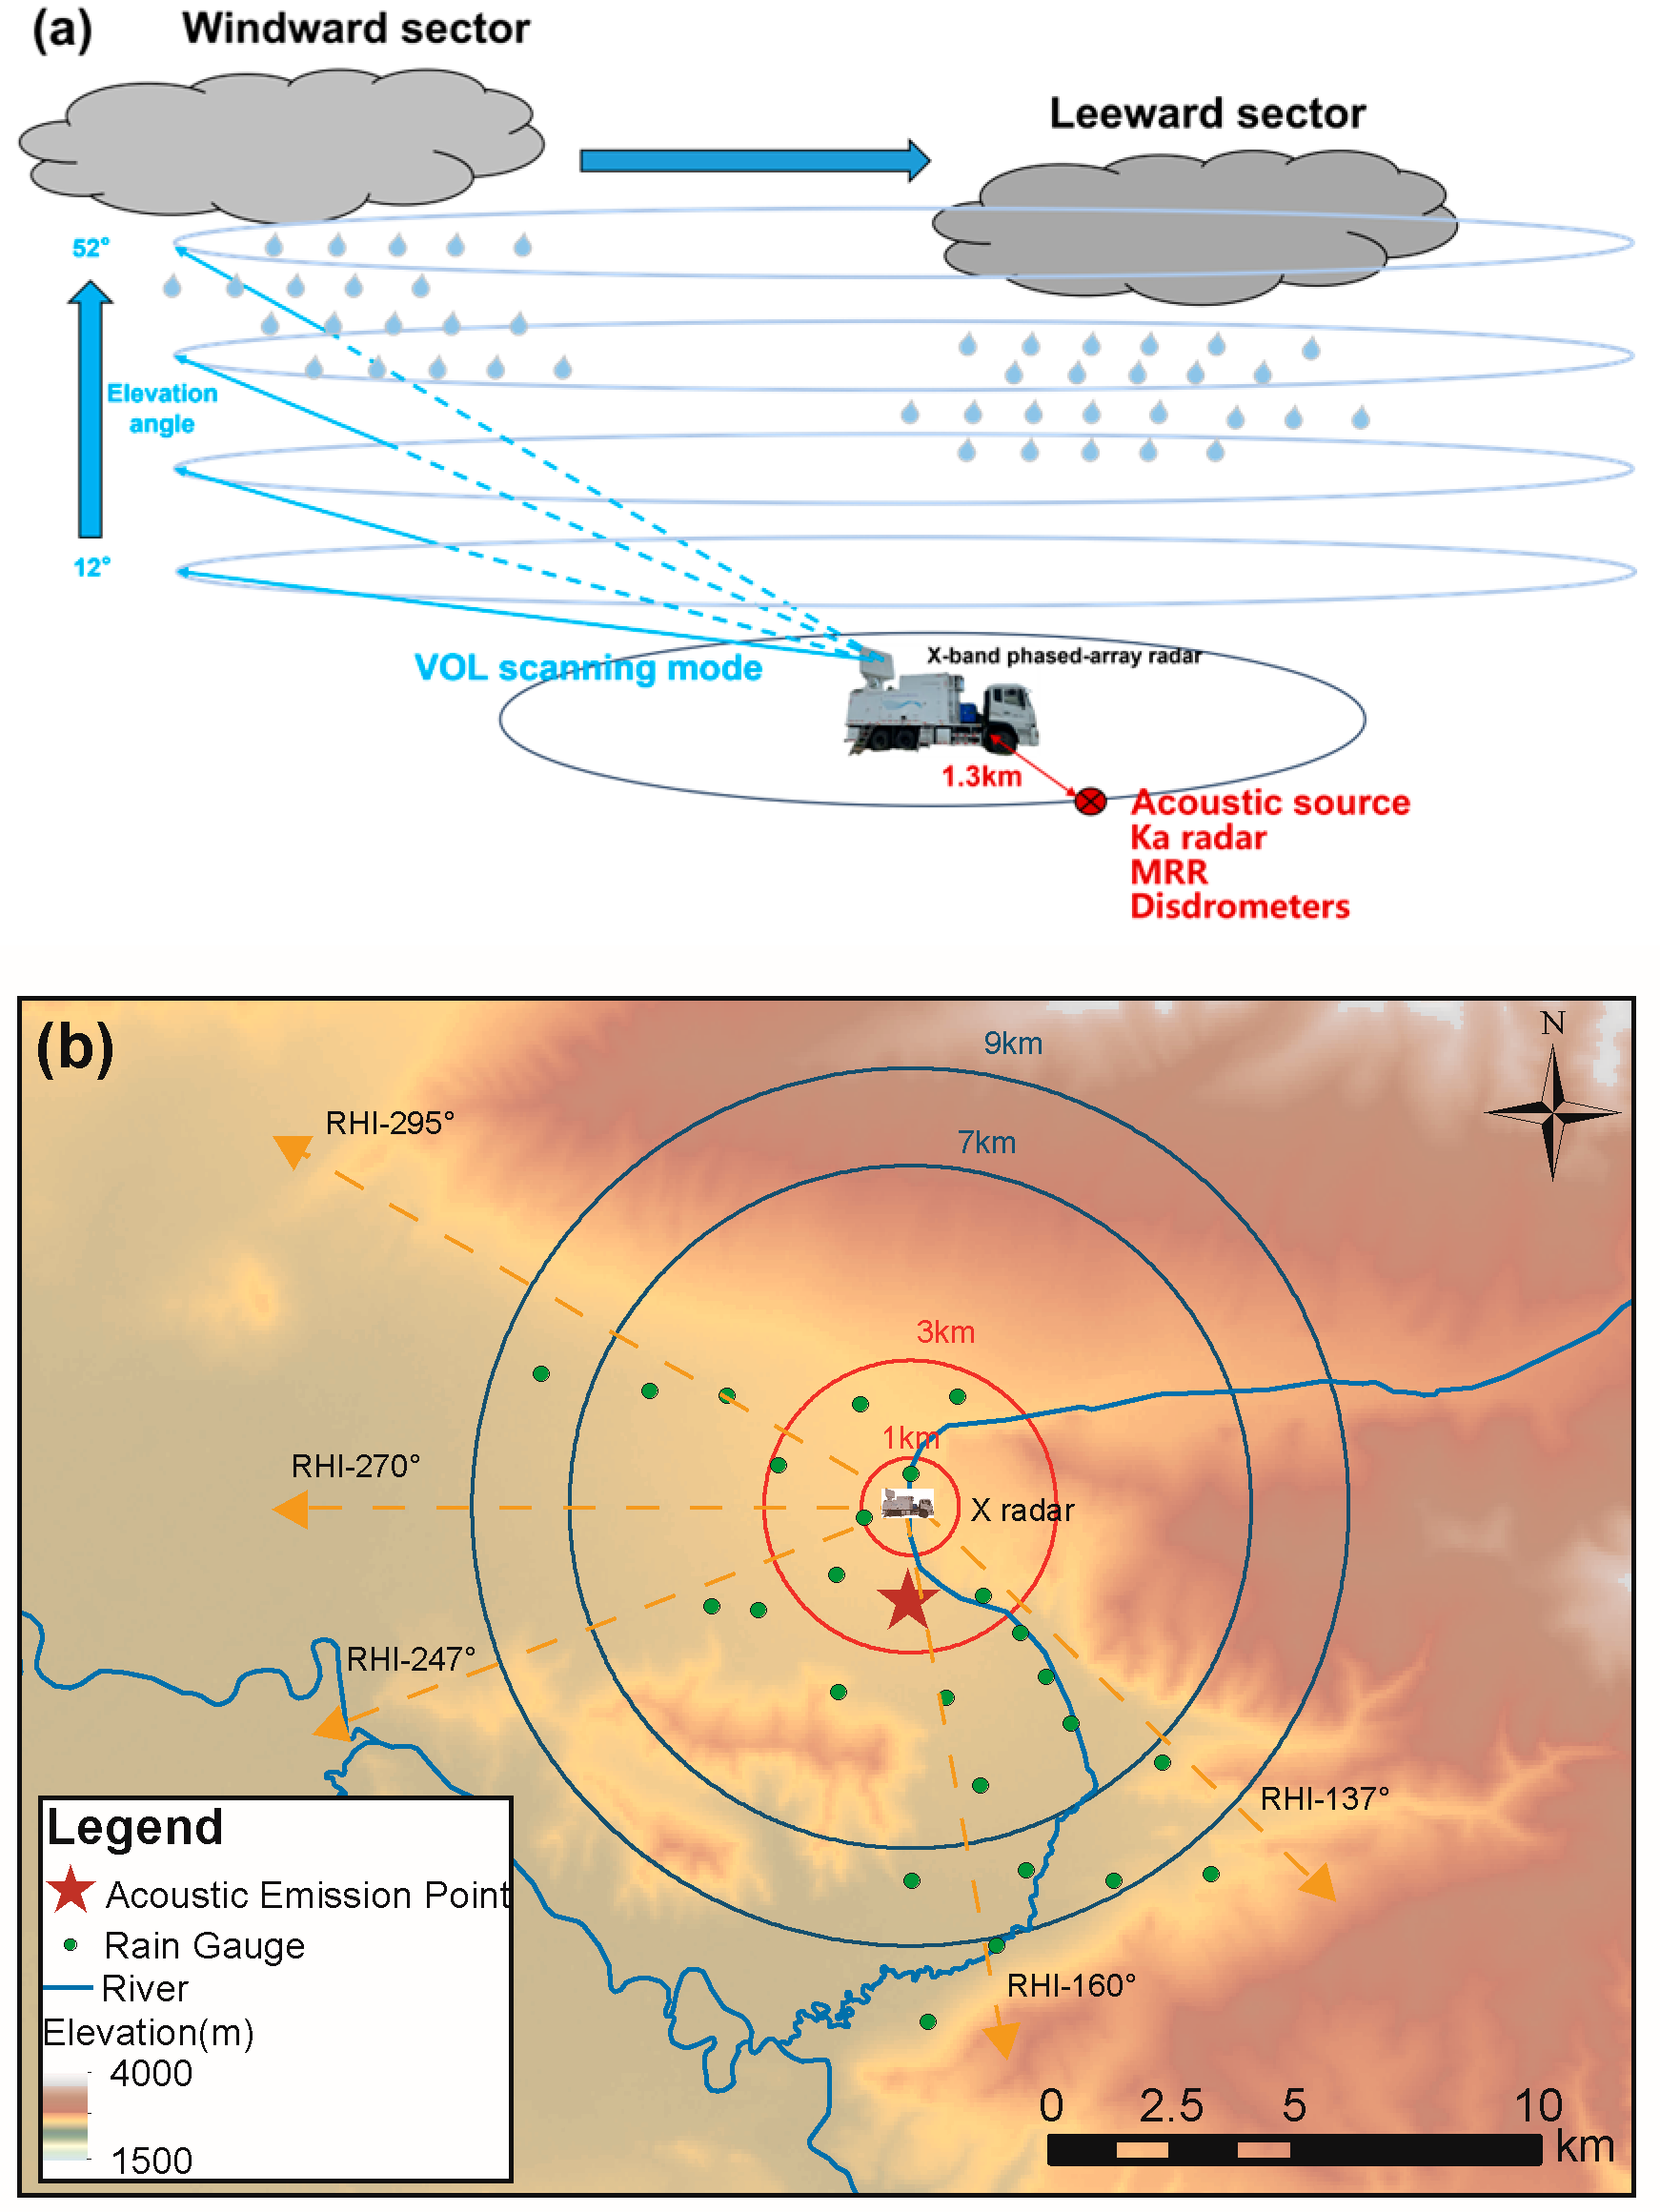
Figure 2.
Observation modes of the X-band phased-array radar. (a) Schematic illustration of the PPI scanning mode; (b) Schematic illustration of the RHI scanning mode, where the yellow dashed arrows indicate the azimuthal directions of the RHI scans.
Figure 3.
Multi-source observations of the stratiform precipitation event over Bayinbuluke on 29–30 August 2024. (a) Reflectivity from the Ka-band cloud radar; (b) reflectivity from the micro rain radar (MRR); (c) rainfall intensity from the surface disdrometer and the MRR at 200 m. The red vertical lines indicate the activation and shutdown times of the acoustic generator.
Acoustic operations were terminated when either of the following conditions persisted for at least 10 min: (1) the central reflectivity of clouds fell below 5 dBZ, or (2) surface rainfall ceased, with intensity falling below the detection threshold of 0.1 mm min−1. This procedure ensured that acoustic forcing was applied only when clouds contained sufficient hydrometeor content and maintained thermodynamic maturity, thereby enhancing the detectability and interpretability of cloud responses.
In this study, the randomization protocol provides the framework for the overall experimental design, ensuring that the analyzed events are not subjectively selected. However, the analysis focuses on a single representative operation-control event pair (29–30 August 2024), chosen to illustrate the typical cloud system response to acoustic forcing.
3.2. Radar Observation Strategy and Scanning Modes
The X-PAR operates in three principal scanning modes—Volume Scan (VOL), Plan Position Indicator (PPI), and Range–Height Indicator (RHI)—which together provide a multidimensional depiction of cloud and precipitation structures. The VOL mode performs conical sweeps across multiple elevation angles, enabling the reconstruction of three-dimensional precipitation morphology. The PPI mode executes 360° azimuthal scans at fixed elevation angles (12–52° in 5° increments) to capture the horizontal distribution and organization of echoes. The RHI mode produced vertical cross-sections along specified azimuths (0–60°), offering high-resolution vertical profiles essential for diagnosing hydrometeor stratification, melting-layer height, and the vertical evolution of microphysical processes.
Benefiting from electronic beam steering, the X-PAR could switch among these scanning modes within milliseconds, allowing rapid adaptation to evolving atmospheric conditions. Considering the radar’s near-field blind zone (approximately 750 m), the instrument was positioned 1.3 km from the acoustic source to ensure complete observational coverage of the acoustic influence region.
A composite scanning strategy was employed in which volumetric (VOL) scans were interleaved with RHI scans. The PPI scans (Figure 2a) documented the horizontal evolution of precipitation, whereas the RHI scans (Figure 2b) resolved the vertical structure along selected azimuths. Owing to terrain-induced beam blockage in several directions, RHI observations could only be performed along five unobstructed azimuths. Upwind sectors at 270°, 295°, and 247° were used to characterize the natural cloud structure prior to acoustic forcing. The 160° sector, which is directly aligned with the acoustic generator, captured the in situ structural response to acoustic forcing, while the 137° sector—situated downstream relative to the primary acoustic radiation direction—was used to monitor the potential downstream advection of acoustically induced microphysical modifications.
Each VOL scan required approximately 68 s and produced 340 radials, whereas each RHI scan lasted about 20 s with 118 radials. A complete scanning cycle—consisting of three PPI scans and five RHI scans—took approximately 5 min 26 s. This temporal resolution was sufficient to resolve subtle structural adjustments in stratiform precipitation under acoustic perturbation.
This deployment and scanning configuration enabled continuous monitoring of cloud structures before, during, and after acoustic operation across the upwind, operation, and downwind sectors. The resulting three-dimensional dataset provides a robust observational basis for identifying localized microphysical responses and evaluating the spatial heterogeneity and potential downstream propagation of acoustic precipitation-enhancement effects.
3.3. Data Processing and Quality Control
All radar observations were converted into a radar-centered cylindrical coordinate system to ensure spatial consistency between the acoustic operation and control periods. Rapid volumetric (VOL) scans with ten fixed elevation angles were used to obtain full 360° three-dimensional reflectivity fields. Given the 5° elevation spacing, vertical interpolation was applied between adjacent beams to improve the continuity of the reconstructed vertical reflectivity profiles. In addition, range–height indicator (RHI) scans were conducted along selected azimuths to obtain vertical cross sections. To account for the range-dependent vertical resolution inherent to RHI geometry, all RHI data were resampled onto a uniform vertical grid with a height interval of 100 m.
Radar calibration was performed using the standard metal-sphere method, which identified and corrected a reflectivity bias of −0.66 dB. Post-calibration verification confirmed a residual bias of 0.28 dB, and all subsequent analyses used the bias-corrected reflectivity (Z). Quality-control procedures were applied to remove ground clutter, anomalous propagation, and other non-meteorological echoes using Doppler-based filtering and texture analysis [32]. To reduce thermodynamic variability, vertical reflectivity profiles were normalized using a dimensionless height coordinate, defined as
where is the geometric height and is the melting-layer height (0 °C level) identified from bright-band signatures in the RHI scans. A summary of the calibration, quality-control, and normalization procedures is provided in Table 2.
Table 2.
Summary of Radar Data Quality-Control Procedures.
3.4. Dual-Ratio Calculation
Acoustic waves are radiated upward in a near-vertical direction and gradually attenuate during atmospheric propagation. As a result, the responses of radar reflectivity vertical profiles may vary with both range and azimuth. Comparative analysis of vertical profiles at different distances and directions is therefore essential for evaluating the impact of acoustic forcing on cloud structures.
The dual-ratio (DR) method is a widely used statistical technique for evaluating the effectiveness of weather-modification operations [33]. Its central concept is to construct a baseline single ratio (SR) between the impact and control regions during non-operational periods, and then compare this baseline with the SR obtained during operational periods. and then compare this baseline with the SR obtained during operational periods. This procedure helps reduce the influence of large-scale meteorological variability shared by both areas and highlights potential enhancement signals associated with artificial intervention. The dual ratio is defined as:
where denotes the single ratio on the treatment days, and denotes the single ratio on the control days; represents the mean vertical-profile reflectivity in the treatment area on the operation days, and represents the corresponding mean reflectivity in the control area on the operation days; denotes the mean vertical-profile reflectivity in the treatment area on the control days, and denotes the mean reflectivity in the control area on the control days.
A value significantly greater than 1 indicates that enhancement in the target area exceeds natural historical variability.
3.5. Statistical Evaluation of Reflectivity Differences
Given the limited sample sizes and spatial heterogeneity inherent to field precipitation observations, nonparametric statistical methods were adopted. The Mann–Whitney U test—an established rank-based test for comparing two independent samples—was used as the primary tool to assess statistical significance [34]. Its distribution-free formulation reduces sensitivity to outliers and maintains robustness under small-sample conditions. A significance level of < 0.05 was used to indicate statistically meaningful differences.
The formula for the Mann–Whitney U test is as follows:
where is the statistic, and are the sample sizes of the two groups being compared, and represents the sum of ranks for all data in the first sample group. A smaller value suggests a greater difference between the two groups. The corresponding -value for can be derived using statistical tables or direct calculation, with a significance threshold typically set at < 0.05.
4. Result
4.1. Stratiform Precipitation Event over Bayinbuluke on 29–30 August 2024
Figure 3 presents the integrated multi-source observations of the stratiform precipitation event that affected Bayinbuluke from 16:26 on 29 August to 05:00 on 30 August 2024. The event persisted for approximately 12.5 h and produced 21 mm of rainfall on 29 August, followed by an additional 5.1 mm early on 30 August. Acoustic operation was conducted from 16:26 to approximately 00:00, as indicated by the vertical reference lines.
Time–height reflectivity fields from the Ka-band cloud radar and the micro-rain radar (MRR) (Figure 3a,b) exhibit typical stratiform characteristics, including horizontally extensive echo layers and vertically coherent structures. Reflectivity intensified gradually during the early stage and remained elevated for several hours, with local maxima exceeding 30 dBZ.
Rainfall intensity observed by the surface disdrometer and the MRR at 200 m (Figure 3c) showed consistent temporal evolution, with several rainfall peaks occurring during the acoustic operation period (0–480 min), particularly between 200 and 480 min, with maximum intensities of 8–9 mm h−1. Following the termination of acoustic operation, rainfall intensity gradually decreased, and no rainfall peaks of comparable magnitude were observed during the subsequent natural precipitation stage. It should be noted that such temporal variations in rainfall intensity may also arise from the intrinsic evolution of stratiform precipitation systems.
4.2. Reflectivity Characteristics from PPI Scanning Observations
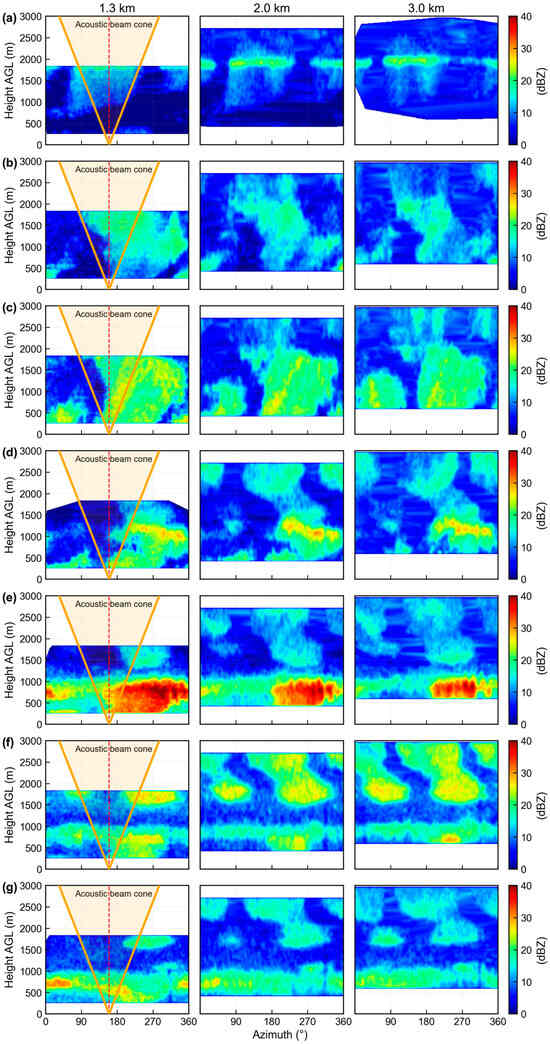
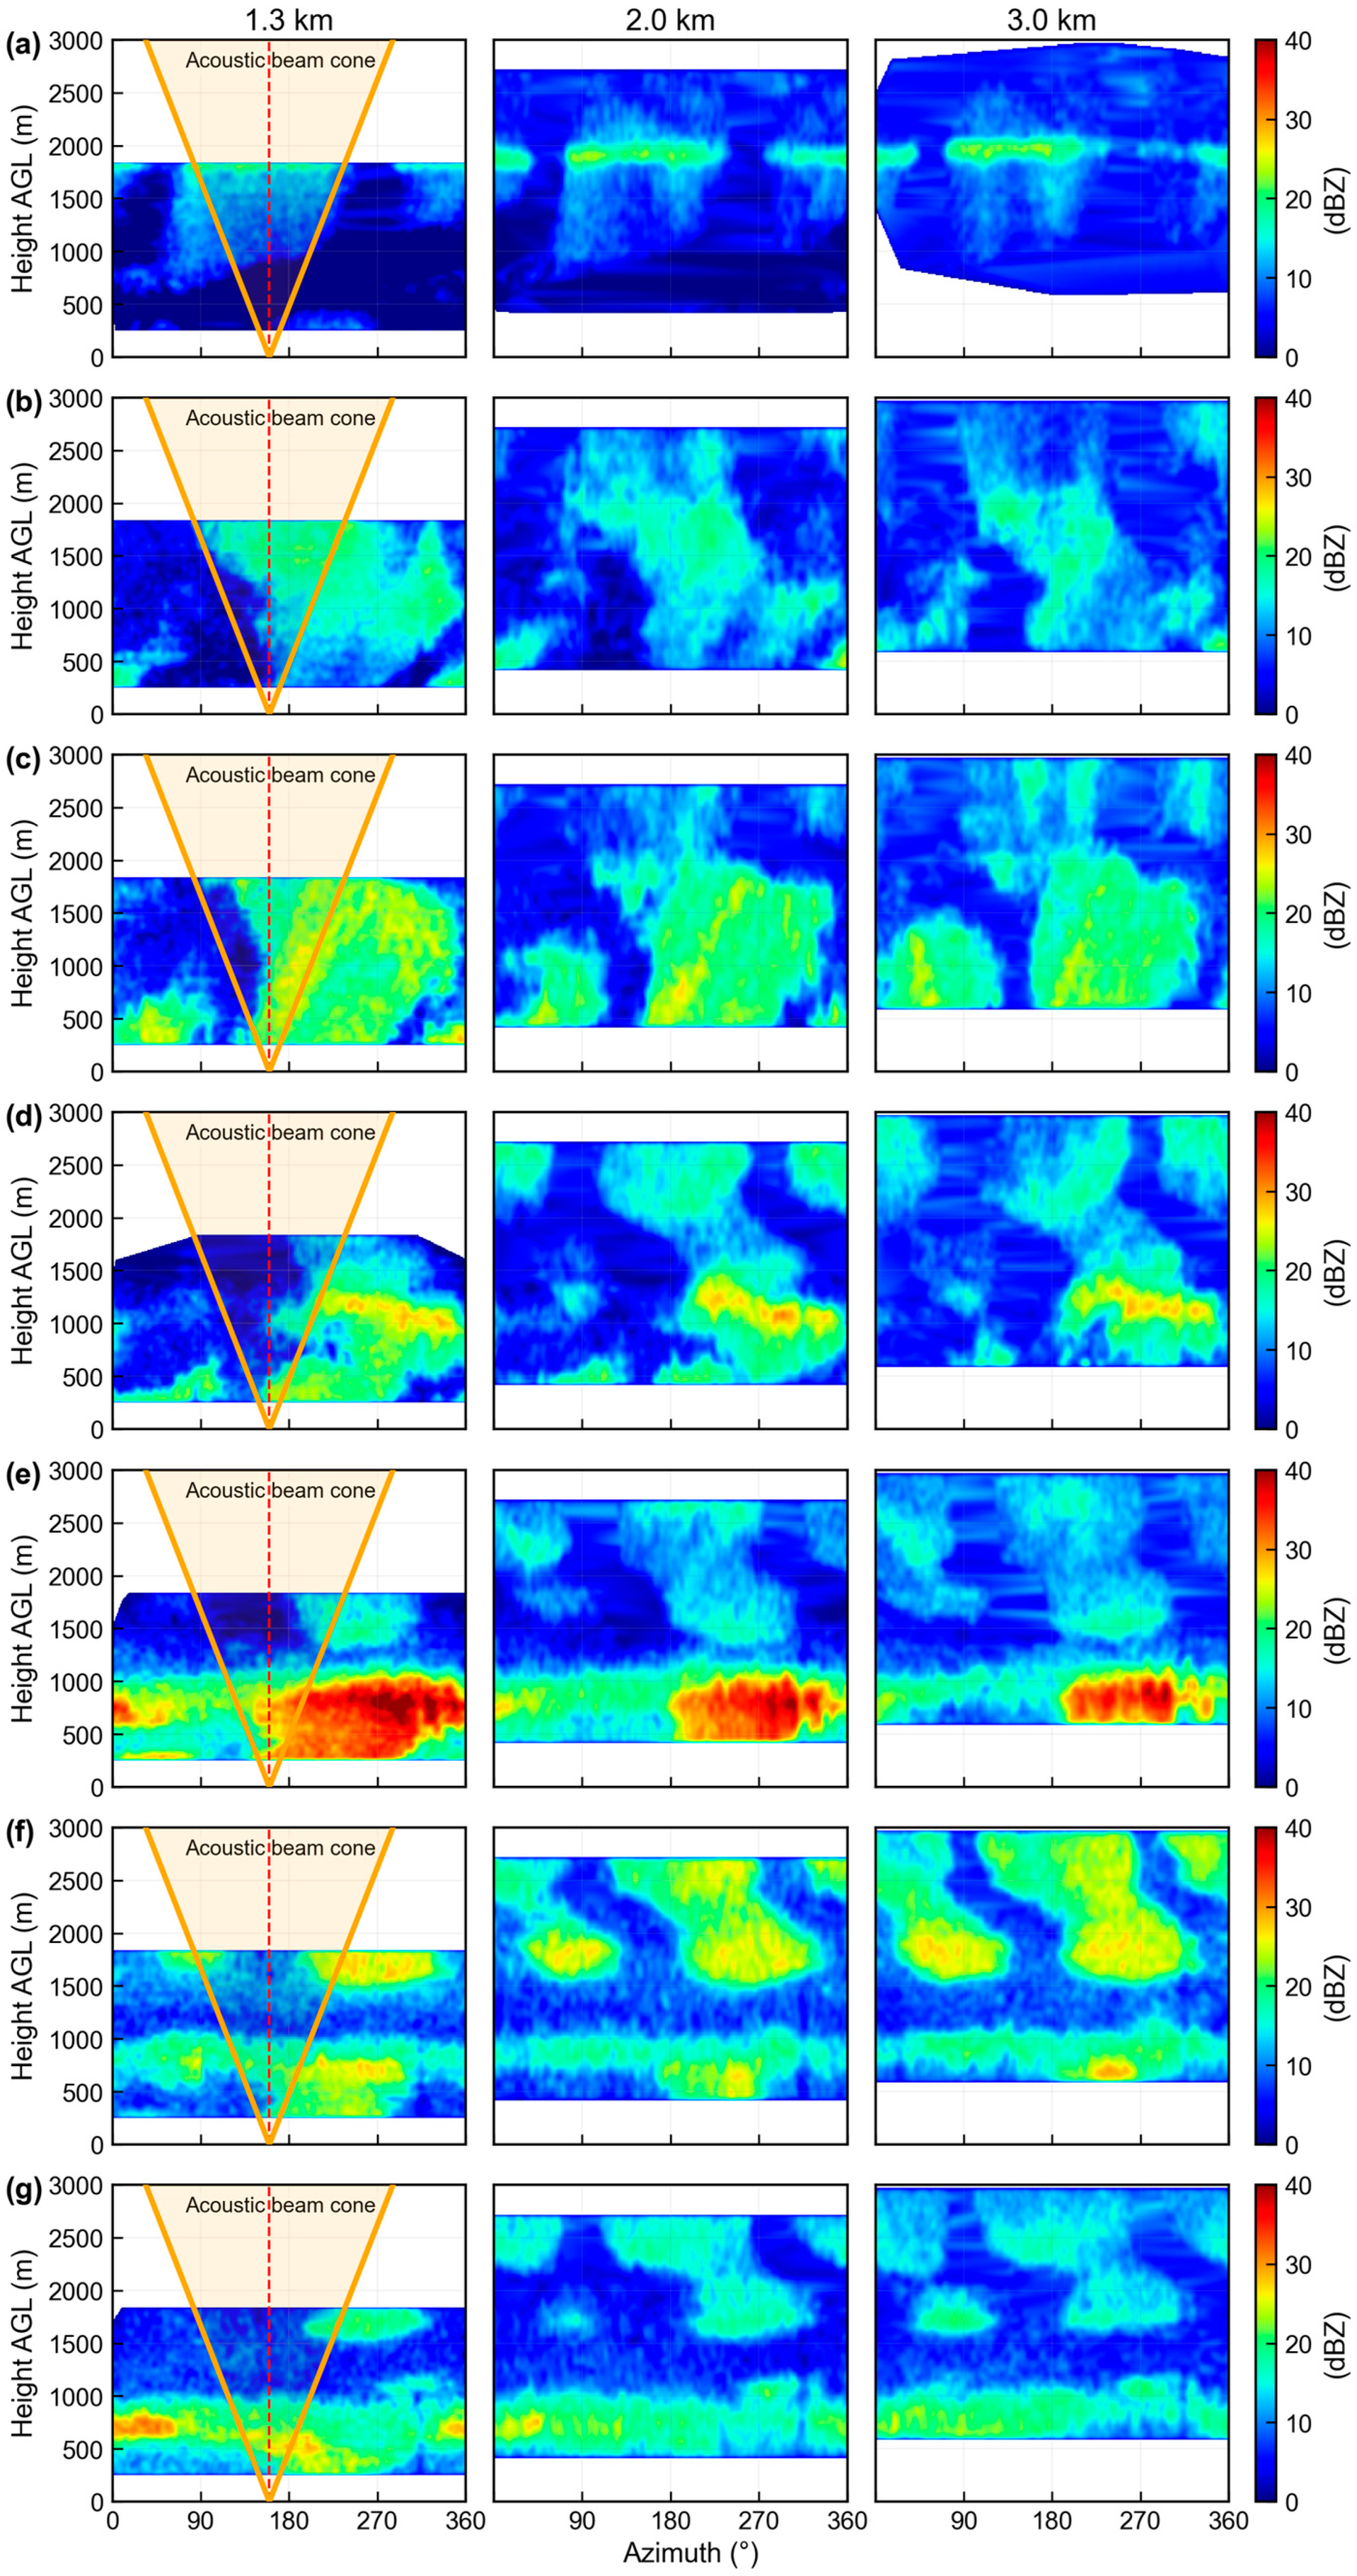
Figure 4 displays the time–azimuth evolution of X-band radar reflectivity at radial distances of 1.3, 2.0, and 3.0 km during the acoustic operation. The acoustic generator was located at an azimuth of 160° and a range of 1.3 km, and its main acoustic radiation cone is indicated by the orange lines.
Figure 4.
Time–azimuth evolution of X-band radar reflectivity during the acoustic operation. Reflectivity fields at radial distances of 1.3, 2.0, and 3.0 km are shown for (a) T = 0 min; (b) T + 150 min; (c) T + 210 min; (d) T + 270 min; (e) T + 330 min; (f) T + 390 min; and (g) T + 450 min. The orange lines delineate the angular range of acoustic emission (i.e., the main acoustic radiation cone), while the red vertical line denotes the central axis of the acoustic beam propagating vertically upward from the acoustic source.
At the initial stage of the acoustic operation (T = 0 min), radar echoes were generally weak and spatially discontinuous, reflecting an early developmental stage of the stratiform precipitation system. By T + 150 min, reflectivity remained relatively low across most azimuths, with no clearly organized enhancement pattern.
As the acoustic operation progressed, distinct structural changes emerged in the reflectivity field. At T + 210 min, broad and continuous echoes began to appear across the western to northwestern sectors. By T + 270 min, a pronounced enhanced-reflectivity band developed, extending clockwise from approximately 160° through 360° to 45°. This enhanced band intensified further and reached its maximum extent at T + 330 min, when localized reflectivity maxima exceeding 40 dBZ were observed, particularly in the near-source region.
Throughout the acoustic operation period, reflectivity enhancement exhibited clear spatial organization. The enhancement was strongest at the shortest radial distance (1.3 km) and gradually weakened with increasing radial distance to 2.0 km and 3.0 km. The reflectivity enhancement displayed significant nonuniformity both radially and azimuthally: it was generally stronger closer to the source and weakened with increasing distance. However, it was not symmetrically distributed around the acoustic source; rather, it was concentrated in several specific azimuthal sectors, indicating spatial heterogeneity in the cloud’s response to the acoustic forcing.
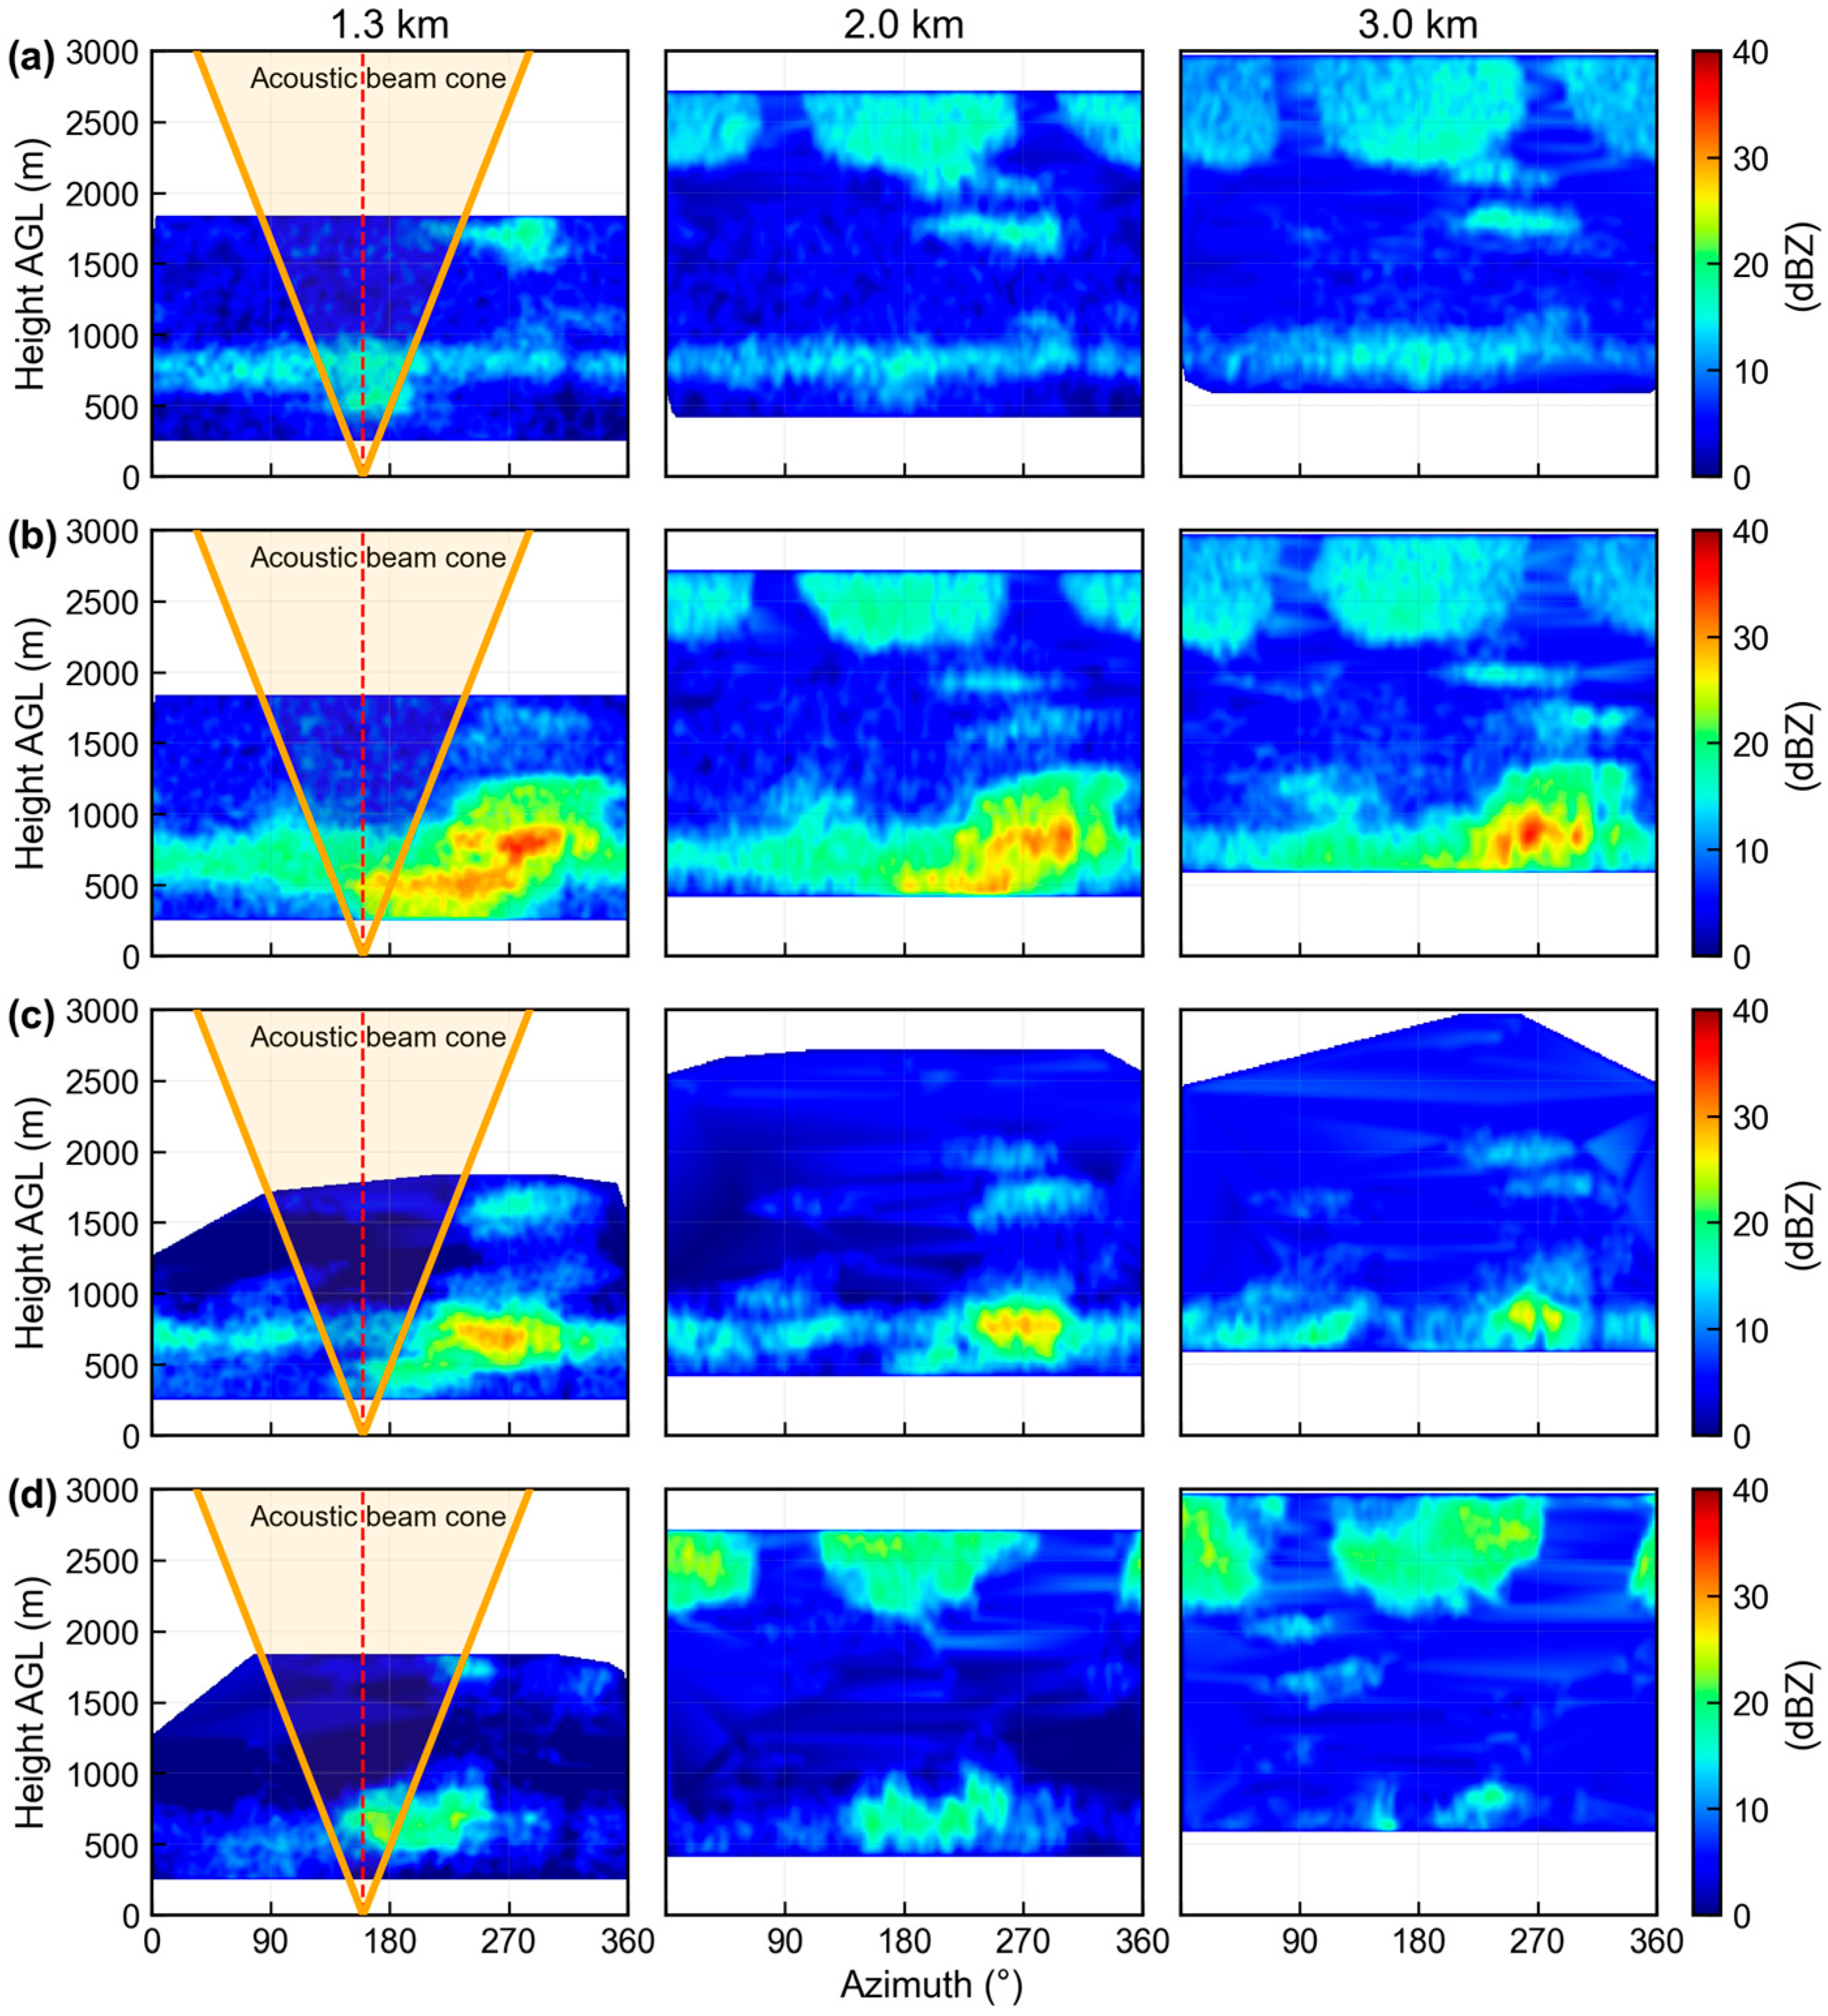
Between T + 390 min and T + 450 min, the azimuthal distribution of reflectivity became progressively more uniform, and the near-source enhancement weakened across all radial distances. Following the termination of the acoustic operation at T + 450 min, the precipitation system transitioned into its natural evolution stage (Figure 5).
Figure 5.
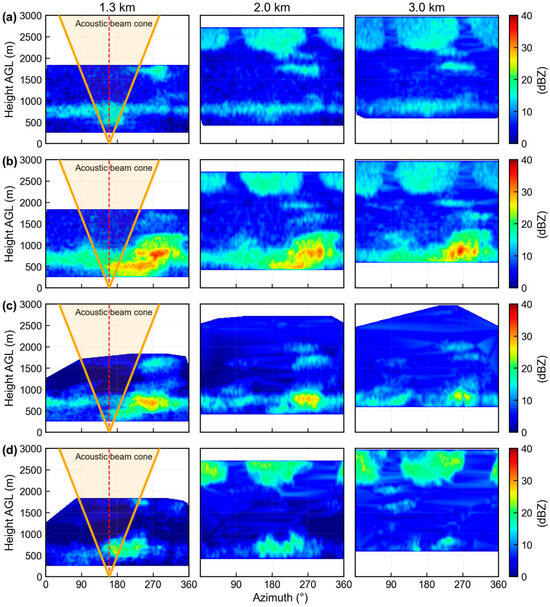
Time–azimuth evolution of X-band radar reflectivity after the termination of the acoustic operation. Reflectivity fields at horizontal ranges of 1.3 km, 2.0 km, and 3.0 km are shown for (a) C = 60 min; (b) C + 120 min; (c) C + 180 min; and (d) C + 240 min. The orange lines delineate the angular range of acoustic emission (i.e., the main acoustic radiation cone), while the red vertical line denotes the central axis of the acoustic beam propagating vertically upward from the acoustic source.
During the subsequent natural precipitation stage, the reflectivity field exhibited a classical stratiform life cycle, characterized by gradual intensification (C + 120 to C + 180 min), a mature stage with a relatively stable strong-echo center near 270°, and a subsequent decay phase (C + 180 to C + 240 min). Throughout this period, reflectivity maxima consistently remained within the 180–290° sector, and no notable enhancement was observed within the 0–90° sector.
4.3. Vertical Structural Differences Based on RHI Radar Scans
4.3.1. Regional Framework and Data Processing
To examine vertical structural differences between the acoustic-operation and natural stages, vertical reflectivity profiles derived from RHI scans were analyzed following the methodology in Section 3.2. Based on the location of the acoustic generator, two regions were defined: a 0–3 km treatment zone and a 7–9 km control zone. Because the radar is located only 1.3 km from the acoustic source, all azimuth angles were referenced to the radar position.
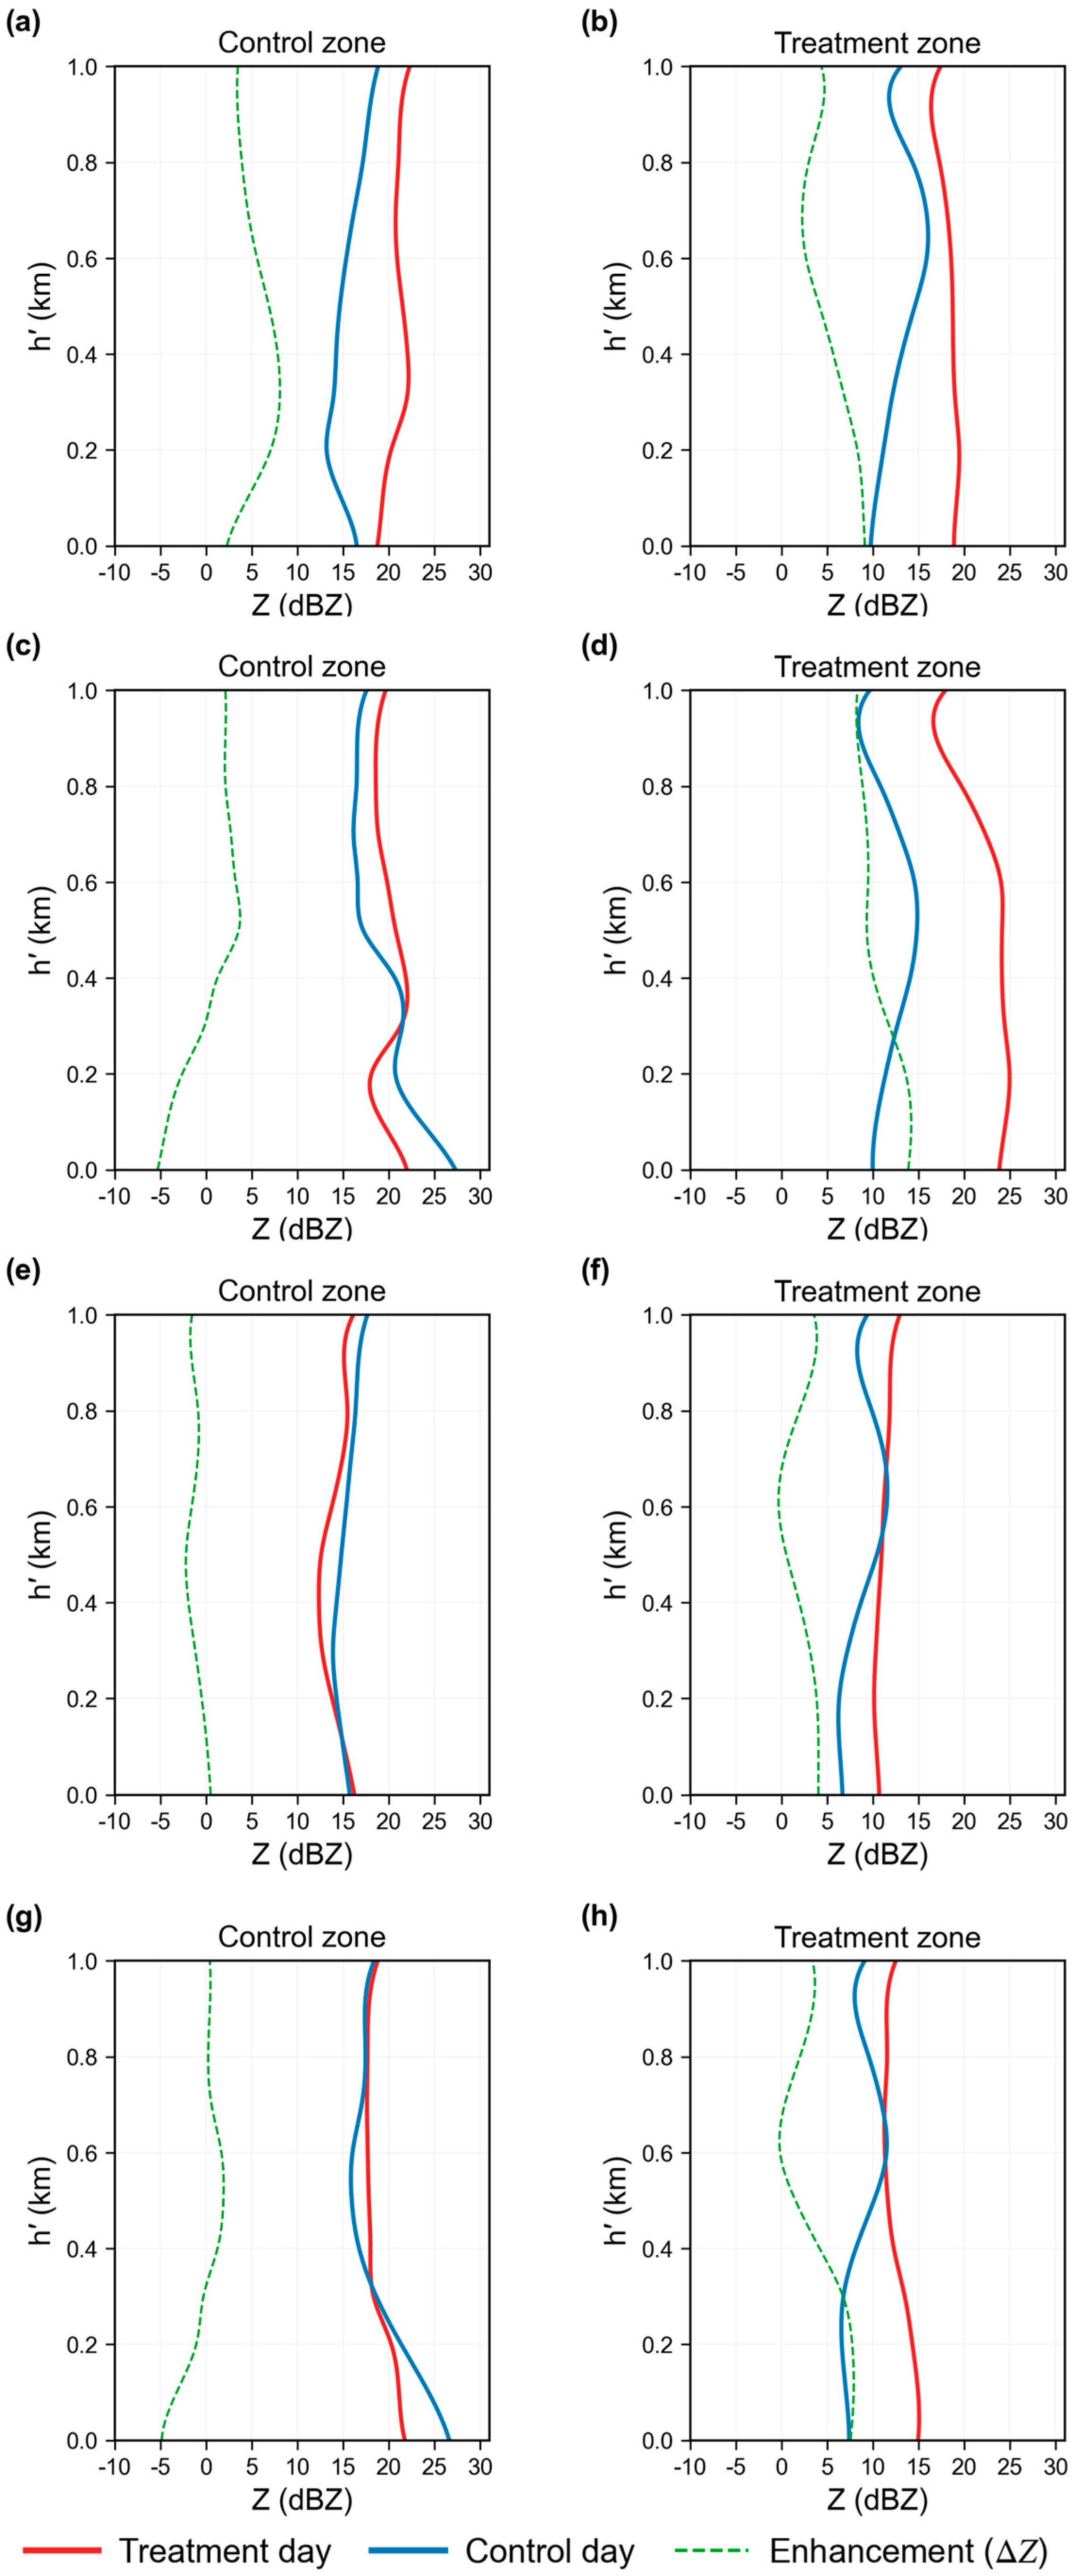
To account for temporal variations in melting-layer height, only reflectivity below the melting layer was analyzed, and all profiles were normalized by height. Representative profiles at key azimuths are shown in Figure 6.
Figure 6.
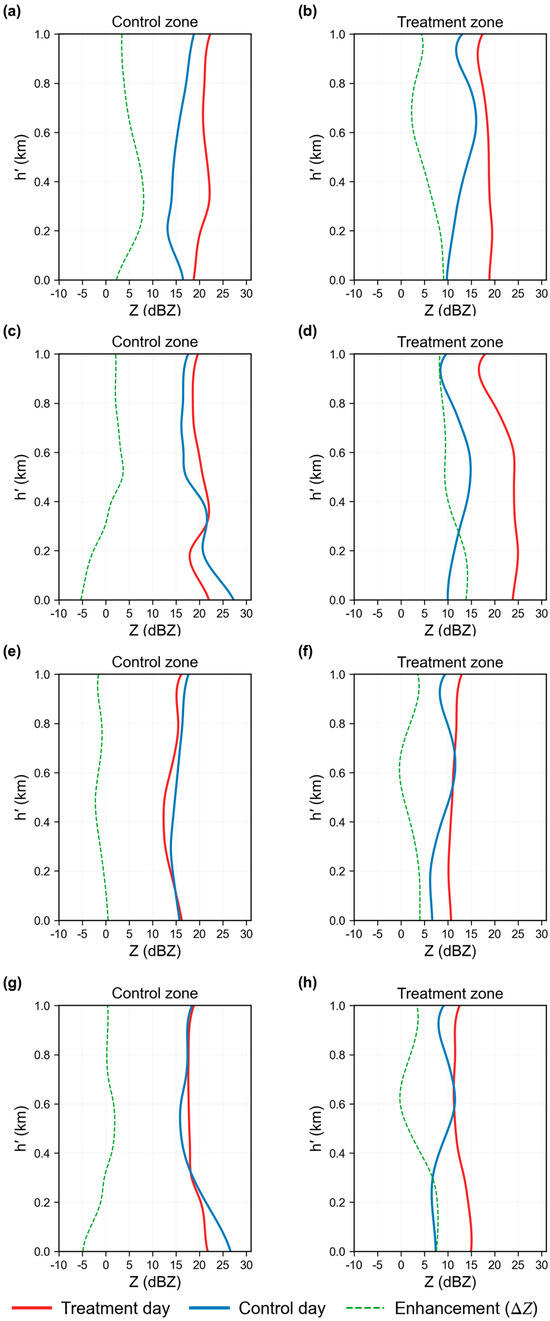
Vertical reflectivity profiles derived from RHI scans during the control day and the acoustic-operation day. Panels (a,c,e,g) show reflectivity profiles in the control zone (7–9 km) across four azimuth sectors (270–295°, 247°, 160°, and 137°). Panels (b,d,f,h) show reflectivity profiles in the treatment zone (0–3 km) for the same azimuth sectors.
4.3.2. Control-Zone Characteristics
In the control zone (7–9 km), vertical reflectivity profiles from the experiment and control days (Figure 6a,c,e,g) exhibited strong consistency. At azimuths 247°, 160°, and 137°, differences between the two periods remained within 5 dBZ, and the overall profile shapes were similar throughout the analyzed vertical range. At azimuths of 270–295°, larger differences exceeding 5 dBZ were observed near the surface.
4.3.3. Influence-Zone Characteristics
In the influence zone (1–3 km), the RHI-derived vertical reflectivity profiles (Figure 6b,d,f,h) exhibited pronounced azimuth-dependent responses. At azimuths of 270–290°, reflectivity below the normalized height < 0.5 increased by approximately 5–10 dBZ relative to the control day.
The largest enhancement was observed at the 247° azimuth, where reflectivity increased throughout the vertical column, with maximum differences reaching approximately 14 dBZ at < 0.3. At the 160° azimuth, reflectivity increased by approximately 2–5 dBZ, both near the melting layer and within the lower part of the column. At the 137° azimuth, reflectivity enhancement of approximately 5–10 dBZ was observed near the surface ( < 0.4), exceeding that at 160°.
4.3.4. Dual-Ratio Analysis of Vertical Reflectivity Profiles
Based on the dual-ratio (DR) analysis of RHI-derived vertical reflectivity profiles, no statistically significant change is detected in the 270–295° sector (p = 0.660). In contrast, during the acoustic operation period, statistically significant reflectivity enhancement is observed in multiple azimuthal sectors. The most pronounced enhancement occurs in the 247° sector (DR = 1.91, p < 0.001), while significant increases are also observed in the 160° and 137° sectors (Table 3).
Table 3.
Dual-ratio (DR) and statistical significance of vertical reflectivity profiles across azimuths and radial ranges.
5. Discussion
The results of this study indicate that, during the acoustic operation period, the radar reflectivity field exhibited spatial structural characteristics distinct from those observed during the subsequent natural precipitation stage. Integrated PPI and RHI observations show that pronounced reflectivity enhancement occurred within the 0–3 km influence zone during acoustic operation, with localized high-reflectivity regions (>40 dBZ) forming near the acoustic source. The enhancement pattern exhibited clear azimuthal heterogeneity, with the strongest response at 247° and additional enhancement in the downstream sector at 137°. No comparable spatially organized reflectivity enhancement was observed during the subsequent natural precipitation stage, suggesting that the observed reflectivity variations were temporally coincident with the acoustic operation and exhibited a certain degree of spatial organization. These spatial responses were influenced by both the acoustic forcing range and the evolving cloud system, reflecting the combined effects of the acoustic energy and natural cloud dynamics.
From a spatial-scale perspective, the near-source reflectivity enhancement may be physically consistent with the limited effective range of acoustic forcing. Low-frequency acoustic effects are generally confined to regions where acoustic pressure perturbations remain sufficiently strong to induce droplet relative motion, acoustic wake effects, or turbulence-enhanced collision–coalescence, which may manifest at the macroscopic scale as enhanced radar reflectivity. The near-field enhancement observed within the 0–3 km influence zone is consistent with this physical framework; however, the absence of direct microphysical observations precludes establishing a causal linkage between acoustic forcing and cloud microphysical modification.
Statistically significant enhancement was also detected in the downstream sector (137°), which may reflect the advection of cloud regions experiencing reflectivity changes during the acoustic operation period along the prevailing cloud-motion direction. Although the spatial alignment between the downstream enhancement and the dominant cloud-motion direction supports a plausible advective interpretation, similar spatial heterogeneity may also arise from natural dynamical processes under complex orographic conditions, and this feature should therefore be interpreted with caution.
It should be emphasized that this study is based on a single stratiform precipitation event observed over complex terrain. In mountainous regions such as the Bayanbulak Basin, natural processes—including terrain-induced lifting, background wind shear, and pre-existing cloud inhomogeneity—can independently generate pronounced azimuth-dependent reflectivity patterns. Accordingly, the present results should be regarded as case-based observational evidence indicating that cloud structure and precipitation fields may exhibit organized responses during acoustic operation, rather than as confirmation of a deterministic acoustic precipitation enhancement mechanism.
Therefore, the present findings should be interpreted as case-based observational evidence rather than as confirmation of a universal acoustic-effect mechanism. Future work should extend this analysis to multiple events under comparable synoptic conditions, integrate dual-polarization radar variables to better constrain microphysical changes, and, where possible, incorporate in situ observations and numerical simulations to disentangle acoustic effects from natural dynamical and orographic influences.
6. Conclusions
This study presents the first three-dimensional volumetric observation from an X-PAR showing the 3-dimensional process of stratiform clouds and precipitation during APE operation. By combining rapid volumetric scans with sector-aligned RHI observations, we reconstructed the cloud structure before, during, and after acoustic operation, thereby capturing the immediate structural and microphysical responses associated with acoustic perturbations, as well as orographic influence.
The key findings are summarized as follows:
- (1)
- Integrated PPI and RHI observations consistently showed pronounced reflectivity enhancement within the 0–3 km influence zone during the acoustic operation. Localized high-reflectivity regions (>40 dBZ) appeared near the source, and the enhancement pattern exhibited clear azimuthal heterogeneity, with the strongest response at 247° and additional downstream enhancement at 137°. No comparable features occurred during the subsequent natural precipitation stage.
- (2)
- Dual-ratio analysis and the Mann–Whitney U test further quantified these findings. Significant enhancement was detected at 247° ( = 1.91, = 0.0004), 137° ( = 1.51, = 0.008), and 160°, whereas the upwind 270–295° sector showed no significant change. This spatially heterogeneous response pattern suggests that the change in the clouds is markedly directional, not only in the primary acoustic radiation sector but also in its downstream regions along the cloud-motion pathway.
From an application-oriented perspective, the combination of X-PAR rapid volumetric scanning, sectorized RHI analysis, and the dual-ratio test provides a feasible and operational observational framework for identifying localized cloud and precipitation responses possibly induced by acoustic forcing, particularly under stratiform cloud conditions [22]. However, the conclusions of this study are derived from a single case and therefore cannot fully exclude the influence of natural cloud evolution processes, considering the strong orographic influence in this case.
To obtain more robust conclusions and to precisely assess the effects of APE, future studies should move beyond single-case analysis. Specifically, expanding the experimental dataset to include multiple similar precipitation events and conducting statistical analyses across different cases would help improve the reliability of the results. In addition, the use of dual-polarization radar observation for cloud microphysical parameters, as well as in situ measurement of cloud drop size distributions, would enable a more detailed investigation of the underlying mechanisms of APE, especially the changes in cloud and rainfall droplets’ size distribution spectra. These efforts are essential for evaluating whether acoustic impacts on precipitation are systematic and broadly applicable.
Author Contributions
Conceptualization, J.W. and T.L.; methodology, J.W.; investigation, J.W. and J.Z.; validation, G.C. and J.Z.; resources, G.C. and T.L.; writing—original draft preparation, J.W.; writing—review and editing, T.L.; supervision, G.C.; project administration, G.C.; funding acquisition, T.L. All authors have read and agreed to the published version of the manuscript.
Funding
This research was funded by the Key Research and Development Program of Xinjiang Uygur Autonomous Region (Grant No. 2023B03019-3) and the Open Research Fund Program of the State Key Laboratory of Hydroscience and Engineering (Grant No. SKLHSE-KF-2025-B-04).
Institutional Review Board Statement
Not applicable.
Informed Consent Statement
Not applicable.
Data Availability Statement
The data presented in this study are available on request from the corresponding author. The data are not publicly available due to privacy.
Acknowledgments
The authors gratefully acknowledge the field experiment team for their dedicated support during the acoustic precipitation enhancement campaign in the Bayinbuluke Basin. We thank all personnel involved in instrument deployment, maintenance, and on-site operations for ensuring the stable performance of the X-band phased-array radar, acoustic generator, and ground-based sensors throughout the experiment. Their technical contributions and logistical assistance were essential to the successful acquisition of the observational dataset used in this study. All authors have read and agreed to the published version of the manuscript.
Conflicts of Interest
The authors declare no conflicts of interest.
References
- Morante-Carballo, F.; Montalván-Burbano, N.; Quiñonez-Barzola, X.; Jaya-Montalvo, M.; Carrión-Mero, P. What Do We Know about Water Scarcity in Semi-Arid Zones? A Global Analysis and Research Trends. Water 2022, 14, 2685. [Google Scholar] [CrossRef] [Scilit]
- Wang, X.; Xiao, X.; Zou, Z.; Dong, J.; Qin, Y.; Doughty, R.B.; Menarguez, M.A.; Chen, B.; Wang, J.; Ye, H.; et al. Gainers and losers of surface and terrestrial water resources in China during 1989–2016. Nat. Commun. 2020, 11, 3471. [Google Scholar] [CrossRef] [Scilit]
- Wehbe, Y.; Griffiths, S.; Al Mazrouei, A.; Al Yazeedi, O.; Al Mandous, A. Rethinking water security in a warming climate: Rainfall enhancement as an innovative augmentation technique. Npj Clim. Atmos. Sci. 2023, 6, 171. [Google Scholar] [CrossRef] [Scilit]
- Singh, A.K.; Abhijith, B.; Dewangan, L. Safety Concerns and Consequences of Cloud Seeding Implications—A Systematic Review. In Advances in Waste Management; Siddiqui, N.A., Baxtiyarovich, A.S., Nandan, A., Mondal, P., Eds.; Lecture Notes in Civil Engineering; Springer: Singapore, 2023; Volume 301, pp. 11–27. [Google Scholar] [CrossRef] [Scilit]
- Flossmann, A.I.; Manton, M.; Abshaev, A.; Bruintjes, R.; Murakami, M.; Prabhakaran, T.; Yao, Z. Review of Advances in Precipitation Enhancement Research. Bull. Am. Meteorol. Soc. 2019, 100, 1465–1480. [Google Scholar] [CrossRef] [Scilit]
- Wei, J.; Qiu, J.; Li, T.; Huang, Y.; Qiao, Z.; Cao, J.; Zhong, D.; Wang, G. Cloud and precipitation interference by strong low-frequency sound wave. Sci. China Technol. Sci. 2021, 64, 261–272. [Google Scholar] [CrossRef] [Scilit]
- Markauskas, D.; Kacianauskas, R.; Maknickas, A. Numerical particle-based analysis of the effects responsible for acoustic particle agglomeration. Adv. Powder Technol. 2014, 26, 698–704. [Google Scholar] [CrossRef] [Scilit]
- Tulaikova, T.; Amirova, S. Acoustical method and device for precipitation enhancement inside natural clouds. Sci. Discov. 2015, 3, 18. [Google Scholar] [CrossRef] [Scilit]
- Shi, Y.; Wei, J.; Bai, W.; Wang, G. Numerical investigations of acoustic agglomeration of liquid droplet using a coupled CFD-DEM model. Adv. Powder Technol. 2020, 31, 2394–2411. [Google Scholar] [CrossRef] [Scilit]
- Bai, W.; Shi, Y.; Zhao, Z.; Wei, J. Investigation of critical response characteristics of micro-droplets under the action of low-frequency acoustic waves. Front. Environ. Sci. 2022, 10, 972648. [Google Scholar] [CrossRef] [Scilit]
- Bai, W.; Wei, J.; Shi, Y.; Zhao, Z.; Li, Q. Microphysical characteristics and environmental isotope effects of the micro-droplet groups under the action of acoustic waves. Atmosphere 2021, 12, 1488. [Google Scholar] [CrossRef] [Scilit]
- Yan, D.; Li, T.; Chen, G.; Tulaikova, T.; Wei, J.; Zhong, D.; Wang, G. Effects of sound waves on the collisional evolution of cloud droplet spectrum and rainfall formation. J. Atmos. Sci. 2025, 82, 1953–1971. [Google Scholar] [CrossRef] [Scilit]
- Shi, Y.; Wei, J.; Qiao, Z.; Shen, W.; Yin, J.; Hou, M.; Ayantobo, O.O.; Wang, G. Investigation of strong acoustic interference on clouds and precipitation in the source region of the Yellow River using KaKu radar. Atmos. Res. 2022, 267, 105992. [Google Scholar] [CrossRef] [Scilit]
- Wang, M.; Chen, J.; Li, J.; Wang, J.; Xie, H. Statistic evaluation of low-frequency acoustic wave impact on rainfall stimulation. Stoch. Environ. Res. Risk Assess. 2023, 37, 611–623. [Google Scholar] [CrossRef] [Scilit]
- Wang, M.; Li, J.; Chen, J.; Wang, J.; Shao, S. Impact of acoustic waves on rainfall distribution in acoustics-induced artificial rainfall technology. Results Eng. 2025, 27, 100259. [Google Scholar] [CrossRef] [Scilit]
- Shi, Y.; Wei, J.; Qiao, Z.; Yang, H.; Zhen, Q.; Ren, Y.; Ni, S.; He, J.; Shen, W.; Cao, S.; et al. Investigation of vertical microphysical characteristics of precipitation under the action of low-frequency acoustic waves. Atmos. Res. 2020, 249, 105283. [Google Scholar] [CrossRef] [Scilit]
- Shi, Y.; Wei, J.; Ren, Y.; Qiao, Z.; Li, Q.; Zhu, X.; Kang, B.; Pan, P.; Cao, J.; Qiu, J.; et al. Investigation of precipitation characteristics under the action of acoustic waves in the source region of the Yellow River. J. Appl. Meteorol. Climatol. 2021, 60, 951–966. [Google Scholar] [CrossRef] [Scilit]
- Shi, Y.; Qiao, Z.; Wang, G.; Wei, J. In situ experimental study of cloud-precipitation interference by low-frequency acoustic waves. Remote Sens. 2023, 15, 993. [Google Scholar] [CrossRef] [Scilit]
- Battaglia, A.; Kollias, P.; Dhillon, R.; Roy, R.; Tanelli, S.; Lamer, K.; Grecu, M.; Lebsock, M.; Watters, D.; Mroz, K.; et al. Spaceborne cloud and precipitation radars: Status, challenges, and ways forward. Rev. Geophys. 2020, 58, e2019RG000686. [Google Scholar] [CrossRef] [Scilit]
- Chu, X.; Geerts, B.; Xue, L.; Pokharel, B. A case study of cloud radar observations and large-eddy simulations of a shallow stratiform orographic cloud, and the impact of glaciogenic seeding. J. Appl. Meteorol. Climatol. 2017, 56, 1285–1304. [Google Scholar] [CrossRef] [Scilit]
- Pokharel, B.; Geerts, B.; Jing, X. The impact of ground-based glaciogenic seeding on a shallow stratiform cloud over the Sierra Madre in Wyoming: A multi-sensor study of the 3 March 2012 case. Atmos. Res. 2018, 214, 74–90. [Google Scholar] [CrossRef] [Scilit]
- French, J.R.; Friedrich, K.; Tessendorf, S.A.; Rauber, R.M.; Geerts, B.; Rasmussen, R.M.; Xue, L.; Kunkel, M.L.; Blestrud, D.R. Precipitation formation from orographic cloud seeding. Proc. Natl. Acad. Sci. USA 2018, 115, 1168–1173. [Google Scholar] [CrossRef] [Scilit]
- Yao, Z.; Liu, Z.; Wang, J.; Li, T.; Liu, D.; Huang, B.; Zhang, Z. Effect evaluation of acoustic rain enhancement operations of stratus-cumulus mixed clouds in the Leizhou Peninsula. J. Basic Sci. Eng. 2024, 32, 1211–1226. (In Chinese) [Google Scholar]
- Zhao, G.; Huang, H.; Yu, Y.; Zhao, K.; Yang, Z.; Chen, G.; Zhang, Y. Study on the quantitative precipitation estimation of X-band dual-polarization phased array radar from specific differential phase. Remote Sens. 2023, 15, 359. [Google Scholar] [CrossRef] [Scilit]
- Fan, M.; Xu, J.; Li, D.; Chen, Y. Response of precipitation in Tianshan to global climate change based on the Berkeley Earth and ERA5 reanalysis products. Remote Sens. 2022, 14, 519. [Google Scholar] [CrossRef] [Scilit]
- Wang, J.; Li, T.; Chen, L.; Wang, X.; Ding, M.; Zhao, J.; Qiao, Z.; Li, X. Statistical analysis of the effect of acoustic wave rain enhancement experiment in Jimsar County, Xinjiang. Arid Zone Res. 2026, 43, 37–49. (In Chinese) [Google Scholar]
- Chen, G.; Li, T.; Yan, D.; Wei, J. Study on cloud droplet collision–coalescence efficiency under acoustic forcing. J. Appl. Basic Eng. Sci. 2025, 33, 1001–1009. (In Chinese) [Google Scholar]
- Chen, H.; Liu, C.; Yin, C.; Mu, H.; Hu, H. Calibration of X-band phased-array weather radar using a metal sphere mounted on a UAV. Remote Sens. Technol. Appl. 2024, 39, 1533–1542. (In Chinese) [Google Scholar]
- Ye, B.-Y.; Jung, E.; Shin, S.; Lee, G. Statistical Characteristics of Cloud Occurrence and Vertical Structure Observed by a Ground-Based Ka-Band Cloud Radar in South Korea. Remote Sens. 2020, 12, 2242. [Google Scholar] [CrossRef] [Scilit]
- Peters, G.; Fischer, B.; Andersson, T. Rain observations with a vertically looking micro rain radar (MRR). Boreal Environ. Res. 2002, 7, 4113. [Google Scholar] [CrossRef] [Scilit]
- Zeng, Y.; Yang, L.; Zhang, Z.; Tong, Z.; Li, J.; Liu, F.; Zhang, J.; Jiang, Y. Characteristics of Clouds and Raindrop Size Distribution in Xinjiang, Using Cloud Radar Datasets and a Disdrometer. Atmosphere 2020, 11, 1382. [Google Scholar] [CrossRef] [Scilit]
- Atlas, D. Radar calibration: Some simple approaches. Bull. Am. Meteorol. Soc. 2002, 83, 1313–1316. [Google Scholar] [CrossRef] [Scilit]
- Gabriel, K.R. Ratio statistics for randomized experiments in precipitation stimulation. J. Appl. Meteorol. Climatol. 1999, 38, 290–301. [Google Scholar] [CrossRef] [Scilit]
- Tuftedal, M.E.; Delene, D.J.; Detwiler, A. Precipitation evaluation of the North Dakota Cloud Modification Project (NDCMP) using rain gauge observations. Atmos. Res. 2021, 269, 105996. [Google Scholar] [CrossRef] [Scilit]

Disclaimer/Publisher’s Note: The statements, opinions and data contained in all publications are solely those of the individual author(s) and contributor(s) and not of MDPI and/or the editor(s). MDPI and/or the editor(s) disclaim responsibility for any injury to people or property resulting from any ideas, methods, instructions or products referred to in the content. |
© 2026 by the authors. Licensee MDPI, Basel, Switzerland. This article is an open access article distributed under the terms and conditions of the Creative Commons Attribution (CC BY) license.