


Abstract
Precipitation variability in the tropical Andes is strongly influenced by complex topography and regional hydroclimatic processes, yet the spatial organization and temporal evolution of precipitation regimes remain insufficiently characterized. This study identifies dominant precipitation regimes in the Upper Pastaza River Basin, Ecuador, and examines their variability during 1981–2025 using daily precipitation data from the Climate Hazards Group InfraRed Precipitation with Stations (CHIRPS) dataset. CHIRPS estimates were evaluated against observations from three meteorological stations, revealing spatial differences in precipitation estimation accuracy and a general underestimation of monthly precipitation totals. Empirical Orthogonal Function (EOF) analysis and K-means clustering were applied to identify four recurrent precipitation Weather Types (WTs), ranging from a dominant low-intensity regime (WT1), representing approximately 70% of classified days, to a relatively infrequent but intense precipitation regime (WT2), accounting for approximately 1.7%. Seasonal and interannual variability was characterized through regime occurrence frequencies and temporal recurrence patterns. Monotonic trends were assessed using Kendall’s rank correlation coefficient and Sen’s slope estimator, while the burstiness index was used to examine temporal irregularity. A statistically significant positive trend was identified in WT2 occurrence (Kendall’s τ = 0.3830, p = 0.0002), whereas no significant trends were detected for the remaining regimes. Comparison with the recent period (2015–2025), using a consistent classification framework, revealed differences in regime occurrence while preserving broadly similar spatial precipitation patterns. These findings highlight changes in the occurrence of specific precipitation states rather than a generalized redistribution of all regimes, providing insights into hydroclimatic variability across the Andes–Amazon transition zone.
1. Introduction
The spatio-temporal variability of precipitation in the tropical Andes is one of the main challenges in regional climatology due to its direct influence on water resources, hydroelectric power generation, mountain ecosystems, and the occurrence of extreme hydrometeorological events. In the Andean–Amazon region, the distribution of precipitation results from complex interactions between topography, tropical atmospheric circulation, and moisture transport from the Amazon, leading to high spatial and temporal heterogeneity in rainfall.
Various studies have shown that the Andes–Amazon transition regions represent one of the most dynamic hydroclimatic systems in South America, characterized by steep altitudinal gradients and orographic processes that significantly modulate precipitation [1,2]. Recent research also highlights changes in the atmospheric mechanisms that control rainfall in the tropical Andes, particularly those associated with changes in regional circulation, Amazonian moisture transport, and large-scale climate variability [1,3].
In Ecuador, the Upper Pastaza River Basin is located within a complex hydroclimatic transition between the central Andes and the western Amazon, where precipitation is strongly modulated by topography, elevation, and the transport of moist air from the Amazon Basin [2,4]. The strong altitudinal gradients and rugged terrain produce marked spatial variability in rainfall, while the available rain-gauge networks are often too sparse to fully represent precipitation patterns in tropical mountainous environments [5,6]. Consequently, satellite-based precipitation products have become an important complement to conventional observations for hydroclimatic studies in the Tropical Andes, particularly in regions where ground-based measurements are spatially limited [5,7]. Recent evaluations in Ecuador have also shown the usefulness of satellite products such as CHIRPS for representing the spatial and seasonal variability of precipitation, although limitations remain at the daily scale and over complex terrain [8].
The basin also has strategic importance for Ecuador’s electricity supply. The Agoyán (156 MW) and San Francisco (212 MW) hydropower plants operate in cascade along the Pastaza River in the Baños area and downstream, with a combined installed capacity of 368 MW [9]. In 2025, the cascade generated 2133.79 GWh, equivalent to approximately 6.3% of Ecuador’s domestic gross electricity generation, excluding imports [10]. This contribution highlights the relevance of characterizing precipitation variability in the mountainous catchment supplying these facilities.
The development of satellite-derived climate products, such as CHIRPS, TRMM, and IMERG, has improved the spatial characterization of precipitation in regions with limited observational coverage. However, several studies have noted that estimation errors increase considerably in Andean areas due to the influence of convective and orographic processes that are difficult to represent using remote sensing [8,11]. At the same time, new methodologies based on multivariate analysis, atmospheric classification, and machine learning have been used to identify complex hydroclimatic patterns and impute time series in data-scarce inter-Andean watersheds [12,13,14].
Precipitation variability in the Ecuadorian Andes is also closely linked to large-scale atmospheric forcings. Recent studies have shown that phenomena such as the El Niño–Southern Oscillation (ENSO) significantly alter the spatial and temporal distribution of rainfall in Ecuador, increasing the frequency of extreme events and hydrological anomalies [15]. Furthermore, regional research has highlighted the influence of oceanic teleconnections and changes in tropical atmospheric circulation on the hydroclimatic dynamics of the Andes and the western Amazon.
Despite the growing number of hydroclimatic studies conducted in the tropical Andes, there are still few comprehensive assessments that combine spatiotemporal analyses of precipitation, atmospheric classification techniques, and large-scale climate variability in the Upper Pastaza River Basin. Most previous studies have focused on local hydrological analyses or relatively short time series, without explicitly characterizing the dominant spatial precipitation patterns and their variability in this Andean–Amazonian region. Consequently, significant uncertainties remain regarding the spatial organization of precipitation and its relationship with regional and tropical atmospheric mechanisms [6,8,12].
In this context, the present study aims to investigate the spatiotemporal variability of precipitation in the Upper Pastaza River Basin, one of the most important Andean–Amazon transition regions in Ecuador. Daily precipitation fields from the CHIRPS dataset were analyzed for the 1981–2025 period using Empirical Orthogonal Functions (EOFs) and an unsupervised K-means classification approach to identify the dominant precipitation regimes over the basin. The temporal evolution, seasonal occurrence, and recent changes in these precipitation regimes were subsequently evaluated. The results provide new insights into the organization of precipitation over a complex tropical Andean basin and contribute to a better understanding of the hydroclimatic processes controlling rainfall variability in the eastern Ecuadorian Andes. Throughout this manuscript, Weather Type (WT) refers to a recurrent spatial configuration of daily precipitation anomalies identified by EOF–K-means classification. Although the term is commonly used for circulation-based classifications [14,16], the WTs defined here are precipitation-based and do not directly identify atmospheric circulation regimes. The contribution is a spatially explicit, basin-specific characterization of precipitation configurations and their occurrence across the mountainous Andes–Amazon transition, rather than a new EOF or clustering algorithm.
2. Materials and Methods
2.1. Study Area
The Upper Pastaza River Basin forms part of the Andean headwaters of the Amazon River and has been considered through different spatial domains in previous hydrological and climatological studies. Several investigations have focused on individual tributary catchments, including the Ambato River Basin and different sectors of the Chambo River Basin [6,17]. Other studies have considered broader systems that include the upper-middle or the complete Pastaza River basin for hydrological modeling and study precipitations in the zone [18,19]. While these spatial domains are appropriate for their respective purposes, they represent only specific sub-basins or broader regional configurations and, therefore, do not necessarily provide a consistent hydrological boundary for the entire area contributing flow to the river outlet selected in this study, located downstream of Agoyán at approximately 1000 m a.s.l. Hence, the Upper Pastaza River Basin was independently delineated in this study to obtain a spatially consistent watershed domain for precipitation variability analysis.
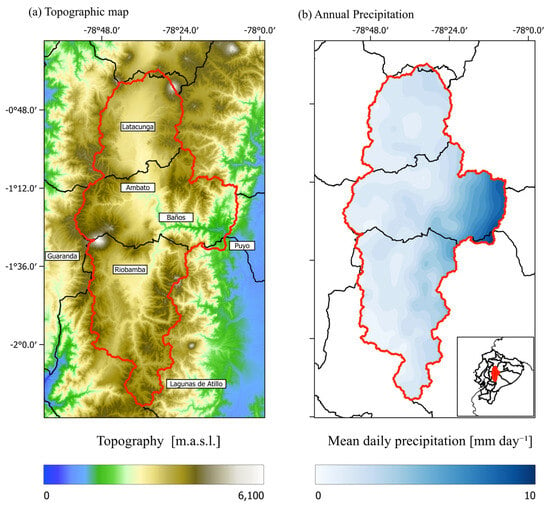
For this study, the Upper Pastaza River Basin was delineated using the ALOS PALSAR Digital Elevation Model (12.5 m native spatial resolution). Standard hydrological analysis procedures implemented in GRASS GIS were applied to obtain the watershed boundaries [20,21]. The basin encompasses the provinces Chimborazo, Tungurahua and Cotopaxi and covers approximately 9160 km2. The watershed was delineated upstream from a point on the Pastaza River at approximately 1000 m a.s.l., downstream of Agoyán. This outlet was selected to focus on the mountainous portion of the catchment, where the terrain becomes increasingly steep and rugged toward the Andes. Elevations within the delineated domain range from approximately 1000 to 6260 m a.s.l., with the maximum corresponding to Chimborazo in the DEM used. The basin is primarily formed by the Patate and Chambo river systems, whose confluence near Baños de Agua Santa gives rise to the Pastaza River before it descends toward the Ecuadorian Amazon. The study area exhibits a pronounced altitudinal and topographic gradient, which includes inter-Andean valleys around Latacunga, Ambato and Riobamba and the steep eastern slopes surrounding Baños (Figure 1a), producing spatial contrasts in hydroclimatic conditions. Similarly, the basin shows substantial spatial variability of precipitation along the Andean–Amazonian transition. Based on the CHIRPS precipitation climatology for the period 1981–2025, long-term mean daily precipitation ranges from 0.415 to 13.735 mm day−1 across the basin, with a basin-wide spatial mean of 4.652 mm day−1 (Figure 1b). Multiplying these daily climatological values by 365 gives approximate annual equivalents of 151–5013 mm year−1, with a basin-wide mean of about 1698 mm year−1. This spatial heterogeneity highlights the influence of local topographic and regional atmospheric processes on precipitation distribution.
Figure 1.
(a) Position of the Pastaza high river basin in Ecuador. The background represents the topography in meters above sea level (m a.s.l.). The red line represents the boundaries of the basin of this study, while the locations of some important places are indicated by red triangles. (b) Long-term mean daily precipitation for the period 1981–2025.
Previous studies have shown substantial precipitation heterogeneity across this region, with relatively dry conditions in the inter-Andean sectors and increasing rainfall toward the eastern slopes, where moist easterly air masses originating from the Amazon Basin are forced to ascend over the Andes [1,6,22]. This orographic influence is also evident in the long-term precipitation distribution shown in Figure 1b, where the highest precipitation values are concentrated along the eastern sector of the basin.
2.2. Precipitation Data
Daily precipitation data from the Climate Hazards Center Infrared Precipitation with Stations, version 3 (CHIRPS v3), downloaded in January 2026, were used for 1981–2025 to characterize precipitation variability over the Upper Pastaza River Basin. CHIRPS is a quasi-global gridded precipitation product that combines satellite observations with in-situ precipitation measurements and provides data at a spatial resolution of approximately 5 km [7,23].
Previous studies have evaluated the applicability of CHIRPS over Ecuador and other tropical Andean regions characterized by complex topography. At the national scale, CHIRPS has shown an adequate capability to represent precipitation variability, although its performance is influenced by the strong topographic gradients of the Ecuadorian Andes [8]. More specifically, a recent evaluation conducted within the Ambato River Basin, which forms part of the Upper Pastaza River Basin, showed that CHIRPS captures the main seasonal precipitation patterns and provides a consistent representation of precipitation variability for climatological applications, despite limitations in the detection and magnitude of individual daily rainfall events [6]. Similar results have been reported for other tropical and subtropical Andean regions, where CHIRPS adequately reproduces spatial precipitation patterns and seasonal and interannual variability, while its accuracy at the daily scale remains comparatively lower [24,25].
The performance of CHIRPS was evaluated against ground-based precipitation observations from three meteorological stations located in the Upper Pastaza River Basin: Riobamba, Lagunas de Atillo, and Baños (Figure 1a). Hourly precipitation records from each station were aggregated into daily accumulated precipitation (mm day−1), while daily CHIRPS precipitation estimates were extracted from the grid cells corresponding to the geographical locations of the stations.
To ensure temporal consistency, the observed and satellite-derived datasets were aligned using their corresponding dates, and only days with valid precipitation records from both sources were retained. Daily station precipitation totals were calculated by summing hourly observations, considering a minimum hourly data completeness threshold of 95%.
For the monthly scale evaluation, daily precipitation totals were aggregated into monthly accumulations (mm month−1). The agreement between CHIRPS and station observations was assessed using Spearman’s rank correlation coefficient (rs), its associated p-value, and the mean bias error (MBE) [25,26]. Spearman’s coefficient was used to evaluate the monotonic association between observed and estimated precipitation, whereas MBE quantified the average difference between CHIRPS estimates and ground-based observations.
At the daily scale, rainfall occurrence was evaluated using a minimum precipitation threshold of 1 mm day−1. The probability of detection (POD) [27] was calculated to quantify the proportion of observed rainy days correctly identified by CHIRPS. Additionally, empirical cumulative distribution functions (ECDFs) were constructed from daily precipitation amounts exceeding the selected threshold to compare the statistical distributions of rainy-day precipitation between CHIRPS and ground-based observations.
The validation was performed independently for each meteorological station over its corresponding period of overlapping observations, allowing spatial differences in CHIRPS performance to be assessed across the study region.
Public CHIRPS v3 station-input inventories were inspected for January 1981, January 2001, and December 2025 (Table S1). They list 148, 134, and 9 Ecuadorian stations, respectively [28]. BANOS (1.39139° S, 78.4181° W), in the Baños sector of the study region, and PUYO (1.50570° S, 77.9560° W), east of the delineated basin, appear in the first two inventories; SAQUISILI (0.83472° S, 78.6635° W), in the inter-Andean sector, appears in all three. These snapshots demonstrate changing station availability; they are not an exhaustive basin-wide station census for 1981–2025. Station names alone do not establish whether the validation records correspond to CHIRPS inputs. The observational comparison is therefore not assumed to be fully independent. Network homogeneity, changes in observing protocols, and their influence on the reported trends were not formally tested.
2.3. Empirical Orthogonal Functions
Daily precipitation anomalies were computed to remove the mean seasonal cycle. Leap days (29 February) were excluded from the analysis to maintain a consistent 365-day annual calendar. At each grid cell, daily climatology was defined as the mean precipitation for each calendar day across 1981–2025. A daily precipitation anomaly was the observed daily value minus that cell’s climatological mean for the same calendar day, thereby removing the mean seasonal cycle. The CHIRPS v3 matrix used for EOF analysis contained no missing values within the selected basin and study period; therefore, no exclusion, interpolation, or infilling was required to address missing data.
To reduce the dimensionality of the dataset while preserving its dominant spatial variability, an Empirical Orthogonal Function (EOF) analysis was applied to the daily CHIRPS precipitation fields. EOF analysis decomposes a spatio-temporal field into a set of orthogonal spatial patterns and their corresponding temporal coefficients, providing an efficient representation of the dominant modes of variability [27,29]. This approach has been widely applied to identify recurrent spatial structures in atmospheric and climatological fields.
Daily precipitation anomaly fields of CHIRPS were organized into a two-dimensional matrix, with rows corresponding to daily time steps and columns representing grid cells within the basin. Principal Component Analysis (PCA) was then applied to this matrix to obtain the EOF modes and the corresponding temporal scores. The modes were ordered according to the proportion of variance explained, and the number of retained EOFs was defined as the minimum number of components required for the cumulative explained variance to exceed 95%. Based on this criterion, 203 EOFs were retained (Figure S1 in Supplementary Materials). The corresponding PCA scores were subsequently used as the reduced-dimensional representation of the precipitation anomaly fields for the Weather Type classification.
2.4. Cluster Analysis
To reduce the dataset size of training while preserving the information of dominant modes of spatial precipitation variability, the database was defined by retained EOFs, which were used as input for an unsupervised classification procedure based on the K-means clustering algorithm to identify recurrent spatial precipitation configurations, here termed Weather Types (WTs) [14,16,30]. The optimal number of clusters was determined through the combined evaluation of four clustering performance metrics: the Calinski–Harabasz index, the Davies–Bouldin index [31], the Silhouette coefficient [32], and the elbow method based on within-cluster inertia [33].
The selection of the number of clusters was based on a joint assessment of clustering performance and the interpretability of the resulting spatial precipitation patterns (Figure S2). Although the Silhouette, Calinski–Harabasz, and Davies–Bouldin indices favored a two-cluster solution, the inertia curve showed a progressive reduction in within-cluster variability, with diminishing improvements beyond approximately four clusters. The four-cluster solution was therefore adopted as a compromise between statistical performance and the level of detail required to characterize precipitation variability across the basin. Compared with a two-cluster partition, this configuration allows for a more differentiated description of the precipitation patterns identified by the EOF–K-means framework, while avoiding the increasing complexity and reduced cluster separation associated with larger values of k. Consequently, four clusters were retained and interpreted as distinct precipitation Weather Types (WT0–WT3).
To increase the robustness of the classification, the K-means algorithm was executed 50 times using different random initializations. The classifiability index (CI) was calculated for each K-mean model, in which the best solutions exhibit the highest centroid stability and the lowest variability among runs was retained [16]. The CI is defined for 50 clusters in the algorithm with different initial random seeds, providing 50 final partitions (Pm(k), m = 1, …, 50). The similarity is estimated by averaging the values of , for all pairs (m,m′). The classifiability index c*(k), which depends on the number of clusters, is defined in Equation (1) [16]:
Cluster centroids were subsequently reconstructed in the original spatial domain to obtain composite precipitation patterns associated with each Weather Type.
Each day of the study period was assigned to one of the identified Weather Types, generating a continuous categorical time series of precipitation states. This classification was used to characterize the temporal variability of the identified regimes through frequency, persistence, and seasonal analyses. Daily occurrences, annual frequencies, and monthly distributions were computed for each Weather Type.
To assess changes in Weather Type occurrence during the recent period (2015–2025), the daily classifications obtained from the K-means model fitted to the complete 1981–2025 dataset were used. Accordingly, the occurrence frequencies for both the full record and the recent period were calculated using the same cluster centroids and Weather Type labels, ensuring that the comparisons refer to consistent precipitation regimes.
Additionally, a separate K-means classification was performed using only the 2015–2025 observations to examine the spatial consistency of the precipitation patterns identified in the full record. The resulting cluster centroids were reconstructed in the original spatial domain and visually compared with their full-period counterparts. This independent classification was used exclusively to assess the persistence of the general spatial structures and was not used to quantify changes in Weather Type occurrence frequencies.
2.5. Temporal Trend Analysis of Weather Type Occurrence
Monthly occurrence time series were constructed for each Weather Type by counting the number of days assigned to each regime within each calendar month to investigate long-term changes in the occurrence of the identified precipitation regimes.
Monotonic trends in these Weather Type frequency series were evaluated using Kendall’s rank correlation coefficient (τ) [34,35]. Trend estimates were expressed as changes in the monthly number of occurrence days per decade. Annual occurrence frequencies were calculated separately to characterize interannual variability. Statistical significance was assessed using a two-sided hypothesis test, with the null hypothesis indicating the absence of a monotonic association. Trends were considered statistically significant at a significance level of α = 0.05.
The magnitude of the trends was estimated using Sen’s slope [34,36], a non-parametric estimator calculated as the median of all pairwise slopes between monthly observations. The corresponding 95% confidence intervals were also estimated to quantify uncertainty in the trend magnitude.
To further characterize the temporal organization of precipitation regimes, the burstiness index (B) was calculated from the time intervals between successive occurrences of each Weather Type using Equation (2) [37]:
where μΔt and σΔt represent the mean and standard deviation of the inter-occurrence intervals, respectively. The index ranges from −1 to 1, with negative values indicating relatively regular recurrence, values close to zero indicating approximately random recurrence, and positive values indicating increasingly irregular or clustered occurrence. Annual burstiness values were calculated separately for each Weather Type to characterize interannual changes in temporal recurrence. Monotonic trends in the resulting annual series were evaluated using Kendall’s rank correlation coefficient and Sen’s slope estimator, following the same statistical framework applied to Weather Type occurrence frequencies.
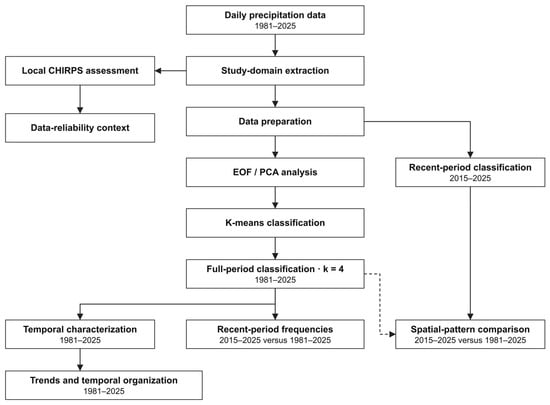
The overall methodological workflow is summarized in Figure 2.
Figure 2.
Methodological workflow for precipitation Weather Type identification and temporal analysis in the Upper Pastaza River Basin. The lateral branch evaluates local CHIRPS performance. Recent-period frequency comparisons use the full-period classification, whereas the separate recent-period classification is used only for qualitative spatial comparison.
3. Results and Discussion
3.1. Evaluation of CHIRPS Precipitation Estimates
The performance of CHIRPS was evaluated against ground-based precipitation observations from three meteorological stations located in the Upper Pastaza River Basin: Riobamba, Lagunas de Atillo, and Baños. The monthly comparison revealed statistically significant positive correlations at all three stations, although the strength of the association varied spatially.
The highest Spearman correlation was obtained at Riobamba (rs = 0.78, p < 0.001), followed by Baños (rs = 0.71, p < 0.001) and Lagunas de Atillo (rs = 0.46, p = 0.0378) (Figure S3). These results indicate that CHIRPS captures a substantial component of the observed monthly precipitation variability at Riobamba and Baños, whereas its performance is comparatively weaker at Lagunas de Atillo.
The mean bias error (MBE) was negative at all evaluated stations, with values of −4.30, −39.71, and −56.03 mm month−1 at Riobamba, Lagunas de Atillo, and Baños, respectively. These results indicate a systematic mean underestimation of monthly precipitation by CHIRPS during the respective validation periods, with the largest absolute biases observed at Baños and Lagunas de Atillo.
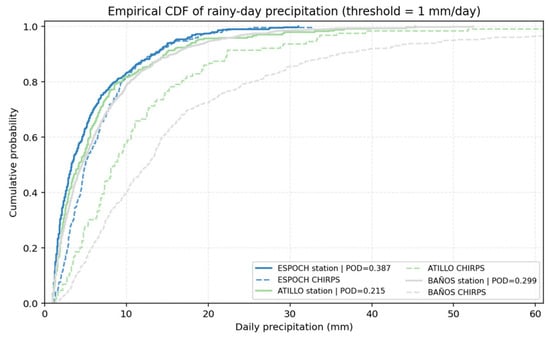
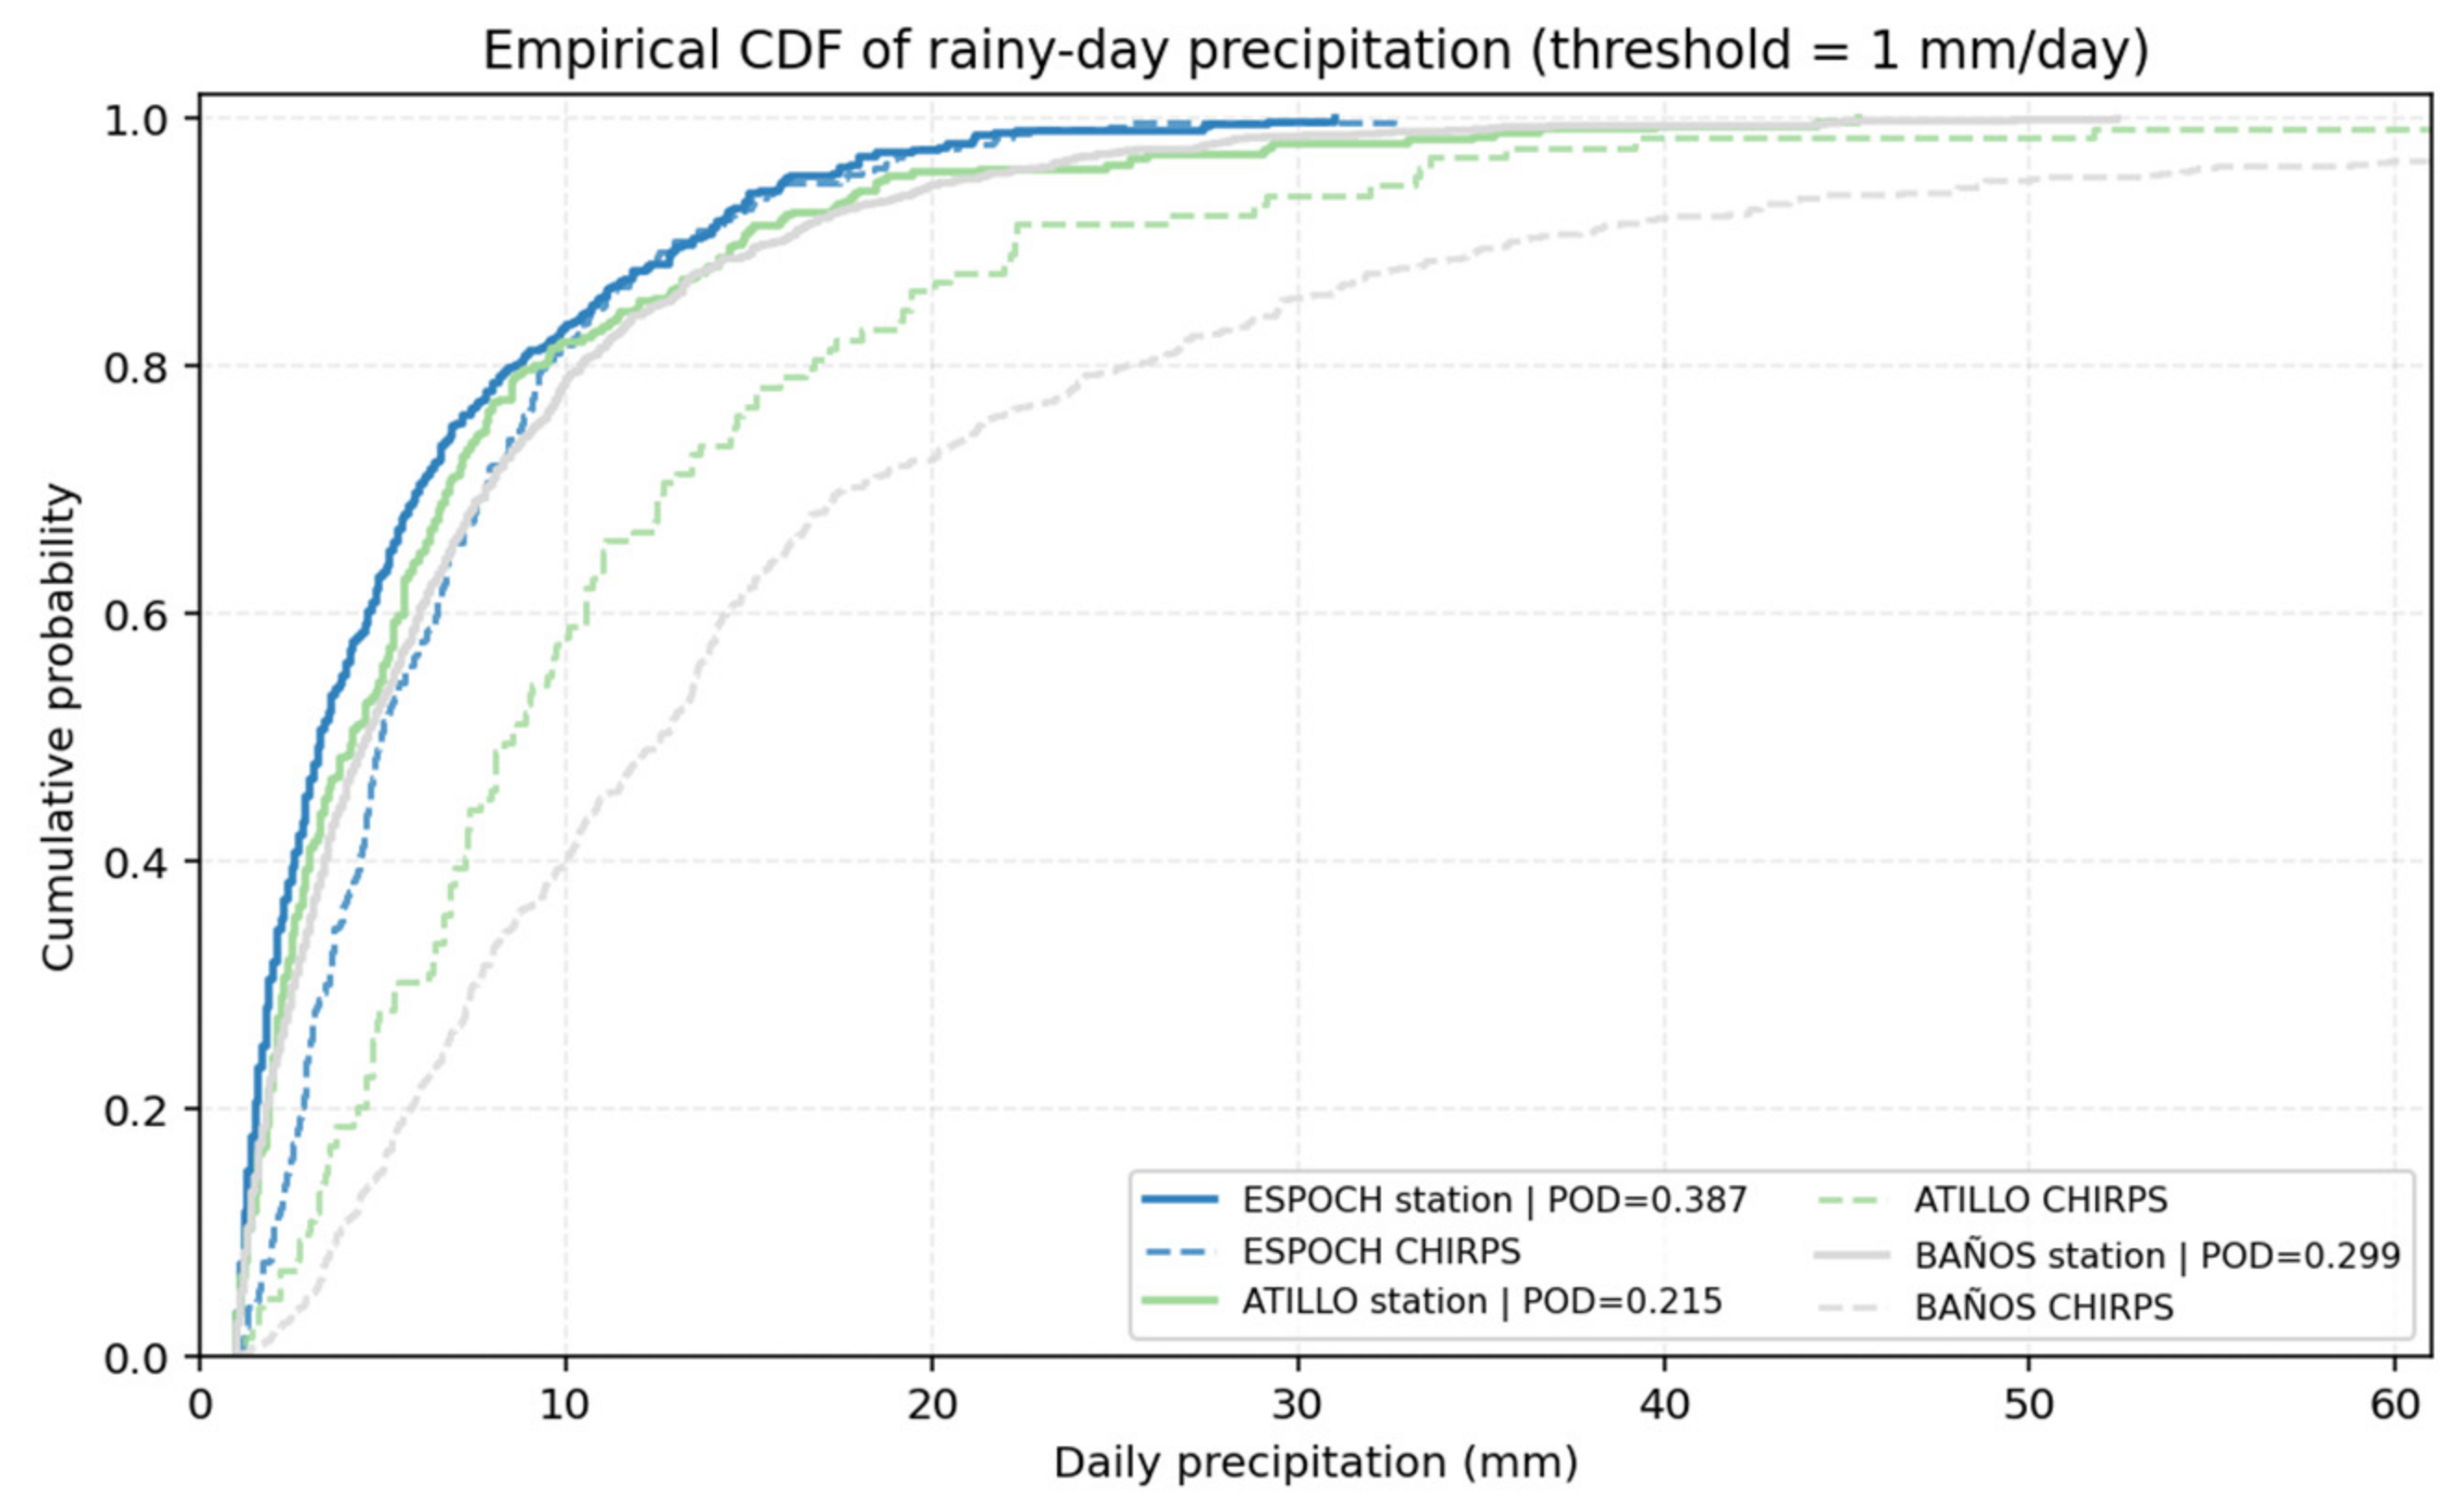
At the daily scale, CHIRPS performance was further evaluated through rainfall occurrence detection and the empirical cumulative distribution of precipitation amounts (Figure 3). The empirical cumulative distribution functions of rainy-day precipitation (threshold ≥ 1 mm day−1) revealed differences between the observed and CHIRPS-derived precipitation distributions. At Riobamba, the observed and CHIRPS-derived distributions exhibit relatively similar behavior, although CHIRPS shows a slight shift toward higher precipitation amounts. In contrast, more pronounced discrepancies are observed at Lagunas de Atillo and Baños, where the CHIRPS distributions are systematically shifted toward higher precipitation intensities compared with station observations. These differences are particularly evident at BAÑOS, suggesting that CHIRPS tends to overestimate the intensity of precipitation on days classified as rainy, despite its limited ability to detect rainfall occurrence.
Figure 3.
Empirical cumulative distribution functions (ECDFs) of daily precipitation for rainy days (≥1 mm day−1) at the Riobamba, Lagunas de Atillo, and Baños meteorological stations and their corresponding CHIRPS estimates. Solid lines represent ground-based observations, while dashed lines represent CHIRPS estimates. Colors distinguish the three meteorological stations. The probability of detection (POD) indicates the proportion of observed rainy days correctly identified by CHIRPS using the same precipitation threshold (≥1 mm day−1).
These findings indicate that CHIRPS performance varies across the study region, with uncertainties affecting both rainfall occurrence and the distribution of daily precipitation intensities. Such uncertainties should be considered when interpreting the spatial patterns, occurrence frequencies, and precipitation intensities associated with the identified precipitation regimes.
3.2. Dominant Precipitation Regimes over the Upper Pastaza Basin
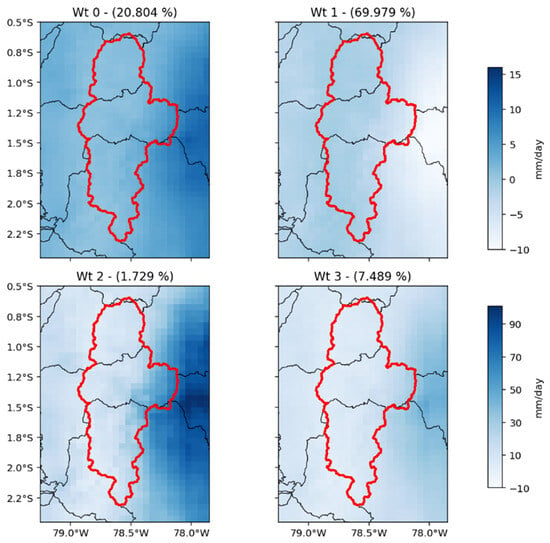
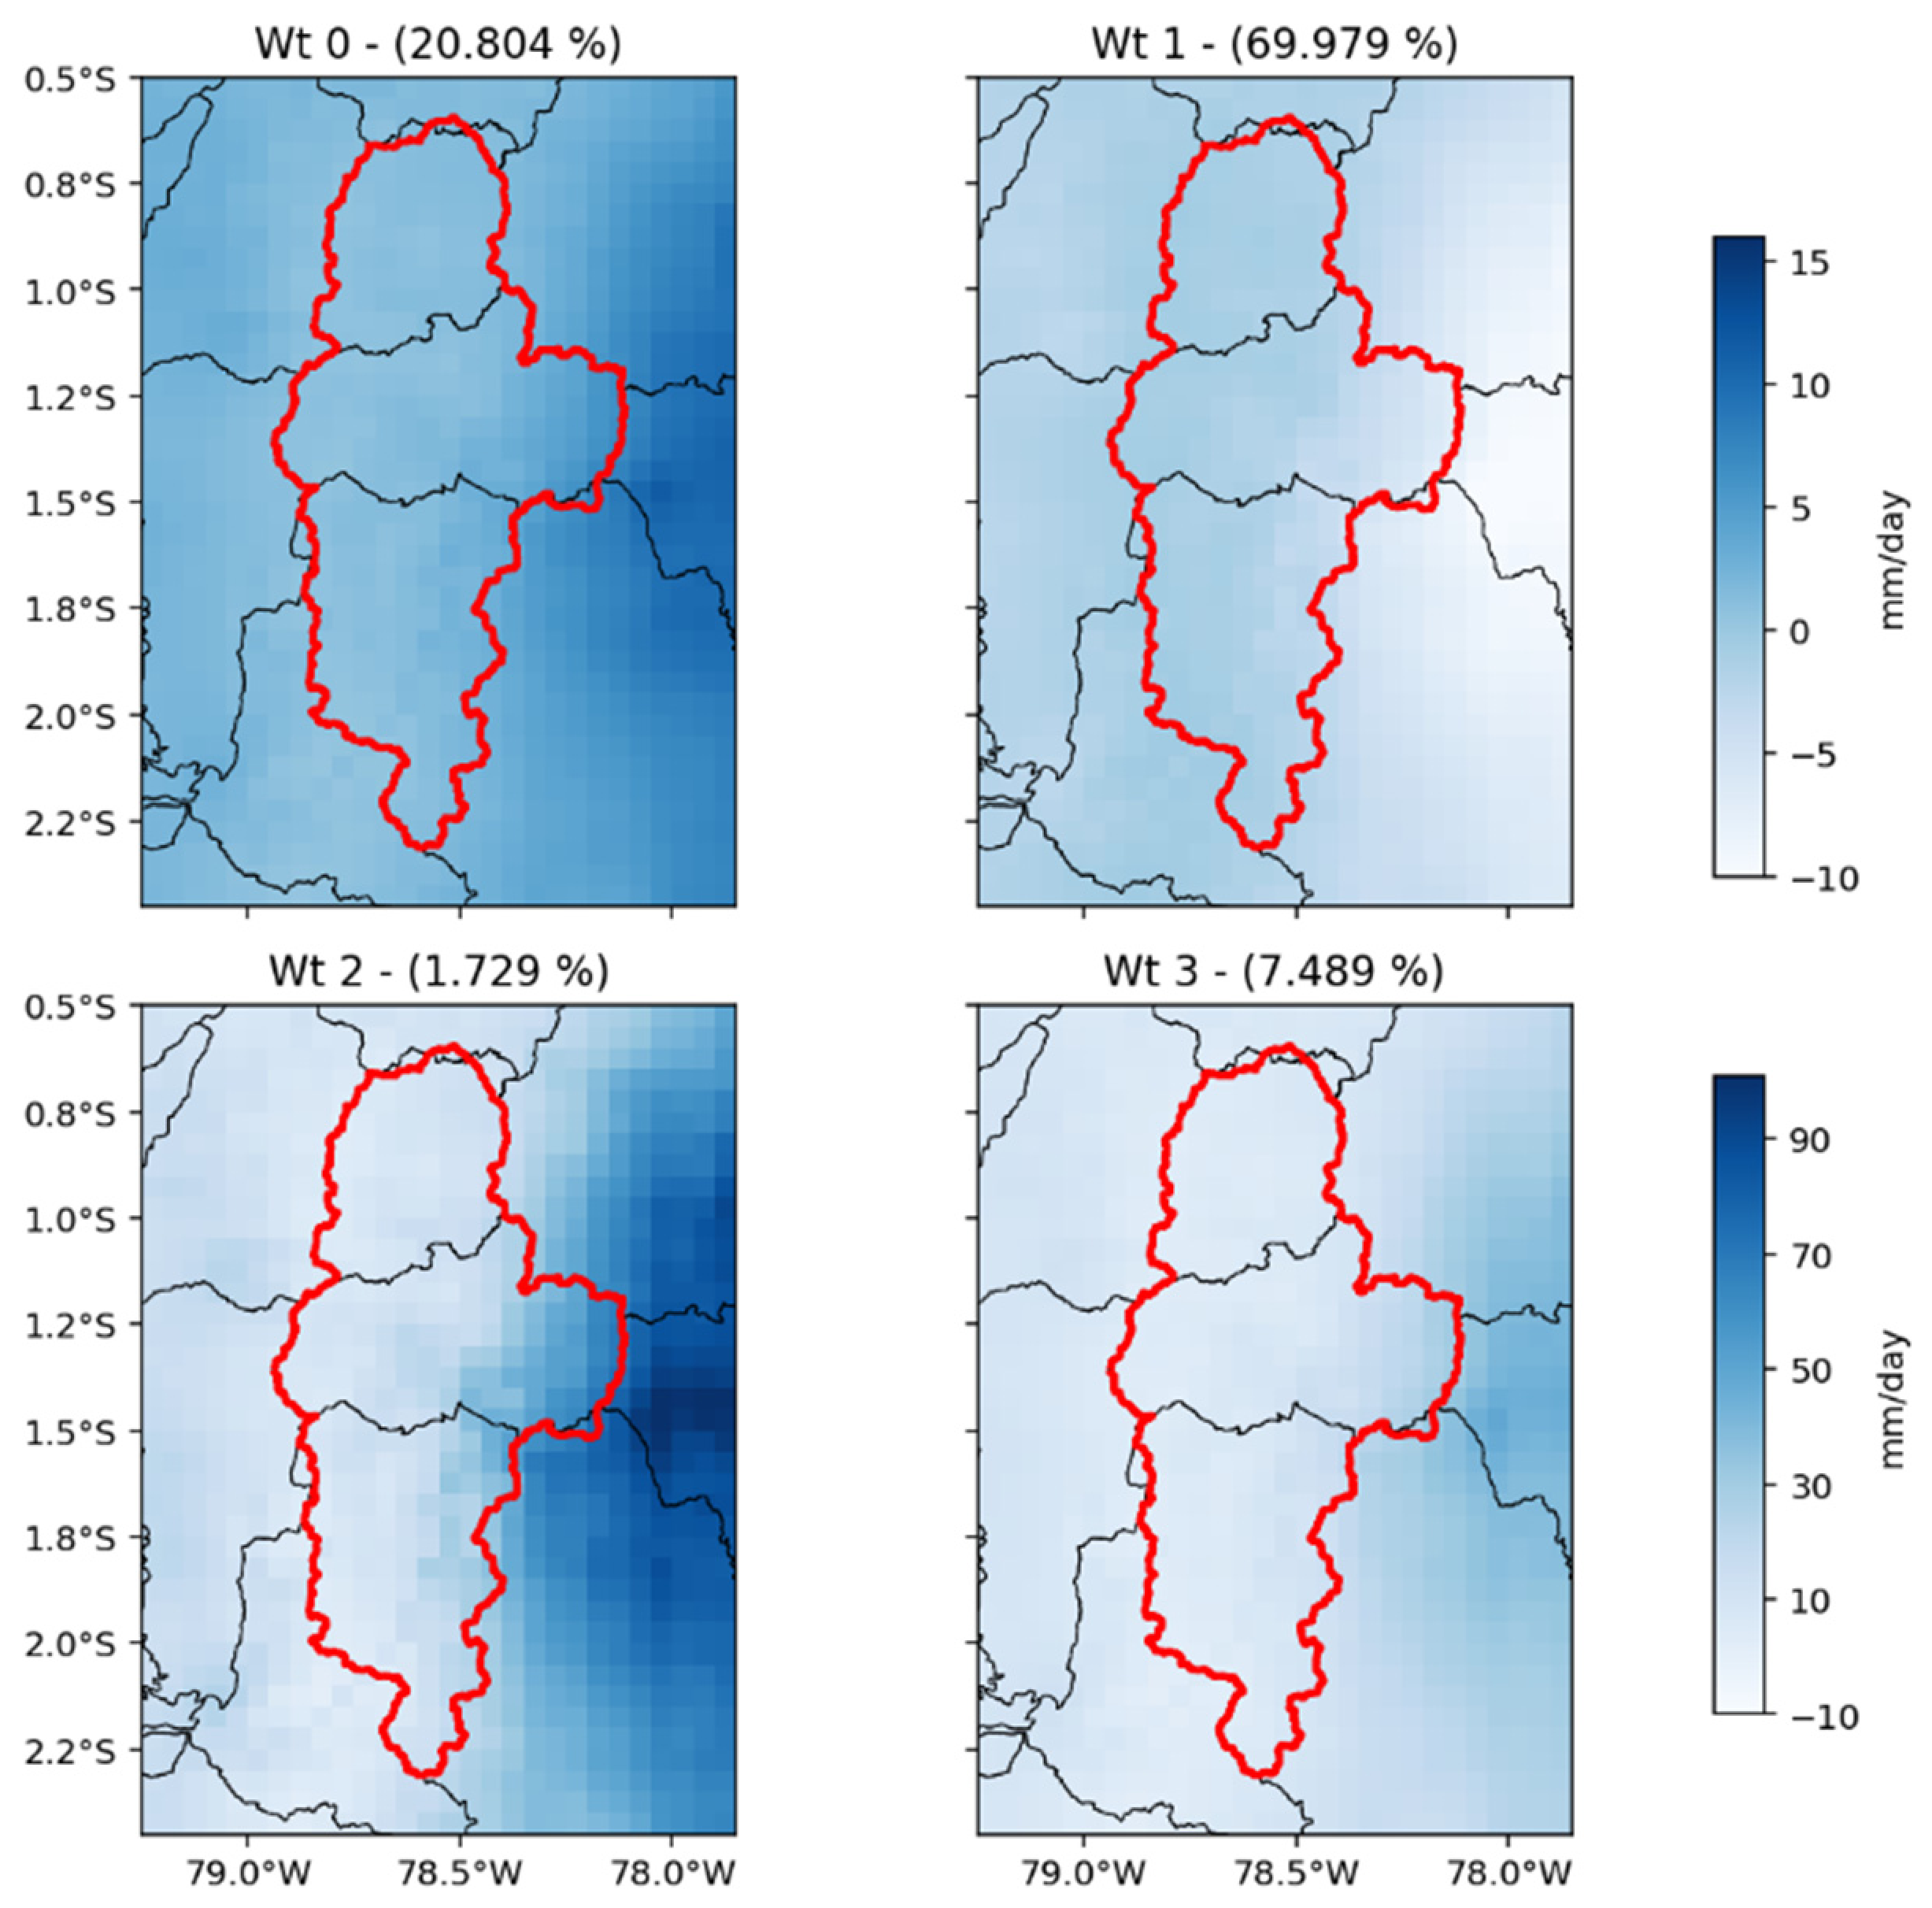
The application of the K-means classification over the reduced EOF space identified four recurrent precipitation regimes over the Upper Pastaza River Basin (Figure 4). These regimes represent the dominant spatial organization of precipitation during the 1981–2025 period and reveal important differences in both rainfall intensity and spatial distribution across the basin.
Figure 4.
Dominant precipitation regimes identified from daily CHIRPS precipitation fields (1981–2025).
A clear contrast is observed between the most frequent precipitation regime (WT1) and the remaining weather types. WT1 accounts for approximately 70% of the classified days and is characterized by relatively low precipitation amounts distributed over most of the basin. The absence of localized precipitation maxima suggests that WT1 represents the background rainfall conditions that dominate the climatology of the basin.
WT0 and WT3 account for 20.8% and 7.5% of classified days, respectively, and exhibit stronger precipitation activity toward the eastern slopes. This spatial contrast agrees qualitatively with the station-based climatology of Laraque et al. [2] for the Ecuadorian Amazon during 1965–1994. Within the broader Pastaza basin, that study reported mean annual rainfall of 436 mm at Riobamba Aeropuerto and 4507 mm at Puyo, illustrating the contrast between sheltered inter-Andean valleys and wetter eastern sectors. Our daily WT composites describe recurrent expressions of this spatial heterogeneity. However, station climatologies and gridded daily composites represent different spatial supports and time scales; their agreement provides regional context rather than a direct validation of WT intensities or frequencies.
WT2 represents the least frequent regime, accounting for only 1.7% of the observations. However, this weather type exhibits the highest precipitation intensities of all identified regimes. A well-defined precipitation core is observed over the central and eastern sectors of the basin, indicating the occurrence of particularly active rainfall conditions. Similar behavior has been documented throughout tropical mountain regions, where a relatively small number of extreme rainfall events contributes disproportionately to total annual precipitation and hydrological extremes [15,35]. Consequently, WT2 may play a critical role in flood generation, sediment transport, and hydrological recharge within the Upper Pastaza Basin.
An interesting feature is the gradual transition observed from WT1 to WT2. Rather than representing completely independent rainfall structures, the four weather types appear to define different levels of precipitation activity. This behavior suggests that precipitation variability in the Upper Pastaza Basin may be controlled by changes in moisture availability and atmospheric circulation intensity rather than by fundamentally different precipitation-generating mechanisms.
Overall, the identified weather types reveal that precipitation in the basin is organized around a dominant low-intensity regime and a series of less frequent but progressively wetter states. This result is consistent with the strong spatial heterogeneity commonly observed in the Andes–Amazon transition region, where local topography interacts with regional moisture transport to produce complex precipitation patterns.
Previous clustering studies in Ecuador provide complementary perspectives. Tobar and Wyseure [38] classified seasonal rainfall patterns using monthly records from 319 stations during 1982–2011, identifying four geographically organized groups. Ruiz-Hernández et al. [39] used records from 80 stations during 2014–2019 to identify four groups of diurnal rainfall cycles across the Guayllabamba–Napo transition, with contrasting seasonal behavior. Those studies group stations according to their rainfall climatology, whereas the present analysis groups days according to basin-wide precipitation anomaly configurations. Our contribution is therefore the characterization of recurrent daily states and their changing occurrence within a consistently delineated catchment. The occurrence of four groups in previous studies does not independently validate our choice of k = 4 or imply equivalence between their groups and WT0–WT3.
3.3. Seasonal Occurrence of the Precipitation Regimes
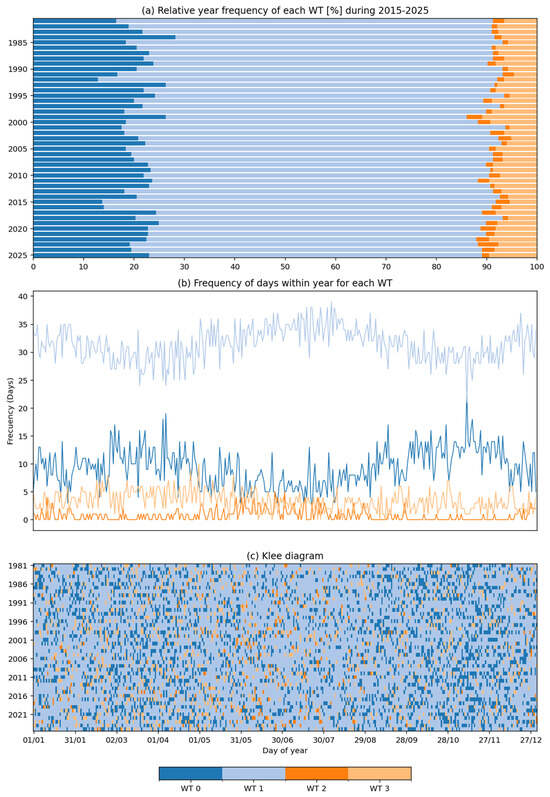
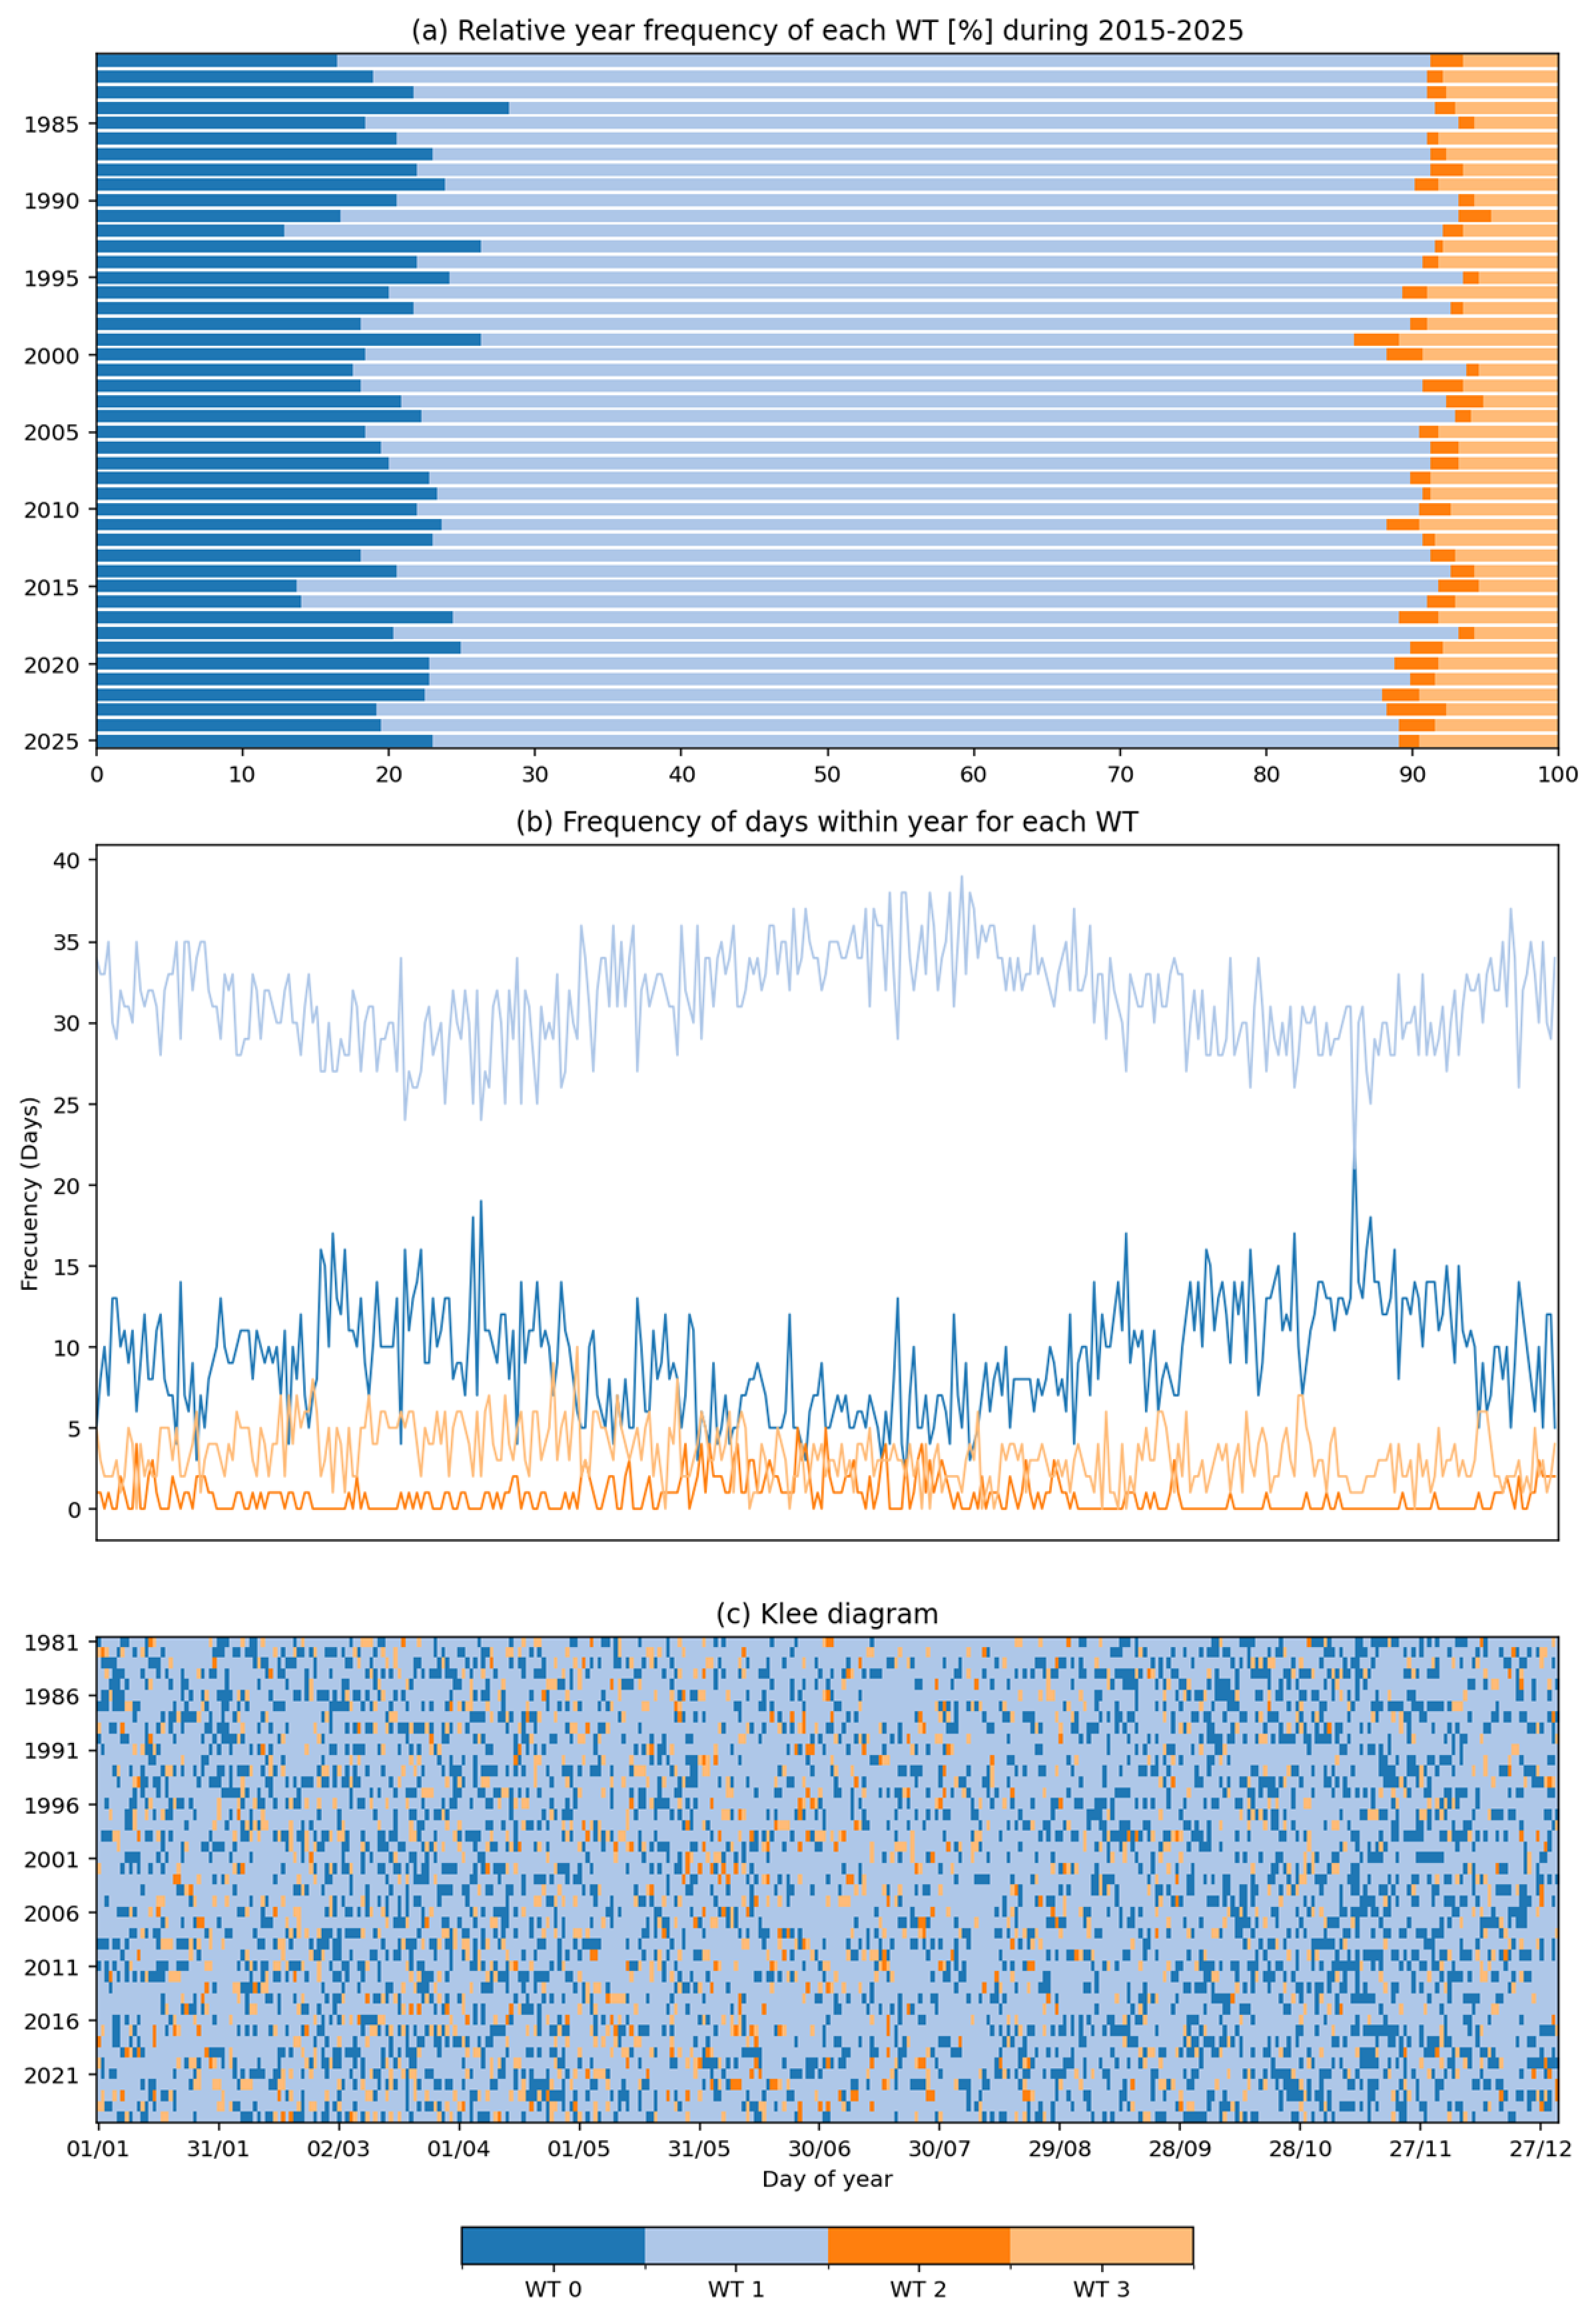
The annual cycle of occurrence exhibits clear differences among the four weather types (Figure 5a). WT1 remains the dominant regime during most of the year, although its frequency is not completely uniform. Moderate variations can be observed between seasons, indicating that even the most common precipitation state responds to seasonal atmospheric forcing.
Figure 5.
(a) Relative frequency of the occurrence of identified WTs from each year (1981–2025). (b) Absolute occupation frequency within year (days). Frequencies in panel (a) are percentages; occurrence counts in panel (b) are in days. (c) Klee diagram sketching the daily distribution of WTs during 1981–2025.
WT0 exhibits temporal variability in occurrence. Its relationship with the seasonal rainfall cycle is interpreted qualitatively because monthly WT frequencies and a formal comparison of seasonal amplitudes are not reported here. The regional precipitation climatology provides context for this interpretation [2]. Accordingly, the available occurrence diagrams are not used to rank WT0 as having the strongest seasonal signal.
WT3 remains relatively uncommon during all seasons and does not exhibit a marked annual cycle. Conversely, WT2 shows a distinct seasonal concentration. Although rare, the most intense precipitation regime tends to occur preferentially during certain months, indicating that favorable atmospheric conditions are required for its development.
In regional rainfall climatology, unimodal and bimodal regimes denote annual cycles with one and two rainfall maxima, respectively. Their distribution varies across the Ecuadorian Andes–Amazon transition, including marked bimodality in high intra-Andean basins [2]. These classifications of rainfall totals differ from the present WT framework, which describes spatial precipitation configurations and their occurrence. A quantitative correspondence between WT frequencies and the regional seasonal rainfall cycle has not been established here.
In general, the results suggest that the seasonal cycle of precipitation in the Upper Pastaza Basin is not only associated with changes in rainfall amounts but also with changes in the frequency of occurrence of specific precipitation regimes. Such behavior highlights the importance of considering classifications of spatial precipitation patterns when analyzing precipitation variability in complex mountain environments.
3.4. Temporal Variability of Precipitation Regimes During 1981–2025
The temporal distribution of the weather types shows a persistent dominance of WT1 throughout the entire study period (Figure 5b,c). This regime remains present during most years and represents the prevailing hydroclimatic state of the Upper Pastaza Basin.
The occurrence diagram reveals substantial interannual variability in the relative frequency of WT0 and WT3. Several years are characterized by an increased presence of WT0, indicating periods with more widespread precipitation activity. In contrast, WT2 appears only sporadically, confirming that the most intense precipitation conditions occur during relatively short intervals.
The annual frequency analysis further highlights the predominance of WT1. In most years, this regime occupies more than half of all classified days. WT0 constitutes the second most important weather type and exhibits moderate year-to-year fluctuations. WT3 remains comparatively rare, while WT2 is observed only during specific periods.
Despite the long-term persistence of WT1, the temporal evolution of the classification suggests that the contribution of the wetter regimes is not constant through time. Some periods display a larger occurrence of WT0 and WT2, indicating years characterized by enhanced precipitation activity. Similar fluctuations have been reported in other sectors of the tropical Andes and western Amazonia, where precipitation variability is influenced by large-scale atmospheric circulation and moisture transport anomalies [1,22].
The temporal behavior of the weather types also indicates that precipitation variability in the basin is organized around recurrent spatial precipitation configurations rather than isolated events. This characteristic suggests that the identified regimes capture meaningful modes of hydroclimatic variability and provide a useful framework for describing long-term precipitation organization within the basin.
Kendall’s τ and Sen’s slope were used to evaluate temporal trends in Weather Type occurrence frequency and burstiness during 1981–2025 (Table 1). Trend analysis identified a statistically significant positive trend for WT2 (Kendall’s τ = 0.3830, p = 0.0002), with a Sen’s slope of 0.0124 occurrence days per decade (95% CI: 0.0071–0.1802). In contrast, no statistically significant trends were detected for WT0 (τ = 0.0000, p = 1.0000), WT1 (τ = 0.0061, p = 0.9532), or WT3 (τ = 0.0869, p = 0.4002). These results indicate that the increasing occurrence of WT2 represents the only statistically supported monotonic change among the four precipitation regimes.
Table 1.
Kendall’s rank correlation and Sen’s slope estimates for (a) temporal trends in Weather Type occurrence and (b) burstiness index. For both tables statistically significant trends at the 5% level are highlighted in bold.
Although differences in the relative occurrence of the Weather Types were observed between the complete study period and the recent period, these differences should not necessarily be interpreted as evidence of systematic changes. In particular, the apparent decrease in WT1 occurrence during the recent period was not supported by a statistically significant monotonic trend.
The results therefore suggest that long-term changes in the occurrence of precipitation regimes are primarily associated with WT2, rather than a generalized shift in the frequencies of all four Weather Types. Nevertheless, the interpretation of this change should consider the low occurrence frequency of WT2 and the potential influence of interannual variability.
3.5. Precipitation Regime Variability During the Recent Period (2015–2025)
The temporal analysis of Weather Type occurrence and recurrence revealed variations in the organization of precipitation regimes throughout the study period. In particular, WT2 exhibited a positive trend in its burstiness index (Kendall’s τ = 0.2672, p = 0.0132), suggesting changes in the temporal distribution of this relatively infrequent precipitation regime (Figure S4). Together with the statistically significant increase in WT2 occurrence frequency (τ = 0.3830, p = 0.0002), these findings motivated a more detailed examination of precipitation regime variability during the recent period (2015–2025). This interval was selected as an exploratory comparison window rather than as a statistically identified change-point period.
To ensure comparability between periods, Weather Type occurrence frequencies were calculated using the daily classifications obtained from the K-means model fitted to the complete 1981–2025 dataset. Consequently, the same cluster centroids and Weather Type definitions were maintained for both the full record and the recent period, allowing differences in occurrence frequency to be evaluated without introducing changes associated with independent cluster fitting.
Under this common classification framework, WT1 remained the dominant precipitation regime, accounting for approximately 70% of classified days in the complete record and approximately 68% during 2015–2025. The remaining regimes exhibited modest increases in their relative occurrence frequencies. However, these differences should be interpreted as descriptive changes in the distribution of Weather Type occurrence rather than conclusive evidence of systematic shifts. In particular, the apparent decrease in WT1 was not supported by a statistically significant monotonic trend (Kendall’s τ = 0.0061, p = 0.9532). In contrast, the significant positive trend identified for WT2 provides stronger statistical evidence of an increase in the occurrence of this relatively infrequent and intense precipitation regime.
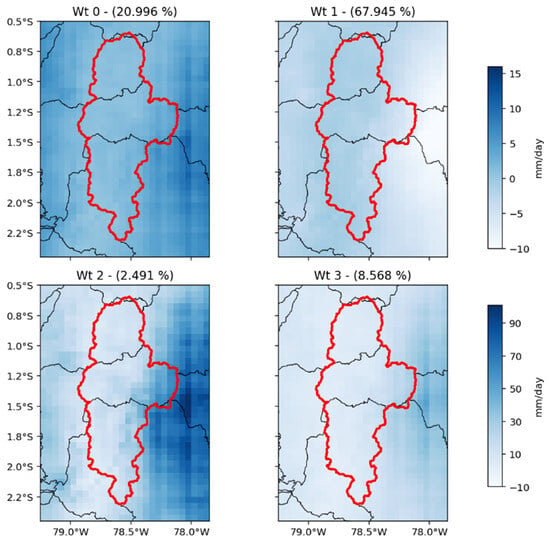
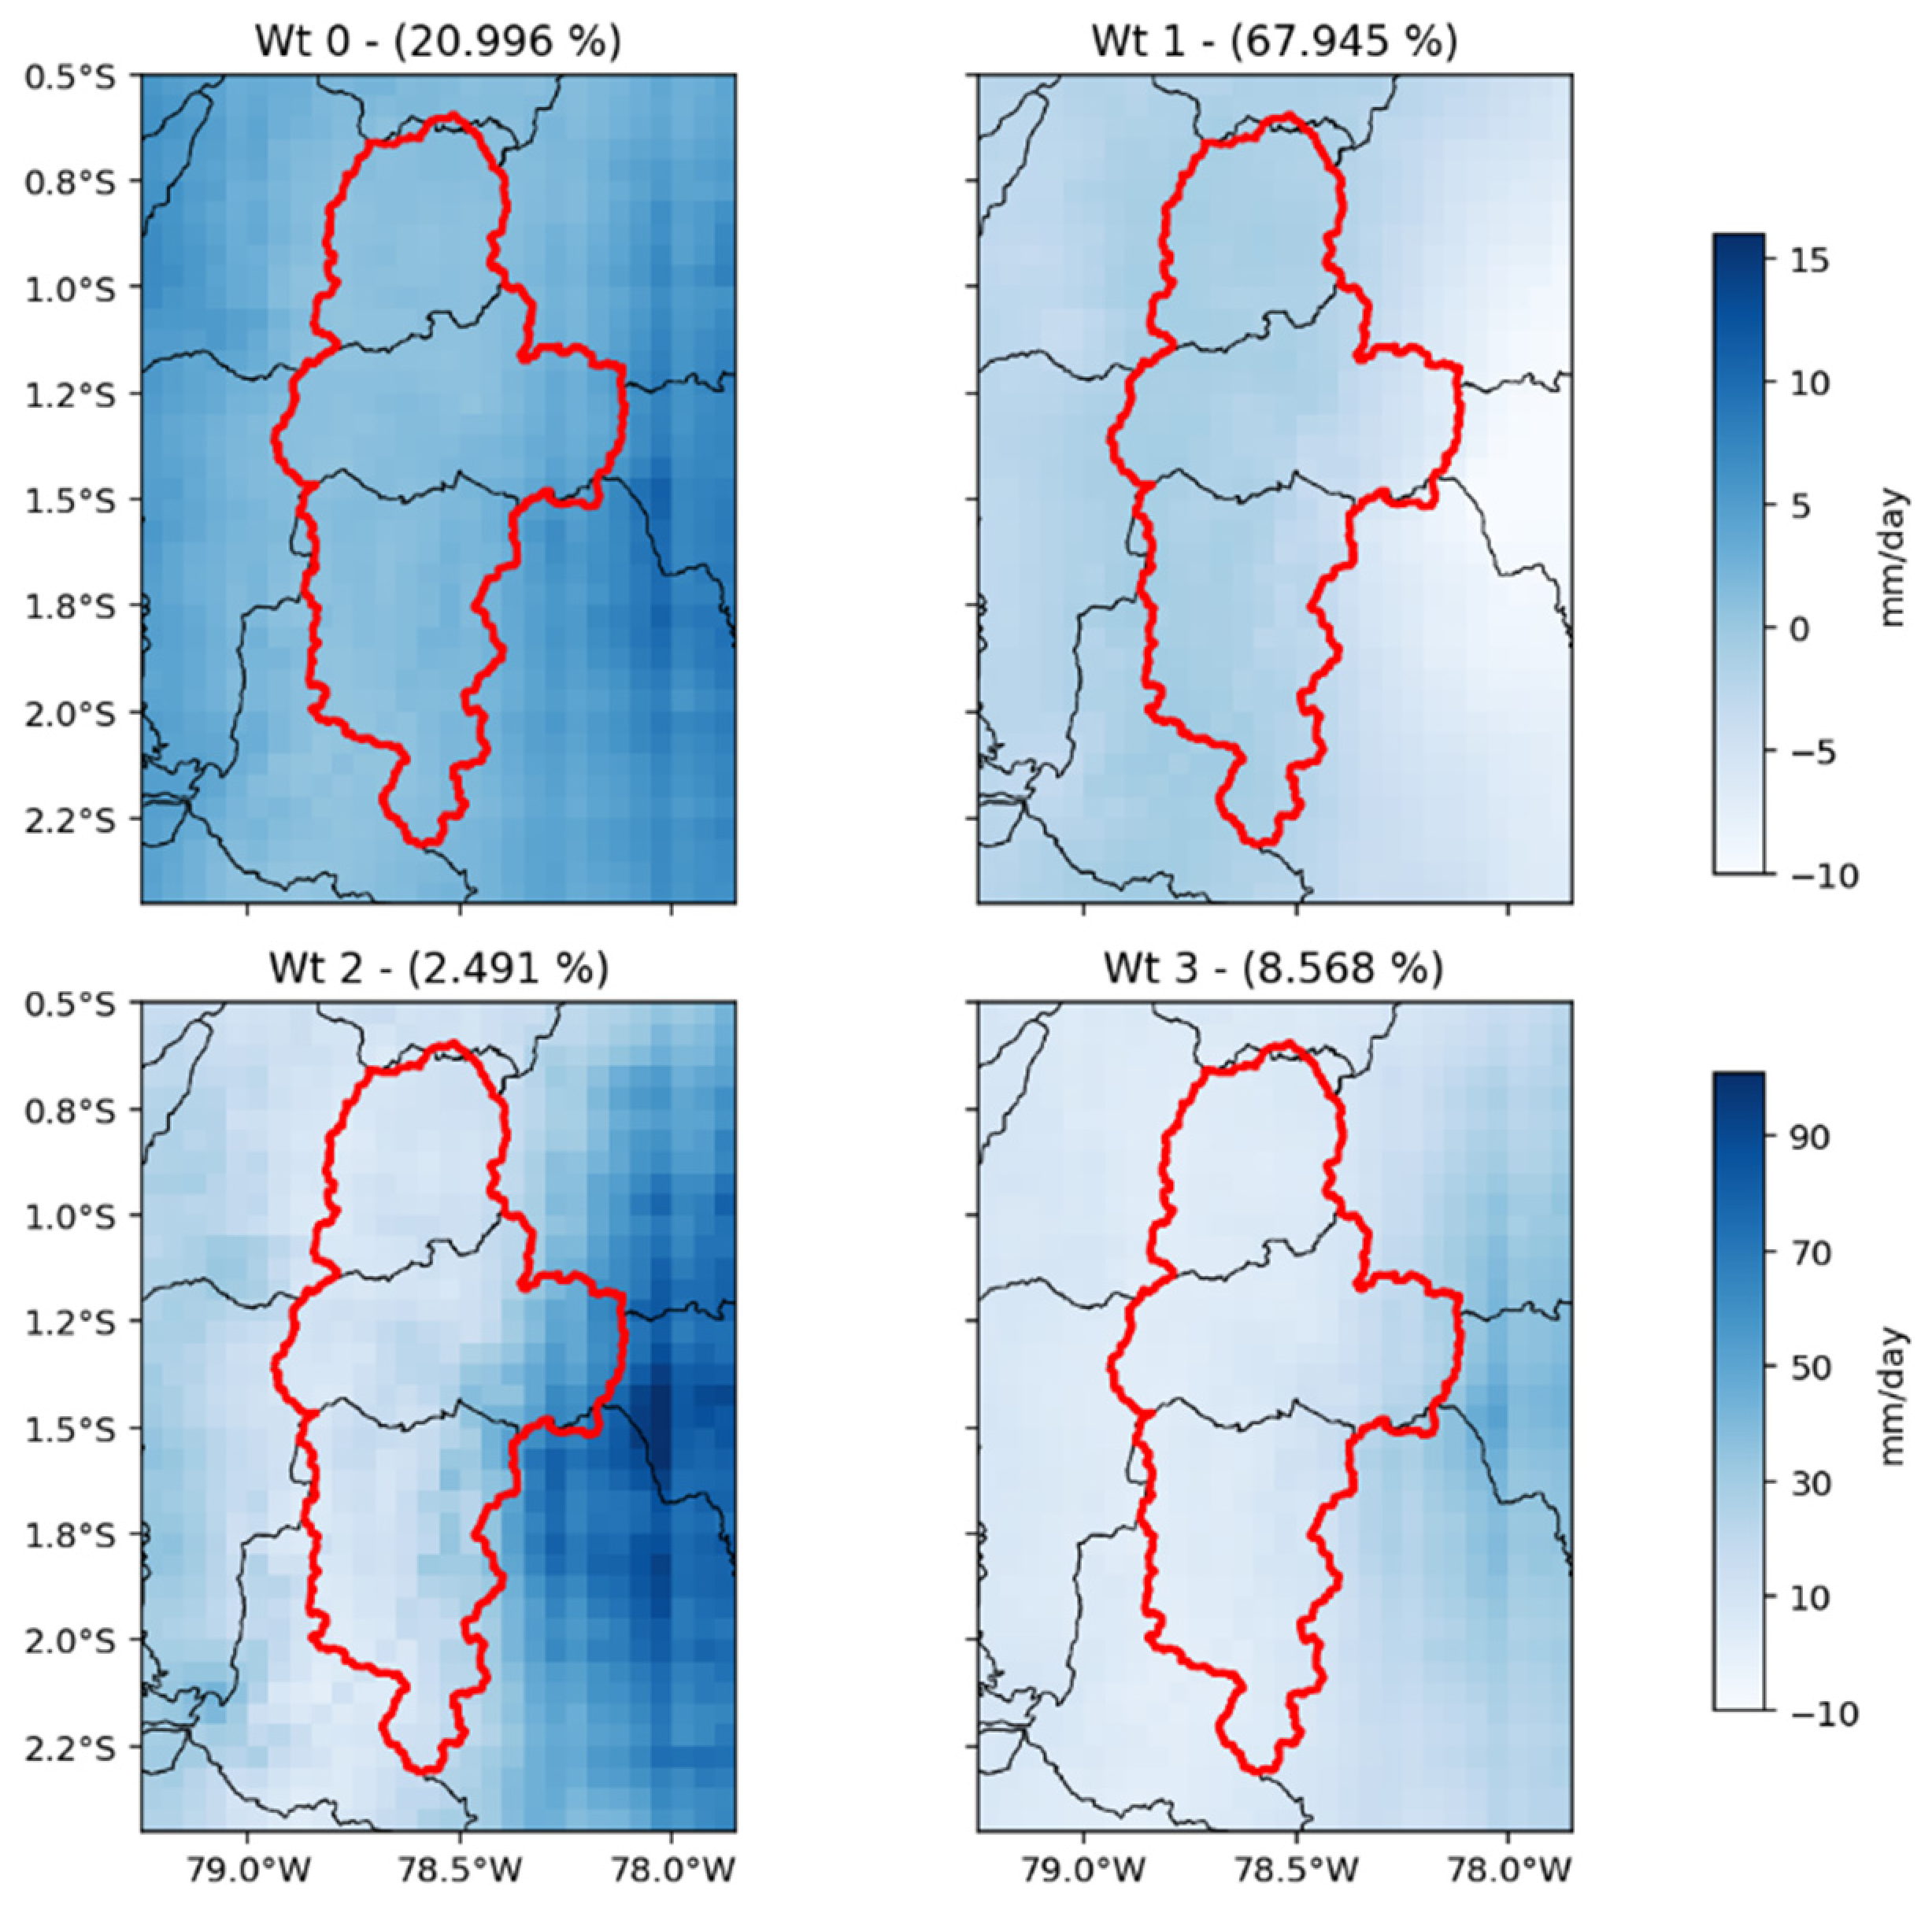
To examine whether the spatial structures of the precipitation regimes remained consistent during the recent period, an independent K-means classification was performed using only the 2015–2025 observations (Figure 6). The resulting precipitation patterns exhibited broadly similar spatial distributions to those obtained from the full-period classification (Figure 4), particularly in the location of precipitation maxima and the contrast between the inter-Andean valleys and the eastern Andean slopes. This comparison suggests that the main spatial characteristics of the identified precipitation regimes remained recognizable during the recent period. Importantly, the independently fitted classification shown in Figure 6 was used only to evaluate spatial consistency; its cluster frequencies were not used to quantify changes in regime occurrence between periods.
Figure 6.
Spatial precipitation patterns obtained from an independent EOF–K-means classification of daily CHIRPS precipitation during the recent period (2015–2025). The patterns are presented to assess the qualitative spatial consistency of the precipitation regimes identified from the complete 1981–2025 record (Figure 4). The relative frequencies displayed in this figure correspond to the independently fitted recent-period classification and were not used to quantify changes in Weather Type occurrence between periods.
The positive trend in WT2 occurrence should be distinguished from changes in rainfall totals or seasonal climatology. In Ecuador, Tobar and Wyseure [38] reported decreasing monthly rainfall trends in September–October and increasing trends in February–April. Their contrasting seasonal changes show why a country-wide or year-round wetting interpretation would be inappropriate. Our result concerns the frequency of a particular daily precipitation configuration, rather than an increase in rainfall totals across all months. Together with the broadly similar recent-period composites in Figure 6, it supports an interpretation centered on occurrence changes within recognizable spatial structures.
Regional studies also differ in geographical scope and attribution. Segura et al. [1] identified increasing December–February precipitation over the southern tropical Andes (12–20° S) and linked it to circulation changes using atmospheric data. This offers a possible regional mechanism to investigate, but does not establish the cause of WT2 changes in equatorial Ecuador. Thielen et al. [15] likewise demonstrated that extreme El Niño rainfall anomalies vary with event type and elevation; our WT2 events have not been attributed to ENSO. Conversely, the Amazonian drought studies [40,41] provide a contrasting hydroclimatic context, not direct confirmation of wetter conditions in Upper Pastaza. These differences in variable, period, and domain limit direct comparisons of trend magnitude.
3.6. Evolution of the Most Intense Precipitation Regime
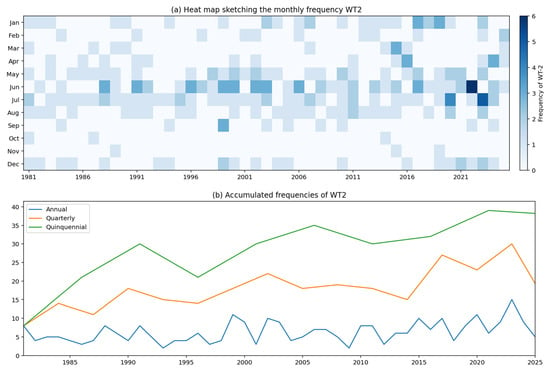
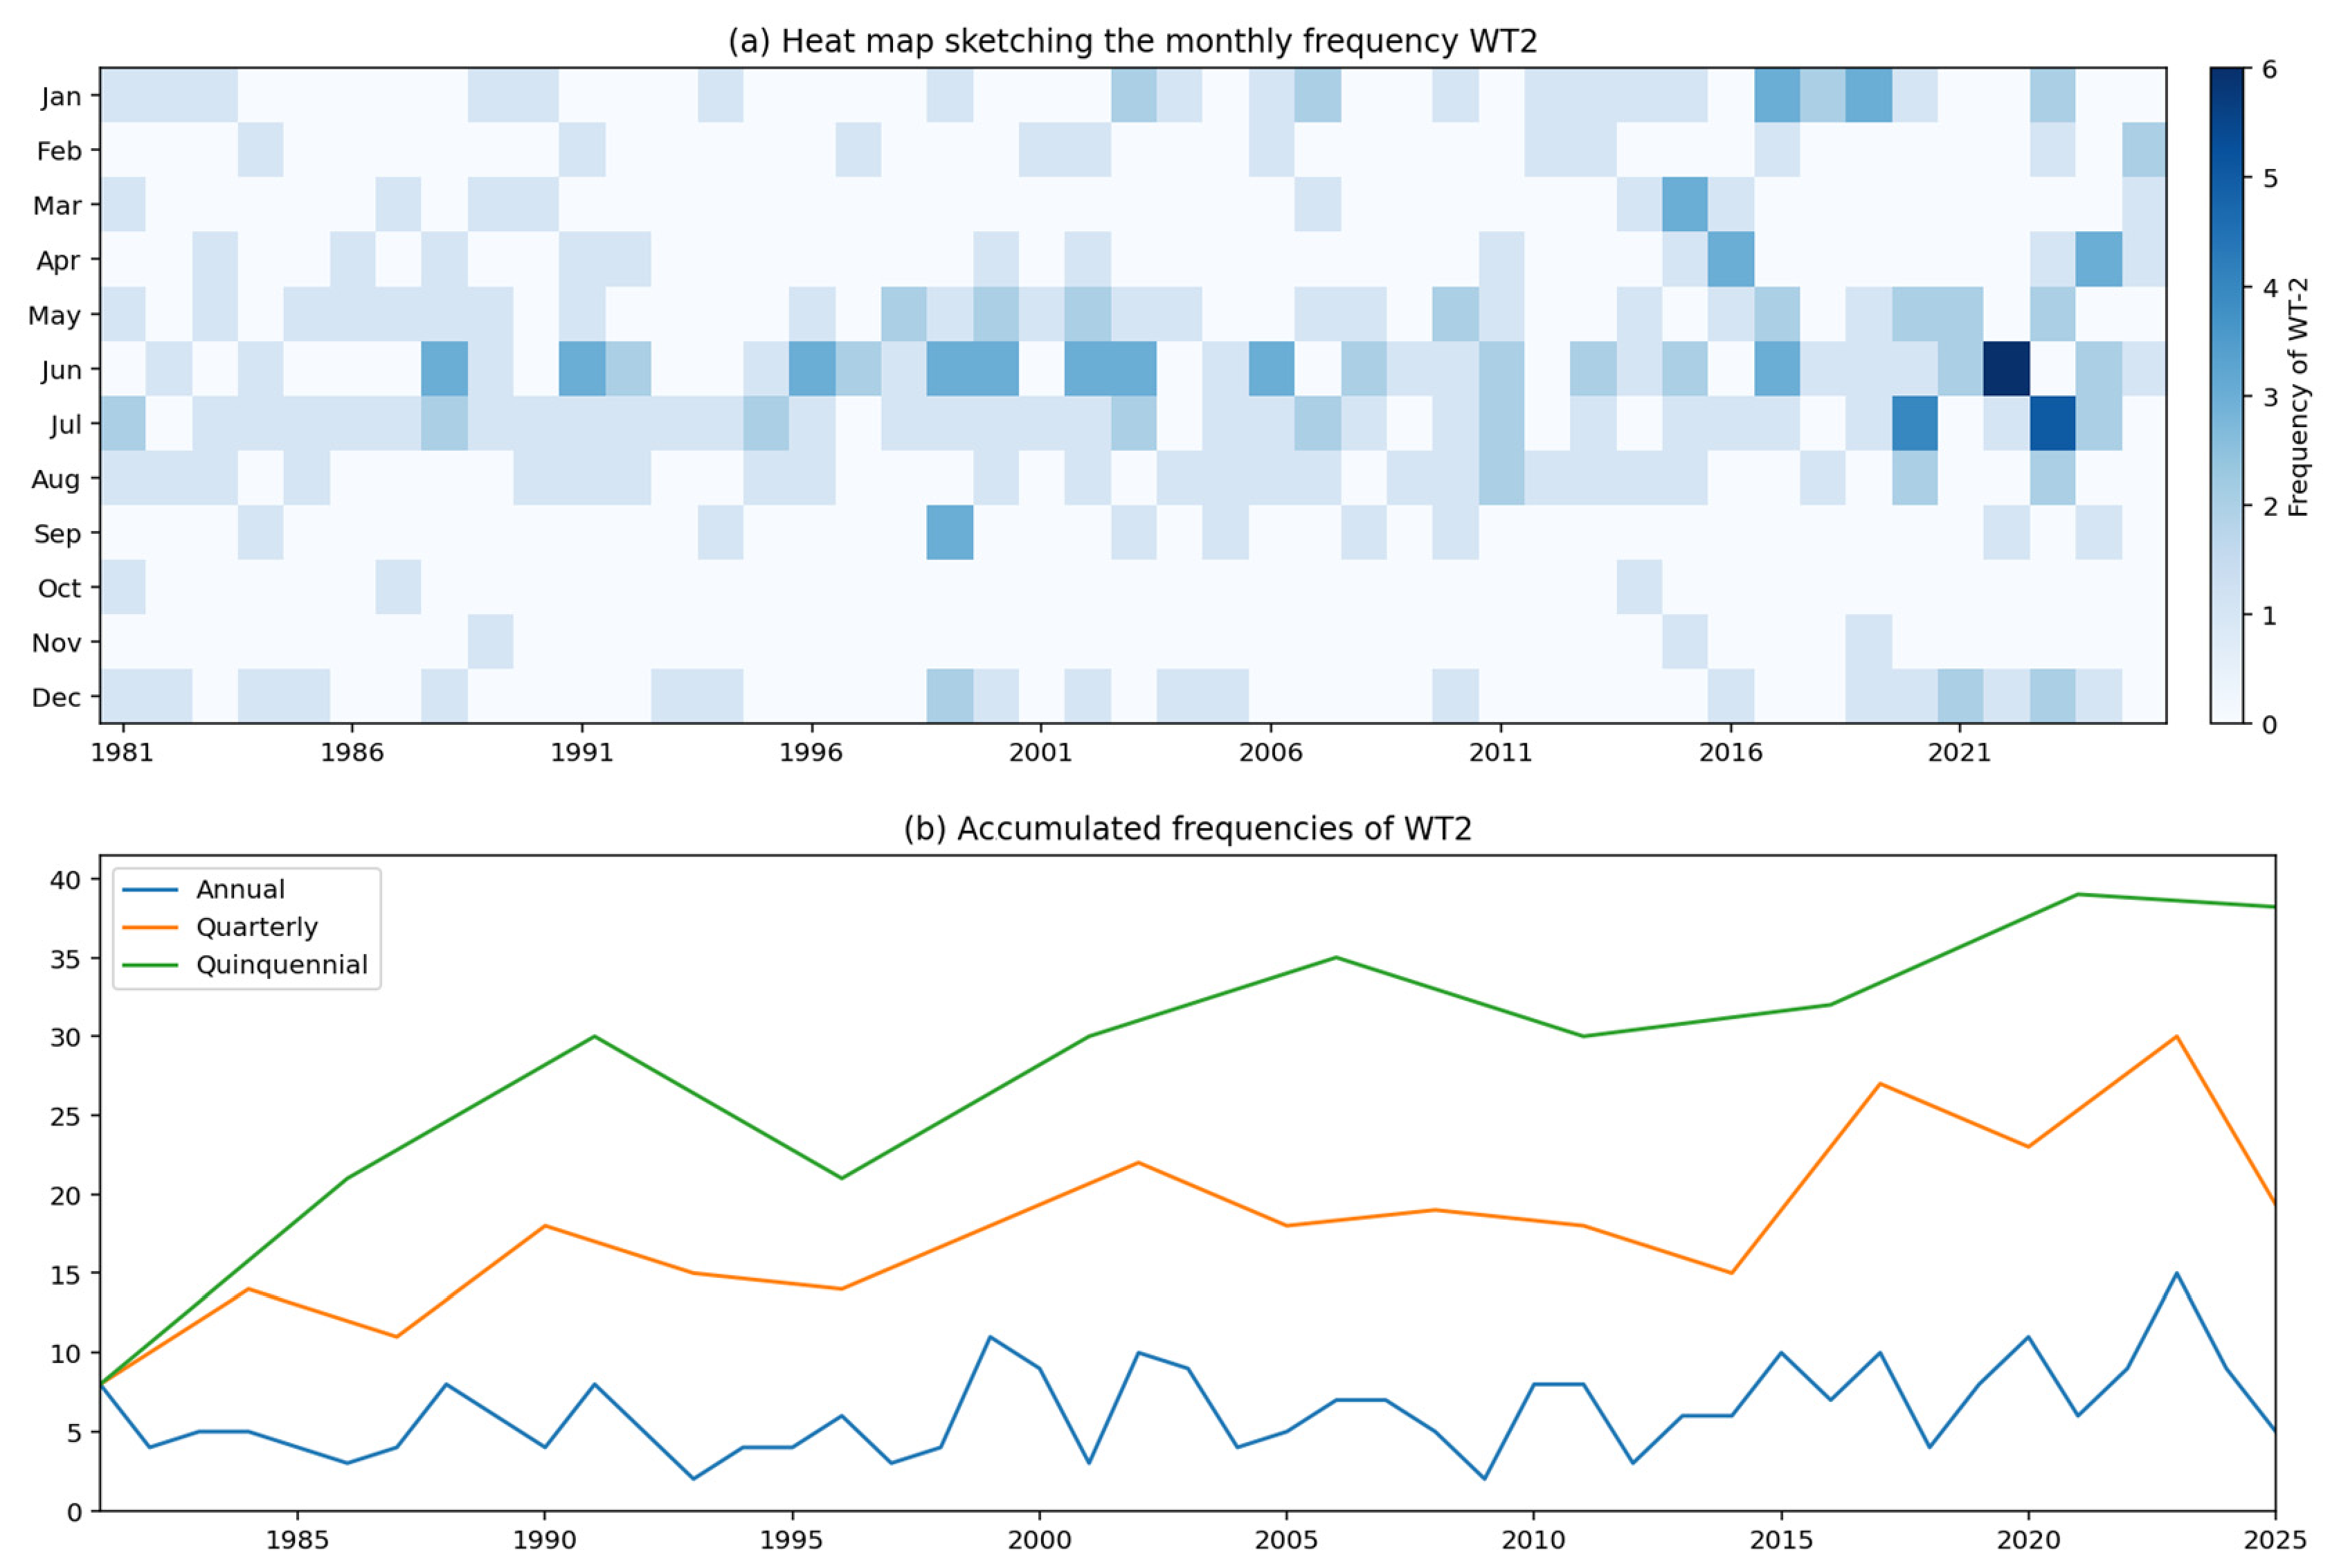
Because WT2 represents the strongest precipitation regime identified in the analysis, its temporal evolution was examined separately. The month–year frequency diagram reveals that WT2 occurrences are not uniformly distributed throughout the study period (Figure 7a). Instead, they tend to cluster during particular years and seasons.
Figure 7.
(a) Month–year occurrence of the most intense precipitation regime (WT2), expressed as occurrence days per month. (b) Temporal evolution of WT2 occurrence based on aggregated occurrence counts (days) over the annual and multiyear windows displayed.
During the first decades of the record, WT2 appears only occasionally. However, a noticeable increase in occurrence can be observed during the most recent years. This behaviour is particularly evident after approximately 2015, when the frequency of WT2 events becomes higher than during most of the previous record.
The annual, three-year, and five-year aggregations in Figure 7b summarize WT2 occurrence over different temporal windows. Their higher values near the end of the record are descriptive; these curves are not independent tests of acceleration or persistence. Statistical evidence for a monotonic increase is provided by the occurrence-frequency analysis in Section 3.4.
An important characteristic of WT2 is that, despite its low frequency, it may contribute disproportionately to total rainfall accumulation. Similar behaviour has been observed in other sectors of the tropical Andes, where a relatively small number of intense precipitation events account for a substantial fraction of annual rainfall totals and hydroclimatic extremes.
The increasing occurrence of WT2 is particularly relevant from a water-management perspective. In mountain basins, a relatively small number of high-intensity precipitation events often contributes disproportionately to annual runoff generation, sediment transport, landslide occurrence, and flood hazards. Consequently, even modest increases in the frequency of the most intense precipitation regime could have important implications for hydrological risk and ecosystem functioning within the Upper Pastaza Basin. Similar concerns have been raised in other Andean regions where recent hydroclimatic variability has been associated with increased precipitation extremes and greater hydrological uncertainty.
The increase observed in WT2 does not by itself demonstrate a long-term change in extreme precipitation. Nevertheless, it suggests that the most active precipitation regime has become more frequent during recent years. This finding deserves further investigation through the analysis of large-scale atmospheric circulation and climate variability drivers, which may help explain the mechanisms responsible for the observed changes.
The identified precipitation regimes provide a useful framework for understanding rainfall variability in a complex tropical mountain environment where conventional observational networks remain relatively sparse. Beyond their climatological relevance, these findings may contribute to improved hydroclimatic monitoring, water-resource management, and hazard assessment within the Upper Pastaza River Basin. The observed redistribution toward wetter precipitation regimes during recent years highlights the importance of maintaining long-term precipitation observations and integrating satellite-based products with ground measurements to better understand ongoing hydroclimatic changes across the Andes–Amazon transition zone.
4. Conclusions and Perspectives
This study characterized the spatial and temporal variability of precipitation regimes in the Upper Pastaza River Basin, Ecuador, during 1981–2025 using daily CHIRPS precipitation estimates and an EOF–K-means classification framework. Four recurrent precipitation Weather Types were identified, revealing a hierarchy of precipitation conditions ranging from a dominant low-intensity regime (WT1), accounting for approximately 70% of classified days, to a relatively infrequent but intense precipitation regime (WT2), representing approximately 1.7% of observations. The spatial patterns exhibited pronounced precipitation contrasts between the inter-Andean valleys and the eastern Andean slopes, consistent with the influence of topography and regional moisture transport across the Andes–Amazon transition zone.
The evaluation of CHIRPS against observations from three meteorological stations revealed spatial differences in its ability to reproduce precipitation variability. Although statistically significant positive correlations were identified at the monthly scale, CHIRPS generally underestimated monthly precipitation totals during the respective validation periods. Differences were also observed in daily rainfall detection and precipitation intensity distributions. These findings emphasize the importance of considering satellite precipitation uncertainties when interpreting the spatial patterns and temporal occurrence of the identified precipitation regimes, particularly in mountainous regions with complex terrain.
The temporal analysis revealed substantial seasonal and interannual variability in the occurrence of the four precipitation regimes. Kendall’s trend analysis identified a statistically significant positive trend in WT2 occurrence (τ = 0.3830, p = 0.0002), whereas WT0, WT1, and WT3 did not exhibit significant monotonic trends. These results indicate that the strongest statistical evidence of long-term change is associated with the relatively infrequent and intense WT2, rather than a generalized redistribution of all precipitation regimes. The burstiness analysis additionally revealed variations in the temporal recurrence of the Weather Types, suggesting that precipitation regime variability involves both changes in occurrence frequency and differences in temporal organization.
The comparison between the complete record and the recent period (2015–2025), performed using the same Weather Type classification, revealed modest differences in relative occurrence frequencies. In particular, the dominant WT1 decreased from approximately 70% to 68%, although this difference was not supported by a statistically significant monotonic trend. An independent classification of the recent period also revealed broadly similar spatial precipitation structures, suggesting that the main precipitation patterns remained recognizable despite variations in their relative frequencies.
Overall, the findings demonstrate the usefulness of combining satellite precipitation estimates, EOF analysis, and unsupervised clustering to characterize hydroclimatic variability in complex tropical mountain basins. Nevertheless, the identified trends in precipitation regime occurrence should not be interpreted as direct evidence of changes in precipitation extremes or their underlying atmospheric mechanisms. Further investigations incorporating independent observations, atmospheric circulation diagnostics, and classification sensitivity analyses are needed to better understand the processes responsible for the observed variability and assess its potential implications for water-resource management and hydrological risk in the Upper Pastaza River Basin.
The delineated mountainous catchment provides a common geographical reference for future numerical simulations of atmospheric dynamics along the Andes–Amazon transition. Future atmospheric model domains should extend beyond the watershed to represent Amazonian moisture inflow and the surrounding orographic forcing. The precipitation-based WTs identified here can guide the selection of representative cases and the evaluation of simulated rainfall patterns. Linking these configurations to simulated moisture transport, atmospheric circulation, and orographic ascent will help investigate the mechanisms underlying the observed precipitation variability and its implications for hydropower water availability.
Supplementary Materials
The following supporting information can be downloaded at https://www.mdpi.com/article/10.3390/atmos17111067/s1: Figure S1. Cumulative explained variance as a function of the number of EOF modes. The dashed horizontal line indicates the 95% cumulative explained-variance threshold used to determine the number of retained modes; Figure S2. Evaluation of clustering performance for k = 2–15 using (a) within-cluster inertia, (b) the Silhouette coefficient, (c) the Calinski–Harabasz index, and (d) the Davies–Bouldin index. The Silhouette, Calinski–Harabasz, and Davies–Bouldin indices favor the two-cluster solution, indicating stronger separation and compactness for a simpler partition. Inertia decreases progressively with increasing k, with diminishing improvements beyond approximately four clusters. A four-cluster solution was selected as a compromise between clustering performance, model complexity, and the level of differentiation required to characterize spatial precipitation variability. This choice does not represent the optimum of every individual clustering metric; Figure S3. Monthly precipitation comparison between CHIRPS estimates and ground-based observations at three meteorological stations in the Upper Pastaza River Basin: (a) Riobamba, (b) Lagunas de Atillo, and (c) Baños. Black dashed lines represent observed monthly precipitation, while green solid lines represent CHIRPS estimates. Blue and red markers identify months with observed precipitation above the 90th percentile and below the 10th percentile, respectively, with corresponding CHIRPS values highlighted for comparison. Spearman’s rank correlation coefficient (rs), its associated p-value, and mean bias error (MBE) are reported for each station. Percentile thresholds were calculated independently from the observed monthly precipitation series at each station; Figure S4. Interannual variability of the burstiness index for the four precipitation Weather Types (WT0–WT3) over the study period. The burstiness index characterizes the temporal irregularity of intervals between successive occurrences of each Weather Type, with negative values indicating relatively regular recurrence and positive values indicating more clustered or irregular recurrence. The dashed horizontal line indicates B = 0, corresponding to the reference value associated with exponentially distributed inter-event intervals. Kendall’s trend analysis identified a statistically significant positive trend for WT2 (τ = 0.2672, p = 0.0132), whereas the remaining Weather Types did not exhibit significant trends at the 5% level; Table S1. Selected monthly CHIRPS v3 station-input inventories for Ecuador and examples of stations in and near the study region.
Author Contributions
Conceptualization, A.H.V., S.R.R., J.C.R.-H. and J.L.-S.; methodology, J.C.R.-H. and I.C.V.; formal analysis, J.C.R.-H. and M.M.P.; investigation, M.M.P. and A.H.V.; resources, I.C.V. and S.R.R.; data curation, S.R.R.; writing—original draft preparation, I.C.V. and M.M.P.; writing—review and editing, J.C.R.-H., J.L.-S., M.M.P. and N.P.C.; visualization, I.C.V.; supervision, A.H.V. and J.C.R.-H.; project administration, A.H.V., J.L.-S. and I.C.V. All authors have read and agreed to the published version of the manuscript.
Funding
This research was funded by Escuela Superior Politécnica de Chimborazo (ESPOCH) through the project “Estudio de la dinámica atmosférica en la cuenca alta del Pastaza”, Project code DIPI-044.
Institutional Review Board Statement
Not applicable.
Informed Consent Statement
Not applicable.
Data Availability Statement
The original data presented in this study are included in the article/Supplementary Materials. Further inquiries can be directed to the corresponding author.
Conflicts of Interest
The authors declare no conflicts of interest.
Abbreviations
The following abbreviations are used in this manuscript:
| CHIRPS | Climate Hazards Group InfraRed Precipitation with Stations |
| ENSO | El Niño–Southern Oscillation |
| EOF | Empirical Orthogonal Function |
| GRASS | Geographic Resources Analysis Support System |
| PCA | Principal Component Analysis |
| WT | Weather Type |
References
- Segura, H.; Espinoza, J.C.; Junquas, C.; Lebel, T.; Vuille, M.; Garreaud, R. Recent changes in the precipitation-driving processes over the southern tropical Andes/western Amazon. Clim. Dyn. 2020, 54, 2613–2631. [Google Scholar] [CrossRef] [Scilit]
- Laraque, A.; Ronchail, J.; Cochonneau, G.; Pombosa, R.; Guyot, J.L. Heterogeneous distribution of rainfall and discharge regimes in the Ecuadorian Amazon basin. J. Hydrometeorol. 2007, 8, 1364–1381. [Google Scholar] [CrossRef] [Scilit]
- Pabón-Caicedo, J.D.; Arias, P.A.; Carril, A.F.; Espinoza, J.C.; Fita Borrel, L.; Goubanova, K.; Lavado-Casimiro, W.; Masiokas, M.; Solman, S.; Villalba, R. Observed and projected hydroclimate changes in the Andes. Front. Earth Sci. 2020, 8, 61. [Google Scholar] [CrossRef] [Scilit]
- Buytaert, W.; Célleri, R.; Willems, P.; De Bièvre, B.; Wyseure, G. Spatial and temporal rainfall variability in mountainous areas: A case study from the south Ecuadorian Andes. J. Hydrol. 2006, 329, 413–421. [Google Scholar] [CrossRef] [Scilit]
- Manz, B.; Buytaert, W.; Zulkafli, Z.; Lavado, W.; Willems, B.; Robles, L.A.; Rodríguez-Sánchez, J.P. High-resolution satellite-gauge merged precipitation climatologies of the Tropical Andes. J. Geophys. Res. Atmos. 2016, 121, 1190–1207. [Google Scholar] [CrossRef] [Scilit]
- Arechúa-Mazón, P.; Cisneros-Vaca, C.; Calahorrano-González, J.; Manzano-Cepeda, M. Assessment of Satellite Precipitation Products in an Andean Catchment: Ambato River Basin, Ecuador. Hydrology 2025, 12, 225. [Google Scholar] [CrossRef] [Scilit]
- Funk, C.; Peterson, P.; Landsfeld, M.; Pedreros, D.; Verdin, J.; Shukla, S.; Husak, G.; Rowland, J.; Harrison, L.; Hoell, A.; et al. The climate hazards infrared precipitation with stations—A new environmental record for monitoring extremes. Sci. Data 2015, 2, 150066. [Google Scholar] [CrossRef] [Scilit] [PubMed]
- Huber Magoffin, R.; Hales, R.C.; Erazo, B.; Nelson, E.J.; Larco, K.; Miskin, T.J. Evaluating the Performance of Satellite Derived Temperature and Precipitation Datasets in Ecuador. Remote Sens. 2023, 15, 5713. [Google Scholar] [CrossRef] [Scilit]
- Corporación Eléctrica del Ecuador (CELEC EP). Centrales Agoyán y San Francisco Recuperaron su Producción Energética para Beneficio de Todos los Ecuatorianos. 8 July 2022. Available online: https://www.celec.gob.ec/noticias/centrales-agoyan-y-san-francisco-recuperaron-su-produccion-energetica-para-beneficio-de-todos-los-ecuatorianos/ (accessed on 19 October 2026).
- Operador Nacional de Electricidad (CENACE). Informe Anual 2025, Parte 1; CENACE: Mejía, Ecuador, 2026; pp. 19, 29–32. Available online: https://www.cenace.gob.ec/wp-content/uploads/downloads/2026/04/Informe-Anual-2025_Parte-1-1.pdf (accessed on 19 October 2026).
- Bulovic, N.; McIntyre, N.; Johnson, F. Evaluation of IMERG V05B 30-min rainfall estimates over the high-elevation tropical Andes mountains. J. Hydrometeorol. 2020, 21, 2875–2892. [Google Scholar] [CrossRef] [Scilit]
- Chancay, J.E.; Espitia-Sarmiento, E.F. Improving Hourly Precipitation Estimates for Flash Flood Modeling in Data-Scarce Andean-Amazon Basins: An Integrative Framework Based on Machine Learning and Multiple Remotely Sensed Data. Remote Sens. 2021, 13, 4446. [Google Scholar] [CrossRef] [Scilit]
- Portuguez-Maurtua, M.; Arumi, J.L.; Lagos, O.; Stehr, A.; Montalvo Arquiñigo, N. Filling Gaps in Daily Precipitation Series Using Regression and Machine Learning in Inter-Andean Watersheds. Water 2022, 14, 1799. [Google Scholar] [CrossRef] [Scilit]
- Muñoz, Á.G.; Yang, X.; Vecchi, G.A.; Robertson, A.W.; Cooke, W.F. A weather-type-based cross-time-scale diagnostic framework for coupled circulation models. J. Clim. 2017, 30, 8951–8972. [Google Scholar] [CrossRef] [Scilit]
- Thielen, D.R.; Ramoni-Perazzi, P.; Zamora-Ledezma, E.; Puche, M.L.; Marquez, M.; Quintero, J.I.; Rojas, W.; Quintero, A.; Bianchi, G.; Soto-Werschitz, I.A. Effect of extreme El Niño events on the precipitation of Ecuador. Nat. Hazards Earth Syst. Sci. 2023, 23, 1507–1527. [Google Scholar] [CrossRef] [Scilit]
- Michelangeli, P.-A.; Vautard, R.; Legras, B. Weather regimes: Recurrence and quasi stationarity. J. Atmos. Sci. 1995, 52, 1237–1256. [Google Scholar] [CrossRef] [Scilit]
- Quishpe Quishpe, A.G. Caracterización Hidrometeorológica y Estimación del Balance Hídrico en la Cuenca del Río Chambo. Bachelor’s Thesis, Escuela Politécnica Nacional, Quito, Ecuador, 2017. Available online: https://bibdigital.epn.edu.ec/handle/15000/17317 (accessed on 27 July 2026).
- Lema Changoluisa, M.A.; Plaza Quezada, V.C. Modelación Hidrológica de la Cuenca (alta y media) del río Pastaza Aplicando el Modelo de Simulación WEAP (Water Evaluation and Planning System). Bachelor’s Thesis, Escuela Politécnica Nacional, Quito, Ecuador, 2009. Available online: https://bibdigital.epn.edu.ec/handle/15000/1780 (accessed on 15 June 2026).
- Rogel, A.; Hidalgo, A.; Castro, F.; Morales, F.; Moya, D.; Paredes, B. Aplicación de Redes Neuronales Artificiales para la Estimación de Precipitaciones: Caso de Estudio de la Cuenca del Río Pastaza, Ecuador. Rev. Científica FINIBUS—Ing. Ind. Arquit. 2024, 7, 131–146. [Google Scholar] [CrossRef] [Scilit]
- GRASS Development Team. r.watershed. GRASS GIS 8.5 Reference Manual. Available online: https://grass.osgeo.org/grass-stable/manuals/r.watershed.html (accessed on 19 October 2026).
- Hofierka, J.; Mitášová, H.; Neteler, M. Geomorphometry in GRASS GIS. Dev. Soil Sci. 2009, 33, 387–410. [Google Scholar] [CrossRef] [Scilit]
- Espinoza Villar, J.C.; Ronchail, J.; Guyot, J.L.; Cochonneau, G.; Naziano, F.; Lavado, W.; De Oliveira, E.; Pombosa, R.; Vauchel, P. Spatio-temporal rainfall variability in the Amazon basin countries (Brazil, Peru, Bolivia, Colombia, and Ecuador). Int. J. Climatol. 2009, 29, 1574–1594. [Google Scholar] [CrossRef] [Scilit]
- Funk, C.; Peterson, P.; Harrison, L.; Saldivar, R.; Landsfeld, M.; Pedreros, D.; Shukla, S.; Fink, A.H.; Davenport, F.; Peterson, S.; et al. The Climate Hazards Center Infrared Precipitation with Stations, Version 3. Sci. Data 2026, 13, 718. [Google Scholar] [CrossRef] [Scilit] [PubMed]
- López-Bermeo, C.; Montoya, R.D.; Caro-Lopera, F.J.; Díaz-García, J.A. Validation of the accuracy of the CHIRPS precipitation dataset at representing climate variability in a tropical mountainous region of South America. Phys. Chem. Earth Parts A/B/C 2022, 127, 103184. [Google Scholar] [CrossRef] [Scilit]
- Rivera, J.A.; Marianetti, G.; Hinrichs, S. Validation of CHIRPS precipitation dataset along the Central Andes of Argentina. Atmos. Res. 2018, 213, 437–449. [Google Scholar] [CrossRef] [Scilit]
- Lohninger, H. Teach/Me—Data Analysis; Springer: Berlin/Heidelberg, Germany, 1999. [Google Scholar]
- Wilks, D.S. Statistical Methods in the Atmospheric Sciences, 2nd ed.; Academic Press: Burlington, MA, USA, 2006. [Google Scholar]
- Climate Hazards Center, University of California, Santa Barbara. CHIRPS3 Diagnostics: List of Stations Used. Available online: https://data.chc.ucsb.edu/products/CHIRPS/v3.0/diagnostics/list_of_stations_used/monthly/ (accessed on 19 October 2026).
- Hannachi, A.; Jolliffe, I.T.; Stephenson, D.B. Empirical orthogonal functions and related techniques in atmospheric science: A review. Int. J. Climatol. 2007, 27, 1119–1152. [Google Scholar] [CrossRef] [Scilit]
- Muñoz, Á.G.; Goddard, L.; Robertson, A.W.; Kushnir, Y.; Baethgen, W.E. Cross-time scale interactions and rainfall extreme events in southeastern South America for the austral summer. Part I: Potential predictors. J. Clim. 2015, 28, 7894–7913. [Google Scholar] [CrossRef] [Scilit]
- Hassan, I.H.; Abdullahi, M.; Ali, Y.S. Analysis of techniques for selecting appropriate number of clusters in K-means clustering algorithm. In Proceedings of the International Conference on Computing and Advances in Information Technology (ICCAIT), Zaria, Nigeria, 15–17 November 2021; pp. 90–96. [Google Scholar]
- Řezanková, H. Different approaches to the silhouette coefficient calculation in cluster evaluation. In Proceedings of the 21st International Scientific Conference AMSE—Applications of Mathematics and Statistics in Economics, Kutná Hora, Czech Republic, 29 August–2 September 2018; pp. 1–10. [Google Scholar]
- Rykov, A.; de Amorim, R.C.; Makarenkov, V.; Mirkin, B. Inertia-Based Indices to Determine the Number of Clusters in K-Means: An Experimental Evaluation. IEEE Access 2024, 12, 11761–11773. [Google Scholar] [CrossRef] [Scilit]
- Gocić, M.; Trajković, S. Analysis of changes in meteorological variables using Mann-Kendall and Sen’s slope estimator statistical tests in Serbia. Glob. Planet. Change 2013, 100, 172–182. [Google Scholar] [CrossRef] [Scilit]
- Heidinger, H.; Carvalho, L.; Jones, C.; Posadas, A.; Quiroz, R. A new assessment in total and extreme rainfall trends over central and southern Peruvian Andes during 1965–2010. Int. J. Climatol. 2018, 38, e998–e1015. [Google Scholar] [CrossRef] [Scilit]
- Sen, P.K. Estimates of the Regression Coefficient Based on Kendall’s Tau. J. Am. Stat. Assoc. 1968, 63, 1379–1389. [Google Scholar] [CrossRef]
- Schleiss, M.; Smith, J.A. Two Simple Metrics for Quantifying Rainfall Intermittency: The Burstiness and Memory of Interamount Times. J. Hydrometeorol. 2016, 17, 421–436. [Google Scholar] [CrossRef] [Scilit]
- Tobar, V.; Wyseure, G. Seasonal rainfall patterns classification, relationship to ENSO and rainfall trends in Ecuador. Int. J. Climatol. 2018, 38, 1808–1819. [Google Scholar] [CrossRef] [Scilit]
- Ruiz-Hernández, J.-C.; Condom, T.; Ribstein, P.; Le Moine, N.; Espinoza, J.-C.; Junquas, C.; Villacís, M.; Vera, A.; Muñoz, T.; Maisincho, L.; et al. Spatial variability of diurnal to seasonal cycles of precipitation from a high-altitude equatorial Andean valley to the Amazon Basin. J. Hydrol. Reg. Stud. 2021, 38, 100924. [Google Scholar] [CrossRef] [Scilit]
- Espinoza, J.C.; Jimenez, J.C.; Marengo, J.A.; Schöngart, J.; Ronchail, J.; Lavado-Casimiro, W.; Ribeiro, J.V.M. The new record of drought and warmth in the Amazon in 2023 related to regional and global climatic features. Sci. Rep. 2024, 14, 8107. [Google Scholar] [CrossRef] [Scilit] [PubMed]
- De la Cruz, G.; Collado-Tello, R.; Chávarri-Velarde, E.; Lavado-Casimiro, W.; Espinoza, J.C. Long-term basin trends confirm a record 2022–2024 hydrological drought and water-storage losses in western Amazonia. J. Hydrol. Reg. Stud. 2025, 62, 102951. [Google Scholar] [CrossRef] [Scilit]

Disclaimer/Publisher’s Note: The statements, opinions and data contained in all publications are solely those of the individual author(s) and contributor(s) and not of MDPI and/or the editor(s). MDPI and/or the editor(s) disclaim responsibility for any injury to people or property resulting from any ideas, methods, instructions or products referred to in the content. |
© 2026 by the authors. Licensee MDPI, Basel, Switzerland. This article is an open access article distributed under the terms and conditions of the Creative Commons Attribution (CC BY) license.