


Abstract
Accurate daily solar radiation estimates are needed to plan solar energy systems in arid regions, where long ground records are unavailable at most candidate sites. This study evaluates metaheuristic-optimized Random Forest models for daily global horizontal irradiance (GHI) at six climatically diverse Saudi sites (Riyadh, Tabuk, Najran, Dammam, Jeddah, and Turaif), using routinely available meteorological variables from the NASA POWER database for 2001–2024 (training 2001–2019, testing 2020–2024). Five metaheuristic optimization algorithms—the Genetic Algorithm (GA), Particle Swarm Optimization (PSO), the Firefly Algorithm (FFA), Elephant Herding Optimization (EHO), and Grey Wolf Optimization (GWO)—were used to tune Random Forest hyperparameters under a fairness-controlled experimental design in which all algorithms received an identical number of fitness evaluations, search bounds and fitness function, with every configuration repeated over ten random seeds. Across the six sites, test MAPE ranged from 4.75% to 6.97% and R2 from 0.772 to 0.945, while the five algorithms differed by at most 0.023 percentage points of MAPE within any site. Neither a Friedman test across sites (MAPE: χ2 = 5.20, p = 0.267; R2: χ2 = 2.67, p = 0.615) nor within-site Kruskal–Wallis tests found a statistically significant difference among the algorithms. Bootstrap confidence intervals, leave-one-year-out validation and bias analysis by sky condition show that the remaining error is concentrated on cloudy and dust-affected days, and that Najran’s lower R2 reflects its small seasonal variance rather than larger errors. An untuned Random Forest performed almost identically to the tuned models. The choice of metaheuristic optimizer is therefore far less consequential for accuracy than site climate and input data quality.
1. Introduction
The transition toward renewable energy has become a strategic priority for countries situated in high-insolation arid regions, where solar resources offer a viable alternative to fossil-fuel-dependent power generation. Saudi Arabia, possessing one of the highest solar irradiance potentials globally, has positioned solar energy as a cornerstone of its Vision 2030 economic diversification agenda, with utility-scale projects requiring accurate, site-specific solar radiation forecasts for planning and grid integration. Ground-based monitoring in the Kingdom has expanded considerably over the past decade: under K.A.CARE’s Renewable Resource Monitoring and Mapping program, 47 solar radiation stations were established, and quality-controlled records from 43 of them (2013–2021) have since been used to characterize the national solar radiation climate [1]. Even so, about one station per 45,000 km2, with records of roughly a decade, cannot characterize every candidate project site, and multi-decade local records remain the exception rather than the rule [1,2]. Satellite-derived and reanalysis products such as NASA POWER are therefore widely used in their place, and estimating site-specific irradiance from routinely available meteorological variables remains a practical need.
Machine learning approaches, and Random Forest in particular, have shown strong performance in solar radiation prediction tasks precisely because they can operate on a reduced set of readily available meteorological variables rather than requiring dense, multi-parameter station networks [3], an approach validated in semi-arid settings using satellite-derived predictors [4] and confirmed by hyperparameter-optimized Random Forest studies elsewhere [5]. Metaheuristic optimization of Random Forest hyperparameters—using algorithms such as the Genetic Algorithm (GA), Particle Swarm Optimization (PSO), the Firefly Algorithm (FFA), Elephant Herding Optimization (EHO), and Grey Wolf Optimization (GWO)—has been proposed as a way to further improve prediction accuracy in low-input, data-limited desert settings. However, comparative metaheuristic studies in the broader optimization literature are frequently criticized for applying unequal optimization budgets, inconsistent fitness functions, or insufficient control for randomness across the algorithms being compared, which can produce misleading performance rankings. This motivates a central methodological principle for the present study: fairness controls should be built into the experimental design from the outset, not applied as a post hoc correction.
More broadly, machine learning solar radiation forecasting has been studied extensively outside Saudi Arabia as well. Hissou et al. [6] proposed a novel machine learning approach for solar radiation estimation validated across multiple climate zones, while Solano and Affonso [7] showed that ensemble voting across several machine learning algorithms improves solar irradiation forecasting accuracy relative to any single model. Chaibi et al. [8] combined Random Forest feature selection with Bayesian hyperparameter optimization for daily global solar radiation prediction, reporting accuracy gains from tuning that are consistent with the motivation for the present study’s metaheuristic-optimization approach. Bakır [9] compared multiple metaheuristic search algorithms for daily global solar radiation prediction across different climatic conditions in Türkiye, finding that the best-performing algorithm varied by site—a pattern this study directly tests for fairness-controlled robustness. Earlier foundational work by Mohandes and Rehman [10] demonstrated that artificial neural networks could estimate global solar radiation from just air temperature and relative humidity, establishing the low-input modeling philosophy that motivates the present study’s seven-variable feature set, and Gouda et al. [11] compared model-selection strategies for daily global solar radiation prediction in China, underscoring that model and feature choice both matter alongside algorithm choice.
Within Saudi Arabia specifically, a small but growing body of work has begun to benchmark machine learning models for solar radiation and renewable-resource forecasting across multiple regions. Hossain et al. [12] applied ensemble learning algorithms to solar power prediction across Saudi sites using a data-driven approach, and Alabdulhadi et al. [13] developed a deep learning framework for wind speed prediction in Saudi Arabia, both illustrating the wider push toward multi-region renewable-resource forecasting in the Kingdom. Most directly relevant to the present study, Rashid et al. [14] recently compared eight machine learning and deep learning architectures—including Random Forest, Support Vector Regression, and Deep Learning—for direct solar radiation forecasting across six climatically diverse Saudi sites using a single year (2023) of NASA POWER data, finding that Deep Learning and Artificial Neural Network models achieved the most consistent accuracy while Random Forest was comparatively less competitive without hyperparameter tuning. That study did not incorporate metaheuristic hyperparameter optimization or fairness-controlled algorithm comparison, and used a single-year data window; the present study addresses both gaps by applying a multi-year (2001–2024), fairness-controlled, metaheuristic-optimized Random Forest framework across an overlapping but distinct set of Saudi regions.
This study contributes to this line of research in three directions. First, it applies a low-input, metaheuristic-optimized Random Forest framework to Saudi Arabia’s distinct desert climate zones—spanning continental plateau (Riyadh), northern highland desert (Tabuk), southern desert bordering the Empty Quarter (Najran), Gulf coastal desert (Dammam), Red Sea coastal desert (Jeddah), and extreme-north continental desert (Turaif)—characterizing how prediction accuracy varies across these climatically diverse regions. Second, it incorporates a fairness-controlled experimental design from the start—an equal number of fitness evaluations, identical fitness functions, repeated runs over multiple random seeds, and statistical significance testing within and across regions—so that any reported differences among metaheuristics can be attributed to the algorithms themselves rather than to unequal experimental conditions. Third, it quantifies the statistical and systematic uncertainty of the resulting estimates through bootstrap confidence intervals, leave-one-year-out validation and bias analysis by season and sky condition, and tests whether the models transfer to a site excluded from training.
Accordingly, this study aims to answer two research questions: (i) does metaheuristic choice meaningfully affect Random Forest solar radiation prediction accuracy once experimental conditions are held fair across algorithms; and (ii) how does prediction accuracy vary across Saudi Arabia’s climatically diverse desert regions, and what does that variation suggest about where future modeling effort is best directed? The remainder of this paper is organized as follows: Section 2 describes the study area, data, and methodology, including the fairness-controlled experimental design; Section 3 reports results across all six regions and five algorithms; Section 4 discusses these findings; and Section 5 concludes with limitations and directions for future research.
2. Materials and Methods
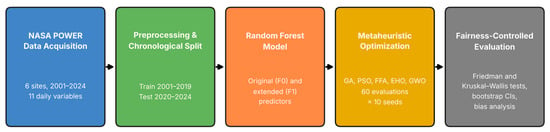
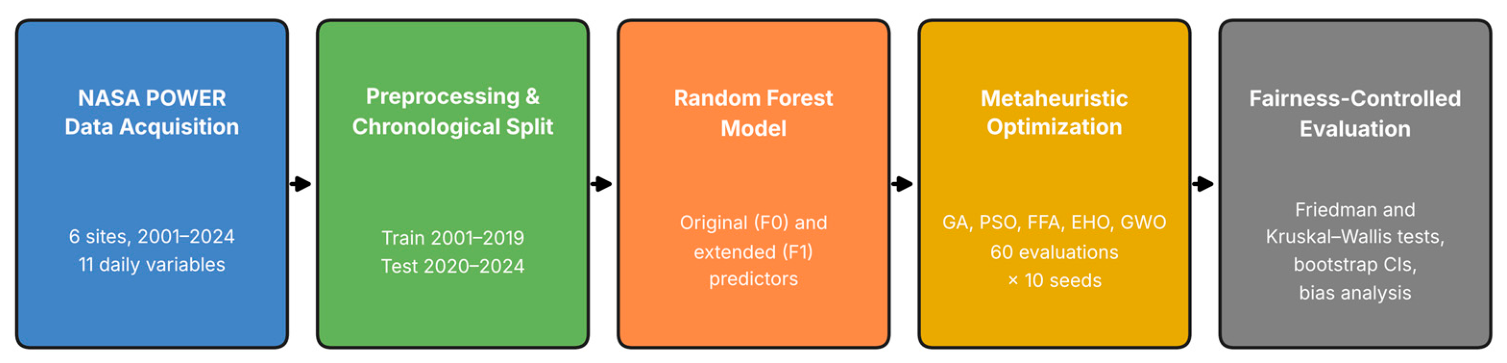
Figure 1 summarizes the five-stage pipeline used in this study: data acquisition from NASA POWER, preprocessing and chronological train/test splitting, a Random Forest baseline model, metaheuristic hyperparameter optimization, and fairness-controlled evaluation with uncertainty and bias analysis.
Figure 1.
Five-stage methodology pipeline used in this study.
2.1. Study Area and Data
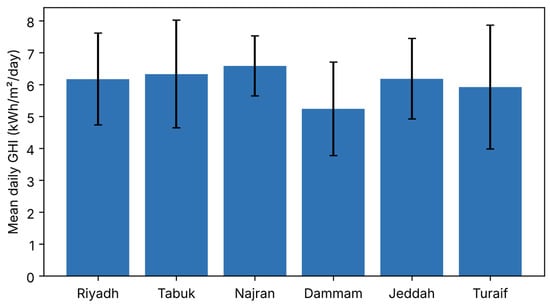
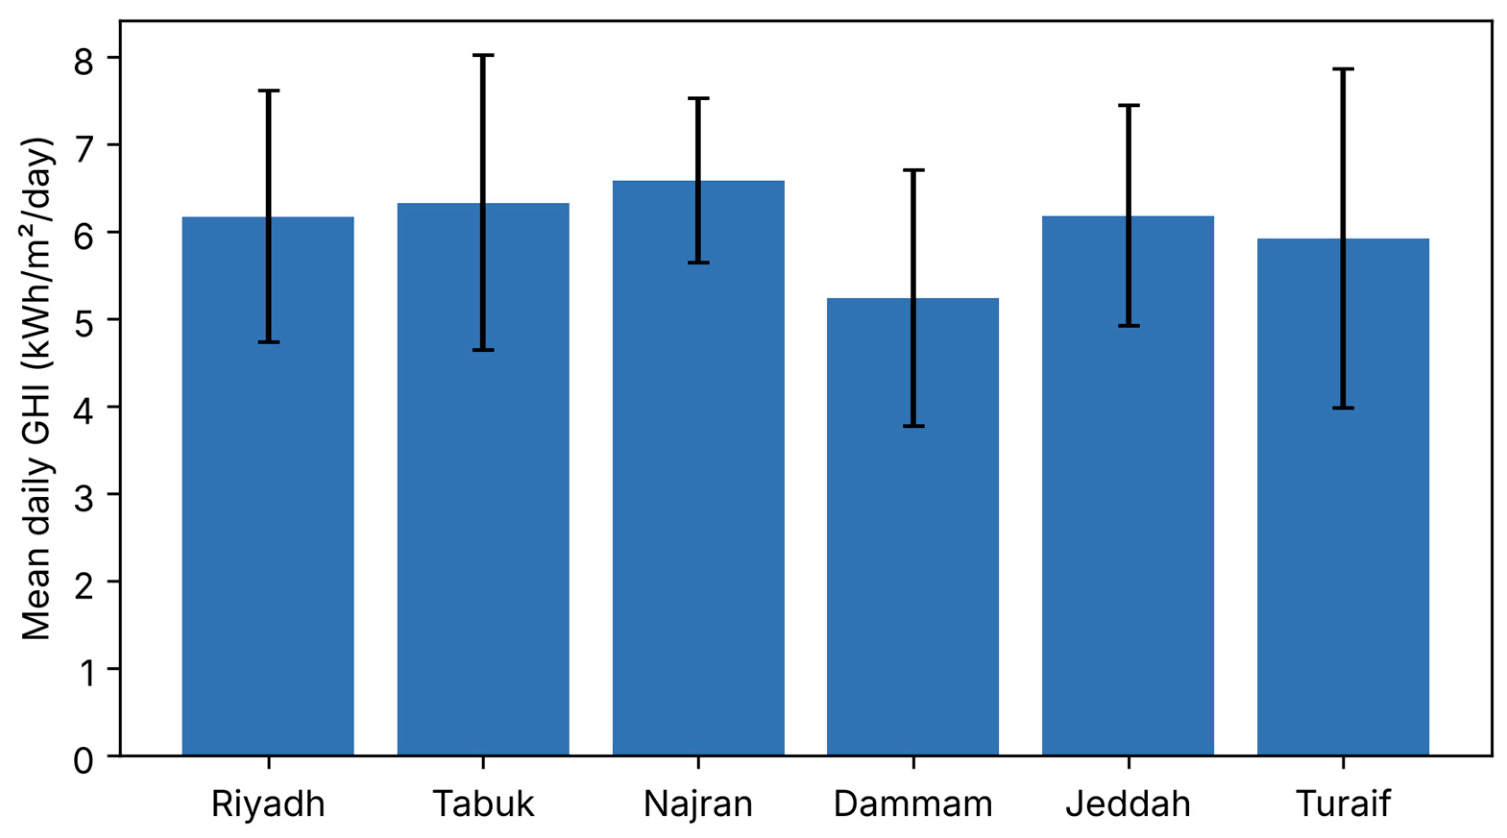
Six sites were selected to capture the climatic diversity of Saudi Arabia’s arid zones: Riyadh (24.71° N, 46.68° E; continental Najd plateau), Tabuk (28.40° N, 36.57° E; northern highland desert), Najran (17.49° N, 44.13° E; southern desert, Empty Quarter margin), Dammam (26.42° N, 50.09° E; Eastern coastal desert with Gulf humidity influence), Jeddah (21.49° N, 39.19° E; Red Sea coastal desert), and Turaif (31.67° N, 38.66° E; extreme-north continental desert). Table 1 summarizes the geographic and climatic characteristics of each site, and Figure 2 shows the mean daily GHI recorded at each site over the study period, illustrating the range of solar resource conditions captured by this site selection.
Table 1.
Geographic characteristics of the six study sites.
Figure 2.
Mean daily global horizontal irradiance (GHI) at each study site, 2001–2024 (error bars show one standard deviation).
Daily solar and meteorological data were retrieved from the NASA Prediction of Worldwide Energy Resources (POWER) database via its Renewable Energy (RE) community daily API for the period January 2001 to December 2024 [15]. The start year is set by the CERES SYN1deg record, on which POWER’s daily surface solar fluxes are based from 2001 onward; extending further back would splice in the earlier GEWEX SRB retrieval and introduce an inhomogeneity into the target series [16]. Consistent with the low-input design established in prior work, the original feature set comprised seven predictors: clear-sky surface shortwave downward irradiance, mean/maximum/minimum air temperature at 2 m, relative humidity at 2 m, wind speed at 2 m, and bias-corrected precipitation, with all-sky surface shortwave downward irradiance as the target variable. Surface pressure and specific humidity at 2 m were also retrieved, and the diurnal temperature range (maximum minus minimum air temperature) was derived as a physically motivated proxy for cloudiness [17]; together with the original predictors, these form an extended feature set used to assess the contribution of additional atmospheric variables (Section 3.5). NASA POWER was selected over ground-station networks such as K.A.CARE’s Renewable Resource Atlas because it provides freely accessible, spatially consistent, satellite-derived estimates without requiring a restricted data-use agreement, supporting full reproducibility of the analysis. The reference data carry their own uncertainty: against Baseline Surface Radiation Network (BSRN) stations equatorward of 60°, the CERES SYN1deg daily GHI used by POWER has a mean bias of 0.2% and an RMSE of 12.1% [16]. Table 2 summarizes descriptive statistics for all retrieved variables, pooled across the six sites.
Table 2.
Descriptive statistics of retrieved NASA POWER variables (pooled across all six sites, 2001–2024, n = 52,596 daily observations).
The negative minima in Table 2 are genuine sub-zero air temperatures in °C, not data errors. Because the table pools all six sites, they come from the northern and central sites in winter. Over 2001–2024, daily minimum temperature fell below 0 °C on 378 days at Turaif (820 m a.s.l.), 133 days at Tabuk (875 m) and 16 days at Riyadh (614 m). Of these, 94% occurred in December–February and the rest in November and March, when cold continental air masses combine with strong night-time radiative cooling under clear skies. Daily mean temperature fell below 0 °C on only 13 days, all at Turaif. No sub-zero values occurred at Najran, Jeddah or Dammam.
2.2. Data Preprocessing
No missing values (NASA POWER fill value −999) were present in any of the six records over 2001–2024, so no imputation was required and each site contributes 8766 daily observations. Each regional dataset was split chronologically: 2001–2019 (6939 days) was used for training and hyperparameter tuning, and 2020–2024 (1827 days, five complete annual cycles) was held out as a test set that was never used during tuning. A chronological rather than random split avoids information leakage between adjacent, autocorrelated days and mimics the intended use, in which a model built on past data is applied to a later period. To check that the results do not depend on this particular split, a leave-one-year-out cross-validation was also performed (Section 2.6). Random Forest is invariant to monotonic feature scaling, so the predictors were used in their physical units.
2.3. Baseline Model: Random Forest
Random Forest regression [3] was selected as the base learner given its established robustness to noisy, heterogeneous meteorological inputs and its demonstrated effectiveness in data-limited solar radiation prediction tasks. The model constructs an ensemble of decision trees trained on bootstrapped subsets of the training data and a random subset of features at each split, with predictions aggregated by averaging across trees. All Random Forest models were implemented in Python (version 3.13) using the scikit-learn library (version 1.9.1) [18].
Random Forest is a data-driven learner and does not solve the radiative transfer equations. The physics of the problem nevertheless enters through its inputs. Clear-sky GHI already accounts for solar geometry, extraterrestrial irradiance and attenuation by Rayleigh scattering, water vapour and aerosol under cloud-free conditions, so the model effectively learns how clouds and excess aerosol modify this clear-sky value. Humidity, precipitation and the diurnal temperature range serve as proxies for that modification, because cloud and dust reduce both daytime heating and night-time cooling [17]. To test whether making this structure explicit helps, a physics-informed variant was also trained that predicts the clear-sky index kc = GHI/GHIclear and multiplies it by clear-sky GHI. All models were compared against two reference baselines: clear-sky GHI scaled by the monthly mean clear-sky index of the training period, and multiple linear regression on the original predictors.
2.4. Metaheuristic Hyperparameter Optimization
Five metaheuristic algorithms, implemented using the mealpy Python library (version 3.0.3) [19,20] to ensure a consistent interface and fitness-evaluation protocol across all five, were used to tune three Random Forest hyperparameters—the number of estimators, maximum tree depth, and minimum samples required to split an internal node—within pre-specified, identical search bounds across all algorithms:
- Genetic Algorithm (GA): a population-based evolutionary method using selection, crossover, and mutation operators to iteratively evolve candidate hyperparameter sets [21];
- Particle Swarm Optimization (PSO): a swarm-intelligence method in which candidate solutions (particles) adjust their position in the search space based on their own best-known position and the swarm’s global best [22];
- Firefly Algorithm (FFA): a swarm-intelligence method inspired by the flashing behavior of fireflies, in which candidate solutions are attracted toward brighter (better) solutions with attraction decaying over distance [23];
- Elephant Herding Optimization (EHO): a swarm-intelligence method modeling the clan-based social structure of elephant herds, combining clan-updating and separating operators [24];
- Grey Wolf Optimization (GWO): a swarm-intelligence method modeling the leadership hierarchy and hunting behavior of grey wolves [20].
2.5. Fairness-Controlled Experimental Design
Unlike comparative metaheuristic studies that apply fairness corrections retrospectively, this study fixes the comparison conditions a priori. All five algorithms were allocated an identical population size (10), identical search bounds and the same fitness function, defined as the mean squared error from 3-fold cross-validation on the training period, with contiguous (unshuffled) folds to limit leakage between adjacent days. Because the Firefly Algorithm’s pairwise attraction mechanism performs O(n2) rather than O(n) fitness evaluations per generation, an equal number of epochs would not give the algorithms an equal computational budget. The budget was therefore defined directly as the number of fitness evaluations: each run was allowed exactly 60 evaluations, enforced by a hard cap inside the objective function so that no algorithm could exceed it. Every region–algorithm combination was run with ten random seeds (300 runs in total), which separates seed-to-seed variability from genuine differences between algorithms. Table 3 summarizes the shared configuration applied identically across all five algorithms.
Table 3.
Fairness-controlled configuration shared identically across all five metaheuristics.
2.6. Evaluation Metrics and Statistical Testing
Model performance is reported using the Mean Absolute Error (MAE), Root Mean Squared Error (RMSE), Mean Absolute Percentage Error (MAPE), and the coefficient of determination (R2), computed on the held-out test set for each region, together with the mean bias error (MBE = mean of predicted minus observed), which exposes systematic over- or underestimation. Differences among the five metaheuristics across the six regions are assessed using the Friedman test [25] on the seed-averaged results, with Nemenyi post hoc pairwise comparisons [26] planned where the Friedman test indicates a statistically significant overall difference (α = 0.05).
Uncertainty was assessed at three levels. First, seed-to-seed variability is summarized as the standard deviation of each metric over the ten runs, and within-region differences among algorithms were tested with the Kruskal–Wallis test on these replicate runs. Second, sampling uncertainty in the test-set metrics was estimated with a moving-block bootstrap (10-day blocks, 1000 resamples), which preserves the day-to-day autocorrelation of the series [27], and is reported as 95% confidence intervals. Third, interannual variability was assessed by leave-one-year-out cross-validation over 2001–2024, using the best cross-validated configuration for each site. Systematic error was examined by stratifying MBE and RMSE by season and by sky condition, defined by the clear-sky index (clear: kc ≥ 0.90; partly cloudy or hazy: 0.70 ≤ kc < 0.90; cloudy or dust-affected: kc < 0.70), and on days with an abrupt day-to-day GHI drop of more than 1.5 kWh/m2, which mark the passage of cloud systems or dust events.
The contribution of individual predictors was quantified by permutation importance on the test set. To approximate the intended use at an unmonitored site, a leave-one-site-out experiment trained a single model on five sites (extended features plus latitude, longitude and elevation) and evaluated it on the sixth. Long-term trends in annual mean GHI were estimated with Sen’s slope and tested with the Mann–Kendall test [28].
3. Results
3.1. Per-Region Model Performance
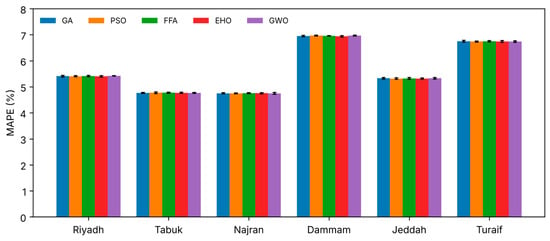
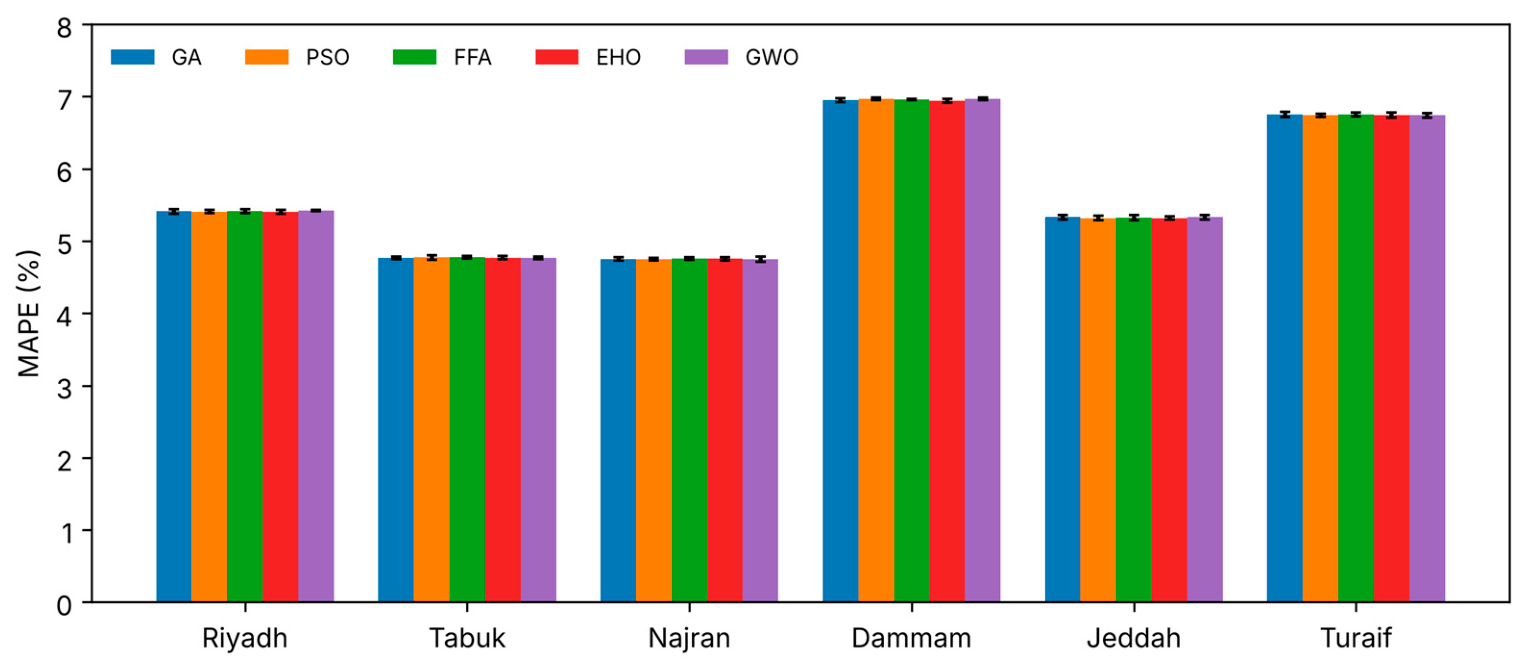
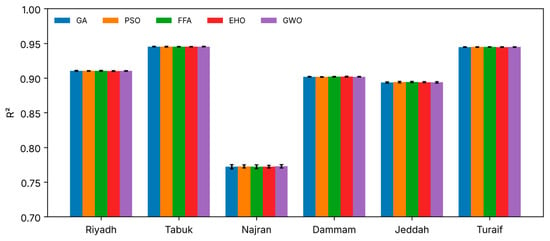
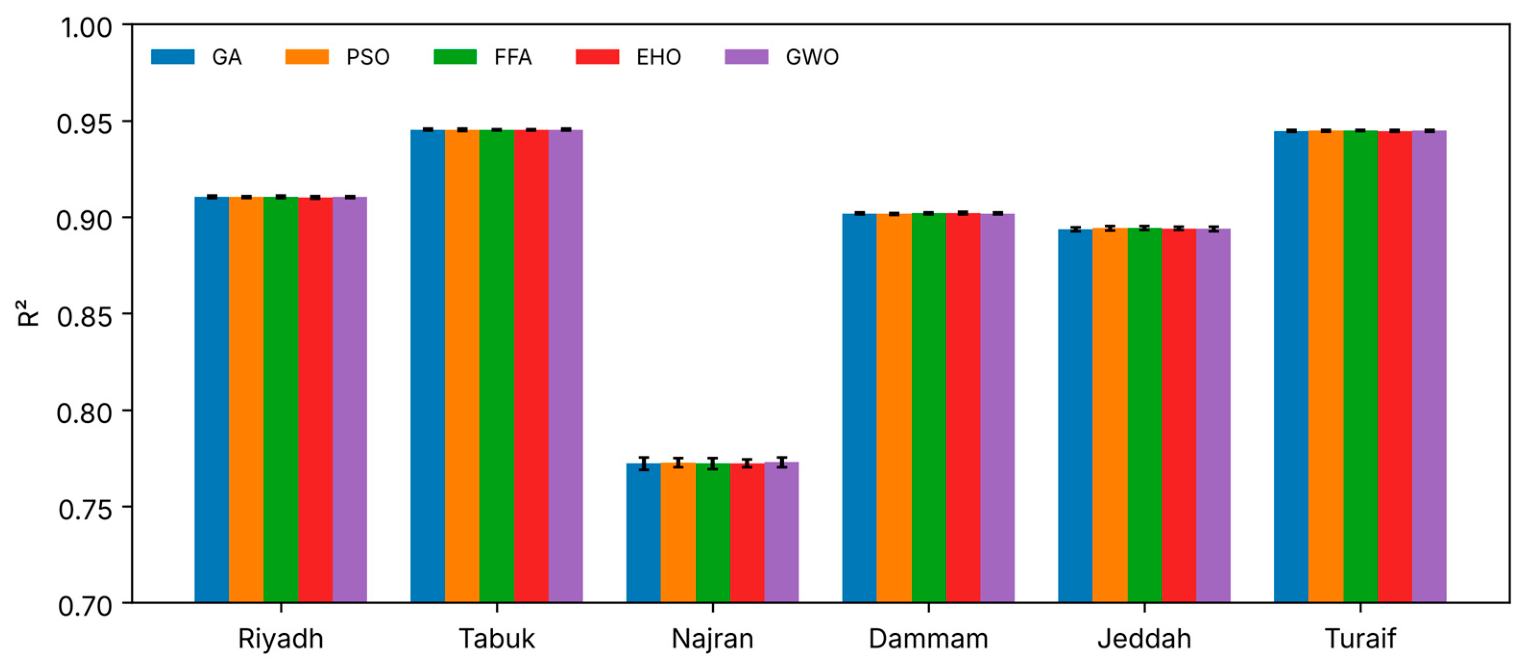
Table 4 reports test-set MAE, RMSE, MAPE, and R2 (mean ± standard deviation over ten seeds) for each of the five metaheuristic-optimized Random Forest models across all six Saudi regions, with the corresponding MAPE and R2 values visualized by region and algorithm in Figure 3 and Figure 4, respectively. Prediction accuracy varied by region, independent of algorithm choice: Tabuk achieved the lowest RMSE (0.392–0.393 kWh/m2/day) and, together with Turaif, the highest R2 (≈0.945); Najran and Tabuk had the lowest MAPE (4.75–4.78%) and Dammam the highest (6.94–6.97%). Najran showed the lowest R2 overall (0.772–0.773) despite its low MAPE; the reasons for this are examined in Section 4. Seed-to-seed standard deviations (0.009–0.037 percentage points of MAPE) were comparable to or larger than the differences between algorithm means (0.008–0.023 percentage points), and as Figure 3 and Figure 4 illustrate, the bars for all five algorithms sit almost flush with one another within each region.
Table 4.
Performance of metaheuristic-optimized Random Forest models across six Saudi Arabian regions (test period 2020–2024; mean ± SD over ten seeds).
Figure 3.
MAPE by region and algorithm (mean ± SD over ten seeds, test period 2020–2024). Bars within each region cluster tightly, visually confirming the non-significant Friedman result.
Figure 4.
R2 by region and algorithm (mean ± SD over ten seeds), showing the same tight within-region clustering across all five metaheuristics.
3.2. Statistical Significance Testing
A Friedman test was conducted across the six regions (blocks) on the seed-averaged results to assess whether the observed differences among the five metaheuristics were statistically significant. On MAPE, the test yielded χ2 = 5.200, p = 0.267, and on R2, χ2 = 2.667, p = 0.615; in both cases, the null hypothesis of no difference among algorithms was not rejected at α = 0.05. Within each region, Kruskal–Wallis tests on the ten replicate runs per algorithm likewise found no significant difference (all p ≥ 0.33; Supplementary Table S1). Consistent with this, the MAPE spread among algorithm means within any given region was narrow, ranging from 0.008 percentage points (Tabuk) to 0.023 percentage points (Dammam), against an average seed-to-seed standard deviation of 0.020–0.030 percentage points. Given the non-significant results, no post hoc pairwise comparisons were conducted.
3.3. Statistical Uncertainty
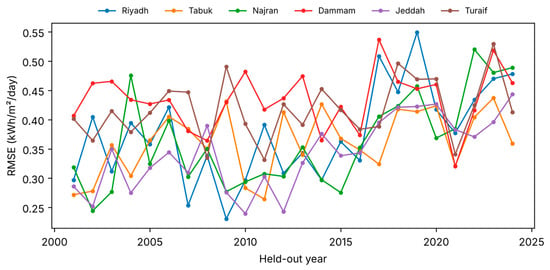
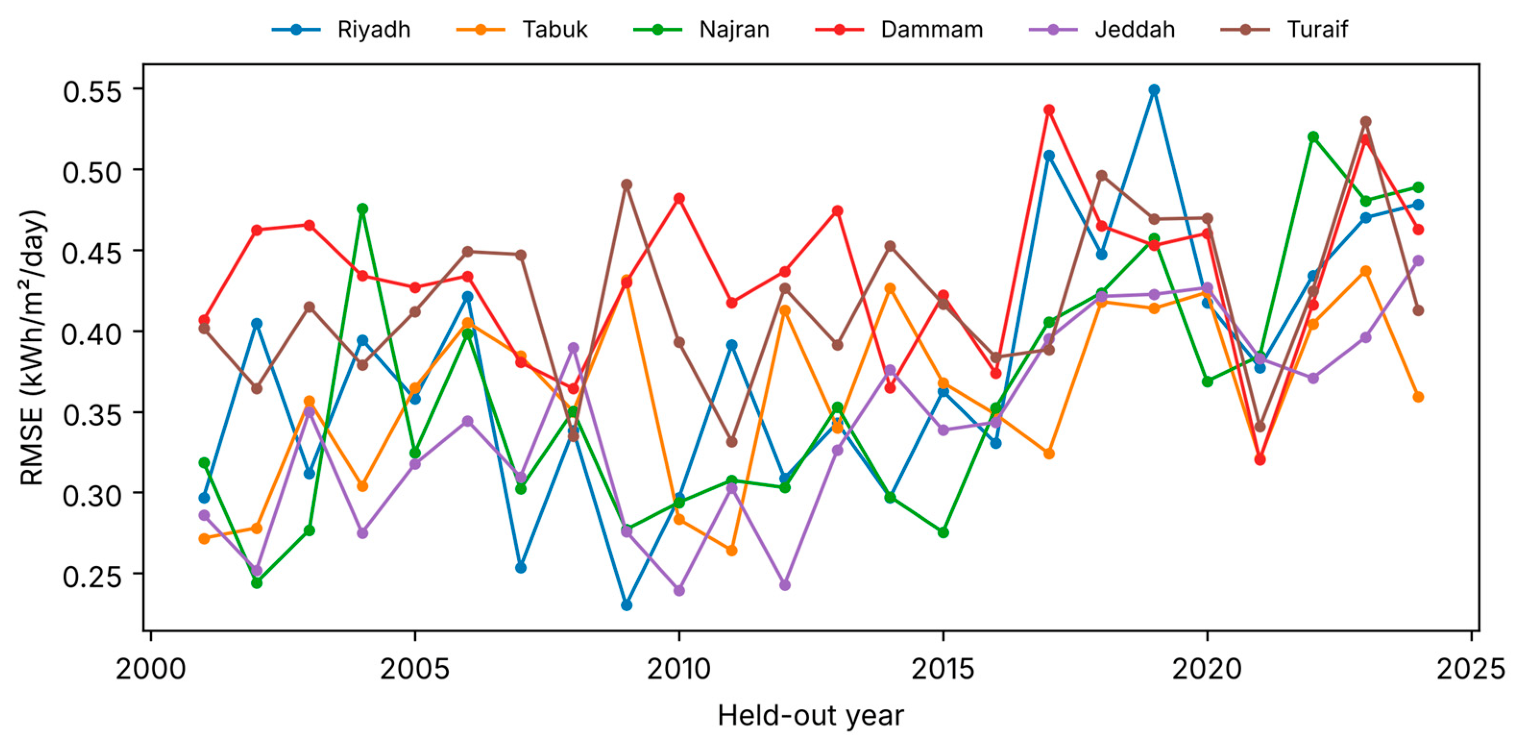
Table 5 gives 95% moving-block bootstrap confidence intervals for the test metrics of the reference (best cross-validated) model at each site. The RMSE intervals are 0.077–0.114 kWh/m2/day wide, about two orders of magnitude wider than the largest difference between algorithm means (0.001 kWh/m2/day), so the between-algorithm differences in Section 3.2 are negligible relative to sampling uncertainty. The differences in RMSE between sites (0.391–0.457 kWh/m2/day) are of the same order as the intervals and should not be over-interpreted. By contrast, the lower MAPE at Tabuk and Najran (intervals 4.0–5.6%) than at Dammam (6.0–8.0%) and the lower R2 at Najran (0.72–0.82, against at least 0.87 elsewhere) exceed sampling uncertainty. Leave-one-year-out validation (Figure 5) gave a mean RMSE of 0.343–0.434 kWh/m2/day across sites, with a year-to-year standard deviation of 0.050–0.081 kWh/m2/day. Single-year RMSE ranged from 0.230 kWh/m2/day at Riyadh in 2009 to 0.549 kWh/m2/day at Riyadh in 2019; the most difficult year differed by site (2017 at Dammam, 2019 at Riyadh, 2022 at Najran, 2023 at Tabuk and Turaif, 2024 at Jeddah), so no single anomalous year drives the results.
Table 5.
Test-set metrics (2020–2024) of the reference tuned Random Forest at each site, with 95% moving-block bootstrap confidence intervals in brackets. MAE, RMSE and MBE in kWh/m2/day.
Figure 5.
Leave-one-year-out RMSE by held-out year and site, 2001–2024.
3.4. Systematic Error and Sky Conditions
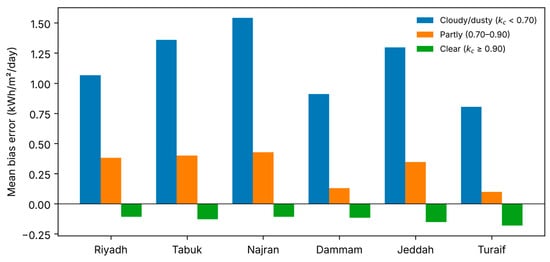
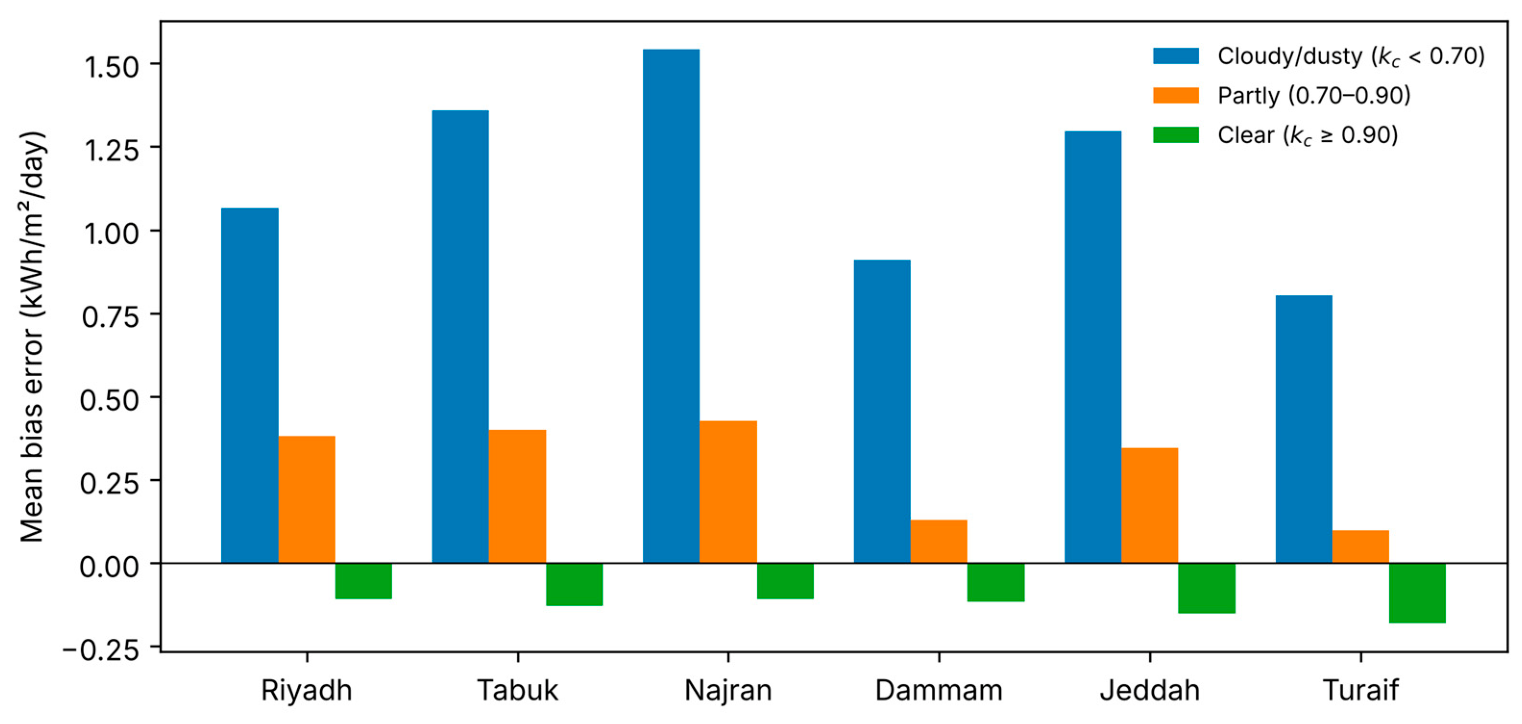
Overall mean bias was small at every site (−0.089 to +0.006 kWh/m2/day, i.e., −1.5% to +0.1% of mean GHI), although at Tabuk, Jeddah and Turaif the slight negative bias is distinguishable from zero (Table 5). Seasonal MBE stayed between −0.15 and +0.07 kWh/m2/day. Stratifying by sky condition reveals a clear systematic pattern (Figure 6). On clear days, which make up 78–89% of the test period, the model slightly underestimates GHI (MBE −0.18 to −0.11 kWh/m2/day) with a MAPE of only 2.5–4.0%. On cloudy or dust-affected days, it overestimates GHI (MBE +0.80 to +1.54 kWh/m2/day), and RMSE rises to 1.05–1.75 kWh/m2/day. This is the expected behavior of a regression model that regresses toward the conditional mean when its inputs carry only indirect information about cloud and aerosol, and it concentrates much of the residual error in the 2.2–6.4% of test days with kc < 0.70. On days with an abrupt GHI drop of more than 1.5 kWh/m2, RMSE was 1.17–1.66 kWh/m2/day, 2.6–3.9 times the all-day value. Seasonally, summer (June–August) is among the most accurate seasons at five sites (RMSE 0.23–0.34 kWh/m2/day) but the least accurate at Najran (0.60 kWh/m2/day).
Figure 6.
Mean bias error of the reference model by sky condition at each site (test period 2020–2024).
3.5. Additional Meteorological Predictors and Physics-Informed Variant
Table 6 compares the tuned model on the original seven predictors (F0) with the extended feature set (F1, adding surface pressure, specific humidity and diurnal temperature range), the physics-informed clear-sky-index variant, and the reference baselines. Adding the three predictors reduced test RMSE at every site, by 0.012–0.024 kWh/m2/day (2.7–5.5%), with the largest gains at Turaif and Jeddah. The physics-informed variant was the most accurate model at all six sites (RMSE 0.372–0.440 kWh/m2/day), 0.001–0.011 kWh/m2/day below the direct F1 model and 3.8–7.5% below the F0 model. Permutation importance (Supplementary Table S2) ranked clear-sky GHI far above all other predictors (an increase in RMSE of 0.78–2.09 kWh/m2/day when permuted). The diurnal temperature range came second at Riyadh, Tabuk, Turaif, Jeddah and Najran (0.04–0.15 kWh/m2/day), with specific humidity almost as important at Najran (0.04 kWh/m2/day). At Dammam, the next most important predictors were mean temperature (0.10), precipitation (0.08) and surface pressure (0.05 kWh/m2/day). Surface pressure otherwise contributed modestly (0.003–0.030 kWh/m2/day). All Random Forest variants outperformed the clear-sky climatology baseline (RMSE 0.432–0.562 kWh/m2/day). Linear regression (RMSE 0.396–0.526 kWh/m2/day) was beaten by the tuned F0 model at five sites but not at Jeddah (0.403 versus 0.415 kWh/m2/day), whereas the F1 and physics-informed models beat it everywhere. Notably, the untuned Random Forest with default settings was within 0.010 kWh/m2/day of the tuned F0 model at every site and slightly better at Najran and Riyadh, so hyperparameter tuning itself contributed little to accuracy.
Table 6.
Test-set (2020–2024) RMSE in kWh/m2/day, with R2 in parentheses, for the reference baselines, the Random Forest with default settings, the tuned Random Forest with the original (F0) and extended (F1) predictors, and the physics-informed variant.
3.6. Transfer to an Unmonitored Site
In the leave-one-site-out experiment, a single model trained on five sites estimated GHI at the excluded site with an RMSE of 0.406–0.672 kWh/m2/day (R2 0.626–0.948), compared with 0.376–0.444 kWh/m2/day for site-specific models (Supplementary Table S3). Transfer worked well to Riyadh, Tabuk and Turaif, where RMSE rose by only 0.011–0.030 kWh/m2/day. It degraded strongly at the two coastal sites, Jeddah (+0.280) and Dammam (+0.222 kWh/m2/day), and at Najran (+0.141 kWh/m2/day), with a marked negative bias (MBE −0.25 to −0.42 kWh/m2/day). These are the sites whose climates are least represented by the other five: the humid coastal settings and the low-latitude, high-elevation southern site.
4. Discussion
The central finding of this study—that metaheuristic choice does not significantly affect Random Forest solar radiation prediction accuracy once optimization conditions are held fair across algorithms, and that this holds across ten random seeds and a 24-year record—carries a methodological caution for the broader metaheuristic-optimization literature in renewable energy forecasting: apparent performance rankings reported elsewhere may often reflect experimental design artifacts (unequal optimization budgets, inconsistent fitness functions, or insufficient control for randomness) rather than genuine algorithmic superiority. Comparative studies should therefore build fairness controls into their design from the outset rather than applying them retrospectively, and should be transparent about the optimization budget and fitness function used for each algorithm being compared.
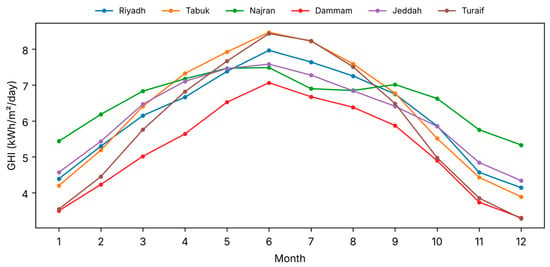
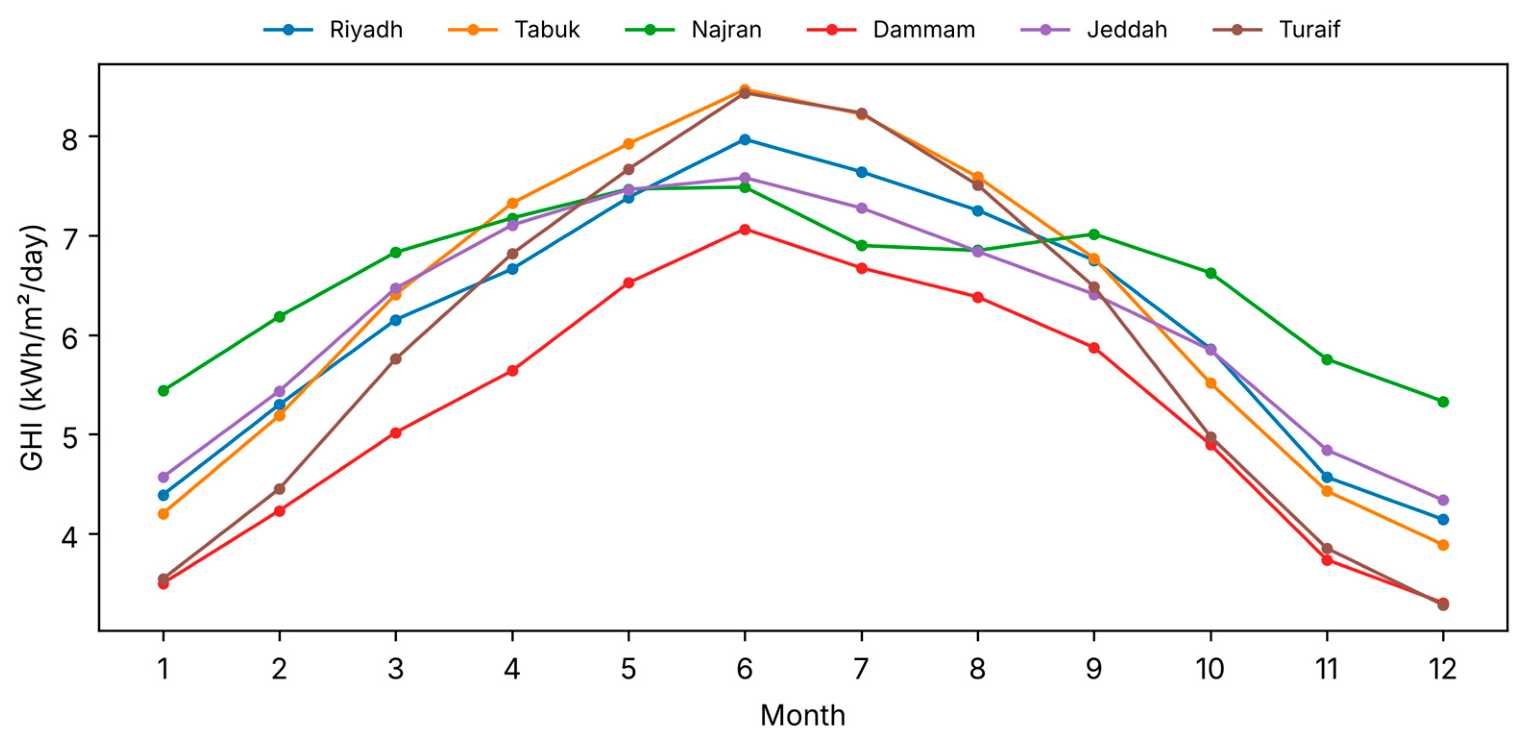
Performance varied considerably by region, but this variation tracked geography and climate rather than algorithm choice. Tabuk and Turaif, the two northern continental sites, achieved the highest R2 values, consistent with a large, regular seasonal cycle at higher latitudes. Najran’s lower R2 needs careful interpretation, because R2 measures error relative to the variance of the target. Najran lies at 17.5° N, where the seasonal cycle of GHI is the flattest of the six sites (Figure 7; amplitude of monthly mean GHI 2.09 kWh/m2/day, against 5.15 kWh/m2/day at Turaif), so its test-period GHI has a standard deviation of only 0.96 kWh/m2/day, compared with 1.28–1.93 kWh/m2/day at the other sites (Table 7). Its absolute errors are not unusually large: its RMSE (0.457 kWh/m2/day) is close to those of the other sites (0.391–0.454 kWh/m2/day), its normalized RMSE (7.1%) is mid-range (6.2–8.7%) and its MAPE is among the lowest, so the same absolute error translates into a lower R2. Across the six sites, R2 follows seasonal amplitude almost monotonically (Spearman ρ = 0.94, p = 0.005). The variance Najran does have comes largely from irregular, short-lived events rather than from the predictable seasonal cycle. The site lies on the margin of the Empty Quarter and is exposed to dust outbreaks that reduce direct and global irradiance [29], as well as to occasional summer convective cloud associated with the southwest monsoon flow over the adjacent highlands. Consistent with this, summer is Najran’s least accurate season, whereas it is among the most accurate elsewhere (Section 3.4). These events are only weakly reflected in daily temperature, humidity and precipitation, which limits how much of the variance any model using these inputs can explain. Dammam, the Gulf coastal site, showed the highest MAPE. It has the highest humidity of the six sites (mean relative humidity 50.4%) and the largest share of cloudy or hazy test days (6.3%), consistent with coastal haze, and it is the only site where temperature, precipitation and pressure carry substantial information beyond clear-sky GHI (Section 3.5). These region-specific patterns suggest that improving prediction accuracy further in southern and Gulf-coastal Saudi Arabia may require additional aerosol- or cloud-related predictors rather than a different optimization algorithm.
Figure 7.
Monthly mean GHI by region, 2001–2024, illustrating seasonal irradiance patterns across the six climate zones.
Table 7.
Test-period (2020–2024) characteristics of the six sites and errors of the reference model: GHI mean and standard deviation, seasonal amplitude of monthly mean GHI (all in kWh/m2/day), share of cloudy or dust-affected days (kc < 0.70), RMSE (kWh/m2/day), normalized RMSE and R2.
Two sources of systematic error should be distinguished. The first lies in the reference data. NASA POWER GHI is itself a satellite-derived estimate with a daily RMSE of about 12% against BSRN stations [16], and validation studies elsewhere report larger errors in humid coastal and convectively active regions [30]. A model trained on POWER inherits these errors, so the metrics reported here measure agreement with POWER rather than with ground truth, and Dammam and Najran are the sites where this distinction is likely to matter most. The second lies in the model itself: as Section 3.4 shows, it slightly underestimates clear days and overestimates cloudy or dusty ones. This is the practical consequence of not representing scattering and absorption explicitly. The clear-sky input captures the deterministic part of radiative transfer, but the reduction caused by clouds and aerosols has to be inferred from indirect proxies, and that inference is weakest for sudden events. At daily resolution, cloud bands passing within a day are integrated into a single value, and abrupt cloud or dust events that leave little trace in daily temperature or humidity are underpredicted in magnitude. Capturing them would require inputs that observe clouds and aerosols directly, such as satellite cloud fraction, aerosol optical depth or sky-camera images, at sub-daily resolution. This is beyond the low-input scope of the present framework, but it identifies the clearest route to further improvement, consistent with recent surveys of AI-driven solar forecasting that point to hybrid physics–data approaches as the main frontier [31].
Extending the record from six to 24 years matters for two reasons. It increases the number of independent seasonal cycles available for training and testing and allows interannual variability to be quantified directly (Section 3.3). It also bears on extrapolation: a Random Forest cannot predict outside the range of its training targets, so a model trained on a short window may fail in an unusually cloudy, dusty or hot year. Over 2020–2024, only 0.2–0.9% of test days had any predictor outside its 2001–2019 range, so within the period studied the models mostly interpolate. The record nevertheless shows that the inputs are not stationary. Annual mean GHI declined significantly at all six sites (Sen’s slope −0.04 to −0.12 kWh/m2/day per decade; Mann–Kendall p ≤ 0.03), and mean temperature rose by 0.25–0.49 °C per decade at five sites (p ≤ 0.01; not significant at Najran). The decline in GHI may reflect increasing aerosol loading, but changes in the satellite products underlying POWER could also contribute, and ground measurements would be needed to separate the two. Over the multi-decade lifetime of solar plants, such shifts will move the distributions of the predictors, so models used for long-term planning should be retrained periodically, checked for out-of-range inputs, and accompanied by explicit uncertainty estimates when their outputs feed grid, storage or demand-side decisions [32].
These results are also broadly consistent with the only other multi-region Saudi solar forecasting study to date: Rashid et al. [14] reported an ANN model MAPE of 7.10% for Najran using a single year (2023) of NASA POWER data across eight ML architectures without hyperparameter optimization. The present study’s fairness-controlled, metaheuristic-optimized Random Forest achieved a lower MAPE of 4.75–4.76% for the same region using a 24-year record, although the test periods of the two studies differ, suggesting that systematic hyperparameter tuning—rather than model architecture alone—can meaningfully close, or even reverse, performance gaps previously attributed to model choice. This reinforces the paper’s central methodological message: how a model is tuned and compared may matter as much as which model or which metaheuristic is chosen.
From a practical standpoint, these findings suggest that solar-project developers and grid planners in Saudi Arabia need not invest significant effort in selecting among GA, PSO, FFA, EHO, or GWO for Random Forest-based solar radiation forecasting, since the choice made no meaningful difference to accuracy in any of the six regions tested. Effort is better directed toward region-specific feature engineering and toward securing higher-quality, potentially ground-truth (K.A.CARE) data for regions such as Najran and Dammam where satellite-derived NASA POWER estimates left more unexplained variance. Other approaches to improving forecasting accuracy in similarly challenging conditions have combined optimization algorithms with deep sequence models, such as Khafaga et al.’s [33] adaptive dynamic squirrel search optimization paired with long short-term memory networks, or focused specifically on forecasting the temperature and irradiance inputs that feed downstream photovoltaic power models, as in Tercha et al. [34]; both directions represent complementary extensions to the Random Forest-based approach used here rather than alternatives to it.
The framework is intended for three groups of users. (i) Developers and consultants at the pre-feasibility stage, who need daily GHI series for candidate sites that have no radiometer but have, or can obtain, routine meteorological observations; a model trained as described here converts those observations into a GHI series whose expected error is given by the site-level metrics and confidence intervals in Table 5 and Table 7. (ii) Operators of monitoring networks, who can use the same models to fill gaps or flag suspect values when a pyranometer fails but temperature and humidity sensors keep recording. (iii) Researchers comparing optimizers, for whom the fairness-controlled protocol (equal evaluation budgets, identical fitness functions, repeated seeds and significance testing within and across sites) is directly reusable. The conditions of use follow from the results: the models are suited to daily rather than sub-daily estimates, to climates represented in the training data (the leave-one-site-out degradation at Jeddah, Dammam and Najran shows the risk of transferring to a dissimilar climate), and to applications that can tolerate larger errors on cloudy and dust-affected days. In future, the procedure could be retrained on K.A.CARE ground measurements where access can be arranged, coupled with day-ahead numerical weather prediction to turn the estimator into a forecasting tool, or embedded in PV yield, solar-tracking and storage-sizing workflows [35]. The code and processed data are released to make this reuse straightforward (see Data Availability Statement).
5. Conclusions
This study compared five metaheuristics for tuning Random Forest estimates of daily GHI at six Saudi desert sites, using 24 years of NASA POWER data under a design that equalized the optimization budget, search space, fitness function and number of repeated runs. The main findings are as follows. (1) The choice of metaheuristic did not matter for accuracy: across ten seeds and six sites, GA, PSO, FFA, EHO and GWO differed by less than 0.03 percentage points of MAPE within any site; neither between-site nor within-site tests found a significant difference, and an untuned Random Forest performed almost as well as the tuned models. (2) Site climate mattered far more: test MAPE ranged from 4.75% at Najran to 6.97% at Dammam, and Najran’s low R2 stems from its small seasonal variance rather than from larger absolute errors. (3) The residual error is largely systematic: it is concentrated on cloudy and dust-affected days, which the model overestimates, whereas clear days are estimated with a MAPE of 2.5–4.0%. Adding surface pressure, specific humidity and diurnal temperature range improved RMSE by 2.7–5.5%, a physics-informed clear-sky-index formulation by 3.8–7.5%, and performance was stable across years (leave-one-year-out RMSE standard deviation 0.050–0.081 kWh/m2/day). (4) Comparisons of metaheuristics should therefore report evaluation budgets, seeds and significance tests explicitly; without them, apparent rankings may reflect experimental artefacts rather than algorithmic merit.
The main limitations are that the reference GHI is a satellite-derived product (daily RMSE of about 12% against ground stations) rather than ground truth, so the reported errors measure agreement with NASA POWER; that daily inputs cannot resolve sub-daily cloud dynamics; that only three Random Forest hyperparameters and a modest budget of 60 fitness evaluations per run were explored; that six sites do not cover all of Saudi Arabia’s desert subclimates; and that the significant downward trend in POWER GHI over 2001–2024 cannot be attributed to atmospheric change rather than product changes without ground data.
Future work should validate the models against K.A.CARE ground measurements, add aerosol optical depth and satellite cloud information for the southern and coastal sites, couple the estimator with numerical weather prediction for day-ahead forecasting, and test whether the finding that optimizer choice matters less than fair experimental design holds for other learners and other arid regions.
Supplementary Materials
The following supporting information can be downloaded at https://www.mdpi.com/article/10.3390/atmos17111066/s1: Table S1: Within-region Kruskal–Wallis tests across the ten replicate runs per algorithm (test period 2020–2024). “Between-algorithm range” is the difference between the best and worst algorithm means; “within-algorithm SD” is the mean seed-to-seed standard deviation; Table S2: Permutation importance of the extended-feature (F1) model: mean increase in test RMSE (kWh/m2/day) when each predictor is permuted (10 repeats, test period 2020–2024); Table S3: Leave-one-site-out transfer: a single model trained on the other five sites (F1 predictors plus latitude, longitude and elevation) versus the site-specific F1 model, evaluated on 2020–2024. RMSE and MBE in kWh/m2/day.
Author Contributions
Conceptualization, A.A.; methodology, A.A.; software, A.A.; validation, T.D.; formal analysis, A.A.; investigation, A.A.; resources, T.D.; data curation, A.A.; writing—original draft preparation, A.A.; writing—review and editing, T.D.; visualization, A.A.; supervision, T.D.; project administration, A.A. All authors have read and agreed to the published version of the manuscript.
Funding
This research received no external funding.
Institutional Review Board Statement
Not applicable.
Informed Consent Statement
Not applicable.
Data Availability Statement
The NASA POWER data used in this study are publicly available at https://power.larc.nasa.gov/ (accessed on 22 October 2026). The analysis code, processed datasets and full experimental results generated during this study are openly available on Zenodo at https://doi.org/10.5281/zenodo.23598720.
Acknowledgments
During the preparation of this manuscript, the authors used Claude Opus 5.5 (Anthropic) to assist with data processing, statistical analysis, and manuscript drafting. All AI-assisted outputs were critically reviewed, verified, and edited by the authors. The authors take full responsibility for the accuracy, integrity, and final content of the manuscript.
Conflicts of Interest
The authors declare no conflicts of interest.
Abbreviations
The following abbreviations are used in this manuscript:
| ANN | Artificial Neural Network |
| BSRN | Baseline Surface Radiation Network |
| CERES | Clouds and the Earth’s Radiant Energy System |
| DTR | Diurnal Temperature Range |
| EHO | Elephant Herding Optimization |
| FFA | Firefly Algorithm |
| GA | Genetic Algorithm |
| GHI | Global Horizontal Irradiance |
| GWO | Grey Wolf Optimization |
| K.A.CARE | King Abdullah City for Atomic and Renewable Energy |
| kc | Clear-sky index (GHI/GHIclear) |
| MAE | Mean Absolute Error |
| MAPE | Mean Absolute Percentage Error |
| MBE | Mean Bias Error |
| MSE | Mean Squared Error |
| NASA POWER | NASA Prediction of Worldwide Energy Resources |
| PSO | Particle Swarm Optimization |
| R2 | Coefficient of Determination |
| RF | Random Forest |
| RMSE | Root Mean Squared Error |
References
- Farahat, A.; Kambezidis, H.D.; Labban, A. The solar radiation climate of Saudi Arabia. Climate 2023, 11, 75. [Google Scholar] [CrossRef] [Scilit]
- Zell, E.; Gasim, S.; Wilcox, S.; Katamoura, S.; Stoffel, T.; Shibli, H.; Engel-Cox, J.; Al Subie, M. Assessment of solar radiation resources in Saudi Arabia. Sol. Energy 2015, 119, 422–438. [Google Scholar] [CrossRef] [Scilit]
- Breiman, L. Random forests. Mach. Learn. 2001, 45, 5–32. [Google Scholar] [CrossRef] [Scilit]
- Yang, L.; Zhang, X.; Liang, S.; He, T.; Zhang, Y. A machine learning approach to estimation of downward solar radiation from satellite-derived data products: An application over a semi-arid ecosystem in the U.S. PLoS ONE 2017, 12, e0180239. [Google Scholar] [CrossRef] [Scilit] [PubMed]
- Villegas-Mier, C.; Rodriguez-Resendiz, J.; Álvarez-Alvarado, J.; Jiménez-Hernández, H.; Odry, Á. Optimized random forest for solar radiation prediction using sunshine hours. Micromachines 2022, 13, 1406. [Google Scholar] [CrossRef] [Scilit] [PubMed]
- Hissou, H.; Benkirane, S.; Guezzaz, A.; Azrour, M.; Beni-Hssane, A. A novel machine learning approach for solar radiation estimation. Sustainability 2023, 15, 10609. [Google Scholar] [CrossRef] [Scilit]
- Solano, E.S.; Affonso, C.M. Solar irradiation forecasting using ensemble voting based on machine learning algorithms. Sustainability 2023, 15, 7943. [Google Scholar] [CrossRef] [Scilit]
- Chaibi, M.; Benghoulam, E.M.; Tarik, L.; Berrada, M.; El Hmaidi, A. Machine learning models based on random forest feature selection and Bayesian optimization for predicting daily global solar radiation. Int. J. Renew. Energy Dev. 2022, 11, 309–323. [Google Scholar] [CrossRef] [Scilit]
- Bakır, H. Prediction of daily global solar radiation in different climatic conditions using metaheuristic search algorithms: A case study from Türkiye. Environ. Sci. Pollut. Res. 2024, 31, 43211–43237. [Google Scholar] [CrossRef] [Scilit] [PubMed]
- Mohandes, M.; Rehman, S. Artificial neural network estimation of global solar radiation using air temperature and relative humidity. Energy Policy 2008, 36, 571–576. [Google Scholar] [CrossRef] [Scilit]
- Gouda, S.G.; Hussein, Z.; Luo, S.; Yuan, Q. Model selection for accurate daily global solar radiation prediction in China. J. Clean. Prod. 2019, 221, 132–144. [Google Scholar] [CrossRef] [Scilit]
- Hossain, M.K.; Arifuzzaman, M.; Seliaman, M.E.; Rahman, A.; Sarker, D.; Altammar, H. Ensemble learning algorithms for solar power prediction in Saudi Arabia: A data-driven approach. In Proceedings of the 2024 ASU International Conference in Emerging Technologies for Sustainability and Intelligent Systems (ICETSIS), Manama, Bahrain, 28–29 January 2024; pp. 1368–1372. [Google Scholar]
- Alabdulhadi, A.A.; Rehman, S.; Ali, A.; Shafiullah, M. Deep learning framework for wind speed prediction in Saudi Arabia. Neural Comput. Appl. 2025, 37, 3685–3701. [Google Scholar] [CrossRef] [Scilit]
- Rashid, L.B.; Shuja, S.Z.; Rehman, S. Machine learning forecasting of direct solar radiation: A multi-model evaluation with trigonometric cyclical encoding. Forecasting 2025, 7, 58. [Google Scholar] [CrossRef] [Scilit]
- NASA Langley Research Center. POWER Project Data Sets. NASA Prediction of Worldwide Energy Resources. Available online: https://power.larc.nasa.gov/ (accessed on 22 October 2026).
- NASA Langley Research Center. POWER Methodology: Solar Validation. Available online: https://power.larc.nasa.gov/docs/methodology/energy-fluxes/solar-validation/ (accessed on 22 October 2026).
- Bristow, K.L.; Campbell, G.S. On the relationship between incoming solar radiation and daily maximum and minimum temperature. Agric. For. Meteorol. 1984, 31, 159–166. [Google Scholar] [CrossRef] [Scilit]
- Pedregosa, F.; Varoquaux, G.; Gramfort, A.; Michel, V.; Thirion, B.; Grisel, O.; Blondel, M.; Prettenhofer, P.; Weiss, R.; Dubourg, V.; et al. Scikit-learn: Machine learning in Python. J. Mach. Learn. Res. 2011, 12, 2825–2830. [Google Scholar]
- Van Thieu, N.; Mirjalili, S. MEALPY: An open-source library for latest meta-heuristic algorithms in Python. J. Syst. Archit. 2023, 139, 102871. [Google Scholar] [CrossRef] [Scilit]
- Mirjalili, S.; Mirjalili, S.M.; Lewis, A. Grey wolf optimizer. Adv. Eng. Softw. 2014, 69, 46–61. [Google Scholar] [CrossRef] [Scilit]
- Holland, J.H. Genetic algorithms. Sci. Am. 1992, 267, 66–72. [Google Scholar] [CrossRef] [Scilit]
- Kennedy, J.; Eberhart, R. Particle swarm optimization. In Proceedings of the ICNN’95—International Conference on Neural Networks, Perth, WA, Australia, 27 November–1 December 1995; Volume 4, pp. 1942–1948. [Google Scholar]
- Yang, X.S. Firefly algorithm, stochastic test functions and design optimisation. Int. J. Bio-Inspir. Comput. 2010, 2, 78–84. [Google Scholar] [CrossRef] [Scilit]
- Wang, G.G.; Deb, S.; Coelho, L.D.S. Elephant herding optimization. In Proceedings of the 2015 3rd International Symposium on Computational and Business Intelligence (ISCBI), Bali, Indonesia, 7–9 December 2015; pp. 1–5. [Google Scholar]
- Friedman, M. The use of ranks to avoid the assumption of normality implicit in the analysis of variance. J. Am. Stat. Assoc. 1937, 32, 675–701. [Google Scholar] [CrossRef] [Scilit]
- Nemenyi, P.B. Distribution-Free Multiple Comparisons. Ph.D. Thesis, Princeton University, Princeton, NJ, USA, 1963. [Google Scholar]
- Künsch, H.R. The jackknife and the bootstrap for general stationary observations. Ann. Stat. 1989, 17, 1217–1241. [Google Scholar] [CrossRef] [Scilit]
- Sen, P.K. Estimates of the regression coefficient based on Kendall’s tau. J. Am. Stat. Assoc. 1968, 63, 1379–1389. [Google Scholar] [CrossRef]
- Labban, A.; Farahat, A. Effect of major dust events on ambient temperature and solar irradiance components over Saudi Arabia. Atmosphere 2023, 14, 408. [Google Scholar] [CrossRef] [Scilit]
- Quansah, A.D.; Dogbey, F.; Asilevi, P.J.; Boakye, P.; Darkwah, L.; Oduro-Kwarteng, S.; Sokama-Neuyam, Y.A.; Mensah, P. Assessment of solar radiation resource from the NASA-POWER reanalysis products for tropical climates in Ghana towards clean energy application. Sci. Rep. 2022, 12, 10684. [Google Scholar] [CrossRef] [Scilit] [PubMed]
- Alhazmi, A. A comprehensive survey of AI/ML-driven optimization, predictive control, and innovative solar technologies. Energies 2026, 19, 1847. [Google Scholar] [CrossRef] [Scilit]
- Alhazmi, A.; Alsubhi, M.A. Beyond the forecast: A systematic review of uncertainty-aware and explainable AI from power-system forecasting to grid, storage, and demand-side decisions. OSF Preprints 2026. [Google Scholar] [CrossRef]
- Khafaga, D.S.; Alhussan, A.A.; Eid, M.M.; El-kenawy, E.-S.M. Improving solar radiation source efficiency using adaptive dynamic squirrel search optimization algorithm and long short-term memory. Front. Energy Res. 2023, 11, 1164528. [Google Scholar] [CrossRef] [Scilit]
- Tercha, W.; Tadjer, S.A.; Chekired, F.; Canale, L. Machine learning-based forecasting of temperature and solar irradiance for photovoltaic systems. Energies 2024, 17, 1124. [Google Scholar] [CrossRef] [Scilit]
- Alhazmi, A.; Maswadi, K.; Eke, C.I. A systematic review of advances in deep learning architectures for efficient and sustainable photovoltaic solar tracking: Research challenges and future directions. Sustainability 2025, 17, 9625. [Google Scholar] [CrossRef] [Scilit]

Disclaimer/Publisher’s Note: The statements, opinions and data contained in all publications are solely those of the individual author(s) and contributor(s) and not of MDPI and/or the editor(s). MDPI and/or the editor(s) disclaim responsibility for any injury to people or property resulting from any ideas, methods, instructions or products referred to in the content. |
© 2026 by the authors. Licensee MDPI, Basel, Switzerland. This article is an open access article distributed under the terms and conditions of the Creative Commons Attribution (CC BY) license.