


Abstract
This study investigates particle number concentrations (PNCs), particle number size distributions (PNSDs), and equivalent black carbon (eBC) concentrations during ironing with a typical steam iron and a steam iron with a portable boiler under different ventilation conditions. Measurements were conducted in a residential environment under low- and higher-ventilation conditions. Ironing caused a rapid and substantial increase in PNC, with concentrations increasing by up to approximately two orders of magnitude during the activity, particularly for particles between 20 and 80 nm. The maximum PNC reached 7.12 × 10⁵ particles cm−3 for the typical steam iron under low-ventilation conditions. Particle concentrations decreased after ironing, although the decay was slower for particles larger than approximately 80 nm. Estimated particle number emission rates ranged from 8.1 × 10¹¹ to 1.5 × 10¹² particles min−1, with the highest emission rate obtained for the steam iron with a portable boiler under low-ventilation conditions. PNSDs were fitted using one or two lognormal distributions, depending on the shape of the measured distributions. Ironing produced a shift in the modal particle diameters towards larger sizes, particularly during the post-ironing period. Higher ventilation reduced particle concentrations and accelerated particle removal from the indoor environment. eBC concentrations showed only modest changes during ironing, with a slight increase under low-ventilation conditions. These results demonstrate that ironing can be an important indoor source of ultrafine and fine particles and that ventilation plays an important role in controlling their indoor concentration and persistence.
1. Introduction
In recent years, the number of studies on pollutant emissions in indoor environments has increased [1,2], since indoor air quality poses a risk to human health [3]. Considering that indoor environments are where people spend most of their time, there is high personal exposure to pollutants. Several studies have assessed the air quality in distinct indoor settings, such as day care centres [4], schools [5,6], cafeterias [7], hospitals [8] or nursing homes [9,10]. Nevertheless, the number of papers on air quality in homes is still small compared to the time people spend in their dwellings. Ref. [11] estimated that European citizens spend 56 to 66% of their day at home. A similar study on the American continent reported values around 65–69% [12].
It is worth stressing that domestic activities are the main source of air pollution in homes, affecting our quality of life, including sleep patterns [13]. Studies have analysed the influence of household activities such as vacuuming [14], smoking [3,15], cooking [16,17,18,19,20] or incense smoke [21] on indoor air quality.
In indoor places, people are exposed to particles generated indoors and a background of airborne particles originating from the outdoors. Ref. [22] reported indoor/outdoor (I/O) ratios from 1.14 to 3.91 for PM10 and from 1 to 2.4 for PM2.5. Infiltration of outdoor particles is substantially altered by the indoor deposition rate and particle size-specific differences in the penetration efficiency [23,24,25]. Ref. [24] showed that particles in the accumulation mode (diameter between 100 and 1000 nm) are expected to penetrate most effectively. Moreover, ultrafine particles (UFPs; particles with a diameter lower than 100 nm) can penetrate deep into the respiratory system, leading to various respiratory health outcomes [26]. Several everyday activities in residential and commercial buildings generate UFPs, e.g., electric heating or house cleaning [27,28]. These activities can produce short-term increases in airborne UFP concentrations, potentially increasing inhalation exposure during the activity [29].
Despite the increase in the number of studies, the influence of many indoor activities on aerosol particle size distributions has not yet been analysed. One of these activities is ironing, which in this work we will study as a source of aerosols. Our starting hypothesis is that, during the ironing process, particles either derived from the iron or detached from the textile garments can be released, since high temperatures are reached. Other potential particle-generation pathways include changes in relative humidity caused by steam release, the formation of residual particles from evaporated droplets containing dissolved minerals in tap water, and the release of semi-volatile organic compounds from heated textiles or finishing products. However, these mechanisms have not been directly investigated in the present study and are considered potential explanations for the observed particle emissions [17]. In Europe, as a result of a survey in 23 countries for men and women between 20 and 73 years old, it was estimated that, on average, the ironing time per day is between 5 and 20 min, with the task being mostly performed by women (85% of the time) [30]. The first assessment of this activity in a real dwelling was carried out by [31], who reported the impact of ironing on indoor PM10 levels and chemical composition for the same sampling campaign as the present study. The present study complements this previous work by providing detailed information on particle number concentrations and particle number size distributions during ironing. Although few studies have investigated emissions from ironing under real-world conditions [32], Ref. [17] conducted a laboratory study in a full-scale chamber to investigate emissions from several indoor activities. They reported the lowest UFP emission rate (1.17 × 10⁷ s−1) during ironing without steam on a cotton sheet, with a corresponding concentration of 550 cm−3. Furthermore, this study showed that ironing with steam generates 10 times more particles than ironing without. Another study has concluded that the ironing process may cause an increase in personal exposure to UFPs, mainly in employees of ironing services [33]. However, the evolution of particle number concentrations and size distributions during ironing under real-world conditions and different ventilation settings remains insufficiently characterised. Since ultrafine particles can penetrate deep into the respiratory tract, particle number concentration provides relevant complementary information for assessing indoor exposure.
The main aim of this study is to characterise the evolution of indoor particle number concentrations and particle number size distributions during steam ironing under different ventilation conditions and using different ironing devices. The temporal evolution of equivalent black carbon concentrations is also investigated.
2. Materials and Methods
2.1. Experimental Setup
A sampling campaign was carried out in a suburban house located in León (NW Spain) for six days (6 h each day) while using two types of irons: a typical 1400 W steam iron and a 2400 W steam iron with a portable boiler (Figure A1). The two devices represent common types of domestic ironing appliances and differ in nominal power and steam-generation design. Since the operating temperature was not monitored and emissions from individual garments could not be isolated, differences in particle emissions cannot be attributed solely to the nominal power of the devices. As in other studies [34,35], the tests were performed under different ventilation conditions, typical of a common home: (i) windows closed and doors closed (low ventilation, LV); (ii) windows closed and door open (higher ventilation, HV). Ventilation was natural, with no mechanical ventilation system used during the experiments, to reproduce typical residential conditions. Measurements were carried out in the living room (volume = 91.9 m3), where only two people were present: one ironing and the other taking notes during the activity. After the ironing process, the ventilation settings were maintained until the initial conditions were restored. Furthermore, background indoor air measurements were also performed before ironing began. Both occupants were present in the room during the background measurements performed before ironing, so any particle resuspension associated with their presence is included in the background concentrations. Occupant activity during ironing (e.g., movement while handling garments) may have caused additional resuspension, which cannot be separated from the emissions of the ironing process.
To keep track of the process, every garment was weighed and registered. The ironing time for each garment was also recorded. Different types of garments and household linens of diverse fabrics were ironed, including jeans, trousers, t-shirts, cotton cloths, sheets and towels, so the ironing is representative of a common home.
2.2. Instrumentation
Continuous monitoring (6 min basis) of ultrafine, fine and accumulation aerosol particle size distributions was conducted by a Scanning Mobility Particle Sizer spectrometer (Model 3938; TSI Incorporated, Shoreview, MN, USA). The charge and diffusion corrections in the line and system were applied according to the Aerosols, Clouds and Trace Gases Research Infrastructure (ACTRIS) SMPS standards [36]. The range analysed was between 7.6 and 310.6 nm in 110 channels. The flow ratio was set at 1 and 10 L min−1 for aerosol and sheath flow, respectively. Particle losses were taken into account based on an equivalent pipe length [36]. This study only characterises particles within the SMPS measurement range of 7.6–310.6 nm and does not assess emissions of larger particles.
To quantify particle number concentrations (PNCs), the following size modes were considered in this study: nucleation mode (Nnuc) between 7.6 and 30 nm, Aitken mode (NAit) between 30 and 100 nm, and accumulation mode (Nacc) from 100 to 310.6 nm. To compare before and after the ironing process, the variation in PNC was calculated according to Equation (1):
where C0 and C2 are the concentration before and during or after ironing, respectively.
The particle number size distributions (PNSDs) were fitted using lognormal distributions with Igor Pro 8 software (WaveMetrics, Inc., USA). Depending on the shape of the measured distribution, one or two lognormal modes were used to obtain the best representation of the experimental data. The geometric mean diameter (Dg), geometric standard deviation (σg), and particle number concentration (N) were obtained from the fitted distributions.
The aerosol light attenuation at seven wavelengths (370, 470, 520, 590, 660, 880 and 950 nm) was continuously recorded with an Aethalometer (Model AE31; Magee Scientific Corporation, Berkeley, CA, USA) to measure the equivalent black carbon (eBC) concentration. Aethalometer data were also corrected for the loading effect using the model proposed by [37]. A detailed description of the instrument can be found in [38,39].
In addition, a real-time laser photometric instrument (DustTrak DRX 8533, TSI Incorporated, Shoreview, MN, USA) [31] was used to register particulate matter mass concentrations over time (PM1, PM2.5 and PM10) with a 1 min resolution. Temperature and relative humidity were measured continuously using an indoor air quality probe (Model 7545; TSI Incorporated, Shoreview, MN, USA). The CO2 concentration was also provided by this probe.
All instruments used in this study were calibrated by their respective manufacturers prior to the measurement campaign.
2.3. Particle Emission Rate Estimation
The ventilation rate was estimated from the decay of indoor CO2 concentration following the method described by [6]. The particle emission rate during ironing was subsequently estimated using a well-mixed indoor particle balance, following the approach described by [40]. The emission rate was estimated for the total measured particle size range and separately for each SMPS size channel. The mean particle number emission rate during ironing was calculated according to Equation (2):
where ER is the particle number emission rate (particles min−1); C and C0 are the peak and initial indoor particle number concentrations, respectively (particles m−3); is the mean concentration during ironing (particles m−3); V is the volume of the living room (m3); α is the air exchange rate (min−1); κ is the particle deposition rate (min−1); and Δt is the time interval between the initial and peak particle concentrations. The particle deposition rate (κ) was determined from the particle concentration decay observed after the ironing process, when the particle source was no longer active. The total loss rate (λ) was obtained from the slope of the linear regression of ln(C/Ce) against time, where Ce is the particle number concentration at the end of the ironing period, and κ was calculated as κ = λ − α, using the air exchange rate α obtained from the CO2 decay [41].
Uncertainties for the time to maximum PNC, the removal rate and the emission rate are expressed as the standard deviation of the two replicates performed for each condition.
3. Results and Discussion
The ambient conditions during ironing are compiled in Table A1. The temperature and relative humidity ranged between 22.0–25.1 °C and 41.2–52.4%, respectively. The results indicate a clear increase in aerosol particle number concentration (PNC) during the ironing process with a typical steam iron, reaching a mean concentration of 2.7 × 105 cm−3 and 2.3 × 105 cm−3 with LV and HV conditions, respectively. It is noteworthy that the PNC before the ironing process is four times lower with LV compared to HV, probably due to the entry of particles from outdoors to indoors before the start of ironing. However, the HV condition resulted in a lower peak PNC during ironing. The steam iron with a portable boiler showed the highest concentration, with a mean value of 3.31 × 105 cm−3 with LV. The ventilation rate (α) ranged between 0.16 and 0.42 h−1 with LV, while with HV the values were between 1.53 and 2.08 h−1.
3.1. Evolution of Aerosol Concentration
The study was divided into three cases according to the type of iron and ventilation:
- (a)
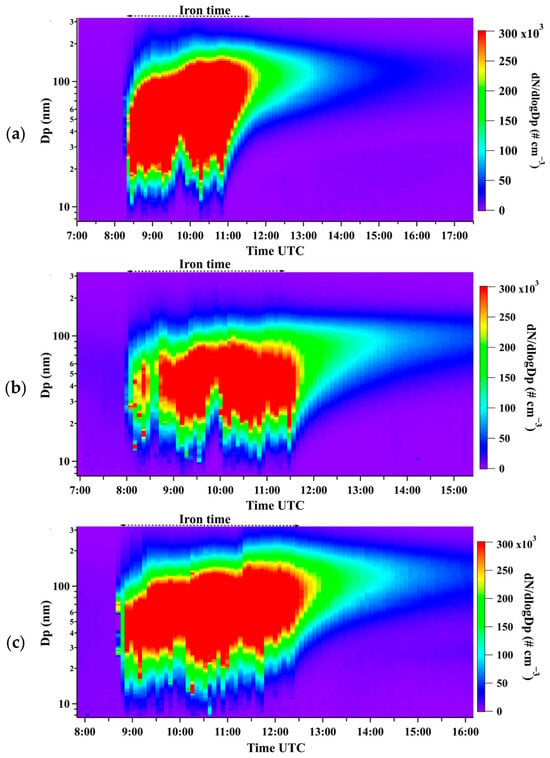
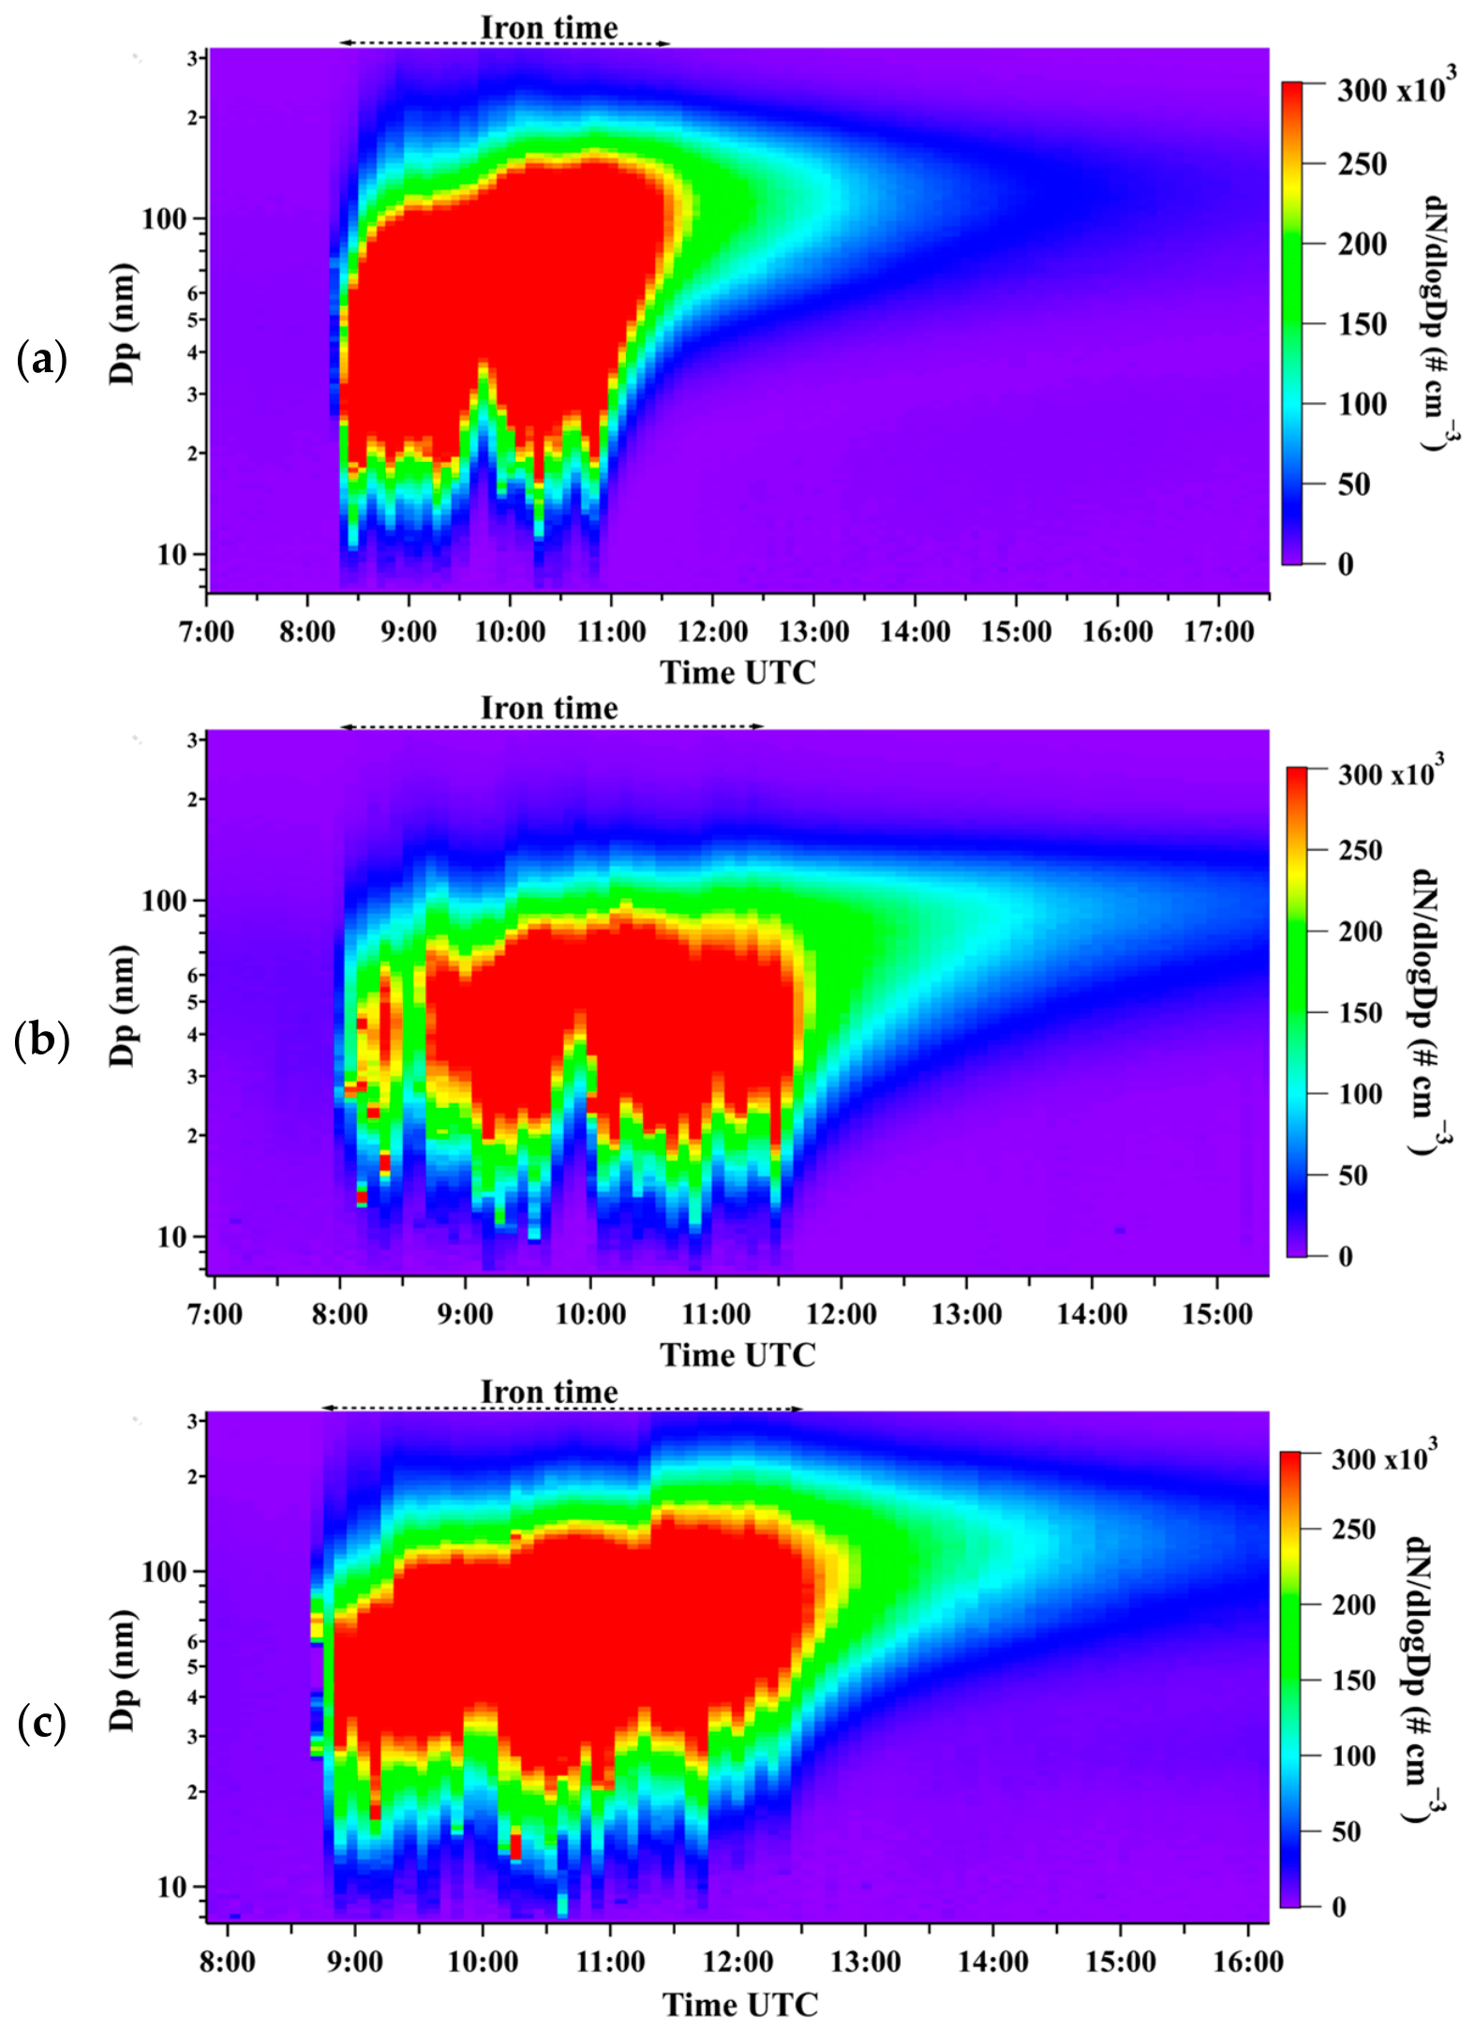
- The evolution of PNC by size bins under the LV condition using a typical steam iron is depicted in Figure 1a. The concentration before ironing was 3.17 × 103 cm−3, but a sharp increase was observed after starting the activity. During the first half hour, the concentration reached values one hundred times higher, mainly for sizes between 20 and 80 nm. The maximum concentration occurred 2 h after starting, when ironing cotton towels, reaching 7.12 × 105 cm−3, with the highest increases for sizes between 110 and 175 nm. The nucleation, Aitken and accumulation modes presented a mean %∆C increase during ironing of 4179%, 9497% and 15,811%, respectively, compared to the background air (Table 1). Comparing before and after ironing, concentration in the nucleation mode decreased 18% between before and after ironing, while the Aitken mode, and especially the accumulation mode, presented a clear increase of 600% and 4163%, respectively. This fact is observed in Figure 1a with the slow decline in particles higher than 80 nm, while the concentration of particles lower than 80 nm decreases quickly.Figure 1. Time evolution of the aerosol particle number concentration (colour-coded) between 8 and 310 nm, on a 6 min basis, before, during and after ironing with: (a) a typical steam iron (LV condition), (b) a typical steam iron (HV condition) and (c) a steam iron with a portable boiler (LV condition). The arrow indicates the ironing time.Table 1. Particle number concentration (×103 cm−3) by modes and percentages of variation between before (B) and during (D) ironing (%ΔCD-B) and between before (B) and after (A) ironing (%ΔCA-B).
- (b)
- Figure 1b shows the evolution of PNC for the typical steam iron under the HV condition. The pattern was different, with a smaller increase in particle concentration during the initial stage of ironing. The concentration before the start of ironing was 1.23 × 104 cm−3 (Table A1). During the first half hour, the concentration reached values of 1.55 × 105 cm−3, mainly for particle sizes between 30 and 60 nm. This value is half the concentration reached under the LV condition. While ironing, the highest concentration was observed for particle sizes between 43 and 95 nm, with a maximum of 3.45 × 105 cm−3. This value is also lower than the maximum under the LV condition. The nucleation, Aitken and accumulation modes presented a mean %∆C increase during ironing of 976%, 2599% and 2248%, respectively, compared to the background air (Table 1). However, it must be taken into account that the background air under the HV condition showed a higher concentration of particles than under the LV condition (Table A1). Comparing before and after ironing, the nucleation mode increased by 33%, while the Aitken and accumulation modes presented a clear increase of 560% and 1378%, respectively. This behaviour is evident in Figure 1b, which denotes a slow decrease in particles larger than 40 nm. Compared with the LV condition, it is evident that the accumulation mode increase after ironing is smaller. Thus, it seems that ventilation causes an effective removal of particles larger than 100 nm, even though the background concentration before ironing was about four times higher under HV (1.23 × 104 cm−3) than under LV (3.17 × 103 cm−3). The increase in the nucleation mode could be related to the possible infiltration of outdoor air from traffic sources [42]. However, this interpretation remains speculative because simultaneous outdoor particle measurements were not performed. Future studies should include synchronous indoor and outdoor monitoring to verify this hypothesis.
- (c)
- Under LV conditions, ironing with a steam iron equipped with a portable boiler showed a pattern like that observed for the typical steam iron under the same ventilation conditions. Before ironing, the background air displayed a higher nucleation and Aitken concentration than that registered for the typical steam iron. The concentration before the start of ironing was 1.09 × 104 cm−3, but it increased rapidly when the activity began. During the first half hour, the concentration reached 3.21 × 105 cm−3, mainly due to the contribution of particles with sizes between 20 and 100 nm. The maximum concentration occurred 1 h after the beginning, while ironing cotton cloths, reaching 5.07 × 105 cm−3. The highest increases were recorded for sizes between 150 and 310 nm. The concentrations of the nucleation, Aitken and accumulation modes presented a mean %∆C increase during ironing of 1403%, 3079% and 14,296%, respectively, compared to the air before ironing (Table 1). The comparison between before and after ironing revealed a pattern very similar to that observed for the typical steam iron. The nucleation mode decreased by 61%, while the Aitken (423%) and the accumulation (7101%) modes presented a clear increase (Figure 1c). A slow decrease in particles larger than 60 nm and a quick decrease in particles smaller than 60 nm was observed.
In summary, these results show a rapid increase in concentrations immediately after ironing began. The time required to reach the maximum PNC varied between approximately 1 and 2 h depending on the ironing and ventilation conditions. As pointed out by [31], the increase in PNC caused a sharp increase in the aerosol mass concentration, between 4.8 and 12 times, depending on the ventilation conditions. However, the concentration drop observed after source removal was clearly slow for particles larger than 80 nm in the three study cases, as reported by [17]. The PNC for sizes between 80 and 150 nm remained at high values for two or more hours. Likewise, Ref. [17] reported that “ironing with steam generates 10 times more particles than ironing without steam”. In the present study, it was also observed that a typical steam iron and a steam iron with a boiler caused a great increase in PNC in all size modes. When using the typical steam iron, the maximum PNC was 7.12 × 105 cm−3, while [17] reported a value around 7.2 × 103 cm−3, two orders of magnitude lower, probably due to the fact that the latter was carried out in a chamber. Another study, also in laboratory conditions, documented a PNC of 2.81 × 105 cm−3 [1], similar to the values obtained in the present study. It is noteworthy that steam ironing in the study by [1] presented the highest PNC among all household activities evaluated (air-freshener spraying, furniture polish spraying, floor vacuuming, etc.). Under real-world conditions, Ref. [32] reported peak PNC in the range of 2.1 × 10⁴–1.48 × 105 cm−3 in a room of 65 m3 when using a steam iron.
The differences in post-ironing particle concentrations across size modes may reflect the combined effects of coagulation, particle deposition, and ventilation, which can influence indoor particle number concentrations and size distributions [43]. Coagulation may reduce the number of smaller particles while contributing to the formation of larger particles. However, these mechanisms were not independently assessed in this study and therefore remain possible explanations rather than confirmed processes.
Even though all the garments were individually registered and weighed, the results show that individual measurements of every piece of clothing are required, as emissions from the item being ironed mix with those from previous garments still in the air. Therefore, this is a point to consider in future studies.
3.2. Particle Emission Rates
The particle number emission rates and the characteristic evolution of particle concentrations during and after ironing are summarised in Table 2.
Table 2.
Summary of time to reach maximum concentrations, particle removal rates, and particle number emission rates from ironing. Values are mean ± standard deviation of two replicate experiments.
Under all experimental conditions, particle number concentrations increased rapidly after the beginning of ironing, followed by a gradual decrease after the activity ended. The time required to reach the maximum particle number concentration was 119 ± 25 min for the typical steam iron under LV conditions, 74 ± 35 min under HV conditions, and 61 ± 39 min for the steam iron with a portable boiler under LV conditions. The shorter time required to reach the maximum concentration under HV conditions is consistent with the higher air exchange rate, which promotes particle removal from the room. The steam iron with a portable boiler also reached its maximum concentration earlier than the typical steam iron under LV conditions. These differences illustrate that the temporal evolution of indoor particle concentrations depends not only on the particle emission process but also on the ventilation conditions and particle removal processes.
After the ironing process ended, particle number concentrations progressively decreased. The particle deposition rates estimated from the post-ironing concentration decay, after subtracting the air exchange rate, were 0.42 ± 0.06, 0.61 ± 0.03 and 0.58 ± 0.03 h−1 for the typical steam iron under LV and HV conditions and the steam iron with a portable boiler under LV conditions, respectively. The differences among experiments were small compared with the difference in the air exchange rate between LV (0.16–0.42 h−1) and HV (1.53–2.08 h−1), so the faster decay observed under HV conditions is mainly attributable to ventilation rather than to deposition. Particle removal indoors can also be affected by gravitational deposition, diffusion, electrostatic effects and thermophoresis [41,44].
The estimated particle number emission rates ranged from 8.1 × 10¹¹ to 1.5 × 10¹² particles min−1. The lowest emission rate was obtained for the typical steam iron under HV conditions, whereas the highest value was obtained for the steam iron with a portable boiler under LV conditions.
These emission rates are similar to those previously reported for steam ironing. Ref. [17] reported particle emission rates of 4.2 × 10¹⁰ particles min−1 for ironing without steam and 2.2 × 10¹³ particles min−1 under steam conditions. Comparable rates have been reported for vacuum cleaning, ranging from 5.29 to 21.2 × 10¹¹ particles min−1 [14], and cooking, with reported values of 2–4 × 10¹¹ particles min−1 [19]. Ref. [45] reported emission rates ranging from 3.6 × 10⁸ to 7.86 × 10¹² particles min−1 for 18 different indoor activities, further highlighting the relevance of ironing as an indoor particle source.
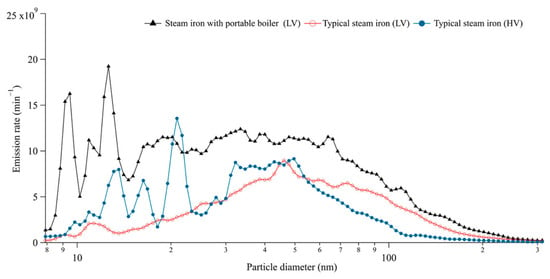
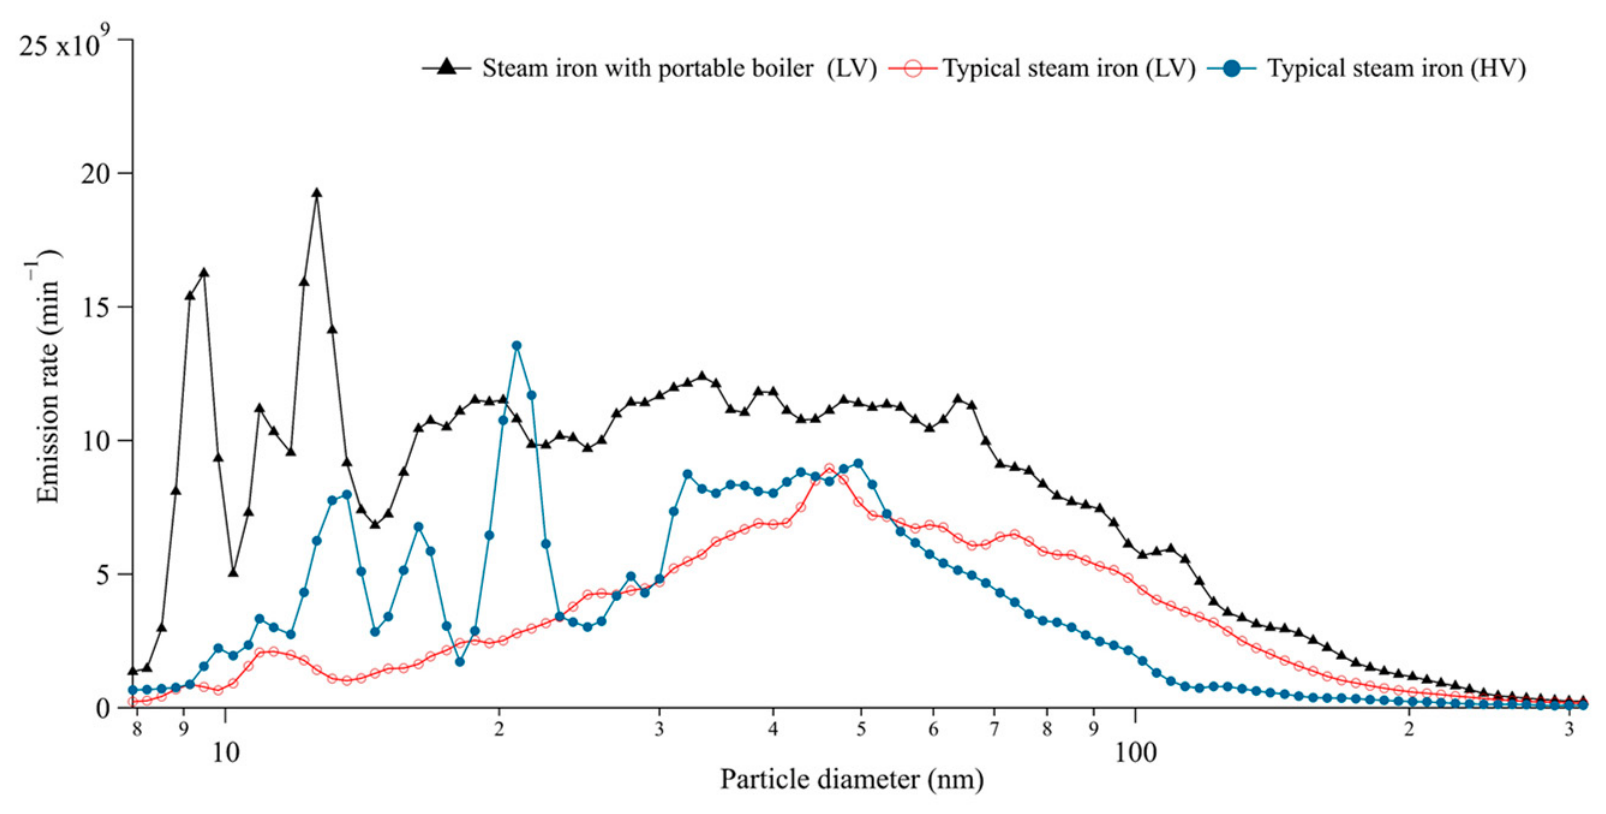
Furthermore, the particle number emission rate () was estimated for each SMPS size bin and is represented in Figure 2. For the typical steam iron under the HV condition, the highest values were observed for particle sizes between 15 and 70 nm, with abrupt variations probably due to infiltration of outdoor air. The maximum emission rate was observed for particles of 20.9 nm (1.36 × 10¹⁰ min−1). However, for the LV condition, the evolution of is smooth, reaching a maximum value of 8.97 × 10⁹ min−1 for the 46.1 nm size. The steam iron with a portable boiler presented the highest for all sizes, with a maximum of 1.92 × 10¹⁰ min−1 at 12.6 nm. The values obtained for the typical steam iron are higher than those observed by [17] under laboratory conditions (6.0 × 10⁹ s−1).
Figure 2.
Particle number emission rate for each SMPS size bin for different irons and ventilation conditions (LV: low ventilation; HV: higher ventilation).
The differences in modal diameters among the experimental conditions may reflect differences in particle formation and evolution. Previous studies have shown that particle-size distributions from indoor sources vary with the source characteristics and that coagulation can shift particle distributions towards larger diameters over time [32]. However, since particle composition and formation mechanisms were not directly investigated in this study, the reasons for the differences observed in Figure 2 remain uncertain. To our knowledge, there is no bibliography on size-resolved particle emission factors for ironing to compare the present results. Compared to other human activities, such as cooking or burning perfumed candles (under laboratory conditions) [45], the ironing process shows a global > 1011 min−1 (Table 2), thus indicating that ironing can represent an important indoor source of ultrafine particles.
The experimental design did not include a control condition that allowed the effects of steam-generation design and operating pressure to be isolated. Therefore, the differences in emission rates between the two devices cannot be attributed to a single appliance characteristic. Further experiments controlling these parameters independently are needed to clarify their individual effects.
3.3. Evolution of Aerosol Particle Number Size Distribution
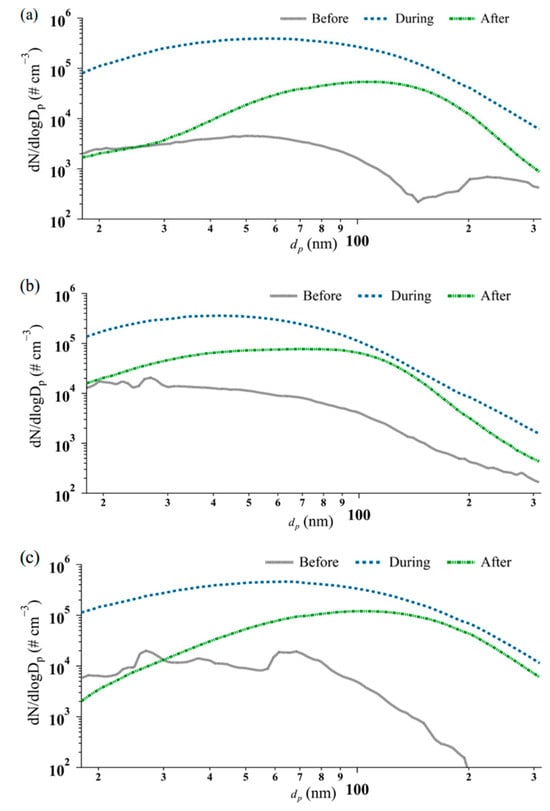
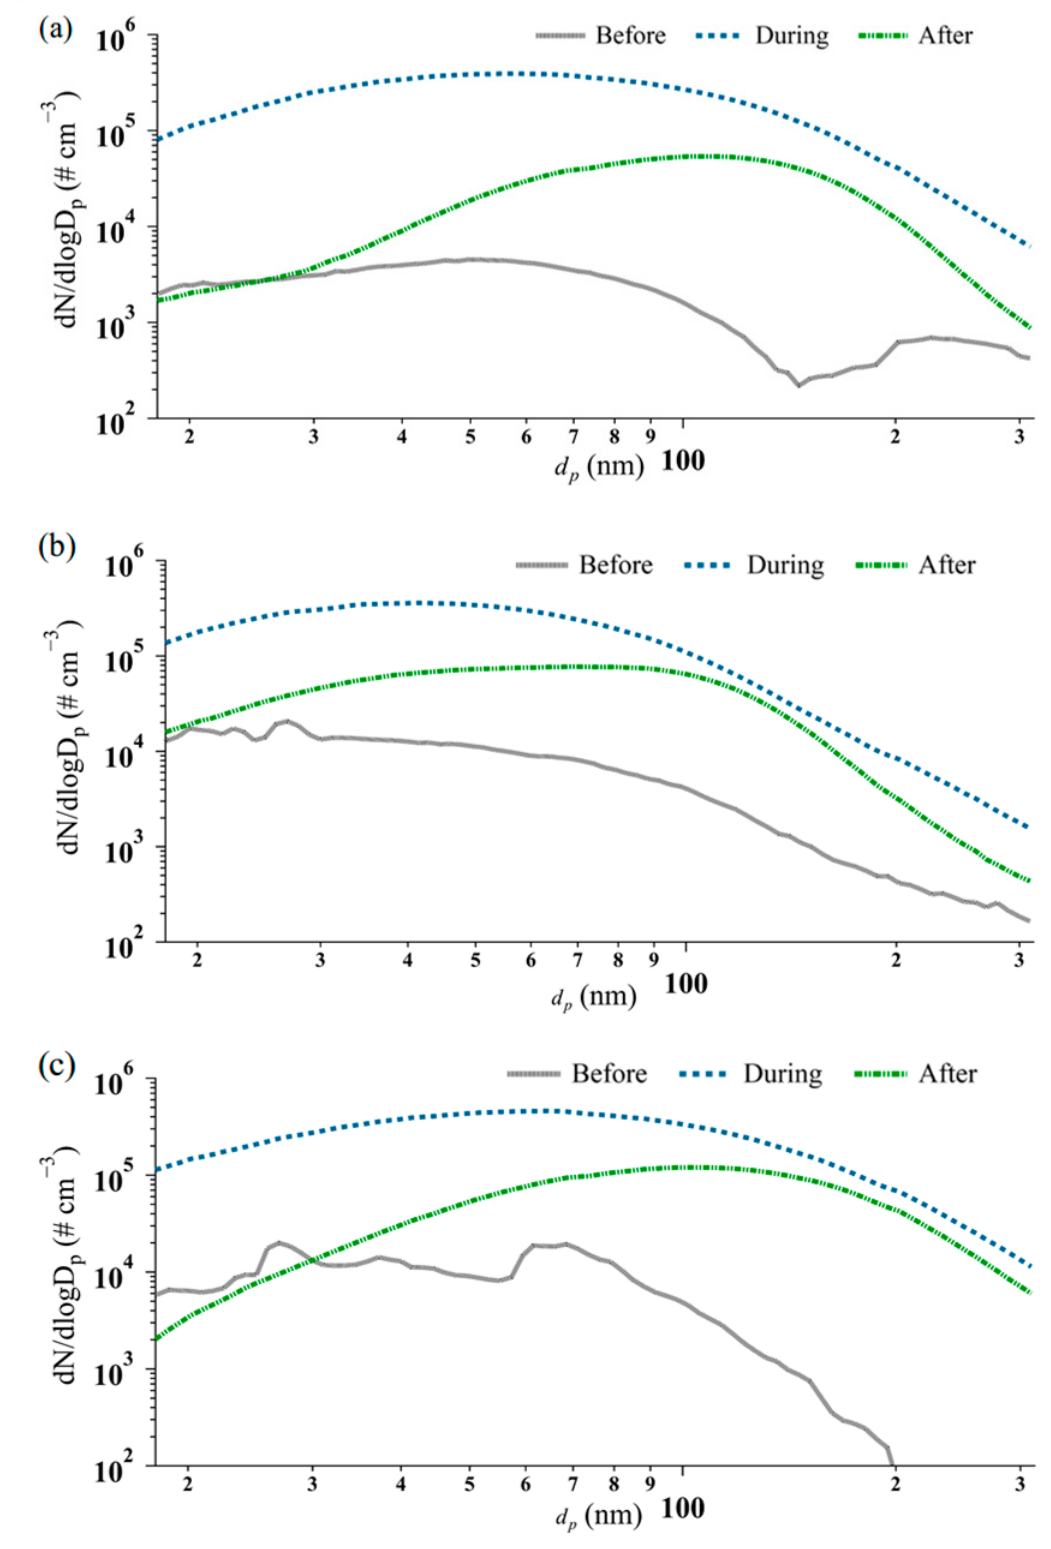
In addition to the increase in PNC during ironing, changes were also observed in the PNSD (Figure 3). For the three cases studied, the PNSDs were fitted using the sum of two lognormal distributions, except for the steam iron with a portable boiler under LV conditions during ironing, for which a single lognormal distribution provided a more stable fit (Table A3).
Figure 3.
Mean aerosol particle size distribution before, during and after ironing with: (a) a typical steam iron (LV condition), (b) a typical steam iron (HV condition) and (c) a steam iron with a portable boiler (LV condition).
- (a)
- Before using the typical steam iron under LV conditions, two modes were identified, with geometric mean diameters of 34.4 and 56.7 nm. During ironing, both modes shifted towards larger particle sizes, with geometric mean diameters of 51.2 and 99.4 nm, respectively. A marked increase in particle number was observed, particularly in the first mode, which increased from approximately 2.5 × 10³ to 2.4 × 10⁵ particles cm−3. After ironing, the modal diameters increased further, reaching 86.3 and 127.1 nm, although the particle concentrations decreased substantially compared with the ironing period, probably due to growth by coagulation or condensation of Aitken-mode particles, which cause an increase in the number of particles in the accumulation mode. As shown in Figure 3a, the main difference between before and after ironing is the increment in the number of particles, with the maximum difference at 150 nm. Between before and during ironing, the maximum difference is observed for particle sizes between 110 and 180 nm.
- (b)
- For the typical steam iron under HV conditions, two modes were also identified before ironing, with geometric mean diameters of 20.5 and 33.5 nm. During ironing, the modes shifted towards approximately 27.9 and 51.3 nm, accompanied by a substantial increase in particle concentration. In particular, the second mode increased to approximately 1.4 × 10⁵ particles cm−3. After ironing, the modal diameters shifted further towards larger sizes, reaching 49.5 and 92.1 nm, while particle concentrations decreased. The higher ventilation rate resulted in a more pronounced reduction in particles below approximately 80 nm after ironing, whereas particles in the 80–300 nm range remained at comparatively elevated concentrations (Figure 3b).
- (c)
- A similar pattern was observed for the steam iron with a portable boiler under LV conditions. Before ironing, two modes were identified, with geometric mean diameters of 34.7 and 69.5 nm. During ironing, the PNSD was better described by a single lognormal distribution, centred at 57.6 nm, with a total particle concentration of approximately 3.32 × 105 cm−3. After ironing, two modes were again identified, with geometric mean diameters of 82.5 and 125.3 nm. The particle concentrations decreased after the activity, although they remained substantially higher than before ironing, particularly in the larger particle-size range (Figure 3c).
Ironing changes the PNSD characteristics, and this behaviour may be attributed to: (i) dust emissions from the iron surface [17]; (ii) emissions of burnt fibres from clothing due to increased temperature [17]; (iii) the increase in relative humidity, which can lead to variations in PNSD [46]; and (iv) particle formation and growth associated with steam. The last mechanism could help explain the differences between the two appliances. Steam released during ironing can condense onto pre-existing particles (heterogeneous condensation), increasing their size and shifting the distribution towards larger diameters, which is consistent with the modal shift observed here. In addition, both irons were filled with tap water, and the evaporation of steam droplets containing dissolved minerals can leave residual particles. The portable boiler releases a larger amount of steam than the typical steam iron, so this contribution would be expected to be greater, which may explain its higher concentrations above 100 nm. Homogeneous nucleation of water vapour is unlikely under the indoor conditions measured (T = 22–25 °C, RH = 41–52%), although nucleation of semivolatile organic vapours released from heated fabrics or finishing products cannot be ruled out. As the chemical composition of the water and the particles was not measured in the present study, these explanations remain hypothetical. Although previous research has characterised the chemical composition of PM10 emitted during ironing [31], further studies should investigate size-resolved particle composition and compare emissions using tap water and pure water to assess the contribution of dissolved minerals.
3.4. Black Carbon Concentration
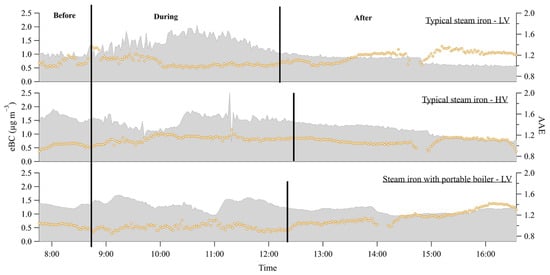
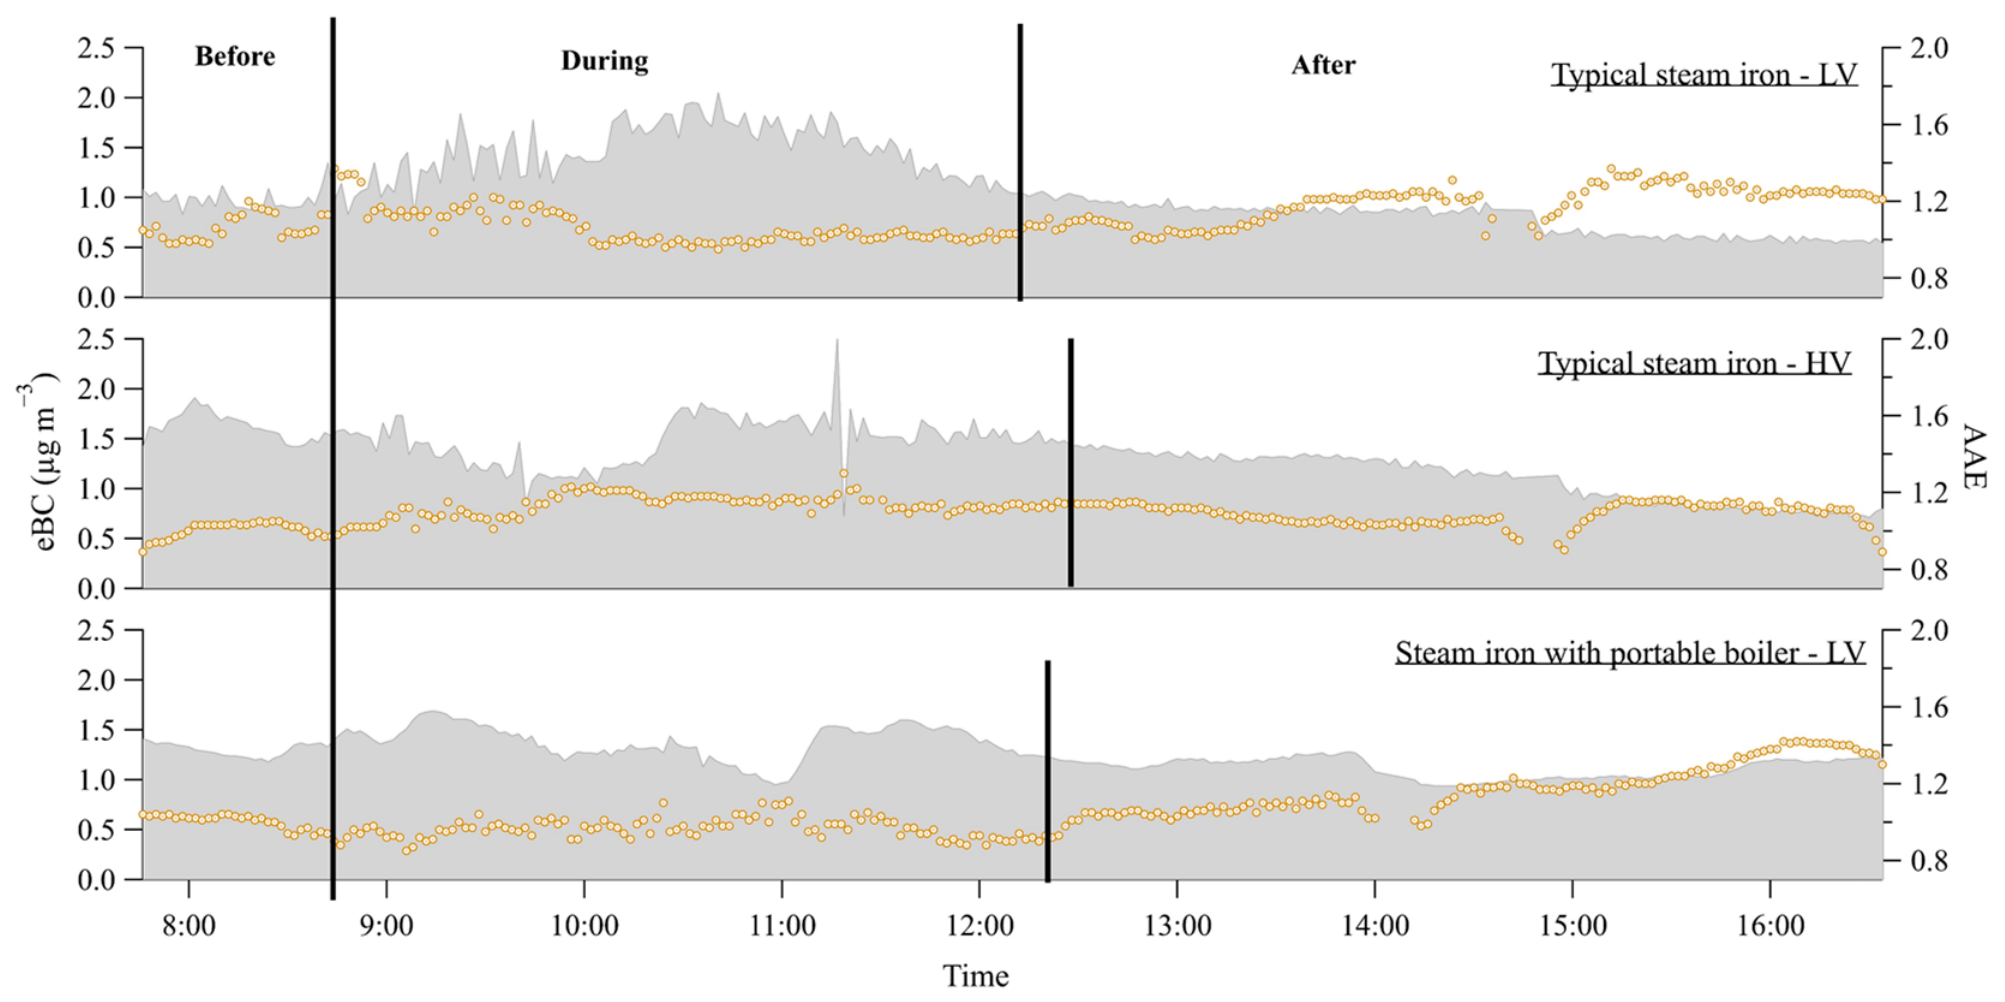
Figure 4 shows the evolution of eBC concentrations and the Absorption Ångström Exponent (AAE). A slight increase in concentrations during ironing was observed, with several peaks. After ironing, the concentration decreased in all three cases, which could be related to particle deposition and ventilation.
Figure 4.
Evolution of equivalent black carbon (eBC) concentrations (fill) and Absorption Ångström Exponents (AAEs) (points) before, during and after ironing with a typical steam iron (LV condition), a typical steam iron (HV condition) and a steam iron with a portable boiler (LV condition).
The mean eBC concentration before using the typical steam iron under the LV condition was low (0.98 ± 0.10 µg m−3 with a maximum of 1.35 µg m−3), while during ironing the concentration experienced a slight increase to 1.45 ± 0.28 µg m−3, with a maximum of 2.05 µg m−3. After ironing, a modest decrease in eBC concentrations (0.77 ± 0.16 µg m−3) was recorded, with a maximum of 1.06 µg m−3 (Table A2). Under the HV condition, the mean concentration before ironing was 1.62 ± 0.14 µg m−3 (maximum of 1.91 µg m−3), probably due to outside air infiltration, although this could not be verified because outdoor measurements were not performed. While carrying out this domestic task, the mean value was 1.47 ± 0.25 µg m−3 (max of 2.51 µg m−3), that is, no increase with respect to the background, and after ironing a clear decrease in eBC concentrations (1.11 ± 0.25 µg m−3) was observed. Thus, the effect of ventilation on the eBC concentration during ironing seems to be small. The steam iron with a portable boiler presented an identical pattern to that of the typical steam iron under the LV condition, with a clear decrease after ironing (from 1.38 during to 1.12 µg m−3 after ironing).
No significant differences in the AAE values were recorded before, during or after ironing, with mean values ranging approximately from 1.0 to 1.2, except for some peaks during ironing that reached 1.99. To our knowledge, no previous study has reported BC concentrations during the ironing process; therefore, comparison with other studies is not possible. Under the HV condition, the mean eBC concentration before ironing was slightly higher than during ironing (1.62 ± 0.14 vs. 1.47 ± 0.25 µg m−3), a difference within the standard deviation, which remains unexplained. One possible explanation is that changes in temperature and humidity may affect aerosol properties and, consequently, their optical response. However, this possibility remains speculative and requires further investigation [47,48].
4. Conclusions
This study investigated the evolution of particle number concentrations, particle number size distributions, particle emission rates and equivalent black carbon concentrations during ironing with a typical steam iron and a steam iron with a portable boiler under different ventilation conditions. Ironing produced a rapid and substantial increase in indoor particle concentrations, particularly in the ultrafine and fine size ranges. The maximum PNC reached 7.12 × 10⁵ particles cm−3 when using the typical steam iron under low-ventilation (LV) conditions. During ironing, the nucleation, Aitken and accumulation modes increased by up to 4179%, 9497% and 15811%, respectively, relative to background concentrations.
Particle concentrations decreased progressively after the activity ended, although particles larger than approximately 80 nm showed a slower decay. The time required to reach the maximum PNC was 119 ± 25 min for the typical steam iron under LV conditions, 74 ± 35 min under higher ventilation (HV) conditions and 61 ± 39 min for the steam iron with a portable boiler under LV conditions. The HV condition promoted faster particle removal and resulted in lower concentrations during ironing.
The PNSDs showed clear changes during the ironing process and were generally described by two lognormal modes. The exception was the steam iron with a portable boiler during ironing, for which a single lognormal distribution provided a more stable fit. Overall, the modal particle diameters shifted towards larger sizes during and after ironing, indicating a modification of the particle size distribution that persisted after the emission source was removed.
The estimated particle number emission rates ranged from 8.1 × 10¹¹ to 1.5 × 10¹² particles min−1. The lowest emission rate was obtained for the typical steam iron under HV conditions, whereas the highest was observed for the steam iron with a portable boiler under LV conditions. These values are of the same order of magnitude as emission rates previously reported for steam ironing and other common indoor activities, indicating that ironing can represent an important indoor particle source.
In contrast, eBC concentrations showed only moderate changes during ironing, with slight increases under low-ventilation conditions. Overall, the results demonstrate that ironing can substantially increase indoor particle concentrations and modify their size distributions, while ventilation plays an important role in determining both peak concentrations and particle persistence after the activity.
This study has several limitations, including the small sample size (two replicates per condition), the investigation of a single dwelling, the lack of simultaneous outdoor particle measurements, and the absence of direct measurements of ironing temperature. Only tap water was used in the irons, and pure water was not tested; moreover, the chemical composition of the water was not analysed. Therefore, the contribution of minerals dissolved in tap water to particle emissions could not be evaluated. The limited number of replicates (two per condition) means that the reported standard deviations only indicate the experimental variability and do not allow for a robust assessment of the uncertainty of the emission rates and of the fitted size-distribution parameters. Personal exposure and health risks were not assessed. Further studies involving more replicates, different residential settings, and direct exposure assessments are needed to improve the reliability and generalisability of the findings.
The findings, together with previous research [31], highlight ironing as a potential source of indoor particles and the importance of ventilation. However, further studies in different residential settings and including direct exposure assessments are needed before broader recommendations or policy implications can be established. It is worth mentioning that future investigations are necessary to consolidate the conclusions, analysing the emissions while ironing individual types of garments. It is necessary to consider that in commercial laundries and ironing services, the period of exposure during the entire working day is much longer than that normally experienced at home, so the work environment of these professionals should be subject to a detailed study.
Author Contributions
Conceptualization, C.B.-A., E.D.V., A.I.C., C.A. and R.F.; methodology, C.B.-A., E.D.V., A.I.C., F.O., C.A. and R.F.; validation, C.B.-A., E.D.V., A.I.C., F.O., C.A. and R.F.; formal analysis, C.B.-A. and E.D.V.; investigation, C.B.-A., E.D.V., A.I.C., F.O., C.A. and R.F.; resources, C.A., A.I.C. and R.F.; data curation, C.B.-A. and E.D.V.; writing—original draft preparation, C.B.-A.; writing—review and editing, C.B.-A., E.D.V., A.I.C., F.O., C.A. and R.F.; visualization, C.B.-A.; supervision, C.A., A.I.C. and R.F.; project administration, C.A., A.I.C. and R.F.; funding acquisition, C.A., A.I.C. and R.F. All authors have read and agreed to the published version of the manuscript.
Funding
This research was funded by the Spanish Ministry of Economy and Competitiveness (Grant TEC2014-57821-R), by the Junta de Castilla y León co-financed with European FEDER funds (Grant LE025P20) and by the AEROHEALTH project (Ministry of Science and Innovation, co-financed with European FEDER funds, Grant PID2019-106164RBI00). Furthermore, it is part of the project TED2021-132292B-I00, funded by MCIN/AEI/10.13039/501. We acknowledge financial support to CESAM by FCT, under the project/grant UID/50017/2025 (https://doi.org/10.54499/UID/50017/2025) + LA/P/0094/2020 (doi.org/10.54499/LA/P/0094/2020). E. D. Vicente also acknowledges FCT for the research contract awarded under the Scientific Employment Stimulus (https://doi.org/10.54499/2022.00 399.CEECIND/CP1720/CT0012).
Institutional Review Board Statement
Not applicable.
Informed Consent Statement
Not applicable.
Data Availability Statement
The data presented in this study are available on request from the corresponding author.
Acknowledgments
The authors would like to thank all participants who contributed to the experimental trials conducted in this study. We would especially like to acknowledge the valuable assistance of Amaya Castro and Beatriz Martínez during the experimental work.
Conflicts of Interest
The authors declare no conflicts of interest.
Abbreviations
The following abbreviations are used in this manuscript:
| AAE | Absorption Ångström Exponent |
| ACTRIS | Aerosols, Clouds and Trace Gases Research Infrastructure |
| eBC | Equivalent black carbon |
| ER | Particle number emission rate |
| HV | Higher ventilation |
| I/O | Indoor/outdoor |
| LV | Low ventilation |
| PM1, PM2.5, PM10 | Particulate matter with aerodynamic diameter ≤1 µm (PM1), ≤2.5 µm (PM2.5), and ≤10 µm (PM10) |
| PNC | Particle number concentration |
| PNSD | Particle number size distribution |
| RH | Relative humidity |
| SMPS | Scanning mobility particle sizer |
| UFP | Ultrafine particles |
Appendix A
Figure A1.
Typical steam iron (a) and steam iron with a portable boiler (b) used during the sampling campaign.
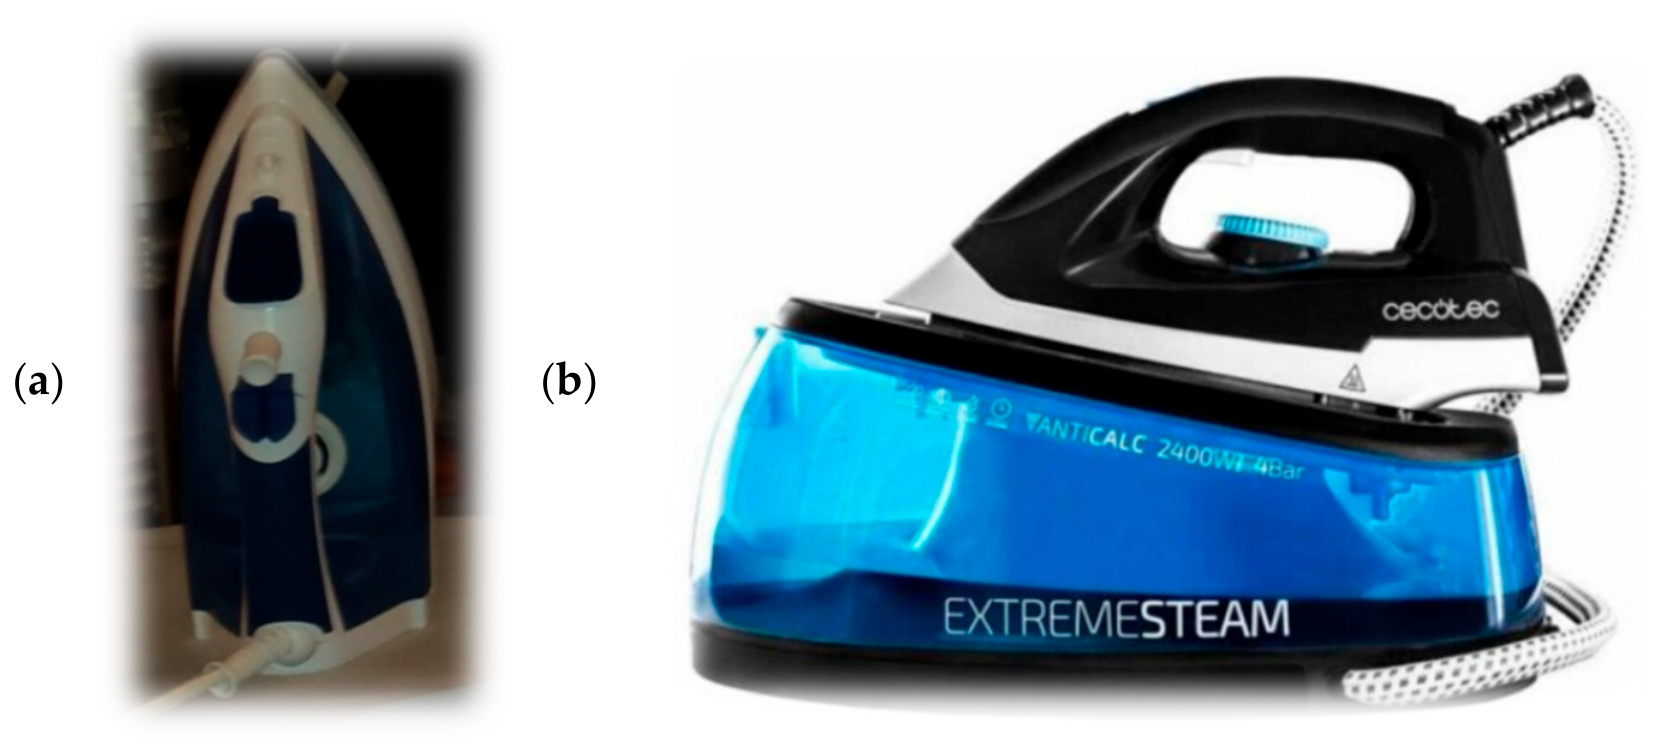
Table A1.
Ambient conditions (temperature, relative humidity, particle number concentration and ventilation rate) during ironing with different ventilation conditions and irons. N = number of samples. Values are mean ± standard deviation of two replicate experiments.
Table A2.
Mean, standard deviation and maximum equivalent black carbon concentration (eBC) and Absorption Ångström Exponent (AAE) before (B), during (D) and after (A) ironing.
Table A3.
Lognormal parameters obtained from fitting the mean particle number size distributions measured before (B), during (D), and after (A) ironing. Values are parameter estimates ± standard errors of the fit to the mean distribution; they do not include variability between replicates.
References
- Ciuzas, D.; Prasauskas, T.; Krugly, E.; Sidaraviciute, R.; Jurelionis, A.; Seduikyte, L.; Kauneliene, V.; Wierzbicka, A.; Martuzevicius, D. Characterization of Indoor Aerosol Temporal Variations for the Real-Time Management of Indoor Air Quality. Atmos. Environ. 2015, 118, 107–117. [Google Scholar] [CrossRef] [Scilit]
- Spilak, M.P.; Frederiksen, M.; Kolarik, B.; Gunnarsen, L. Exposure to Ultrafine Particles in Relation to Indoor Events and Dwelling Characteristics. Build. Environ. 2014, 74, 65–74. [Google Scholar] [CrossRef] [Scilit]
- Koivisto, A.J.; Kling, K.I.; Hänninen, O.; Jayjock, M.; Löndahl, J.; Wierzbicka, A.; Fonseca, A.S.; Uhrbrand, K.; Boor, B.E.; Jiménez, A.S.; et al. Source Specific Exposure and Risk Assessment for Indoor Aerosols. Sci. Total Environ. 2019, 668, 13–24. [Google Scholar] [CrossRef] [Scilit]
- Harbizadeh, A.; Abbas, S.; Dokht, A.; Saleh, F.; Goodarzi, H.; Alavi, N.; Ahmadi, K.; Dehdari, H.; Maleki, H.; Goudarzi, G. Indoor and Outdoor Airborne Bacterial Air Quality in Day-Care Centers (DCCs) in Greater Ahvaz, Iran. Atmos. Environ. 2019, 216, 116927. [Google Scholar] [CrossRef] [Scilit]
- Becerra, J.A.; Lizana, J.; Gil, M.; Barrios-Padura, A.; Blondeau, P.; Chacartegui, R. Identification of Potential Indoor Air Pollutants in Schools. J. Clean. Prod. 2020, 242, 118420. [Google Scholar] [CrossRef] [Scilit]
- Alves, C.; Nunes, T.; Silva, J.; Duarte, M. Comfort Parameters and Particulate Matter (PM10 and PM2.5) in School Classrooms and Outdoor Air. Aerosol Air Qual. Res. 2013, 13, 1521–1535. [Google Scholar] [CrossRef] [Scilit]
- Alves, C.A.; Vicente, E.D.; Evtyugina, M.; Vicente, A.M.; Nunes, T.; Lucarelli, F.; Calzolai, G.; Nava, S.; Calvo, A.I.; Blanco-Alegre, C.; et al. Indoor and Outdoor Air Quality: A University Cafeteria as a Case Study. Atmos. Pollut. Res. 2020, 11, 531–544. [Google Scholar] [CrossRef] [Scilit]
- Chamseddine, A.; Alameddine, I.; Hatzopoulou, M.; El-fadel, M. Seasonal Variation of Air Quality in Hospitals with Indoor—Outdoor Correlations. Build. Environ. 2019, 148, 689–700. [Google Scholar] [CrossRef] [Scilit]
- Madureira, J.; Paciência, I.; Rufo, J.C.; Pereira, C.; Teixeira, J.P.; de Oliveira Fernandes, E. Assessment and Determinants of Airborne Bacterial and Fungal Concentrations in Different Indoor Environments: Homes, Child Day-Care Centres, Primary Schools and Elderly Care Centres. Atmos. Environ. 2015, 109, 139–146. [Google Scholar] [CrossRef] [Scilit]
- Mendes, A.; Bonassi, S.; Aguiar, L.; Pereira, C.; Neves, P.; Silva, S.; Mendes, D.; Guimarães, L.; Moroni, R.; Teixeira, J.P. Indoor Air Quality and Thermal Comfort in Elderly Care Centers. Urban Clim. 2015, 14, 486–501. [Google Scholar] [CrossRef] [Scilit]
- Schweizer, C.; Edwards, R.D.; Bayer-Oglesby, L.; Gauderman, W.J.; Ilacqua, V.; Juhani Jantunen, M.; Lai, H.K.; Nieuwenhuijsen, M.; Künzli, N. Indoor Time-Microenvironment-Activity Patterns in Seven Regions of Europe. J. Expo. Sci. Environ. Epidemiol. 2007, 17, 170–181. [Google Scholar] [CrossRef] [Scilit]
- Klepeis, N.E.; Nelson, W.C.; Ott, W.R.; Robinson, J.P.; Tsang, A.M.; Switzer, P.; Behar, J.V.; Hern, S.C.; Engelman, W.H. The National Human Activity Pattern Survey (NHAPS): A Resource for Assessing Exposure to Environmental Pollutants. J. Expo. Sci. Environ. Epidemiol. 2001, 11, 231–252. [Google Scholar] [CrossRef] [Scilit]
- Katsoyiannis, A.; Cincinelli, A. ‘Cocktails and Dreams’: The Indoor Air Quality That People Are Exposed to While Sleeping. Curr. Opin. Environ. Sci. Health 2019, 8, 6–9. [Google Scholar] [CrossRef] [Scilit]
- Vicente, E.D.; Vicente, A.M.; Evtyugina, M.; Calvo, A.I.; Oduber, F.; Blanco Alegre, C.; Castro, A.; Fraile, R.; Nunes, T.; Lucarelli, F.; et al. Impact of Vacuum Cleaning on Indoor Air Quality. Build. Environ. 2020, 180, 107059. [Google Scholar] [CrossRef] [Scilit]
- Kaunelienė, V.; Meišutovič-Akhtarieva, M.; Martuzevičius, D. A Review of the Impacts of Tobacco Heating System on Indoor Air Quality versus Conventional Pollution Sources. Chemosphere 2018, 206, 568–578. [Google Scholar] [CrossRef] [Scilit]
- Glytsos, T.; Ondráček, J.; Džumbová, L.; Kopanakis, I.; Lazaridis, M. Characterization of Particulate Matter Concentrations during Controlled Indoor Activities. Atmos. Environ. 2010, 44, 1539–1549. [Google Scholar] [CrossRef] [Scilit]
- Afshari, A.; Matson, U.; Ekberg, L.E. Characterization of Indoor Sources of Fine and Ultrafine Particles: A Study Conducted in a Full-Scale Chamber. Indoor Air 2005, 15, 141–150. [Google Scholar] [CrossRef] [Scilit]
- Isaxon, C.; Gudmundsson, A.; Nordin, E.Z.; Lönnblad, L.; Dahl, A.; Wieslander, G.; Bohgard, M.; Wierzbicka, A. Contribution of Indoor-Generated Particles to Residential Exposure. Atmos. Environ. 2015, 106, 458–466. [Google Scholar] [CrossRef] [Scilit]
- He, C.; Morawska, L.; Hitchins, J.; Gilbert, D. Contribution from Indoor Sources to Particle Number and Mass Concentrations in Residential Houses. Atmos. Environ. 2004, 38, 3405–3415. [Google Scholar] [CrossRef]
- Singh, A.; Bartington, S.E.; Abreu, P.; Anderson, R.; Cowell, N.; Leach, F.C.P. Impacts of Daily Household Activities on Indoor Particulate and NO2 Concentrations; a Case Study from Oxford UK. Heliyon 2024, 10, e34210. [Google Scholar] [CrossRef] [Scilit]
- Wei See, S.; Balasubramanian, R.; Joshi, U.M. Physical Characteristics of Nanoparticles Emitted from Incense Smoke. Sci. Technol. Adv. Mater. 2007, 8, 25–32. [Google Scholar] [CrossRef] [Scilit]
- Morawska, L.; Afshari, A.; Bae, G.N.; Buonanno, G.; Chao, C.Y.H.; Hänninen, O.; Hofmann, W.; Isaxon, C.; Jayaratne, E.R.; Pasanen, P.; et al. Indoor Aerosols: From Personal Exposure to Risk Assessment. Indoor Air 2013, 23, 462–487. [Google Scholar] [CrossRef] [Scilit]
- Thatcher, T.L.; Lunden, M.M.; Revzan, K.L.; Sextro, R.G.; Brown, N.J. A Concentration Rebound Method for Measuring Particle Penetration and Deposition in the Indoor Environment. Aerosol Sci. Technol. 2003, 37, 847–864. [Google Scholar] [CrossRef] [Scilit]
- Nazaroff, W.W. Indoor Particle Dynamics. Indoor Air 2004, 14, 175–183. [Google Scholar] [CrossRef] [Scilit]
- Yang, S.; Müller, T.; Wang, N.; Bekö, G.; Zhang, M.; Merizak, M.; Wargocki, P.; Williams, J.; Licina, D. Influence of Ventilation on Formation and Growth of 1–20 Nm Particles via Ozone-Human Chemistry. Environ. Sci. Technol. 2024, 58, 4704–4715. [Google Scholar] [CrossRef] [Scilit]
- HEI. Review Panel Understanding the Health Effects of Ambient Ultrafine Particles; HEI Perspectives 3; Health Effects Institute: Boston, MA, USA, 2013; Available online: https://www.healtheffects.org/publication/understanding-health-effects-ambient-ultrafine-particles (accessed on 25 October 2026).
- Marval, J.; Tronville, P. Ultrafine Particles: A Review about Their Health Effects, Presence, Generation, and Measurement in Indoor Environments. Build. Environ. 2022, 216, 108992. [Google Scholar] [CrossRef] [Scilit]
- Patra, S.S.; Huang, C.; Magnuson, B.H.; Boor, B.E.; Jung, N. Indoor Atmospheric Nanoparticle Emissions, Inhalation Exposures, and Indoor-to-Outdoor Transport during Residential Activities with Electric and Combustion Appliances. J. Hazard. Mater. 2026, 511, 142011. [Google Scholar] [CrossRef] [Scilit]
- Audignon-Durand, S.; Ramalho, O.; Mandin, C.; Roudil, A.; Le Bihan, O.; Delva, F.; Lacourt, A. Indoor Exposure to Ultrafine Particles Related to Domestic Activities: A Systematic Review and Meta-Analysis. Sci. Total Environ. 2023, 904, 166947. [Google Scholar] [CrossRef] [Scilit]
- European Commission; European Social Reality (ESR). Special Eurobarometer 273, Wave 66.3; European Commission: Brussels, Belgium, February 2007; Available online: https://data.europa.eu/data/datasets/s606_66_3_ebs273 (accessed on 25 October 2026).
- Vicente, E.D.; Evtyugina, M.; Vicente, A.M.; Calvo, A.I.; Oduber, F.; Blanco-Alegre, C.; Castro, A.; Fraile, R.; Nunes, T.; Lucarelli, F.; et al. Impact of Ironing on Indoor Particle Levels and Composition. Build. Environ. 2021, 192, 107636. [Google Scholar] [CrossRef] [Scilit]
- Wallace, L.; Ott, W. Personal Exposure to Ultrafine Particles. J. Expo. Sci. Environ. Epidemiol. 2011, 21, 20–30. [Google Scholar] [CrossRef] [Scilit]
- Sysoltseva, M. Characterization of Aerosols and Nanoparticles Released During Various Indoor and Outdoor Human Activities. Ph.D. Thesis, RWTH Aachen University, Aachen, Germany, 2018. [Google Scholar]
- Vu, T.V.; Ondracek, J.; Zdímal, V.; Schwarz, J.; Delgado-Saborit, J.M.; Harrison, R.M. Physical Properties and Lung Deposition of Particles Emitted from Five Major Indoor Sources. Air Qual. Atmos. Health 2017, 10, 1–14. [Google Scholar] [CrossRef] [Scilit]
- Corsi, R.L.; Siegel, J.A.; Chiang, C. Particle Resuspension During the Use of Vacuum Cleaners on Residential Carpet. J. Occup. Environ. Hyg. 2008, 5, 232–238. [Google Scholar] [CrossRef] [Scilit]
- Wiedensohler, A.; Birmili, W.; Nowak, A.; Sonntag, A.; Weinhold, K.; Merkel, M.; Wehner, B.; Tuch, T.; Pfeifer, S.; Fiebig, M.; et al. Mobility Particle Size Spectrometers: Harmonization of Technical Standards and Data Structure to Facilitate High Quality Long-Term Observations of Atmospheric Particle Number Size Distributions. Atmos. Meas. Tech. 2012, 5, 657–685. [Google Scholar] [CrossRef] [Scilit]
- Weingartner, E.; Saathoff, H.; Schnaiter, M.; Streit, N.; Bitnar, B.; Baltensperger, U. Absorption of Light by Soot Particles: Determination of the Absorption Coefficient by Means of Aethalometers. J. Aerosol Sci. 2003, 34, 1445–1463. [Google Scholar] [CrossRef] [Scilit]
- Fialho, P.; Hansen, A.D.A.; Honrath, R.E. Absorption Coefficients by Aerosols in Remote Areas: A New Approach to Decouple Dust and Black Carbon Absorption Coefficients Using Seven-Wavelength Aethalometer Data. J. Aerosol Sci. 2005, 36, 267–282. [Google Scholar] [CrossRef] [Scilit]
- Hansen, A.D.A. The Aethalometer, Magee Scientific Corporation; Magee Scientific: Berkeley, CA, USA, 2005. [Google Scholar]
- Nasir, Z.A.; Colbeck, I. Particulate Pollution in Different Housing Types in a UK Suburban Location. Sci. Total Environ. 2013, 445–446, 165–176. [Google Scholar] [CrossRef] [Scilit]
- He, C.; Morawska, L.; Gilbert, D. Particle Deposition Rates in Residential Houses. Atmos. Environ. 2005, 39, 3891–3899. [Google Scholar] [CrossRef] [Scilit]
- Reche, C.; Viana, M.; Rivas, I.; Bouso, L.; Àlvarez-Pedrerol, M.; Alastuey, A.; Sunyer, J.; Querol, X. Outdoor and Indoor UFP in Primary Schools across Barcelona. Sci. Total Environ. 2014, 493, 943–953. [Google Scholar] [CrossRef] [Scilit]
- Jeong, S.-G.; Wallace, L.; Rim, D. Contributions of Coagulation, Deposition, and Ventilation to the Removal of Airborne Nanoparticles in Indoor Environments. Environ. Sci. Technol. 2021, 55, 9730–9739. [Google Scholar] [CrossRef] [Scilit]
- Abt, E.; Suh, H.H.; Catalano, P.; Koutrakis, P. Relative Contribution of Outdoor and Indoor Particle Sources to Indoor Concentrations. Environ. Sci. Technol. 2000, 34, 3579–3587. [Google Scholar] [CrossRef] [Scilit]
- Géhin, E.; Ramalho, O.; Kirchner, S. Size Distribution and Emission Rate Measurement of Fine and Ultrafine Particle from Indoor Human Activities. Atmos. Environ. 2008, 42, 8341–8352. [Google Scholar] [CrossRef] [Scilit]
- Eštoková, A.; Števulová, N.; Kubincová, L. Particulate Matter Investigation in Indoor Environment. Glob. Nest J. 2010, 12, 20–26. [Google Scholar] [CrossRef] [Scilit][Green Version]
- Zeng, L.; Tan, T.; Zhao, G.; Du, Z.; Hu, S.; Shang, D.; Hu, M. Overestimation of Black Carbon Light Absorption Due to Mixing State Heterogeneity. npj Clim. Atmos. Sci. 2024, 7, 2. [Google Scholar] [CrossRef] [Scilit]
- Liu, J.; Zhu, C.; Zhou, D.; Han, J. Retrieval of Refractive Index and Water Content for the Coating Materials of Aged Black Carbon Aerosol Based on Optical Properties: A Theoretical Analysis. Atmos. Chem. Phys. 2024, 24, 12341–12354. [Google Scholar] [CrossRef] [Scilit]

Disclaimer/Publisher’s Note: The statements, opinions and data contained in all publications are solely those of the individual author(s) and contributor(s) and not of MDPI and/or the editor(s). MDPI and/or the editor(s) disclaim responsibility for any injury to people or property resulting from any ideas, methods, instructions or products referred to in the content. |
© 2026 by the authors. Licensee MDPI, Basel, Switzerland. This article is an open access article distributed under the terms and conditions of the Creative Commons Attribution (CC BY) license.