


Abstract
Aerosol influences on local thunderstorms are complex and often contradictory. Within aerosol-laden city environments, these interactions are further complicated by additional thermodynamic and kinematic effects related to the urban landscape. Observational studies are limited in their ability to distinguish the different influences of urban land cover and aerosols on thunderstorms, but numerical modeling can alleviate the problem by systematically accounting for each variable separately. This study used the NASA Unified-Weather Research and Forecasting (NU-WRF) model to simulate frontal, scattered thunderstorms during a summer day in coastal Louisiana. The study period was simulated by iteratively including and excluding atmospheric chemistry and the physical attributes of the urban land cover, producing a total of four simulations. Three sub-zones, distinguished by their thunderstorm activity, level of urbanization, and aerosol concentrations, were selected for more detailed analysis to examine the sensitivity of precipitation and thunderstorm coverage to the experimental conditions (i.e., atmospheric chemistry and urban landscape). The aerosol and urban landscape simulations demonstrated a minimal impact on storm initiation timing, suggesting that these processes were secondary to the synoptic atmospheric conditions driving the initial development of convection. However, the quantity of precipitation and reflectivity coverage was more sensitive to the experimental modeling scenarios, with the individual simulations (i.e., aerosol or urban effects only) frequently overproducing precipitation compared to observations. Whether the aerosol or urban effects were the more influential factor was regionally dependent and varied between sub-zones. When both aerosol and urban effects were activated, the precipitation and reflectivity coverage aligned more closely with NASA’s Integrated Multi-SatellitE Retrievals for GPM (IMERG) estimated rainfall across much of the study area. Over the heavily urbanized coastal region, the combined model run with both aerosol and urban effects overproduced the rainfall and reflectivity coverage, whereas on a regional scale it modulated rainfall quantity, creating a non-linear precipitation reduction in most regions. These results suggest that urban and aerosol properties weakly influence the meso-beta meteorological pattern but can drive meso-gamma-scale changes that accumulate over larger areas.
1. Introduction
Aerosols have a complex influence on climate systems due to their diverse nature. Some aerosols are a heterogeneous mix of materials like sulfates, nitrates, hydrogen ions, ammonium, and carbon. Metals such as lead, cadmium, vanadium, nickel, and zinc can also comprise aerosols along with particle-bound water and biogenic organic materials [1,2]. Additionally, aerosols can consist of dust and ash, sea salt, silicon, iron, tin, pollen, and mold spores [1,2,3].
Aerosols often originate from the combustion of fossil fuels, such as coal, oil, and gasoline, as well as the resuspension of combustion particles [4]. Therefore, vehicle operation, construction, farming, biomass burning, and mining are prevalent anthropogenic sources [3,5,6,7,8,9,10,11]. Since local meteorological processes transport particulates downwind, industrial and agricultural activities can also contribute to urban aerosol levels [12,13,14].
Although the meteorological behavior of aerosols has been well studied (i.e., atmospheric transport, wet scavenging, etc.), the impacts of aerosols on localized climates are more complex [15,16]. Aerosols exhibit conflicting “direct” and “indirect” effects on local cloud development [17]. For instance, increased solar radiative scattering, which enhances static stability and discourages cloud development, is a direct impact of aerosols on local atmospheric processes. However, aerosols can also increase cloud formation by acting as cloud condensation nuclei (CCN) [18,19]. This latter indirect, microphysical effect has been linked to both the inhibition of warm-rain processes [20,21,22,23] and the invigoration of cold-rain processes in convective precipitation [24,25,26]. Given the complex and contradictory interactions between aerosols, radiation, and cloud-scale processes, it is difficult to generalize the effects of aerosols on precipitation, particularly in areas of high aerosol concentrations.
Because vehicles and power generation are major sources of aerosols, cities are often regions with high aerosol concentrations [27]. However, the urban landscape alters local meteorology in additional ways, with the most notable being the urban heat island (UHI) effect. Since buildings store heat and release it slowly with little surrounding vegetation, there is a reduction in the latent heat flux and an increase in the sensible heat flux [28,29]. Additionally, buildings enhance surface roughness, creating turbulence and strengthening vertical fluxes. The urban heat coupled with the mechanical lift is linked to increased precipitation over and downstream of cities, which is known as the Urban Rainfall Effect (URE) [30,31,32,33].
Observational studies have attempted to understand how the combination of the UHI effect and elevated urban aerosol levels impacts local precipitation [24,34,35,36]. For example, precipitation suppression by aerosols can be counteracted by precipitation enhancement due to urban land cover [37,38]. Similarly, aerosol enhancement of cold-rain processes can be further bolstered by the urban land surface, increasing rainstorms downwind of cities [24,39,40]. However, observational studies are limited in their ability to isolate the causal mechanisms related to aerosols and urban land cover processes that ultimately produce these precipitation alterations [41,42,43]. Numerical modeling can alleviate this conflation problem by iteratively simulating precipitation with just one or both influences present. This enables the individual influences of aerosols and the urban landscape, as well as their potential non-linear interaction, to be identified.
Therefore, the purpose of this study was to examine the sensitivity of local thunderstorm precipitation to aerosols and urban land cover. The analysis utilized the NASA Unified-Weather Research and Forecasting (NU-WRF) Version 11.3 software to complete four aerosol-land cover scenarios of a warm season convective precipitation event in the Lower Mississippi River industrial corridor. Precipitation and storm morphology were analyzed as a function of urban land cover and atmospheric aerosols across the entire domain as well as several sub-zones.
2. Materials and Methods
2.1. Study Area and Case Study Details
Louisiana and much of the Southeastern United States are characterized by persistent heat and humidity because warm, maritime air masses from the Gulf to the south frequently dominate the region. During the winter, synoptic-scale troughs are driven equatorward, creating large-scale rain systems. In the summer, the pseudo-barotropic environment generates precipitation through late afternoon convective thunderstorms [44]. In addition, the Southeastern U.S. hydroclimate is influenced by many teleconnections on a seasonal and inter-annual basis, such as the North Atlantic Oscillation [45], El Niño Southern Oscillation [46], the Madden–Julian Oscillation [47], and the Bermuda–Azores High [48,49].
While large-scale atmospheric patterns are important hydroclimatic drivers, local-scale hydroclimate influences are often linked to agricultural and industrial activities, which are prevalent throughout the region [18,22,50]. In addition to industrial centers, southeast Louisiana also contains two major cities, Baton Rouge and New Orleans. Baton Rouge has an estimated population of 219,052 and an area of 224 km2 [51,52], while New Orleans has a population of 383,997 with an area of 439 km2 [51,53]. Both of these cities, the two largest in Louisiana, have been documented to exhibit UHI and URE effects [54,55,56,57,58].
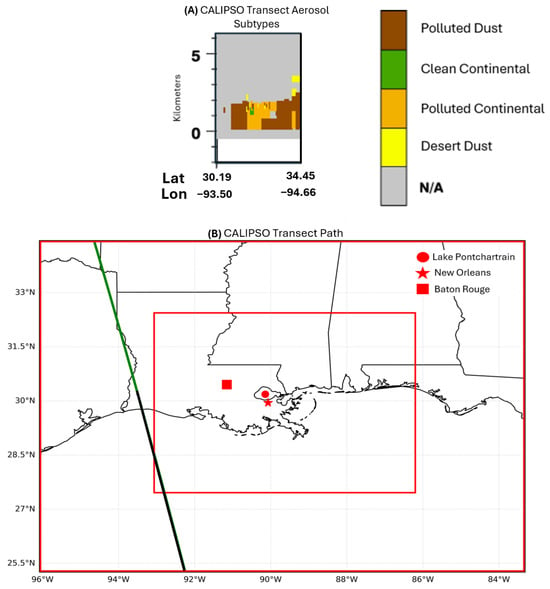
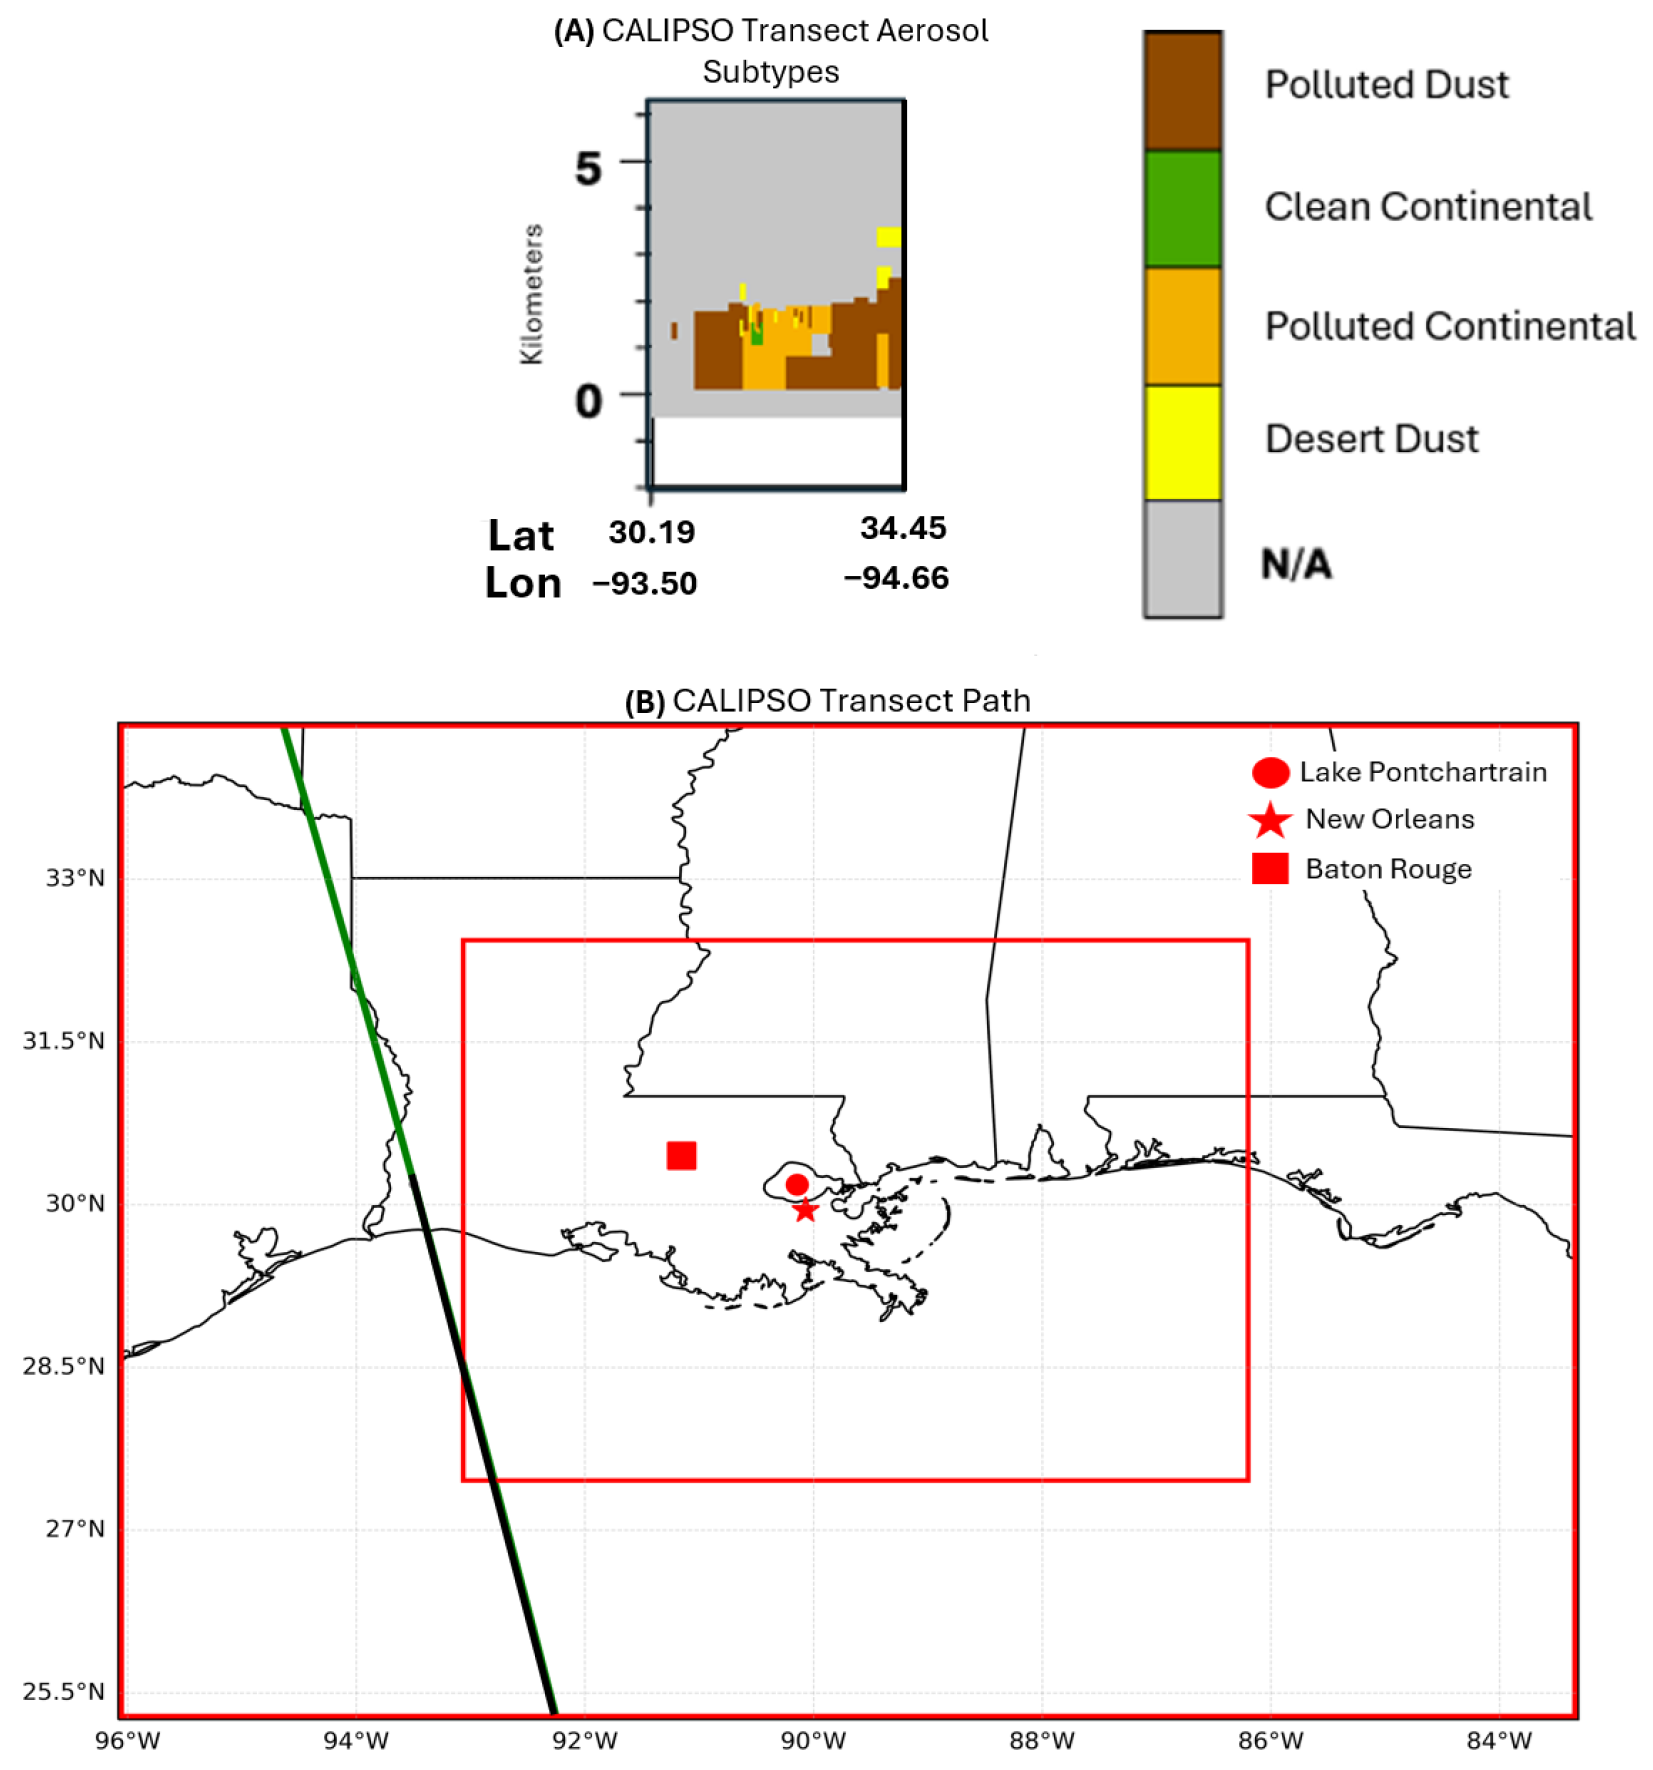
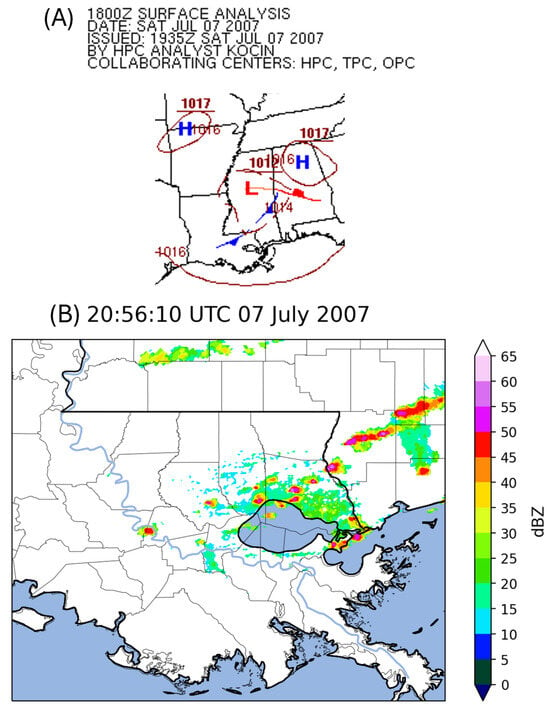
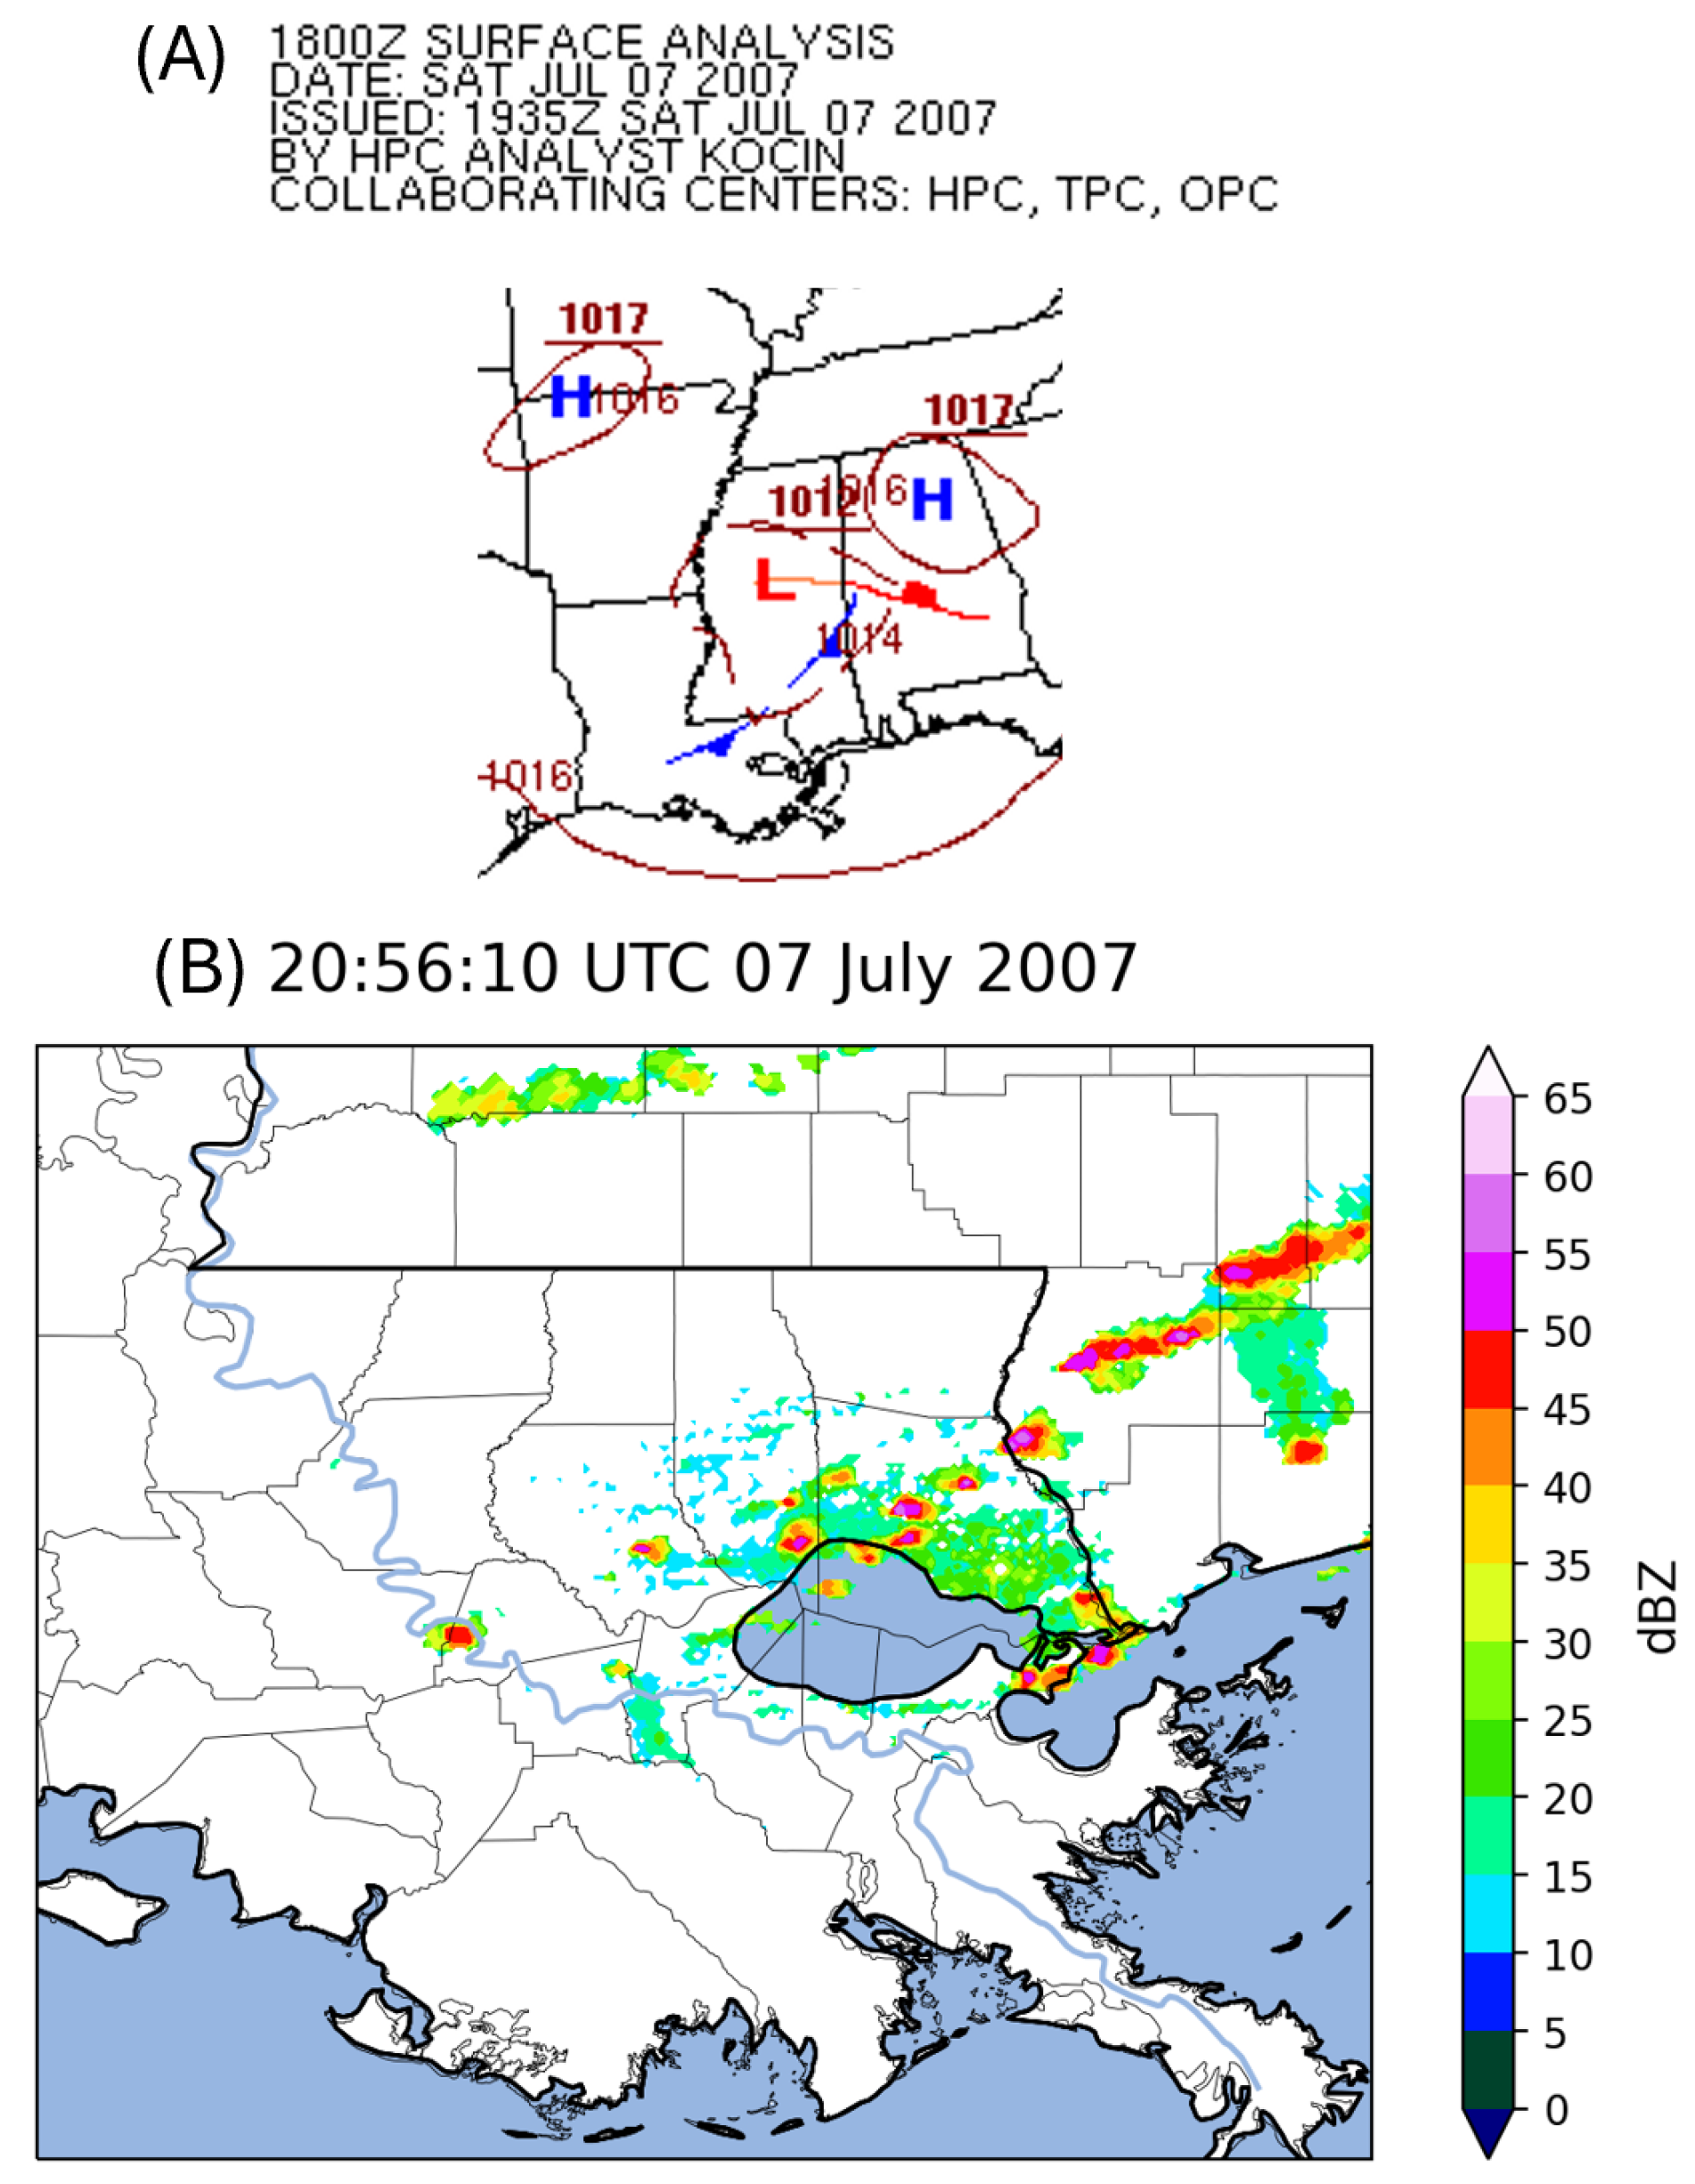
This study focused on 7 July 2007 because it coincided with a preconvective aerosol transect collected by the Cloud-Aerosol Lidar and Infrared Pathfinder Satellite Observations (CALIPSO) satellite (Figure 1), enabling a clear view of the aerosol environment before any wet scavenging. The CALIPSO transect identified quantities of “polluted dust” and “polluted continental” aerosols (Figure 1A) below 5 km, indicating it was an appropriate day to examine potential aerosol effects on convective morphology. Afternoon convection on 7 July was associated with a weak boundary indicated on the Weather Prediction Center’s (WPC) surface analysis (Figure 2A), which triggered the eastward-propagating storms across the study area (Figure 2B).
Figure 1.
(A) NASA Cloud-Aerosol Lidar with Orthogonal Polarization (CALIOP) level 1 lidar imagery transect captured by CALIPSO at 19:12:02 UTC on 7 July 2007, which depicts aerosol subtypes, and (B) CALIPSO path (green and black) with the simulation domains overlaid in red. The green line indicates the CALIOP transect path shown in (A), while the black line indicates the non-measured/offshore path.
Figure 2.
(A) WPC surface analysis for 1800 UTC 7 July 2007 depicting a southwest-to-northeast oriented cold front (blue line) stretching from southern Louisiana to eastern Mississippi. “H” represents regions of high surface pressure, while “L” is the relative surface low pressure. Solid maroon lines and numbers are isobars and hectopascal surface pressures, respectively. The solid red line is a warm front. (B) Composite reflectivity (dBZ) from the KLIX WSR-88D in Slidell, LA for 2056 UTC on 7 July 2007.
2.2. Numerical Modeling Technique
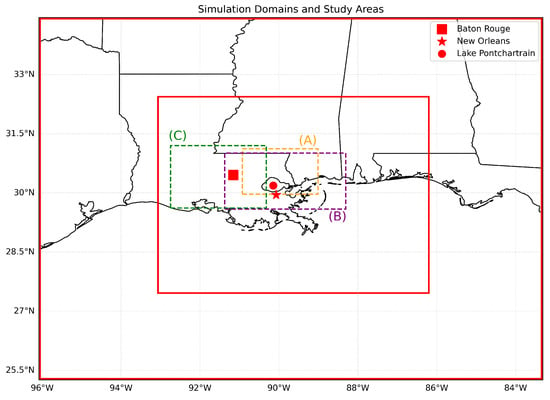
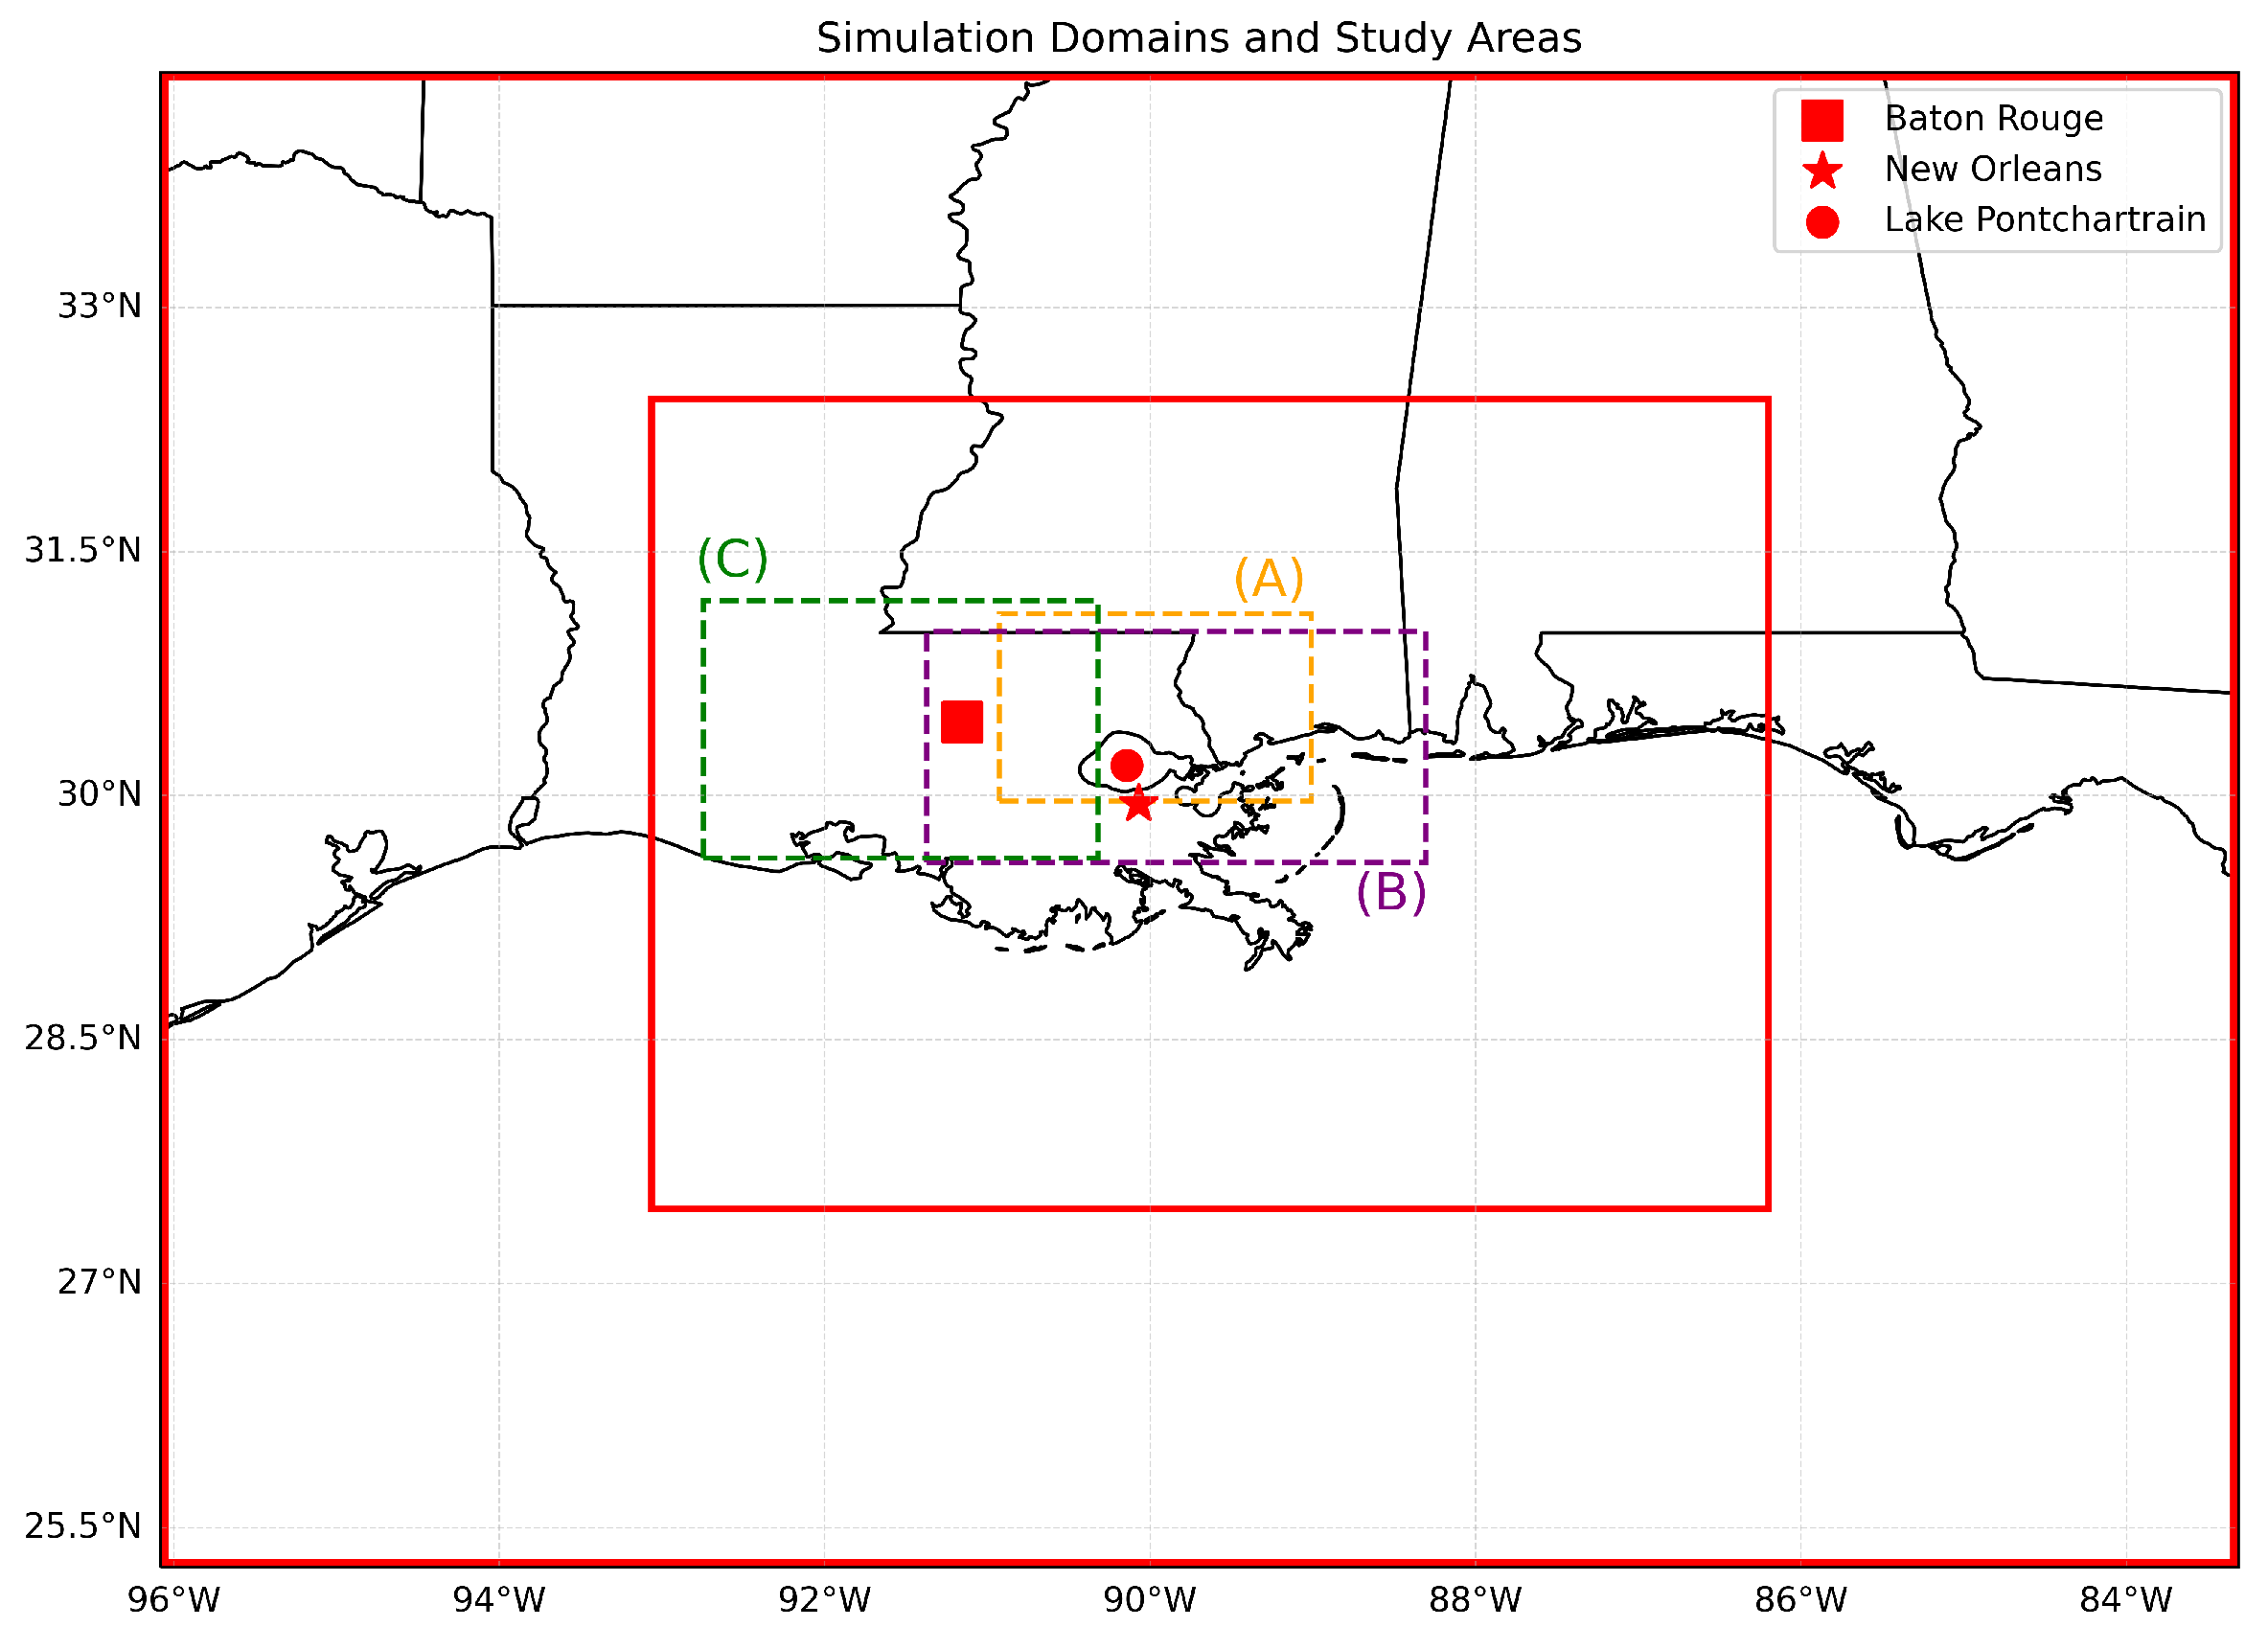
The NU-WRF v11.3 modeling system incorporates WRF-Chem version 4.4 and the Goddard Space Flight Center Land Information System (GSFC LIS), allowing atmospheric aerosol and particulate modeling at satellite-resolved scales [59,60,61]. Prior research has demonstrated NU-WRF’s efficacy for regional precipitation and aerosol modeling [62,63,64]. Simulations were performed for 36 h beginning at 0000 UTC 7 July 2007 and ending at 1200 UTC 8 July 2007 with output written to disk every 15 min and the first 6 h discarded as spin-up time. The NU-WRF domain consisted of a 12 km grid-spacing in the outer domain and a 3 km grid within the inner domain, which was the primary focus of the study. Figure 3 shows the NU-WRF domains as well as the three focus areas within the inner domain that are described further in Section 2.3. Boundary conditions were specified using the 32 km North American Mesoscale model. Parameterization choices are summarized in Table 1. Importantly, no cumulus scheme was activated for the inner 3 km resolution domain. The remaining physical parameterizations were selected based on existing literature and aerosol datasets compatible with NU-WRF [65,66,67]. The MOZART Chemistry and GOCART aerosols modules were utilized due to their versatility and previous successful deployments within the NU-WRF system [68,69], despite their inability to resolve the effects of sea salt aerosols.
Figure 3.
Simulation domains (red boxes) and study areas, where (A) is the Lake Pontchartrain sub-zone, (B) is the New Orleans sub-zone, and (C) is the aerosol-concentrated sub-zone.
Table 1.
NU-WRF simulation physical parameterization selections.
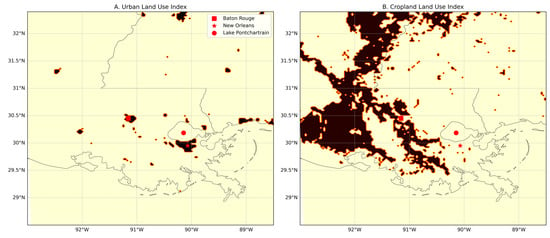
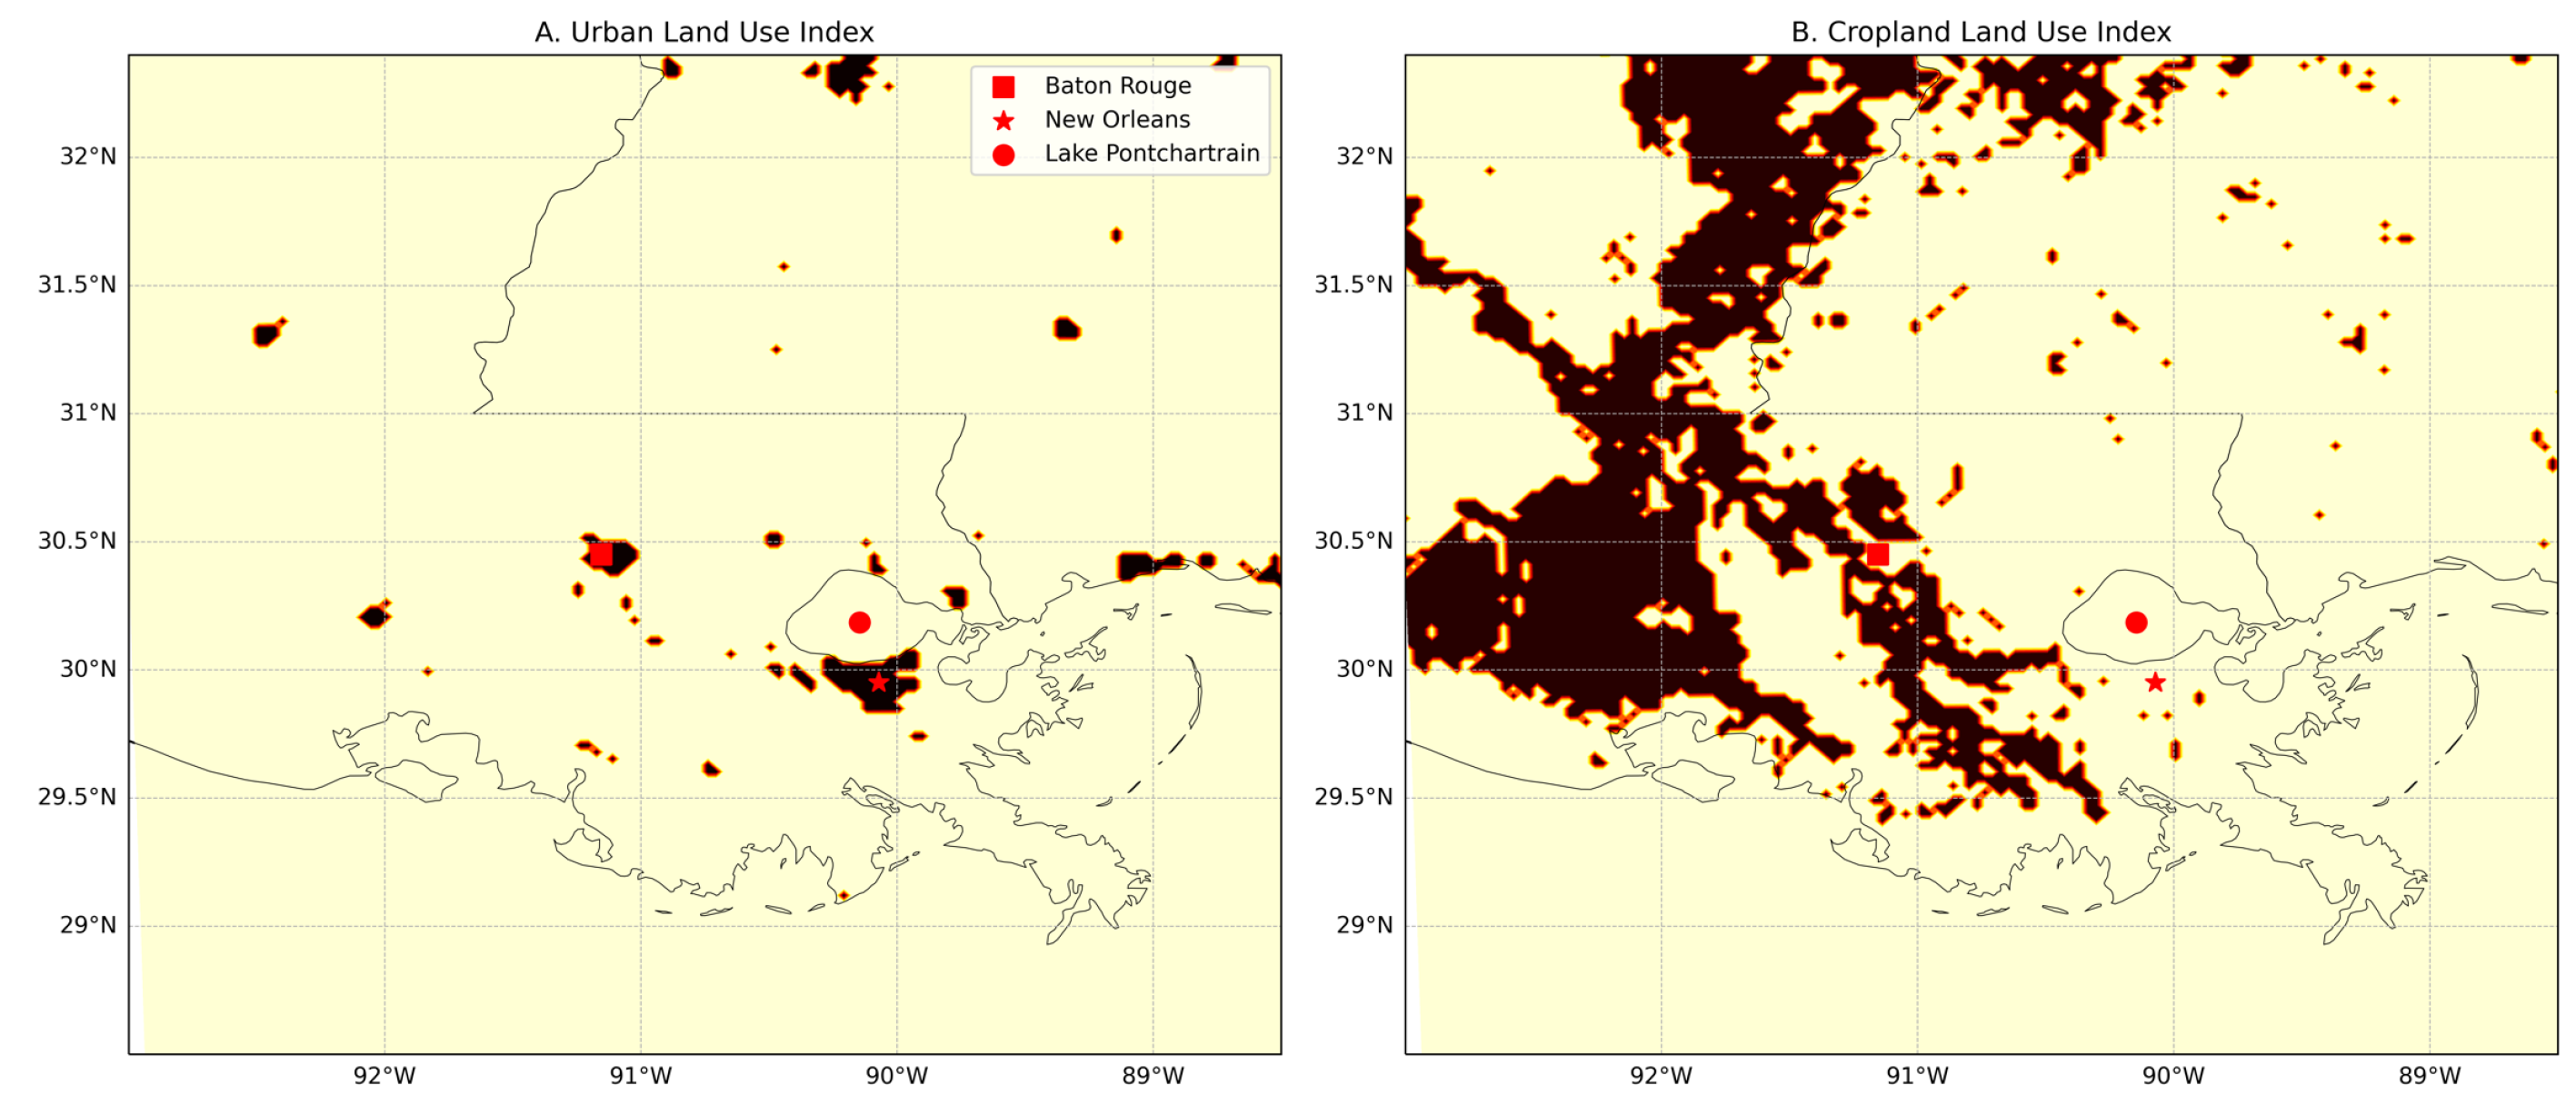
To examine the sensitivity of convective precipitation to aerosols and the urban environment, the following four scenarios were explored where aerosols (i.e., atmospheric chemistry) and/or urban land cover were iteratively included/excluded from the simulations: (1) “control” scenario without aerosols or urban land cover, (2) “urban-only” scenario, (3) “aerosol-only” scenario, and (4) “aerosol-urban” scenario where both were incorporated. For both of the aerosol-on simulations, the “Chemical Mechanism/Aerosol Module”, “Anthropogenic Emissions”, and “Biogenic Emissions” listed in Table 1 were incorporated into the model’s initialization. These atmospheric chemistry parameters dictate emission inventories and how the model transports aerosols. The parameters and inventories were not incorporated into the two aerosol-off simulations. For both of the urban-off simulations, the physical properties of the “Urban/Built-Up” land cover category (i.e., albedo, roughness, etc.) in NU-WRF’s VEGPARM.TBL and LANDUSE.TBL files were edited to match those of the “Croplands” category (Figure 4). Croplands were chosen as the alternative land cover due to their domain-wide prevalence and close proximity to urban cells.
Figure 4.
(A) NU-WRF cells categorized as “Urban/Built-Up” that were converted to “Croplands” for the urban-off simulations. (B) NU-WRF cells categorized as “Croplands” before (A) was converted.
To simulate aerosols in the Lower Mississippi River industrial corridor, the atmospheric chemistry module accounted for natural particulate sources, biogenic emissions, and anthropogenic emissions. EDGAR-HTAP Version 2.2 served as the anthropogenic emission data due to its availability on the NASA Discover Cluster and its successful application in similar studies [70,71,72]. Because the study event occurred in 2007 before the dataset was available, the simulations used emissions data from 2010. However, previous studies have successfully utilized the 2010 EDGAR-HTAP v2.2 dataset within WRF-Chem outside of the original emission inventory year [73,74,75]. Additionally, the scenarios incorporated direct and indirect shortwave radiation feedback from the chemistry sources, better simulating the radiative impacts of aerosols [76].
2.3. Hydrometeorological Evaluation and Analysis
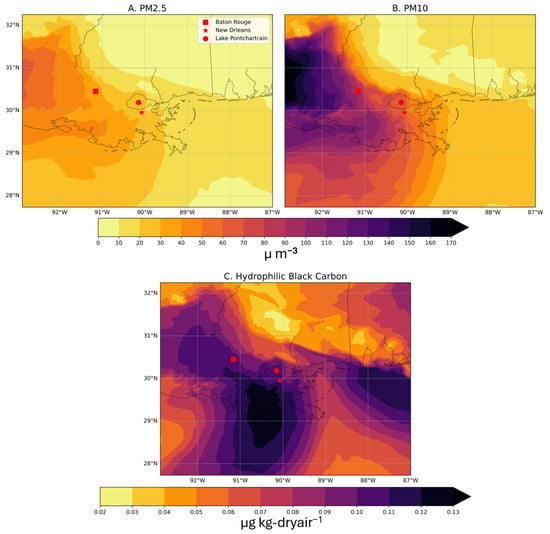
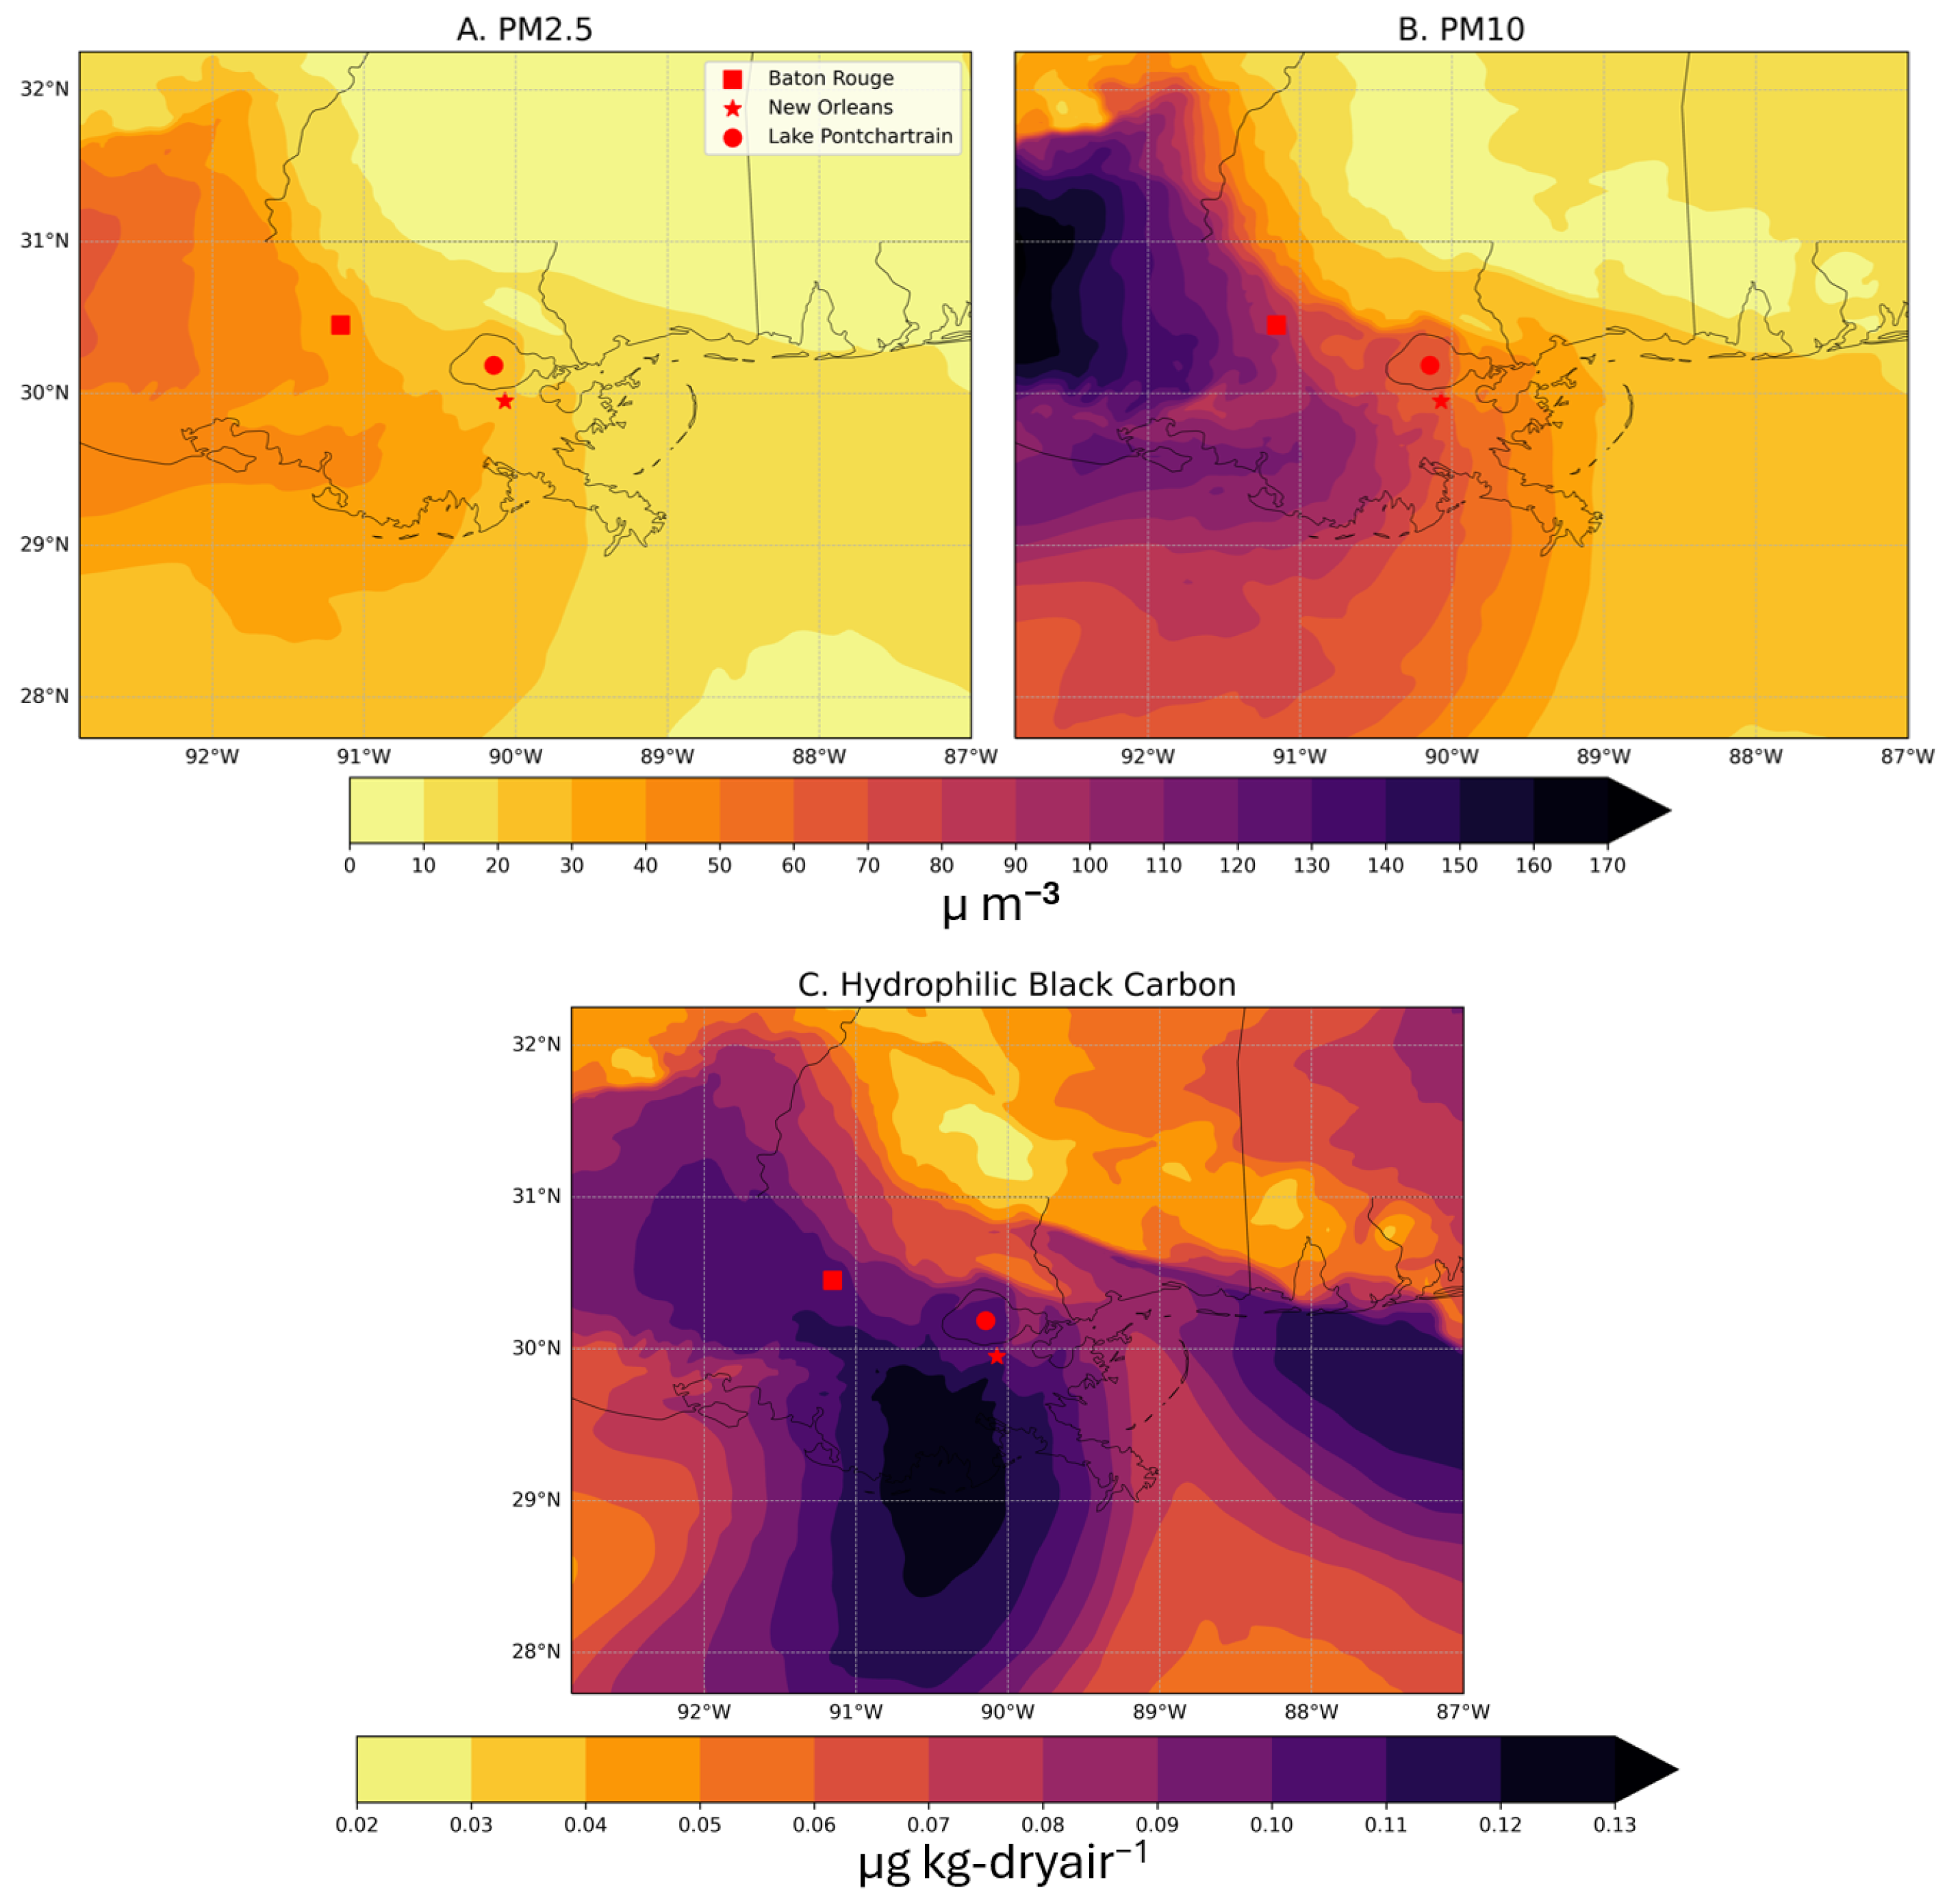
To assess the hydrometeorological differences across the modeling scenarios, three sub-zones (Figure 3) were analyzed in detail for distinct reasons. The “Lake Pontchartrain” sub-zone was isolated due to its comparatively widespread convective activity on 7 July 2007 (Figure 2). The “New Orleans” sub-zone was selected due to its dense urban land cover. Finally, the “aerosol-concentrated” sub-zone was identified by consulting the aerosol distribution fields from the NU-WRF initialization files (Figure 5), which revealed that the greatest concentrations of aerosols were located in central Louisiana upon initialization (i.e., before being transported east). Additionally, with the exception of Baton Rouge, the sub-zone consisted of sparse urban land cover. Although the anthropogenic emissions data were from 2010, the location and concentration of aerosols remained consistent with the CALIPSO transect (Figure 1). Additionally, analysis comparing 2007 and 2010 point source emissions also suggested that the temporal mismatch was not overly problematic (Table S1). Despite the partial overlap in sub-zone areas, the distinctive convective, urban, and aerosol contexts provided important unique regional differences.
Figure 5.
Aerosol concentrations at 0600 UTC 7 July 2007 for (A) PM2.5, (B) PM10, and (C) Hydrophilic Black Carbon.
NU-WRF accumulated precipitation, simulated reflectivity, and 2 m air temperature min/max were used to evaluate the accuracy of the simulations. Accumulated precipitation and simulated radar reflectivity were compared against NASA’s Integrated Multi-SatellitE Retrievals for GPM (IMERG) [77] and the National Weather Service’s KLIX WSR-88D composite reflectivity (Figure 2B), respectively. IMERG is a remotely sensed dataset that combines precipitation observations from satellites to create rainfall estimates at a 0.1° grid cell resolution [78]. Although this study focused primarily on precipitation, rainfall is often scattered, which can produce inflated error measures even when relatively small discrepancies in thunderstorm timing and/or location occur. Therefore, near-surface air temperature data from Daymet was also included to evaluate the NU-WRF simulations, as temperature contributes to the underlying conditions influencing precipitation. Daymet provides 1 km interpolated estimates of weather conditions derived from daily observations by weather stations [79]. Daymet’s Tmax and Tmin values are calculated for 24 h from midnight to midnight at a grid cell’s local time (i.e., 0500 UTC 7 July 2007 to 0500 UTC 8 July 2007). However, due to the discarded spin-up time, the simulation Tmax and Tmin values were calculated for 23 h, from 0600 UTC 7 July 2007 to 0500 UTC 8 July 2007.
Accumulated precipitation mean absolute error (MAE) values for each sub-zone were calculated by first finding the absolute difference at every grid point between the simulation and the IMERG dataset. Then, each grid cell’s absolute difference was added together and divided by the total number of grid cells. Root mean square error (RMSE) was found by squaring the difference between every simulation grid value and the IMERG dataset grid cell, summing the grid cell squared differences, dividing the sum by the total number of grid cells, and finally taking the square root of the mean value. Maximum and minimum 2 m air temperature MAE and RMSE values were calculated similarly, except that modeled 2 m temperature and Daymet air temperature were used. For both MAE and RMSE calculations, the coarser datasets were regridded to match the finer spatial resolutions. The regridding process was conducted in Python 3.11.5 by creating a new array with the resolution of the finer-scale dataset but with each grid cell containing the closest coarser grid cell value.
After characterizing the performance of the hindcasts, the simulated precipitation and reflectivity were compared across the four scenarios to evaluate the influence of urban land cover and aerosols on the hydrometeorological characteristics of the event. For each of the three sub-zones (Figure 3), the number of grid cells meeting or exceeding various reflectivity and accumulated precipitation thresholds was recorded at each timestep. This method examined relevant variables without unnecessarily penalizing small spatial differences between simulations, and it provided insights regarding the timing and coverage area of reflectivity and precipitation. For operational purposes, 10 dBZ is commonly the baseline for precipitating storms [80,81,82,83]. Therefore, 10 dBZ (5 mm) was used to define the “minimum” threshold. The “medium” threshold was 25 dBZ (10 mm), which represents moderate reflectivity (precipitation). The “high” threshold of 40 dBZ (15 mm) meets or exceeds the conventional definition of radar-indicated convective precipitation [82,84]. Finally, the “peak” threshold of 55 dBZ (20 mm) captured the highest values resolved in the simulations.
3. Results
3.1. Comparison to Observations
The MAE values in Table 2 were somewhat consistent across the various simulations for accumulated precipitation. The control simulations exhibited the smallest accumulated precipitation error for each sub-zone, except for the aerosol-concentrated sub-zone where the aerosol-only simulation displayed the smallest error. However, the differences in the error across each simulation for the aerosol-concentrated sub-zone were much smaller. The regions displayed mixed signals in terms of which simulation exhibited the greatest error magnitude. For the Pontchartrain and aerosol-concentrated sub-zones, the urban-only simulations displayed the highest MAEs for accumulated precipitation, while the combined model performed most poorly for New Orleans. Although the RMSE values were naturally higher than the MAE values in each sub-zone, their ordering was relatively similar across simulations. Overall, the lack of consistent error reductions by the aerosol-urban model relative to the control suggests that aerosol and urban processes were secondary, or even tertiary, drivers of precipitation variability for the study event, which influenced fine-scale spatial patterns that were challenging to capture in the simulations. Despite this discrepancy, previous NU-WRF and WRF-Chem studies have reached meaningful conclusions while facing similar challenges [63,69,85,86,87,88,89,90].
Table 2.
Mean absolute error (MAE) and root mean square error (RMSE) across the three sub-zones for accumulated precipitation (mm), Tmax (°C), and Tmin (°C).
The Tmax and Tmin errors were more consistent between the simulations (Table 2). The Pontchartrain sub-zone exhibited the widest Tmax error range of 0.09 °C (0.10 °C), whereas the aerosol-concentrated region displayed nearly identical Tmax errors. The larger Tmin errors (Table 2) might be attributable to the slight discrepancy in the diurnal temperature calculation (i.e., one-hour delay in NU-WRF versus Daymet). However, the consistent magnitude and narrow error ranges again suggest that the event was largely dominated by non-aerosol, non-urban processes, with the experimental conditions only slightly modulating the primary meteorological drivers.
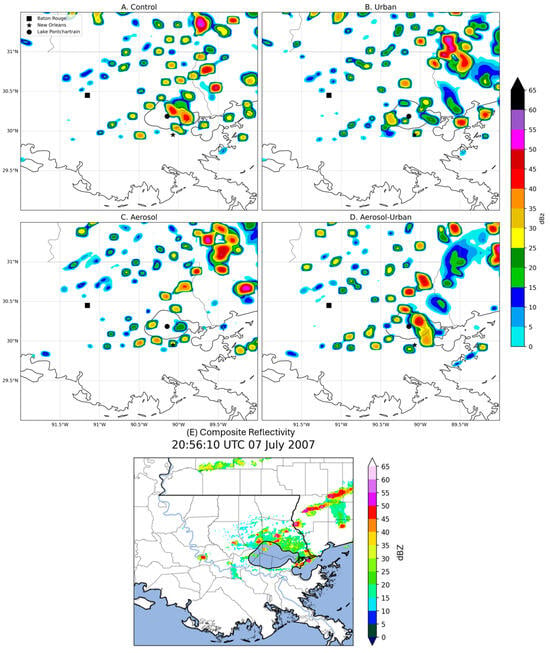
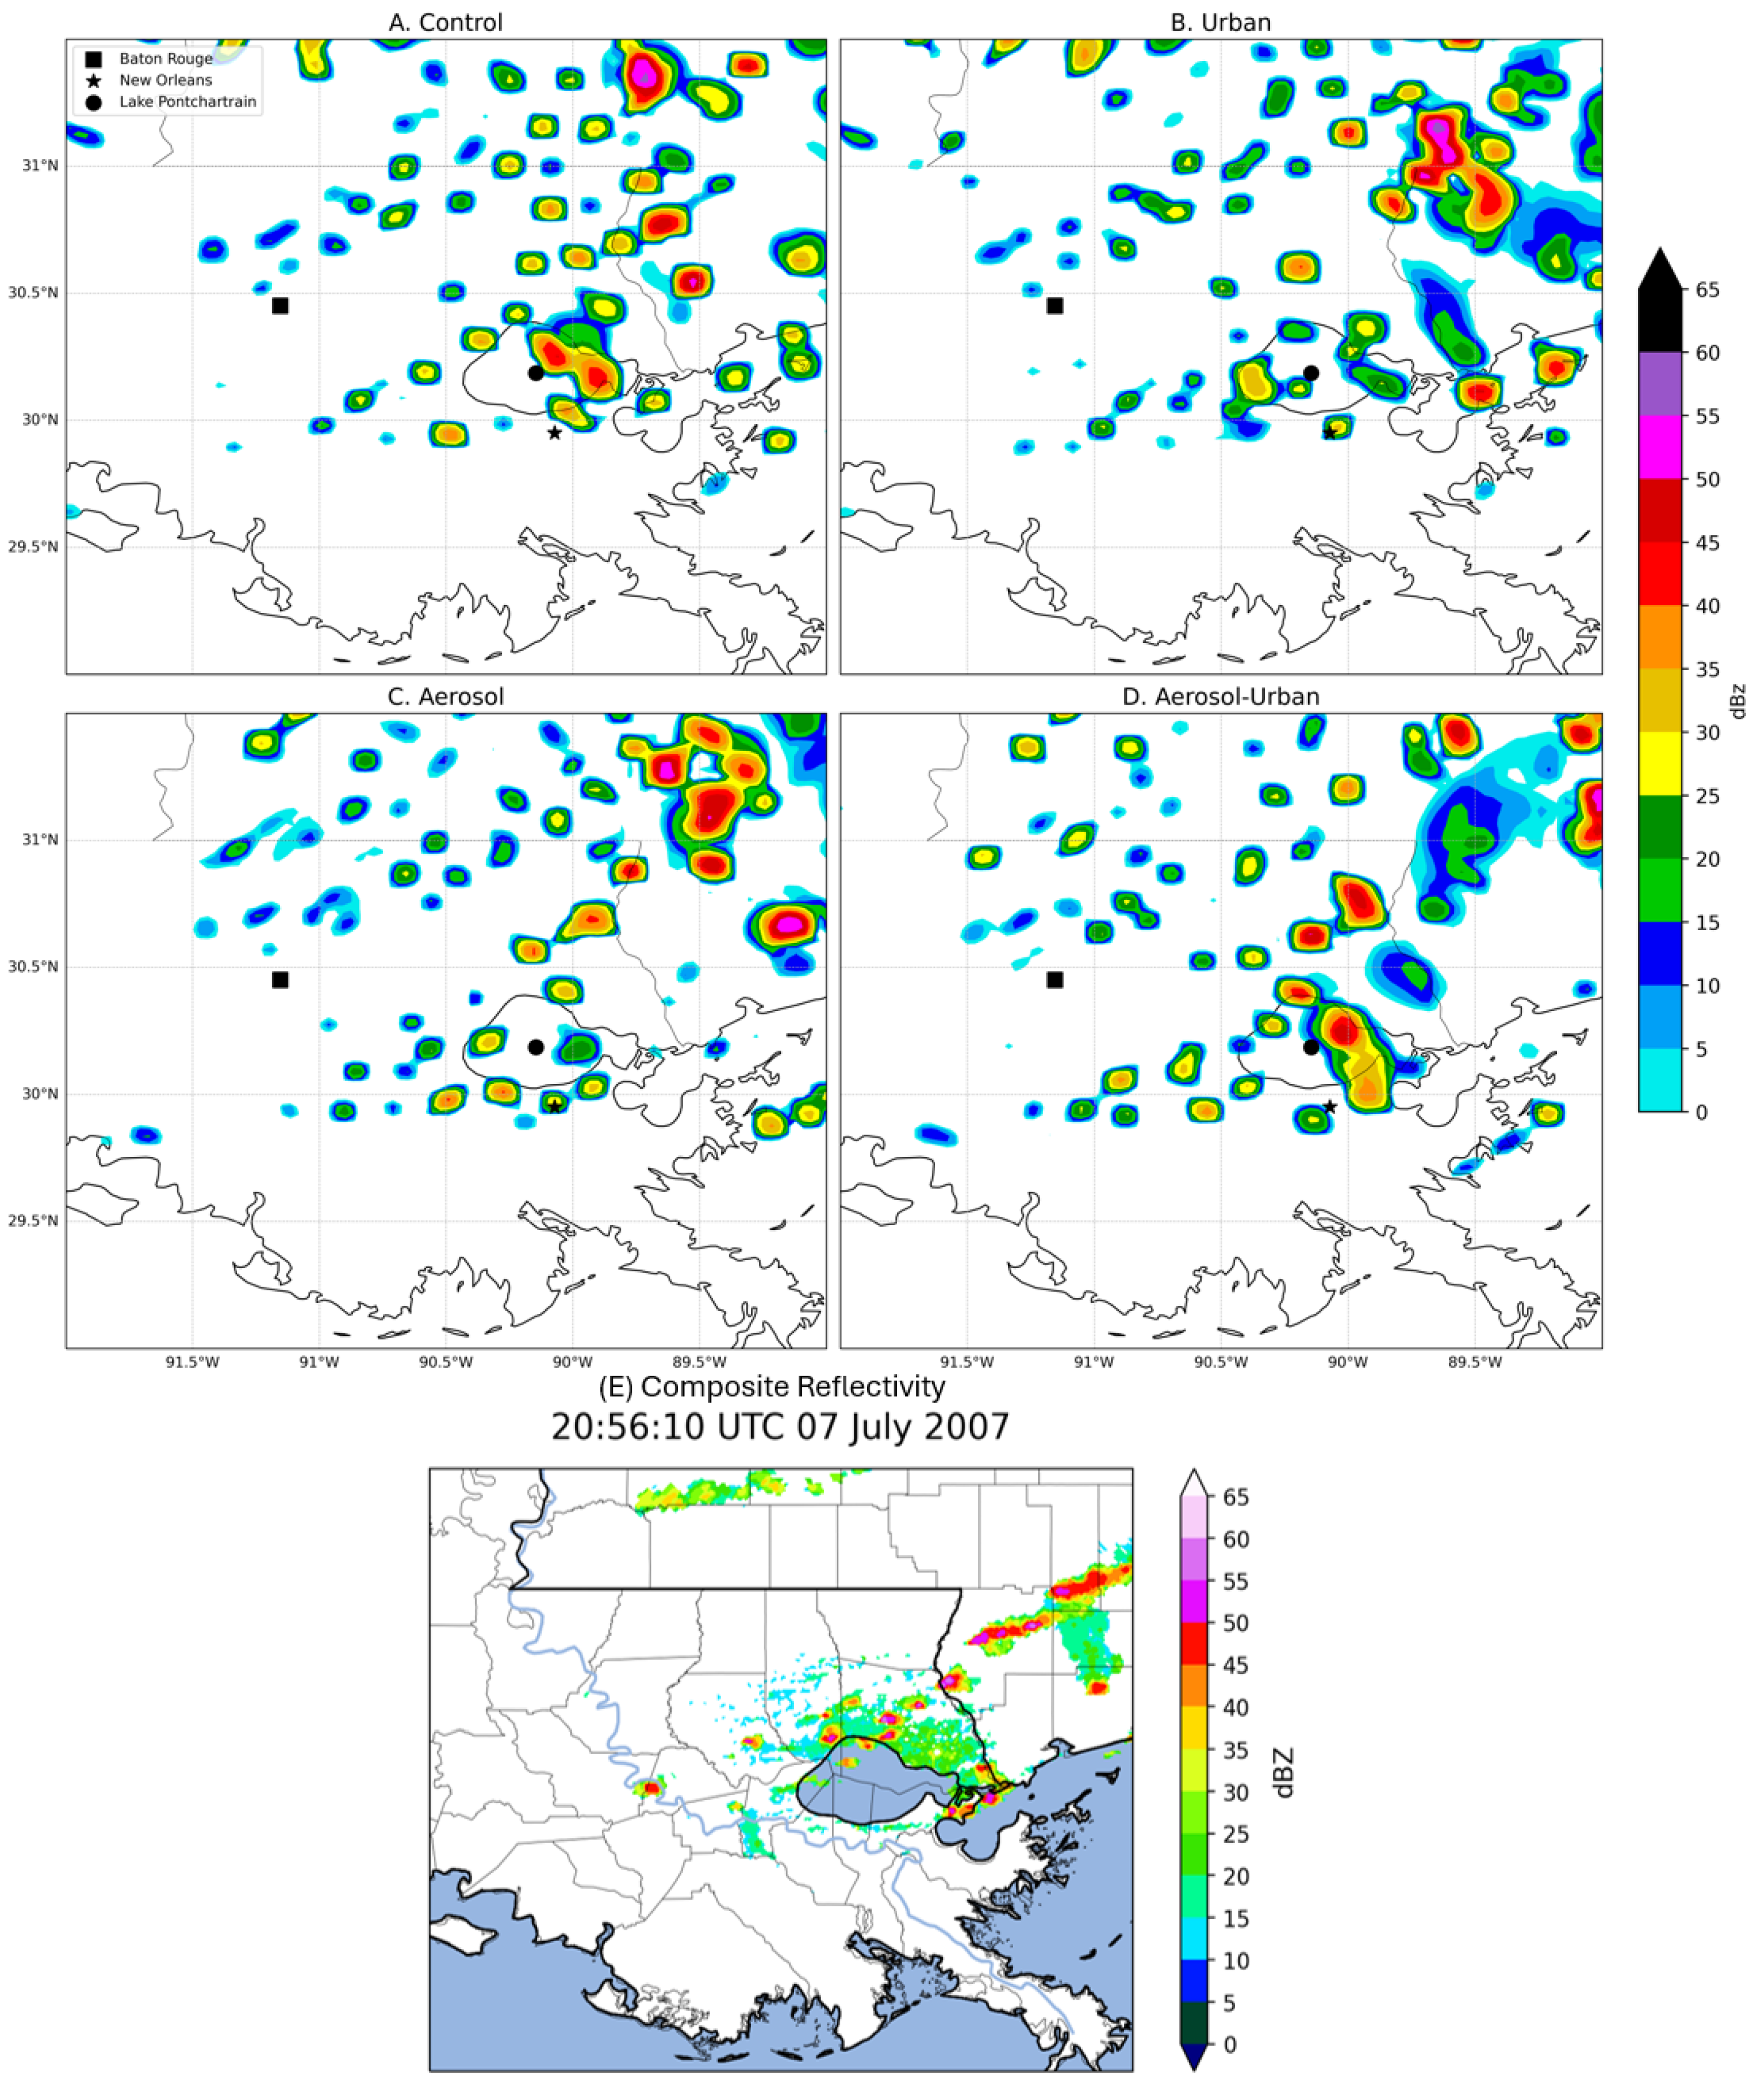
Visual comparisons of the simulated composite reflectivity (Figure 6A–D) against the KLIX WSR-88D radar (Figure 2B and Figure 6E) at 2100 UTC illustrated that the simulations were aggressive in terms of storm strength, creating high-dBZ cells behind the primary line of convection that extended towards the southwestern coast of Louisiana. However, the simulations captured the overall spatial orientation of the event, which spanned from the southwest domain corner to the northeast. The propagation timing was also similar between the observed radar (Figure 6E) and the simulated reflectivity (Figure 6A–D), which suggests that the near-storm environment was accurately reproduced even if errors in precipitation location and magnitude produced higher MAE and RMSE values. Additionally, the significance of the differences between the experimental simulations and the control was calculated for accumulated precipitation, which showed that a majority of the area within each sub-zone was considered significantly different (Figure S1). Collectively, these findings highlight that the simulations can be meaningfully compared to assess the sensitivity of precipitation to aerosols and urban land cover.
Figure 6.
Simulated composite reflectivity (dBZ) at 2100 UTC on 7 July 2007 for the (A) control simulation, (B) urban-only simulation, (C) aerosol-only simulation, and (D) aerosol-urban simulation. (E) Composite reflectivity (dBZ) from the KLIX WSR-88D in Slidell, LA at 2056 UTC on 7 July 2007.
3.2. Pontchartrain Sub-Zone
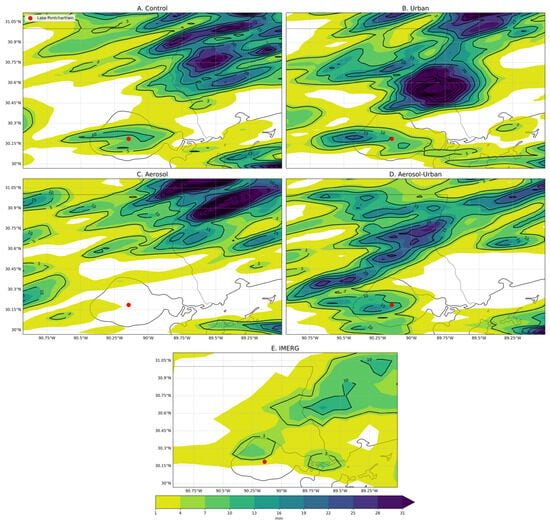
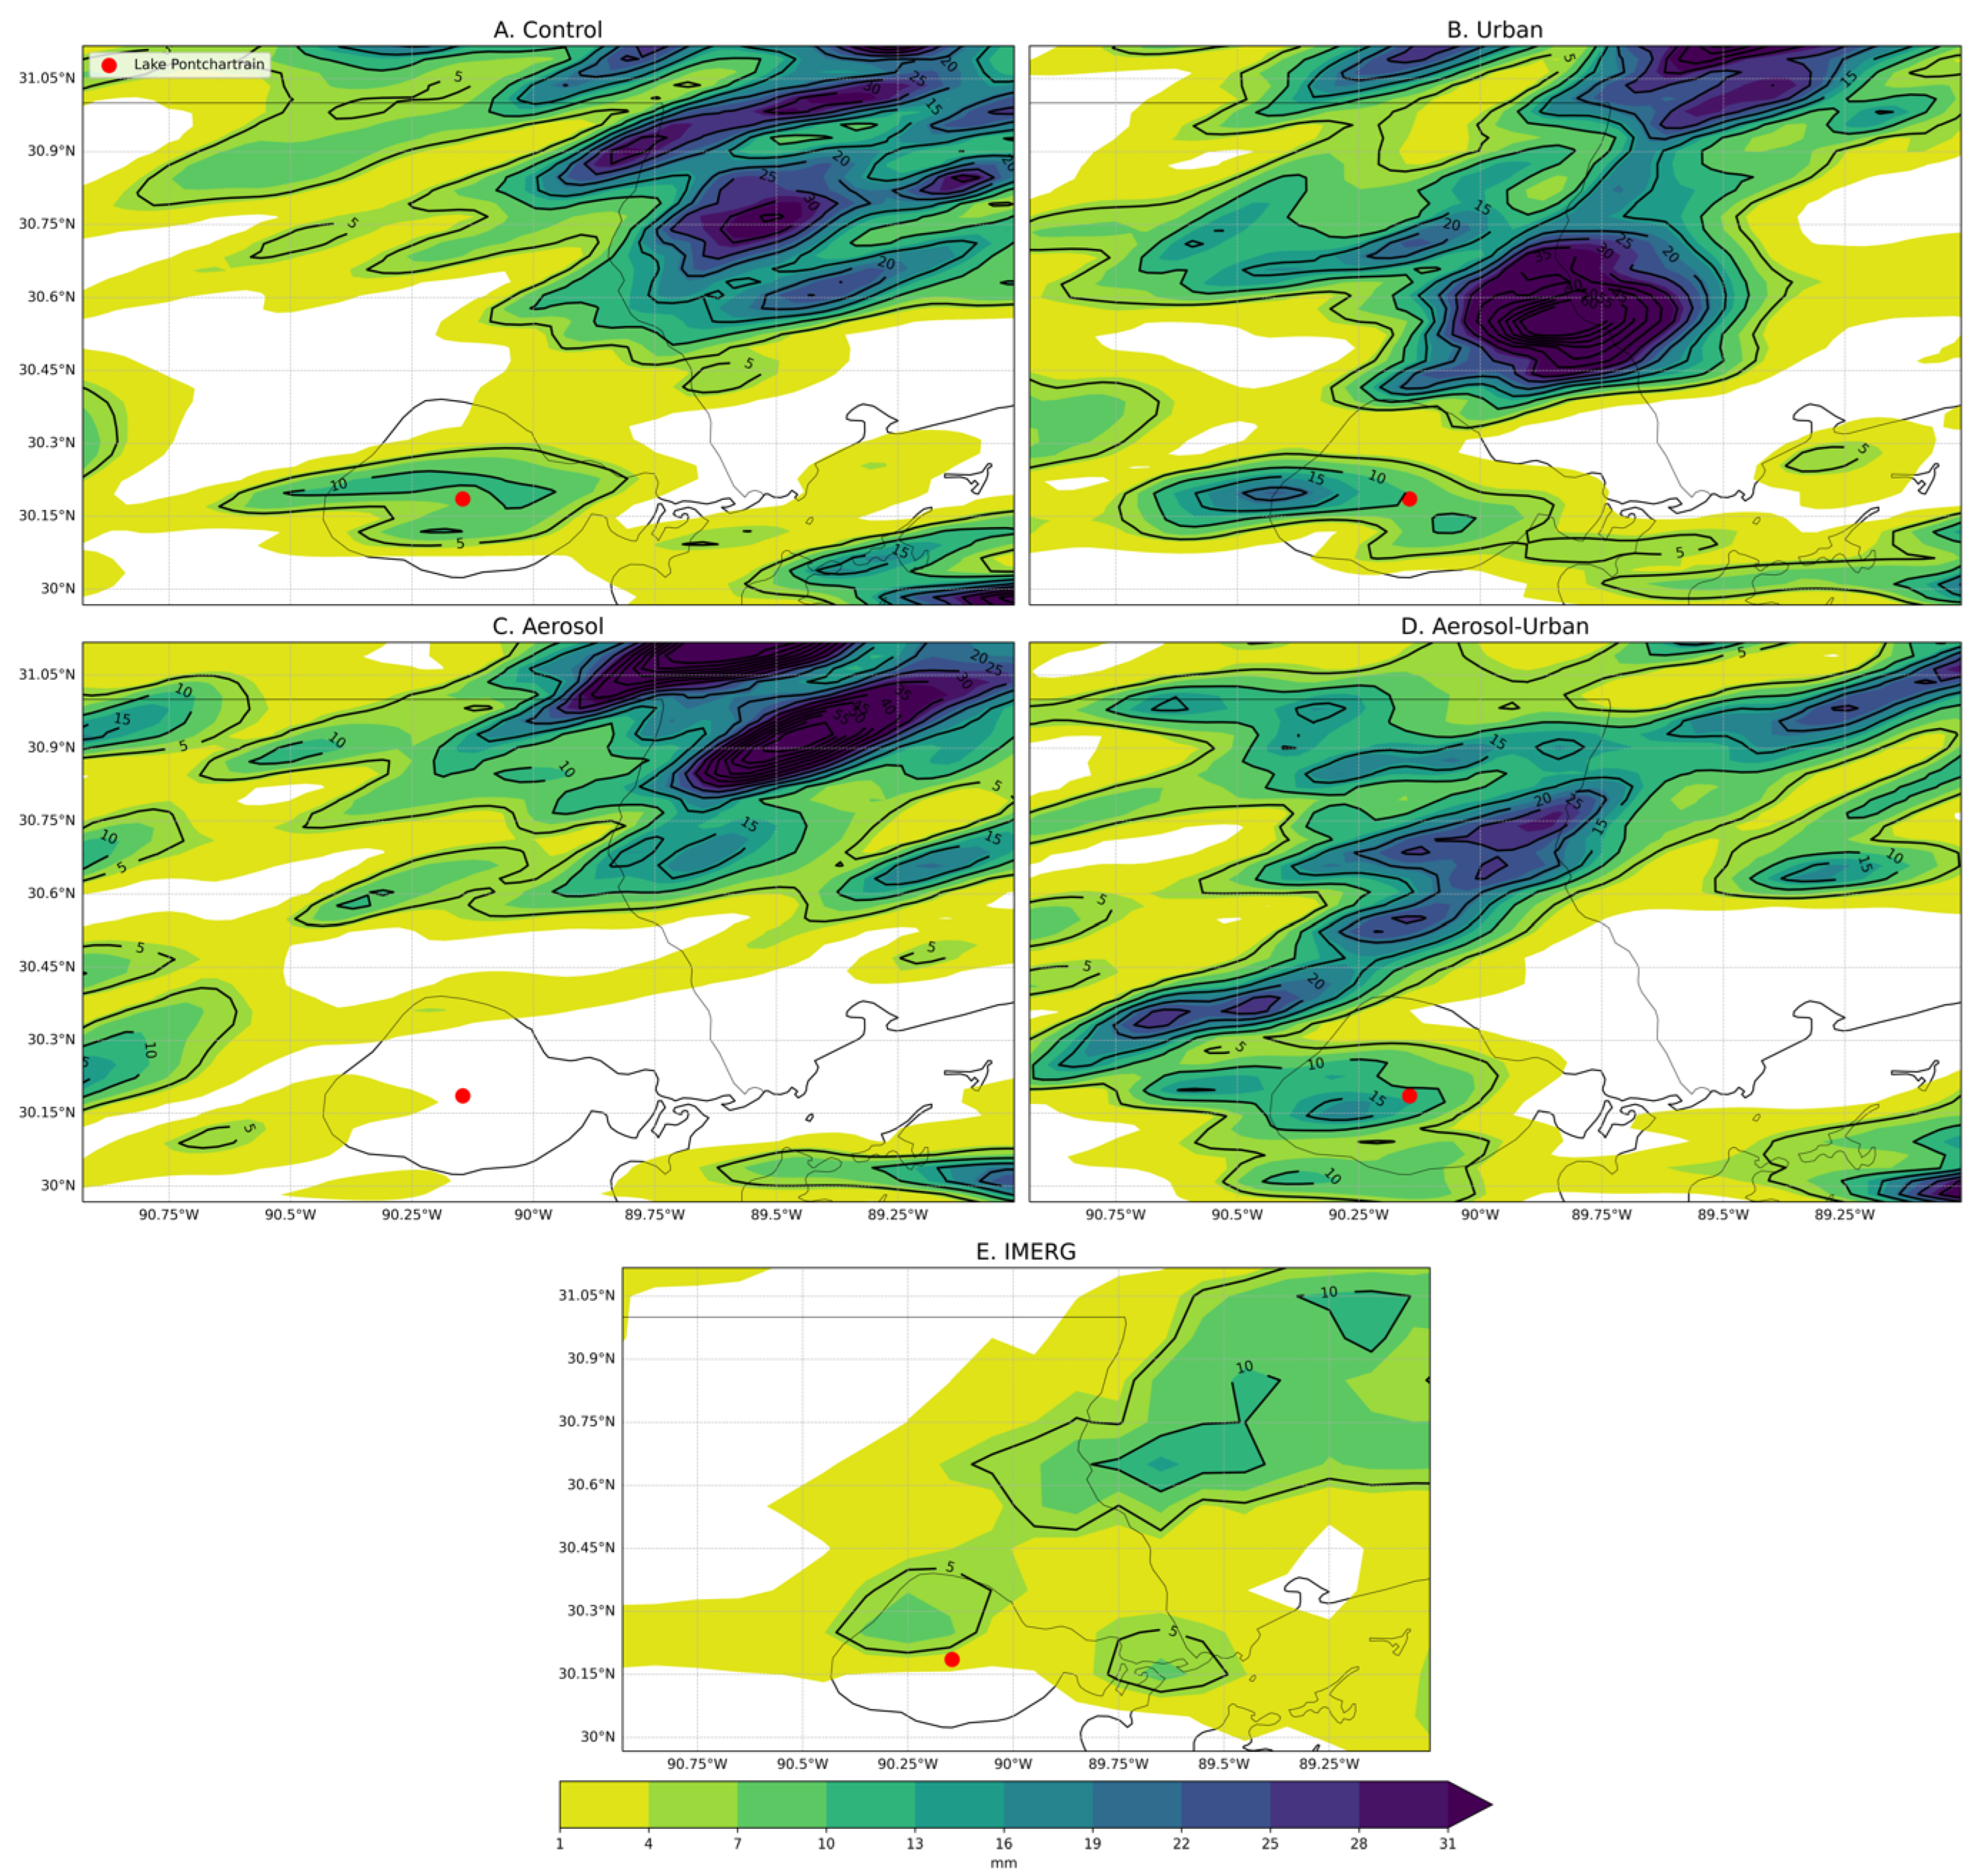
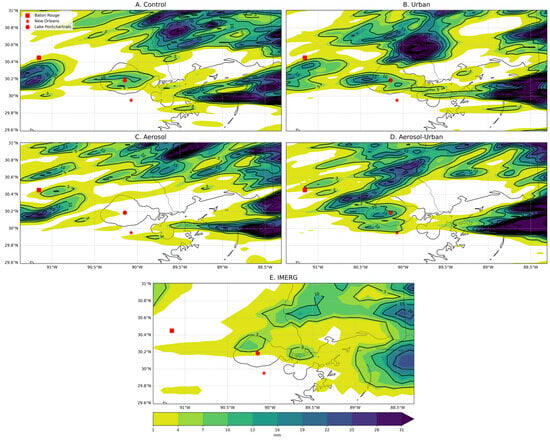
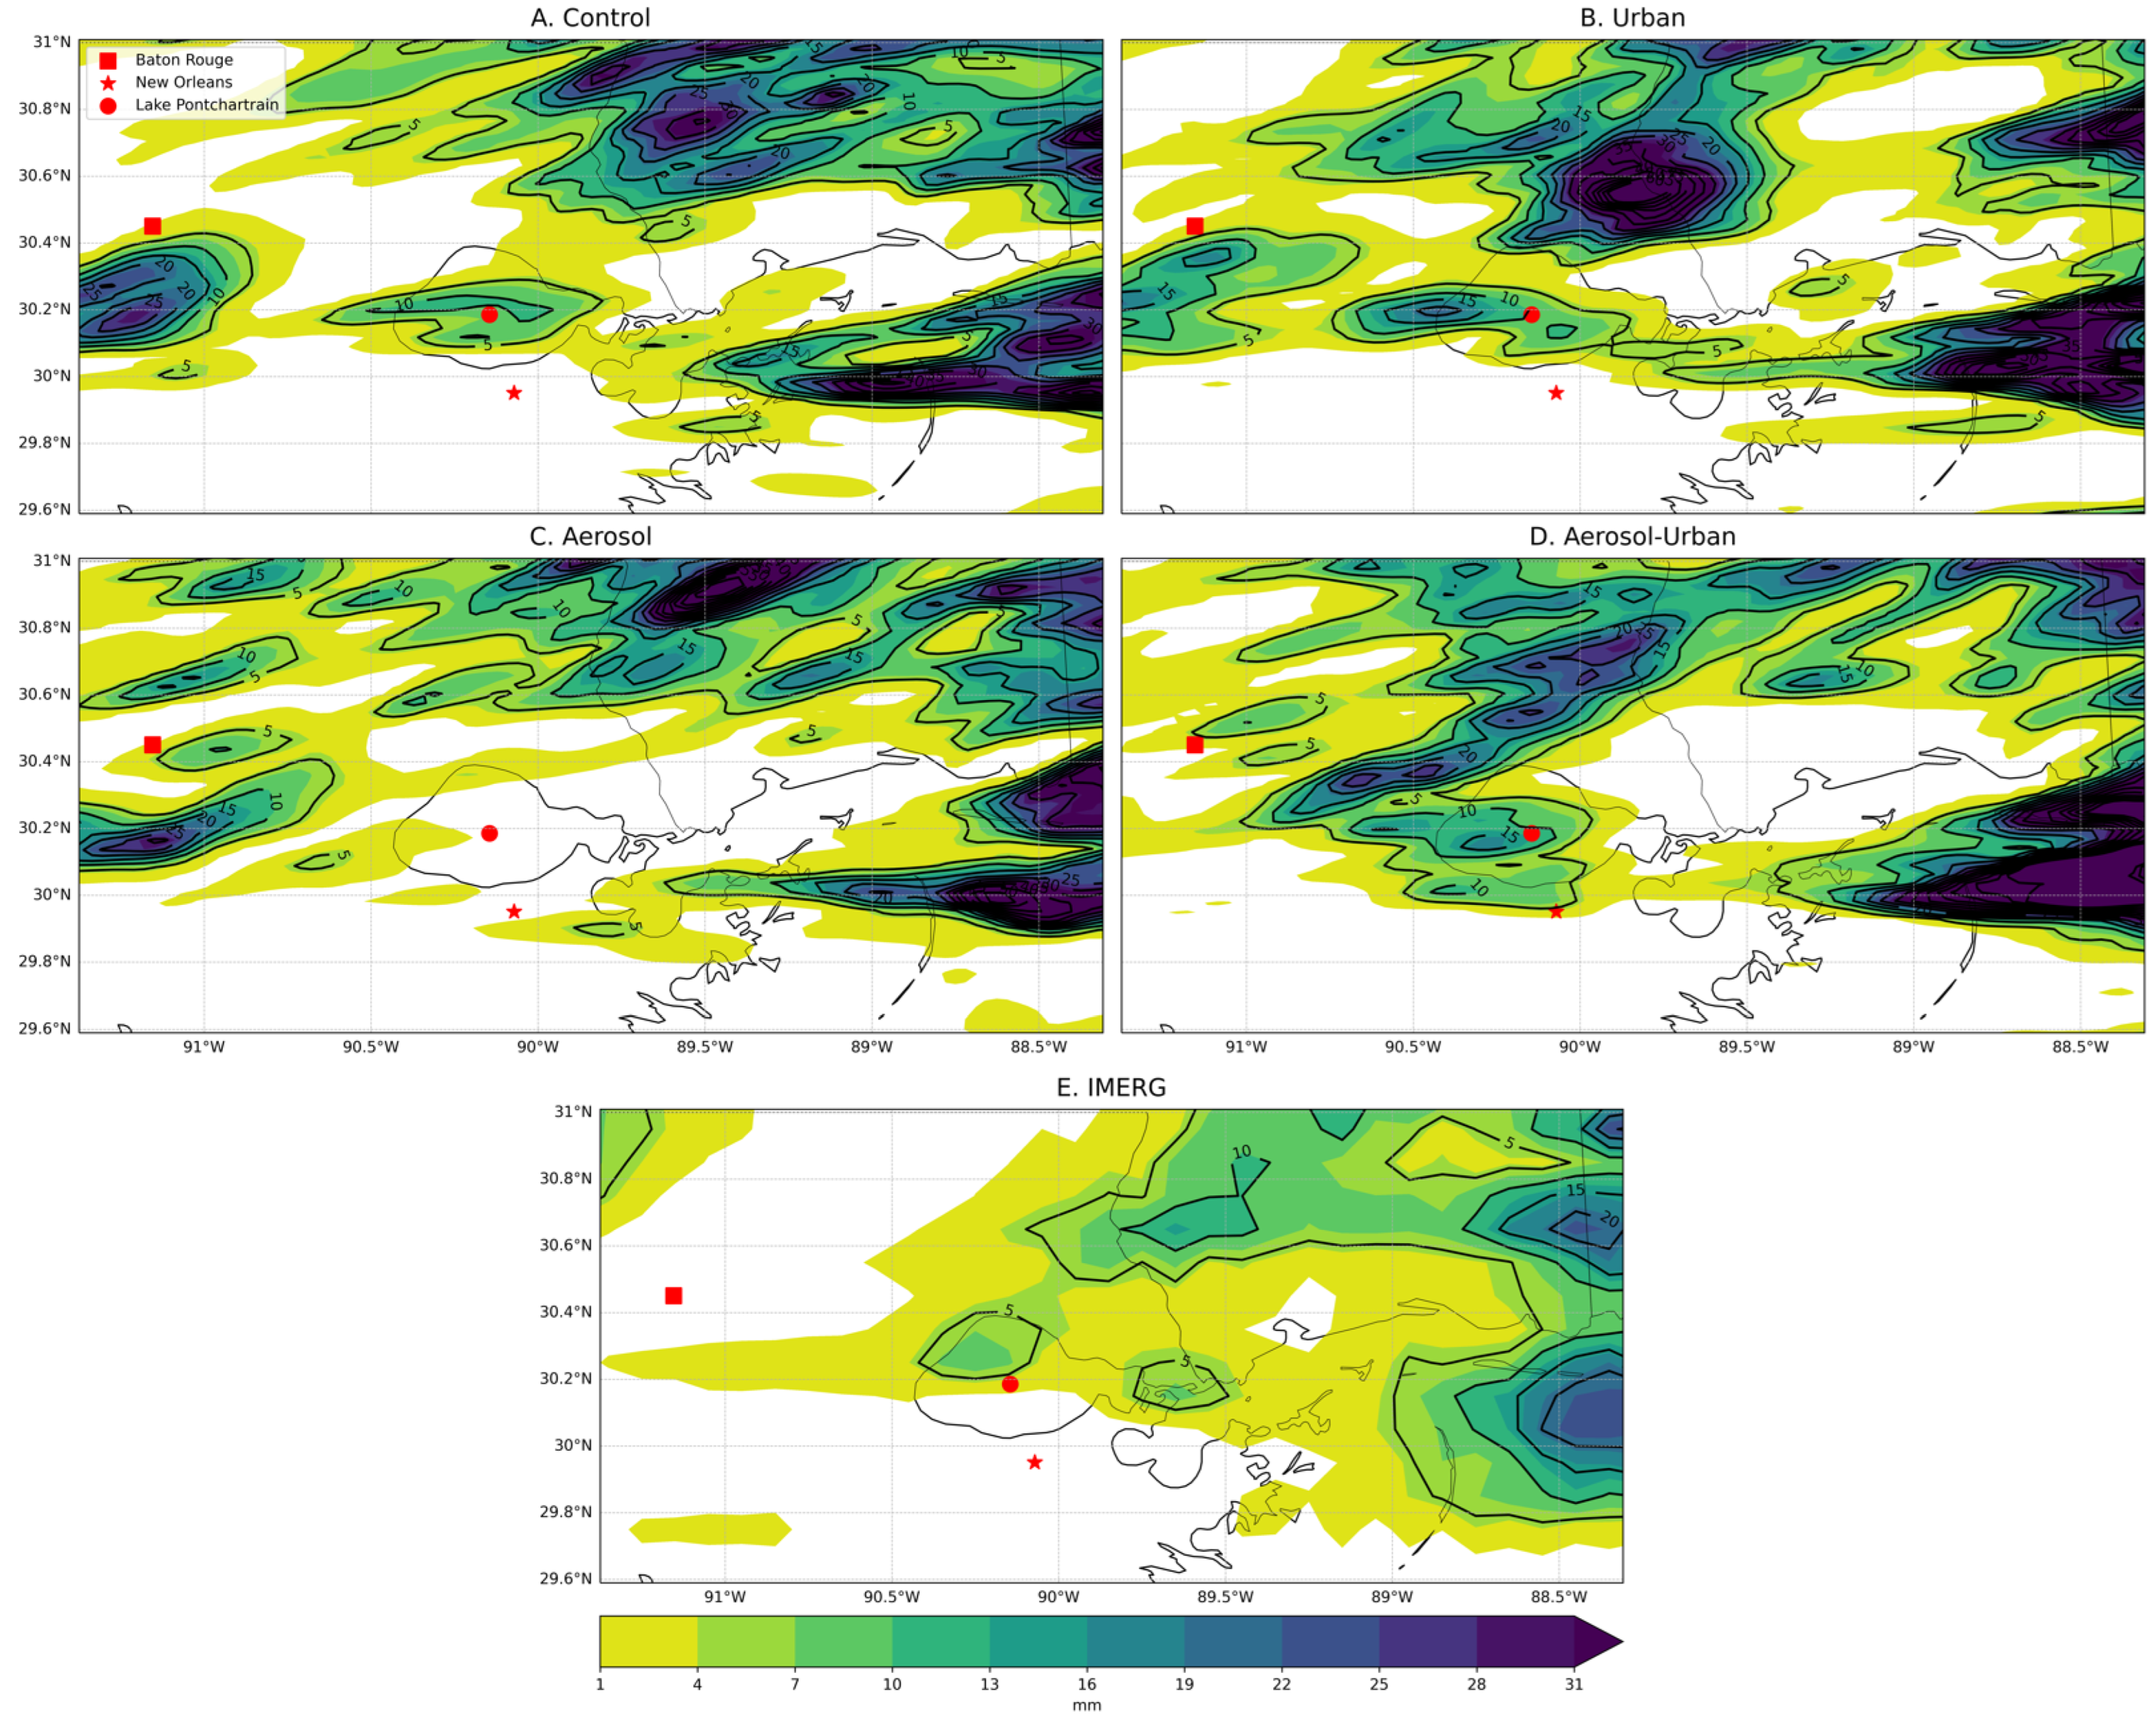
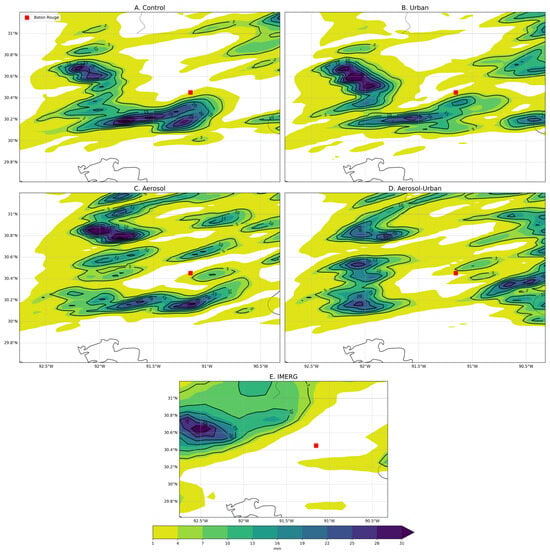
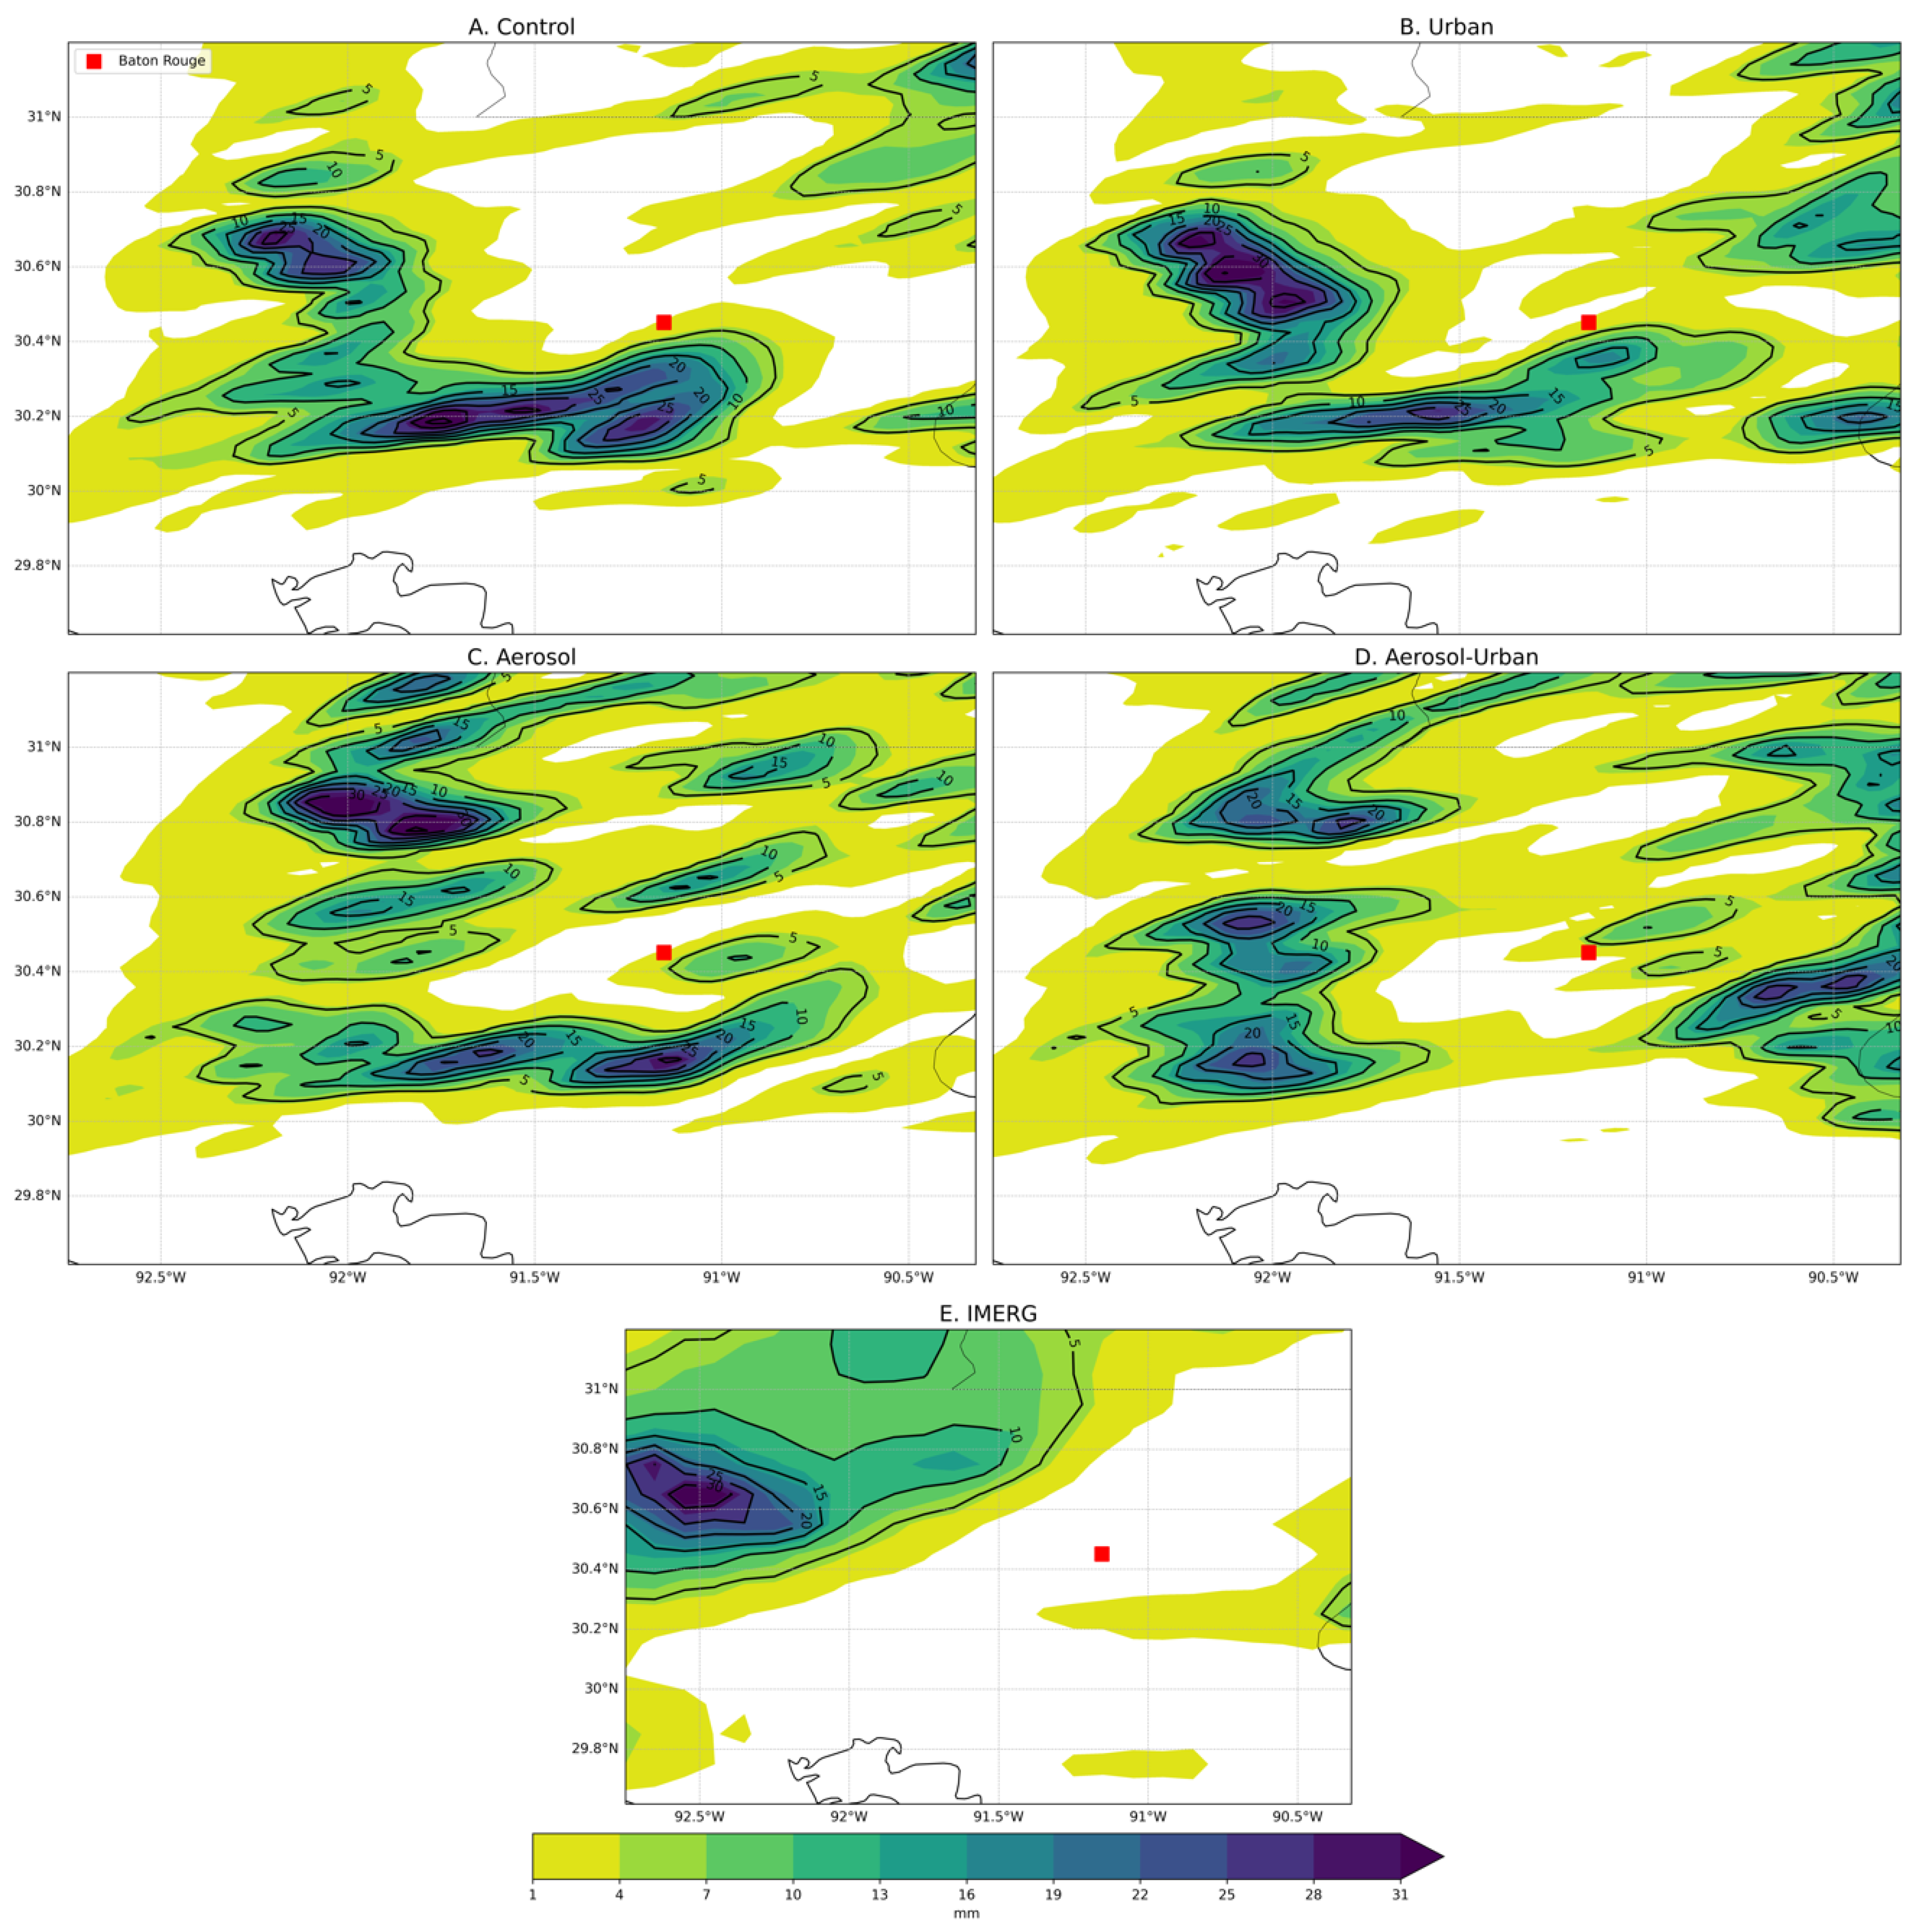
Of the three sub-zones, the Pontchartrain region contained the greatest thunderstorm activity during the case study period. Figure 7 illustrates the accumulated precipitation throughout the Pontchartrain region. Upon visual analysis, the simulations appeared to provide a qualitatively reasonable spatial approximation of thunderstorm rainfall compared to the IMERG accumulated precipitation (Figure 7E), although all simulations exceeded the maximum IMERG precipitation by 14–58 mm. In the control scenario (i.e., aerosol- and urban-effects off), the greatest precipitation was positioned over the northeastern quarter of the study area with a secondary maximum over Lake Pontchartrain (Figure 7A). Including the urban landscape resulted in a spatial pattern that was more similar to the IMERG dataset, but it produced a 72 mm precipitation maximum (Figure 7B). The aerosol-only simulation doubled the northeastern precipitation maximum from 30 mm to >60 mm and did not capture the local maxima over Lake Pontchartrain (Figure 7C). Combined, the urban landscape and aerosol simulation yielded a spatial pattern that was visually similar to the IMERG data, although the magnitude of maximum precipitation remained larger than the IMERG observations by 28 mm (Figure 7D).
Figure 7.
Simulated accumulated precipitation (mm) for the (A) control simulation, (B) urban-only simulation, (C) aerosol-only simulation, and (D) aerosol-urban simulation. (E) IMERG accumulated 30-min precipitation (mm) from 0600 UTC 7 July to 1200 UTC 8 July.
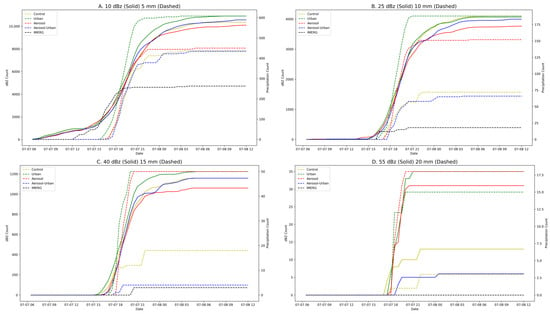
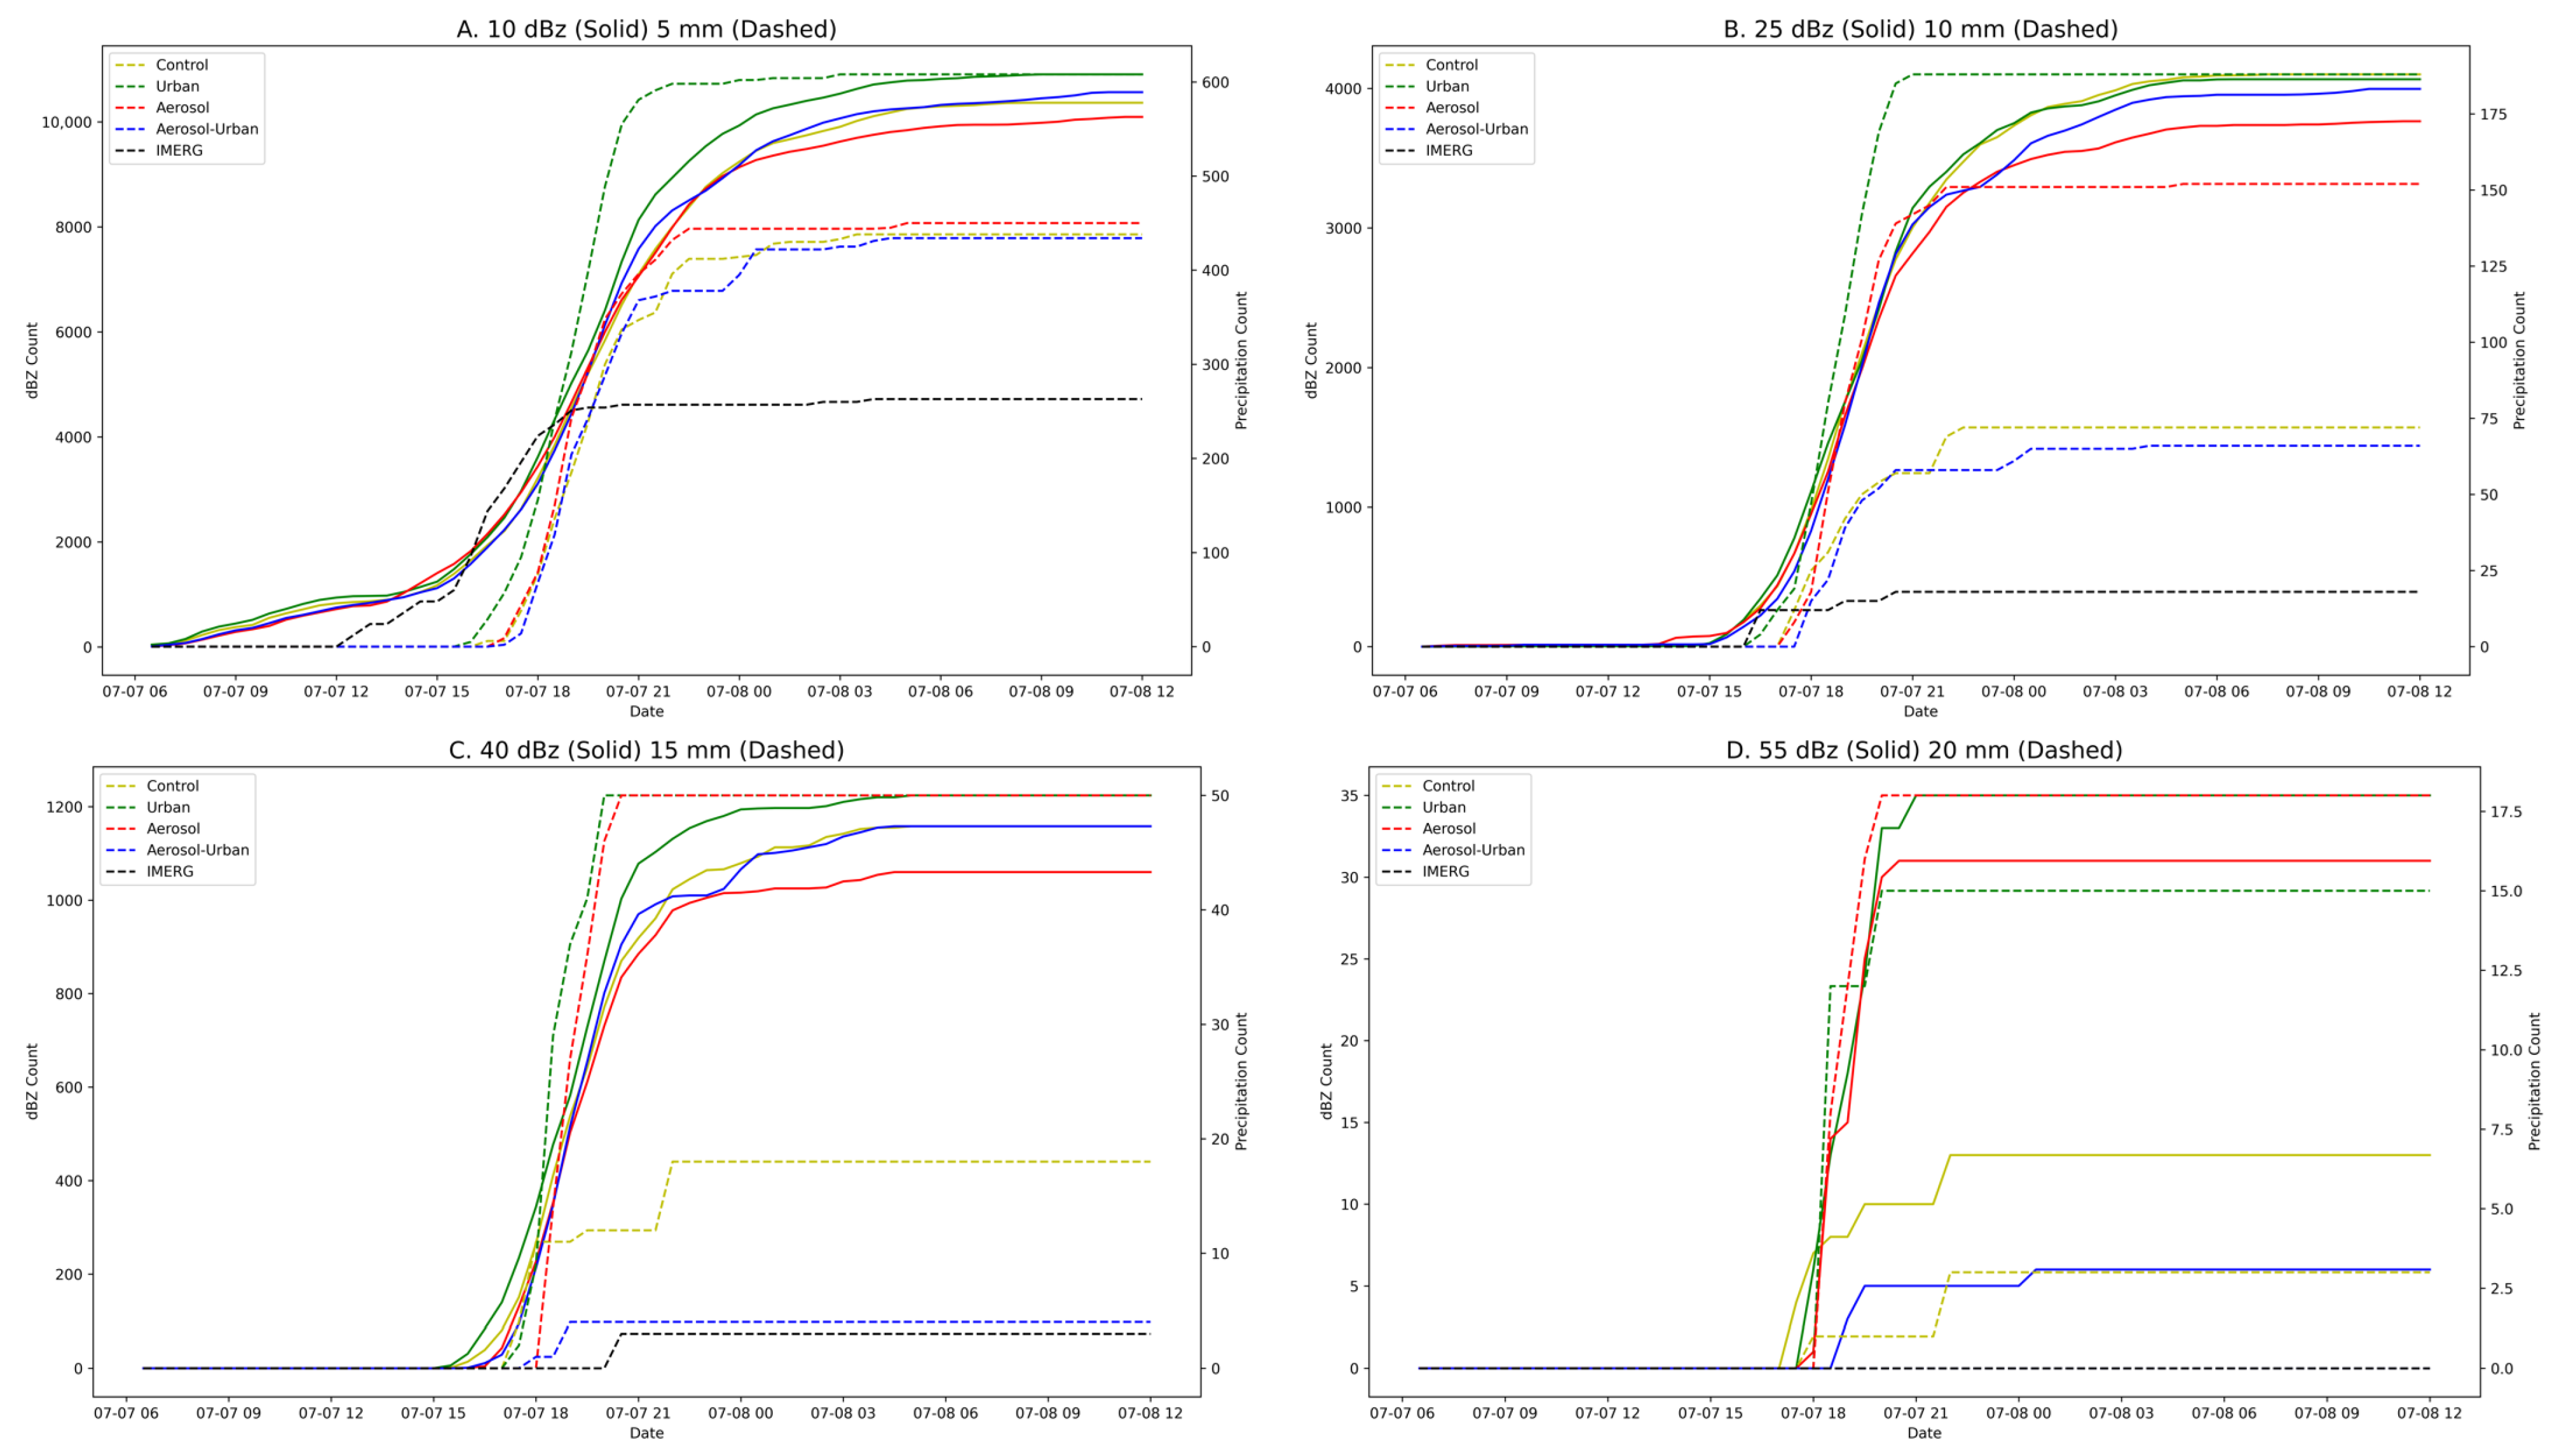
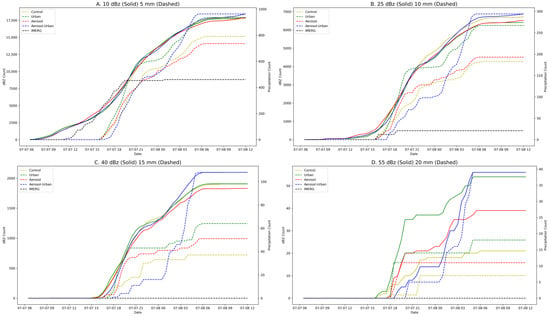
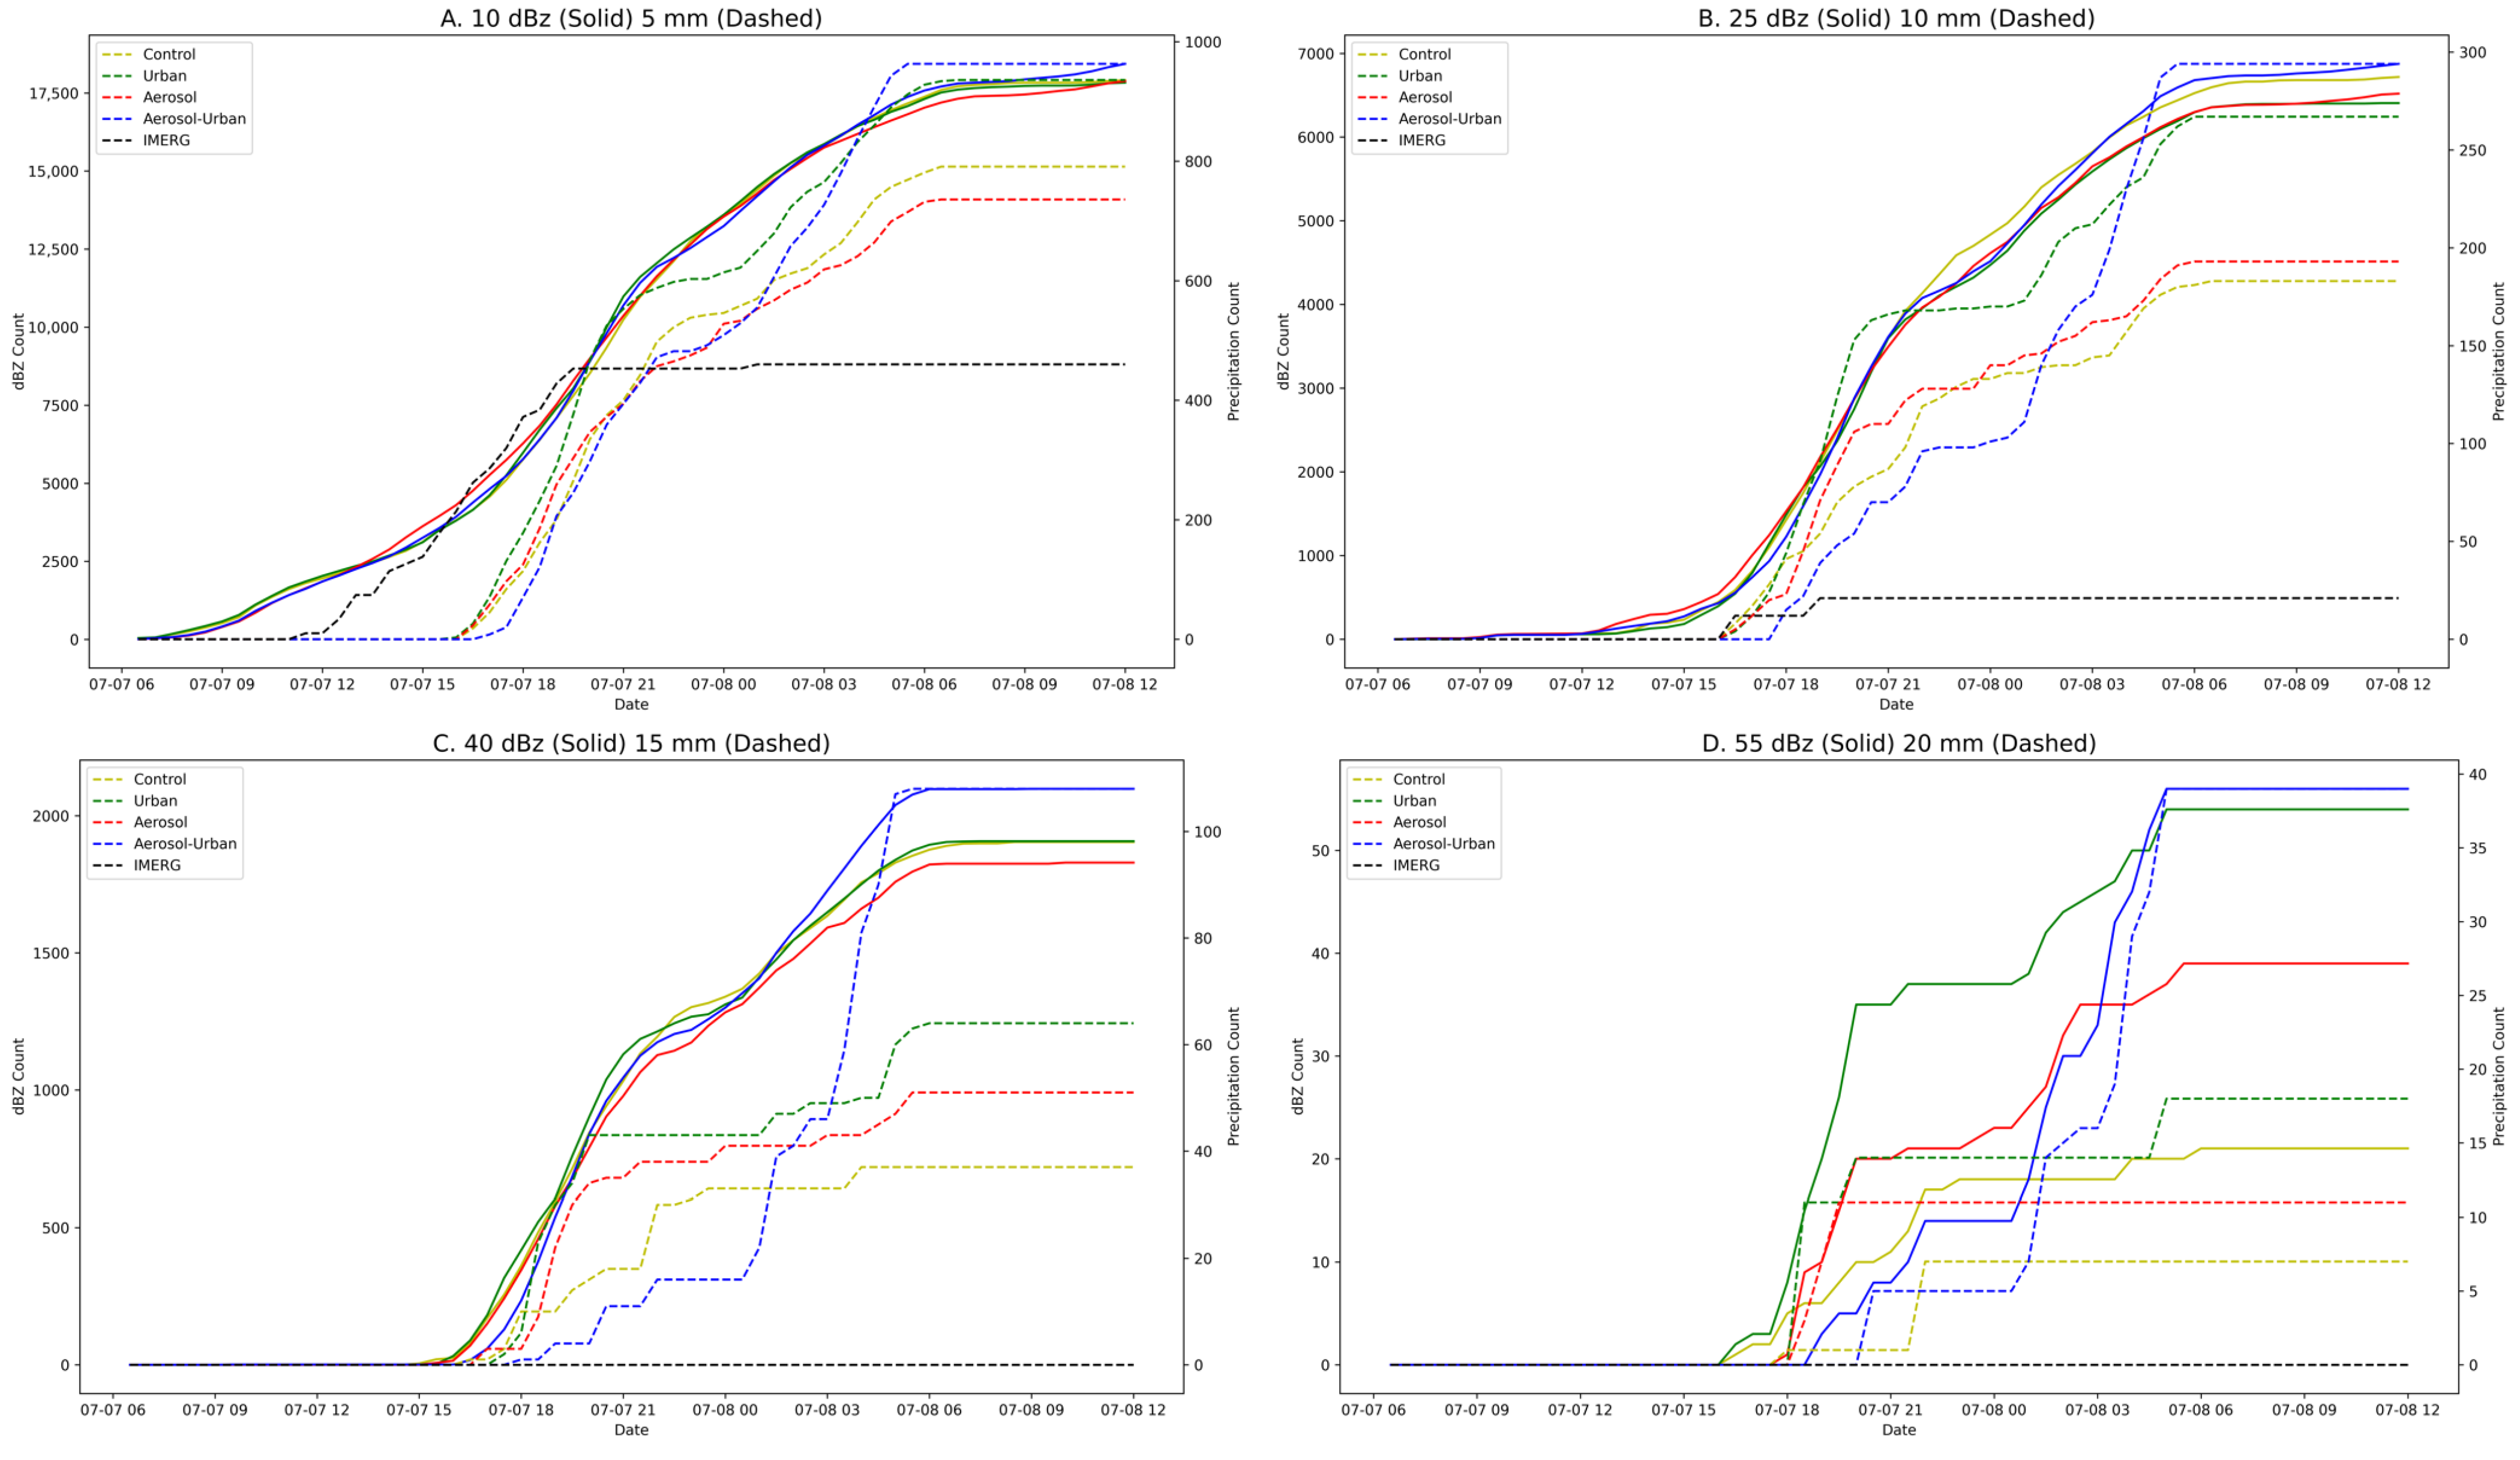
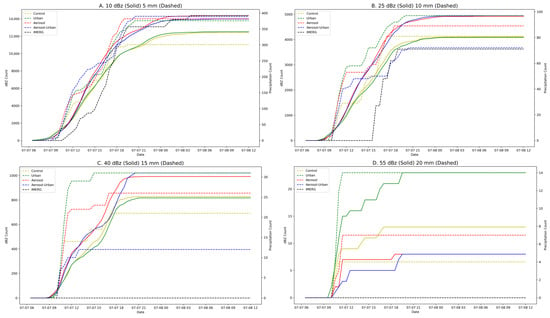
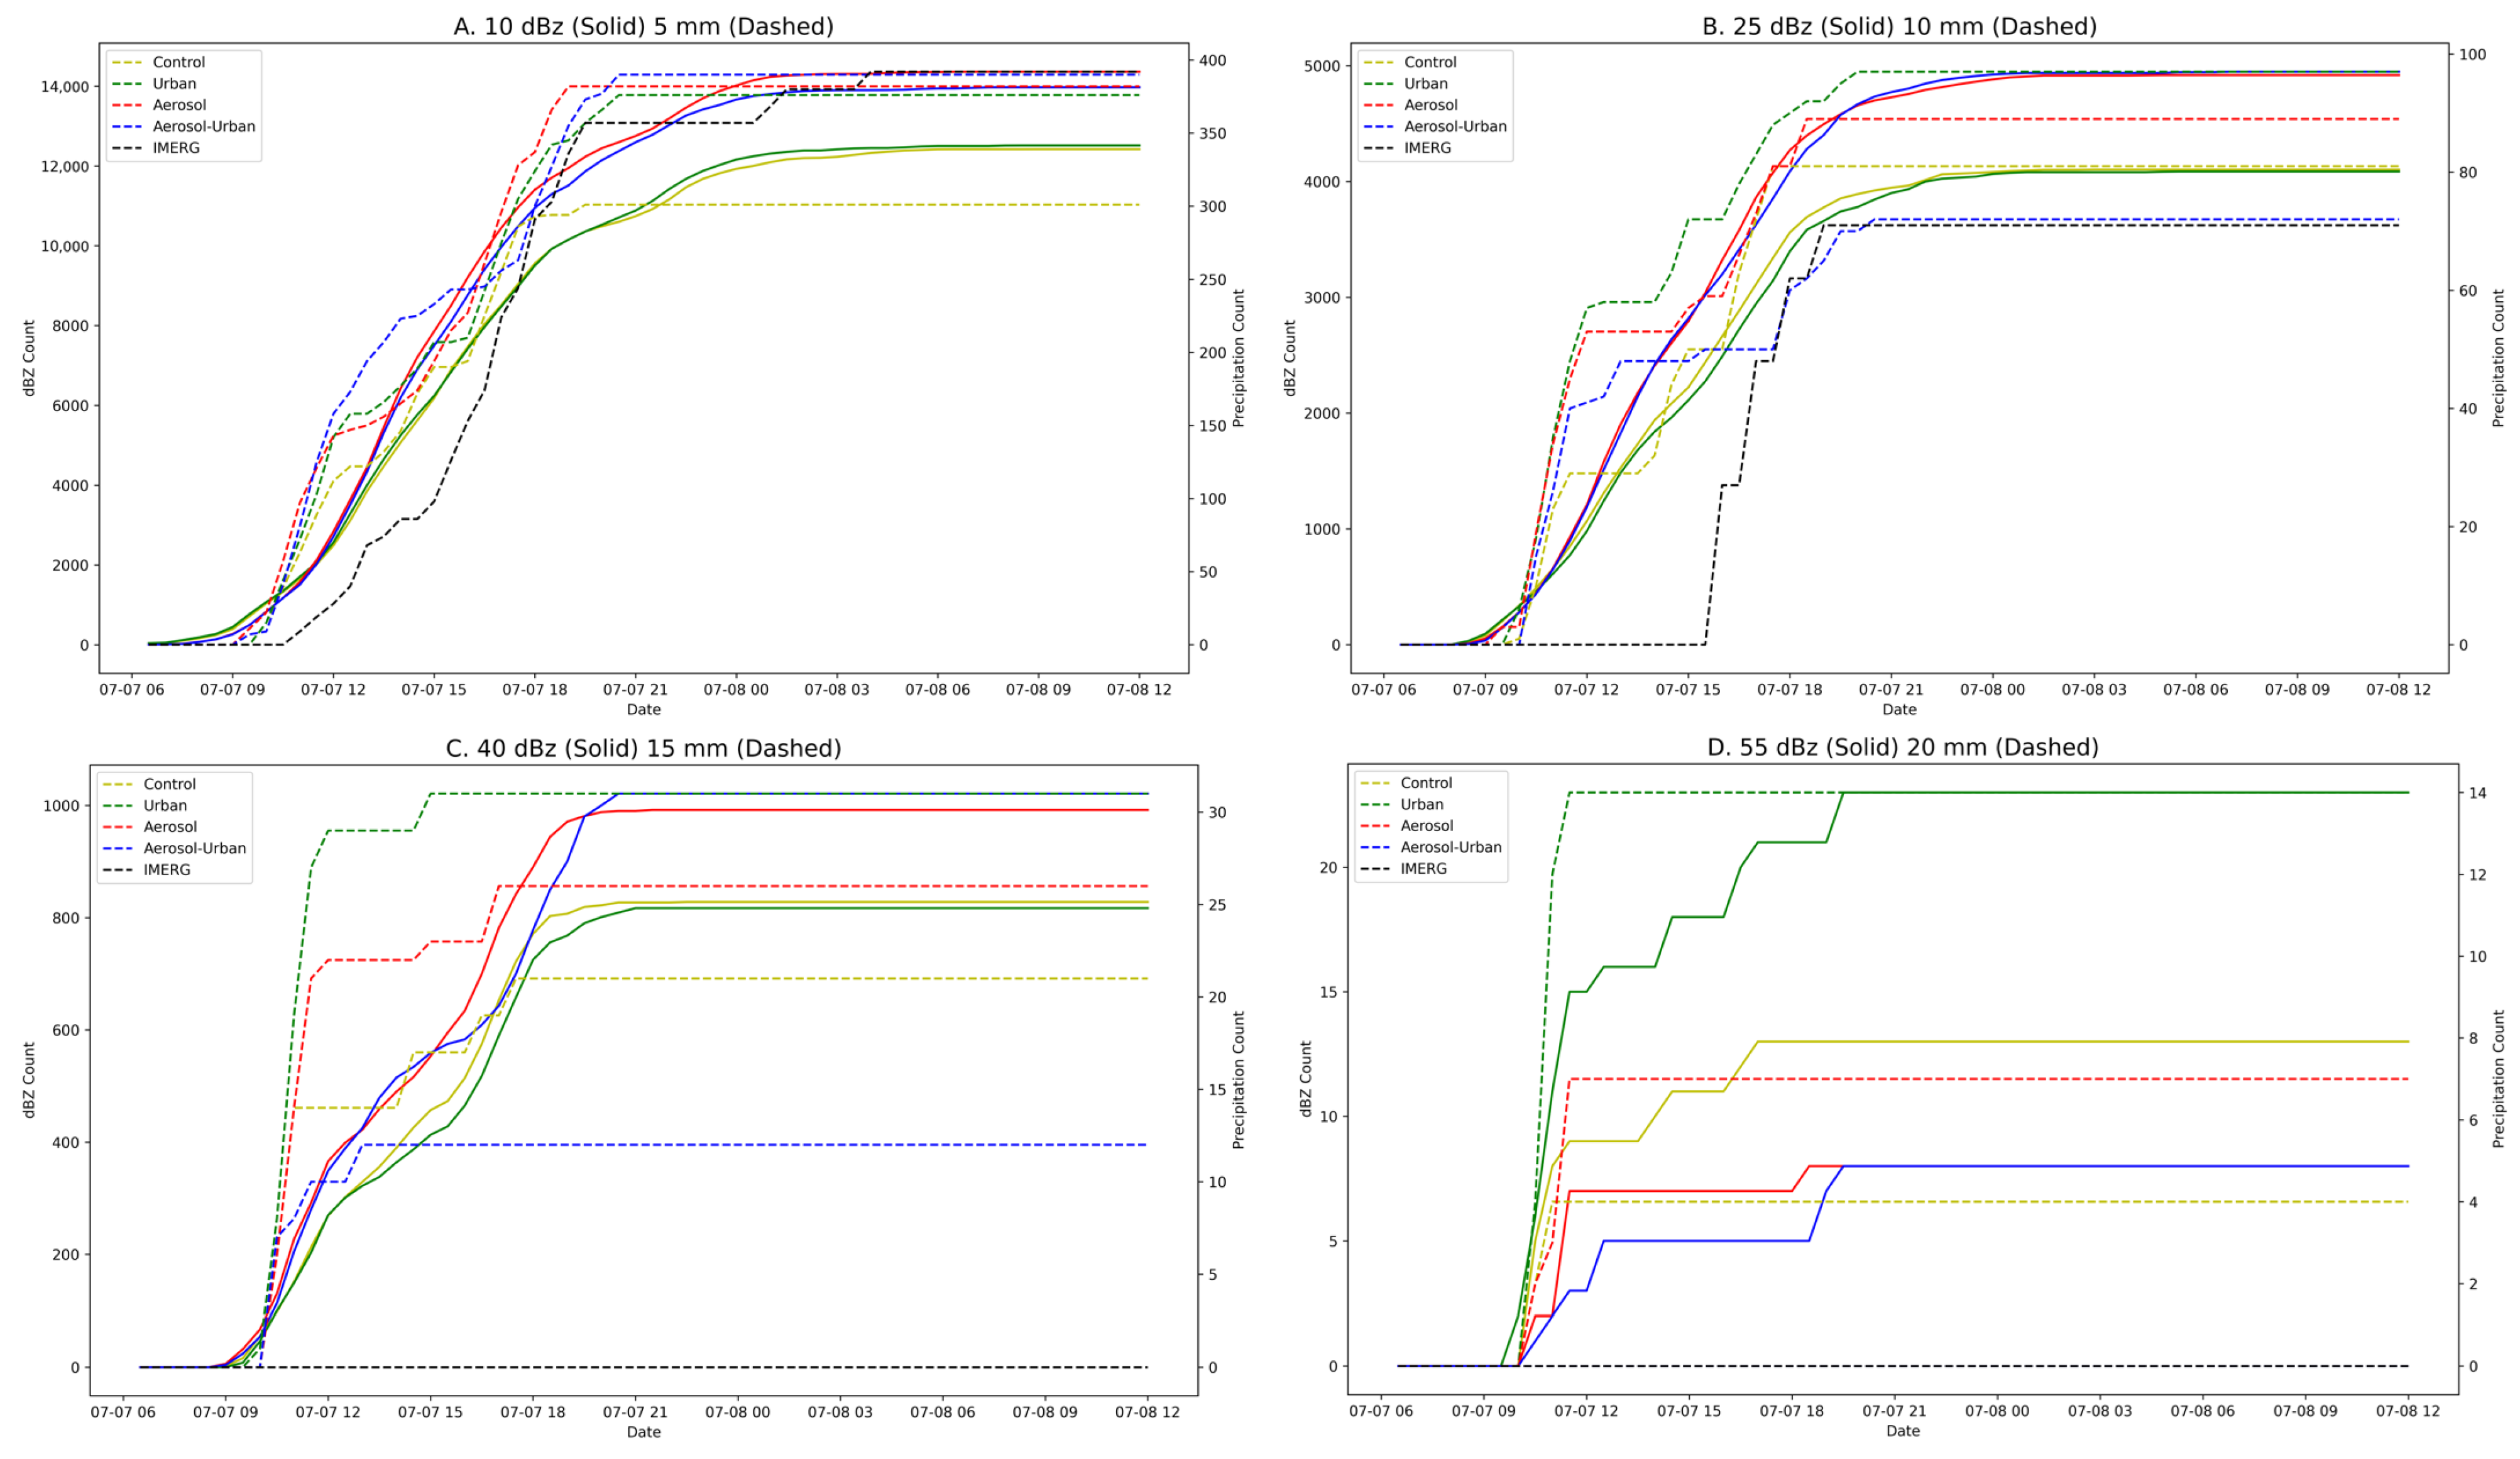
Figure 8 highlights the number of grid cells during each simulation that exhibited values greater than or equal to the provided thresholds for composite reflectivity (solid lines) and precipitation (dashed lines) across the Pontchartrain sub-zone. For the minimum and medium thresholds, the IMERG data detected an earlier precipitation initiation compared to each simulation (Figure 8A,B). At the high and peak thresholds, this initiation became more delayed, such that the IMERG dataset identified a later initiation than the simulations (Figure 8C,D).
Figure 8.
Cumulative composite reflectivity and precipitation grid-cell counts across the simulation time period for the Pontchartrain sub-zone. The solid (dashed) lines indicate grid-cell counts satisfying the specified thresholds for reflectivity (precipitation): (A) 10 dBZ (5 mm), (B) 25 dBZ (10 mm), (C) 40 dBZ (15 mm), and (D) 55 dBZ (20 mm).
Comparing the simulations with one another revealed that the aerosol- and urban-only simulations promoted more widespread precipitation coverage than the others. Except for the peak threshold, total reflectivity coverage area (solid line end-values in Figure 8) exhibited only small variations among the simulations. The simulations also displayed qualitatively similar patterns of reflectivity coverage growth. At the minimum and medium thresholds (Figure 8A,B), the control precipitation initiation timing was similar to the other simulations. Regarding the reflectivity coverage area, Figure 8 illustrates that the control scenario produced relatively moderate totals, particularly for the high threshold.
Compared to the control, including only the urban landscape resulted in greater precipitation and reflectivity coverage at each threshold (Figure 8; green lines). The urban-only scenario also initiated precipitation notably earlier than other simulations for the minimum and medium thresholds (Figure 8A,B; dotted green lines). Relative to the control, the aerosol-only simulation delayed precipitation initiation while increasing precipitation coverage at higher thresholds (Figure 8A–D; dotted red lines). Conversely, the aerosol-only precipitation initiation and subsequent coverage growth began similarly to the control simulation at the minimum and medium thresholds before rapidly scaling beyond the control (Figure 8A,B; dotted red lines). The aerosol-only model exhibited the lowest total reflectivity area coverage for each threshold except the peak threshold, and the initiation was delayed by a half-hour compared to the control at the high and peak thresholds (Figure 8C,D; solid red line). The aerosol-urban simulation eventually aligned with the control total, while the aerosol-only simulation produced less total reflectivity coverage (Figure 8C; solid red line). In Figure 8D, all the experimental simulations featured a delay in simulated reflectivity initiation, but the aerosol-urban simulation exhibited a relatively larger delay. Additionally, the coverage in the aerosol-only simulation initially increased at a slower rate than the urban-only simulation, implying that aerosols during this event may have delayed large-diameter cloud droplet growth.
For the peak threshold, relative to the control, the urban-only and aerosol-only simulations demonstrated increases in final total precipitation coverage (simulated reflectivity coverage) of 400% (169%) and 500% (138%), respectively (Figure 8). If the coupling of aerosols and the urban landscape was linearly additive, then the anticipated aerosol-urban response would be a 900% (307%) increase in precipitation (simulated reflectivity) coverage. However, the aerosol-urban simulation exhibited a decrease of 100% (54%).
Within the Pontchartrain region, the combination of aerosols and the urban landscape reduced the overall total precipitation coverage compared to the other scenarios (Figure 8; dotted blue lines). The combined effects produced a delay in rainfall at the minimum and medium thresholds (Figure 8A,B) and no precipitation at the peak threshold (Figure 8D). Although the combined model still overestimated the precipitation area compared to the IMERG, the values qualitatively aligned more closely at higher thresholds (Figure 8A–D; dotted blue and black lines). For the simulated reflectivity total, the aerosol-urban simulation visually aligned closely with the control at each threshold except the peak threshold (Figure 8A–C), where Figure 8D illustrates that the combined aerosol-urban effects inhibited peak-threshold reflectivity.
3.3. New Orleans Sub-Zone
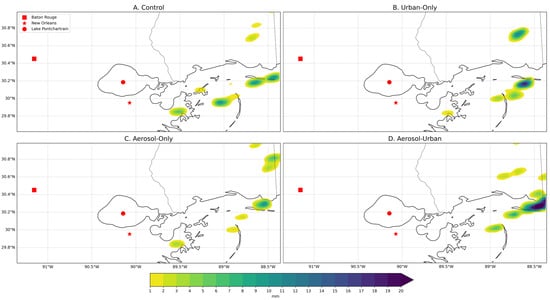
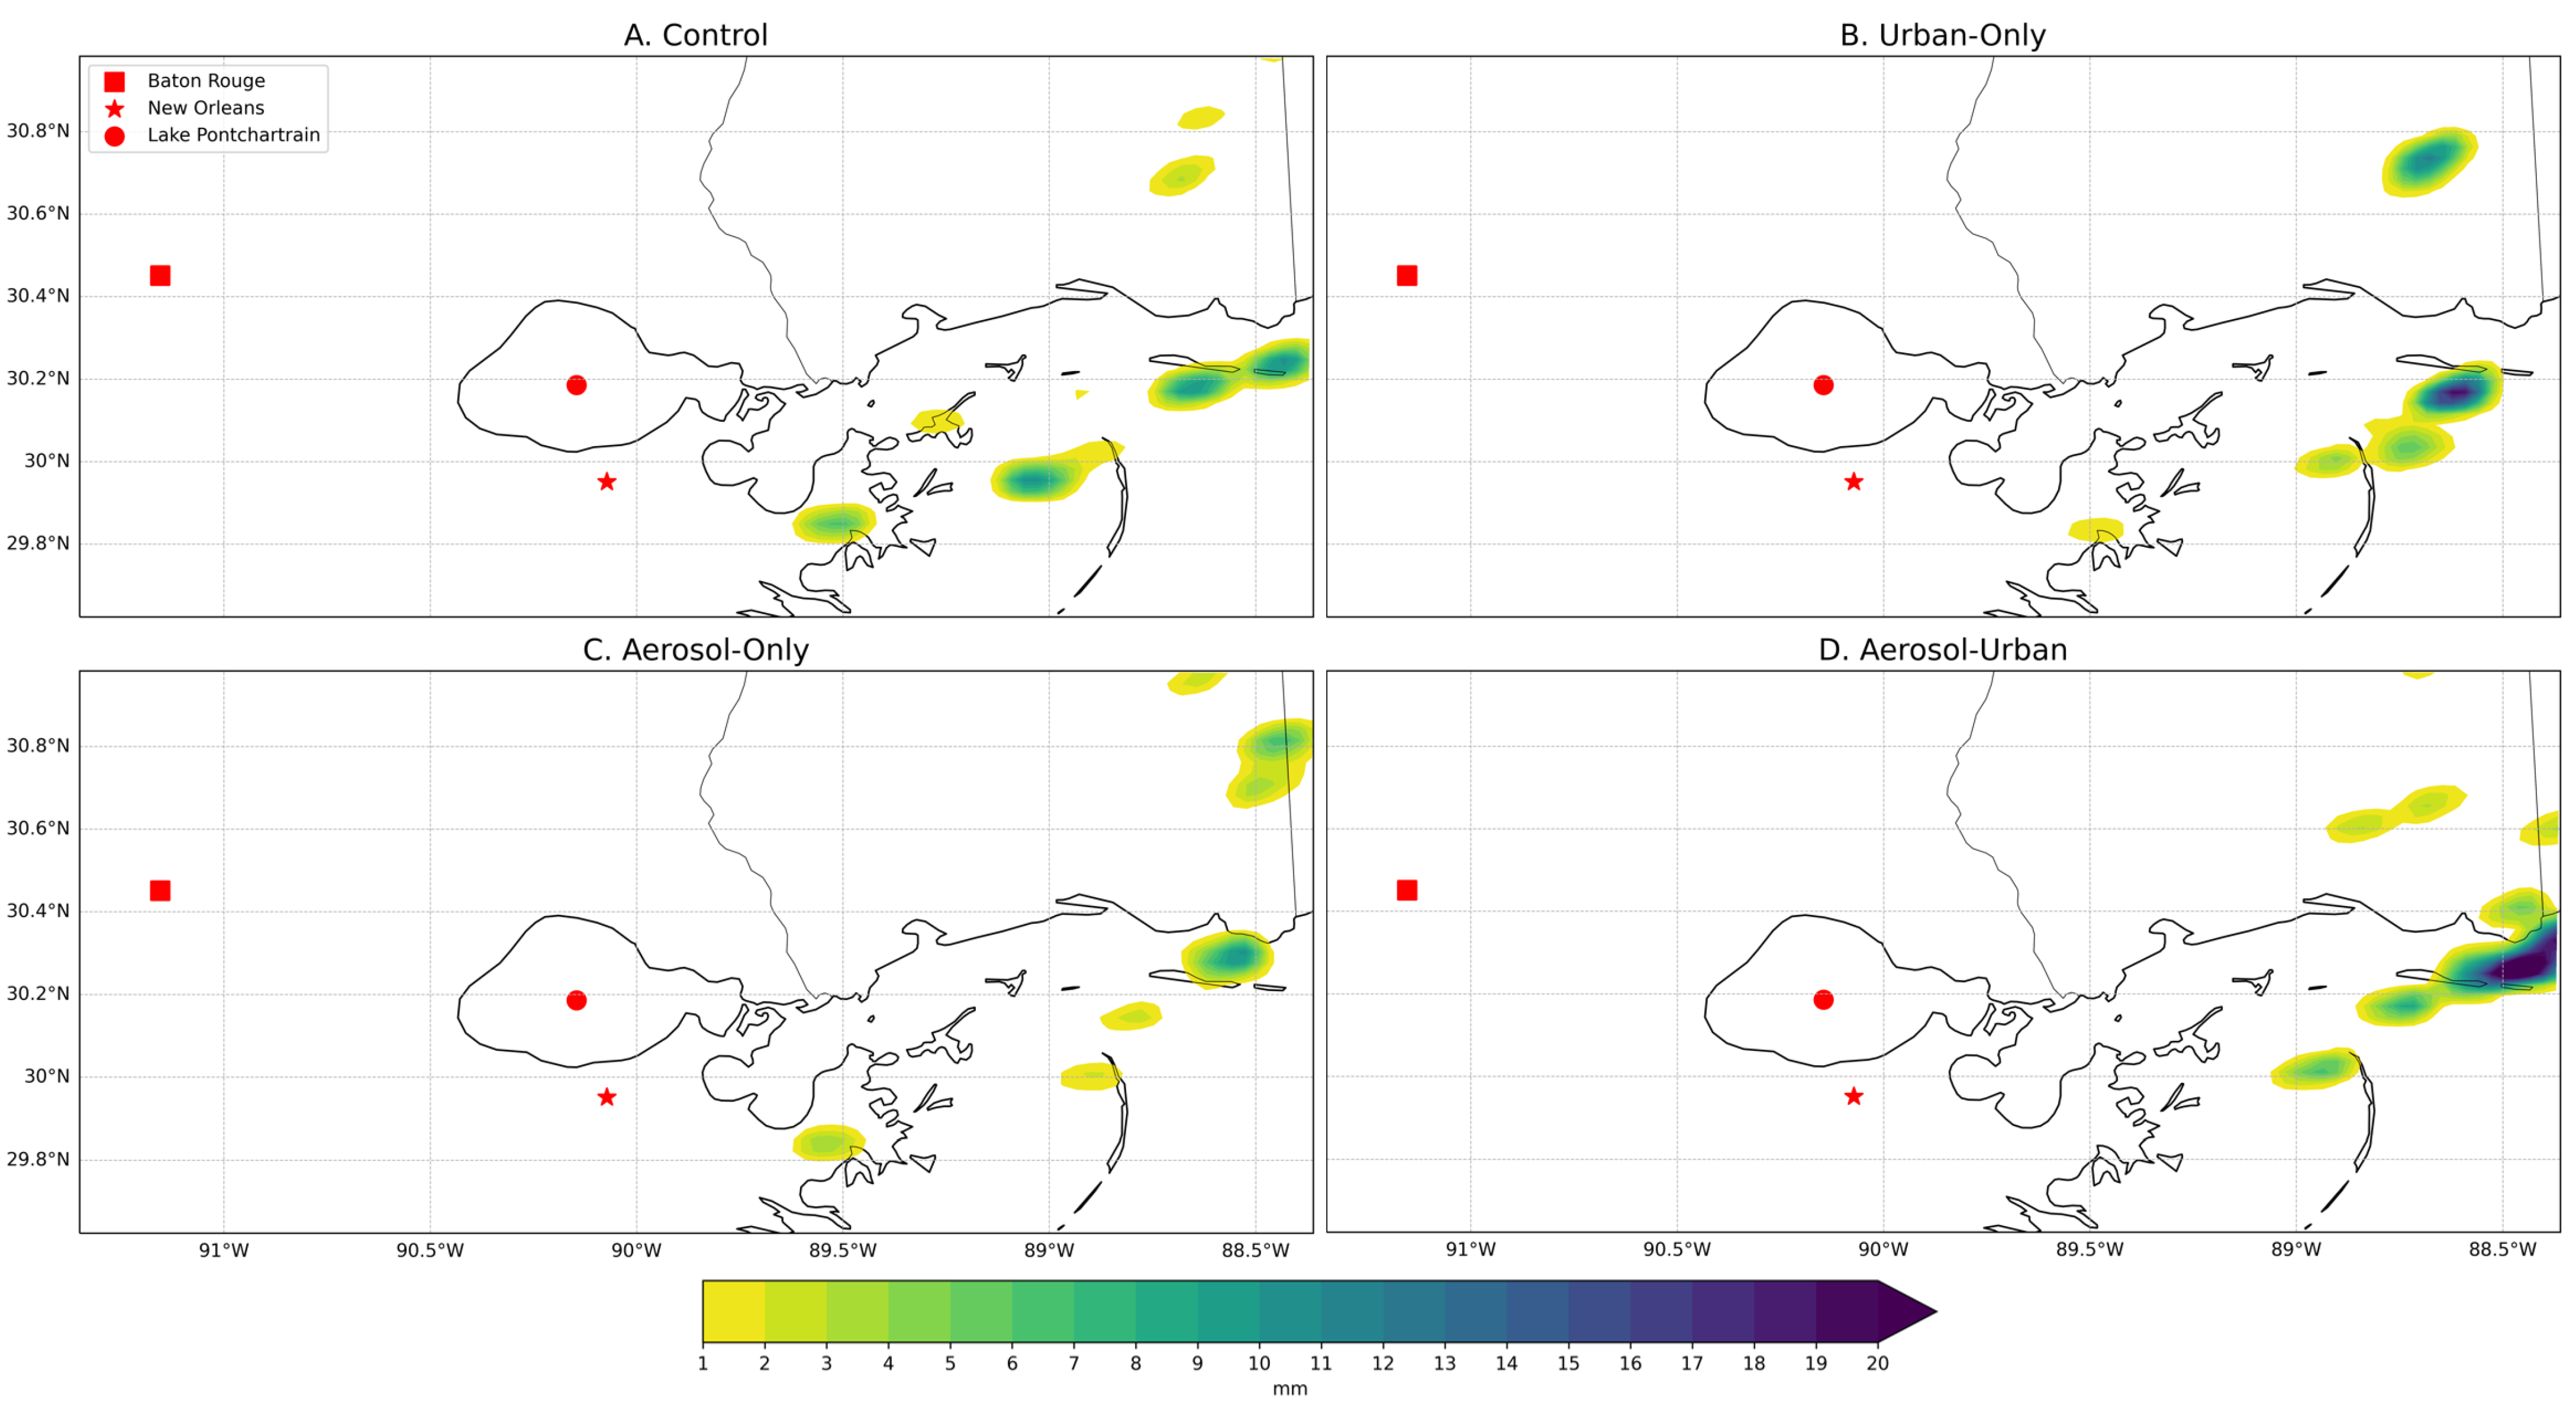
To further analyze the sensitivity of potentially urban-driven rainfall to the modeling scenarios, the New Orleans sub-zone was centered on the large urban complex south of Lake Pontchartrain (Figure 3) and extended eastward to identify any easterly-propagating downstream effects. Figure 9 illustrated that each simulation reasonably resolved the local precipitation maximum estimated in the IMERG dataset downstream of New Orleans (southeastern portion of the sub-zone; Figure 9). While all the simulations overestimated the precipitation within the downstream feature, the accumulated precipitation of the control was the most accurate (48 mm) relative to the IMERG 24 mm maximum (Figure 9A,E). The inclusion of the urban-landscape produced a greater quantity of rainfall, with a 67 mm maximum, while the aerosol-only model resulted in a 58 mm maximum. When both aerosol and urban effects were included, the precipitation maximum increased to 89 mm (Figure 9D).
Figure 9.
Same as Figure 7, except for the New Orleans sub-zone.
The dotted black line in Figure 10 illustrated that the IMERG precipitation started much earlier than the simulations for the low threshold. Across the four simulations, the precipitation began within the same hour (Figure 10A–D), but the coverage area displayed large variations. Similar to the Pontchartrain sub-zone simulated reflectivity thresholds (Figure 8), except for the peak threshold, each simulation’s reflectivity initiation and area coverage growth pattern remained roughly similar for New Orleans (Figure 10).
Figure 10.
Same as Figure 8, except for the New Orleans sub-zone.
Figure 10 highlighted that compared to the control (yellow lines), incorporating the urban landscape (green lines) yielded consistently greater precipitation coverage. For each threshold except the minimum, the control either initialized precipitation coverage slightly ahead of the urban-only simulation (Figure 10C,D; dotted yellow lines) or initially increased coverage more rapidly (Figure 10B) before being outpaced by the urban-only simulation. A similar pattern was visually apparent for the aerosol-only simulation as well (Figure 10B–D; dotted red lines). While the urban landscape produced a rapid increase and a relatively large reflectivity coverage at the peak threshold, it did not cover as wide of a total area as the combined aerosol-urban model (Figure 10D; solid green and blue lines). However, across all thresholds, both urban-on simulations exhibited the highest total precipitation coverages, which implies that simulated reflectivity in this sub-zone was relatively sensitive to the urban landscape, especially at the peak threshold.
The aerosol-only simulation produced a total precipitation and simulated reflectivity coverage area and growth pattern visually similar to the control for most thresholds (Figure 10A–D; red lines). However, much like the peak threshold behavior within the Pontchartrain region (Figure 8D; red and yellow lines), the aerosol-only total reflectivity area exceeded the control (Figure 10D).
In New Orleans, the aerosol-urban scenario produced the highest total precipitation and reflectivity coverage across each threshold (Figure 10; blue lines). Additionally, the combined effects resulted in a delay in precipitation initiation followed by an apparent rapid production between 0100 UTC and 0600 UTC 8 July 2007 (Figure 10A–D). To a smaller degree, a qualitatively similar reflectivity coverage and timing pattern was evident for the lower thresholds for the urban-only simulation (Figure 10A,B; green lines). Figure 11 illustrates the intense precipitation development downstream of New Orleans at 0100 UTC 8 July 2007 corresponding to the rapid precipitation and reflectivity coverage increases in Figure 10. While each simulation resolved the same spatial pattern of precipitation, the urban landscape was associated with greater precipitation quantities. In the eastern New Orleans region, the aerosol-urban and urban-only scenarios produced rainfall maximums of 27.3 mm and 19.7 mm, while the other two scenarios displayed a maximum of 10.5 mm (Figure 11).
Figure 11.
Accumulated precipitation (mm) between 8 July 0100 UTC and 8 July 0115 UTC for the (A) control simulation, (B) urban-only simulation, (C) aerosol-only simulation, and (D) aerosol-urban simulation.
Unlike the Pontchartrain region, the New Orleans sub-zone aerosol-urban simulation did not decrease precipitation and radar reflectivity coverage at the peak threshold (Figure 10D). Relative to the control simulation, the urban-only and aerosol-only simulations respectively resulted in 157% (157%) and 57% (85%) increases in final total precipitation (simulated reflectivity) coverage. If the aerosol and urban effects were linearly additive, then the aerosol-urban simulation would display an increase of 214% (242%). However, the aerosol-urban simulation actually produced a 457% (167%) increase, surpassing a purely linear coupling for total precipitation coverage.
3.4. Aerosol-Concentrated Sub-Zone
Visual examination of the spatial patterns of accumulated precipitation (Figure 12) suggests that the simulations all performed moderately well, with the aerosol-urban model displaying a better qualitative spatial agreement with the IMERG dataset. Within the simulations, the greatest precipitation concentration was resolved in the northwest and central area of the region, but further east than the 34 mm IMERG maximum. The simulated maximum precipitation values ranged from 27.5 mm in the aerosol-urban scenario (Figure 12D) to 36.8 mm in the control model (Figure 12A).
Figure 12.
Same as Figure 7, except for the aerosol-concentrated sub-zone.
Comparing the precipitation coverage to the IMERG dataset in Figure 13A,B (black lines) revealed qualitatively reasonable alignment in terms of overall coverage at the minimum and medium thresholds, but the simulations initiated precipitation earlier than the IMERG estimates. Additionally, each simulation continued to over-represent the areal extent of rainfall at the higher thresholds (Figure 13C,D).
Figure 13.
Same as Figure 8, except for the aerosol-concentrated sub-zone.
Across the simulations, there were minimal differences in initiation when considering both precipitation and composite reflectivity (Figure 13). Total precipitation coverage exhibited a trend similar to the Pontchartrain region (Figure 8; dotted lines), with the aerosol- and urban-only simulations consistently producing a wider area of precipitation than the control as thresholds increased. In contrast, the combined simulation reduced rainfall in an apparently nonlinear fashion (Figure 13; dotted blue lines).
Including only the urban landscape highlighted the degree to which land cover influenced peak threshold precipitation and reflectivity coverage even in an area with relatively few urban grid cells. All reflectivity thresholds except the peak threshold illustrated that the urban-only and control simulations increased and reached their maximum totals at similar rates; both were slower than the aerosol-on simulations (Figure 13A–C; solid yellow and green lines). The notable grouping implies that the urban landscape had little impact on simulated reflectivity until the peak threshold. While there was minimal precipitation difference between the urban-only and the other experimental simulations at the minimum threshold (Figure 13A; dotted green lines), as the thresholds increased, so did the precipitation disparity between simulations (Figure 13B–D). Similarly, due to those few urban grid cells, the timing of reflectivity development and the areal growth in the urban-only scenario closely aligned with the control for all but the peak threshold. For the aerosol-only simulation, the total precipitation coverage surpassed the control at each threshold and displayed similar quantities and timing to the urban-only simulation at the minimum and moderate thresholds (Figure 13A,B; dotted red lines). For the peak threshold, the aerosol-only simulation reflectivity coverage decreased compared to the control (Figure 13D; solid red lines).
Including both aerosols and the urban landscape resulted in greater precipitation coverage at the minimum threshold but a reduction at higher thresholds, including no precipitation satisfying the peak threshold (Figure 13A–D; dotted blue lines). This was consistent with the IMERG observations, although the aerosol-urban model continued to produce precipitation at the high threshold (Figure 13C). Reflectivity coverage also exhibited a decline at the peak threshold similar to the aerosol-only simulation (Figure 13D; solid blue line).
Compared to the control, the urban-only simulation demonstrated a peak threshold increase in final total precipitation (simulated reflectivity) coverage of 250% (77%) (Figure 13). Similar to the other two sub-zones, the aerosol-only simulation produced a final total precipitation coverage that was 75% greater than the control. Whereas the other sub-zones exhibited an increase in simulated reflectivity coverage, within the aerosol-concentrated region, the aerosol-only simulation actually displayed a 38% decrease compared to the control. In a linearly additive scenario, the aerosol-urban simulation would be expected to produce increases of 325% (37%) relative to the control. This contrasts with the 38% decrease in simulated reflectivity and the total lack of peak-threshold rainfall coverage in the aerosol-urban model, which highlights the potential for complex nonlinear interactions.
4. Discussion
Comparing the four simulations highlighted the nonlinear interactions of the atmospheric chemistry and urban land cover, but it also demonstrated the consistent influence of the broader atmospheric conditions. The timing of precipitation and thunderstorm development displayed relatively minimal differences between the simulations. However, total precipitation and reflectivity coverage exhibited more significant differences, suggesting, in this case, that the larger-scale atmospheric conditions influenced event timing but, once initiated, the more subtle influences of aerosol and urban effects modulated precipitation and reflectivity generation [18,91,92]. Importantly, all the scenarios were consistent regarding the Tmax and Tmin temperature error analysis (Table 2), indicating that NU-WRF strongly grasped the synoptic weather regime within which the precipitation developed, while the precipitation error analysis displayed much more variation (Table 2). This suggests that while the large-scale weather regime is insensitive to aerosol and urban effects, the evolution of convective precipitation is more readily modulated by these secondary and tertiary influences.
Although the broad-scale evolution of the event was qualitatively similar across each simulation, there were distinct variations related to atmospheric chemistry and the urban landscape. For nearly every region and threshold, the aerosol- and urban-only scenarios consistently exhibited precipitation coverage surpassing the control (Figure 8, Figure 10 and Figure 13; dotted red and green lines). For the peak thresholds, the aerosol-only simulations surpassing the control for total simulated reflectivity (Figure 8D and Figure 10D; solid red lines) and total precipitation coverage (Figure 8D, Figure 10D and Figure 13D; dotted red lines) conceptually aligns with several previous studies, which have found that aerosols can invigorate cold-rain processes by initially suppressing droplet growth and enhancing latent-heat release and riming through greater droplet quantities [93,94,95].
A similar study conducted by Blagina & Dementyeva [96] utilized WRF to examine the influence of smoke aerosols from wildfires on convective cloud processes and electrification. They found that the inclusion of aerosols shifted peak convective timing to later in the day and reduced thunderstorm volume compared to the no-aerosol control. Comparatively, this case study of coastal Louisiana found that aerosols alone resulted in a delay in convective initiation at the highest threshold (55 dBZ; Figure 8D, Figure 10D and Figure 13D), but this was not necessarily indicative of a delay in the peak convective timing. In the aerosol-concentrated sub-zone, the aerosol-only simulation exhibited a decrease in simulated reflectivity coverage relative to the control simulation for the highest threshold (Figure 13D), which conceptually aligns with the reduced thunderstorm volume identified in Blagina & Dementyeva [96]. However, for the other two sub-zones, the aerosol-only simulation produced an enhanced areal extent at the peak radar reflectivity threshold compared to the control (Figure 8D and Figure 10D). For the aerosol-concentrated region, at each threshold above the minimum (Figure 13B–D), the urban-only precipitation surpassed both aerosol-on scenarios. Compared with other regions, the high aerosol concentrations at initialization served as additional CCN. The aerosols can enhance low-diameter cloud-droplet formation; however, the multitude of smaller droplets inhibits further growth. As radar reflectivity is proportional to diameter [97], resolving greater low-reflectivity coverage and less high-reflectivity coverage in the aerosol-on scenarios conceptually aligns with existing aerosol-based rainfall suppression studies [66,98,99,100,101].
Meanwhile, the New Orleans sub-zone, characterized by expansive urban land cover, exhibited greater areal precipitation and reflectivity coverage as a result of urban-related effects. For example, Figure 10C,D illustrated that the urban-only precipitation coverage exceeded the aerosol-only scenario. This was not true for the Pontchartrain region (Figure 8C,D), which was characterized by less pervasive urban land cover. In the Pontchartrain region, the aerosol-only scenario, at higher thresholds of precipitation, displayed greater coverage than the urban-only scenario (Figure 8C,D).
Additionally, in the New Orleans sub-zone, the aerosol-urban scenario surpassed every simulation in terms of both reflectivity and precipitation coverage, which contrasted with the results from the other two sub-zones (Figure 8, Figure 10 and Figure 13). The Pontchartrain and aerosol-concentrated regions displayed reduced high and peak threshold precipitation in the aerosol-urban scenario (Figure 8C,D and Figure 13C,D). The discrepancy in the aerosol-urban simulation between New Orleans and the other two regions might be attributable to a nonlinear interaction between aerosols and the urban landscape. In the New Orleans area, which was characterized by heavily urbanized landscapes, the aerosols greatly enhanced not only the lower-threshold precipitation and reflectivity coverage but also the peak threshold (Figure 10). This interaction may have also been facilitated by additional moisture east of New Orleans from the Gulf. Figure 9 and Figure 11 illustrated the greater precipitation maxima of both urban-on simulations east of New Orleans and downstream of the weak boundary stretched across the study area. The increased moisture from the Gulf could be responsible for the local maxima present in all scenarios and the satellite estimate (Figure 9), while the enhanced surface convective heating and mechanical lift related to the UHI and URE could explain why both urban-on simulations outpaced the other scenarios (Figure 10 and Figure 11).
Qualitatively, each of the four simulations reasonably reproduced the observed spatial pattern of the convective precipitation, although they tended to overproduce rainfall compared to satellite-based estimates. This moisture bias may have resulted from simulation parameterizations. Other studies have shown that the combination of the Purdue Lin microphysics scheme and the Yonsei University planetary boundary layer scheme can lead to localized precipitation overestimates [102,103]. Conversely, it is also possible that the remotely sensed IMERG data might have underestimated the precipitation totals to some extent [104,105,106].
Although there was a discrepancy between the modeled and observed precipitation, the aerosol-urban simulation exhibited less precipitation coverage than the other simulations for two of the three regions (Figure 8 and Figure 13). Combining the two experimental variables (i.e., the aerosol-urban scenario) largely suppressed higher-threshold precipitation and reflectivity coverage (Figure 8C,D and Figure 13C,D). The control, aerosol-only, and urban-only simulations consistently overestimated precipitation, while qualitative, visual analysis indicated that the aerosol-urban simulation most closely resembled the IMERG precipitation coverage across the regions. For example, in the Pontchartrain sub-zone, the aerosol-urban areal coverage for the high-precipitation threshold (Figure 8C; blue line) aligned closely with the IMERG values (black line), and neither produced sufficient precipitation to meet the peak threshold (Figure 8D). Similarly, for the aerosol-concentrated sub-zone, the aerosol-urban precipitation coverage visually aligned more closely with the IMERG estimates for all but the high threshold (Figure 13).
Despite the capability of numerical weather models to disentangle the influences of the urban landscape and aerosols on rainfall, this case study was constrained by several limitations. First, the conclusions may not be broadly applicable due to the constraints related to the case selection. As discussed within Section 2, this event was chosen due to the combination of a CALIPSO overpass with a frontal system triggering thunderstorms. This created a unique opportunity to examine various influences on rainfall, but it was hindered by the limited data available in the year that the event occurred. As a result, a major limitation of the study was the choice of EDGAR-HTAP v2.2 2010 anthropogenic emissions. While point source locations may remain largely static, resulting in reasonable spatial comparisons (Table S1), emission quantities are different between the years. This discrepancy likely altered aerosol levels within the simulations, in turn, influencing CCN competition and radiation feedbacks. Similarly, the absence of sea salt aerosols (SSA) within the models excluded an important source of coastal CCN. Studies examining the influence of SSAs and anthropogenic aerosols on precipitation have found that within a polluted coastal environment, raindrop growth for smaller anthropogenic particles is suppressed through CCN competition, and the larger SSAs display enhanced droplet growth and greater overall precipitation [107,108,109]. However, Han et al. [109] concluded that the precipitation response depends on the meteorological environment, aerosol background, and synoptic forcing strength. Within the context of this study, including SSAs may have reduced the lower threshold precipitation and reflectivity coverages while enhancing the higher thresholds.
5. Conclusions
This case study performed four simulations of a summertime frontal precipitation event in South Louisiana to examine the sensitivity of the local convective thunderstorms to the urban landscape and aerosols. The analysis included an examination of three sub-zones distinguished by varying magnitudes of urban land cover and aerosol concentrations. Aerosol and urban land cover simulations individually overproduced precipitation relative to the control simulation in which no such effects were included. Combined, however, aerosol- and urban-related effects formed a nonlinear interaction that often reduced precipitation coverage compared to the single-effect scenarios, except within the heavily urbanized, coastal New Orleans region. While each simulation was sensitive to the urban landscape and atmospheric chemistry at local scales, the broader influence of the synoptic atmospheric conditions during the event appeared to be the dominant factor. Thus, for this case study, aerosol- and urban-related effects, while capable of modulating the evolution of the event, did not significantly alter the occurrence of the event itself.
Although each simulation overestimated rainfall, the aerosol-urban simulation most closely reproduced the satellite-based precipitation coverage threshold totals, whereas the aerosol- and urban-only simulations performed more poorly, even in areas with less urbanization. The findings of this case study demonstrated that, in this instance, the nonlinear interactions between aerosols and the urban environment cannot be neglected. Therefore, URE-related research should examine the aerosol environment of cities before attributing precipitation modifications to only urban land cover-related effects. Further research should pursue finer-scale experiments or field-based frameworks that explicitly account for aerosol-related impacts on the URE.
Supplementary Materials
The following supporting information can be downloaded at: https://www.mdpi.com/article/10.3390/atmos17111062/s1. Figure S1: Mean accumulated precipitation difference per time step between experimental scenarios and the control simulation for the Pontchartrain sub-zone (A–C), New Orleans sub-zone (D–F), and aerosol-concentrated sub-zone (G–I). (A), (D), and (G) represent the difference between the urban-only scenario and the control. (B), (E), and (H) represent the aerosol-only scenario compared to the control. (C), (F), and (I) compare the aerosol-urban to the control. The hash marks indicate statistically significant areas. Statistical significance was determined with 95% confidence through a paired permutation test with 5000 permutations. The Benjamini-Hochberg method controlled for an assumed 5% false discovery rate. Table S1: Common point-source pollutants across Louisiana in 2007 and 2010. Data was collected from the Louisiana Department of Environmental Quality (LDEQ). In 2007, LDEQ identified 750 unique point-source facility IDs. In 2010, LDEQ identified 715 unique point-source facility IDs. 643 facilities occurred in both years. Across the listed species, more than 95% of point-source emissions originated from the 643 common facilities. This suggests that although the yearly total emission values differ, the 2010 EDGAR-HTAP v2.2 dataset spatially accounts for nearly all point sources present in 2007.
Author Contributions
Conceptualization, C.J., P.M. and N.D.; methodology, C.J. and P.M.; validation, C.J. and P.M.; formal analysis, C.J. and P.M.; investigation, C.J.; resources, C.J. and P.M.; data curation, C.J.; writing—original draft preparation, C.J.; writing—review and editing, C.J., P.M. and N.D.; visualization, C.J.; supervision, P.M.; project administration, P.M.; funding acquisition, P.M. All authors have read and agreed to the published version of the manuscript.
Funding
This project was funded by the NASA Interdisciplinary Sciences (IDS) program under award number 80NSSC20K1268 through sub-awards to the University of Texas at San Antonio and Louisiana State University.
Institutional Review Board Statement
Not applicable.
Informed Consent Statement
Not applicable.
Data Availability Statement
The data is available upon request made to the corresponding author. Sample data is available at: https://doi.org/10.5281/zenodo.22802620.
Conflicts of Interest
The authors declare no conflicts of interest. The funders had no role in the design of the study; in the collection, analyses, or interpretation of data; in the writing of the manuscript; or in the decision to publish the results.
References
- Cheung, K.; Daher, N.; Kam, W.; Shafer, M.M.; Ning, Z.; Schauer, J.J.; Sioutas, C. Spatial and temporal variation of chemical composition and mass closure of ambient coarse particulate matter (PM10–2.5) in the Los Angeles area. Atmos. Environ. 2011, 45, 2651–2662. [Google Scholar] [CrossRef] [Scilit]
- Kim, K.H.; Kabir, E.; Kabir, S. A review on the human health impact of airborne particulate matter. Environ. Int. 2015, 74, 136–143. [Google Scholar] [CrossRef] [Scilit] [PubMed]
- Srimuruganandam, B.; Nagendra, S.S. Source characterization of PM10 and PM2. 5 mass using a chemical mass balance model at urban roadside. Sci. Total Environ. 2012, 433, 8–19. [Google Scholar] [CrossRef] [Scilit] [PubMed]
- Atkinson, R.W.; Fuller, G.W.; Anderson, H.R.; Harrison, R.M.; Armstrong, B. Urban ambient particle metrics and health: A time-series analysis. Epidemiology 2010, 21, 501–511. [Google Scholar] [CrossRef] [Scilit] [PubMed]
- Juda-Rezler, K.; Reizer, M.; Oudinet, J.P. Determination and analysis of PM10 source apportionment during episodes of air pollution in Central Eastern European urban areas: The case of wintertime 2006. Atmos. Environ. 2011, 45, 6557–6566. [Google Scholar] [CrossRef] [Scilit]
- Rhys-Tyler, G.; Legassick, W.; Bell, M. The significance of vehicle emissions standards for levels of exhaust pollution from light vehicles in an urban area. Atmos. Environ. 2011, 45, 3286–3293. [Google Scholar] [CrossRef] [Scilit]
- Zhang, K.; Batterman, S. Air pollution and health risks due to vehicle traffic. Sci. Total Environ. 2013, 450, 307–316. [Google Scholar] [CrossRef] [Scilit] [PubMed]
- Jonidi Jafari, A.; Charkhloo, E.; Pasalari, H. Urban air pollution control policies and strategies: A systematic review. J. Environ. Health Sci. Eng. 2021, 19, 1911–1940. [Google Scholar] [CrossRef] [Scilit] [PubMed]
- Duan, F.; Liu, X.; Yu, T.; Cachier, H. Identification and estimate of biomass burning contribution to the urban aerosol organic carbon concentrations in Beijing. Atmos. Environ. 2004, 38, 1275–1282. [Google Scholar] [CrossRef] [Scilit]
- Crounse, J.; DeCarlo, P.; Blake, D.R.; Emmons, L.; Campos, T.; Apel, E.; Clarke, A.; Weinheimer, A.; McCabe, D.; Yokelson, R.J.; et al. Biomass burning and urban air pollution over the Central Mexican Plateau. Atmos. Chem. Phys. 2009, 9, 4929–4944. [Google Scholar] [CrossRef] [Scilit]
- Li, H.; Sodoudi, S.; Liu, J.; Tao, W. Temporal variation of urban aerosol pollution island and its relationship with urban heat island. Atmos. Res. 2020, 241, 104957. [Google Scholar] [CrossRef] [Scilit]
- Guerra, S.A.; Lane, D.D.; Marotz, G.A.; Carter, R.E.; Hohl, C.M.; Baldauf, R.W. Effects of wind direction on coarse and fine particulate matter concentrations in southeast Kansas. J. Air Waste Manag. Assoc. 2006, 56, 1525–1531. [Google Scholar] [CrossRef] [Scilit] [PubMed]
- Khaniabadi, Y.O.; Sicard, P.; Taiwo, A.M.; De Marco, A.; Esmaeili, S.; Rashidi, R. Modeling of particulate matter dispersion from a cement plant: Upwind-downwind case study. J. Environ. Chem. Eng. 2018, 6, 3104–3110. [Google Scholar] [CrossRef] [Scilit]
- Sánchez-Soberón, F.; Rovira, J.; Mari, M.; Sierra, J.; Nadal, M.; Domingo, J.L.; Schuhmacher, M. Main components and human health risks assessment of PM10, PM2. 5, and PM1 in two areas influenced by cement plants. Atmos. Environ. 2015, 120, 109–116. [Google Scholar] [CrossRef] [Scilit]
- Levy, H.; Horowitz, L.W.; Schwarzkopf, M.D.; Ming, Y.; Golaz, J.C.; Naik, V.; Ramaswamy, V. The roles of aerosol direct and indirect effects in past and future climate change. J. Geophys. Res. Atmos. 2013, 118, 4521–4532. [Google Scholar] [CrossRef] [Scilit]
- Zhao, C.; Sun, Y.; Yang, J.; Li, J.; Zhou, Y.; Yang, Y.; Fan, H.; Zhao, X. Observational evidence and mechanisms of aerosol effects on precipitation. Sci. Bull. 2024, 69, 1569–1580. [Google Scholar] [CrossRef] [Scilit] [PubMed]
- Ghan, S.J. Estimating aerosol effects on cloud radiative forcing. Atmos. Chem. Phys. 2013, 13, 9971–9974. [Google Scholar] [CrossRef] [Scilit]
- Givati, A.; Rosenfeld, D. Quantifying precipitation suppression due to air pollution. J. Appl. Meteorol. 2004, 43, 1038–1056. [Google Scholar] [CrossRef] [Scilit]
- Han, F.; Kota, S.H.; Wang, Y.; Zhang, H. Source apportionment of PM2.5 in Baton Rouge, Louisiana during 2009–2014. Sci. Total Environ. 2017, 586, 115–126. [Google Scholar] [CrossRef] [Scilit] [PubMed]
- Hobbs, P.V.; Radke, L. Cloud condensation nuclei from a simulated forest fire. Science 1969, 163, 279–280. [Google Scholar] [CrossRef] [Scilit] [PubMed]
- Kaufman, Y.J.; Fraser, R.S. The effect of smoke particles on clouds and climate forcing. Science 1997, 277, 1636–1639. [Google Scholar] [CrossRef] [Scilit]
- Rosenfeld, D. TRMM observed first direct evidence of smoke from forest fires inhibiting rainfall. Geophys. Res. Lett. 1999, 26, 3105–3108. [Google Scholar] [CrossRef] [Scilit]
- Suzuki, K.; Stephens, G.L.; Lebsock, M.D. Aerosol effect on the warm rain formation process: Satellite observations and modeling. J. Geophys. Res. Atmos. 2013, 118, 170–184. [Google Scholar] [CrossRef] [Scilit]
- Bell, T.L.; Rosenfeld, D.; Kim, K.M.; Yoo, J.M.; Lee, M.I.; Hahnenberger, M. Midweek increase in US summer rain and storm heights suggests air pollution invigorates rainstorms. J. Geophys. Res. Atmos. 2008, 113, D02209. [Google Scholar] [CrossRef] [Scilit]
- Boucher, O.; Randall, D.; Artaxo, P.; Bretherton, C.; Feingold, G.; Forster, P.; Kerminen, V.M.; Kondo, Y.; Liao, H.; Lohmann, U.; et al. Clouds and aerosols. In Climate Change 2013: The Physical Science Basis. Contribution of Working Group I to the Fifth Assessment Report of the Intergovernmental Panel on Climate Change; Cambridge University Press: Cambridge, UK, 2013; pp. 571–657. [Google Scholar]
- Williams, E.; Rosenfeld, D.; Madden, N.; Gerlach, J.; Gears, N.; Atkinson, L.; Dunnemann, N.; Frostrom, G.; Antonio, M.; Biazon, B.; et al. Contrasting convective regimes over the Amazon: Implications for cloud electrification. J. Geophys. Res. Atmos. 2002, 107, LBA–50. [Google Scholar] [CrossRef] [Scilit]
- Wu, T.; Boor, B.E. Urban aerosol size distributions: A global perspective. Atmos. Chem. Phys. 2021, 21, 8883–8914. [Google Scholar] [CrossRef] [Scilit]
- Imhoff, M.L.; Zhang, P.; Wolfe, R.E.; Bounoua, L. Remote sensing of the urban heat island effect across biomes in the continental USA. Remote Sens. Environ. 2010, 114, 504–513. [Google Scholar] [CrossRef] [Scilit]
- Price, J.C. Assessment of the urban heat island effect through the use of satellite data. Mon. Weather Rev. 1979, 107, 1554–1557. [Google Scholar] [CrossRef] [Scilit]
- Changnon, S.A., Jr.; Semonin, R.G.; Huff, F. A hypothesis for urban rainfall anomalies. J. Appl. Meteorol. Climatol. 1976, 15, 544–560. [Google Scholar] [CrossRef] [Scilit]
- Cristiano, E.; ten Veldhuis, M.C.; Van De Giesen, N. Spatial and temporal variability of rainfall and their effects on hydrological response in urban areas—A review. Hydrol. Earth Syst. Sci. 2017, 21, 3859–3878. [Google Scholar] [CrossRef] [Scilit]
- Debbage, N.; Shepherd, J.M. Urban influences on the spatiotemporal characteristics of runoff and precipitation during the 2009 Atlanta flood. J. Hydrometeorol. 2019, 20, 3–21. [Google Scholar] [CrossRef] [Scilit]
- Shen, C.; Shen, A.; Cui, Y.; Chen, X.; Liu, Y.; Fan, Q.; Chan, P.; Tian, C.; Wang, C.; Lan, J.; et al. Spatializing the roughness length of heterogeneous urban underlying surfaces to improve the WRF simulation-part 1: A review of morphological methods and model evaluation. Atmos. Environ. 2022, 270, 118874. [Google Scholar] [CrossRef] [Scilit]
- Carrió, G.; Cotton, W.; Cheng, W. Urban growth and aerosol effects on convection over Houston: Part I: The August 2000 case. Atmos. Res. 2010, 96, 560–574. [Google Scholar]
- Lacke, M.C.; Mote, T.L.; Shepherd, J.M. Aerosols and associated precipitation patterns in Atlanta. Atmos. Environ. 2009, 43, 4359–4373. [Google Scholar] [CrossRef] [Scilit]
- Zhong, S.; Yang, X.Q. Mechanism of urbanization impact on a summer cold-frontal rainfall process in the greater Beijing metropolitan area. J. Appl. Meteorol. Climatol. 2015, 54, 1234–1247. [Google Scholar] [CrossRef] [Scilit]
- Ntelekos, A.A.; Oppenheimer, M.; Smith, J.A.; Miller, A.J. Urbanization, climate change and flood policy in the United States. Clim. Chang. 2010, 103, 597–616. [Google Scholar] [CrossRef] [Scilit]
- Yang, L.; Smith, J.; Baeck, M.L.; Smith, B.; Tian, F.; Niyogi, D. Structure and evolution of flash flood producing storms in a small urban watershed. J. Geophys. Res. Atmos. 2016, 121, 3139–3152. [Google Scholar] [CrossRef] [Scilit]
- Bell, T.L.; Rosenfeld, D.; Kim, K.M. Weekly cycle of lightning: Evidence of storm invigoration by pollution. Geophys. Res. Lett. 2009, 36, L23805. [Google Scholar] [CrossRef] [Scilit]
- Naccarato, K.; Pinto, O., Jr.; Pinto, I. Evidence of thermal and aerosol effects on the cloud-to-ground lightning density and polarity over large urban areas of Southeastern Brazil. Geophys. Res. Lett. 2003, 30, 1674. [Google Scholar] [CrossRef] [Scilit]
- Chen, F.; Bornstein, R.; Grimmond, S.; Li, J.; Liang, X.; Martilli, A.; Miao, S.; Voogt, J.; Wang, Y. Research priorities in observing and modeling urban weather and climate. Bull. Am. Meteorol. Soc. 2012, 93, 1725–1728. [Google Scholar] [CrossRef] [Scilit]
- Han, J.Y.; Baik, J.J.; Khain, A.P. A numerical study of urban aerosol impacts on clouds and precipitation. J. Atmos. Sci. 2012, 69, 504–520. [Google Scholar] [CrossRef] [Scilit]
- Schmid, P.E.; Niyogi, D. Modeling urban precipitation modification by spatially heterogeneous aerosols. J. Appl. Meteorol. Climatol. 2017, 56, 2141–2153. [Google Scholar] [CrossRef] [Scilit]
- Vega, A.J.; Grymes; III, J.M.; Rohli, R.V. Louisiana Weather and Climate; Jones & Bartlett Publishers: Sudbury, MA, USA, 2012. [Google Scholar]
- Rogers, J.C. The association between the North Atlantic Oscillation and the Southern Oscillation in the northern hemisphere. Mon. Weather Rev. 1984, 112, 1999–2015. [Google Scholar] [CrossRef] [Scilit]
- Xue, Z.G.; Gochis, D.J.; Yu, W.; Keim, B.D.; Rohli, R.V.; Zang, Z.; Sampson, K.; Dugger, A.; Sathiaraj, D.; Ge, Q. Modeling hydroclimatic change in southwest Louisiana rivers. Water 2018, 10, 596. [Google Scholar] [CrossRef] [Scilit]
- Zhang, C. Madden-julian oscillation. Rev. Geophys. 2005, 43, RG2003. [Google Scholar] [CrossRef] [Scilit]
- Bjerknes, J. Atmospheric teleconnections from the equatorial Pacific. Mon. Weather Rev. 1969, 97, 163–172. [Google Scholar]
- Rohli, R.V.; Snedden, G.A.; Martin, E.R.; DeLong, K.L. Impacts of ocean-atmosphere teleconnection patterns on the south-central United States. Front. Earth Sci. 2022, 10, 934654. [Google Scholar] [CrossRef] [Scilit]
- Saravia, J.; Lee, G.I.; Lomnicki, S.; Dellinger, B.; Cormier, S.A. Particulate matter containing environmentally persistent free radicals and adverse infant respiratory health effects: A review. J. Biochem. Mol. Toxicol. 2013, 27, 56–68. [Google Scholar] [CrossRef] [Scilit] [PubMed]
- U.S. Census Bureau. 2025 Gazetteer Place File—Louisiana (place_22); U.S. Department of Commerce: Washington, DC, USA, 2025. Available online: https://www.census.gov/geographies/reference-files/2025/geo/gazetter-file.html (accessed on 18 September 2026).
- Census Dots. Baton Rouge, LA Demographics. 2020. Available online: https://www.censusdots.com/race/baton-rouge-la-demographics (accessed on 18 September 2026).
- Census Dots. New Orleans, LA Demographics. 2020. Available online: https://www.censusdots.com/race/new-orleans-la-demographics (accessed on 18 September 2026).
- Forney, R.K.; Debbage, N.; Miller, P.; Uzquiano, J. Urban effects on weakly forced thunderstorms observed in the Southeast United States. Urban Clim. 2022, 43, 101161. [Google Scholar] [CrossRef] [Scilit]
- Armah, R.N.D.; Ning, Z.H.; Twumasi, Y.A.; Osei, J.D.; Masasi, B.; Anokye, M.; Loh, P.M. Mapping the Spatial Distribution of Urban Heat Island in Scotlandville in the Louisiana State of USA using Satellite Remote Sensing. Int. Arch. Photogramm. Remote Sens. Spat. Inf. Sci. 2025, XLVIII-M-5-2024, 9–14. [Google Scholar] [CrossRef] [Scilit]
- Miller, P.; Debbage, N. Weakly forced thunderstorms in the Southeast US are stronger near urban areas. Geophys. Res. Lett. 2023, 50, e2023GL105081. [Google Scholar] [CrossRef] [Scilit]
- Panda, J.; Mukherjee, A.; Choudhury, A.; Biswas, S. Urban heat: UHI and heat stress threat to megacities. In Climate Crisis: Adaptive Approaches and Sustainability; Springer: Cham, Switzerland, 2024; pp. 425–445. [Google Scholar]
- Reesman, C.; Miller, P.; D’Antonio, R.; Gilmore, K.; Schott, B.; Bannan, C. Areal probability of precipitation in moist tropical air masses for the United States. Atmosphere 2021, 12, 255. [Google Scholar] [CrossRef] [Scilit]
- Kumar, S.V.; Peters-Lidard, C.D.; Tian, Y.; Houser, P.R.; Geiger, J.; Olden, S.; Lighty, L.; Eastman, J.L.; Doty, B.; Dirmeyer, P.; et al. Land information system: An interoperable framework for high resolution land surface modeling. Environ. Model. Softw. 2006, 21, 1402–1415. [Google Scholar] [CrossRef] [Scilit]
- Peters-Lidard, C.D.; Houser, P.R.; Tian, Y.; Kumar, S.V.; Geiger, J.; Olden, S.; Lighty, L.; Doty, B.; Dirmeyer, P.; Adams, J.; et al. High-performance Earth system modeling with NASA/GSFC’s Land Information System. Innov. Syst. Softw. Eng. 2007, 3, 157–165. [Google Scholar] [CrossRef] [Scilit]
- Skamarock, W.C.; Klemp, J.B.; Dudhia, J.; Gill, D.O.; Liu, Z.; Berner, J.; Wang, W.; Powers, J.G.; Duda, M.G.; Barker, D.M.; et al. A Description of the Advanced Research WRF Version 4; NCAR Technical Notes NCAR/TN-556+STR; National Center for Atmospheric Research: Boulder, CO, USA, 2019; 145p. [Google Scholar]
- Lau, W.K.; Kim, K.M.; Shi, J.J.; Matsui, T.; Chin, M.; Tan, Q.; Peters-Lidard, C.; Tao, W. Impacts of aerosol–monsoon interaction on rainfall and circulation over Northern India and the Himalaya Foothills. Clim. Dyn. 2017, 49, 1945–1960. [Google Scholar] [CrossRef] [Scilit] [PubMed]
- Wu, D.; Peters-Lidard, C.; Tao, W.K.; Petersen, W. Evaluation of NU-WRF rainfall forecasts for IFloodS. J. Hydrometeorol. 2016, 17, 1317–1335. [Google Scholar] [CrossRef] [Scilit] [PubMed]
- Zhang, S.Q.; Matsui, T.; Cheung, S.; Zupanski, M.; Peters-Lidard, C. Impact of assimilated precipitation-sensitive radiances on the NU-WRF simulation of the West African monsoon. Mon. Weather Rev. 2017, 145, 3881–3900. [Google Scholar] [CrossRef] [Scilit]
- Carter, M.; Shepherd, J.M.; Burian, S.; Jeyachandran, I. Integration of lidar data into a coupled mesoscale–land surface model: A theoretical assessment of sensitivity of urban–coastal mesoscale circulations to urban canopy parameters. J. Atmos. Ocean. Technol. 2012, 29, 328–346. [Google Scholar] [CrossRef] [Scilit]
- Tao, W.K.; Chen, J.P.; Li, Z.; Wang, C.; Zhang, C. Impact of aerosols on convective clouds and precipitation. Rev. Geophys. 2012, 50, RG2004. [Google Scholar] [CrossRef] [Scilit]
- Zhang, Y.; Roundy, J.K.; Santanello, J.A. Evaluating the impact of model resolutions and cumulus parameterization on precipitation in NU-WRF: A case study in the Central Great Plains. Environ. Model. Softw. 2021, 145, 105184. [Google Scholar] [CrossRef] [Scilit]
- Shi, J.; Matsui, T.; Tao, W.K.; Tan, Q.; Peters-Lidard, C.; Chin, M.; Pickering, K.; Guy, N.; Lang, S.; Kemp, E. Implementation of an aerosol–cloud-microphysics–radiation coupling into the NASA unified WRF: Simulation results for the 6–7 August 2006 AMMA special observing period. Q. J. R. Meteorol. Soc. 2014, 140, 2158–2175. [Google Scholar] [CrossRef] [Scilit]
- Tao, Z.; Chin, M.; Gao, M.; Kucsera, T.; Kim, D.; Bian, H.; Kurokawa, J.i.; Wang, Y.; Liu, Z.; Carmichael, G.R.; et al. Evaluation of NU-WRF model performance on air quality simulation under various model resolutions–an investigation within the framework of MICS-Asia Phase III. Atmos. Chem. Phys. 2020, 20, 2319–2339. [Google Scholar] [CrossRef] [Scilit]
- Janssens-Maenhout, G.; Crippa, M.; Guizzardi, D.; Dentener, F.; Muntean, M.; Pouliot, G.; Keating, T.; Zhang, Q.; Kurokawa, J.; Wankmüller, R.; et al. HTAP_v2. 2: A mosaic of regional and global emission grid maps for 2008 and 2010 to study hemispheric transport of air pollution. Atmos. Chem. Phys. 2015, 15, 11411–11432. [Google Scholar] [CrossRef] [Scilit]
- Kim, K.M.; Kim, S.W.; Seo, S.; Blake, D.R.; Cho, S.; Crawford, J.H.; Emmons, L.K.; Fried, A.; Herman, J.R.; Hong, J.; et al. Sensitivity of the WRF-Chem v4. 4 simulations of ozone and formaldehyde and their precursors to multiple bottom-up emission inventories over East Asia during the KORUS-AQ 2016 field campaign. Geosci. Model Dev. 2024, 17, 1931–1955. [Google Scholar] [CrossRef] [Scilit]
- López-Noreña, A.I.; Berná, L.; Tames, M.F.; Millán, E.N.; Puliafito, S.E.; Fernandez, R.P. Influence of emission inventory resolution on the modeled spatio-temporal distribution of air pollutants in Buenos Aires, Argentina, using WRF-Chem. Atmos. Environ. 2022, 269, 118839. [Google Scholar] [CrossRef] [Scilit]
- Sharma, A.; Ojha, N.; Pozzer, A.; Mar, K.A.; Beig, G.; Lelieveld, J.; Gunthe, S.S. WRF-Chem simulated surface ozone over south Asia during the pre-monsoon: Effects of emission inventories and chemical mechanisms. Atmos. Chem. Phys. 2017, 17, 14393–14413. [Google Scholar] [CrossRef] [Scilit]
- Ding, Q.; Sun, J.; Huang, X.; Ding, A.; Zou, J.; Yang, X.; Fu, C. Impacts of black carbon on the formation of advection–radiation fog during a haze pollution episode in eastern China. Atmos. Chem. Phys. 2019, 19, 7759–7774. [Google Scholar] [CrossRef] [Scilit]
- Mogno, C.; Palmer, P.I.; Knote, C.; Yao, F.; Wallington, T.J. Seasonal distribution and drivers of surface fine particulate matter and organic aerosol over the Indo-Gangetic Plain. Atmos. Chem. Phys. 2021, 21, 10881–10909. [Google Scholar] [CrossRef] [Scilit]
- Gustafson, W.I., Jr.; Chapman, E.G.; Ghan, S.J.; Easter, R.C.; Fast, J.D. Impact on modeled cloud characteristics due to simplified treatment of uniform cloud condensation nuclei during NEAQS 2004. Geophys. Res. Lett. 2007, 34, L19804. [Google Scholar] [CrossRef] [Scilit]
- Huffman, G.J.; Bolvin, D.T.; Joyce, R.; Kelley, O.A.; Nelkin, E.J.; Portier, A.; Stocker, E.F.; Tan, J.; Watters, D.C.; West, B.J. IMERG V07 Release Notes; Goddard Space Flight Center: Greenbelt, MD, USA, 2023. [Google Scholar]
- Pradhan, R.K.; Markonis, Y.; Godoy, M.R.V.; Villalba-Pradas, A.; Andreadis, K.M.; Nikolopoulos, E.I.; Papalexiou, S.M.; Rahim, A.; Tapiador, F.J.; Hanel, M. Review of GPM IMERG performance: A global perspective. Remote Sens. Environ. 2022, 268, 112754. [Google Scholar] [CrossRef] [Scilit]
- Thornton, M.M.; Shrestha, R.; Wei, Y.; Thornton, P.E.; Kao, S.-C. Daymet: Annual Climate Summaries on a 1-km Grid for North America, Version 4 R1; ORNL Distributed Active Archive Center: Oak Ridge, TN, USA, 2022. [Google Scholar] [CrossRef]
- Knight, C.A.; Miller, L. First radar echoes from cumulus clouds. Bull. Am. Meteorol. Soc. 1993, 74, 179–188. [Google Scholar] [CrossRef] [Scilit]
- Dowell, D.C.; Zhang, F.; Wicker, L.J.; Snyder, C.; Crook, N.A. Wind and temperature retrievals in the 17 May 1981 Arcadia, Oklahoma, supercell: Ensemble Kalman filter experiments. Mon. Weather Rev. 2004, 132, 1982–2005. [Google Scholar] [CrossRef] [Scilit]
- Aksoy, A.; Dowell, D.C.; Snyder, C. A multicase comparative assessment of the ensemble Kalman filter for assimilation of radar observations. Part I: Storm-scale analyses. Mon. Weather Rev. 2009, 137, 1805–1824. [Google Scholar] [CrossRef] [Scilit]
- Gao, S.; Min, J.; Yu, H. Assimilation of no-precipitation observations from Doppler radar with 4DVar and its impact on summertime convective event prediction. Atmos. Res. 2021, 257, 105617. [Google Scholar] [CrossRef] [Scilit]
- Steiner, M.; Houze, R.A., Jr.; Yuter, S.E. Climatological characterization of three-dimensional storm structure from operational radar and rain gauge data. J. Appl. Meteorol. Climatol. 1995, 34, 1978–2007. [Google Scholar] [CrossRef] [Scilit]
- Li, Z.; Wright, D.B.; Zhang, S.Q.; Kirschbaum, D.B.; Hartke, S.H. Object-based comparison of data-driven and physics-driven satellite estimates of extreme rainfall. J. Hydrometeorol. 2020, 21, 2759–2776. [Google Scholar] [CrossRef] [Scilit] [PubMed]
- Tao, Z.; Santanello, J.; Chin, M.; Zhou, S.; Tan, Q.; Kemp, E.; Peters-Lidard, C. Effect of land cover on atmospheric processes and air quality over the continental United States—A NASA Unified WRF (NU-WRF) model study. Atmos. Chem. Phys. 2013, 13, 6207–6226. [Google Scholar] [CrossRef] [Scilit]
- Li, Y.; Pickering, K.E.; Allen, D.J.; Barth, M.C.; Bela, M.M.; Cummings, K.A.; Carey, L.D.; Mecikalski, R.M.; Fierro, A.O.; Campos, T.L.; et al. Evaluation of deep convective transport in storms from different convective regimes during the DC3 field campaign using WRF-Chem with lightning data assimilation. J. Geophys. Res. Atmos. 2017, 122, 7140–7163. [Google Scholar] [CrossRef] [Scilit]
- Nandi, I.; Ganguly, D. Toward reliable air quality simulations over India: Optimizing WRF-Chem through comprehensive sensitivity analysis of meteorology, physical parameterizations, and emission inventories. Environ. Sci. Atmos. 2026, 6, 644–660. [Google Scholar] [CrossRef] [Scilit]
- Rai, M.; Kang, S.; Yang, J.; Chen, X.; Hu, Y.; Rupakheti, D. Tracing atmospheric anthropogenic black carbon and its potential radiative response over Pan-third Pole region: A synoptic-scale Analysis using WRF-chem. J. Geophys. Res. Atmos. 2022, 127, e2021JD035772. [Google Scholar] [CrossRef] [Scilit]
- Yang, Z.; Zhang, W.; Villarini, G. Impact of coronavirus-driven reduction in aerosols on precipitation in the western United States. Atmos. Res. 2023, 288, 106732. [Google Scholar] [CrossRef] [Scilit] [PubMed]
- Moraglia, G.; Crippa, P. Assessing the influence of aerosols on urban precipitation: A sensitivity study of Dallas–Fort Worth. Atmos. Res. 2025, 328, 108436. [Google Scholar] [CrossRef] [Scilit]
- Qian, Y.; Chakraborty, T.; Li, J.; Li, D.; He, C.; Sarangi, C.; Chen, F.; Yang, X.; Leung, L.R. Urbanization impact on regional climate and extreme weather: Current understanding, uncertainties, and future research directions. Adv. Atmos. Sci. 2022, 39, 819–860. [Google Scholar] [CrossRef] [Scilit] [PubMed]
- Khain, A.; Rosenfeld, D.; Pokrovsky, A. Aerosol impact on the dynamics and microphysics of deep convective clouds. Q. J. R. Meteorol. Soc. A J. Atmos. Sci. Appl. Meteorol. Phys. Oceanogr. 2005, 131, 2639–2663. [Google Scholar] [CrossRef] [Scilit]
- Xiao, H.; Yin, Y.; Chen, Q.; Zhao, P. Impact of aerosol and freezing level on orographic clouds: A sensitivity study. Atmos. Res. 2016, 176, 19–28. [Google Scholar] [CrossRef] [Scilit]
- Xiao, Z.; Yu, Y.; Miao, Y.; Zhu, S.; He, H.; Wang, Y.; Che, H. Impact of aerosols on convective system over the North China Plain: A numerical case study in autumn. J. Geophys. Res. Atmos. 2023, 128, e2022JD037465. [Google Scholar] [CrossRef] [Scilit]
- Blagina, A.; Dementyeva, S. Numerical Simulation of the Influence of Aerosols on Electrical Processes in Convective Clouds during Wildfires. Atmos. Ocean. Opt. 2025, 38, 830–837. [Google Scholar] [CrossRef] [Scilit]
- Marshall, J.S.; Palmer, W.M.K. The distribution of raindrops with size. J. Atmos. Sci. 1948, 5, 165–166. [Google Scholar]
- Lynn, B.; Khain, A.; Rosenfeld, D.; Woodley, W.L. Effects of aerosols on precipitation from orographic clouds. J. Geophys. Res. Atmos. 2007, 112, D10225. [Google Scholar] [CrossRef] [Scilit]
- Khain, A.; BenMoshe, N.; Pokrovsky, A. Factors determining the impact of aerosols on surface precipitation from clouds: An attempt at classification. J. Atmos. Sci. 2008, 65, 1721–1748. [Google Scholar] [CrossRef] [Scilit]
- Xiao, H.; Liu, X.; Li, H.; Yue, Q.; Feng, L.; Qu, J. Extent of aerosol effect on the precipitation of squall lines: A case study in South China. Atmos. Res. 2023, 292, 106886. [Google Scholar] [CrossRef] [Scilit]
- Li, T.; Yu, Y.; Wang, X.; Liu, X.; Mao, Q.; Yuan, Y. A review of aerosol-cloud interactions: Mechanisms, climate effects, and observation methods. Atmos. Res. 2025, 325, 108267. [Google Scholar] [CrossRef] [Scilit]
- Efstathiou, G.; Zoumakis, N.; Melas, D.; Lolis, C.; Kassomenos, P. Sensitivity of WRF to boundary layer parameterizations in simulating a heavy rainfall event using different microphysical schemes. Effect on large-scale processes. Atmos. Res. 2013, 132, 125–143. [Google Scholar] [CrossRef] [Scilit]
- Chawla, I.; Osuri, K.K.; Mujumdar, P.P.; Niyogi, D. Assessment of the Weather Research and Forecasting (WRF) model for simulation of extreme rainfall events in the upper Ganga Basin. Hydrol. Earth Syst. Sci. 2018, 22, 1095–1117. [Google Scholar] [CrossRef] [Scilit]
- Cui, W.; Dong, X.; Xi, B.; Feng, Z.; Fan, J. Can the GPM IMERG final product accurately represent MCSs’ precipitation characteristics over the central and eastern United States? J. Hydrometeorol. 2020, 21, 39–57. [Google Scholar] [CrossRef] [Scilit]
- Marra, F.; Nikolopoulos, E.I.; Anagnostou, E.N.; Bárdossy, A.; Morin, E. Precipitation frequency analysis from remotely sensed datasets: A focused review. J. Hydrol. 2019, 574, 699–705. [Google Scholar] [CrossRef] [Scilit]
- Zhang, H.; Zhang, A.; Chen, Y. Cloud-rain vertical inconsistency increases IMERG precipitation uncertainty. Geophys. Res. Lett. 2026, 53, e2026GL123397. [Google Scholar] [CrossRef] [Scilit]
- Yang, Q.; Gustafson, W., Jr.; Fast, J.; Wang, H.; Easter, R.; Wang, M.; Ghan, S.; Berg, L.; Leung, L.; Morrison, H. Impact of natural and anthropogenic aerosols on stratocumulus and precipitation in the Southeast Pacific: A regional modelling study using WRF-Chem. Atmos. Chem. Phys. 2012, 12, 8777–8796. [Google Scholar] [CrossRef] [Scilit]
- Guo, J.; Luo, Y.; Yang, J.; Furtado, K.; Lei, H. Effects of anthropogenic and sea salt aerosols on a heavy rainfall event during the early-summer rainy season over coastal Southern China. Atmos. Res. 2022, 265, 105923. [Google Scholar] [CrossRef] [Scilit]
- Han, P.; Li, S.; Zhao, K.; Wang, T.; Xie, M.; Zhuang, B.; Li, M.; Liu, C. Effects of anthropogenic aerosols and sea salt aerosols during a summer precipitation event in the Yangtze River Delta. Atmos. Res. 2023, 284, 106584. [Google Scholar] [CrossRef] [Scilit]

Disclaimer/Publisher’s Note: The statements, opinions and data contained in all publications are solely those of the individual author(s) and contributor(s) and not of MDPI and/or the editor(s). MDPI and/or the editor(s) disclaim responsibility for any injury to people or property resulting from any ideas, methods, instructions or products referred to in the content. |
© 2026 by the authors. Licensee MDPI, Basel, Switzerland. This article is an open access article distributed under the terms and conditions of the Creative Commons Attribution (CC BY) license.