


Abstract
This study examines the spatial and temporal variability of Tourism Climate Index (TCI) values across selected meteorological stations in Türkiye during 2000–2025. Using observations from 29 meteorological stations, the analysis investigates regional differences in TCI-derived climatic suitability and evaluates temporal trends at selected coastal locations. The study applies TCI as an established tourism climatology assessment framework; it does not constitute an empirical validation of the index against tourist preferences or physiological measurements. The Tourism Climate Index (TCI) is a valuable tool for assessing climatic suitability in tourism destinations in Türkiye, particularly in the Aegean and Mediterranean regions. In this study, data from 29 meteorological stations and several major coastal tourism destinations, including Antakya, Mersin, Antalya, Marmaris, Bodrum, Çeşme, İzmir, and Çanakkale, were analyzed to calculate TCI values and evaluate tourism climate conditions. Biometeorological research related to tourism and recreation has received increasing attention because tourism activities are strongly influenced by climatic conditions. Consequently, assessing the potential impacts of climate change on tourism and recreation has become an important research priority. This study contributes to the biometeorology literature by investigating the spatial variability of tourism-related bioclimatic conditions in Türkiye using the Tourism Climate Index (TCI). The analysis is based on meteorological data obtained from stations located along the coastal corridor extending from Çanakkale to Antakya. The results provide insights into the spatial distribution of climatic suitability for tourism across Türkiye’s coastal regions and highlight the role of climate as a key factor influencing tourism development. The findings are expected to support tourism planning and management by improving understanding of regional tourism climate conditions and raising awareness of the importance of climatic factors in shaping tourism activities. The Tourism Climate Index (TCI) values indicate that the Aegean coastal zone generally exhibits more favorable tourism climate conditions than the Mediterranean coastal zone. This difference is primarily attributable to the more moderate thermal conditions and stronger wind regimes characteristic of the Aegean region, which contribute to improved outdoor comfort, particularly during the summer months. In contrast, the Mediterranean coast is more frequently affected by higher temperatures and greater heat stress, which can reduce climatic suitability despite its abundant sunshine and limited precipitation. As a result, the Aegean coast tends to achieve higher TCI scores and provides more comfortable conditions for a wider range of tourism activities, including beach tourism, urban sightseeing, nature-based recreation, and shoulder-season tourism. Trend analysis using the Mann–Kendall test and Sen’s slope estimator revealed statistically significant decreasing trends (p < 0.001) in the Tourism Climate Index (TCI) at seven of the eight coastal stations. Sen’s slope values ranged from −0.18 to −0.28 TCI units year−1, with the greatest declines observed at Antalya and Antakya. Marmaris was the only station that showed no statistically significant trend (p = 0.73). Overall, the results indicate a consistent deterioration in climatic suitability for tourism across the majority of the study area during the study period.
1. Introduction
One of the most significant challenges facing the tourism sector is the growing number of extreme weather events—such as heatwaves, cold spells, storms, and other natural hazards—as highlighted in reports by the World Meteorological Organization. These climatic extremes are closely associated with ongoing global climate change and pose significant risks to tourism destinations and infrastructure [1]. Tourism, widely regarded as one of the crucial global industries, is dynamically influenced by climate. Given the significant contribution of tourism to Turkiye’s economy, this study aims to investigate the relationship between climate and tourism and to assess the impact of climatic conditions on thermal comfort using Mieczkowski’s Tourism Climatic Index (TCI) [2].
Climate change, characterized by shifts in temperature and precipitation patterns as well as an increase in extreme weather events, is placing the country’s tourism sector at risk by affecting both natural and cultural attractions. Rising temperatures and changes in precipitation patterns significantly influence the overall experience and satisfaction of tourists [3], whereas rising sea levels pose a significant threat to coastal tourism and beach quality [4,5]. In addition, extreme heat waves, droughts, and heavy rainfall events can reduce the attractiveness of beach destinations, affecting tourist arrivals and thus revenues [6]. Conversely, climate change may change winter tourism, especially in mountainous areas [7]. Skiing destinations can experience shorter ski seasons, unpredictable snowfall patterns, and diminishing snowpacks [8]. These changes not only impact the economic viability of ski resorts but also have an environmental and cultural impact on mountainous areas [9]. Climate change-induced increases in temperature and the heightened occurrence of extreme weather events may compromise the preservation of cultural heritage assets, with consequential impacts on visitor satisfaction and site accessibility [10]. Researchers have long recognized that climatic conditions play a crucial role in shaping tourism demand, destination attractiveness, and the overall tourist experience. Weather variables such as temperature, precipitation, humidity, sunshine duration, and wind speed significantly influence tourists’ travel decisions, the timing of visits, and participation in outdoor activities [11,12,13,14,15,16].
Most tourists favor summer tourism, traditionally described by the ‘three S’s’ (3S): sun, sea, and sand. Many of the tourism factors creating triple S are dependent on weather, climate, and climate change [17].
Solar radiation is one of the dominant factors determining human thermal comfort, as proofed by its strong positive correlation with the diurnal cycle. In particular, during the day, surface temperature exhibits a stronger correlation with air temperature due to the direct sway of solar radiation on the ground [18]. Tourism climate comfort assessment represents a systematic approach to evaluating the climatic conditions of tourist destinations and their suitability for tourism activities [19].
The Coastal Tourism Climate Index (CTCI) was developed to evaluate the climatic suitability of nine coastal tourism cities in China. The index integrates five principal variables—thermal comfort, sunshine duration, precipitation, wind speed, and air quality—which collectively represent the major atmospheric factors influencing coastal tourism activities. Thermal comfort reflects the combined effects of temperature and humidity on the human body, while sunshine duration influences outdoor visibility and overall tourist satisfaction. Precipitation and wind speed are key determinants of the feasibility and safety of coastal tourism activities, whereas air quality is essential for ensuring a healthy environment for tourists [20]. Badiru et al. [21] demonstrated that the climatic conditions in the city of Joao Pessoa, Brazil, influence sustainable tourism, with a specific focus on the Climate–Tourism/Transfer Information Scheme (CTIS), Physiologically Equivalent Temperature (PET) index, and rainfall patterns. The climate change vulnerability of tourism in Portuguese and Brazilian cities has become obvious recently, and in both countries, extreme rainfall events cause delays or interrupt travel and affect infrastructure, equipment, and services for tourists [22]. Amid growing climate change and more frequent heat extremes, the impacts extend beyond beach tourism, with mountain and inland tourism activities also undergoing substantial changes. Balkan cities like Mostar (Bosnia and Herzegovina) are becoming sensitive. This study aimed to provide a detailed analysis of the human bioclimatic conditions in Mostar using the Physiologically Equivalent Temperature (PET) index, the modified PET (mPET), and the Climate-Tourism Information Scheme (CTIS), based on hourly meteorological data for the period of 2000–2020. By applying the RayMan model, relevant bioclimatic parameters were calculated for three key times of day (07:00, 14:00, and 21:00 CET), and the results were analyzed in terms of seasonal and daily patterns of thermal stress [23].
Climate change is likely to alter the spatial distribution of tourism demand across Europe. Northern European coastal destinations are projected to benefit from increased tourism demand during summer and early autumn, whereas southern coastal regions may experience a reduction in tourist arrivals during the peak summer season, particularly under higher warming scenarios. Across Europe, the largest increase in tourist activity is projected to occur in April, with an estimated rise of +8.89% relative to the current baseline under a 4 °C warming scenario. Conversely, the most substantial decline in tourism demand is expected in July, ranging from −0.06% under the 1.5 °C scenario to −5.72% under the warmest climate scenario [24].
1.1. Novelty of the Study
The novelty of this study lies in its station-based empirical assessment of tourism bioclimatic conditions in Türkiye using 25 years of historical meteorological observations (2000–2025). Unlike studies that primarily rely on future climate model projections, this research examines how observed climate variability and longer-term changes have already manifested in tourism-related climatic conditions across Türkiye’s coastal regions and selected inland reference locations. By applying the Tourism Climate Index (TCI) alongside the Mann–Kendall trend test and Sen’s slope estimator, the study moves beyond a static description of climatic suitability to identify the direction, statistical significance, and magnitude of observed changes at individual stations. This approach provides evidence of spatially differentiated trends and establishes an observation-based reference for assessing changes in tourism bioclimatic conditions along Türkiye’s economically important coastal corridor.
An additional contribution is the study’s focus on the implications of recent observed changes for regional tourism–climate assessment. Although the TCI is an established index, its application to a consistent 2000–2025 observational record enables an assessment of whether and where tourism-related climatic conditions have changed over the recent historical period. The resulting station-level baseline can support regional monitoring, tourism planning, and climate adaptation discussions while providing a basis for comparison with future projections. However, the observed trends should be interpreted as changes in TCI-derived climatic suitability rather than direct evidence of changes in tourist comfort, satisfaction, preferences, or demand.
This study does not model future station-level conditions under alternative climate-change scenarios, such as those assessed in Intergovernmental Panel on Climate Change (IPCC) reports. Such an analysis would require consistent future projections for all meteorological variables used in the TCI calculation, including temperature, humidity, precipitation, sunshine duration, and wind speed, together with careful consideration of downscaling limitations and model uncertainty. Integrating multi-model climate projections with observed station-level trends therefore represents an important direction for future research. By documenting changes already evident in historical observations, the present study provides an empirical baseline against which future changes in tourism bioclimatic conditions can be evaluated.
1.2. Research Gap
Tourism climate assessment has been widely investigated using composite indices and human biometeorological approaches. However, these approaches differ in their objectives and methodological foundations: tourism climate indices characterize the suitability of climatic conditions for tourism activities, whereas physiological indices such as PET and UTCI evaluate human thermal stress. Consequently, results derived from these frameworks are not directly interchangeable. For Türkiye, a systematic assessment of the spatial variability and recent temporal trends in tourism climate conditions requires consistent meteorological observations across multiple climatic regions. This study addresses that descriptive objective by calculating TCI values for 29 meteorological stations using observations from 2000 to 2025 and examining temporal trends at eight selected coastal stations. The study does not attempt to validate TCI against tourist preferences or physiological measurements; rather, it provides a station-based assessment of the patterns represented by the index and identifies questions requiring further empirical investigation.
1.3. Tourism Sector in Türkiye
Tourism is a crucial sector for the economy of Türkiye, and recent official statistics highlight its strong performance in 2025. The tourism industry continues to contribute significantly to national income, employment, and regional development, particularly in coastal destinations and major cultural cities [25].
Evaluating the effects of climate change on coastal tourism in the Black Sea Region using the Summer Simmer Index (SSI) indicates that during the summer, thermal comfort conditions mostly do not pose a major health risk to tourists. The analysis suggests that, despite rising temperatures associated with climate change, the combined effects of temperature and humidity in this region remain within tolerable limits for human comfort [26].
According to data from the Turkish Statistical Institute (TÜİK), Türkiye generated tourism income of approximately 65.23 billion USD in 2025, marking a 6.8% increase compared to the previous year. During the same period, the number of visitors reached about 63.9 million, also up from 2024 figures, reflecting continued growth in international arrivals and spending [27]. These record figures demonstrate not only the economic importance of tourism for Türkiye but also how favorable climatic and seasonal conditions can support and enhance tourism demand.
Tourism activities such as beach, mountain, nature-based, and cultural tourism rely heavily on favorable weather and climatic conditions, and they are especially vulnerable to climate change, which can alter environmental suitability and tourist comfort, and thus destination attractiveness. Variations in temperature, precipitation patterns, and the frequency of extreme weather events may alter climatic comfort, thereby influencing tourism demand and the overall attractiveness of destinations. Türkiye is likewise exposed to the disruptive impacts of climate change, given its extensive coastlines along the Mediterranean, Aegean, and Black Seas, its ski resorts and mountainous highland villages, and its numerous outdoor cultural and historical attractions. From this perspective, this study examines the relationship between climate change and tourism demand across Turkish provinces, with a particular focus on potential shifts in tourism patterns under future climate scenarios.
Tourism represents a significant component of the Turkish economy, contributing substantially to both economic output and employment. In 2023, accommodation and food service activities generated 3.1% of the country’s gross domestic product (GDP) and accounted for 5.7% of total employment, highlighting the sector’s economic importance [28]. In addition to its direct economic contributions, the tourism sector exerts significant multiplier effects, generating indirect and induced impacts through supply chain linkages and increased expenditures across related goods and service industries. Tourism in Türkiye has continued to develop with increasing momentum over the years. The graph below presents tourism statistics and tourist arrival figures for the period between 2011 and 2020, including the pandemic period. The tourism sector recorded its highest number of tourist arrivals in 2019; however, this growth was abruptly interrupted in 2020 by the COVID-19 pandemic. Following the sharp decline during the pandemic period, the tourism sector entered a recovery phase in 2023. The sector continued its upward trend in 2024 and 2025, reaching approximately 57 million, 62 million, and 64 million tourists, respectively, demonstrating a strong revival in international tourism demand and travel activity.
The intensification of climate change and the rising frequency of extreme heat events are increasing the vulnerability of tourism in Mediterranean cities, particularly by affecting visitor comfort [29].
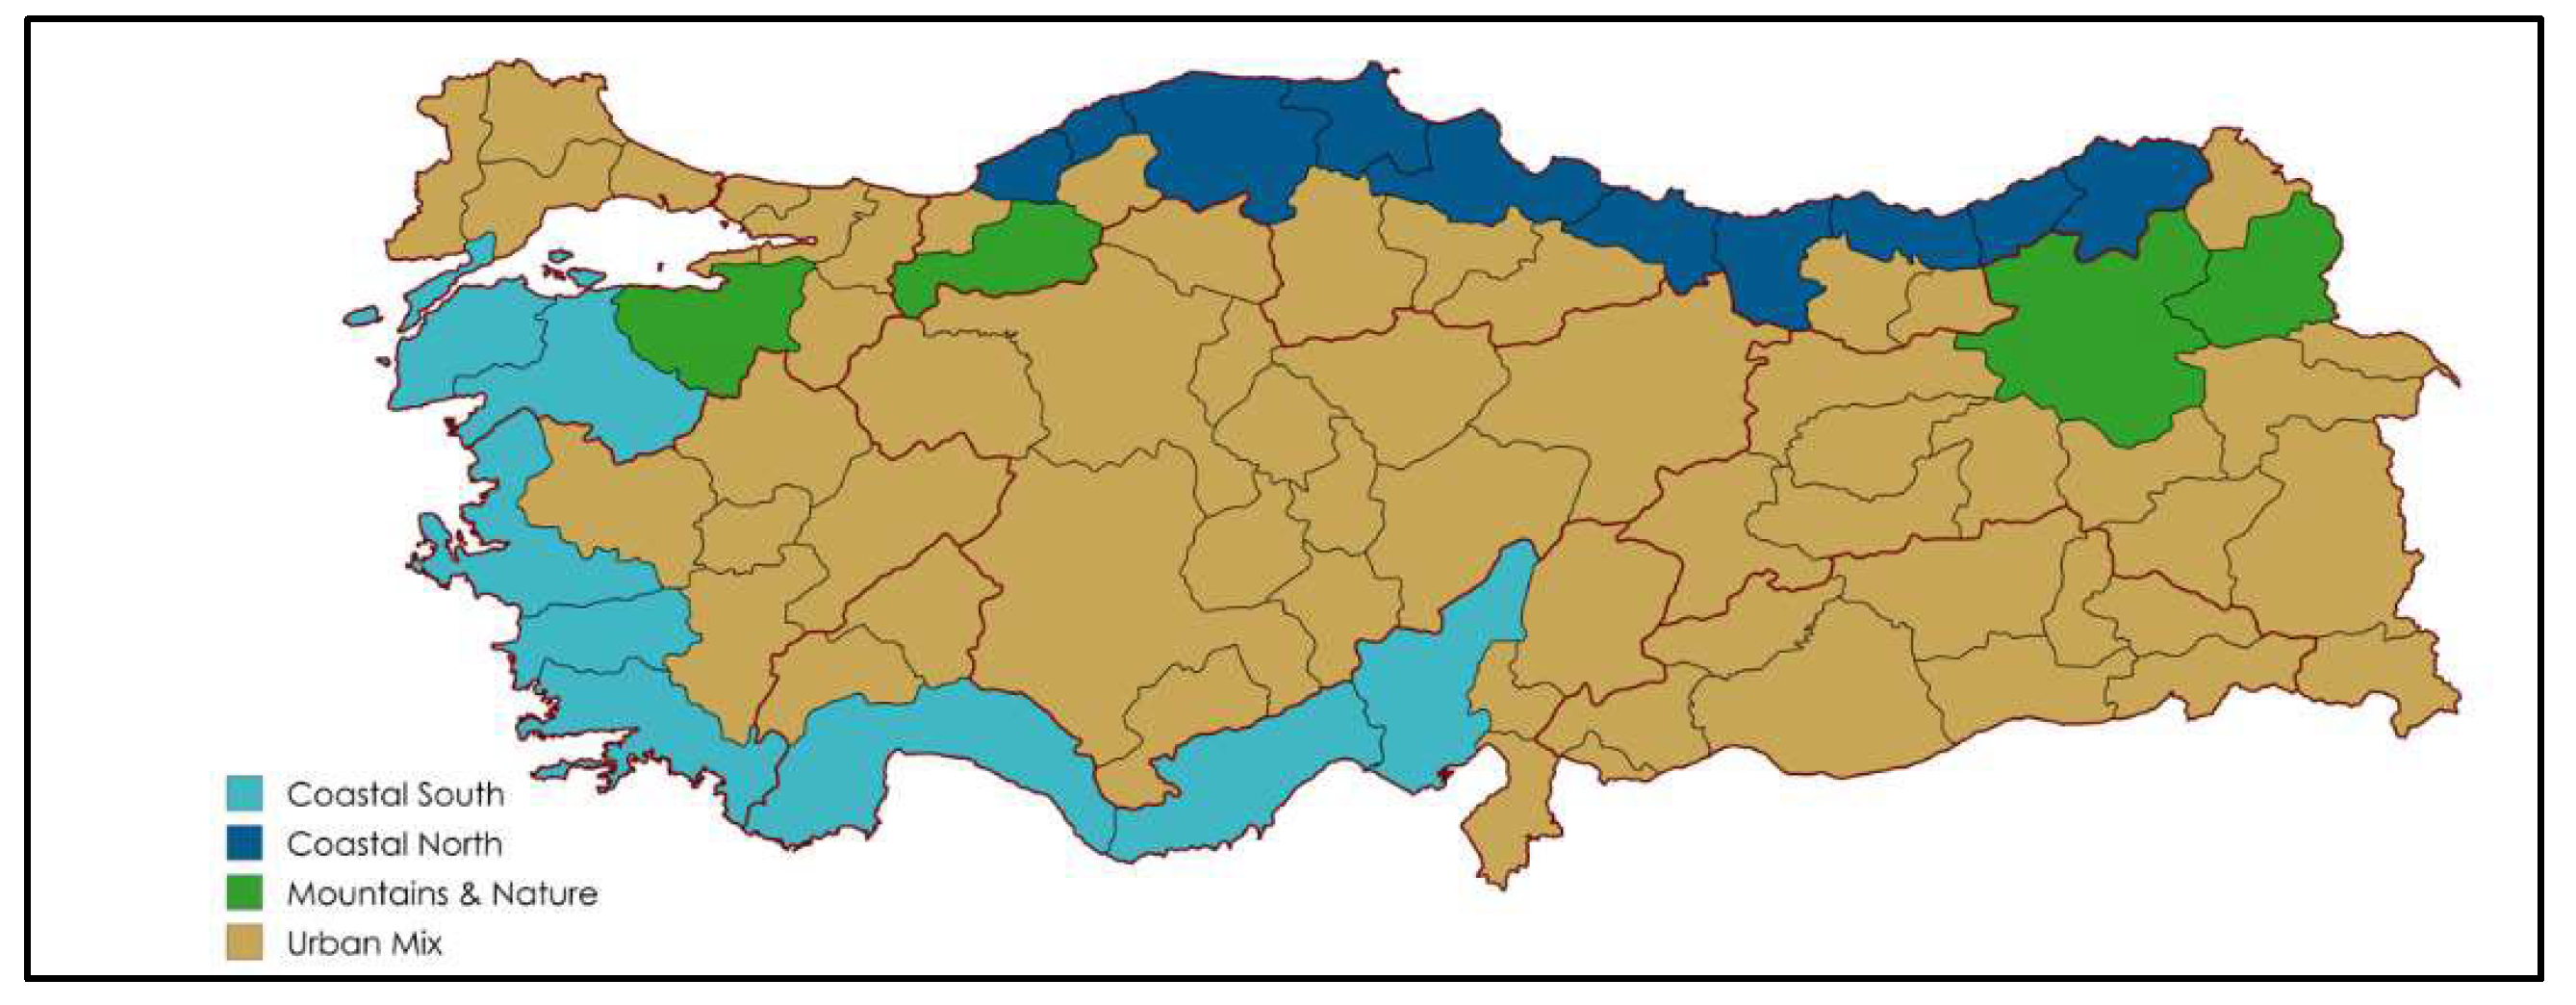
Tourism types are determined by examining the geographic characteristics and the distribution of bed nights within each province across the year. This type of tourism classification stems from four distinct categories according to the following definitions [20].
Coastal South: Provinces with coastlines along the Mediterranean and Aegean Seas—Adana, Antalya, Aydın, Balıkesir, Çanakkale, İzmir, Mersin, and Muğla—are classified under this category. In terms of tourism flows, these provinces exhibit a higher average share of bed nights during the summer season.
Coastal North: Provinces located along the Black Sea coast—Artvin, Bartın, Giresun, Kastamonu, Ordu, Rize, Samsun, Sinop, Trabzon, and Zonguldak—are included in this category. These provinces primarily attract domestic tourism during the summer months, driven not only by beach tourism but also by highland tourism, particularly in the eastern Black Sea region, where visitors travel to mountainous areas to escape high summer temperatures. Consequently, these provinces record higher average shares of bed nights during summer; however, the magnitude of tourism flows is comparatively lower than that observed in the Coastal South category.
Mountains and Nature: This category comprises provinces with established ski facilities that report higher average shares of bed nights during the winter season. Four provinces meet these criteria: Bolu, Bursa, Erzurum, and Kars.
Urban Mix: The remaining provinces that do not satisfy the criteria of the three aforementioned categories are classified as Urban Mix. This group represents the majority of provinces, ranging from metropolitan areas such as İstanbul and Ankara to less populated provinces such as Çankırı and Hakkari. Tourism activity in these provinces is more evenly distributed throughout the year and is primarily associated with cultural and historical sightseeing, which is relatively less sensitive to weather conditions.
Figure 1 presents the Turkish provinces classified by tourism types.
Figure 1.
Turkish provinces classified by type of tourism.
2. Methods
The climatological data used in this study cover the period 2000–2025 and were obtained from the meteorological 29 stations of Turkiye. To minimize potential inhomogeneities or discontinuities in the climate records—arising from factors such as instrumentation, or observational practices—quality control procedures were applied. These included detailed visual inspection of the data and cross-checking with records from neighboring meteorological stations to ensure consistency and reliability. Data used in this study are temperature (°C), humidity (%), precipitation (mm), sunshine (h), and wind speed (m/s).
2.1. Tourism Climate Index (TCI)
Mieczkowski developed the Tourism Climate Index (TCI) in 1985 [2], which is based on a combination of monthly mean or total values of key climatic variables, including wind speed, air temperature, relative humidity, precipitation, and solar radiation. These parameters are integrated to evaluate the overall climatic suitability of a destination for tourism activities. In constructing the index, Mieczkowski assumed that rainy days are generally unfavorable for tourists, thereby assigning lower scores to higher precipitation amounts. Although the potential effects of solar radiation were also considered—particularly because excessive sunshine can lead to adverse health impacts such as heat stress or sunburn—the explicit inclusion of solar radiation was ultimately excluded, as it would have made the index formulation overly complex. The Tourism Climate Index (TCI) provides a comprehensive tool for evaluating tourism climate resources by quantifying climatic suitability on a scale from −20 to 100. The scores explain the categories of TCI.
TCI = 2 [(4 * CID) + CIA + (2*P) + (2*S) + W]
In the TCI formulation, CID and CIA represent the Daytime Comfort Index and the Daily Comfort Index, respectively. P, S, and W denote precipitation (mm), daily sunshine duration (hours), and mean wind speed, respectively. In this formula, the greatest weight is assigned to the Daytime Comfort Index (CID) which reflects that the tourists are generally most active during daytime hours and that temperature plays a decisive role in determining climatic suitability. Moreover, Mieczkowski assumed that sunshine becomes undesirable when air temperatures exceed 33 °C, suggesting that temperatures above this threshold are excessively hot and therefore reduce thermal comfort for tourism activities. Table 1 presents the descriptions of the TCI scores [25].
Table 1.
Tourism Climate Index scores [28].
The TCI provides a systematic method for evaluating the tourism climate resources of destinations worldwide using a scale ranging from −20 to 100. This scale is divided into 11 descriptive categories, where scores of 50–59 indicate “acceptable” climatic conditions for tourism, 80–89 correspond to “excellent” conditions, and 90–100 represent “ideal” tourism climates (Table 2). Although the TCI was not originally designed for climate change research, it serves as a valuable empirical tool for assessing changing climatic conditions. By translating climatic variables into standardized comfort ratings, the index enables comparative analyses across different regions and time periods.
Table 2.
Rating Categories for Tourism Climate Index [25].
To convert raw meteorological raw data into a Tourism Climate Index (TCI) score, the Mieczkowski diagram and formula were utilized.
Example
Step 1—Meteorological observations
- Maximum daily temperature.
- Minimum relative humidity.
- Mean daily temperature.
- Mean relative humidity.
- Precipitation.
- Sunshine duration.
- Mean wind speed.
Step 2—Determine the sub-index ratings
Use the appropriate Mieczkowski rating diagrams or tables to obtain:
- CID: daytime comfort rating.
- CIA: daily comfort rating.
- P: precipitation rating.
- S: sunshine rating.
- W: wind rating.
Step 3: Rate precipitation
The rating scale used to assess the Daily Comfort Index is illustrated in Table 3
Table 3.
Rating scale (Daytime Comfort Index) and CIA (Daily Comfort Index).
Table 4 presents the inputs for the CID (Daytime Comfort Index) and CIA (Daily Comfort Index).
Table 4.
CID (Daytime Comfort Index) and CIA (Daily Comfort Index).
Step 5: Rate sunshine
Example:
| Sunshine (% possible) | Rating |
| >80% | 5 |
| 70–79% | 4.5 |
| 60–69% | 4 |
| 50–59% | 3 |
| <20% | 0 |
Step 5: Rate wind
Wind effects vary by temperature:
- In hot climates, moderate wind improves comfort.
- In cold climates, wind decreases comfort.
Example:
| Wind Speed (km/h) | Rating |
| 5–15 | 5 |
| 15–25 | 4 |
| >40 | 1–2 |
Step 6: Apply the TCI formula
After obtaining all ratings (0–5 scale):
where
- CID = Daytime Comfort Index
- CIA = Daily Comfort Index
- P = precipitation rating
- S = sunshine rating
- W = wind rating
Example Calculation
Suppose:
| Component | Rating |
| CID | 4.5 |
| CIA | 4.0 |
| P | 3.5 |
| S | 5.0 |
| W | 4.0 |
Then:
TCI = 86, which falls in the “excellent” category.
Although the TCI has been widely applied in tourism climatology, it has also been subject to considerable critique (16). A major limitation of the Tourism Climate Index (TCI) is that its variable ratings and sub-component weighting scheme are grounded in Mieczkowski’s subjective expert assessment and lack empirical validation against actual tourist preferences, thereby raising questions about its representativeness and generalizability [30,31].
2.2. Limitations of the Tourism Climate Index (TCI)
The Tourism Climate Index (TCI), developed more than four decades ago when access to comprehensive meteorological datasets was limited, relies primarily on monthly mean climatic variables and therefore may not adequately capture the temporal variability of meteorological conditions relevant to tourism. The use of monthly averages can obscure short-term fluctuations and extreme events, such as heatwaves, heavy precipitation, and strong winds, which may substantially influence tourists’ outdoor experiences and destination suitability. This limitation is particularly relevant in the context of climate change, as changes in the frequency, intensity, and duration of extreme weather events may not be adequately reflected in monthly mean values. Furthermore, the TCI has been criticized for placing relatively greater emphasis on thermal conditions while potentially underestimating the overriding effects of physical parameters, such as precipitation and wind, and esthetic parameters, such as sunshine and cloud cover. Its predetermined weighting scheme may also fail to account for differences in tourists’ climatic preferences, travel purposes, and adaptive responses across destinations and over time. Consequently, the assumption that the relative importance of individual climatic variables remains constant may limit the ability of the TCI to represent changing tourism climatic suitability under future climate conditions. Nevertheless, despite these recognized limitations, the TCI continues to be widely applied in academic research, with numerous studies using it to assess climatic suitability for tourism across different geographical contexts [32,33,34].
The exclusive use of the TCI in this study was justified by its suitability for tourism-oriented climate assessment and its relatively modest data requirements. The index integrates key climatic variables, including temperature, humidity, precipitation, sunshine, and wind, for which consistent data were available for the study area and period. In contrast, more advanced biometeorological indices, such as the Physiologically Equivalent Temperature (PET) and the Universal Thermal Climate Index (UTCI), require additional meteorological and physiological input parameters, including information on radiation and wind conditions, which were not fully available in the dataset [35]. Although PET and UTCI offer a more detailed assessment of human thermal stress, their application was beyond the scope of this study because of data limitations. Accordingly, the results should be interpreted as an assessment of general climatic suitability for tourism rather than a direct measure of physiological thermal comfort or tourists’ responses to individual weather conditions. Moreover, the use of monthly mean variables and fixed index weightings may limit the identification of short-term climatic extremes and changes in the relative importance of climatic factors under climate change. Future research could address these limitations by incorporating daily or sub-daily meteorological data, examining extreme weather events, and comparing TCI results with PET, UTCI, or other context-appropriate thermal comfort indices. Sensitivity analyses using alternative weighting schemes could also help determine the robustness of tourism climate assessments under changing climatic conditions.
2.3. Data Used
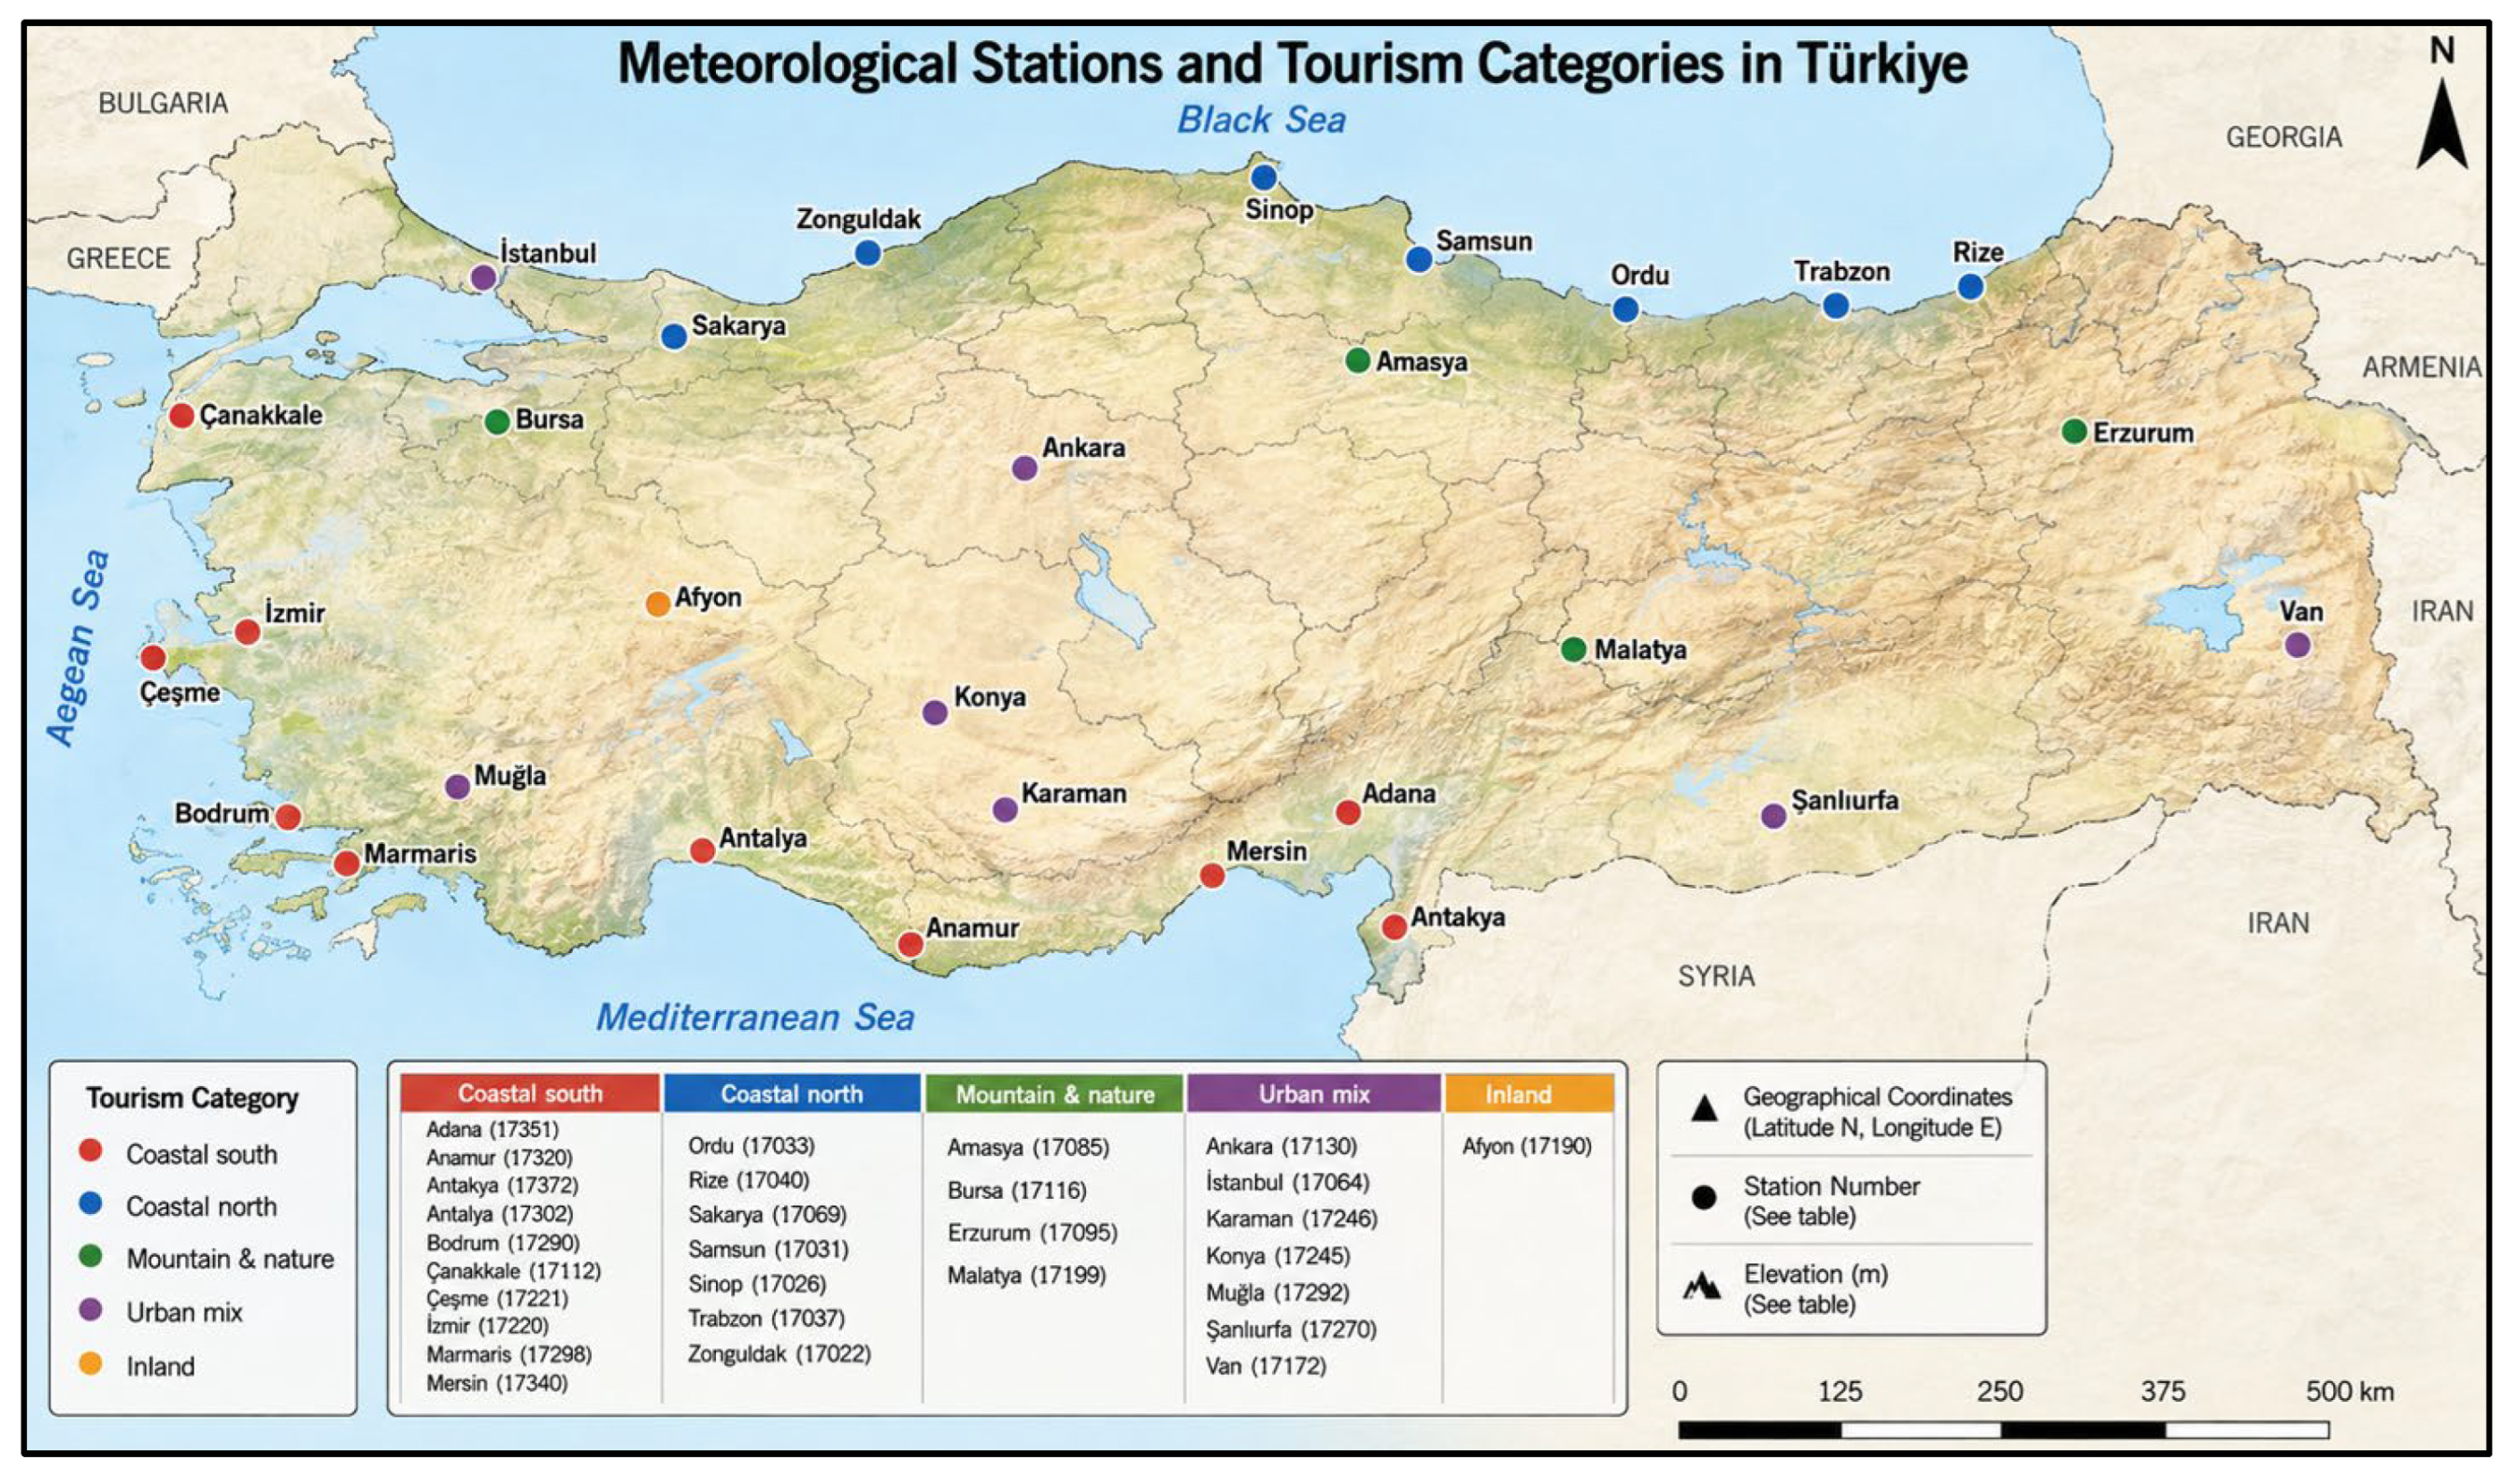
While the study primarily focuses on the coastal tourism dynamics of Türkiye, a balanced network of 29 stations was selected. Among these, coastal stations directly evaluate the primary tourism zones, whereas selected interior and eastern stations (e.g., Ankara, Erzurum, Konya) are integrated into the analysis as continental reference cases to provide a comparative baseline against coastal microclimatic variations. The climatological data used in this study were obtained from the Meteorological General Directorate of Türkiye and cover the period 2000–2025. The dataset consists of observations from a network of 29 meteorological stations representing nearly all regions of Türkiye. The stations were selected to ensure spatial representativeness, with particular emphasis on the Mediterranean, Aegean, and Black Sea coastal areas. To minimize potential inhomogeneities or discontinuities in the climate records; visual inspection was applied. The dataset contained only negligible amounts of missing data, which were considered not to affect the reliability of the analysis. Table 5 shows the station names, coordinates, number, and elevation, highlighting the complex terrain height that influences climatic variability.
Table 5.
Station name and coordinates of used meteorological stations.
The coastal areas of the Mediterranean region in southern Türkiye are separated from Central Anatolia by the South Anatolian Mountains, where elevations reach up to 3000 m. Likewise, the North Anatolian Mountains, running parallel to the Black Sea coast, rise to elevations of approximately 4000 m. Between these two mountain ranges lies the Central Anatolian Plateau, characterized by varied elevations. Moreover, topographic influences, particularly those associated with mountainous terrain, substantially complicate climate variability by affecting atmospheric circulation, temperature distribution, and precipitation patterns.
Figure 2 illustrates the spatial distribution of the selected meteorological stations. The meteorological variables analyzed in this study include wind speed (m s−1), relative humidity (%), air temperature (°C), precipitation (mm), and sunshine duration (h).
Figure 2.
Map of the meteorological stations used in the study.
2.4. Mann–Kendall Trend Test
Non-parametric statistical tests, such as the Mann–Kendall trend test, are widely used for detecting trends in meteorological variables because they are distribution-free and provide robust results in the presence of non-normality, outliers, and missing observations, which are typical of long-term climate records. To investigate the temporal trends in Tourism Climate Index (TCI) values, the non-parametric Mann–Kendall (MK) trend test was applied to TCI time series from meteorological stations located along the Mediterranean and Aegean coasts of Türkiye. The Mann–Kendall (MK) test is a non-parametric statistical test used to determine whether there is a monotonic trend (consistently increasing or decreasing) in a time series. It is one of the most widely used methods in hydrology, climatology, and meteorology [35,36,37]. A comprehensive reference on the impacts of climate change on tourism, including the application of trend analysis methods, is provided [38]. Temporal trends in the Tourism Climate Index (TCI) were evaluated using the non-parametric Mann–Kendall trend test. The magnitude of significant trends was estimated using Sen’s slope estimator [39]. This approach has been widely adopted in tourism climatology to assess long-term changes in tourism [40]. The results of the present study are consistent with those reported in Reference [41]. The Mann–Kendall (MK) trend test is a widely used non-parametric statistical method for detecting monotonic trends in meteorological and climatological time series. Unlike parametric tests, the MK test does not require the data to follow a normal distribution and is less sensitive to outliers and missing values. The test statistic, , is calculated by comparing each observation with all subsequent observations in the time series. For each pair of observations, a value of +1 is assigned if the later observation is greater than the earlier one, −1 if it is smaller, and 0 if the two observations are equal. The sum of these values constitutes the Mann–Kendall tatistic. A positive value of indicates an increasing trend, a negative value indicates a decreasing trend, and a value close to zero suggests no monotonic trend. The statistical significance of the observed trend is subsequently evaluated using the standardized test statistic () and its corresponding p-value.
where
The variance of the Mann–Kendall test statistic () is calculated to determine the statistical significance of the observed trend. Using the variance, the standardized test statistic () is computed, and the corresponding two-tailed p-value is obtained from the standard normal distribution. The null hypothesis () assumes that no monotonic trend exists in the time series, whereas the alternative hypothesis () assumes the presence of a significant monotonic trend. If the p-value is smaller than the selected significance level (), then the null hypothesis is rejected, indicating that the observed trend is statistically significant. In this study, significance levels of 0.01, 0.05, and 0.10 were adopted. Accordingly, a p-value < 0.01 indicates a highly significant trend, indicates a significant trend at the 5% level, and indicates a marginally significant trend at the 10% level. When , the trend is considered statistically insignificant.
The variance of S (in the following equation) is calculated to determine the standardized test statistic, Z. The Z value is then computed using the equation below and compared with the standard normal distribution to obtain the corresponding probability value (p-value). For a two-tailed test, the resulting probability is multiplied by two to obtain the final p-value. The statistical significance of the trend is assessed by comparing the p-value with the predetermined significance level. If the p-value is less than the selected significance level (α), then the null hypothesis of no trend is rejected, indicating that a statistically significant trend exists in the data. Conversely, if the p-value exceeds the significance level, then the null hypothesis cannot be rejected, suggesting that no statistically significant trend is present. Specifically, a p-value less than 0.01 indicates a significant trend at the 1% significance level, a p-value between 0.01 and 0.05 indicates significance at the 5% level, and a p-value between 0.05 and 0.10 indicates significance at the 10% level. When the p-value is greater than 0.10, the observed trend is considered statistically insignificant.
Interpretation:
: increasing trend
: decreasing trend
2.5. Sen Slope Method
The Sen’s Slope Estimator (also called Theil–Sen estimator when applied to regression) was independently proposed by Henri Theil and Pranab Kumar Sen and is commonly used together with the Mann–Kendall trend test to estimate the magnitude of a monotonic trend in meteorological, hydrological, climatological, and environmental time series [42,43,44,45].
Calculate the slope between every possible pair:
for
For 26 years,
pairwise slopes are calculated. The Sen slope is simply the median of these 325 slopes.
Interpretation:
- Positive → increasing TCI
- Negative → decreasing TCI
3. Results
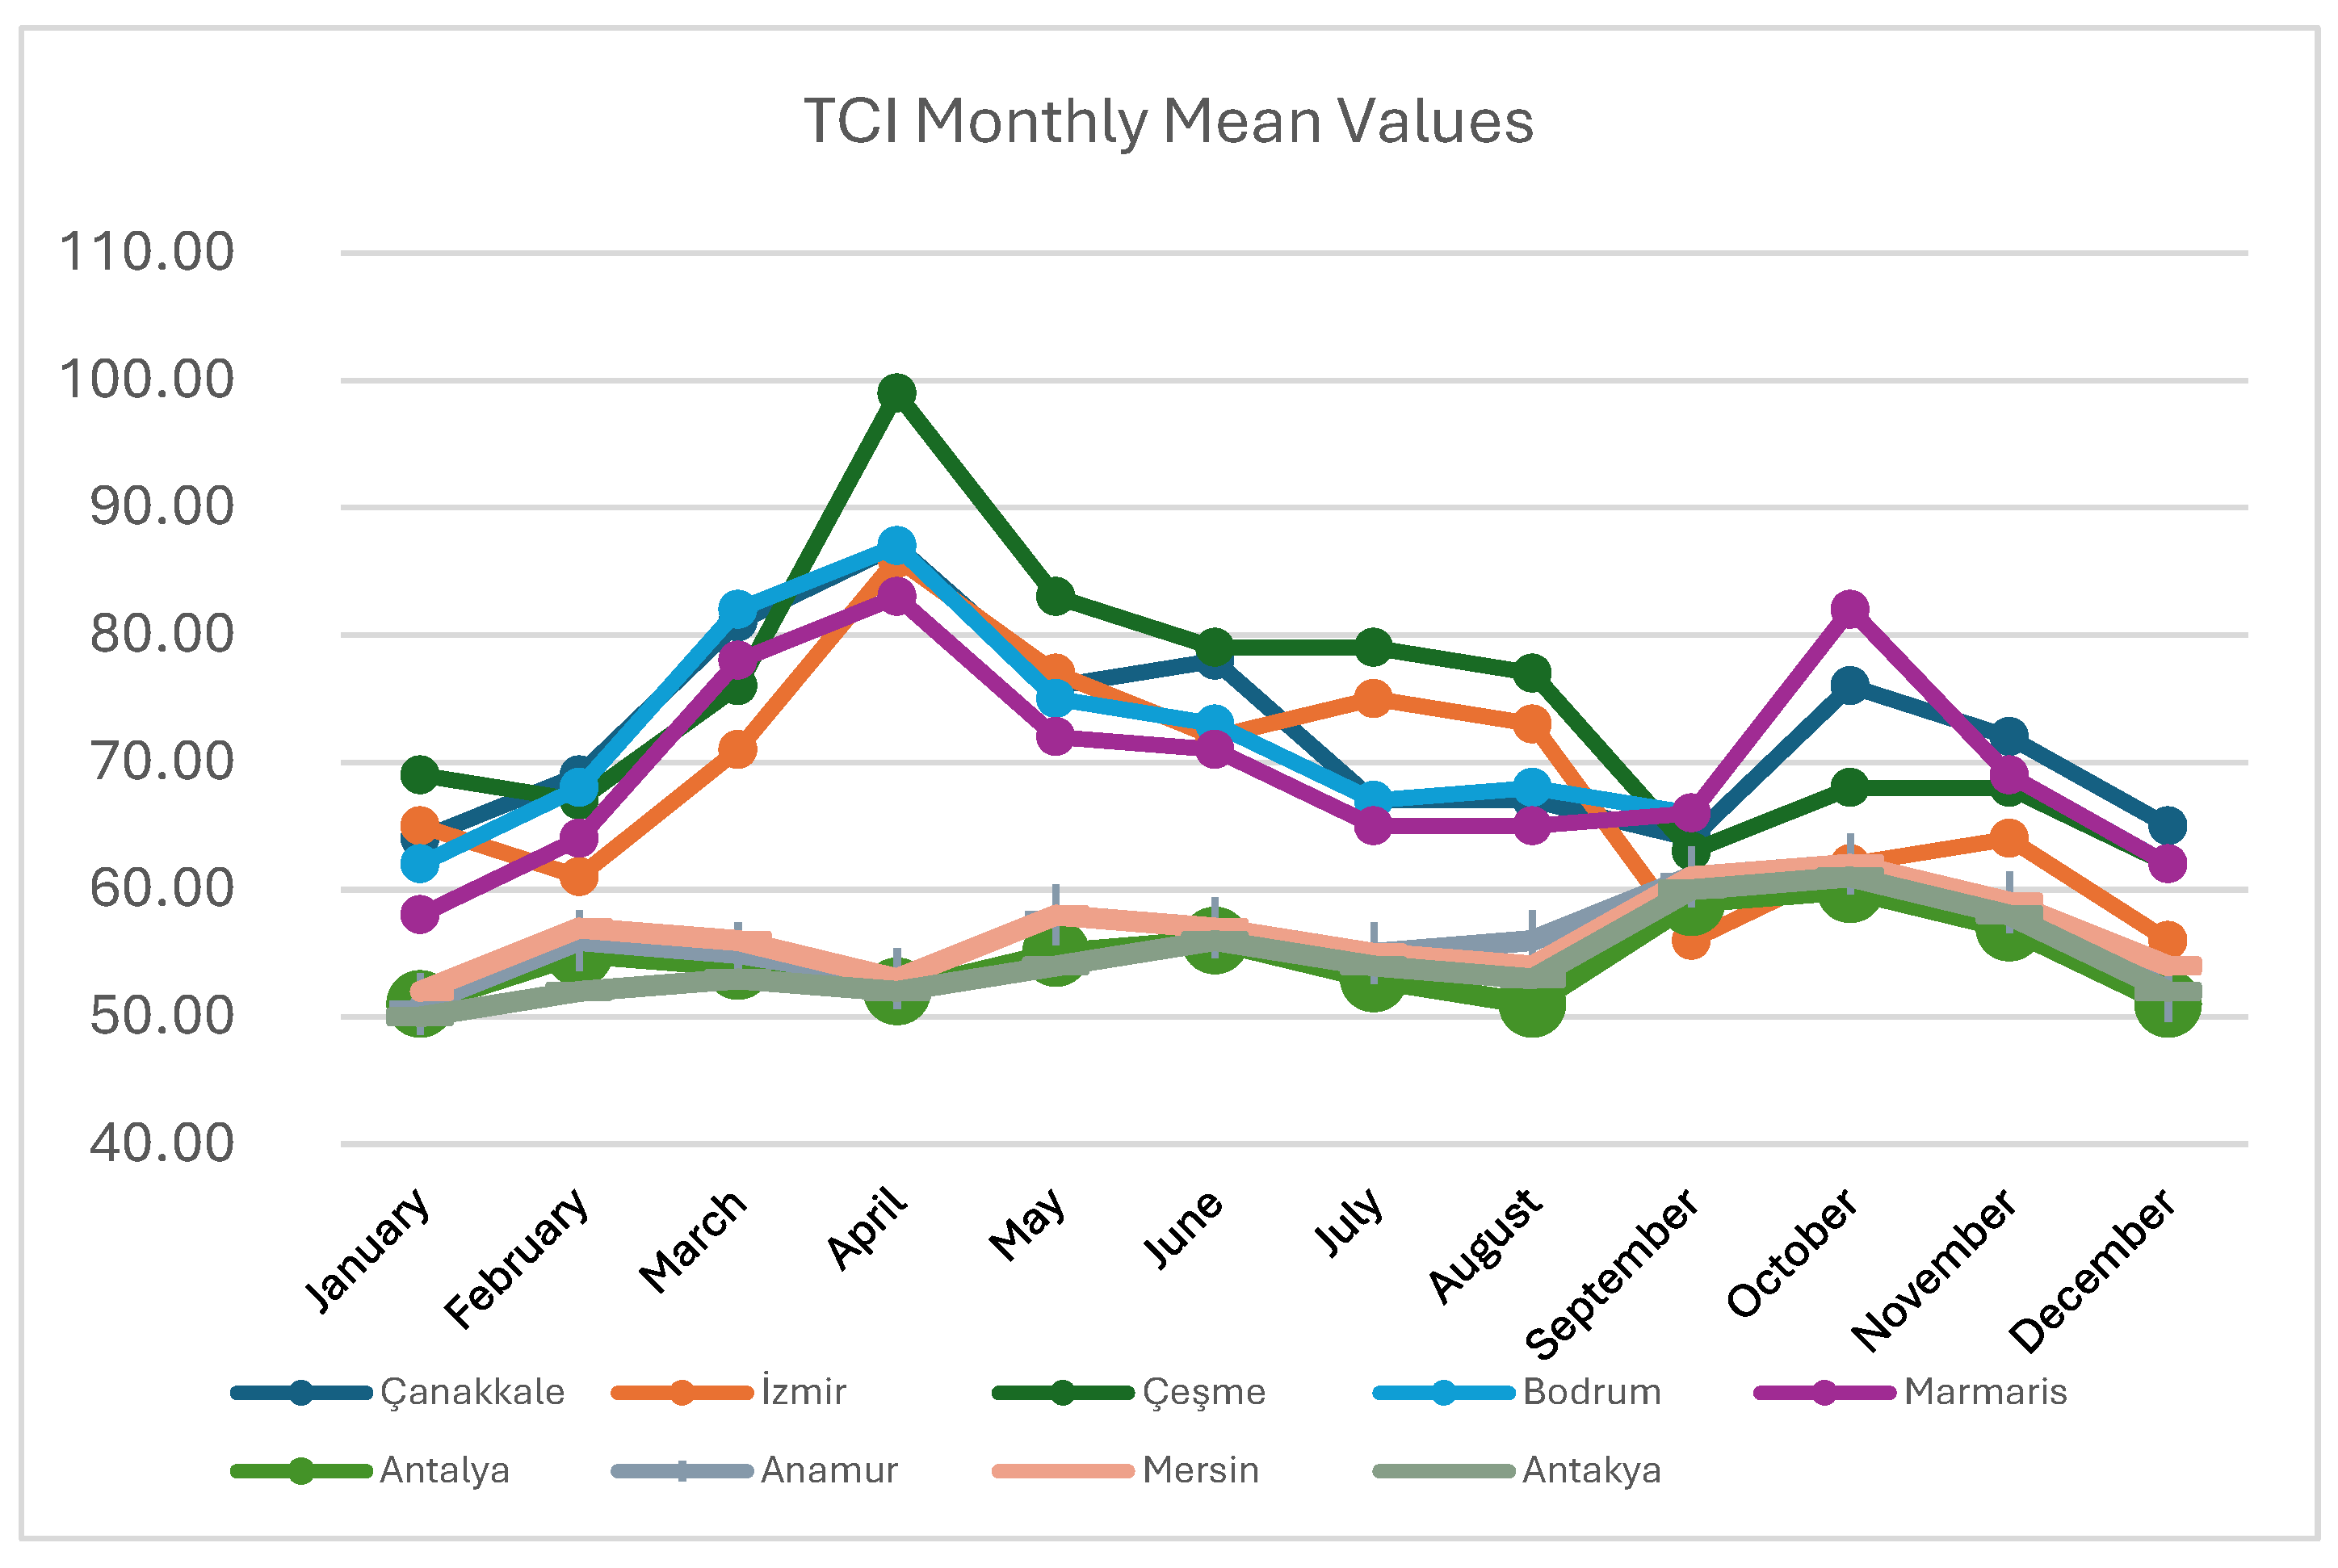
The monthly and annual mean values of the Tourism Climate Index (TCI) for the selected stations between Çanakkale and Antakya are presented in Table 6. Among these destinations, Bodrum and Marmaris are internationally recognized tourism and yachting centers located in the southwestern Aegean Region. Both destinations are characterized by particularly favorable climatic conditions during the spring and autumn seasons. The calculated TCI scores for Bodrum reveal a bimodal distribution, with pronounced peaks occurring in spring and autumn. In contrast, Marmaris exhibits an approximately optimal distribution, with only one month falling below a TCI threshold of 60, indicating generally favorable climatic conditions for tourism throughout most of the year. Overall, TCI scores are slightly higher in Bodrum than in Marmaris. For example, Bodrum records values exceeding 87 in May, whereas Marmaris reaches approximately 83 in April. The autumn peaks, ranging between 75 and 77, are relatively similar for both destinations, reflecting comparable climatic suitability for tourism during the autumn season. When the values of the Tourism Climate Index (TCI) along the Mediterranean Coast are evaluated, notable differences among destinations become evident. In Antalya, the annual average TCI score has been approximately 55 over a 25-year period, indicating moderate climatic suitability for tourism on an annual basis.
Table 6.
The monthly mean TCI scores for selected locations.
Anamur (32.50° E, 36.40° N), located on the Mediterranean coast, exhibits a trimodal distribution of TCI values, with scores exceeding 60, particularly during the autumn months, suggesting favorable climatic conditions for tourism during this period.
Mersin, another major coastal city on the Mediterranean, demonstrates a markedly different pattern of TCI variation. The city records at least six months with trimodal tourism climate conditions. These periods correspond to TCI values that indicate favorable climatic conditions for tourism activities. Overall, Mersin displays a climatic suitability pattern compared with nearby Antalya, highlighting the spatial variability of tourism climate conditions along the Mediterranean coast of Türkiye.
The values of the Tourism Climate Index (TCI) indicate that the Aegean coastal zone generally exhibits more favorable tourism climate conditions than the Mediterranean coastal zone. The seasonal variation in average TCI scores shows a similar pattern across several Aegean destinations, including Çeşme, İzmir, and Çanakkale. In these locations, the highest TCI values tend to occur during the transitional seasons, particularly in spring and autumn, indicating optimal climatic conditions for tourism during these months. The higher TCI scores observed in the Aegean coastal zone compared with the Mediterranean coastal zone are primarily associated with differences in thermal comfort conditions during the tourism season. The Mediterranean coast experiences higher summer temperatures, which can reduce daytime comfort and negatively affect the thermal components of the TCI. In contrast, the Aegean coast generally benefits from slightly lower temperatures and higher wind regimes, particularly during summer, which help moderate heat stress and improve overall climatic comfort. While both regions receive abundant sunshine and relatively low precipitation during the peak tourism season, variations in temperature and wind conditions appear to be the main factors driving the spatial differences in TCI values.
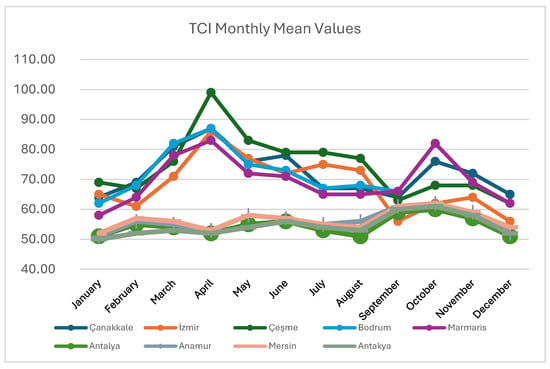
These climatic differences have implications for different forms of tourism. For beach tourism, the warmer Mediterranean climate may remain attractive despite occasional thermal discomfort, whereas the more moderate conditions of the Aegean coast can provide greater comfort for extended outdoor activities. For urban sightseeing and nature-based tourism, lower temperatures and improved ventilation in the Aegean region are likely to enhance visitor comfort, particularly during summer. Furthermore, the more balanced climatic conditions of the Aegean coast may support a longer tourism season during spring and autumn, whereas excessive summer heat in parts of the Mediterranean region may constrain comfort levels outside traditional beach-oriented tourism activities. The relatively lower temperatures and higher wind speeds observed in the Aegean region of Türkiye, compared to the Mediterranean region, contribute to more favorable TCI outcomes. This pattern suggests that moderate temperatures, lower humidity levels, and comfortable wind conditions during transitional periods enhance the climatic suitability for outdoor tourism activities, making these destinations especially appealing for visitors outside the peak summer season, as shown in Figure 3.
Figure 3.
Mean TCI values for the selected stations (2000–2025).
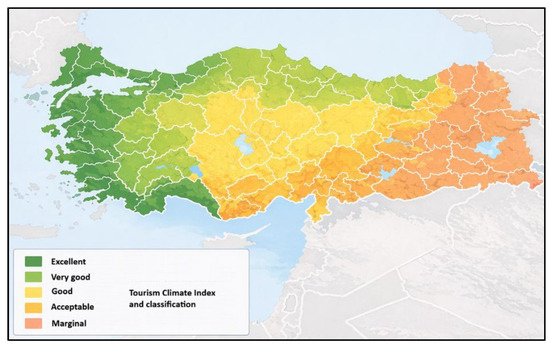
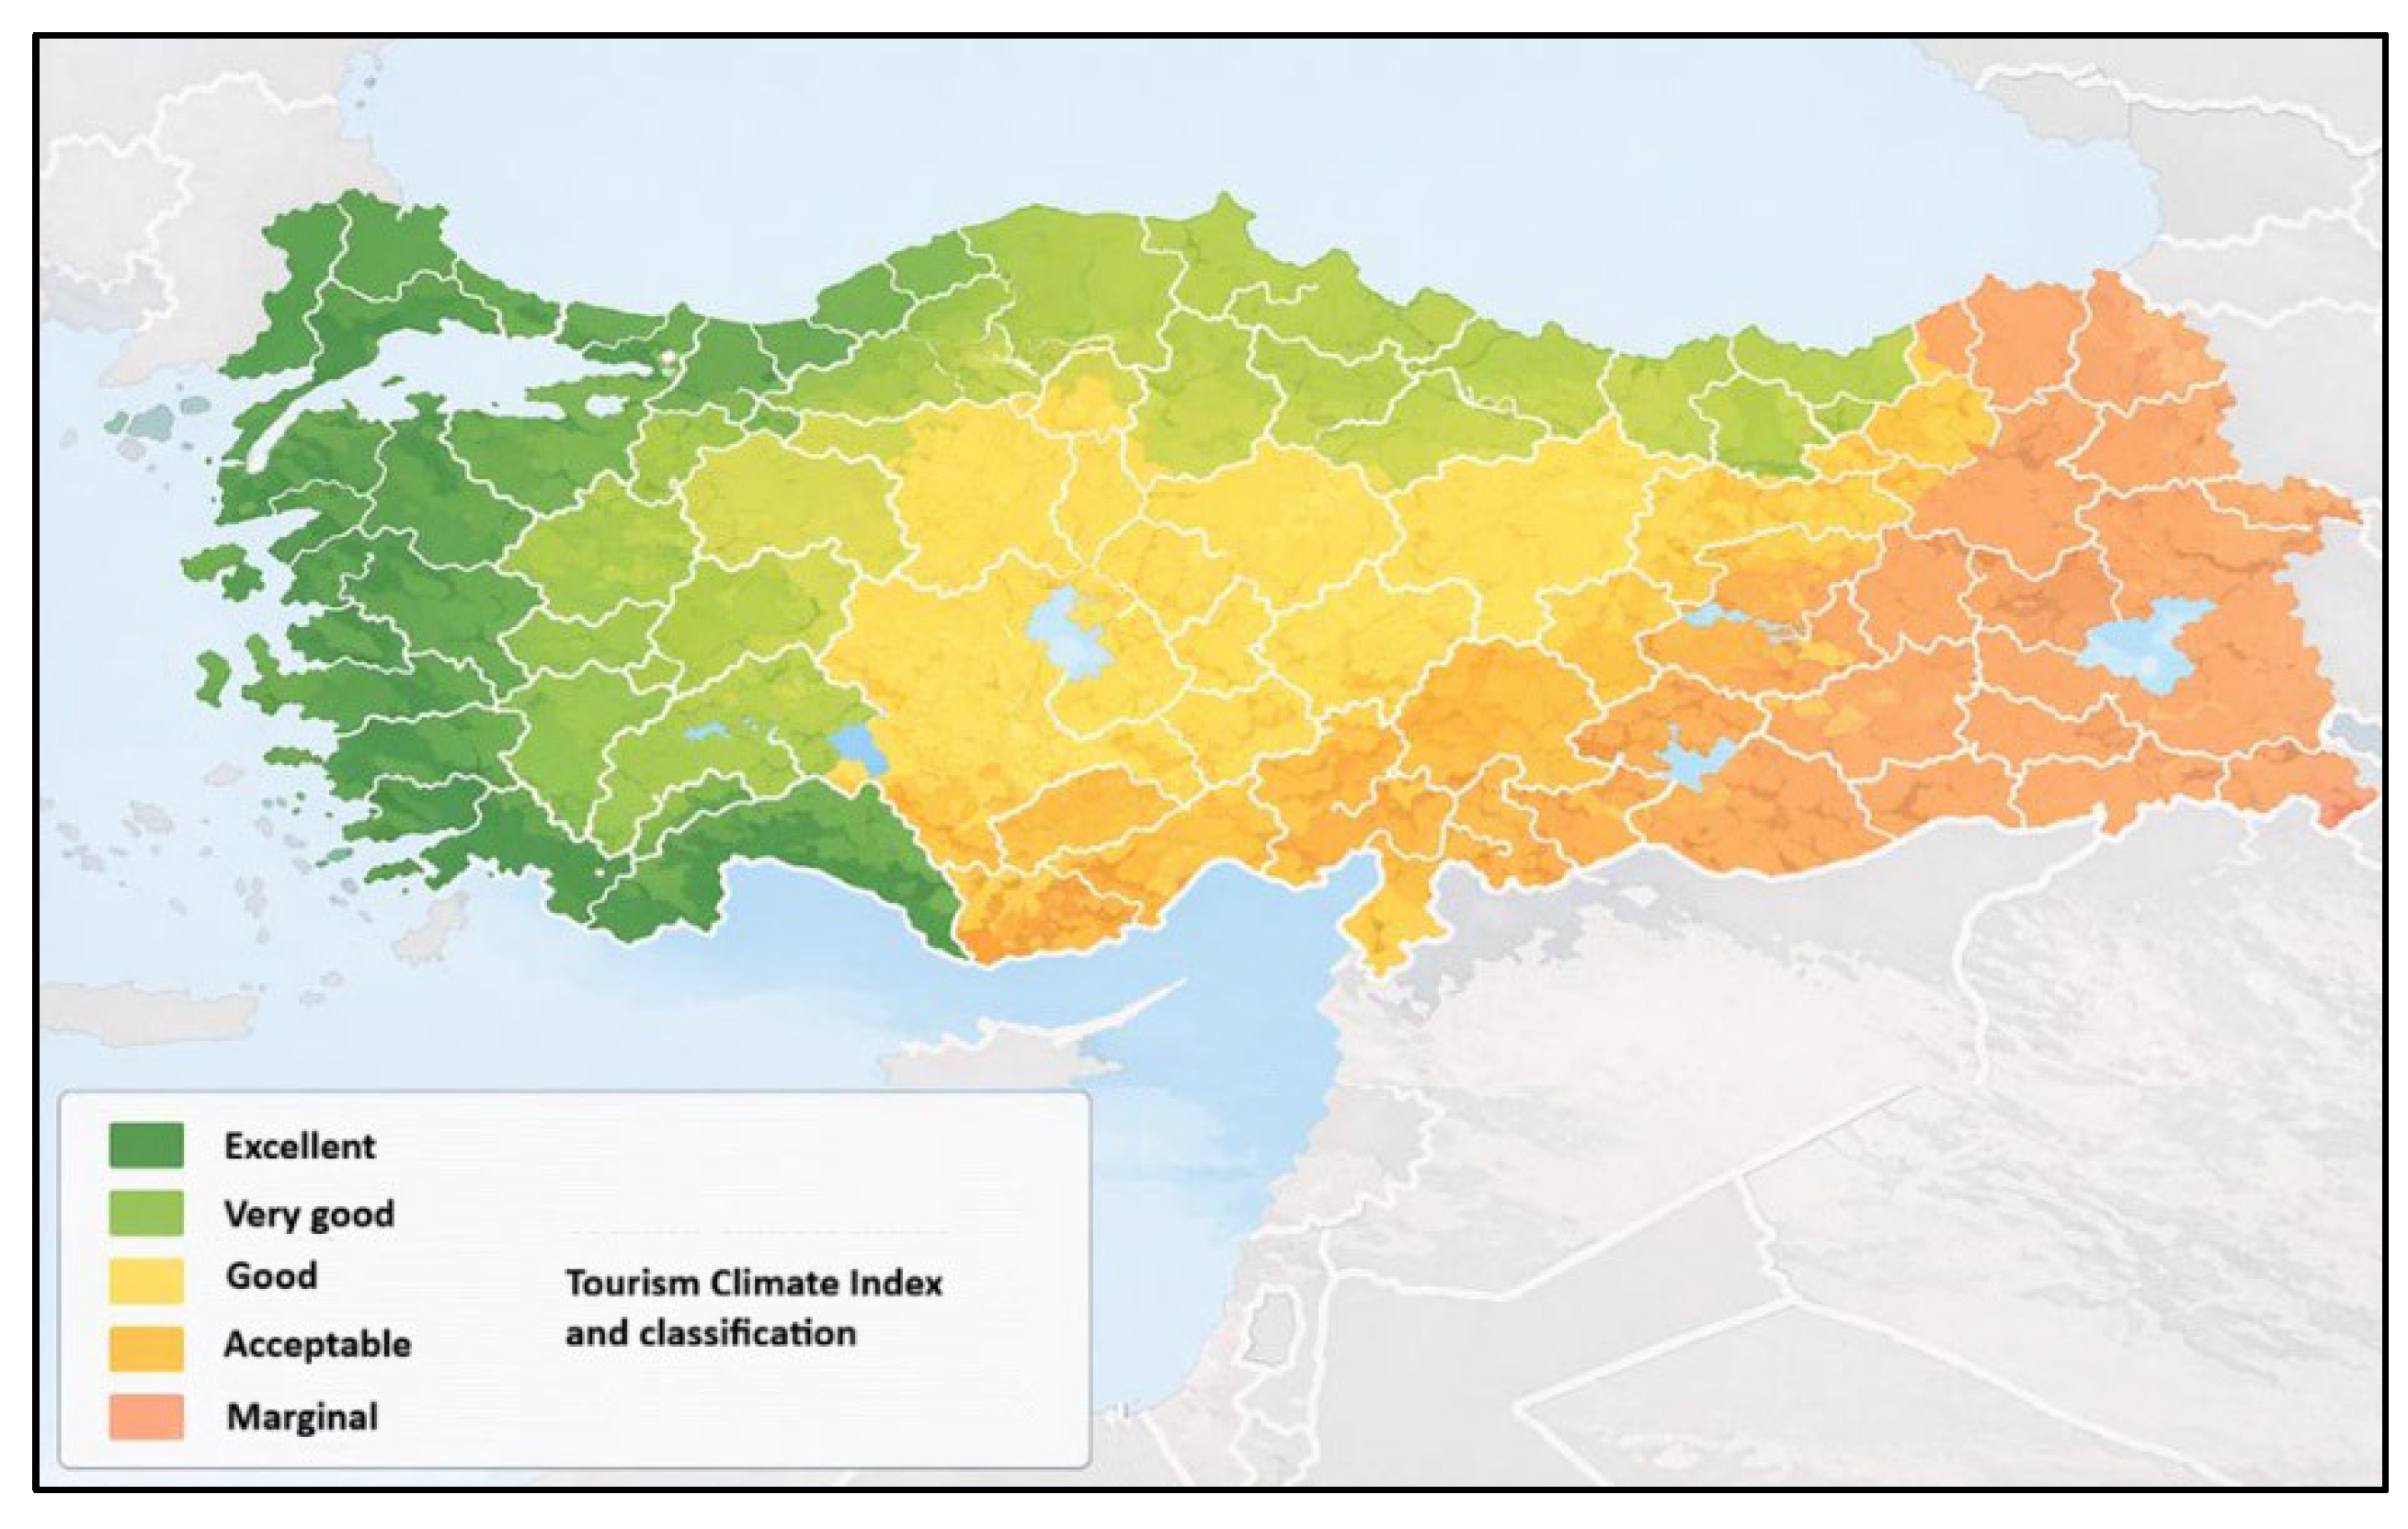
The provincial TCI values for the stations examined are presented in Figure 4. The figure represents station-level classifications, a spatial interpolation of station-derived TCI values. The results indicate that the Aegean and Marmara regions exhibit excellent tourism climate conditions, while the Black Sea Region demonstrates very good conditions and Central Anatolia shows good conditions according to the TCI classification. In contrast, eastern and southeastern parts of Türkiye fall within the marginal category. Contrary to expectations, the Rize and Artvin provinces in the eastern Black Sea region did not achieve higher TCI scores and were classified within the marginal category. This outcome is likely related to the climatic characteristics of the region, particularly its high precipitation frequency, persistent cloud cover, and limited sunshine duration, all of which negatively affect several components of the TCI. In addition, local topographic conditions and the location of meteorological stations may influence the recorded climatic parameters and, consequently, the calculated TCI values.
Figure 4.
Mean TCI values for the stations (2000–2025).
Table 7 presents the results of the Mann–Kendall trend test and Sen’s slope estimator for the Tourism Climate Index (TCI) across the selected coastal meteorological stations. The Mann–Kendall test revealed statistically significant decreasing trends (p < 0.001) at seven of the eight stations, indicating a consistent decline in TCI during the study period.
Table 7.
Mann–Kendal and Sen’s slope test results.
4. Discussion
This study examined the Tourism Climate Index (TCI) across 29 meteorological stations in Türkiye during the period 2000–2025, with particular attention to temporal trends at eight selected coastal stations. The findings provide a descriptive overview of the spatial and temporal characteristics of tourism-related climatic conditions across the study area. The results also highlight differences in the temporal evolution of TCI values among coastal destinations. The trend analysis revealed statistically decreasing trends in TCI values at seven of the eight selected coastal stations. The estimated Sen’s slope values ranged from −0.18 to −0.28 TCI units per year. Marmaris was the only station that did not exhibit a statistically significant trend (p = 0.73). However, the observed trends should be interpreted as changes in the index rather than direct evidence of changes in tourists’ physiological comfort, satisfaction, or destination preferences. The differences among coastal stations suggest that the temporal evolution of tourism-related climatic conditions is not uniform across Türkiye. Such spatial variation is important for tourism planning because destinations may experience different climatic conditions even within the same broader coastal region. Nevertheless, the present analysis does not establish the specific physical or climatic mechanisms responsible for the observed trends. Further research incorporating more detailed meteorological variables and regional analyses would be needed to investigate these mechanisms. The findings must also be considered in relation to the characteristics and limitations of the TCI. The index combines daytime and daily thermal comfort components with precipitation, sunshine, and wind. This approach provides a practical means of summarizing several climatic variables relevant to outdoor tourism. However, the index relies on predefined ratings and weighting schemes and does not directly measure human physiological responses. In addition, its use of monthly average climatic conditions may obscure short-term variations and episodes of extreme heat that can influence the experience of visitors. These limitations are particularly relevant when interpreting tourism suitability under changing climatic conditions. Although the TCI provides a useful descriptive indicator for comparing climatic conditions across locations and periods, its values should not be treated as direct measurements of thermal stress or as evidence of tourists’ actual perceptions. Physiologically based approaches, such as the Physiological Equivalent Temperature (PET) and the Universal Thermal Climate Index (UTCI), offer alternative frameworks for examining human thermal conditions. Their application generally requires additional meteorological inputs that were not available in the dataset used for this study.
An important implication is that the results should be used as an initial assessment of tourism-related climatic conditions rather than as a validated measure of tourist comfort. The study did not compare TCI values with visitor surveys, observed tourist behavior, or physiological measurements. Therefore, the extent to which the calculated index corresponds to tourists’ actual experiences remains uncertain. This distinction is important for destination managers and policymakers who may wish to use climate indices to inform tourism planning, seasonal promotion, or adaptation strategies. Future research could strengthen the interpretation of these findings by combining TCI calculations with visitor surveys and destination-level tourism data. Where suitable meteorological observations are available, comparisons with PET and UTCI could also help establish whether the spatial and temporal patterns identified by the TCI are consistent with those produced by physiologically based indices. Such comparisons would provide a stronger basis for assessing the applicability of different climate indicators to tourism research in Türkiye.
An additional limitation of the Tourism Climate Index (TCI) is its limited ability to represent the impacts of extreme heat events on tourism climatic suitability. Because the TCI is generally calculated using monthly mean meteorological variables, it may mask short-term temperature extremes, heatwaves, and unusually hot days that can cause thermal discomfort during peak tourism periods. Furthermore, monthly averages do not adequately capture the duration of extreme heat events or intraday variations in thermal exposure, which may substantially influence tourists’ outdoor activities, comfort, and destination choices. This limitation is particularly important in the context of climate change, as increasing temperatures and changes in the frequency and intensity of extreme heat events may alter the climatic suitability of tourism destinations in ways that are not fully reflected by monthly TCI values. Therefore, although the TCI provides a useful basis for comparing general climatic suitability across destinations and periods, it should not be used as a stand-alone indicator of heat-related risks or as the sole basis for future climate adaptation planning. A more comprehensive assessment could combine TCI with daily or hourly meteorological data, extreme-heat indicators, and physiological thermal comfort indices, such as the Physiologically Equivalent Temperature (PET) and the Universal Thermal Climate Index (UTCI). In addition, integrating future climate projections with these complementary indicators could help identify periods of heightened heat stress, assess potential changes in tourism seasonality, and support the development of more effective adaptation strategies for tourism destinations.
The negative Z values, ranging from approximately −5.8 to −6.1, together with strongly negative Kendall’s τ coefficients (−0.95 to −0.98), indicate a downward trend in climatic suitability for tourism. The Sen’s slope estimates further quantify the magnitude of the decline. Antalya and Antakya exhibited the largest decreases, with Sen’s slope values of −0.28 TCI units per year, closely followed by Mersin (−0.27 TCI units per year). İzmir, Çeşme, and Bodrum each showed a decline of approximately −0.20 TCI units per year, while Çanakkale experienced a slightly smaller decrease of −0.18 TCI units per year. In contrast, Marmaris did not exhibit a statistically significant trend (Z = −0.35, p = 0.73). Although the Sen’s slope was slightly negative (−0.01 TCI units per year), the weak Kendall’s τ value (−0.05) indicates that the observed change is negligible and likely attributable to natural interannual variability rather than a persistent long-term trend. Overall, the results demonstrate a widespread and statistically significant reduction in Tourism Climate Index values across the majority of the study stations. The combination of highly Mann–Kendall statistics and Sen’s slope estimates show declining trend observed at Antalya, Antakya, and Mersin. These results are consistent with studies from other Mediterranean destinations like the Croatian coast (45, 46) and Bosnia and Herzegovina (23).
5. Conclusions
This study examined tourism-related climatic conditions at 29 meteorological stations across Türkiye for the period 2000–2025 using the Tourism Climate Index (TCI). It also investigated temporal trends at eight selected coastal stations using the Mann–Kendall trend test and Sen’s slope estimator. The results provide a descriptive assessment of spatial and temporal variation in TCI values and contribute to the understanding of tourism-related climatic conditions across the study area.
The trend analysis identified statistically significant decreasing trends at seven of the eight coastal stations examined. Sen’s slope estimates ranged from −0.18 to −0.28 TCI units per year, while Marmaris showed no statistically significant trend (p = 0.73). These findings indicate that TCI values declined at most of the selected coastal stations during the study period. However, the results represent trends in the index and should not be interpreted as direct evidence of changes in tourists’ thermal comfort, satisfaction, or travel behavior.
Several limitations should be acknowledged. First, the study relied on the TCI, an index based on predefined ratings and weights that have not been empirically validated against tourist preferences or physiological measurements in this research. Second, the use of monthly average meteorological data may not capture short-term climatic variability or extreme conditions. Third, the analysis did not compare TCI results with physiologically based indices such as PET or UTCI, because the additional meteorological inputs required for such calculations were not available in the dataset. Finally, no visitor survey or other direct measure of tourists’ experiences was included.
These limitations define the scope of the conclusions that can be drawn from the study. The findings demonstrate patterns in TCI values across the selected stations, but they do not independently validate the index as a measure of tourists’ actual climatic preferences or thermal comfort. Accordingly, the results are best understood as a descriptive assessment rather than a validation of the TCI.
Future studies should incorporate visitor surveys to examine the relationship between TCI values and tourists’ perceived comfort and destination preferences. Where data availability permits, comparisons with PET and UTCI would help evaluate the consistency of different climate assessment approaches. Further research could also use higher-temporal-resolution meteorological data and investigate future climatic conditions under regional climate scenarios. These extensions would provide a more comprehensive basis for evaluating tourism-related climatic conditions and supporting climate adaptation planning in Türkiye.
Funding
This research received no external funding.
Institutional Review Board Statement
Not applicable.
Informed Consent Statement
Not applicable.
Data Availability Statement
The data supporting the conclusions of this article will be made available by the author on request.
Conflicts of Interest
The author declare no conflict of interest.
References
- World Meteorological Organization (WMO). State of the Global Climate 2021; WMO-No. 1290; WMO: Geneva, Switzerland, 2021; Available online: https://library.wmo.int/index.php?lvl=notice_display&id=22080 (accessed on 2 April 2026).
- Mieczkowski, Z. The tourism climate index: A method for evaluating world climates for tourism. Can. Geogr. 1985, 29, 220–233. [Google Scholar] [CrossRef] [Scilit]
- Georgopoulou, E.; Mirasgedis, S.; Sarafidis, Y.; Hontou, V.; Gakis, N.; Lalas, D.P. Climatic Preferences for Beach Tourism: An Empirical Study on Greek Islands. Theor. Appl. Clim. 2019, 137, 667–691. [Google Scholar] [CrossRef] [Scilit]
- Bax, V.; van de Lageweg, W.I.; de Groot, S.; Moerbeek, W. Beach User Perspectives on the Upscaling of Sand Nourishments in Response to Sea Level Rise—A Discrete Choice Experiment. Ocean Coast. Manag. 2024, 253, 107139. [Google Scholar] [CrossRef] [Scilit]
- Karditsa, A.; Niavis, S.; Paramana, T.; Monioudi, I.; Poulos, S.; Hatzaki, M. Is the Insular Coastal Tourism of Western Greece at Risk Due to Climate Induced Sea Level Rise? Ocean Coast. Manag. 2024, 251, 107088. [Google Scholar] [CrossRef] [Scilit]
- Thiéblemont, R.; le Cozannet, G.; Rohmer, J.; Privat, A.; Guidez, R.; Negulescu, C.; Philippenko, X.; Luijendijk, A.; Calkoen, F.; Nicholls, R.J. Sea-Level Rise Induced Change in Exposure of Low-Lying Coastal Land: Implications for Coastal Conservation Strategies. Anthr. Coasts 2024, 7, 8. [Google Scholar] [CrossRef] [Scilit]
- Bigano, A.; Goria, A.; Hamilton, J.M.; Tol, R.S.J. The Effect of Climate Change and Extreme Weather Events on Tourism; FEEM Working Paper No. 30.05, CMCC Research Paper No. 01; Fondazione Eni Enrico Mattei (FEEM): Milan, Italy, 2005; pp. 1–33. Available online: https://www.econstor.eu/bitstream/10419/74282/1/NDL2005-030.pdf (accessed on 2 April 2026).
- Kapetanakis, D.; Georgopoulou, E.; Mirasgedis, S.; Sarafidis, Y. Weather Preferences for Ski Tourism: An Empirical Study on the Largest Ski Resort in Greece. Atmosphere 2022, 13, 1569. [Google Scholar] [CrossRef] [Scilit]
- Tsilogianni, D.; Cartalis, C.; Philippopoulos, K. Climate Change Impact Assessment on Ski Tourism in Greece: Case Study of the Parnassos Ski Resort. Climate 2023, 11, 140. [Google Scholar] [CrossRef] [Scilit]
- Steiger, R.; Knowles, N.; Poll, K.; Rutty, M. Impacts of Climate Change on Mountain Tourism: A Review. J. Sustain. Tour. 2022, 32, 1984–2017. [Google Scholar] [CrossRef] [Scilit]
- Kapetanakis, D.; Georgopoulou, E.; Mirasgedis, S.; Sarafidis, Y. Weather Preferences for Urban Tourism: An Empirical Study in the Greek Capital of Athens, Greece. Atmosphere 2022, 13, 282. [Google Scholar] [CrossRef] [Scilit]
- Matzarakis, A. Weather- and climate- related information for tourism. Tour. Hosp. Plan. Dev. 2006, 3, 99–115. [Google Scholar] [CrossRef] [Scilit]
- Vitt, R.; Gulyás, A.; Matzarakis, A. Temporal differences of urban-rural biometeorological factors for planning and tourism in Szeged, Hungary. In Proceedings of the ICUC9—9 th International Conference on Urban Climate Jointly with 12th Symposium on the Urban Environment, Toulouse, France, 20–24 July 2015. [Google Scholar]
- Scott, D.; de Freitas, C.R.; Matzarakis, A. Adaptation in the tourism and recreation sector. In Biometeorology for Adaptation to Climate Variability and Change; McGregor, G.R., Burton, I., Ebi, K., Eds.; Springer: Berlin/Heidelberg, Germany, 2009. [Google Scholar] [CrossRef] [Scilit]
- Freitas, C.R. Tourism climatology: Evaluating environmental information for decision making and business planning in the recreation and tourism sector. Int. J. Biometeorol. 2003, 48, 45–54. [Google Scholar] [CrossRef] [Scilit] [PubMed]
- Scott, D. Why sustainable tourism must address climate change. J. Sustain. Tour. 2010, 19, 17–34. [Google Scholar] [CrossRef] [Scilit]
- Matzarakis, A. Transfer of climate data for tourism applications—The Climate-Tourism/Transfer-Information-Scheme. Sustain. Environ. Res. 2014, 24, 273–280. [Google Scholar]
- Anders, J.; Schubert, S.; Maronga, B.; Salim, M. Simplifying heat stress assessment: Evaluating meteorological variables as single indicators of outdoor thermal comfort in urban environments. Build. Environ. 2025, 274, 112658. [Google Scholar] [CrossRef] [Scilit]
- Huang, X.; Hui, Y.; Chen, J.; Huang, Z.; Li, X.; Yang, X. Research Progress on the Evaluation of Tourism Climate Comfort and Its Application in China: A Bibliometrics-Based Review. Atmosphere 2025, 16, 714. [Google Scholar] [CrossRef] [Scilit]
- Gao, C.; Liu, J.; Zhang, S.; Zhu, H.; Zhang, X. The Coastal Tourism Climate Index (CTCI): Development, Validation, and Application for Chinese Coastal Cities. Sustainability 2022, 14, 1425. [Google Scholar] [CrossRef] [Scilit]
- Badiru, A.; Humaire, L.; Matzarakis, A. Climate and Sustainable Tourism in João Pessoa: A Comparative Study with Salvador and Rio de Janeiro, Brazil. Atmosphere 2025, 16, 705. [Google Scholar] [CrossRef] [Scilit]
- Lemesios, I.; Varotsos, K.V.; Georgopoulou, E.; Sarafidis, Y.; Kapetanakis, D.; Mirasgedis, S.; Gakis, N.; Giannakopoulos, C. Effects of Climate Change on the Future Attractiveness of Tourist Destinations in Greece. Atmosphere 2024, 15, 1185. [Google Scholar] [CrossRef] [Scilit]
- Pecelj, M.; Malinović-Milićević, S.; Matzarakis, A. Thermal Comfort and Tourism in Mostar (Bosnia and Herzegovina): A Human Bioclimatic Information Sheet for Visitors and Planners. Atmosphere 2025, 16, 987. [Google Scholar] [CrossRef] [Scilit]
- Matei, N.A.; García-León, D.; Dosio, A.; Batista e Silva, F.; Ribeiro Barranco, R.; Císcar Martínez, J.C. Regional İmpact of Climate Change on European Tourism Demand; Publications Office of the European Union: Luxembourg, 2023. [Google Scholar] [CrossRef] [PubMed]
- Deniz, A. An examination of the tourism climate index in Turkey. Fresenius Environ. Bull. 2011, 20, 1414–1424. [Google Scholar]
- Zeydan, O.; Zeydan, İ.; Gurbuz, A. Evaluating climate change effects on coastal tourism over the Black Sea region by using the summer simmer index. Sustainability 2025, 17, 1490. [Google Scholar] [CrossRef] [Scilit]
- Joxe, M.; Barrutiabengoa, J.M.; Carta, G.; González, N.; Más, P.; Pérez, D.; Yücel, G. The Impact of Climate Change on Tourism Demand in Türkiye. Working Paper BBVA Research 2024. Available online: https://ideas.repec.org/p/bbv/wpaper/2414.html (accessed on 3 April 2026).
- Batista, F.; Barranco, R.; Proietti, P.; Pigaiani, C.; Lavalle, C. A new European regional tourism typology based on hotel location patterns and geographical criteria. Ann. Tour. Res. 2021, 89, 103077. [Google Scholar] [CrossRef] [Scilit]
- Scott, D.; McBoyle, G. Using a ‘tourism climate index’ to examine the implications of climate change for climate as a natural resource for tourism. In 1st International Workshop on Climate, Tourism and Recreation; Matzarakis, A., de Freitas, C., Eds.; International Society of Biometeorology, Commission on Climate, Tourism and Recreation: Halkidiki, Greece, 2001; pp. 69–98. Available online: https://www.researchgate.net/publication/238102783_Using_a_’tourism_climate_index’_to_examine_the_implications_of_climate_change_for_climate_as_a_tourism_resource (accessed on 3 April 2026).
- Gomez-Martin, M.A. Climate potential and tourist demand in Catalonia (Spain) during the summer season. Clim. Res. 2006, 32, 75–87. [Google Scholar] [CrossRef] [Scilit]
- Rutty, M.; Scott, D. Will the Mediterranean become “too hot” for tourism? A Reassessment. Tour. Plan. Dev. 2010, 7, 267–281. [Google Scholar] [CrossRef] [Scilit]
- Rutty, M.; Scott, D. Differential climate preferences of international beach tourists. Clim. Res. 2013, 57, 259–269. [Google Scholar] [CrossRef] [Scilit]
- Nicholls, S.; Amelung, B. Implications of climate change for rural tourism in the Nordic region based on application of the tourism climatic index. Scand. J. Hosp. Tour. 2015, 15, 48–72. [Google Scholar] [CrossRef] [Scilit]
- Perch-Nielsen, S.; Amelung, B.; Knutti, R. Future climate resources for tourism in Europe based on the daily Tourism Climatic Index. Clim. Change 2010, 103, 363–381. [Google Scholar] [CrossRef] [Scilit]
- Mann, H.B. Nonparametric tests against trend. Econometrica 1945, 13, 245–259. [Google Scholar] [CrossRef] [Scilit]
- Kendall, M.G. Rank Correlation Methods; Charles Griffin: London, UK, 1975; Available online: https://www.scirp.org/reference/referencespapers?referenceid=2099295 (accessed on 4 April 2026).
- Hamed, K.H.; Rao, A.R. A modified Mann–Kendall trend test for autocorrelated data. J. Hydrol. 1998, 204, 182–196. [Google Scholar] [CrossRef] [Scilit]
- Scott, D.; Gössling, S.; Hall, C.M. International Tourism and Climate Change. Wiley Interdiscip. Rev. Clim. Change 2012, 3, 213–232. [Google Scholar] [CrossRef] [Scilit]
- Sen, P.K. Estimates of the regression coefficient based on Kendall’s tau. J. Am. Stat. Assoc. 1968, 63, 1379–1389. [Google Scholar] [CrossRef]
- Roshan, G.; Yousefi, R.; Fitcett, J.M. Long-term trends in tourism climate index scores for 40 stations across Iran: The role of climate change and influence on tourism sustainability. Int. J. Biometeorol. 2016, 60, 33–52. [Google Scholar] [CrossRef] [Scilit] [PubMed]
- Efe, B.; Gözet, E.; Özgür, E.; Lupo, A.R.; Deniz, A. Spatiotemporal Variation of Tourism Climate Index for Türkiye during 1981–2020. Climate 2022, 10, 151. [Google Scholar] [CrossRef] [Scilit]
- Yue, S.; Pilon, P.; Phinney, B.; Cavadias, G. The influence of autocorrelation on the ability to detect trend in hydrological series. Hydrol. Process. 2002, 16, 1807–1829. [Google Scholar] [CrossRef] [Scilit]
- Yue, S.; Hashino, M. Long-term trends of annual and monthly precipitation in Japan. J. Am. Water Resour. Assoc. 2003, 39, 587–596. [Google Scholar] [CrossRef] [Scilit]
- Zaninović, K.; Matzarakis, A. The bioclimatological leaflet as a means conveying climatological information to tourists and the tourism industry. Int. J. Biometeorol. 2009, 53, 369–374. [Google Scholar] [CrossRef] [Scilit] [PubMed]
- Malinović-Milićević, S.; Micić, J.; Denda, S.; Stanojević, G.; Petrović, M.D. Intensification of thermal risk in a changing climate: Findings from prominent tourism destinations along the eastern Adriatic coast. Int. J. Biometeorol. 2025, 69, 157–175. [Google Scholar] [CrossRef] [Scilit] [PubMed]

Disclaimer/Publisher’s Note: The statements, opinions and data contained in all publications are solely those of the individual author(s) and contributor(s) and not of MDPI and/or the editor(s). MDPI and/or the editor(s) disclaim responsibility for any injury to people or property resulting from any ideas, methods, instructions or products referred to in the content. |
© 2026 by the author. Licensee MDPI, Basel, Switzerland. This article is an open access article distributed under the terms and conditions of the Creative Commons Attribution (CC BY) license.