


Abstract
This study evaluated meteorological drought conditions in Tuzluca District (Iğdır, Türkiye) over the period 1960–2024 using four complementary drought indices: the Standardized Precipitation Index (SPI), Standardized Precipitation–Evapotranspiration Index (SPEI), Percent of Normal Index (PNI), and Rainfall Normalized Index (RNI), calculated at 1-, 3-, 6-, and 12-month time scales. Daily precipitation, temperature, and evaporation data obtained from the 16th Regional Directorate of the Turkish State Meteorological Service (MGM) were quality-controlled and used for index computation. The results revealed substantial temporal variability in drought and wetness conditions across short-, medium-, and long-term accumulation periods. Short-term indices (1- and 3-month) effectively captured rapid monthly and seasonal fluctuations, whereas longer accumulation periods (6- and 12-month) highlighted the persistence of extended dry and wet episodes. The longer accumulation scales revealed pronounced negative anomalies around 1999–2003 and renewed dry conditions during parts of the early 2020s. Trend analysis using the modified Mann–Kendall test identified statistically significant increasing trends in the annual mean SPI-12, PNI-12, and RNI-12 series, with Z statistics of 2.0191, 1.9997, and 2.0299, respectively (p < 0.05). In contrast, SPEI-12 exhibited a decreasing but statistically non-significant tendency (Z = −1.1451, p = 0.2522). The corresponding Sen’s slope estimates were 0.0147 index units per year for SPI-12, −0.0063 index units per year for SPEI-12, 0.3527 index units per year for PNI-12, and 0.0142 index units per year for RNI-12. These findings demonstrate that the direction and statistical significance of the detected trends differed among the indices. Overall, this study highlights the importance of combining precipitation-based and water-balance-based drought indices across multiple accumulation periods to characterize temporal drought variability and support regional water-resources management, agricultural planning, and meteorological drought early-warning systems in semi-arid regions.
1. Introduction
Climate change stands out as one of the most pressing environmental problems worldwide, with far-reaching consequences for ecosystems, water cycles, crop production, and human communities [1,2]. The Intergovernmental Panel on Climate Change (IPCC) [3] reports that global mean surface temperature has increased by approximately 1.1 °C relative to the 1850–1900 period, accompanied by substantial changes in hydroclimatic conditions, including precipitation patterns, soil moisture, and atmospheric water availability. Such changes can influence the frequency, duration, and intensity of drought events through alterations in precipitation and atmospheric evaporative demand [3,4]. Drought is therefore recognized as a major hydroclimatic hazard, with consequences for water resources, agriculture, ecosystems, and socio-economic systems. Among its different forms, meteorological drought is primarily characterized by precipitation deficits relative to the climatological reference period and represents an important component of drought assessment and monitoring [5,6].
Owing to its geographical location and climatic characteristics, Türkiye is among the countries where hydroclimatic variability and drought conditions are of particular concern [7]. Recent assessments have demonstrated substantial spatial and temporal variability in meteorological drought across Türkiye and have highlighted the importance of considering both precipitation variability and temperature-related atmospheric water demand in drought assessment [7,8,9]. Within this national context, Iğdır Province is characterized by a relatively dry and semi-arid climate, with low annual precipitation and pronounced seasonal water deficits [10]. The province also has a strong agricultural character, particularly in the Iğdır Plain, where agricultural activities are closely associated with the regional environmental and socio-economic structure. These hydroclimatic and socio-economic characteristics make Iğdır particularly relevant for localized drought assessment and water-resources management.
The characterization of drought requires indices that capture different aspects of precipitation variability and atmospheric water demand. SPI is based solely on precipitation and can be calculated over different accumulation periods, whereas the SPEI incorporates the difference between precipitation and atmospheric evaporative demand and is therefore sensitive to temperature-related changes in atmospheric water demand [4,5]. Because drought signals vary with the accumulation period considered, evaluating multiple time scales allows short-term precipitation anomalies and more persistent dry or wet conditions to be examined using complementary drought indicators.
Recent nationwide studies have demonstrated the value of multi-index approaches for examining drought variability across Türkiye. For example, Selek et al. [7] evaluated drought conditions using SPI, SPEI, and PNI at multiple time scales based on observations from 255 meteorological stations covering 1972–2023. Their results revealed substantial temporal and seasonal variability in drought conditions, while the consistently lower SPEI values than SPI during summer and autumn highlighted the influence of temperature-driven evapotranspiration on drought severity. However, nationwide assessments may not fully capture localized drought characteristics at the district scale, particularly in environmentally sensitive semi-arid regions. Despite the growing body of drought research in Türkiye, district-scale assessments integrating multiple complementary drought indices and accumulation periods remain limited for Iğdır Province and, particularly, Tuzluca District. This limitation is relevant because drought signals may vary depending on both the indicator employed and the temporal scale considered.
The present study addresses this gap by applying four complementary drought indices SPI, SPEI, PNI, and RNI at 1-, 3-, 6-, and 12-month accumulation periods to meteorological data from Tuzluca District, Iğdır, covering 1960–2024. The resulting time series are evaluated using the non-parametric Mann–Kendall test and Sen’s slope estimator to determine the direction, statistical significance, and magnitude of temporal trends in the annual mean values of the 12-month drought indices. This integrated framework enables the characterization of drought and wetness conditions across different temporal scales, the identification of persistent dry and wet phases, and the comparison of drought signals derived from precipitation- and evapotranspiration-sensitive indicators. Accordingly, this study aims to (i) quantify meteorological drought and wetness conditions in Tuzluca District using SPI, SPEI, PNI, and RNI; (ii) characterize the temporal evolution and persistence of dry and wet phases during 1960–2024; and (iii) assess the direction, statistical significance, and magnitude of temporal trends using the Mann–Kendall test and Sen’s slope estimator. The findings are expected to provide a localized scientific basis for water-resources management and drought monitoring in Tuzluca District and the wider Iğdır region.
2. Materials and Methods
2.1. Study Area
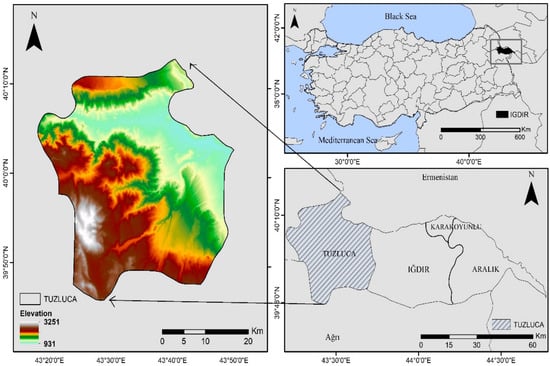
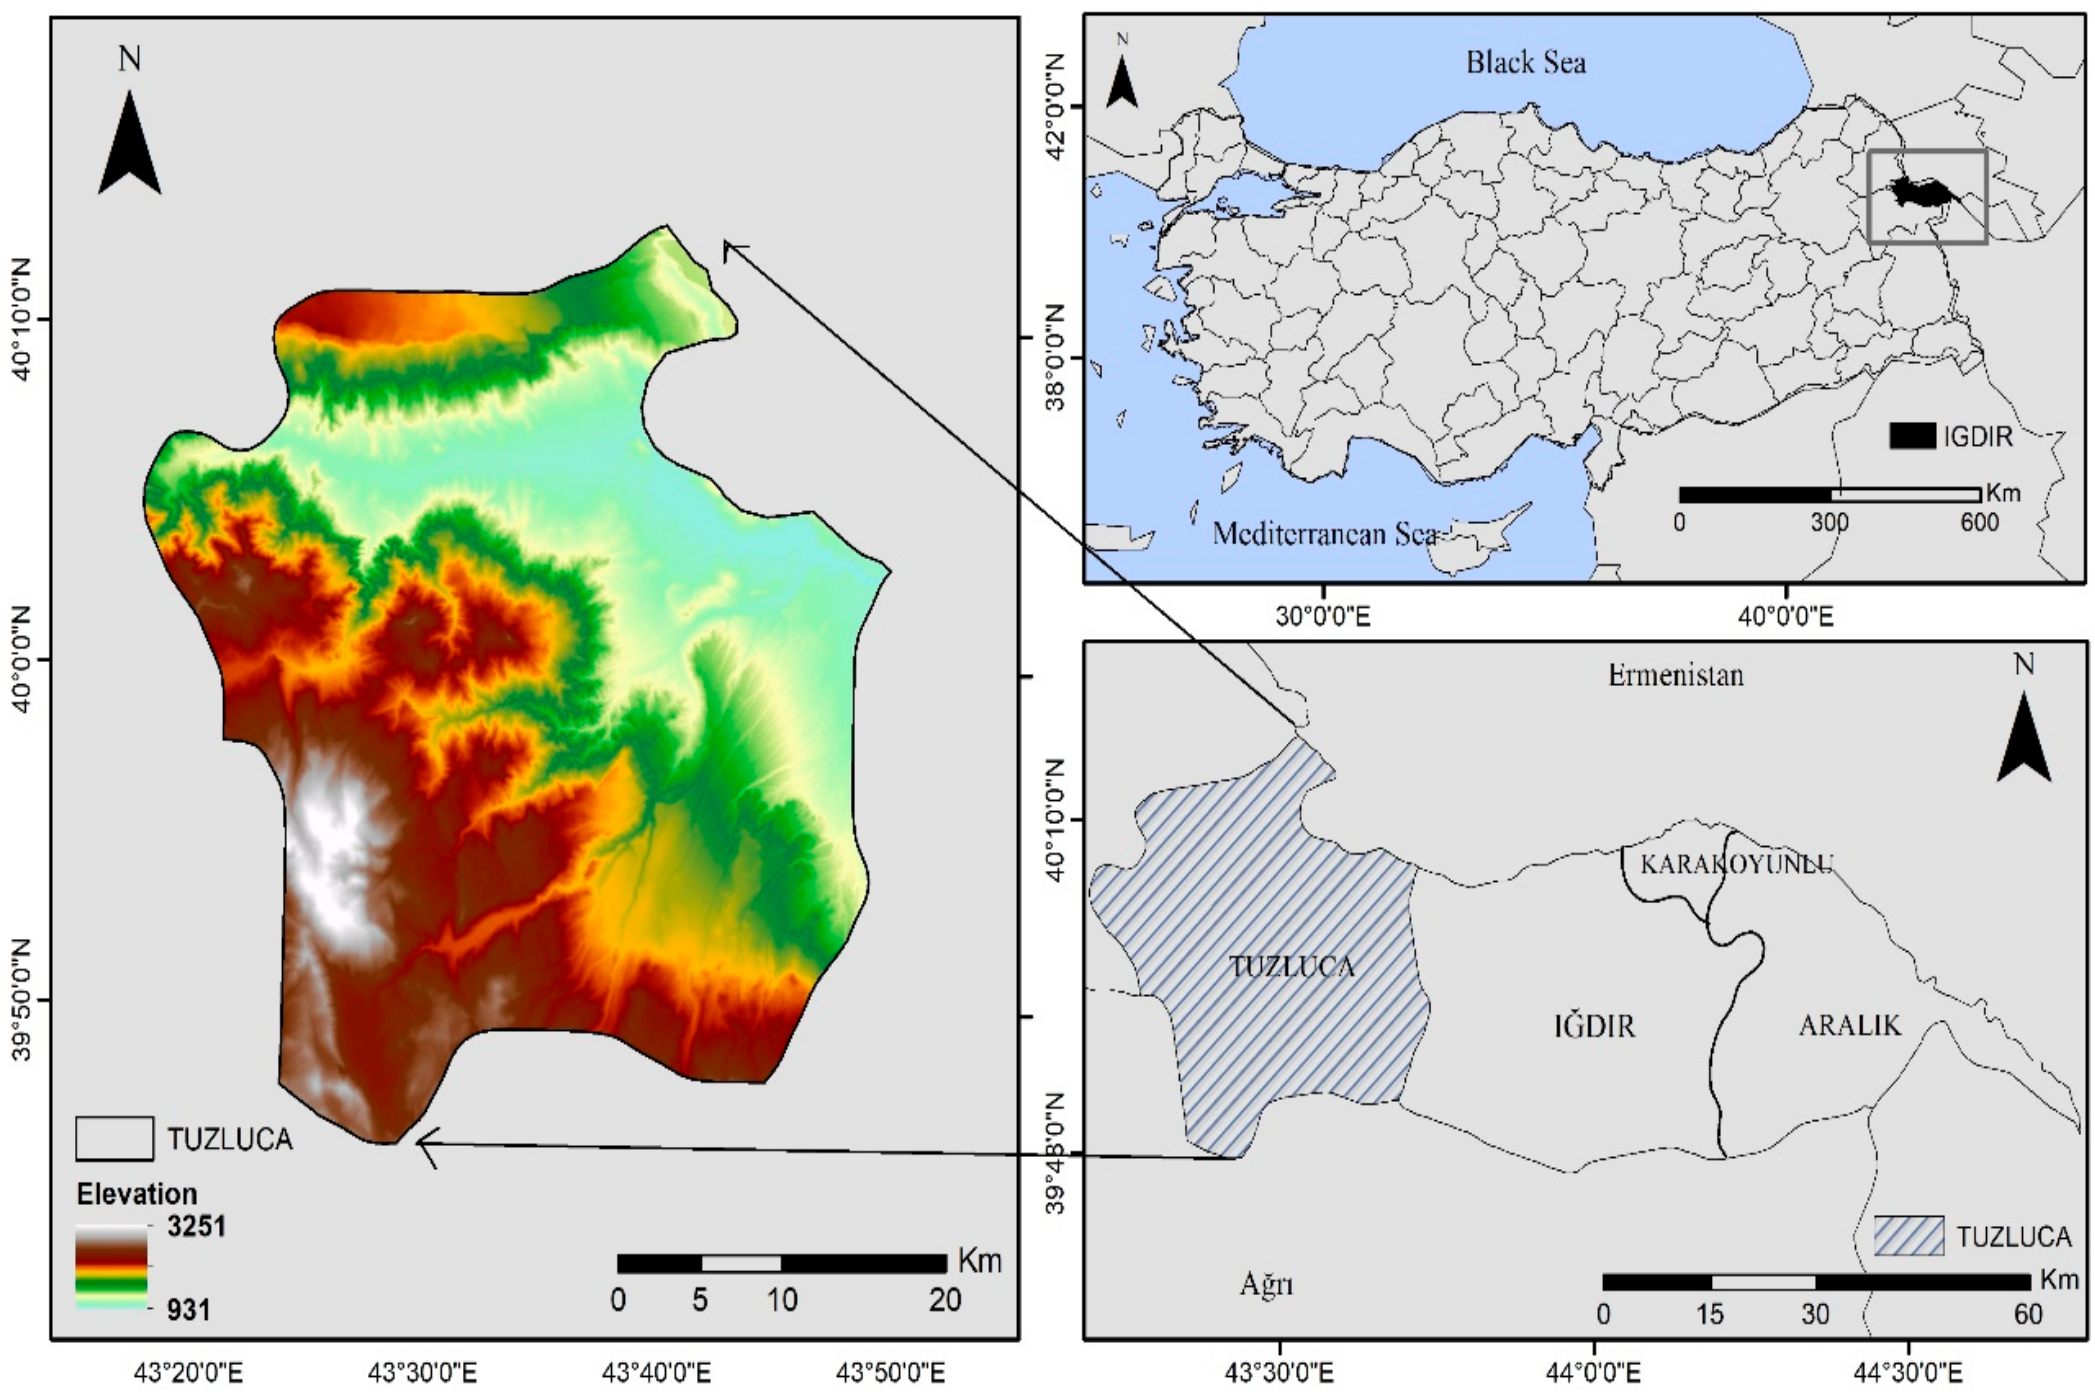
The study area is Tuzluca District, located in eastern Türkiye within Iğdır Province. Covering approximately 1254 km2, Tuzluca is the largest district of Iğdır and is located at approximately 43.07° E and 38.35° N (Figure 1). The district is characterized by a predominantly mountainous topography and a continental climate. The mean annual temperature is 11.1 °C, while the mean annual precipitation is 326.2 mm [11]. The natural vegetation predominantly exhibits steppe characteristics, although fruit trees cultivated in the district center and surrounding villages contribute to local variations in vegetation cover [12].
Figure 1.
Location of the study area (Tuzluca district, Iğdır province, Türkiye).
2.2. Data Sources and Pre-Processing
The meteorological data used in this study were obtained from the 16th Regional Directorate of the Turkish State Meteorological Service (MGM) and covered the period from January 1960 to December 2024. The precipitation observations were organized into a continuous monthly time series comprising 780 monthly records. Monthly precipitation totals were used to calculate SPI, PNI, and RNI, while monthly potential evapotranspiration (PET), estimated from air temperature using the Thornthwaite method, was used together with precipitation to calculate SPEI. Prior to the calculation of drought indices, the raw dataset was subjected to a series of quality-control procedures to ensure data reliability and consistency.
The precipitation series contained five missing monthly observations out of 780 months, corresponding to 0.64% of the complete study-period record. These missing observations were located in September 1960, August 1966, September 1973, March 1990, and November 1996. No missing values were identified in the monthly PET series used for the SPEI calculations. The small proportion of missing precipitation observations was addressed before drought-index computation to obtain a continuous monthly series for the 1960–2024 analysis period.
Missing monthly precipitation observations were initially estimated using linear interpolation between the adjacent chronological observations. To evaluate the sensitivity of the drought-index results to this choice, two alternative gap-filling scenarios were also constructed using the long-term monthly median and monthly mean for the corresponding calendar month. SPI and SPEI were recalculated at 1-, 3-, 6-, and 12-month accumulation scales for each scenario, using the same 1960–2024 reference period and the same distribution-fitting procedures as in the primary analysis. The resulting index series were compared with the linear-interpolation baseline using the mean absolute error (MAE), root mean square error (RMSE), maximum absolute difference, and the number and percentage of observations whose drought/wetness classification changed. Drought-event counts and durations were also compared across the three scenarios. This sensitivity analysis was designed to quantify the extent to which the selected gap-filling method influenced the calculated indices and the identification of drought events.
In addition, a repeated holdout cross-validation procedure was used to compare the predictive errors of the three gap-filling methods. The procedure was repeated 200 times. In each repetition, five observed precipitation values were selected for each of the four calendar months represented among the missing observations (March, August, September, and November), yielding 20 withheld observations per repetition. Each withheld value was estimated using linear interpolation, the monthly mean, and the monthly median, and the estimates were compared with the corresponding observed precipitation values. Across the 200 repetitions, this yielded 4000 test estimates per method. The mean error, mean absolute error (MAE), and root mean square error (RMSE) were calculated to evaluate predictive performance. This procedure provided an empirical comparison of the gap-filling methods based on observed values, whereas the index-based sensitivity analysis evaluated their effects on drought-index values, drought classifications, and drought-event characteristics.
Potential precipitation outliers were screened using the interquartile range (IQR) rule applied separately to each calendar month. This procedure flagged 25 monthly precipitation values for further inspection. These observations were treated as potential statistical outliers rather than automatically classified as erroneous measurements, because unusually high monthly precipitation can represent genuine climatic variability. Consequently, the flagged values were retained unless independent evidence indicated a measurement or recording error.
Homogeneity of the annual precipitation and potential evapotranspiration (PET) series was assessed using the Pettitt test, the standard normal homogeneity test (SNHT), and the Buishand range test. For annual precipitation, the Pettitt test identified a statistically significant change point around 2000 (test statistic = 468, permutation-based p = 0.0116), whereas the SNHT (statistic = 8.0313, p = 0.0886) and Buishand range test (statistic = 1.4081, p = 0.1250) did not indicate statistically significant inhomogeneity at the 5% significance level. For annual PET, all three tests indicated statistically significant change signals: Pettitt (statistic = 920, p = 0.0002), SNHT (statistic = 35.5885, p = 0.0002), and Buishand range (statistic = 2.8200, p = 0.0002). The estimated change points occurred around 1994 for the Pettitt and Buishand tests and around 1997 for the SNHT. These results indicate potential temporal changes in the precipitation and PET series; however, the tests alone cannot establish whether these changes resulted from climatic variability, changes in station operation, or changes in data processing. The PET homogeneity results were therefore considered when interpreting the SPEI-based findings.
Following quality control, the meteorological observations were organized into monthly time series (Table 1). Four complementary drought indices the Standardized Precipitation Index (SPI), Standardized Precipitation Evapotranspiration Index (SPEI), Percent of Normal Index (PNI), and Rainfall Normalized Index (RNI) were calculated at 1-, 3-, 6-, and 12-month accumulation scales. These indices enabled the assessment of drought and wetness conditions across different temporal scales, from short-term precipitation variability to longer-term moisture conditions. The inclusion of SPEI also allowed the potential influence of atmospheric evaporative demand, represented through potential evapotranspiration (PET), to be considered alongside precipitation variability.
Table 1.
Data sources, characteristics, and analytical applications used in this study.
To assess long-term temporal trends, the annual mean values of the monthly 12-month index series were analyzed using the non-parametric Mann–Kendall test [13,14,15]. This method was used to identify the direction and statistical significance of monotonic trends over the 1960–2024 study period. Trend magnitudes were estimated using Sen’s slope estimator. This integrated analytical framework was designed to characterize the temporal variability of drought and wetness conditions, identify persistent dry and wet periods, and evaluate the direction and magnitude of long-term changes in Tuzluca District, Iğdır, Türkiye.
2.3. Drought Indices
Four drought indices were used to characterize meteorological drought variability in Tuzluca District: the SPI, SPEI, PNI, and RNI. All indices were calculated at 1-, 3-, 6-, and 12-month accumulation scales to capture short-, medium-, and long-term hydroclimatic conditions.
SPI, introduced by McKee et al. [5], was calculated using monthly precipitation totals. Accumulated precipitation series were fitted to a two-parameter Gamma probability distribution and transformed into a standard normal distribution to obtain the SPI values. The Gamma probability density function is expressed as:
where x represents accumulated precipitation, α is the shape parameter, β is the scale parameter, and Γ(α) is the Gamma function. Cumulative probability from the fitted distribution was transformed into a standard normal variate. Negative SPI values indicate dry conditions, whereas positive values indicate wet conditions [5].
The Standardized Precipitation–Evapotranspiration Index (SPEI), proposed by Vicente-Serrano et al. [4], was calculated using the climatic water balance between precipitation (P) and potential evapotranspiration (PET), estimated via the Thornthwaite method [16]. Monthly water balance (Di) was defined as:
Di = Pi − PETi
Accumulated water-balance series were fitted to a three-parameter log-logistic distribution and standardized. Negative SPEI values indicate dry conditions, whereas positive values indicate wet conditions. By incorporating PET, SPEI accounts for the effects of temperature-driven atmospheric water demand [4].
The Percent of Normal Index (PNI) expresses observed precipitation relative to its long-term mean and was calculated as:
where Pi is the observed accumulated precipitation for accumulation period and is the corresponding long-term mean. Values below 100% indicate precipitation deficits, whereas values above 100% indicate surpluses.
The Rainfall Normalized Index (RNI) quantifies precipitation anomalies relative to the long-term mean and standard deviation, following the normalized rainfall anomaly approach described by Türkeş [17]:
where SD(Pk) is the standard deviation of accumulated precipitation for the reference period. Negative RNI values represent below-normal precipitation, whereas positive values indicate above-normal precipitation [17].
The SPI values were classified according to McKee et al. [5] (Table 2), whereas SPEI, PNI, and RNI values were evaluated based on their continuous magnitude and direction across temporal scales.
Table 2.
Drought severity classification for the Standardized Precipitation Index [5].
For each accumulation scale (1, 3, 6, and 12 months), precipitation was accumulated using a moving window. The mean and sample standard deviation were calculated separately for each ending calendar month using all available accumulated precipitation observations corresponding to that month and accumulation scale. The sample standard deviation was calculated as:
where (sk,m) denotes the sample standard deviation, (nk,m) is the number of observations in the corresponding group, (Pk,i,m) represents the (i)-th accumulated precipitation observation, and () is the mean accumulated precipitation for that group. The accumulation scale (k) represents 1, 3, 6, or 12 months, whereas (m) denotes the ending calendar month (January–December).
Table 3 summarizes the main characteristics of the four drought indices used in this study, including their input data, time scales, drought characteristics, advantages, and limitations. SPI, PNI, and RNI are based on precipitation, whereas SPEI additionally incorporates potential evapotranspiration (PET), allowing the effects of temperature-related atmospheric water demand to be considered. The use of these complementary indices provides a broader assessment of drought variability.
Table 3.
Comparison of the drought indices used in this study.
The drought indices were calculated using the 1960–2024 meteorological record, providing a 65-year observational period for characterizing long-term hydroclimatic variability. SPI was derived using a two-parameter Gamma distribution, whereas SPEI was calculated using a three-parameter log-logistic distribution. The parameters of the Gamma distribution for SPI and the log-logistic distribution for SPEI were estimated using the unbiased probability-weighted moments (ub-PWM) method. All standardized indices were calculated using the 1960–2024 reference period. The use of a multi-decadal record reduces the limitations associated with short observational series; nevertheless, uncertainty related to the selected reference period and the statistical characteristics of the underlying data should be acknowledged. The resulting standardized index values are therefore interpreted in relation to the 1960–2024 reference period.
2.4. Supplementary WorldClim-Based Drought Assessment
To provide an independent gridded-data comparison of drought variability, monthly climate data were obtained from the WorldClim 2.1 historical climate dataset based on CRU TS 4.09. The downloaded dataset covered the period 1951–2024. Monthly precipitation (prec), minimum air temperature (tmin), and maximum air temperature (tmax) were extracted for Tuzluca District, Iğdır, Türkiye. To ensure temporal comparability with the primary meteorological analysis based on observations obtained from the Turkish State Meteorological Service (MGM), the supplementary analysis was restricted to the common period of 1960–2024. Accordingly, the WorldClim observations for 1951–1959 were excluded, resulting in a 65-year analysis period comprising 780 monthly observations.
Monthly mean air temperature (Tmean) was calculated as the arithmetic mean of minimum and maximum air temperatures. Potential evapotranspiration (PET) was estimated using the Hargreaves method based on Tmean, Tmin, Tmax, and extraterrestrial radiation. Extraterrestrial radiation was calculated using the geographical latitude of the study area (38.35° N). The climatic water balance was calculated as the difference between monthly precipitation and PET (D = P − PET).
Using the WorldClim-derived monthly climate series, the Standardized Precipitation Index (SPI), Standardized Precipitation–Evapotranspiration Index (SPEI), Percent of Normal Index (PNI), and Rainfall Normalized Index (RNI) were calculated at 1-, 3-, 6-, and 12-month accumulation scales. These calculations yielded 16 index series: SPI-1, SPI-3, SPI-6, SPI-12; SPEI-1, SPEI-3, SPEI-6, SPEI-12; PNI-1, PNI-3, PNI-6, PNI-12; and RNI-1, RNI-3, RNI-6, RNI-12. The 1-month series represented short-term monthly fluctuations, the 3- and 6-month series captured seasonal and medium-term anomalies, and the 12-month series were used to examine longer-term drought and wetness persistence.
For the standardized SPI and SPEI series, zero was used as the reference level separating negative and positive anomalies. For PNI, a value of 100 represented normal precipitation, with values below and above 100 indicating precipitation deficits and surpluses, respectively. For RNI, zero was used as the reference level, with negative and positive values representing precipitation deficits and surpluses, respectively. The four accumulation scales for each index were presented in four-panel plots to facilitate comparisons of drought and wetness variability across timescales.
To quantify agreement between the MGM and WorldClim datasets, paired monthly precipitation observations over the common period (1960–2024) were compared using Pearson’s correlation coefficient (r), mean bias, and root mean square error (RMSE). Mean bias was calculated as the average difference between WorldClim and MGM precipitation, whereas RMSE quantified the magnitude of the differences between the two datasets. These statistics complemented the visual comparison by providing a quantitative assessment of agreement between the gridded and station-based precipitation records.
The WorldClim-derived indices were evaluated separately from the primary MGM-based indices. In particular, PET was estimated using the Hargreaves method for the WorldClim analysis, whereas the primary MGM-based SPEI calculation used the Thornthwaite method. This methodological difference was considered when interpreting similarities and differences between the two SPEI series. The WorldClim-based analysis was intended as a supplementary assessment of temporal variability rather than a replacement for the station-based analysis. The WorldClim-derived series were not merged with the MGM observations and were not used in the Mann–Kendall or Sen’s slope analyses. Accordingly, the primary drought-index results and statistical trend analyses were based exclusively on the MGM-derived series, while the WorldClim-derived indices were presented separately as supplementary comparisons.
2.5. Trend Analysis
Trend significance was assessed using the modified Mann–Kendall (MK) test proposed by Hamed and Rao [18], which adjusts the variance of the MK statistic to account for serial correlation. The analysis was conducted for the period 1960–2024 using annual mean series derived from the monthly 12-month drought index values (SPI-12, SPEI-12, PNI-12, and RNI-12). For each index, the 12 monthly values within each calendar year were averaged to obtain one annual observation, resulting in 65 annual observations per index.
The sign of the standardized Z statistic indicates the direction of the monotonic trend, with positive and negative values representing increasing and decreasing trends, respectively [19]. Statistical significance was evaluated at the 5% significance level (a = 0.05). Trend magnitude and direction were quantified using Sen’s slope estimator [20], a non-parametric method based on the median of the slopes calculated between all pairs of observations. The estimated slopes were expressed in index units per year.
Serial dependence in each annual mean index series was assessed using the lag-1 autocorrelation coefficient and the Ljung–Box test with five lags. The lag-1 autocorrelation coefficient quantified first-order serial dependence, whereas the Ljung–Box test evaluated the joint significance of autocorrelations up to lag 5. The modified Mann–Kendall test proposed by Hamed and Rao [18] was applied to account for the potential influence of serial correlation on trend significance.
3. Results
3.1. SPI Results
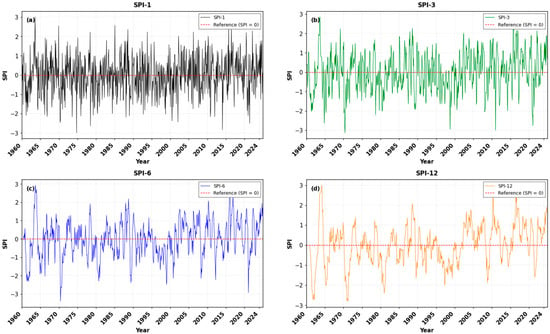
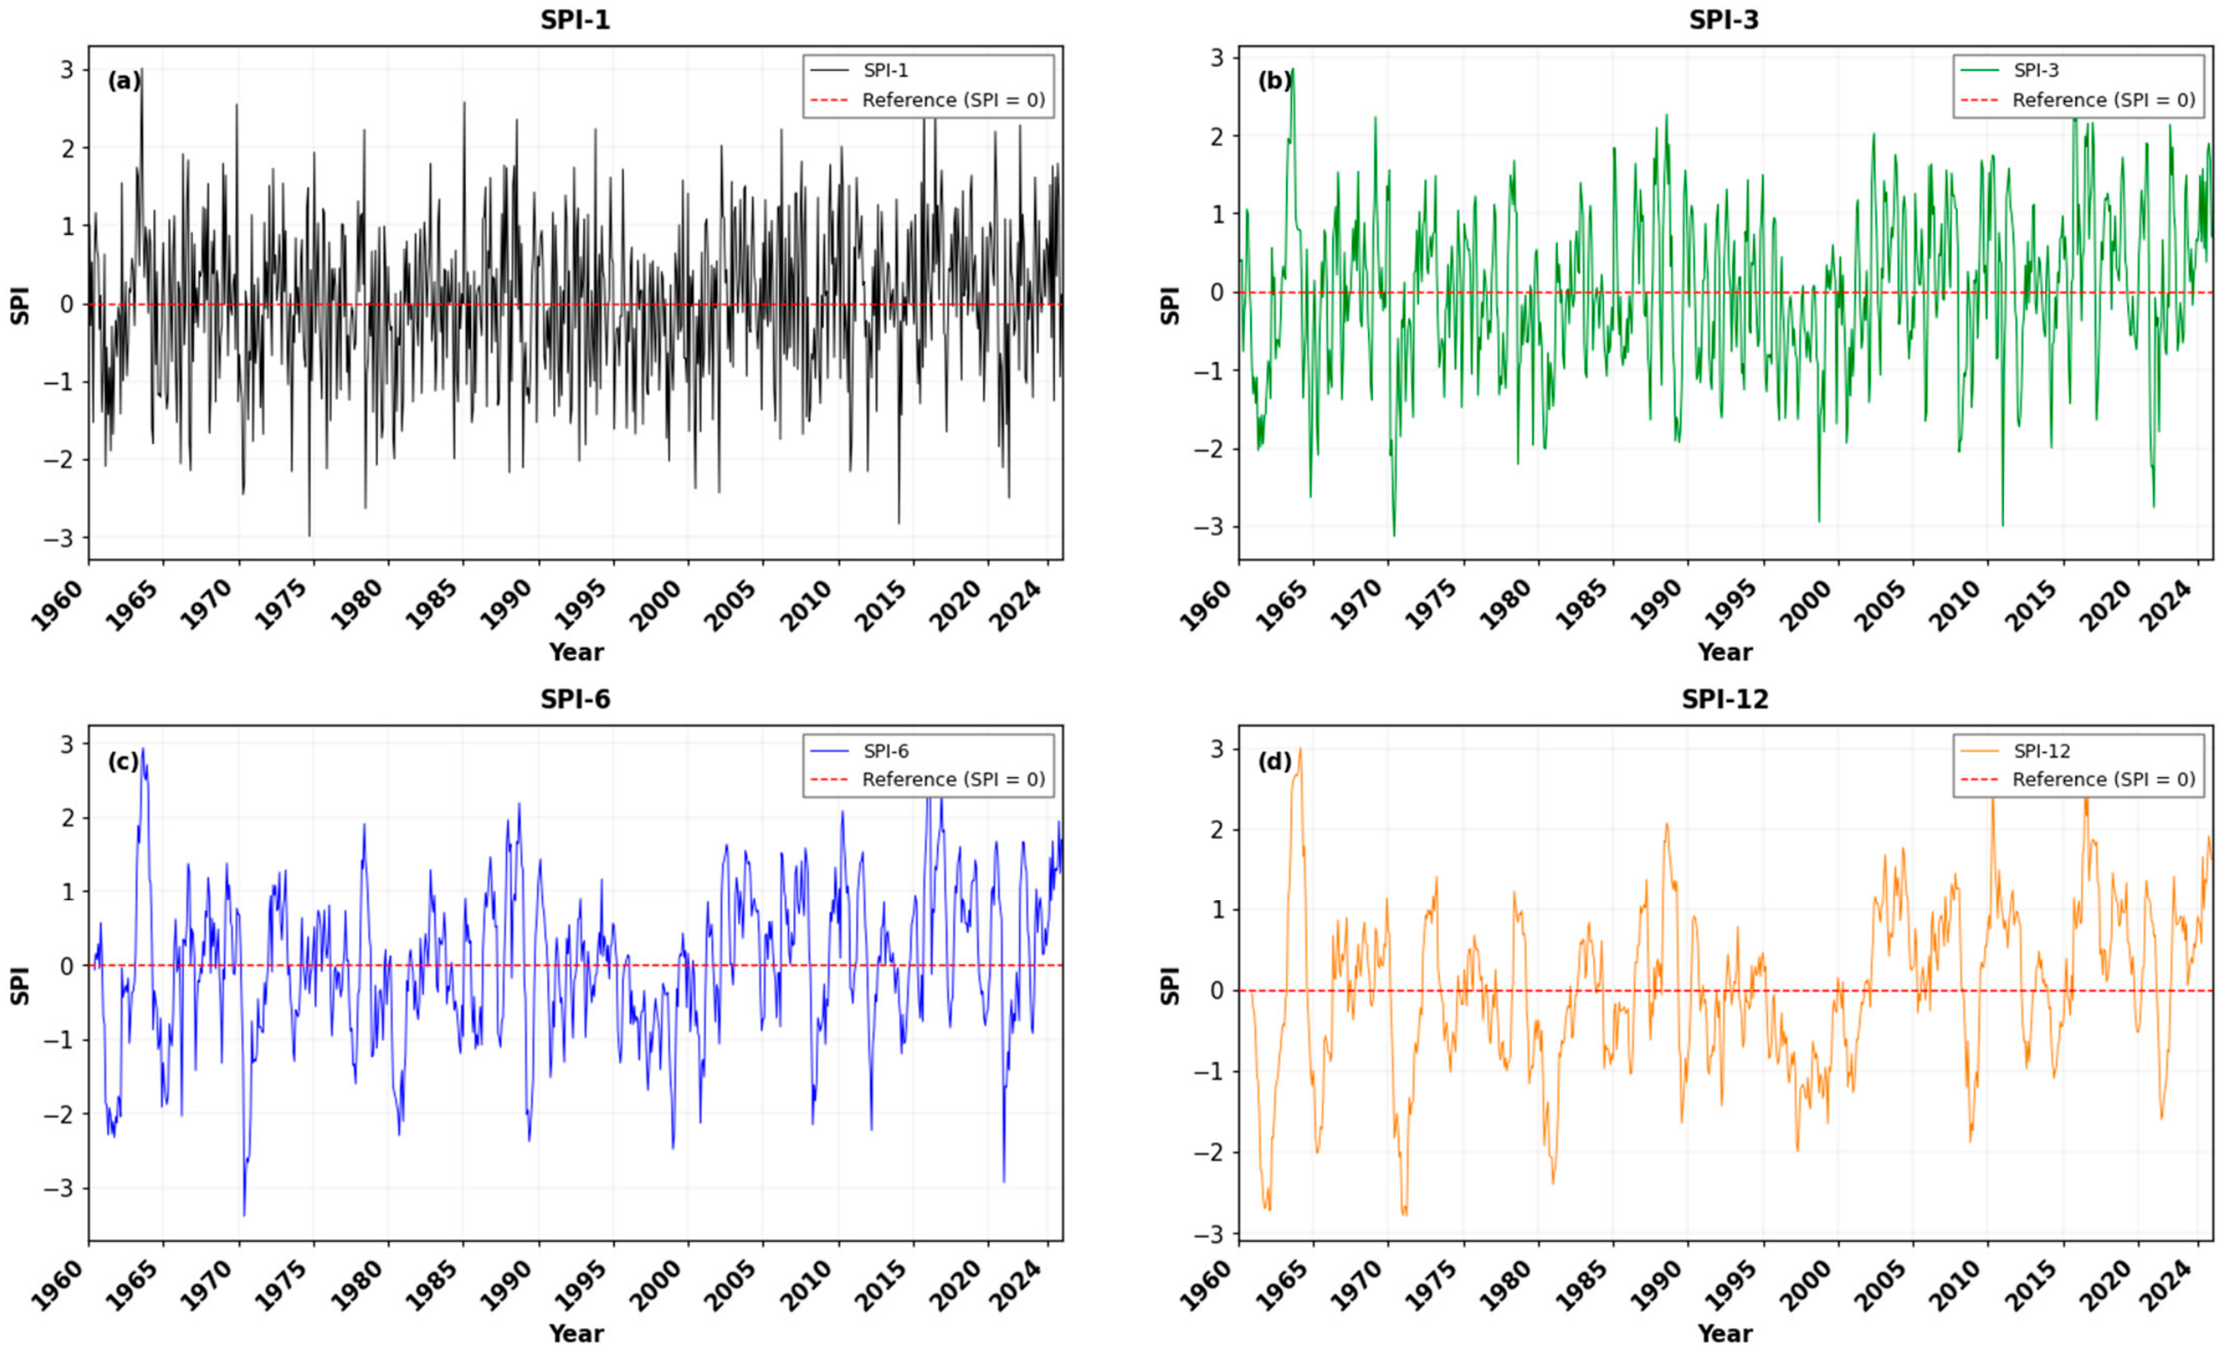
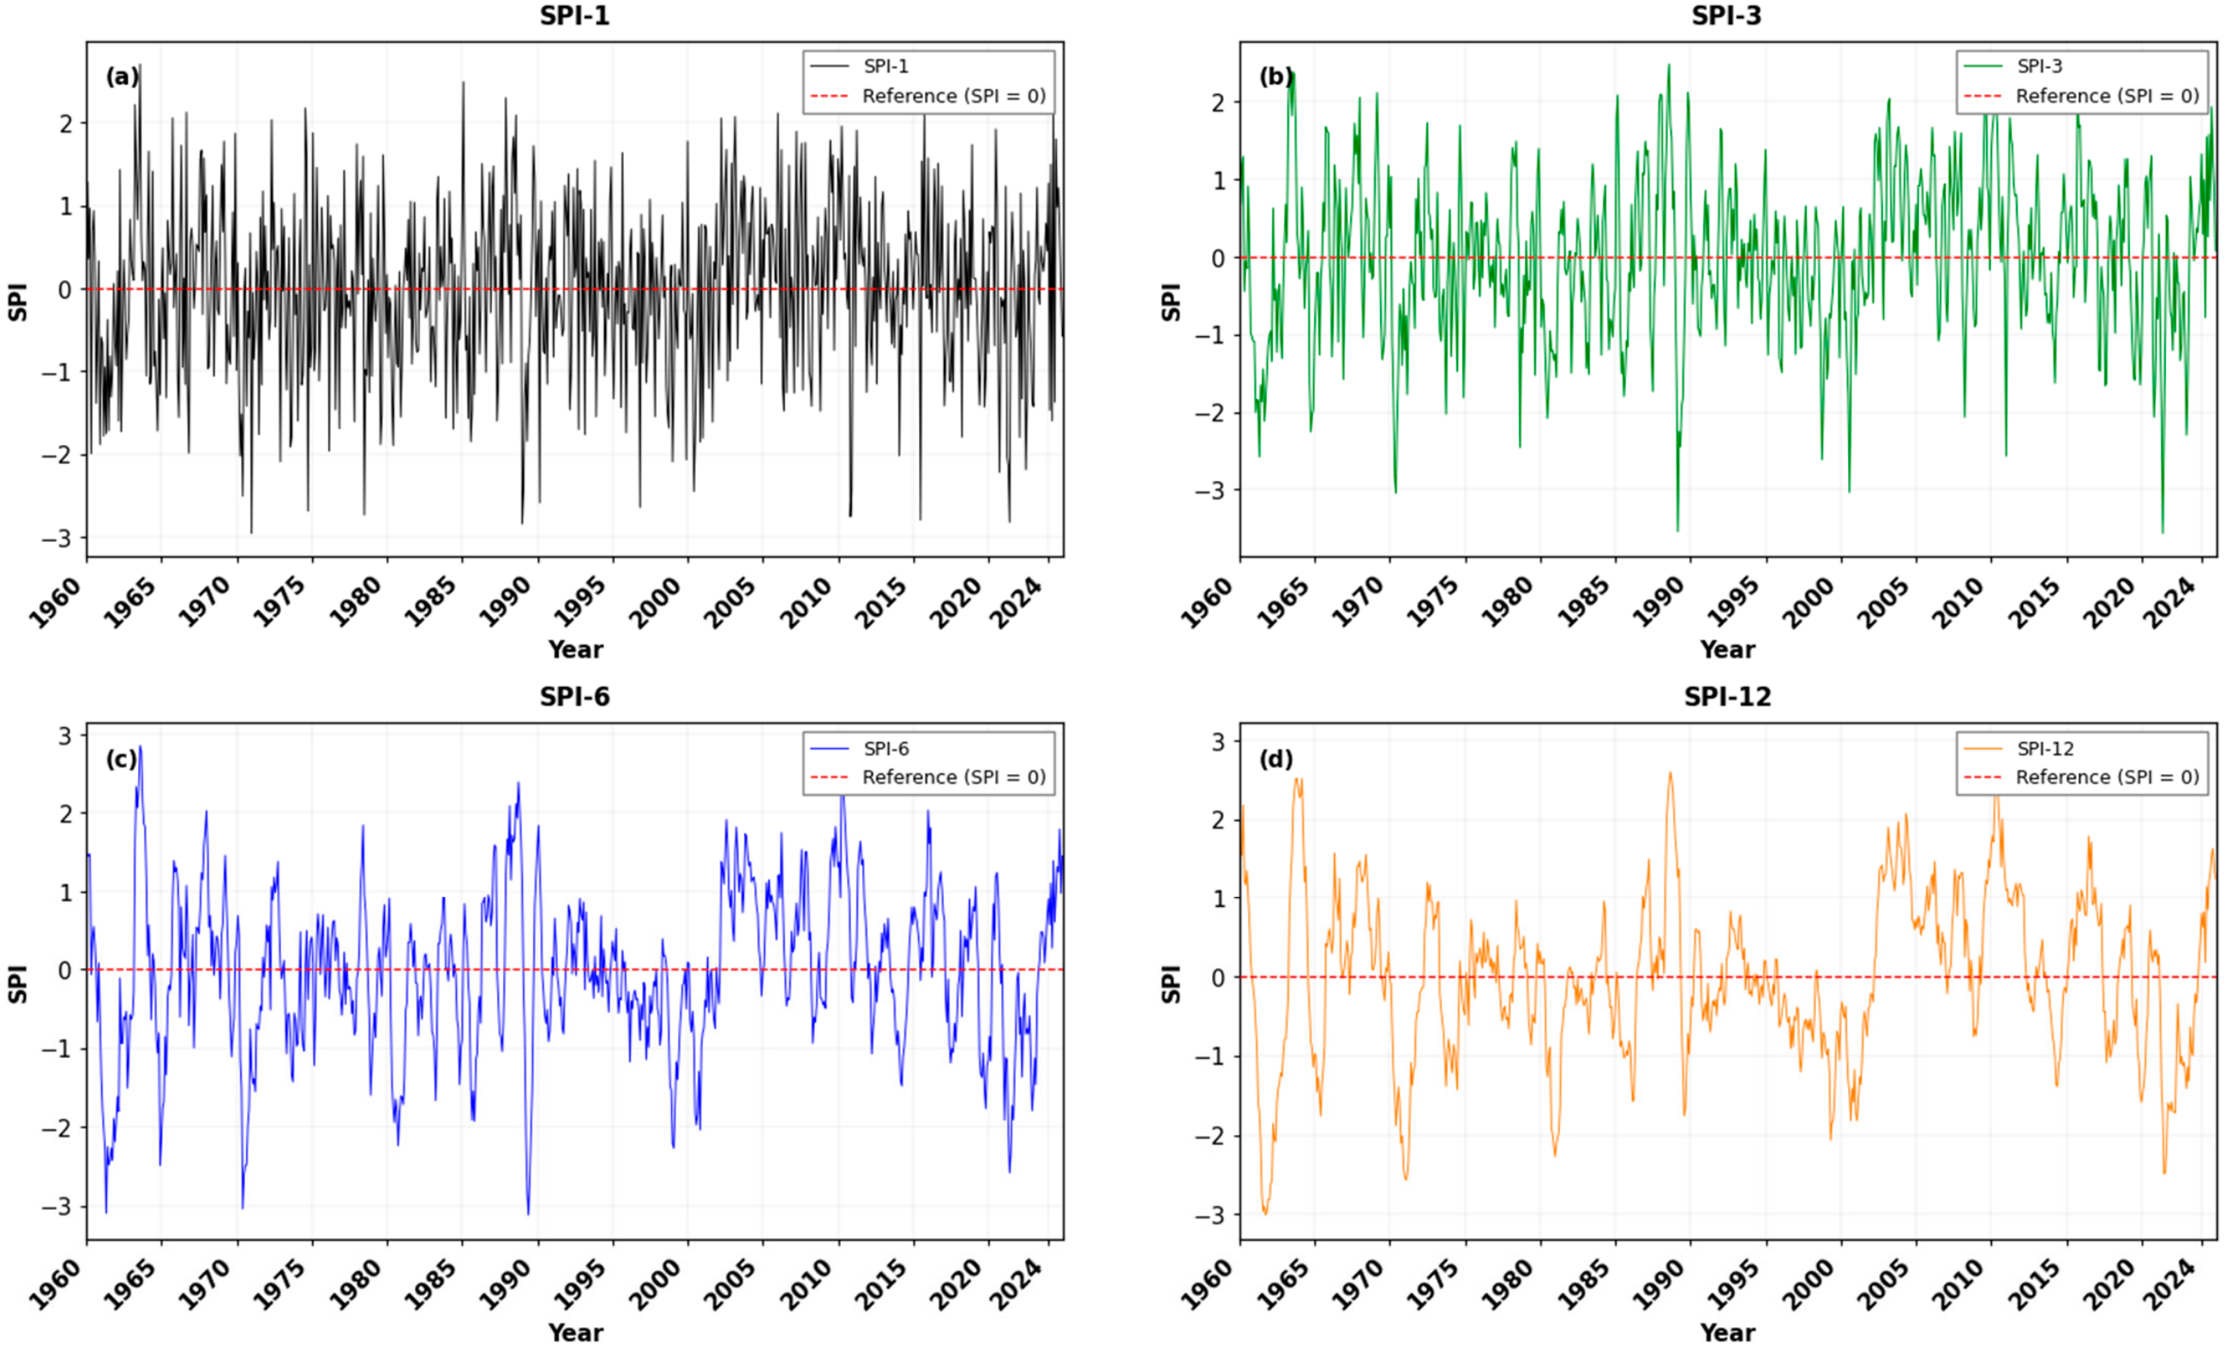
SPI series exhibited pronounced temporal variability across all accumulation scales during 1960–2024, with short-term fluctuations progressively smoothing as the accumulation period increased (Figure 2).
Figure 2.
Temporal variation of (a) monthly SPI, (b) 3-month SPI (SPI-3), (c) 6-month SPI (SPI-6), and (d) 12-month SPI (SPI-12) during 1960–2024.
The monthly SPI (SPI-1) series changed sign frequently around the zero reference line, reflecting high short-term precipitation variability. Both negative and positive anomalies occurred throughout the study period, with several pronounced dry episodes reaching values below −2.0 and wet anomalies exceeding +2.0 (Figure 2a).
With increasing accumulation time, short-term fluctuations were progressively smoothed, revealing more persistent seasonal and interannual dry and wet phases. The SPI-3 series captured recurring precipitation deficits and surpluses, with several pronounced negative episodes and positive anomalies distributed throughout the record (Figure 2b). The SPI-6 series highlighted medium-term persistence, showing notable dry episodes during the early 1960s, the early 1970s, the late 1970s, and around 1999–2001, followed by more variable conditions and several positive anomalies during the 2000s and 2010s (Figure 2c).
The long-term SPI-12 series displayed the strongest temporal persistence, revealing alternating multi-year dry and wet phases. Pronounced negative conditions occurred during the early 1960s, the early 1970s, the late 1970s to early 1980s, and around 1999–2002. More sustained positive conditions were evident during parts of the 2000s, the early to mid-2010s, and toward the end of the study period (Figure 2d). Overall, the figure illustrates substantial temporal variability in precipitation conditions across all accumulation scales, while the longer time scales emphasize the persistence of dry and wet episodes more clearly [21].
The WorldClim-derived SPI series exhibited substantial temporal variability across the four accumulation scales, with shorter accumulation periods showing more pronounced short-term fluctuations and longer scales progressively smoothing these variations (Figure 3). The SPI-1 and SPI-3 series frequently alternated between positive and negative conditions, reflecting substantial monthly and seasonal precipitation variability, whereas the SPI-6 and SPI-12 series more clearly highlighted persistent wet and dry phases.
Figure 3.
Temporal variation of WorldClim-derived (a) monthly SPI (SPI-1), (b) 3-month SPI (SPI-3), (c) 6-month SPI (SPI-6), and (d) 12-month SPI (SPI-12) in Tuzluca District during 1960–2024. The dashed horizontal line indicates the zero reference level.
The SPI-1 and SPI-3 series showed pronounced negative anomalies at several points throughout the record, interspersed with positive anomalies (Figure 3a,b). The SPI-6 series revealed more persistent dry episodes, particularly during the early 1960s, the early 1970s, around 1990–1991, and approximately 1999–2002, followed by alternating dry and wet conditions in subsequent years (Figure 3c).
The WorldClim-derived SPI-12 series displayed distinct multi-year dry and wet phases (Figure 3d). Pronounced negative conditions occurred during the early 1960s, the early 1970s, the late 1970s to early 1980s, and around 1999–2002. In contrast, predominantly positive conditions were observed during parts of the 2000s and early 2010s. Negative anomalies reappeared during several periods after 2015, including around 2020–2023, followed by a shift toward positive conditions in 2024. Overall, the WorldClim-derived SPI series illustrated substantial variability across accumulation scales, with longer time scales providing a clearer representation of persistent precipitation deficits and surpluses.
3.2. SPEI Results
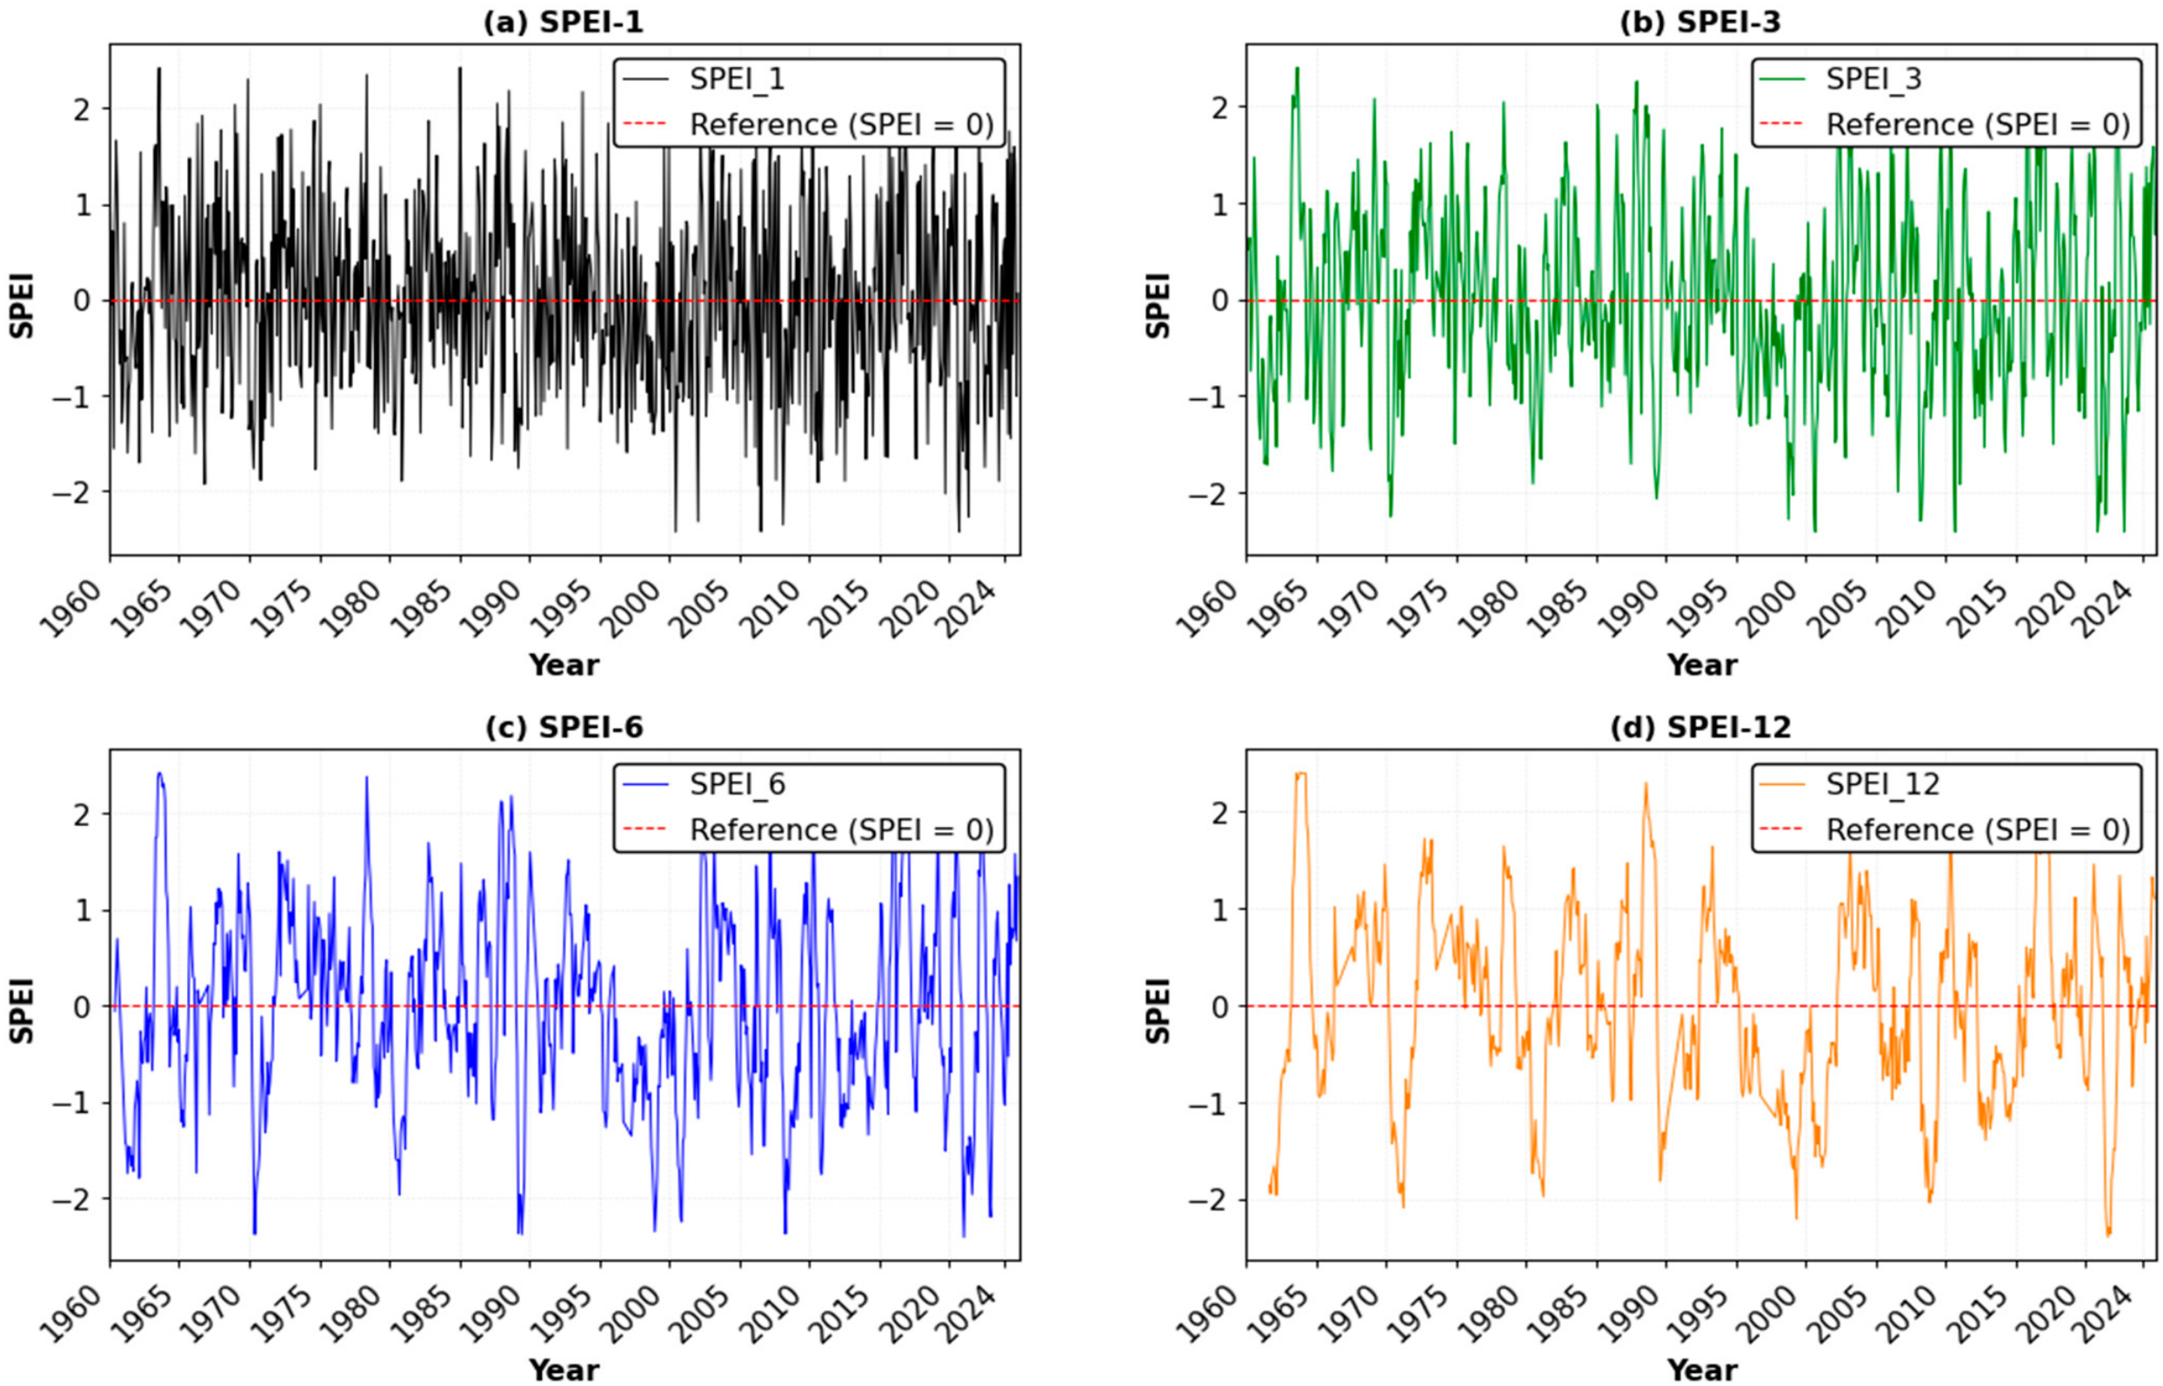
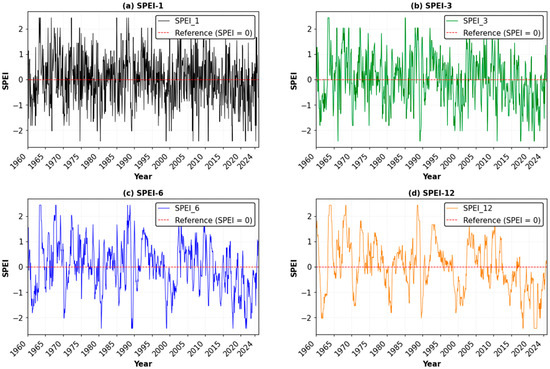
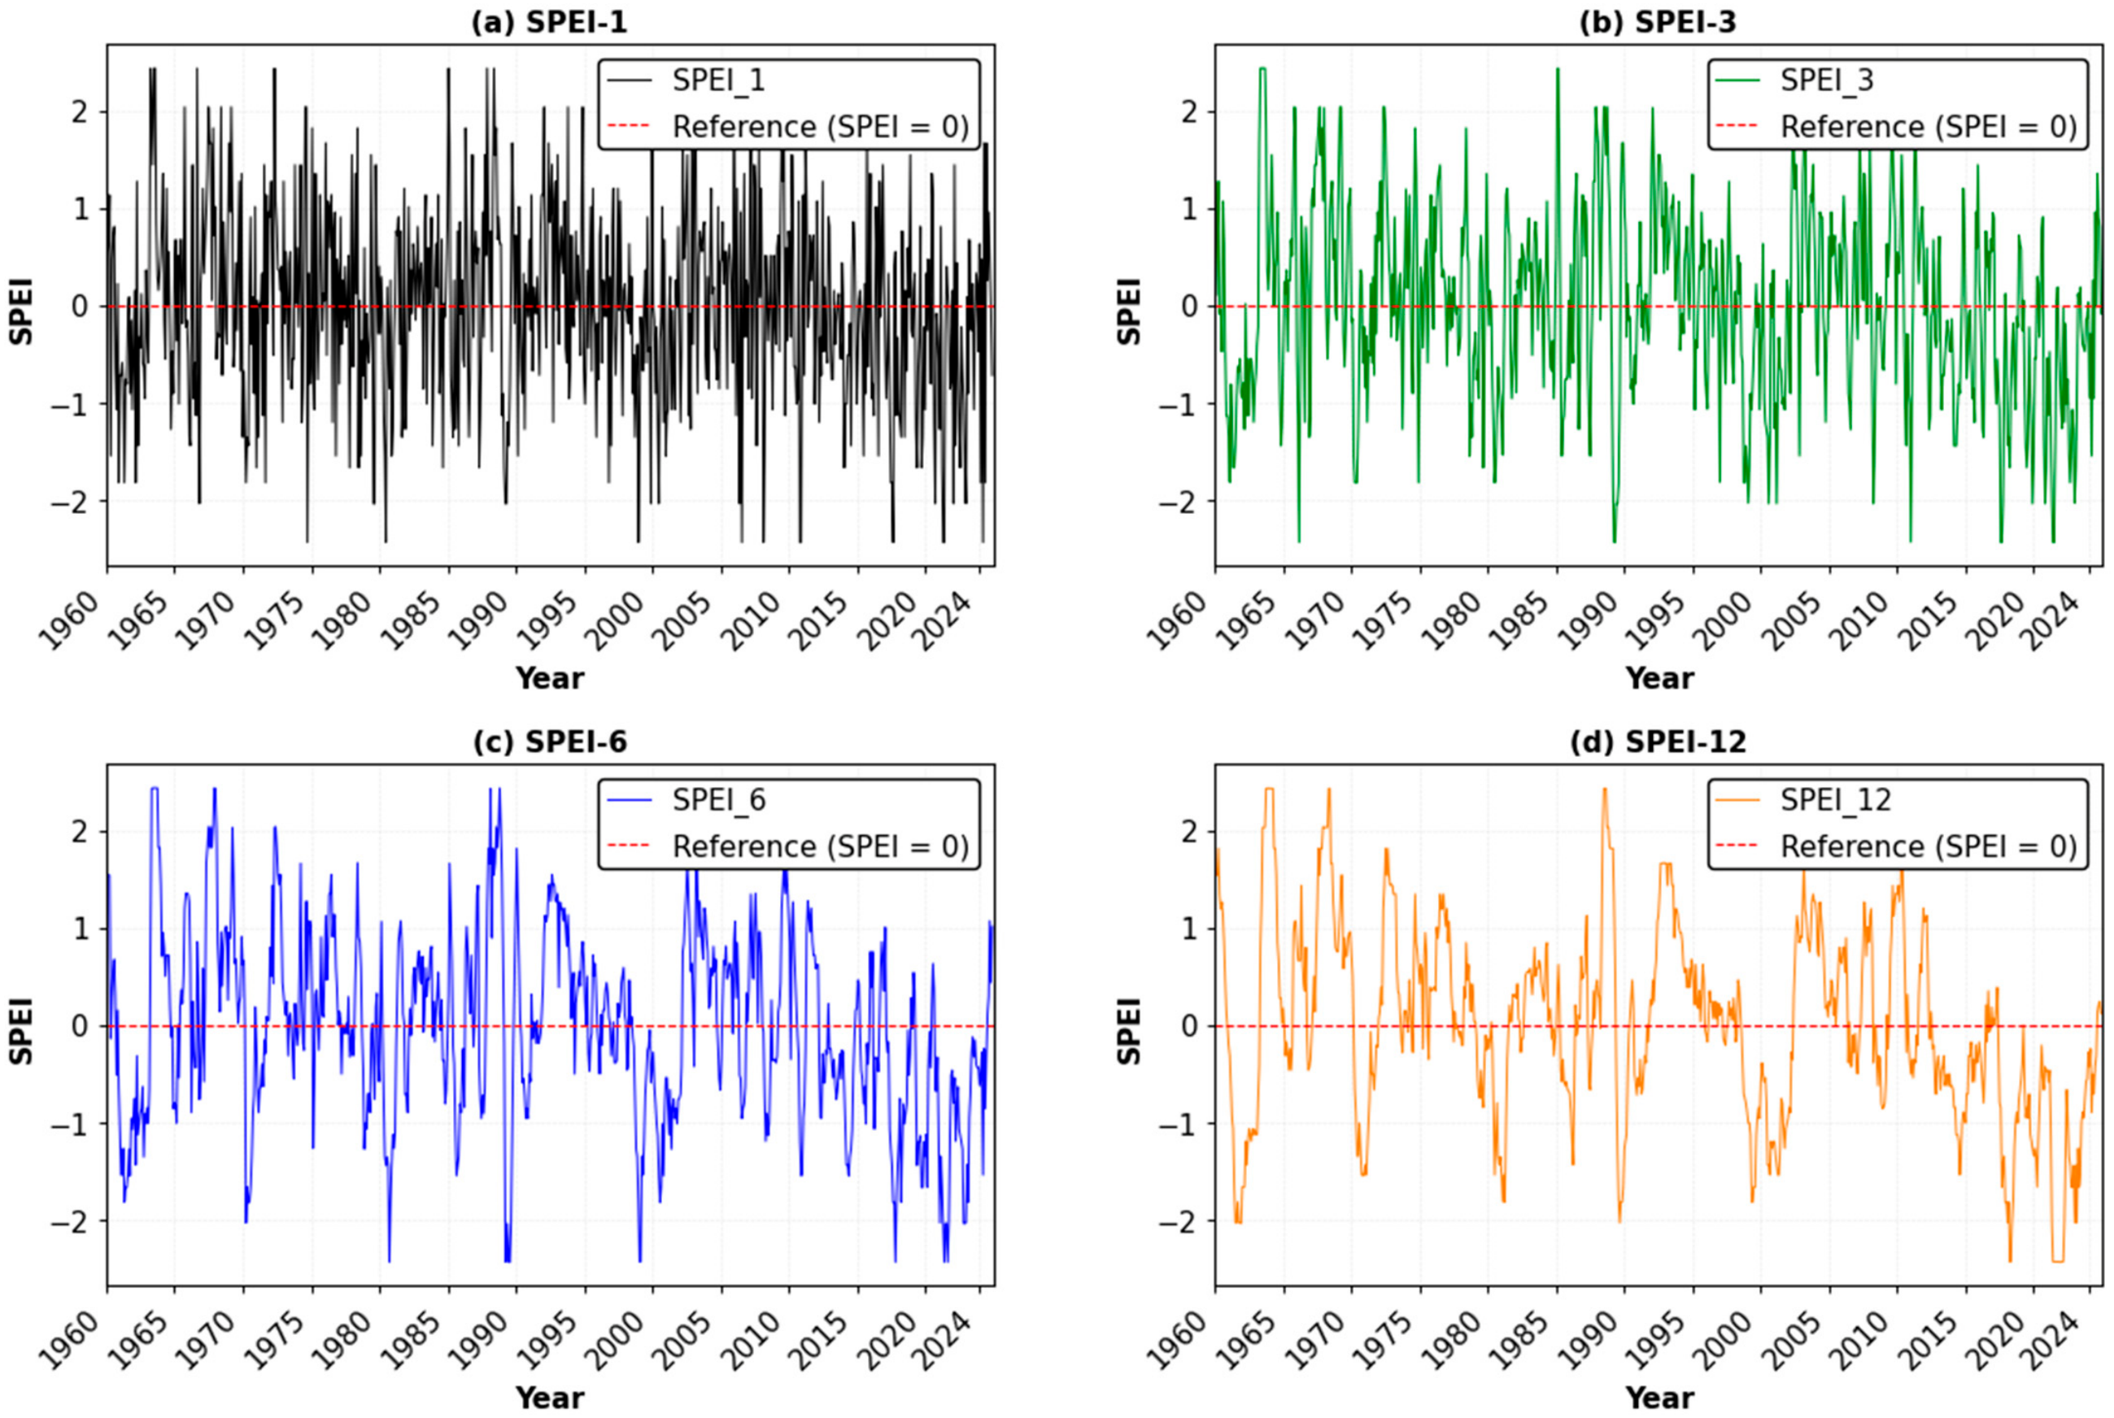
SPEI series exhibited substantial temporal variability across all accumulation scales during 1960–2024, with short-term fluctuations becoming progressively smoother and dry and wet conditions becoming more persistent as the accumulation period increased (Figure 4).
Figure 4.
Temporal variation of (a) monthly SPEI, (b) 3-month SPEI (SPEI-3), (c) 6-month SPEI (SPEI-6), and (d) 12-month SPEI (SPEI-12) during 1960–2024.
The monthly SPEI-1 series showed frequent alternations between negative and positive anomalies, reflecting pronounced short-term variability in climatic water balance. Both dry and wet anomalies occurred throughout the study period, with several negative values falling below −2.0 and positive values exceeding +2.0 (Figure 4a).
As the accumulation period increased, the high-frequency variability observed in SPEI-1 was reduced, revealing more persistent seasonal and interannual drought and wetness phases. The SPEI-3 series captured recurring negative and positive anomalies, with pronounced dry episodes around 1970–1972, 1999–2002, and 2021–2023. Positive conditions were evident during several periods, particularly in the mid-1960s, the 1970s, the late 1980s, and parts of the 2000s and 2010s (Figure 4b). The SPEI-6 series highlighted more persistent medium-term conditions, with notable negative episodes during the early 1960s, the late 1970s, around 1990–1992, and approximately 1999–2003. Additional negative anomalies occurred during the early 2020s, interspersed with positive episodes (Figure 4c).
The SPEI-12 series exhibited the strongest temporal persistence, clearly identifying extended dry and wet phases. Pronounced negative conditions occurred during the early 1960s, around 1972–1973, the late 1970s to early 1980s, and approximately 1999–2003. Further negative anomalies were observed around 2010–2012 and 2021–2023. In contrast, positive conditions were evident during parts of the late 1960s and 1970s, around 1988–1991, and during several periods after 2005 (Figure 4d).
The WorldClim-derived SPEI series exhibited substantial temporal variability across all four accumulation scales, with short-term fluctuations progressively smoothing as the accumulation period increased (Figure 5). The SPEI-1 and SPEI-3 series frequently alternated between positive and negative anomalies, reflecting pronounced short-term variability in climatic water balance, whereas the SPEI-6 and SPEI-12 series more clearly highlighted persistent dry and wet phases.
Figure 5.
Temporal variation of WorldClim-derived Standardized Precipitation Evapotranspiration Index (SPEI) at (a) 1-month (SPEI-1), (b) 3-month (SPEI-3), (c) 6-month (SPEI-6), and (d) 12-month (SPEI-12) accumulation scales in Tuzluca District during 1960–2024. The dashed horizontal line indicates the zero reference level.
The SPEI-1 and SPEI-3 series showed alternating dry and wet conditions throughout the record, with pronounced negative anomalies occurring at several points, including around 1991, 2000–2002, and 2021–2023 (Figure 5a,b). The SPEI-6 series revealed more persistent moisture deficits during the early 1960s, around 1980–1982, the early 1990s, and approximately 2000–2002. Negative conditions became particularly evident again during 2019–2024, indicating a prolonged period of below-normal climatic water balance (Figure 5c).
The WorldClim-derived SPEI-12 series displayed distinct multi-year dry and wet phases (Figure 5d). Positive conditions were prominent during parts of the late 1960s and early 1970s, around 1990–1993, and during several periods between 2005 and 2012. In contrast, pronounced negative phases occurred around 1980–1982, 1999–2002, and particularly during 2020–2024, when SPEI-12 reached values below −2.0. These negative values indicate substantial climatic water-balance deficits over the corresponding accumulation periods.
3.3. PNI Results
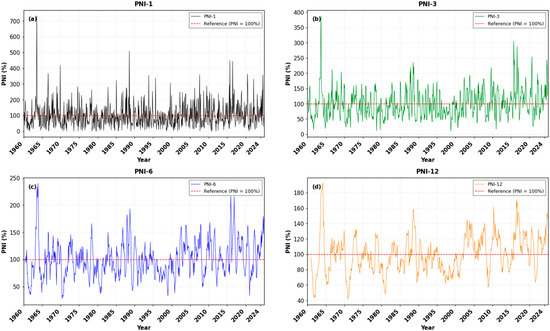
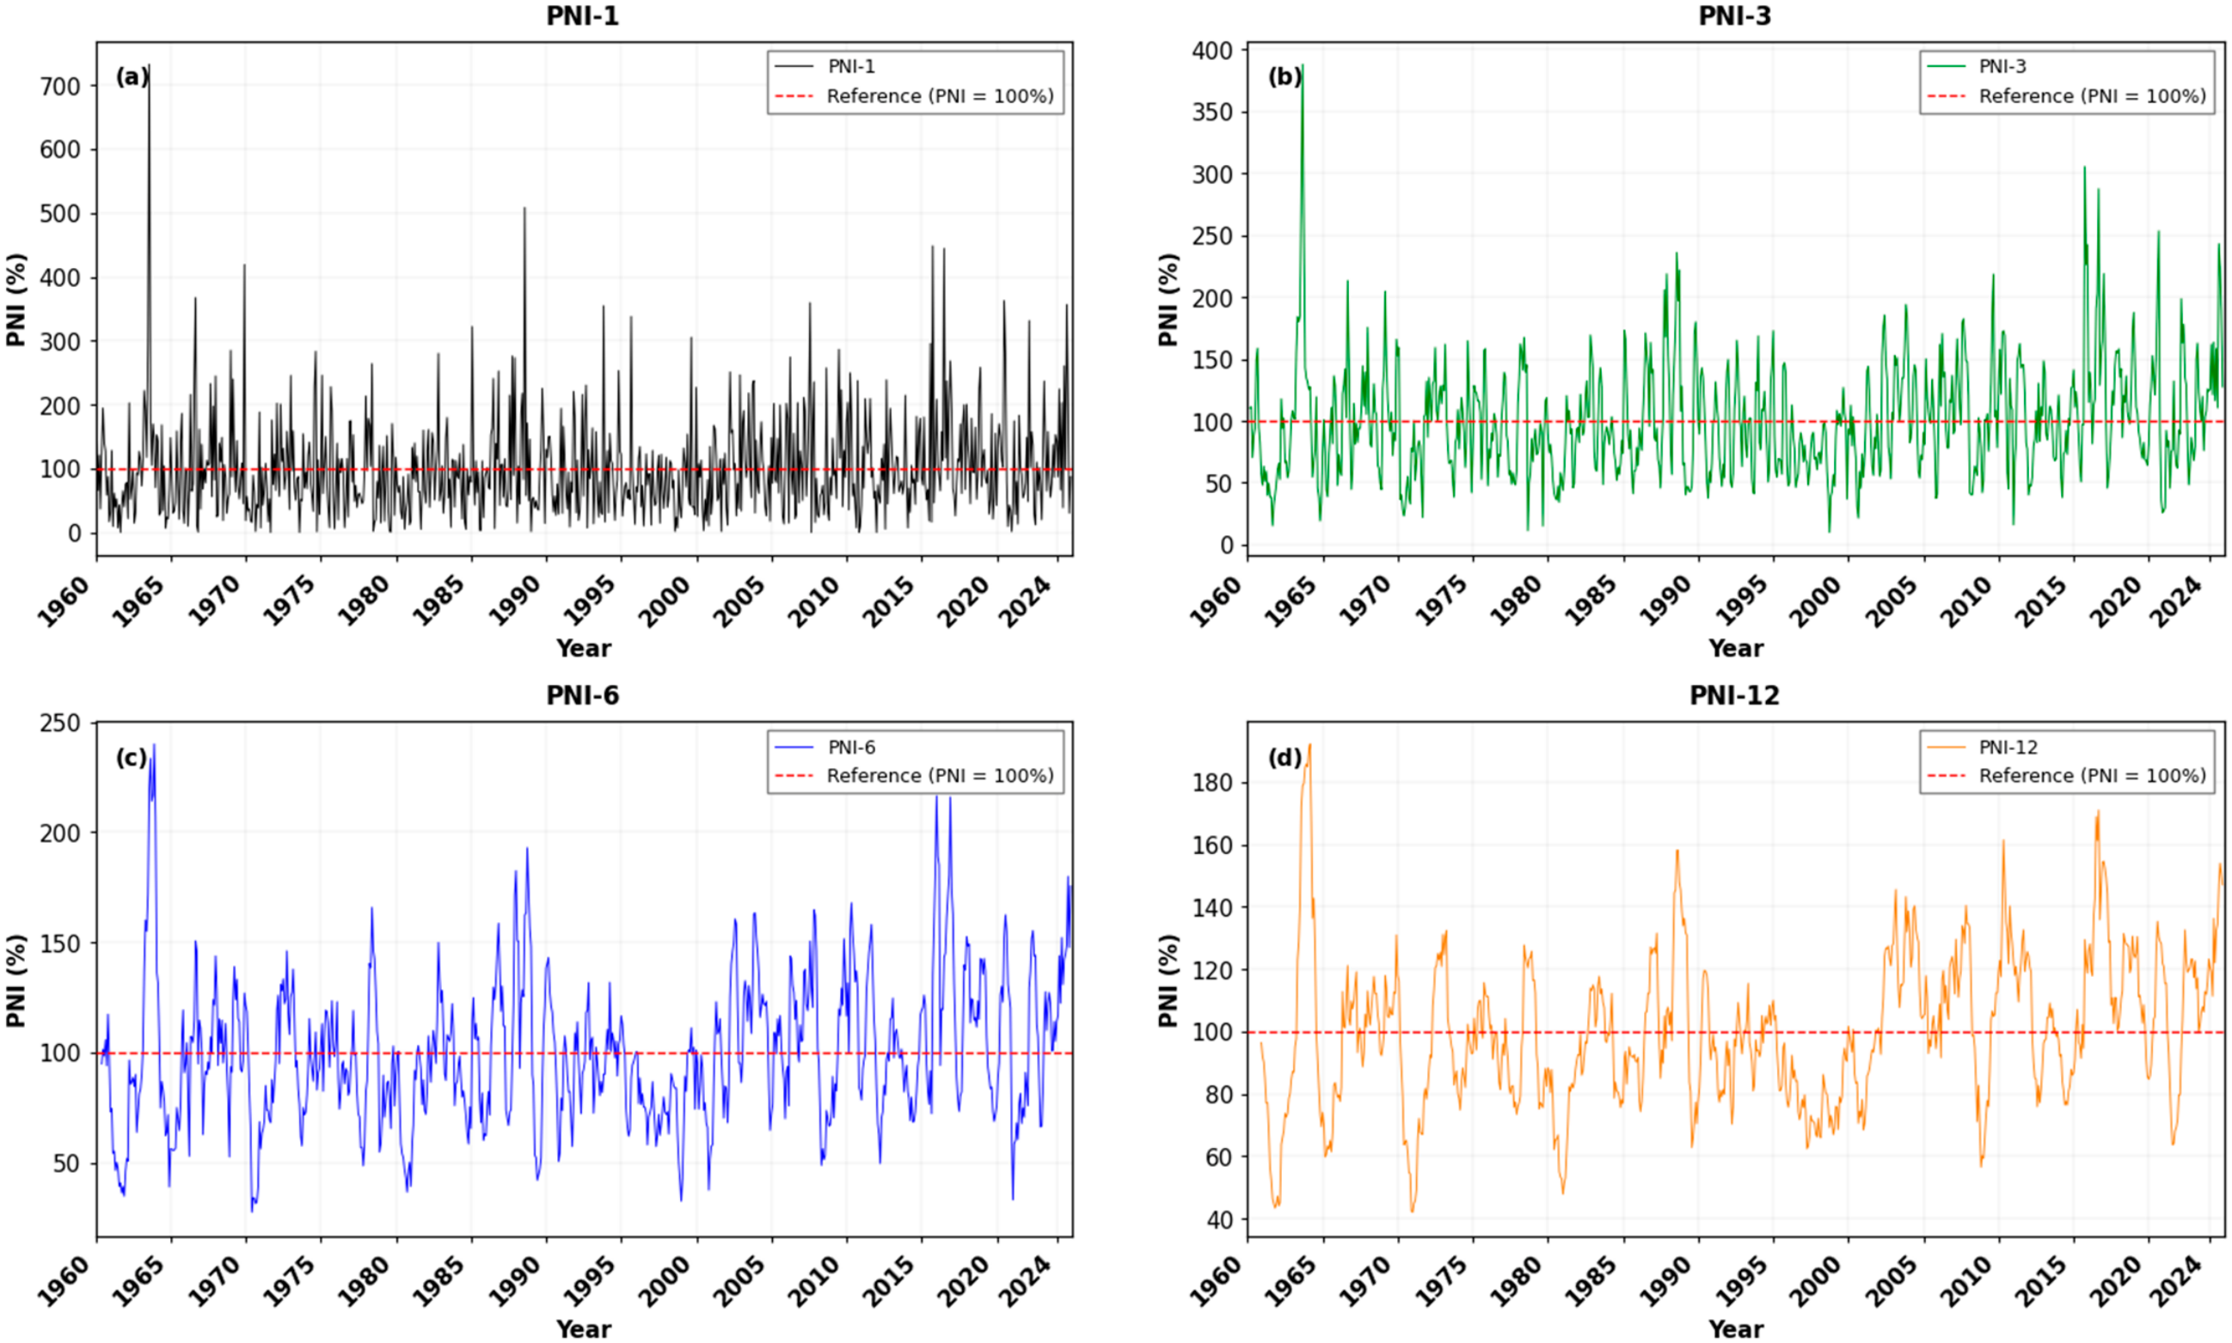
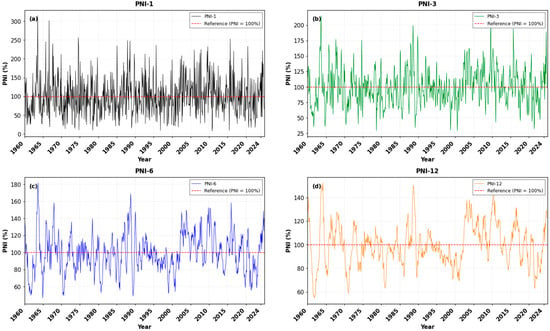
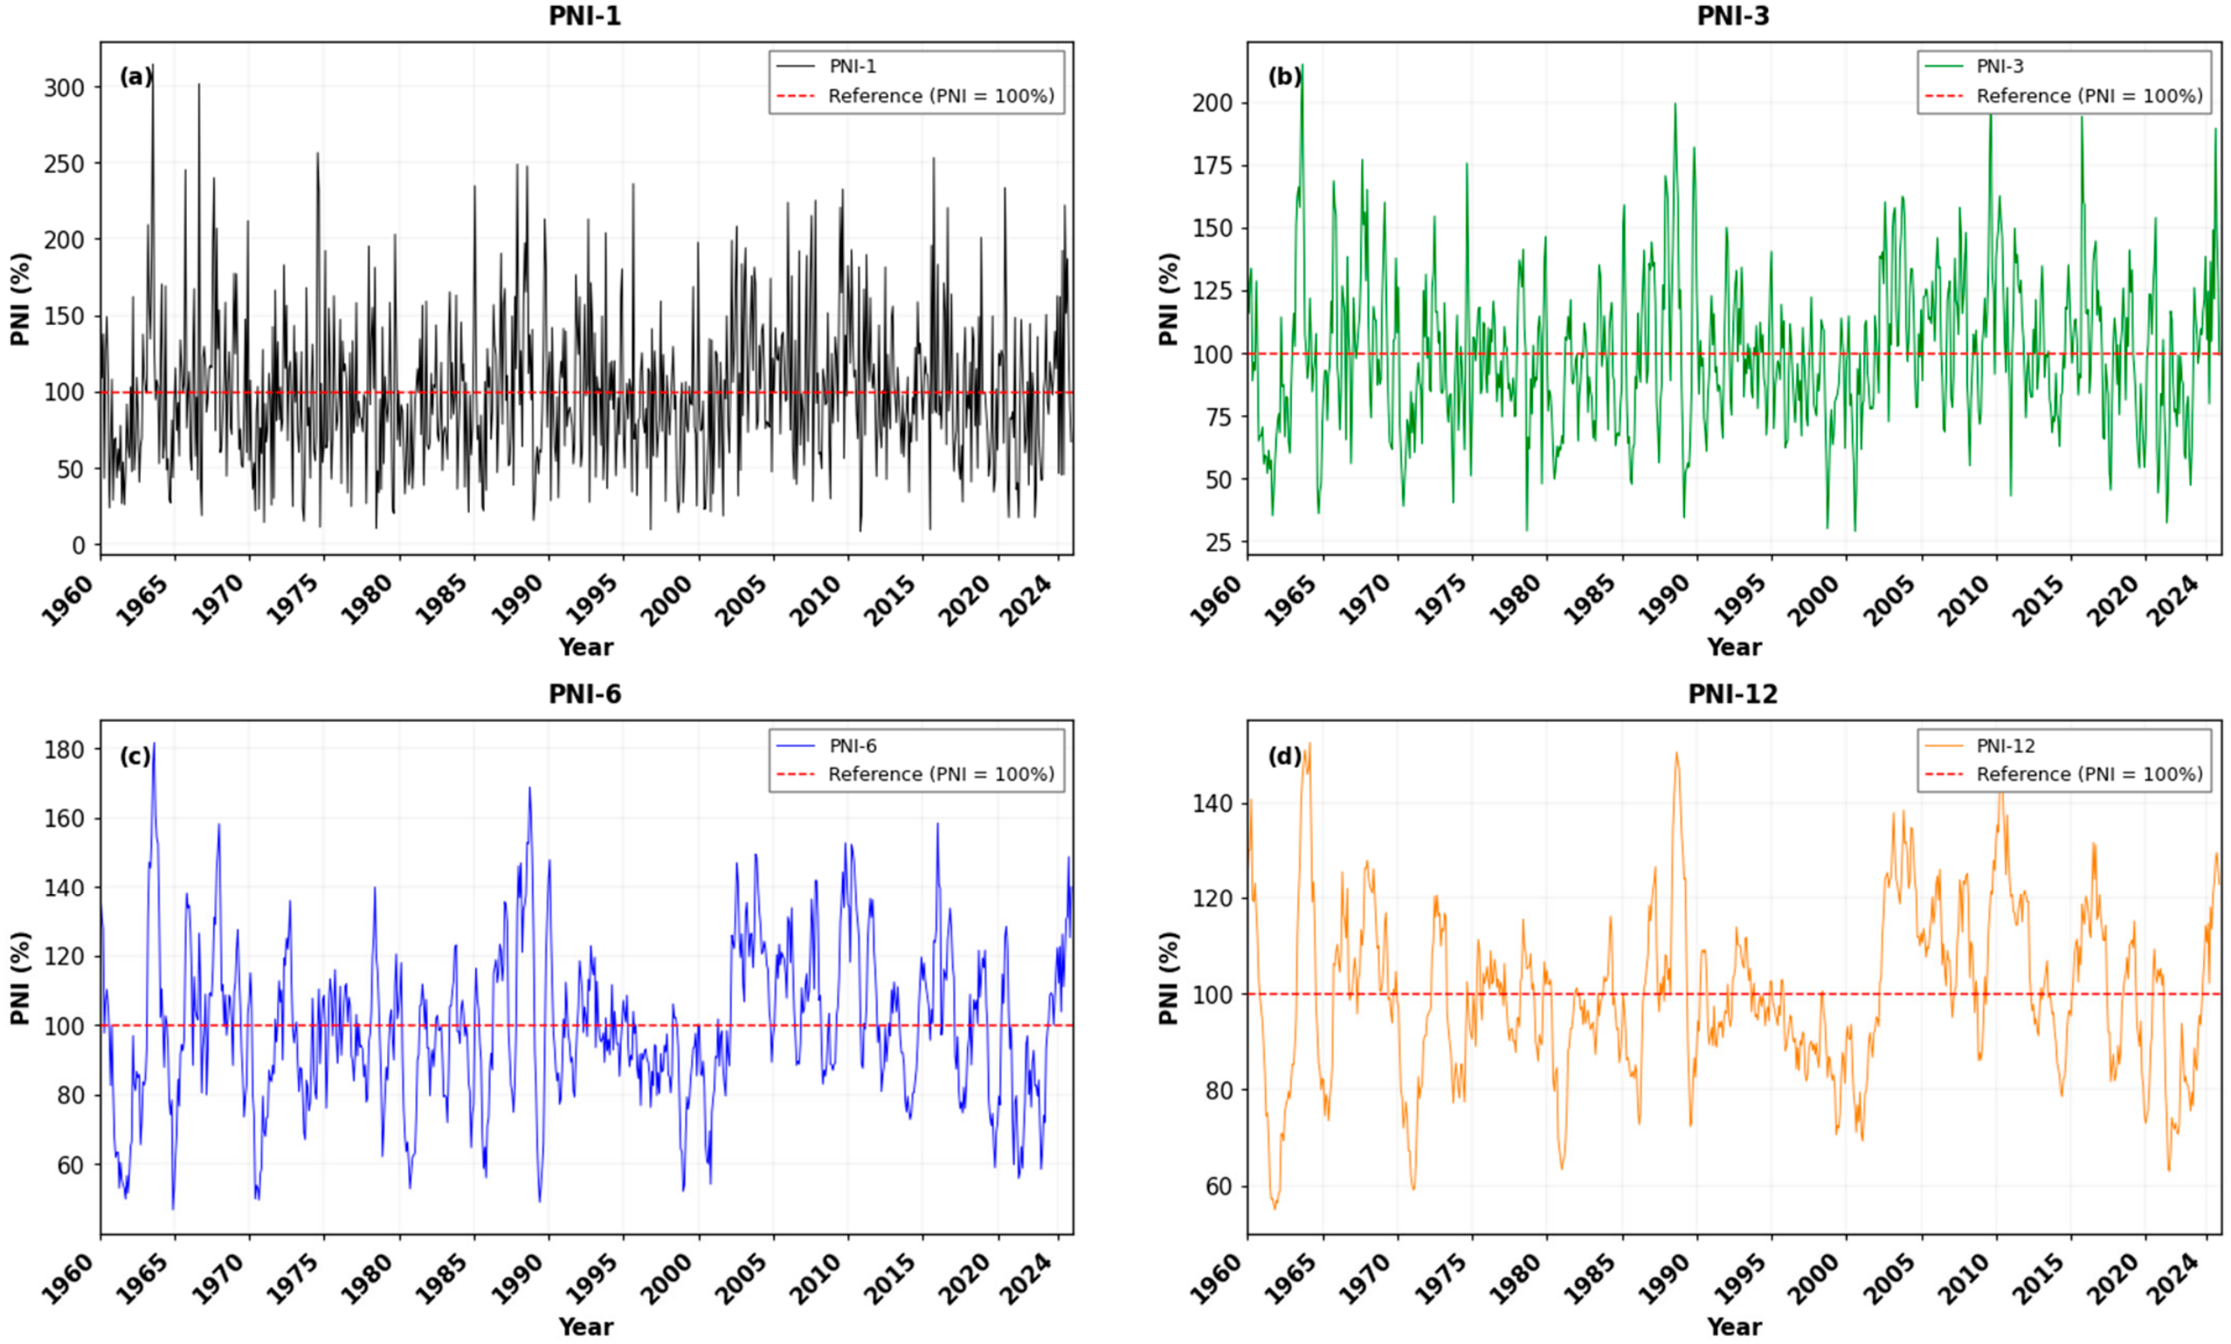
PNI series exhibited substantial variability around the 100% normal reference line across all four accumulation scales, with short-term fluctuations progressively smoothing into more persistent seasonal and interannual precipitation anomalies as the accumulation period increased (Figure 6).
Figure 6.
Temporal variation of (a) monthly PNI, (b) 3-month PNI (PNI-3), (c) 6-month PNI (PNI-6), and (d) 12-month PNI (PNI-12) during 1960–2024.
The monthly PNI (PNI-1) series displayed the highest temporal variability, frequently alternating between precipitation deficits and surpluses. Values generally fluctuated around the 100% reference line, with several pronounced positive anomalies exceeding 300% and occasional extreme peaks above 500%. Conversely, precipitation deficits below 50% occurred at multiple points throughout the study period (Figure 6a).
As the accumulation scale increased, short-term fluctuations were progressively reduced, revealing more persistent precipitation regimes. The PNI-3 series captured recurring seasonal anomalies, with pronounced wet conditions during the mid-1960s, the late 1980s, and several periods after 2005. Negative anomalies were also evident, particularly around 1998–2002 and during parts of the early 2020s (Figure 6b). The PNI-6 series highlighted medium-term variability, with sustained precipitation deficits during the early 1960s, the early 1970s, the late 1970s, and approximately 1998–2002. In contrast, above-normal precipitation became more prominent during several periods after 2005 and toward the end of the record (Figure 6c).
The PNI-12 series displayed the strongest temporal persistence, delineating multi-year precipitation deficit and surplus phases (Figure 6d). Prolonged below-normal conditions occurred during the early 1960s, around 1971–1973, the late 1970s to early 1980s, and approximately 1998–2002, when values frequently fell below 80%. In contrast, above-normal precipitation was evident during parts of the late 1960s and early 1970s, around 1988–1991, and during several periods between 2005 and 2018. Toward the end of the record, PNI-12 showed alternating conditions, followed by a shift toward above-normal precipitation in 2024. Overall, the PNI results demonstrate substantial temporal variability in precipitation relative to normal conditions, with longer accumulation scales providing a clearer representation of persistent precipitation deficits and surpluses.
The WorldClim-derived PNI series exhibited substantial temporal variability across all four accumulation scales, with short-term fluctuations progressively smoothing as the accumulation period increased (Figure 7). The PNI-1 and PNI-3 series frequently fluctuated above and below the 100% reference line, reflecting pronounced monthly and seasonal variability in precipitation, whereas the PNI-6 and PNI-12 series more clearly highlighted persistent precipitation deficits and surpluses.
Figure 7.
Temporal variation of WorldClim-derived Percent of Normal Precipitation Index (PNI) at (a) 1-month (PNI-1), (b) 3-month (PNI-3), (c) 6-month (PNI-6), and (d) 12-month (PNI-12) accumulation scales in Tuzluca District during 1960–2024. The dashed horizontal line at PNI = 100 represents the normal precipitation level.
The monthly PNI-1 series showed the greatest variability, with values frequently falling below 50% and occasionally exceeding 200%, including an extreme peak above 300% in the mid-1960s (Figure 7a). The PNI-3 series captured recurring seasonal anomalies, with pronounced wet conditions during the mid-1960s, the late 1980s, and around 2010, alongside notable precipitation deficits during the early 1980s, around 2000–2002, and in several years after 2020 (Figure 7b).
The PNI-6 series highlighted medium-term variability, with below-normal precipitation during the early 1960s, the early 1970s, the late 1970s, and around 1998–2003. In contrast, above-normal conditions were evident during parts of the late 1980s and from approximately 2005 to 2015, followed by renewed precipitation deficits in several years after 2020 (Figure 7c).
The PNI-12 series displayed the strongest temporal persistence, revealing distinct multi-year precipitation deficit and surplus phases (Figure 7d). Below-normal precipitation occurred during the early 1960s, around 1971–1973, the late 1970s to early 1980s, and approximately 1998–2002. In contrast, above-normal conditions were prominent during parts of the late 1960s and early 1970s, around 1988–1991, and particularly between 2005 and 2015. After 2015, PNI-12 fluctuated around the 100% reference line, with several below-normal periods extending into the early 2020s and a subsequent increase toward above-normal conditions by 2024. Overall, the WorldClim-derived PNI series illustrates substantial precipitation variability, with longer accumulation periods providing a clearer representation of persistent wet and dry conditions [22].
3.4. RNI Results
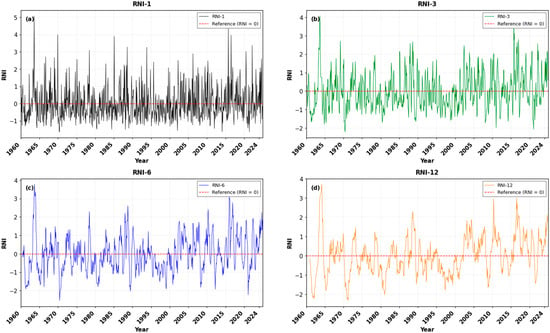
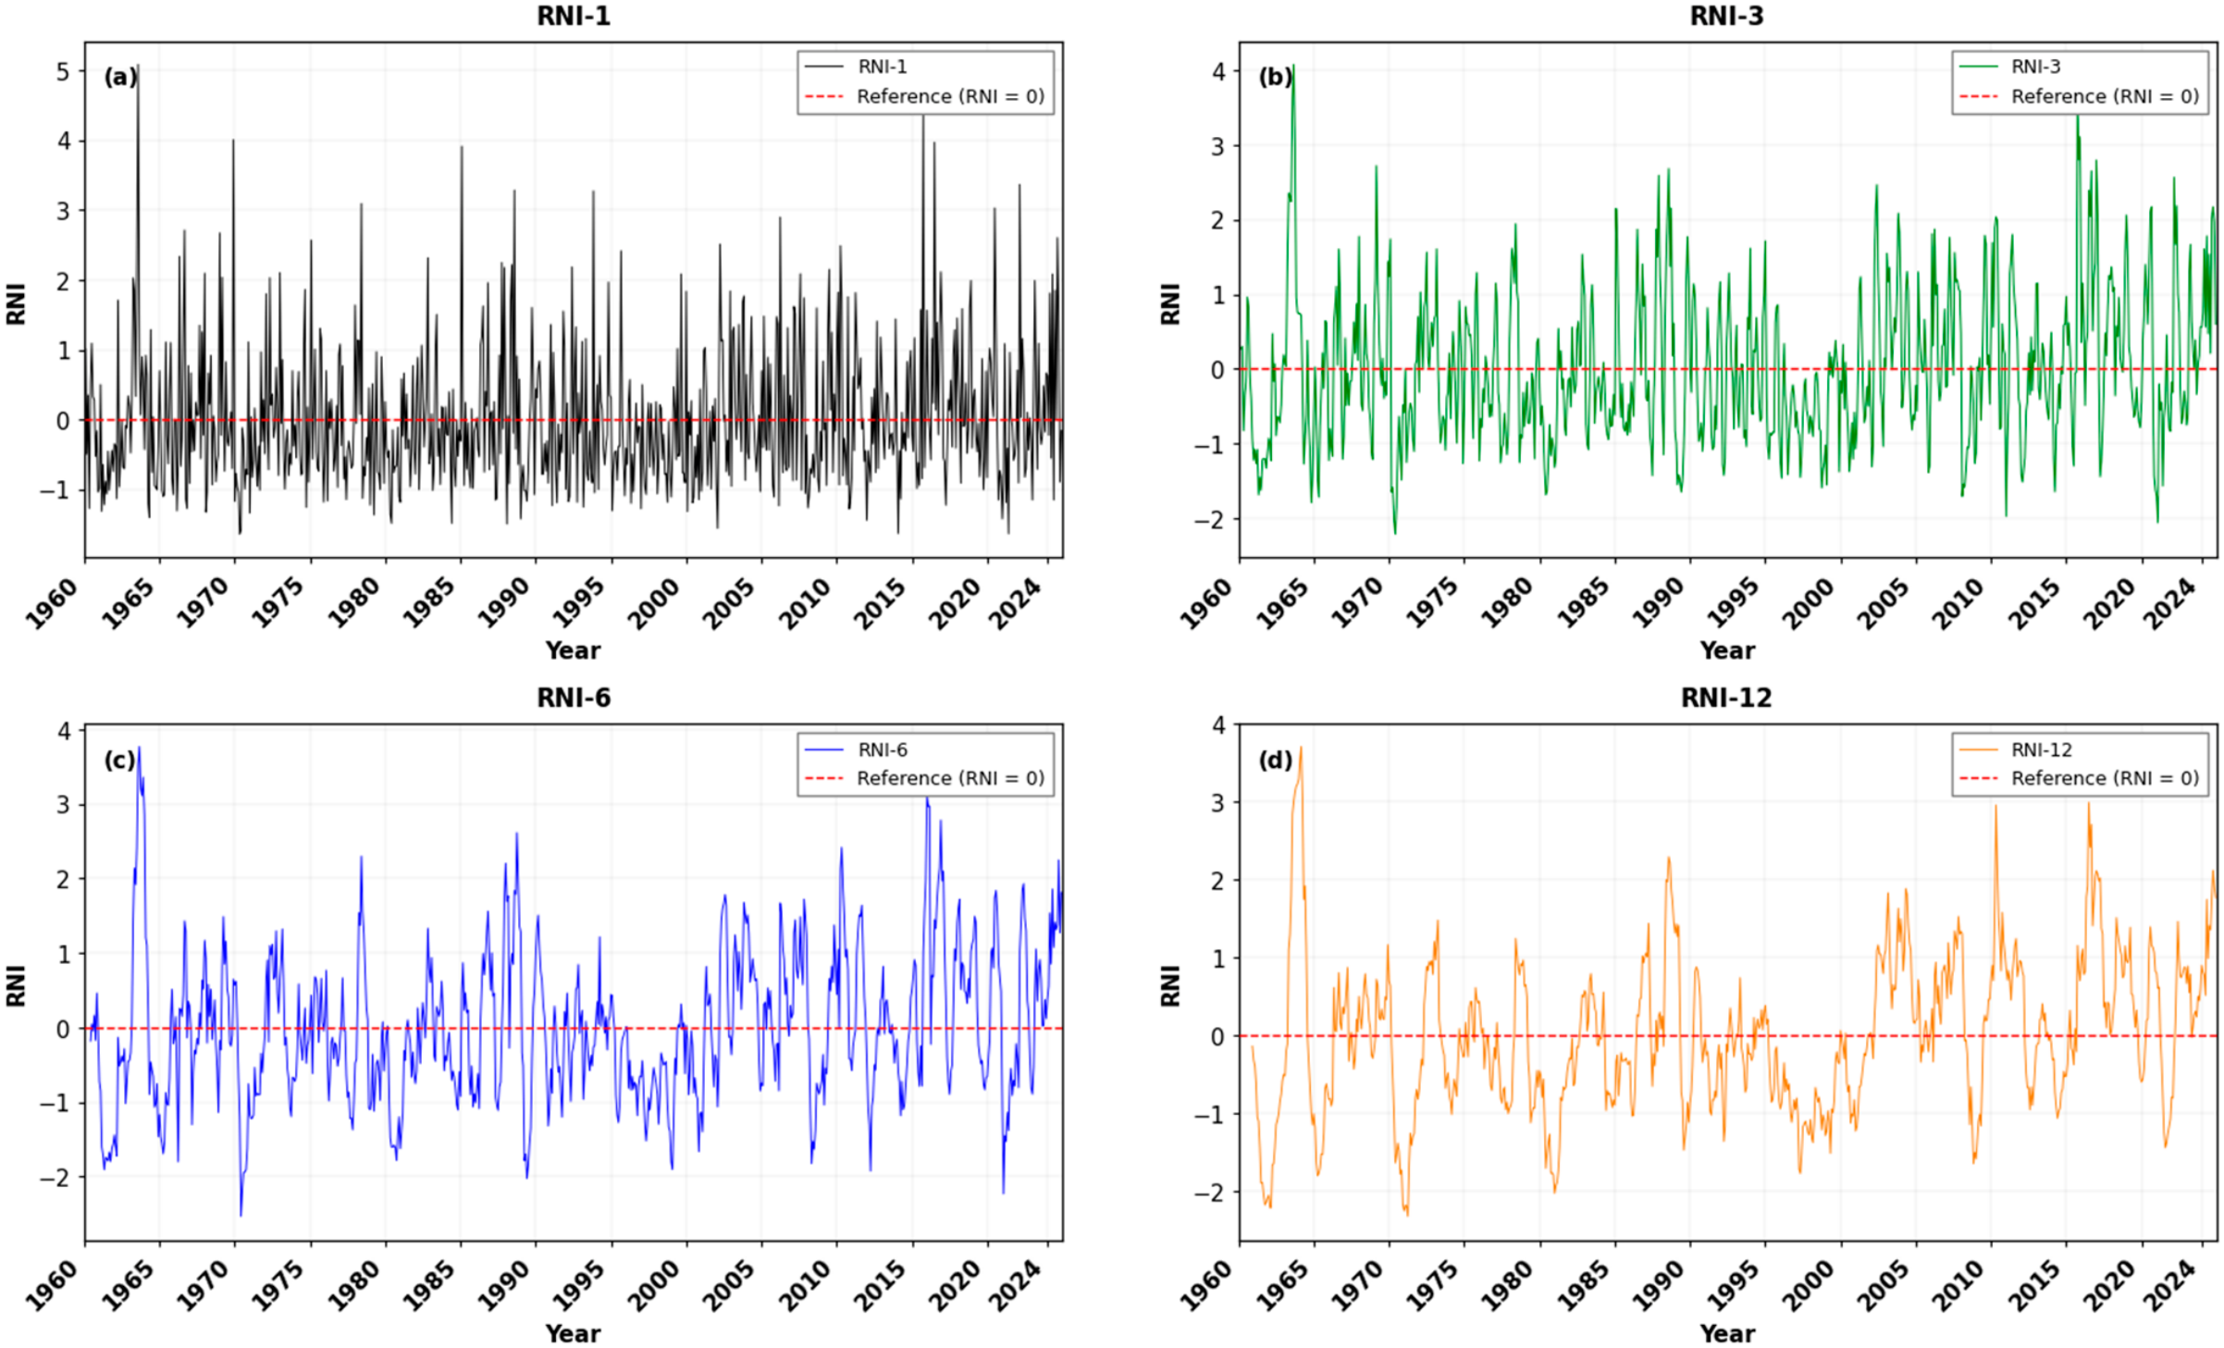
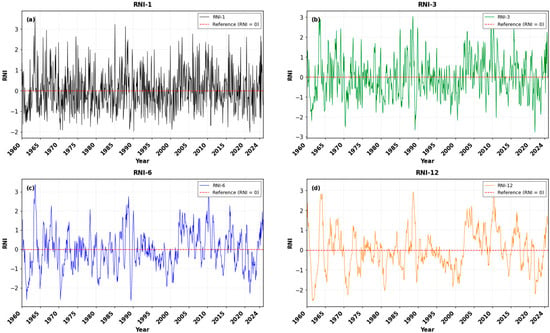
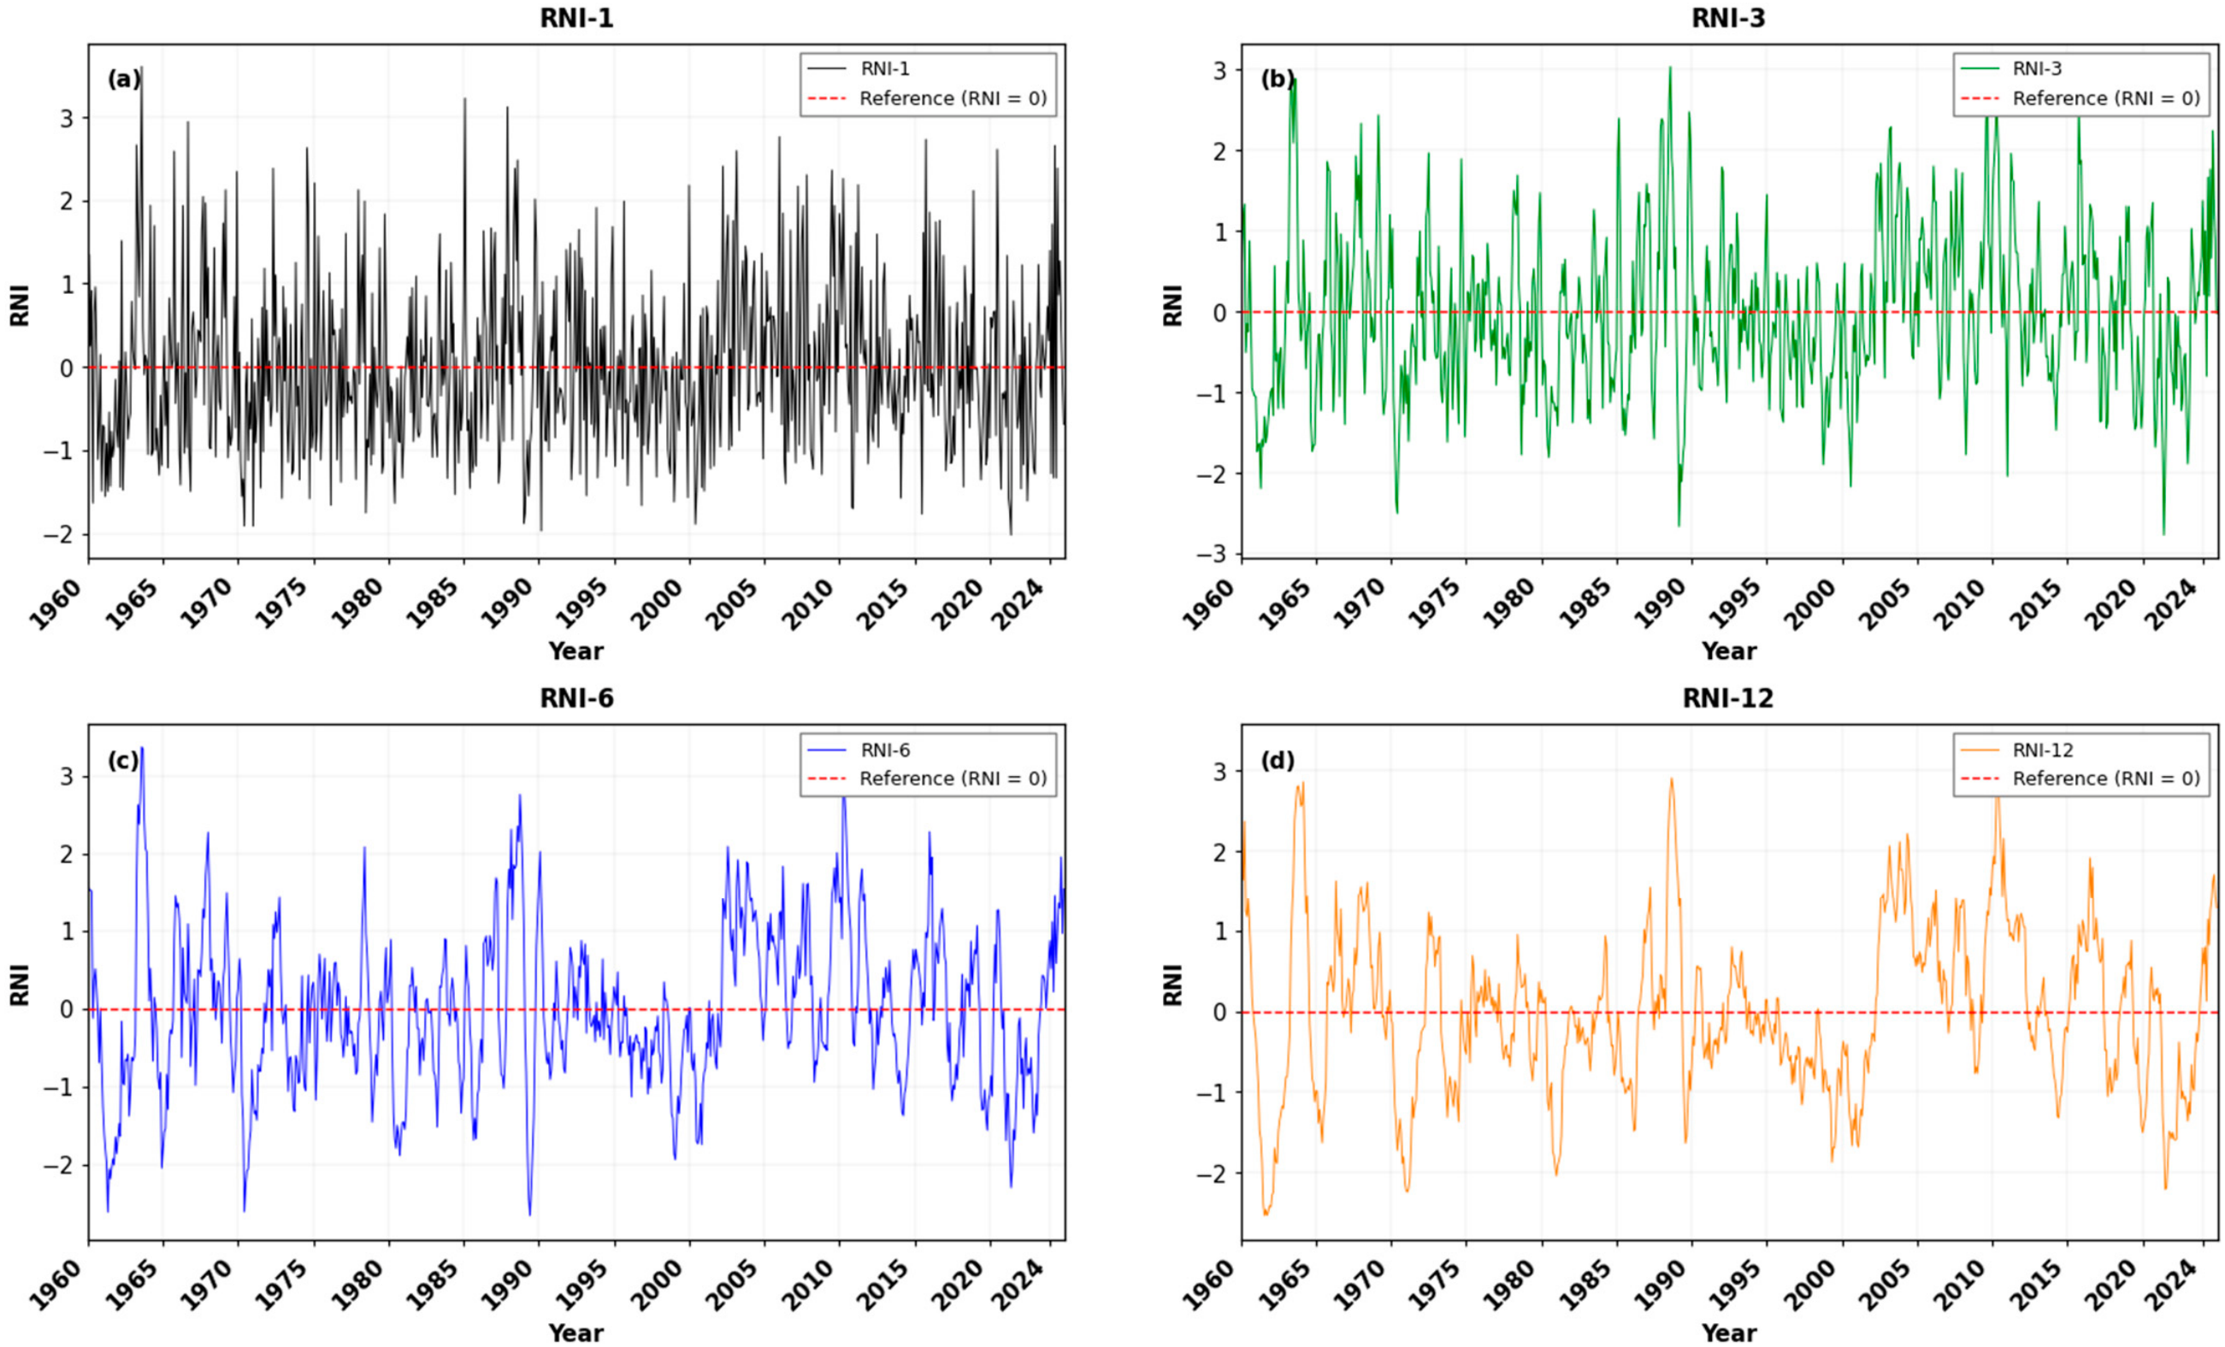
RNI series exhibited substantial temporal variability across all four accumulation scales during 1960–2024, with short-term fluctuations progressively smoothing as the accumulation period increased (Figure 8). The RNI-1 and RNI-3 series frequently alternated between positive and negative anomalies, reflecting pronounced monthly and seasonal precipitation variability, whereas the RNI-6 and RNI-12 series more clearly highlighted persistent wet and dry phases.
Figure 8.
Temporal variation of (a) monthly RNI, (b) 3-month RNI (RNI-3), (c) 6-month RNI (RNI-6), and (d) 12-month RNI (RNI-12) during 1960–2024.
The monthly RNI-1 series displayed the greatest variability, with frequent oscillations around the zero reference line and several pronounced positive and negative anomalies throughout the record (Figure 8a). Extreme positive values exceeded +4 at some points, particularly during the mid-1960s and around 2017–2018, while negative anomalies below −1 occurred repeatedly across the study period.
As the accumulation period increased, short-term fluctuations were progressively smoothed. The RNI-3 series revealed recurring seasonal precipitation anomalies, with pronounced positive conditions during the mid-1960s, the late 1980s, and several periods after 2005. Negative anomalies were evident around 1970–1972, the late 1990s to early 2000s, and parts of the early 2020s (Figure 8b). The RNI-6 series highlighted more persistent medium-term variability, with negative phases during the early 1960s, the early 1970s, the late 1970s to early 1980s, and around 1998–2002. In contrast, positive conditions became more prominent during parts of the late 1980s and after 2005, although negative anomalies reappeared in several years after 2020 (Figure 8c).
The RNI-12 series displayed the strongest temporal persistence, identifying distinct multi-year precipitation anomaly phases (Figure 8d). Pronounced negative conditions occurred during the early 1960s, around 1971–1973, the late 1970s to early 1980s, and approximately 1998–2002. Positive anomalies were prominent during parts of the late 1960s and early 1970s, around 1988–1991, and between approximately 2005 and 2018. After 2018, RNI-12 fluctuated between negative and positive conditions, with several negative episodes extending into the early 2020s, followed by a shift toward positive values near the end of the record.
The WorldClim-derived RNI series exhibited substantial temporal variability across all four accumulation scales, with short-term fluctuations progressively smoothing as the accumulation period increased (Figure 9). The RNI-1 and RNI-3 series frequently alternated between positive and negative anomalies, whereas RNI-6 and RNI-12 more clearly highlighted persistent precipitation anomaly phases.
Figure 9.
Temporal variation of WorldClim-derived Rainfall Normalized Index (RNI) at (a) 1-month (RNI-1), (b) 3-month (RNI-3), (c) 6-month (RNI-6), and (d) 12-month (RNI-12) accumulation scales in Tuzluca District during 1960–2024. The dashed horizontal line at RNI = 0 represents the reference level.
The RNI-6 series showed pronounced negative conditions around 1998–2002 and again during 2020–2023 (Figure 9c). The RNI-12 series displayed distinct multi-year wet and dry phases, with negative anomalies around 1980–1983, 1998–2002, and 2020–2023. The most recent negative phase was followed by a recovery toward positive conditions in 2024, when RNI-12 reached approximately +1.7 (Figure 9d).
Overall, the WorldClim-derived RNI series revealed substantial temporal variability and a recent shift toward positive precipitation anomalies, roadly consistent with the recovery observed in the other drought indices [23].
3.5. Trend Analysis Results
The modified Mann–Kendall test results for the drought indices (SPI-12, SPEI-12, PNI-12, and RNI-12) during 1960–2024 are presented in Table 4. The analysis was conducted using annual mean series, with 65 annual observations for each index, and the Hamed–Rao [18] modification was applied to account for the influence of serial correlation on the variance of the Mann–Kendall statistic. The results indicate different directional tendencies among the drought indices. SPI-12, PNI-12, and RNI-12 exhibited positive Z statistics of 2.0191, 1.9997, and 2.0299, respectively, indicating increasing trends. In contrast, SPEI-12 exhibited a negative Z statistic of −1.1451, indicating a decreasing tendency. At the 95% confidence level (a = 0.05), the increasing trends in SPI-12 (p = 0.0435), PNI-12 (p = 0.0455), and RNI-12 (p = 0.0424) were statistically significant, whereas the decreasing trend in SPEI-12 was not statistically significant (p = 0.2522).
Table 4.
Trend analysis results for annual drought indices using the Mann–Kendall test and Sen’s slope estimator (1960–2024).
The modified Mann–Kendall results therefore indicate statistically significant increasing trends in the annual mean SPI-12, PNI-12, and RNI-12 series. The positive Z statistics for these indices are consistent with their increasing directions, while the negative Z statistic for SPEI-12 indicates a decreasing tendency. However, this decrease was not statistically significant, suggesting that the analysis did not provide sufficient evidence of a monotonic trend in SPEI-12 during the study period.
Sen’s slope estimates further quantify the magnitude and direction of the observed trends. The estimated slopes were 0.0147 index units per year for SPI-12, −0.0063 index units per year for SPEI-12, 0.3527 percentage points per year for PNI-12, and 0.0142 index units per year for RNI-12. The positive slopes for SPI-12, PNI-12, and RNI-12 indicate increasing tendencies, whereas the negative slope for SPEI-12 indicates a decreasing tendency. The SPEI-12 slope should be interpreted cautiously because its corresponding trend was not statistically significant. The larger numerical slope of PNI-12 reflects the different scale and formulation of this index and should not be directly compared with the slopes of the other indices.
Overall, the modified trend analysis indicates statistically significant increases in annual mean SPI-12, PNI-12, and RNI-12 during 1960–2024, while SPEI-12 exhibited a nonsignificant decreasing tendency [24]. These findings highlight differences in the trends identified by the drought indices and emphasize the importance of considering both precipitation-based indices and the precipitation–evapotranspiration balance when assessing long-term drought variability in Tuzluca District.
The autocorrelation diagnostics for the annual mean index series are summarized by the lag-1 autocorrelation coefficients and the Ljung–Box test results at lag 5. The lag-1 autocorrelation coefficients were 0.3374 for SPI-12, 0.3131 for SPEI-12, 0.3335 for PNI-12, and 0.3336 for RNI-12, indicating positive first-order serial dependence in all four series. The corresponding Ljung–Box test p-values at lag 5 were 0.0653, 0.0707, 0.0707, and 0.0722, respectively. None of these Ljung–Box p-values was below the 0.05 significance threshold. Thus, although the lag-1 coefficients indicated positive first-order dependence, the Ljung–Box tests did not provide statistically significant evidence of joint autocorrelation through lag 5 at the 5% level. The modified Mann–Kendall results were therefore interpreted with the potential influence of serial dependence in mind.
3.6. Sensitivity Analysis of Missing-Data Interpolation
The sensitivity analysis evaluated the influence of missing-data treatment on SPI and SPEI at 1-, 3-, 6-, and 12-month accumulation scales. Relative to the linear-interpolation baseline, the monthly mean scenario produced lower root mean square errors (RMSEs) than the monthly median scenario for all eight indices. For the monthly mean scenario, RMSE ranged from 0.03745 for SPEI-12 to 0.04704 for SPEI-1, whereas the monthly median scenario yielded RMSE values ranging from 0.04707 for SPEI-12 to 0.06165 for SPEI-1. The mean absolute errors were also generally small, ranging from 0.00587 to 0.01470 for the monthly mean scenario and from 0.00758 to 0.02079 for the monthly median scenario. These results indicate that the alternative gap-filling scenarios produced index series that were generally close to those obtained using linear interpolation, although the magnitude of the differences varied with the index and accumulation scale.
The maximum absolute differences between the alternative gap-filling scenarios and the linear-interpolation baseline varied across indices and accumulation scales. For the monthly median scenario, these differences ranged from 0.3780 for SPEI-12 to 1.4167 for SPEI-1, whereas the monthly mean scenario yielded values ranging from 0.2990 for SPEI-12 to 1.0598 for SPEI-1.
Changes in drought/wetness classification were limited across the alternative gap-filling scenarios. Relative to the linear-interpolation baseline, the monthly median scenario changed the classification of 1–11 observations across the eight SPI and SPEI series, corresponding to 0.13–1.43% of the compared observations. The monthly mean scenario changed 1–9 observations, corresponding to 0.13–1.16%. The largest number of classification changes occurred for SPI-12 under the monthly median scenario (11 observations; 1.43%) and for SPEI-3 under the monthly mean scenario (9 observations; 1.16%). Overall, these results indicate that the alternative gap-filling methods generally preserved the drought/wetness classifications, although a small number of observations changed category.
The drought-event comparison showed that the number and duration of identified events were broadly similar across the three interpolation scenarios, although some differences occurred at individual accumulation scales. Under linear interpolation, 21 SPI-12 drought events comprising 116 drought months and 22 SPEI-12 events comprising 122 drought months were identified. The monthly median scenario yielded 20 SPI-12 events and 112 drought months, whereas the monthly mean scenario yielded 21 events and 114 drought months. For SPEI-12, the monthly median scenario yielded 22 events and 123 drought months, while the monthly mean scenario yielded 21 events and 121 drought months. These differences indicate that the choice of gap-filling method did not substantially alter the overall event counts, but could affect the timing or duration of individual drought episodes.
The repeated holdout cross-validation results provided an additional comparison of the three gap-filling methods based on 4000 test estimates per method from 200 repetitions. The monthly median method yielded an MAE of 10.22 mm, an RMSE of 14.55 mm, and a mean error of −3.82 mm. The monthly mean method yielded an MAE of 10.83 mm, an RMSE of 14.13 mm, and a mean error of 0.20 mm. Linear interpolation produced the largest errors, with an MAE of 14.04 mm, an RMSE of 18.59 mm, and a mean error of 3.71 mm. Thus, the monthly median method had the lowest MAE, whereas the monthly mean method had the lowest RMSE and a mean error closest to zero. These results indicate that the relative performance of the gap-filling methods depended on the error metric used. The cross-validation findings should be interpreted as an empirical comparison based on observed precipitation values rather than as direct validation of the five unknown missing observations.
3.7. Correlation Between SPI and SPEI
The quantitative comparison revealed significant positive associations between SPI and SPEI across all accumulation timescales (Table 5). Pearson’s correlation coefficients ranged from 0.378 to 0.434, indicating moderate linear relationships, whereas Spearman’s rank correlation coefficients ranged from 0.713 to 0.815, indicating stronger monotonic associations. The strongest rank correlation was observed at the 1-month timescale (p = 0.815), while the 12-month timescale exhibited the weakest linear correlation (r = 0.378). These findings suggest that SPI and SPEI generally capture related temporal variations in drought conditions, although their numerical responses are not identical. The differences are consistent with the distinct formulations of the indices, particularly the inclusion of potential evapotranspiration in SPEI [25].
Table 5.
Correlations between SPI and SPEI at different accumulation timescales during 1960–2024.
3.8. Supplementary Comparison of MGM and WorldClim Precipitation Data
The comparison of monthly precipitation data from MGM and WorldClim for the common period 1960–2024 was based on 775 paired observations (Table 6). The two datasets exhibited a strong positive linear association (Pearson’s r = 0.870, p < 0.001), indicating that their monthly precipitation variations were generally related. However, the datasets differed in their absolute precipitation amounts. WorldClim recorded a higher mean monthly precipitation (38.20 mm) than MGM (22.55 mm), corresponding to a positive mean bias of 15.65 mm (WorldClim − MGM). The MAE (16.21 mm) and RMSE (19.48 mm) further quantified the differences between the paired observations. These results indicate that, despite the strong correlation, the two datasets were not directly interchangeable in terms of monthly precipitation amounts. Therefore, the WorldClim data were used as a supplementary source for examining drought-related variability rather than as a direct validation of the MGM observations.
Table 6.
Statistical comparison of monthly precipitation data from MGM and WorldClim during 1960–2024.
4. Discussion
The four drought indices computed for Tuzluca District during 1960–2024 revealed substantial temporal variability across 1-, 3-, 6-, and 12-month accumulation periods. As accumulation periods increased, short-term fluctuations became smoother and dry and wet conditions more persistent, consistent with the characteristics of multi-timescale SPI and SPEI analysis [4,5]. Pronounced negative anomalies occurred around 1999–2003 and during parts of the early 2020s, while the WorldClim-derived series also indicated dry conditions during approximately 2020–2023, followed by a shift toward more positive conditions in 2024 [26].
The sensitivity analysis indicated that alternative gap-filling methods generally produced similar SPI and SPEI series. However, differences in index values, drought classifications, and event boundaries showed that the interpolation method can affect individual drought assessments. Cross-validation also indicated that no method performed best across all error metrics. These findings support the overall stability of the main drought patterns while highlighting uncertainty associated with missing observations [27].
The comparison between SPI and SPEI highlights the role of atmospheric evaporative demand in drought characterization [28]. Unlike SPI, SPEI incorporates PET and therefore reflects both precipitation and atmospheric water demand [4,5]. Pronounced negative SPEI-12 anomalies occurred around 1980–1982, 1999–2002, and 2020–2024 in the WorldClim-derived series, while the MGM-based SPEI also identified substantial negative climatic water-balance anomalies. Persistent negative SPEI values at 6- and 12-month scales suggest sustained water-balance deficits rather than exclusively short-term precipitation anomalies. Similar differences between SPI- and SPEI-based drought characterization have been reported in previous studies [29,30]. Nevertheless, SPEI magnitude and anomaly timing should be interpreted in relation to the dataset and PET estimation method.
SPI and SPEI were positively correlated across all accumulation timescales, but differences in their linear and rank correlations indicate that they are not interchangeable [31]. This study primarily examined index variability and trends rather than systematically comparing drought-event duration, intensity, and cumulative severity. Future research could address this limitation through event-based comparisons and assessments of implications for regional water-resource management.
The modified Mann–Kendall analysis of the annual mean 12-month indices, based on 65 annual observations, identified statistically significant increasing trends in SPI-12 (Z = 2.0191, p = 0.0435; Sen’s slope = 0.0147 index units/year), PNI-12 (Z = 1.9997, p = 0.0455; 0.3527 index units/year), and RNI-12 (Z = 2.0299, p = 0.0424; 0.0142 index units/year). In contrast, SPEI-12 showed a decreasing but statistically nonsignificant tendency (Z = −1.1451, p = 0.2522; −0.0063 index units/year). The SPEI-12 slope should therefore not be interpreted as evidence of a persistent long-term decline. Moreover, slope magnitudes are not directly comparable across indices with different scales and formulations, and increasing index values do not necessarily indicate increasing drought severity. The annual trends describe changes in annual mean index values and complement, rather than replace, the monthly time-series evidence of episodic dry and wet conditions. Although the modified Mann–Kendall test accounts for serial dependence in trend assessment, it does not correct potential inhomogeneities in the underlying climate records [32].
The homogeneity tests indicated uncertainty in the precipitation series but stronger evidence of change in PET. For annual precipitation, the Pettitt test detected a change point around 2000 (p = 0.0116), whereas the SNHT (p = 0.0886) and Buishand range test (p = 0.1250) were not significant at the 5% level. In contrast, all three tests identified significant changes in PET (p = 0.0002), with estimated change points around 1994–1997. Because SPEI is based on precipitation minus PET, its temporal variability may reflect changes in both components. The tests alone cannot establish whether the PET changes arose from climatic variability, station operation, or data-processing differences. Accordingly, SPEI trends and drought episodes should be interpreted cautiously; homogenized records and alternative PET estimates would help assess the influence of these changes [33].
The supplementary WorldClim assessment showed broadly comparable temporal patterns but should not be interpreted as direct validation of the MGM-based indices. Monthly precipitation was strongly correlated between MGM and WorldClim (Pearson’s r = 0.870, p < 0.001), although WorldClim had a higher mean (38.20 mm/month) than MGM (22.55 mm/month), with a mean bias of 15.65 mm and an RMSE of 19.48 mm. This indicates that strong temporal association does not necessarily imply agreement in absolute precipitation amounts. In addition, MGM-based SPEI was calculated using Thornthwaite PET, whereas WorldClim-based SPEI used Hargreaves PET. Because the data source and PET method differed simultaneously, their individual contributions to differences in SPEI magnitude, anomaly timing, and drought classification cannot be separated. The WorldClim indices are therefore best treated as a complementary assessment of drought variability. A controlled comparison using both PET methods on the same meteorological dataset, followed by a common PET method across data sources, would be needed to isolate these effects.
Overall, combining SPI, SPEI, PNI, and RNI across multiple timescales provides complementary information on precipitation anomalies and climatic water-balance variability. The occurrence of substantial dry episodes despite differing long-term trend directions demonstrates why drought monitoring should consider both temporal trends and individual events. Continued monitoring of precipitation, temperature, PET, and multi-timescale drought indices can support drought assessment and water-resource and agricultural planning in Tuzluca District.
5. Conclusions
This study evaluated meteorological drought and wetness conditions in Tuzluca District, Iğdır, during 1960–2024 using four complementary indices (SPI, SPEI, PNI, and RNI) at 1-, 3-, 6-, and 12-month accumulation scales. The results demonstrated substantial temporal variability across different time scales, with short-term fluctuations progressively becoming smoother and dry or wet conditions becoming more persistent as the accumulation period increased. The longer accumulation scales revealed distinct multi-year dry and wet phases, including pronounced negative anomalies around 1999–2003 and renewed dry conditions during parts of the early 2020s. The WorldClim-derived series also showed negative anomalies during approximately 2020–2023, followed by a shift toward more positive conditions in 2024.
The comparison of the drought indices showed that SPEI provided additional information on drought conditions by incorporating potential evapotranspiration and, consequently, atmospheric evaporative demand. The SPEI series revealed pronounced negative anomalies at longer accumulation scales, indicating sustained negative climatic water-balance conditions during several periods. The modified Mann–Kendall analysis of the annual mean 12-month index series, based on 65 annual observations for 1960–2024, identified statistically significant increasing trends in SPI-12, PNI-12, and RNI-12, whereas SPEI-12 exhibited a decreasing but statistically nonsignificant tendency. The corresponding Z statistics were 2.0191, 1.9997, and 2.0299 for SPI-12, PNI-12, and RNI-12, respectively, and −1.1451 for SPEI-12. The Sen’s slope estimates were 0.0147 index units per year for SPI-12, 0.3527 index units per year for PNI-12, 0.0142 index units per year for RNI-12, and −0.0063 index units per year for SPEI-12. These findings indicate that the direction and statistical significance of the detected trends differed among the indices. An increasing index value should not automatically be interpreted as increasing drought severity because its physical meaning depends on the formulation of the index. The supplementary WorldClim-based analysis provided an additional perspective on drought-related temporal variability during 1960–2024. However, the observed differences in absolute precipitation amounts between WorldClim and MGM indicate that the two data sources should not be considered directly interchangeable. The WorldClim-derived indices should therefore be interpreted as complementary evidence, taking into account the differences between the gridded and station-based datasets and the PET estimation methods.
Overall, the findings demonstrate that statistical trends and individual drought episodes provide complementary information about hydroclimatic variability. Although significant increasing trends were identified in three annual mean drought indices using the modified Mann–Kendall test, the time-series analyses revealed substantial fluctuations and alternating dry and wet phases. The combined use of SPI, SPEI, PNI, and RNI across multiple accumulation periods provides complementary information for distinguishing short-lived precipitation anomalies from persistent precipitation deficits and negative climatic water-balance conditions.
These findings provide a localized basis for drought monitoring, agricultural planning, and water-resources management in Tuzluca District and the wider Iğdır region. Future studies should extend the observational record and incorporate additional hydroclimatic and remote-sensing indicators, such as NDVI and VCI, to provide a broader assessment of vegetation and agricultural responses to drought. The application of change-point methods, including the Pettitt test, may also help identify potential shifts or structural changes in the hydroclimatic series that cannot be captured by monotonic trend analysis alone. Further research should include event-based comparisons of drought duration, intensity, and cumulative severity to clarify the complementary information provided by SPI and SPEI and strengthen the application of multi-timescale drought indices in regional water-resource management.
Author Contributions
Conceptualization, Z.R., M.S., Y.P., and M.A.Ç.; methodology, Z.R. and M.A.Ç.; software, M.S. and Z.I.; validation, Z.R. and M.A.Ç.; formal analysis, Y.P. and M.A.Ç.; investigation, Y.P.; resources, M.S.; data curation, Y.P.; writing—original draft preparation M.A.Ç. and Z.R.; writing—review and editing, Y.P. and M.A.Ç.; visualization, Z.I., Y.P. and M.A.Ç.; supervision, M.A.Ç.; project administration, M.A.Ç.; funding acquisition, all authors. All authors have read and agreed to the published version of the manuscript.
Funding
This research received no external funding.
Institutional Review Board Statement
Not applicable.
Informed Consent Statement
Not applicable.
Data Availability Statement
The data are not publicly available due to data access restrictions and/or institutional confidentiality requirements. The datasets used in this study can be obtained from the corresponding author upon reasonable request, subject to the relevant permissions and data-use restrictions.
Acknowledgments
The authors gratefully acknowledge the General Directorate of Water Management, Ministry of Agriculture and Forestry, for providing the data used in this study. The authors also gratefully acknowledge the Turkish State Meteorological Service (MGM) for providing the meteorological data used in the analysis. The authors further acknowledge ChatGPT (GPT-4, free version) and Claude Haiku 5.5 for their assistance with language editing and improving the clarity and readability of the manuscript. The authors remain fully responsible for the content, interpretation, and scientific integrity of the work.
Conflicts of Interest
The authors declare no conflicts of interest.
References
- Aydemir, S.; Hocalar, Ç.; Şekerci, K.; Paşa, Y.; Çelik, M.A. Integrating Observational Datasets and CMIP6 Projections for Multi-Scale Drought Characterization: Evidence from Western Türkiye. Sustainability 2026, 18, 8543. [Google Scholar] [CrossRef] [Scilit]
- Çelik, M.A.; Simsek, O.; Akiner, M.E.; Kızılelma, Y. Impacts of climate change on meteorological and hydrological drought dynamics in a Mediterranean basin: The case of Göksu River Basin, Türkiye. Meteorol. Atmos. Phys. 2026, 138, 45. [Google Scholar] [CrossRef] [Scilit]
- Intergovernmental Panel on Climate Change (IPCC). Climate Change 2021: The Physical Science Basis. Contribution of Working Group I to the Sixth Assessment Report of the Intergovernmental Panel on Climate Change; Cambridge University Press: Cambridge, UK, 2021. [Google Scholar] [CrossRef] [Scilit]
- Vicente-Serrano, S.M.; Beguería, S.; López-Moreno, J.I. A multiscalar drought index sensitive to global warming: The standardized precipitation evapotranspiration index. J. Clim. 2010, 23, 1696–1718. [Google Scholar] [CrossRef] [Scilit]
- McKee, T.B.; Doesken, N.J.; Kleist, J. The relationship of drought frequency and duration to time scales. In Proceedings of the 8th Conference on Applied Climatology, Boston, MA, USA, 17–22 January 1993; Volume 17, pp. 179–183. [Google Scholar]
- Deo, R.C.; Byun, H.-R.; Adamowski, J.F.; Begum, K. Application of effective drought index for quantification of meteorological drought events: A case study in Australia. Theor. Appl. Climatol. 2016, 128, 359–379. [Google Scholar] [CrossRef] [Scilit]
- Selek, B.; Pinarlik, M.; Faki, I.; Selek, Z. Multi-Index evaluation of meteorological drought across Türkiye: A temporal and seasonal perspective. Nat. Hazards 2026, 122, 224. [Google Scholar] [CrossRef] [Scilit]
- Gumus, V. Evaluating the effect of the SPI and SPEI methods on drought monitoring over Turkey. J. Hydrol. 2023, 626, 130386. [Google Scholar] [CrossRef] [Scilit]
- Öz, F.Y.; Özelkan, E.; Tatlı, H. Comparative analysis of SPI, SPEI, and RDI indices for assessing spatio-temporal variation of drought in Türkiye. Earth Sci. Inform. 2024, 17, 4473–4505. [Google Scholar] [CrossRef] [Scilit]
- Öztürk, Y.; Yulu, A.; Turgay, O. Remote sensing supported analysis of the effect of wind erosion on local air pollution in arid regions: A case study from Iğdır province in eastern Türkiye. Environ. Syst. Res. 2023, 12, 13. [Google Scholar] [CrossRef] [Scilit]
- Çelik, M.A.; Kopar, İ.; Gezici, K.; Kesgin, E. A multi-variable and matrix-based assessment of elevation effects on vegetation dynamics and climate trends in a semi-arid environment. Phys. Chem. Earth Parts A/B/C 2026, 144, 104611. [Google Scholar] [CrossRef] [Scilit]
- Şimşek, O. Demographical Development In Tuzluca. Kafdağı 2017, 2, 38–58. [Google Scholar]
- Mann, H.B. Nonparametric tests against trend. Econometrica 1945, 13, 245–259. [Google Scholar] [CrossRef] [Scilit]
- Kendall, M.G. Rank Correlation Methods, 4th ed.; Griffin: London, UK, 1975. [Google Scholar]
- Kubiak-Wójcicka, K.; Pilarska, A.; Kamiński, D. The Analysis of Long-Term Trends in the Meteorological and Hydrological Drought Occurrences Using Non-Parametric Methods—Case Study of the Catchment of the Upper Noteć River (Central Poland). Atmosphere 2021, 12, 1098. [Google Scholar] [CrossRef] [Scilit]
- Thornthwaite, C.W. An approach toward a rational classification of climate. Geogr. Rev. 1948, 38, 55–94. [Google Scholar] [CrossRef] [Scilit] [PubMed]
- Türkeş, M. Spatial and temporal analysis of annual rainfall variations in Turkey. Int. J. Climatol. A J. R. Meteorol. Soc. 1996, 16, 1057–1076. [Google Scholar] [CrossRef]
- Hamed, K.H.; Rao, A.R. A modified Mann-Kendall trend test for autocorrelated data. J. Hydrol. 1998, 204, 182–196. [Google Scholar] [CrossRef] [Scilit]
- Then, Y.J.; Abdul Halim, S. Modified Mann-Kendall with higher-order statistics for trend analysis. Sci. Rep. 2025, 16, 500. [Google Scholar] [CrossRef] [Scilit] [PubMed]
- Sen, P.K. Estimates of the regression coefficient based on Kendall’s tau. J. Am. Stat. Assoc. 1968, 63, 1379–1389. [Google Scholar] [CrossRef]
- Alves da Silva, A.S.; Cunha Filho, M.; Simões Cezar Menezes, R.; Stosic, T.; Stosic, B. Trends and Persistence of Dry–Wet Conditions in Northeast Brazil. Atmosphere 2020, 11, 1134. [Google Scholar] [CrossRef] [Scilit]
- Çelik, M.A. Long-Range Dependence, Multifractality, and Trends of Drought Across Multiple Accumulation Periods in Türkiye Derived From SPEI. Atmos. Sci. Lett. 2026, 27, e70055. [Google Scholar] [CrossRef] [Scilit]
- Jain, L.; Bhowmik, S.; Parmar, K.; Joshi, J.; Bhatt, B. Multiscale drought assessment and forecasting in Saurashtra using meteorological drought indices and machine learning models. Int. J. River Basin Manag. 2026, 1–22. [Google Scholar] [CrossRef] [Scilit]
- Sun, J.; Bi, S.; Bashir, B.; Ge, Z.; Wu, K.; Alsalman, A.; Ayugi, B.O.; Alsafadi, K. Historical trends and characteristics of meteorological drought based on standardized precipitation index and standardized precipitation evapotranspiration index over the past 70 years in China (1951–2020). Sustainability 2023, 15, 10875. [Google Scholar] [CrossRef] [Scilit]
- Beguería, S.; Vicente-Serrano, S.M.; Reig, F.; Latorre, B. Standardized precipitation evapotranspiration index (SPEI) revisited: Parameter fitting, evapotranspiration models, tools, datasets and drought monitoring. Int. J. Climatol. 2013, 34, 3001–3023. [Google Scholar] [CrossRef] [Scilit]
- Zhuang, Y.; Fu, R.; Lisonbee, J.; Sheffield, A.M.; Parker, B.A.; Deheza, G. Anthropogenic warming has ushered in an era of temperature-dominated droughts in the western United States. Sci. Adv. 2024, 10, eadn9389. [Google Scholar] [CrossRef] [Scilit] [PubMed]
- Rhee, J.; Im, J. Meteorological drought forecasting for ungauged areas based on machine learning: Using long-range climate forecast and remote sensing data. Agric. For. Meteorol. 2017, 237-238, 105–122. [Google Scholar] [CrossRef] [Scilit]
- Mwinjuma, M.; Wang, R.; Mtupili, M.; Twaha, M. Comparisons of SPI and SPEI in capturing drought dynamics: A Global assessment across arid and humid regions. Atmos. Res. 2026, 329, 108475. [Google Scholar] [CrossRef] [Scilit]
- Aydın, M. Van ilinin kuraklığının SPI ve SPEI yöntemlerine göre değerlendirilmesi. Dicle Üniversitesi Mühendislik Fakültesi Mühendislik Derg. 2024, 15, 237–250. [Google Scholar] [CrossRef] [Scilit]
- Mombrini, E.; Tamea, S.; Viglione, A.; Revelli, R. A 60-year drought analysis of meteorological data in the western Po River basin. Hydrol. Earth Syst. Sci. 2025, 29, 2255–2273. [Google Scholar] [CrossRef] [Scilit]
- Tirivarombo, S.; Osupile, D.; Eliasson, P. Drought monitoring and analysis: Standardised Precipitation Evapotranspiration Index (SPEI) and Standardised Precipitation Index (SPI). Phys. Chem. Earth Parts A/B/C 2018, 106, 1–10. [Google Scholar] [CrossRef] [Scilit]
- Collaud Coen, M.; Andrews, E.; Bigi, A.; Martucci, G.; Romanens, G.; Vogt, F.P.A.; Vuilleumier, L. Effects of the prewhitening method, the time granularity, and the time segmentation on the Mann–Kendall trend detection and the associated Sen’s slope. Atmos. Meas. Tech. 2020, 13, 6945–6964. [Google Scholar] [CrossRef] [Scilit]
- Sánchez, D.E.; Cantos, J.O. One Country, Several Droughts: Characterisation, Evolution, and Trends in Meteorological Droughts in Spain Within the Context of Climate Change. Climate 2025, 13, 202. [Google Scholar] [CrossRef] [Scilit]

Disclaimer/Publisher’s Note: The statements, opinions and data contained in all publications are solely those of the individual author(s) and contributor(s) and not of MDPI and/or the editor(s). MDPI and/or the editor(s) disclaim responsibility for any injury to people or property resulting from any ideas, methods, instructions or products referred to in the content. |
© 2026 by the authors. Licensee MDPI, Basel, Switzerland. This article is an open access article distributed under the terms and conditions of the Creative Commons Attribution (CC BY) license.