


Abstract
Backward-trajectory statistics locate arid-region dust sources on the assumption that trajectories separate emission from transport, an assumption seldom tested where the local contribution is known. We build one from ten years (2016–2025) of routine METAR observations at Riyadh, Saudi Arabia, where present-weather codes distinguish locally lifted dust (BLDU/BLSA) from dust in suspension (DU/SA). Suspension-dominated days outnumbered locally lifted days 345 to 179 (1.9:1), and ERA5-driven models reproduced the locally lifted class substantially better (held-out AUC 0.914 versus 0.765), indicating distinct meteorological signatures. Dust activity then fell 85.9% below the 2016–2022 baseline in 2023–2024, recovering only to 56.0% below it in 2025. The model did not anticipate this: observed dust days in 2023–2024 were 13–27% of the calibrated expectation in every class while local surfaces in 2024 stayed favorable for emission; upwind dust availability and transport remain hypotheses. We then computed PSCF and CWT fields from 14,612 HYSPLIT trajectories, running the locally lifted class, for which a distant source is not required, as an imperfect negative control, tested against permutation nulls. Under unmatched and season-matched backgrounds, the control was more enriched than the suspension-dominated class over the eight a priori candidate regions (p ≤ 0.007), and wind matching removed most regional structure from both. Both fields are shaped largely by the shared Shamal transport climatology and the wind selection of dust days, limiting their ability to identify emitting terrain. At wind-selected, single-regime receptors, PSCF and CWT source fields should be interpreted alongside such a control.
1. Introduction
Mineral dust is a major contributor to particulate air quality across the Arabian Peninsula, one of the principal dust-source regions globally [1,2,3], where dust storms are associated with measurable costs to health, aviation, and solar energy generation [4,5,6,7]. Riyadh sits near the center of this activity, its dust season peaking in spring under the northwesterly Shamal [8,9,10,11], and dust loadings over the peninsula are large enough to alter the regional radiation balance [12]. Identifying where that dust originates is a prerequisite for any mitigation strategy: surface stabilization, afforestation, and early warning all presume a known source.
Trajectory statistics is a widely used method for attributing observed dust events to upwind source regions. Backward air-parcel trajectories, most often computed with HYSPLIT [13,14], are generated for observed events, and grid cells crossed disproportionately often by event-day air are inferred to contain sources, a family of methods known collectively as trajectory statistics [15]. Ashbaugh et al. [16] formalized the idea as the potential source contribution function (PSCF), a conditional probability of event occurrence given air-parcel residence in a cell; Seibert et al. [17] extended it to concentration-weighted trajectories (CWT); Polissar et al. [18,19] supplied the endpoint-count weighting that has become standard; and Hsu et al. [20] established the comparative framework in which the two methods are now routinely run in tandem. The approach demands no emission inventory, no dispersion modeling, and no source-side observations. That economy explains its reach: PSCF and CWT maps pervade the dust literature of the Middle East, North Africa, and East Asia, and trajectory analysis underpins published source claims for Arabian dust specifically [8].
PSCF estimates how often a dust event followed air that crossed a given cell, relative to all air that crossed that cell. It reflects only how frequently trajectories intersect a grid cell, not the mass, intensity, or likelihood of dust being raised from the surface there. The method resolves terrain only if event-day trajectories differ from background trajectories because of what the surface beneath them contributed; where events are instead selected by a meteorological variable that also fixes trajectory geometry, particularly wind speed, event-day and background air differ for reasons unrelated to the surface, and the field inherits the transport climatology of the events. Controlled evaluations against precisely known emission sources have found PSCF and CWT performing poorly where inverse modeling succeeds [21], but such evaluations are rare for a simple reason: ground truth is rarely available.
Routine surface weather reports distinguish two dust phenomena [22]: dust or sand raised by the wind at the station (METAR codes BLDU and BLSA) and dust or sand in suspension, not raised at the station (DU and SA). The first is direct evidence of local surface lifting, so the receptor itself is a source. The second is dominated by dust already in suspension rather than lifted at the station, so its material originated upwind, whether by distant emission or by earlier lifting now advected over the site; we therefore call this class suspension-dominated. Applying an identical attribution procedure to both classes provides a methodological control, which we treat as an imperfect negative control [23]: for the locally lifted class, a distant source is not required to explain the dust, so a trajectory method keyed to emission should not return strong, spatially coherent distant-source structure for it. This control constrains method behavior and does not imply that the air above the station is free of transported dust, which can coexist with local lifting; any strong, coherent distant-source signal returned for the locally lifted class that matches or exceeds that of the suspension-dominated class therefore reflects a shared driver rather than emission at those distant cells.
Riyadh is a suitable site for this analysis for three reasons. Its dust season is strongly seasonal and strongly wind-selected, maximizing the potential for confounding. It lies downwind of candidate source systems of contrasting geomorphology, including the Mesopotamian alluvial floodplain, the An Nafud and Rub’ al Khali sand seas, the Ad-Dahna corridor, and the Syrian Desert [24], so a method that resolves emission should discriminate among them. Additionally, a pronounced regional decline in dust activity beginning in 2023, the mirror image in sign of the drought-triggered 2007–2013 regime shift [25], supplies an independent test of whether receptor-side meteorology explains interannual variability at all.
This study provides three findings relevant to the recent dust-attribution literature. First, we quantify the partition between locally lifted and suspension-dominated dust at a major Arabian urban receptor and show that the two observational classes carry distinct meteorological signatures. Second, we document a three-regime shift in dust activity and show that receptor-side meteorology does not anticipate it; observed activity fell far below a calibrated expectation, a mismatch that leaves an important role for upwind dust availability and transport as a hypothesis to be tested. Third, and most consequentially for method users, we use the locally lifted class as an imperfect negative control and show that, at this receptor, the PSCF and CWT source fields are shaped largely by the shared transport climatology and the wind selection of dust days, which matching on wind speed removes; we set out the controls that PSCF and CWT applications at such receptors should carry.
2. Data and Methods
2.1. Study Site and Period
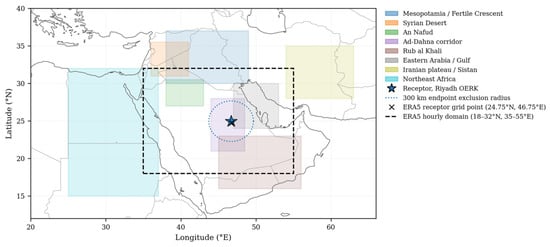
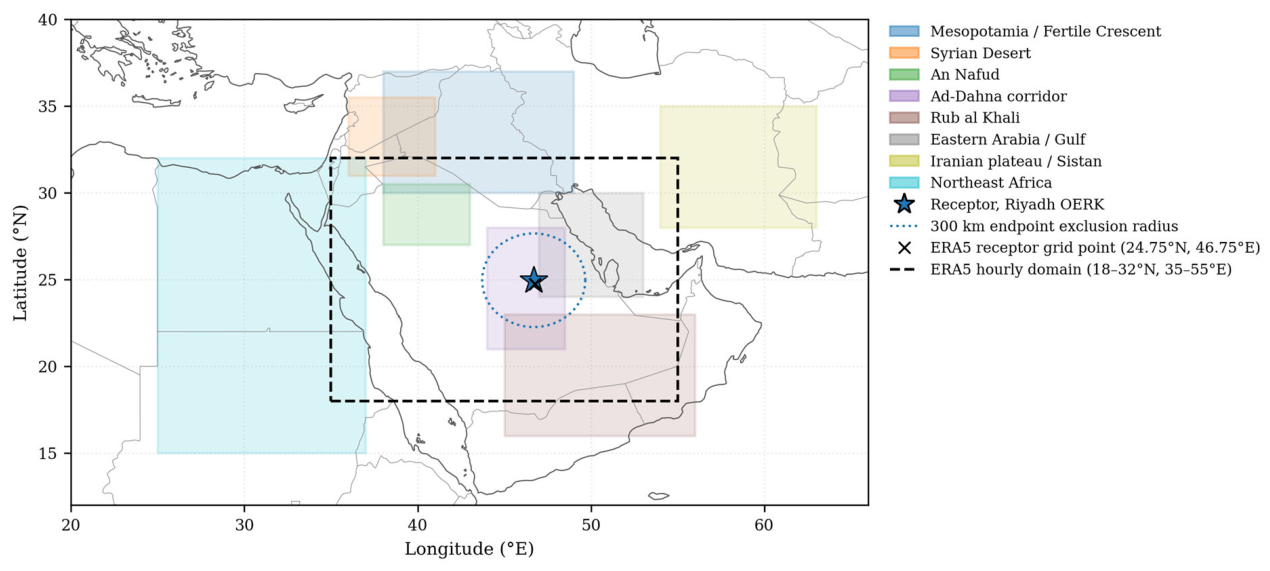
Observations are from Riyadh King Khalid International Airport (OERK; 24.958° N, 46.699° E; approximately 614 m a.s.l.), covering 1 January 2016 to 31 December 2025. The merged meteorology–observation table contains 3653 classifiable days. Figure 1 shows the receptor, the meteorological domain, and the candidate source regions.
Figure 1.
Study region. Riyadh King Khalid International Airport (OERK, star) with the 300 km receptor exclusion radius applied to all trajectory endpoint counts (dotted circle), the ERA5 meteorological domain (dashed rectangle, 18–32° N, 35–55° E), the ERA5 grid point used for the receptor series (cross), and the eight candidate source regions used for geomorphological validation. The ERA5 domain terminates at 32° N and therefore excludes the Mesopotamian and Fertile Crescent systems, precluding any source-side emission diagnostic.
2.2. Dust Event Catalog
Hourly surface observations were obtained from the Iowa Environmental Mesonet ASOS/METAR archive [26]. Only routine reports were retained. Special reports (SPECI) were excluded because they are triggered by rapid visibility change and would inflate dust-hour counts during events, biasing any frequency climatology.
Dust presence was identified from present-weather codes rather than from visibility alone. Visibility responds to the entire near-surface aerosol column, and in a city of Riyadh’s size an anthropogenic haze component is unavoidable; requiring an explicit dust code excludes pollution episodes. Haze (HZ) was tracked separately and excluded from all event definitions.
Observations were classified following the code definitions of WMO-No. 306 [22]:
- Locally raised (locally lifted)—any of BLDU, BLSA present, i.e., direct evidence of dust or sand raised by the wind at the station;
- Suspension-dominated—any of DU or SA present and no BLDU/BLSA, i.e., dust in suspension without evidence of local lifting; the class may include regionally resuspended dust and does not imply distant origin. Observations reporting both were assigned to the locally raised class, since active local lifting is present regardless of what else is airborne;
- Unassigned—duststorm or sandstorm codes without either of the above (DS, SS; n = 21 observations), and dust or sand whirls (PO; n = 20). A duststorm code indicates dust loading without specifying where material was mobilized, and a whirl is a transient convective feature; neither contributes to the two-way partition. Each observation was assigned to one category only, so reports carrying several codes were counted once.
Hourly observations were aggregated to local days (UTC + 3, no daylight saving). A day entered a class only if at least three separate hours reported that class, excluding brief convective dust events that carry no transport signal. The daily classes are not mutually exclusive: a day on which both phenomena separately satisfied the three-hour criterion enters both counts; removing these overlap days gives mutually exclusive local-only and suspension-only classes. Days with fewer than twelve reporting hours were marked unclassifiable rather than dust-free, preventing data gaps from being counted as clear days (n = 1 day, 1 January 2026, created by the UTC + 3 shift and outside the study period).
Event intensity was quantified as the daily maximum extinction coefficient from the Koschmieder relation [27], (km−1), where is horizontal visibility in km. Visibility is censored at the 9999 m “10 km or more” ceiling (the highest reportable METAR value; no report exceeds it), so extinction has a floor near 0.391 km−1 (3.912/10) on clear days; this compresses the low end of the distribution but does not affect the ranking of regions in Section 3.4.
2.3. Record Homogeneity
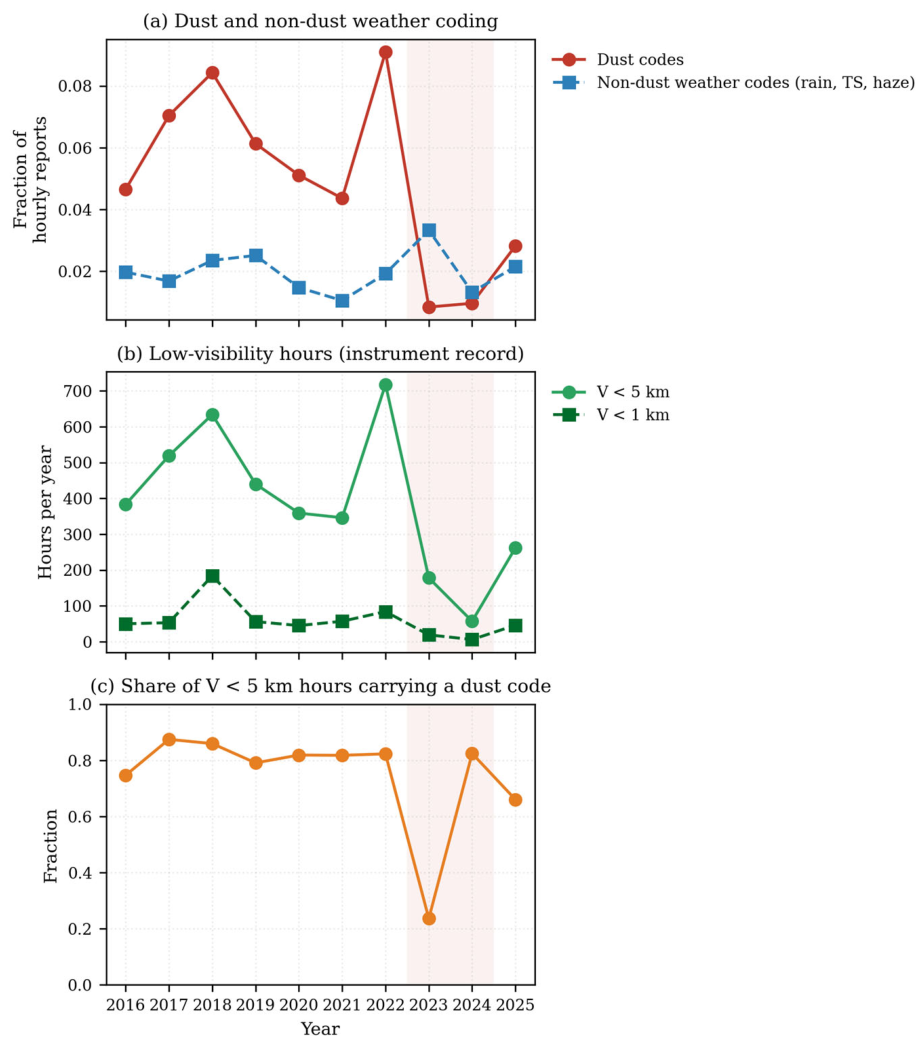
Station relocations, instrument upgrades, and manual-to-automatic transitions all change present-weather reporting frequency, so an apparent trend in coded dust must be shown not to be a reporting artifact. Two tests independent of dust coding were applied: (i) the annual reporting rate of non-dust weather codes (rain, thunderstorm, and haze), which has no physical reason to co-vary with dust; and (ii) the annual count of hours below fixed visibility thresholds, computed without reference to present-weather codes, with visibility being an instrument reading logged regardless of observer coding.
2.4. Meteorological Data
ERA5 hourly single-level reanalysis [28] was retrieved at 0.25° resolution for 18–32° N, 35–55° E, comprising 10 m u and v wind components, 10 m wind gust, 2 m temperature and dewpoint, surface pressure, boundary layer height, volumetric soil water (layer 1, 0–7 cm), total precipitation, and downward surface solar radiation. Only the grid point nearest the city (24.75° N, 46.75° E; Figure 1) was used, without spatial averaging; the wider domain, retrieved with source-side diagnostics in mind, is not used because its 32° N limit excludes the northern source regions. Wind speed and meteorological wind direction were derived from the u and v components, vapor pressure deficit from temperature, and dewpoint via the Tetens formulation [29].
Hourly fields were aggregated to local days using statistics matched to each variable’s physical role rather than a uniform daily mean: daily maximum for wind speed, gust, boundary layer height, temperature, and vapor pressure deficit, because emission is threshold-driven and a mean conceals the peak; daily sum for precipitation (mm); and daily mean for soil moisture (m3 m−3) and downward solar radiation (W m−2). Wind direction was aggregated as a vector mean, a scalar mean of degrees being invalid across the 0/360° discontinuity. Antecedent precipitation was computed as 7-day and 30-day rolling sums over the continuous series, representing soil-moisture recharge on a different timescale from same-day wet suppression.
2.5. Meteorological Indicator
Event occurrence was modeled from ERA5 daily fields using logistic regression (for interpretable coefficient signs) and random forest [30] (for threshold behavior and permutation-based ranking), implemented in scikit-learn v1.5 [31]. Wind direction entered as sine and cosine components, direction being circular; a wind projection term combined speed and direction into a single predictor. Day-of-year sine and cosine were included so that season could be held constant rather than absorbed into the meteorological drivers.
Two specification choices in the indicator model follow directly from collinearity diagnostics. Daily maximum wind speed and daily maximum gust are derived from the same wind field and are near-duplicates; retaining both split the logistic coefficient arbitrarily between them and produced an uninterpretable sign. Gust was therefore excluded, which slightly improved held-out skill in every class. The projection axis was set by sweeping all 360° and selecting the direction whose projection best separated event from non-event days on the training years alone; the optimum fell within 35° of the 320° Shamal axis used in the regional literature [9,11], and the literature value was retained for comparability. Variance inflation remains elevated for temperature and vapor pressure deficit, which are analytically related, so coefficient signs for those terms are not interpreted; permutation importance and marginal (Spearman) association are reported alongside every coefficient.
Models were trained on 2016–2022 (2557 days) and tested on 2023–2025 (1096 days). Held-out validation was stratified by regime rather than randomized, because adjacent days share weather and a shuffled test set is contaminated by neighboring training days. Performance is reported as area under the ROC curve (AUC) and average precision against the base rate [32]; accuracy is uninformative at event base rates of 1–5%.
Because the classifiers were fitted with balanced class weights, their scores are not probabilities. For comparison with observed counts, random-forest scores were calibrated by Platt scaling [33], fitted to leave-one-year-out scores for 2016–2022, and summed over the days of each year to give the expected number of event days; its 95% prediction interval combines a block bootstrap over training years with binomial sampling inflated for overdispersion. A seasonal climatology (monthly event frequencies of 2016–2022) served as a benchmark.
2.6. Trajectory Computation
Backward trajectories were computed with HYSPLIT v5.4.2 [13,14] driven by GDAS 1° three-hourly archive meteorology. Arrival height was 500 m a.g.l.—above the surface layer and urban canopy but representing air that reaches the ground. Run duration was 84 h, sufficient to reach the Mesopotamian and Fertile Crescent systems under typical Shamal speeds; vertical motion followed the meteorological model’s own vertical velocity. Trajectories were initiated at 00, 06, 12, and 18 UTC on every day of the study period (03, 09, 15, and 21 local time), so all four arrive within the local day whose class labels they inherit.
Trajectories were computed for all days, not only event days. PSCF is a conditional probability requiring a denominator of all trajectories; computing event-day trajectories alone yields a map of trajectory density rather than source probability. A total of 14,612 trajectories were generated, all completing successfully, yielding 1,242,020 hourly endpoints.
2.7. PSCF and CWT
Trajectory endpoints were binned onto a 1° grid spanning 10–45° N, 25–65° E. Coarser resolution was preferred because finer grids thin the endpoint count per cell and exacerbate the trailing effect, in which false elongated source regions appear along common transport paths.
Two filters were applied to the trajectory endpoints, together retaining 911,867 of the original 1,242,020. Endpoints within the first 3 h of arrival were discarded. Endpoints within 300 km of the receptor were excluded, because all trajectories necessarily converge there and any region overlapping that radius would rank highly by construction. Region summaries report the fraction of each region falling inside the exclusion radius so that partially excluded regions are not misread. Trajectories left with no endpoint were dropped (65 of the 10,228 trajectories of 2016–2022, 18 of them in March–June).
For each event class, the potential source contribution function in cell is
where counts all retained trajectory endpoints in the cell from the background sample of the design (below), counts the subset arriving on event days of the class in question [16], and stabilizes sparsely crossed cells. The concentration-weighted trajectory field replaces the binary event indicator with event intensity on the event days of the class,
where is 1 for trajectories arriving on days of class c and 0 otherwise, is the daily maximum extinction coefficient associated with trajectory (Section 2.2) less the clear-sky floor, and is that trajectory’s residence time in the cell [17,20]. For comparison between classes, each CWT field is divided by its expectation under random assignment of class days within the strata of the design (Equation (4), with the intensity in place of the class label), so that 1 indicates no excess. As a visibility-independent alternative, was replaced by the number of hours of the day reporting the class’s dust codes. Both fields carry the endpoint-count weight of Polissar et al. [18,19], following common trajectory-statistics practice [34],
with the reference set to the median endpoint count of occupied cells rather than the mean: trajectory convergence at the receptor inflates the mean far above the median, and a mean-based threshold suppressed 80% of crossed cells in preliminary analysis.
Because PSCF magnitude scales with the class base rate , the fraction of the design’s background trajectories that arrive on class days, fields are reported as enrichment, , so that classes of differing frequency are comparable; indicates no excess over the domain average where W = 1, and cells with are treated as enriched.
The eight candidate source regions (Figure 1) were delineated a priori from published dust-source geomorphology and satellite dust-source climatology [1,24,35], before any source field was computed, and no region was selected on the basis of its enrichment. For each region we report the mean enrichment with its permutation p-value, the endpoint share, the occupied cells and the class days whose trajectories cross the region, and we mark regions that overlap the 300 km exclusion radius.
Background matching compared three specifications, as follows: (i) unmatched, events against all trajectories of 2016–2022; (ii) season-matched, both restricted to March–June; and (iii) wind-matched, a stratified design in which the season-matched sample was divided into quintiles of daily maximum wind speed and, within each quintile, event trajectories were compared against non-event trajectories from the same quintile. Pooling per-quintile fields by event count, a common practice (per-quintile PSCF ratios averaged with weights equal to the class trajectory counts, over quintiles with at least 15 class and 15 non-class trajectories), gives an estimator whose expectation under random assignment exceeds 1 wherever the class rate varies between quintiles, as it does strongly here (Section 3.4). We therefore used the stratum-standardized enrichment,
where is the class base rate in quintile b. Without the weight, this ratio has an expectation of 1 under random assignment within quintiles, so no quintile needs to be excluded.
Null distributions were obtained by permuting class labels and intensities among days, keeping the four trajectories of each day together, within the strata of each design (the whole sample for the unmatched and season-matched designs, quintiles for the wind-matched design; 1000 permutations) [36]. Permuting single days ignores the clustering of dust days into episodes, so the nulls are, if anything, too narrow.
The same negative-control procedure was applied to the locally raised class. Because these events carry direct evidence of local surface lifting, a distant source is not required to explain their dust; a trajectory method keyed to emission should therefore not return strong, spatially coherent distant-source structure for this class. The class serves as a methodological control on the source fields and does not imply that the air above the station is free of transported dust; because advected dust may accompany local lifting, particularly on overlap days, all comparisons were repeated with the mutually exclusive classes. Agreement between the two classes, quantified as the Pearson correlation between their enrichment fields over jointly occupied cells and, because W imposes a common structure on all fields, also between unweighted fields over well-sampled cells (W ≥ 0.70), therefore indicates the degree to which a shared driver, rather than distinct emission, shapes the two fields. Their contrast was measured as the difference in mean enrichment over the eight candidate regions, suspension-dominated minus locally raised, which an emission-sensitive method should make positive.
3. Results
3.1. Event Catalog and Classification
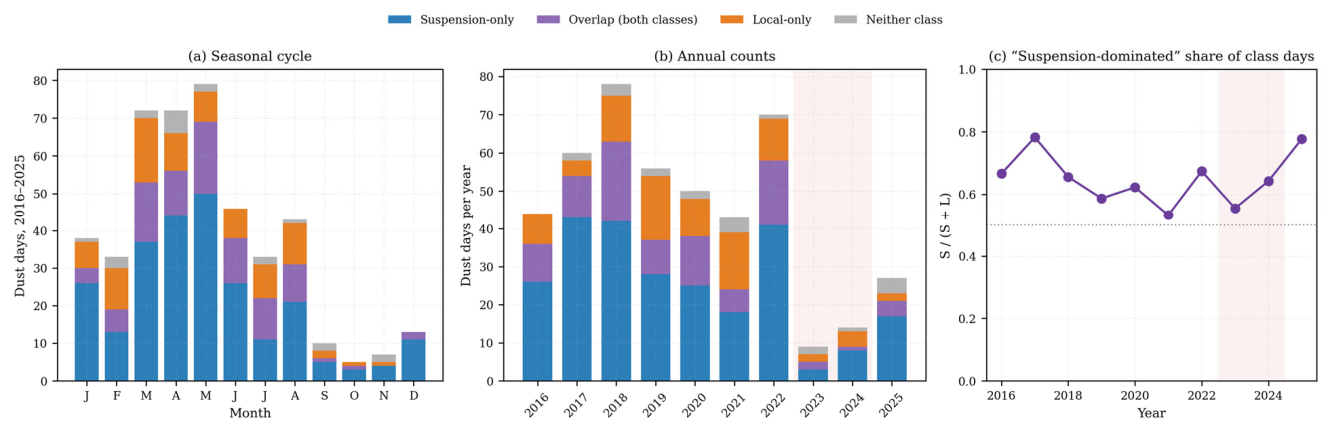
Of the total 87,400 hourly observations analyzed, 4317 (4.94%) reported dust. Locally raised codes accounted for 1272 observations and suspension-dominated codes for 3004; the remaining 41 are the 21 DS/SS and 20 PO observations (Section 2.2). At daily resolution, 451 dust days were identified: 179 locally raised days and 345 suspension-dominated days, a suspension-to-local ratio of 1.9:1. The class totals exceed the number of dust days because the two criteria are not exclusive; on 94 days (87 in 2016–2022) both phenomena separately met the three-hour threshold (Section 2.2), while 21 dust days met neither class criterion. Excluding the overlap days leaves 85 local-only and 251 suspension-only days (Figure 2). Haze was reported in only 259 observations (0.30%), so its exclusion removed little.
Figure 2.
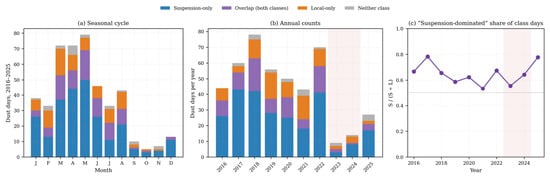
Event climatology, 2016–2025. (a) Seasonal distribution of dust days by emission class, with overlap days shown separately. (b) Annual counts by class. (c) Suspension-dominated fraction of class days; shading in (b,c) marks the 2023–2024 minimum; dotted line, 0.5.
The seasonal cycle followed the expected Arabian pattern (Figure 2a), peaking in March–May (72, 72, and 79 dust days, respectively, across the decade) and reaching a minimum in September–November (10, 5, and 7 days), consistent with Shamal-driven dust climatology [9,10]. Suspension-dominated events outnumbered locally raised events in every year of the record (Figure 2b,c).
3.2. A Three-Regime Decline in Dust Activity
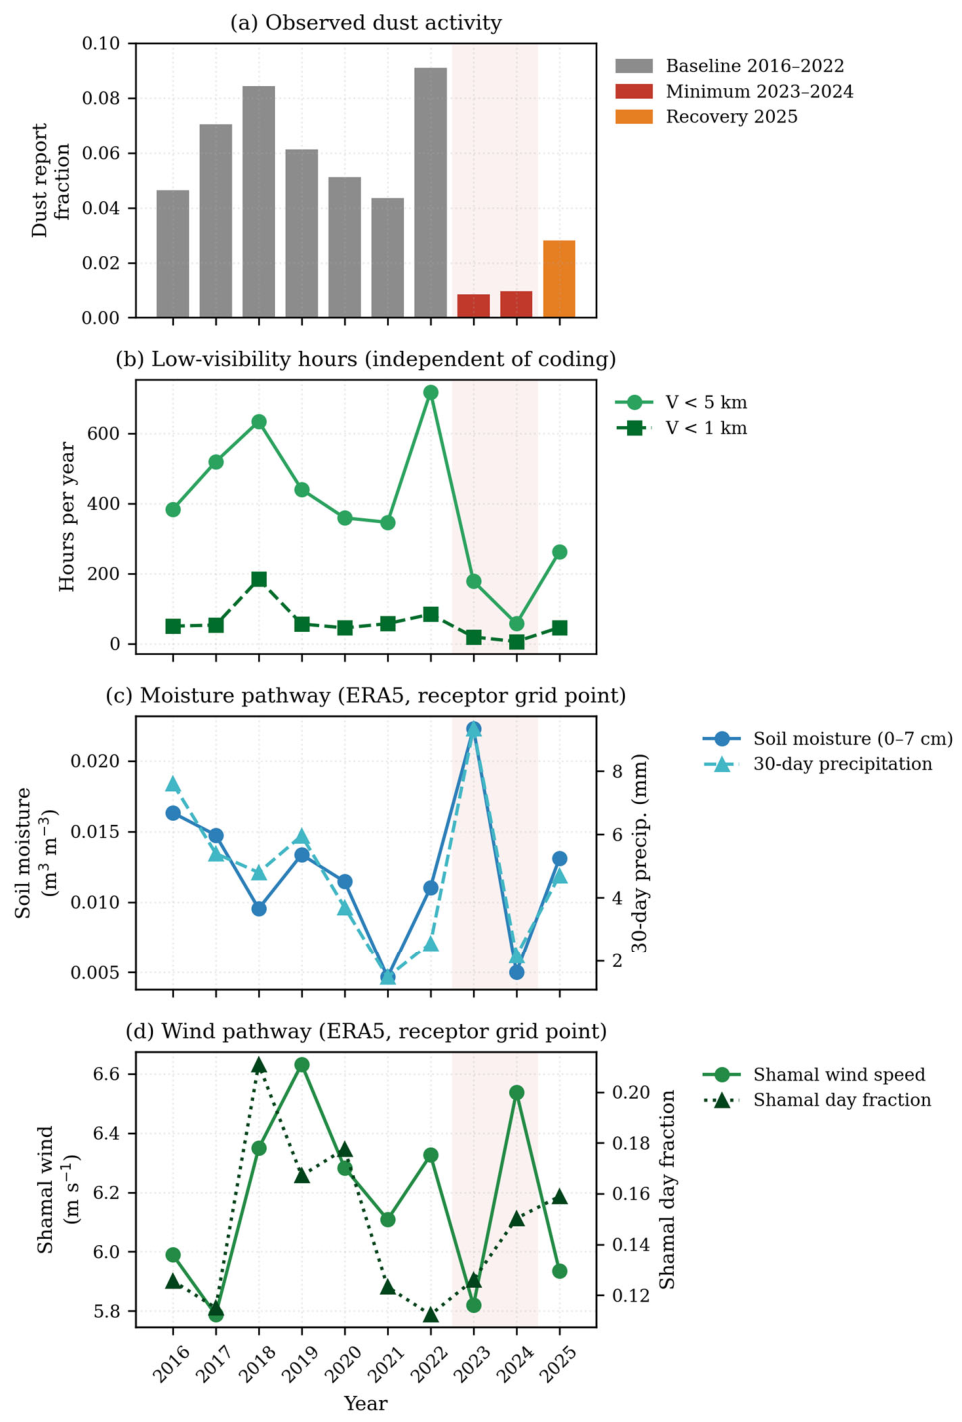
Dust activity fell sharply after 2022 (Table 1, Figure 3 and Figure 4). Relative to the 2016–2022 baseline, the dust observation rate declined 85.9% (95% interval 82.6–88.3%) during 2023–2024 and recovered only partially in 2025, remaining 56.0% (45.5–63.4%) below baseline. The visibility record, an instrument measurement independent of observer coding, tracked the same trajectory, falling from a baseline mean of 486 h below 5 km per year to 118 in 2023–2024 and recovering to 262 in 2025.
Table 1.
Annual dust statistics by regime. Dust and Other are the fractions of hourly observations carrying a dust code and a non-dust weather code respectively; <5 km and <1 km are hours below those visibility thresholds, counted without reference to present-weather codes; Days, Loc, and Sus are dust days, locally raised days, and suspension-dominated days. Regimes: Base = 2016–2022, Min = 2023–2024, Rec = 2025. Regime rows: annual means; % change: from Base, with 95% bootstrap interval.
Figure 3.
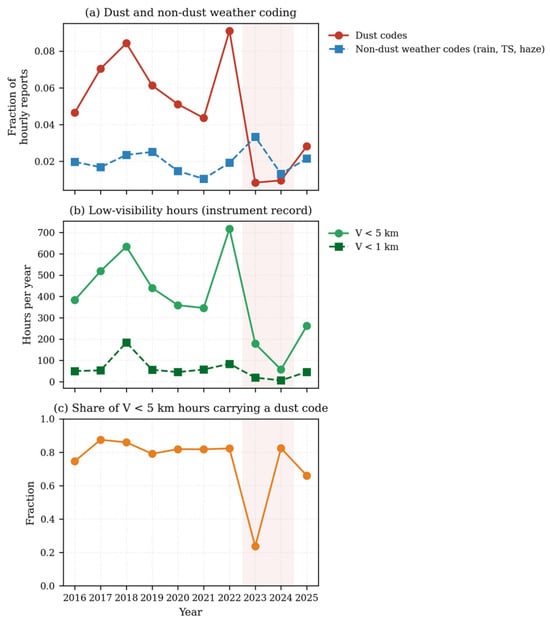
Record homogeneity. (a) Dust and unrelated weather coding rates diverge after 2022, excluding a general reduction in weather coding. (b) The instrument visibility record confirms the decline. (c) Share of low-visibility hours carrying a dust code. Shading marks the 2023–2024 minimum.
Figure 4.
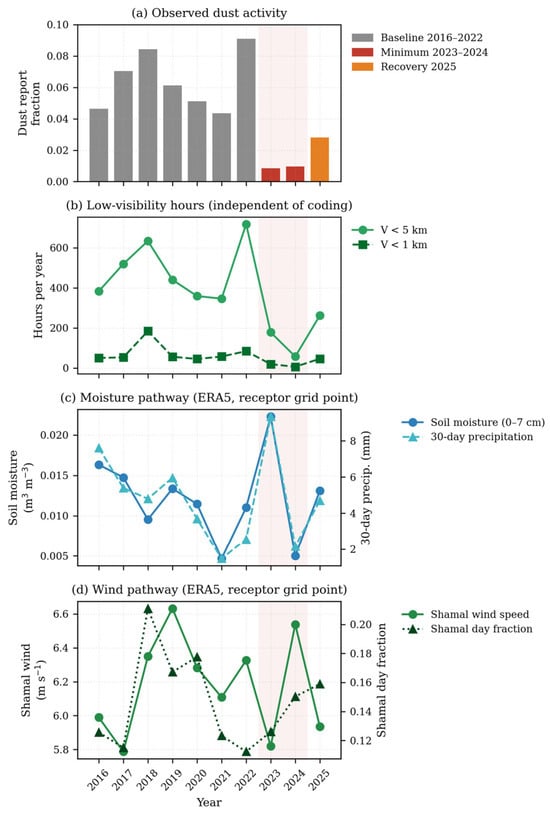
Regime structure. (a) Annual dust observation fraction, colored by regime. (b) Low-visibility hours from the instrument record, independent of observer coding. (c) Moisture pathway: soil moisture and 30-day antecedent precipitation. (d) Wind pathway: Shamal wind speed and Shamal day fraction; (c,d) at the ERA5 receptor grid point. The 2024 column carries the argument of Section 3.3: soil moisture near its record low and Shamal wind above baseline, with dust activity at a two-decade minimum. Shading marks the 2023–2024 minimum.
Three lines of evidence indicate that this decline reflects a real reduction in dust activity rather than a reporting artifact (Figure 3). First, the reporting rate of non-dust weather codes increased by 22.5% in 2023–2025, excluding a general reduction in weather coding. Second, the independent visibility record declined in parallel. Third, national meteorological reporting independently documented the same phenomenon: the Sand and Dust Storm Regional Center reported that 2023 recorded the fewest dust cases of any year in the preceding two decades, and that May 2024 saw an 80% national decline, with Riyadh city specifically down 95% [37,38]. Two quantitative comparisons are possible. For 2023, the Regional Center reported 12 dust-condition days at Riyadh city; our independently constructed catalog gives 9 dust days for the same year, close agreement given the differing event definitions. For 2025 our estimate of −56.0% matches the 53% decline the Center reported for January–July 2025 [39]. Two independent observing and classification systems converge on the same timing and magnitude; the decline is not an artifact of either.
3.3. Local Meteorology Relates More Closely to Locally Raised than to Suspension-Dominated Dust
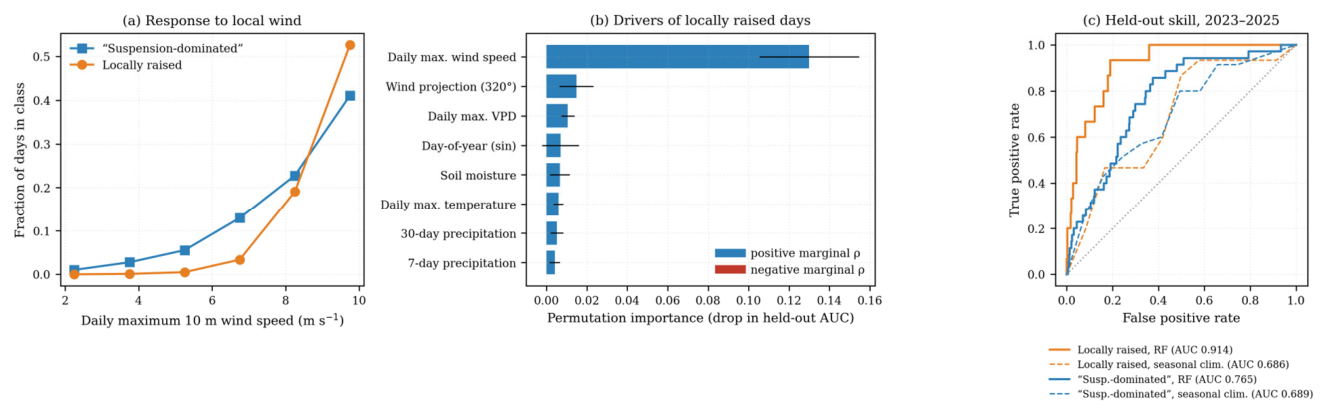
Models trained on 2016–2022 and tested on 2023–2025 reproduced locally raised events substantially better than suspension-dominated events (Table 2, Figure 5c). Random-forest held-out AUC was 0.914 for locally raised days against 0.765 for suspension-dominated days; logistic regression gave 0.913 and 0.726. Two algorithmically distinct models agree on the gap, so the gap reflects the data, not the estimator. Both classes were predicted better than by the seasonal climatology (AUC 0.686 and 0.689), although in held-out Brier score, which the 2023–2025 decline penalizes, neither improved on a constant climatology.
Table 2.
Indicator performance. Models trained on 2016–2022 and tested on 2023–2025. Average precision should be compared against the test-period base rate, not against 0.5. Seasonal climatology: monthly 2016–2022 event frequencies.
Figure 5.
Emission class and model skill. (a) Probability of each event class as a function of daily maximum local wind speed; the curves cross near 8.5 m s−1. (b) Permutation importance of drivers for locally raised dust, colored by the sign of the marginal association. (c) Receiver operating characteristic curves on the held-out 2023–2025 period; dashed, seasonal climatology.
Driver rankings help explain the gap between the two classes mechanistically (Figure 5b). For locally raised days, daily maximum wind speed dominated, with permutation importance (0.130) nearly nine times the next-ranked feature and a positive coefficient and marginal association alike (ρ = +0.32), the signature of threshold-driven local entrainment. For suspension-dominated days, seasonal harmonics ranked next after wind speed (day-of-year cosine 0.027, sine 0.026): the model partially substituted seasonal climatology for a causal driver absent from the dataset, possibly the source-region meteorology that mobilized the dust.
The two classes also differ in the shape of their wind response (Figure 5a). Below roughly 8.5 m s−1, suspension-dominated events are the more likely of the two; above it the ordering reverses. Locally raised dust requires a higher wind threshold but responds more steeply once that threshold is passed—the behavior expected of surface entrainment, and not of material advected from elsewhere.
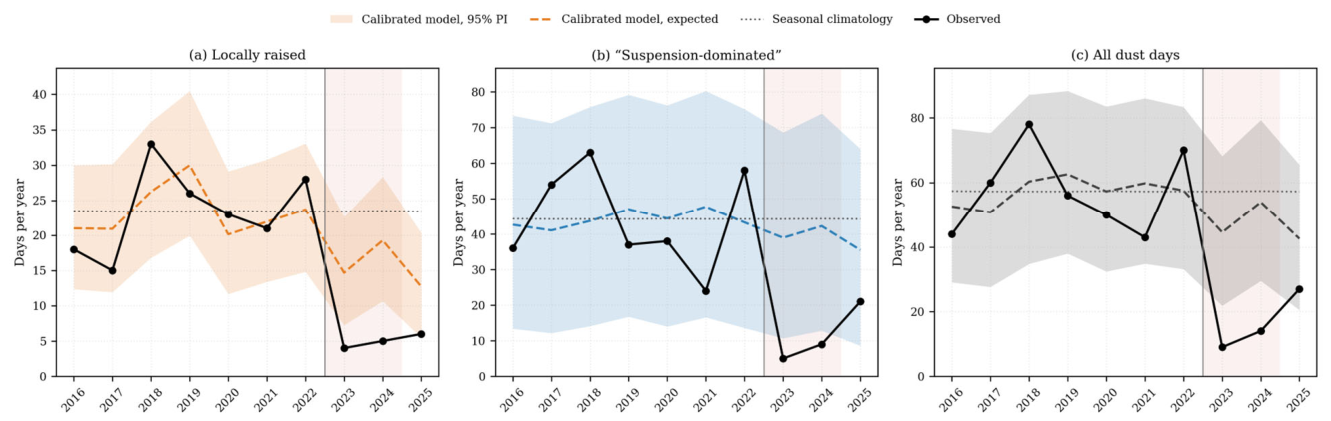
Neither of the two indicator models anticipated the sharp decline in dust activity. Raw scores of the balanced classifiers overstate event frequency (by 1.5–1.8 times in out-of-fold baseline years), so observed counts are compared with the calibrated expectation (Table 3, Figure 6). The calibrated model reproduced the baseline years within its 95% prediction intervals, but in 2023 and 2024 observed dust days were 20% and 26% of the expected 44.5 and 54.0, below the interval in every class; in 2025 they returned within it. The mismatch is directional rather than a simple loss of magnitude: predicted risk peaked in 2024, when observed activity was near its floor, and fell in 2025, when observed activity recovered. Across the three test years, the correlation between expected and observed event days is negative for every class: −0.29 for locally raised dust, −0.40 for all dust, and −0.73 for suspension-dominated dust. These correlations are computed over only three annual values and are reported as descriptive summaries of the mismatch, not as inferential statistics.
Table 3.
Observed and expected event days over the held-out period. The model was trained on 2016–2022 and saw none of these years. Expected: sum of calibrated daily probabilities, with 95% prediction interval (PI); Climatology: seasonal-climatology expectation; O/E: observed/expected.
Figure 6.
The meteorological model does not anticipate the decline. Observed (black) and calibrated expected annual event days for (a) locally raised, (b) suspension-dominated, and (c) all dust days, with 95% prediction interval (shading) and seasonal climatology (dotted); 2016–2022 values are out-of-fold.
The deficit was not specific to the suspension-dominated class: calibrated observed-to-expected ratios in 2023–2024 were 0.13–0.21 for suspension-dominated days and 0.26–0.27 for locally raised days (Table 3), so the ordering of the three correlations above is not evidence of an upwind control. The classes differed in the recovery: suspension-dominated days rose from 5 and 9 to 21 in 2025, whereas locally raised days stayed at 4–6. The error also shrinks monotonically as activity recovers (observed-to-expected ratio for all dust was 0.20, 0.26, and 0.63 in 2023–2025)—so the model is most wrong exactly when the anomaly is largest.
The year 2024 provides the single sharpest illustration of this mismatch. Soil moisture was the second lowest in the record, 30-day antecedent precipitation was below baseline, and both Shamal wind speed and Shamal day frequency were above baseline; every local driver indicated a normal or high-dust year (the calibrated model expected 54.0 dust days, against 57.4 from climatology)—yet only 14 dust days occurred. Local surfaces at Riyadh were favorable for emission during a period when dust activity sat at a two-decade minimum. This suggests that factors not represented by receptor-side meteorology, possibly regional upwind dust availability and transport, contributed importantly to the decline.
3.4. A Negative-Control Test of the PSCF and CWT Source Fields
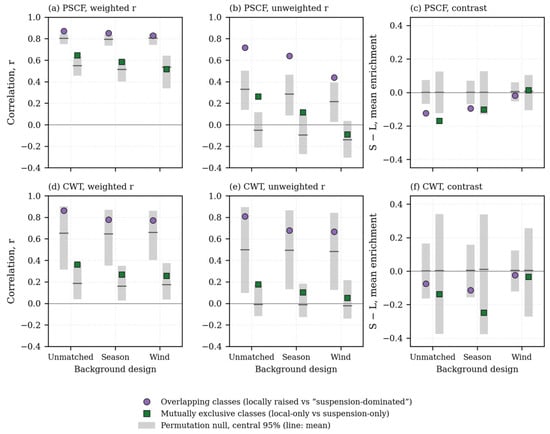
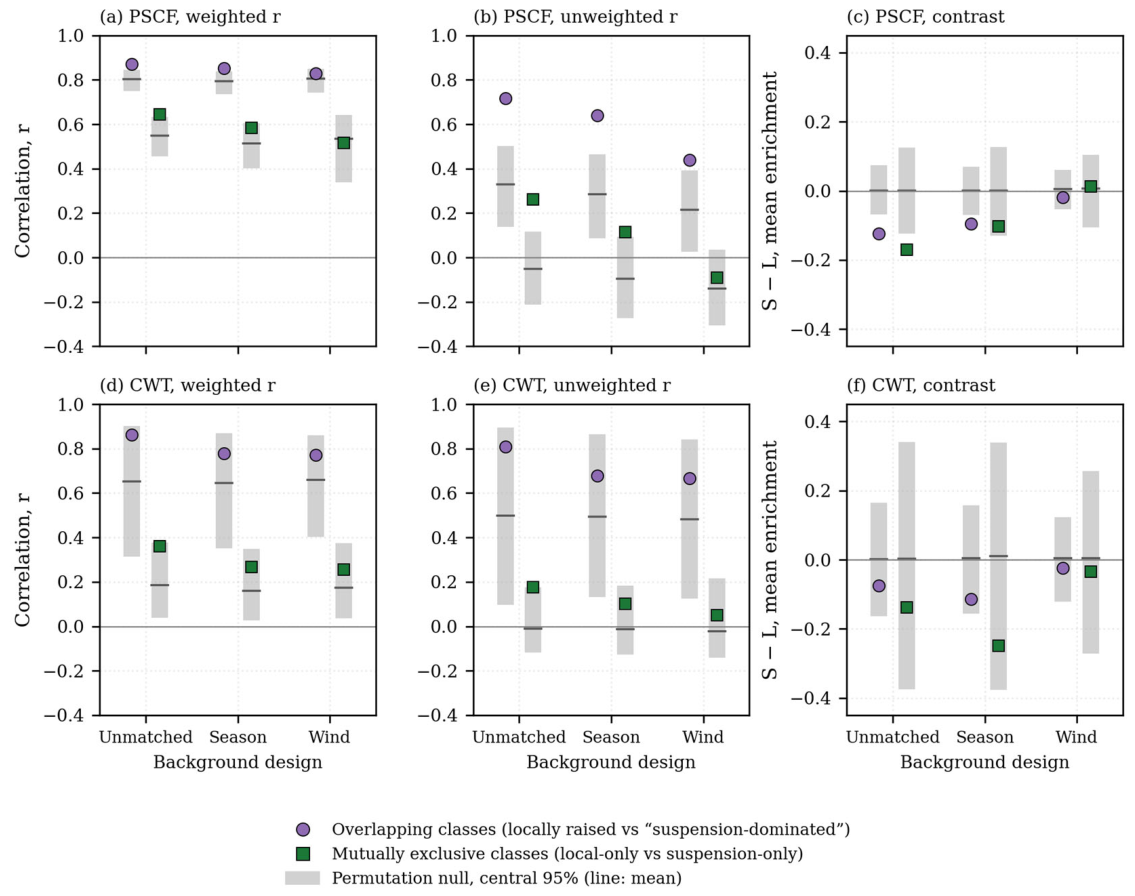
PSCF and CWT fields were computed from the 2016–2022 subset of the 911,867 retained endpoints. Under all three background specifications (Figure 7a), the suspension-dominated and locally raised enrichment fields remained strongly correlated: r = 0.870 unmatched, r = 0.851 season-matched, and r = 0.829 wind-matched; random relabeling of days, however, gave almost the same values (null means 0.80, 0.79, and 0.81), because W imposes a common structure on all fields. Unweighted fields agreed beyond chance (r = 0.72, 0.64, and 0.44 against null means of 0.33, 0.29, and 0.21; Figure 7b), less so for the mutually exclusive classes (0.26, 0.11, and −0.09 against −0.05, −0.10, and −0.14). Successive control for the two most plausible confounders reduced the correlation in every case.
Figure 7.
Agreement and contrast between the class fields: (a,d) weighted correlation; (b,e) unweighted correlation over cells with W ≥ 0.70; (c,f) mean enrichment over the eight candidate regions, suspension-dominated minus locally raised. (a–c) PSCF; (d–f) CWT with daily maximum extinction. Gray bars: central 95% of 1000 permutations.
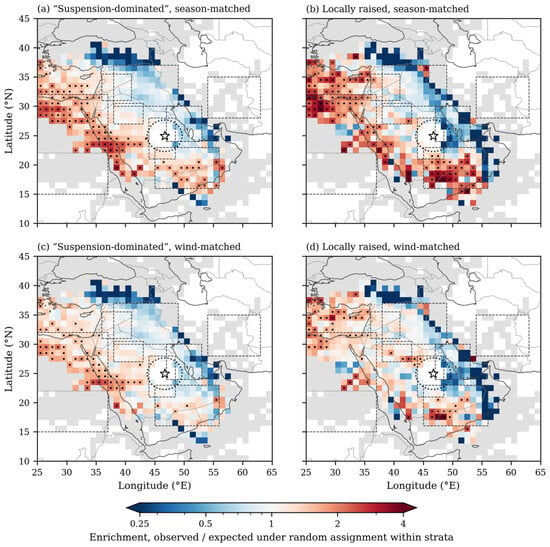
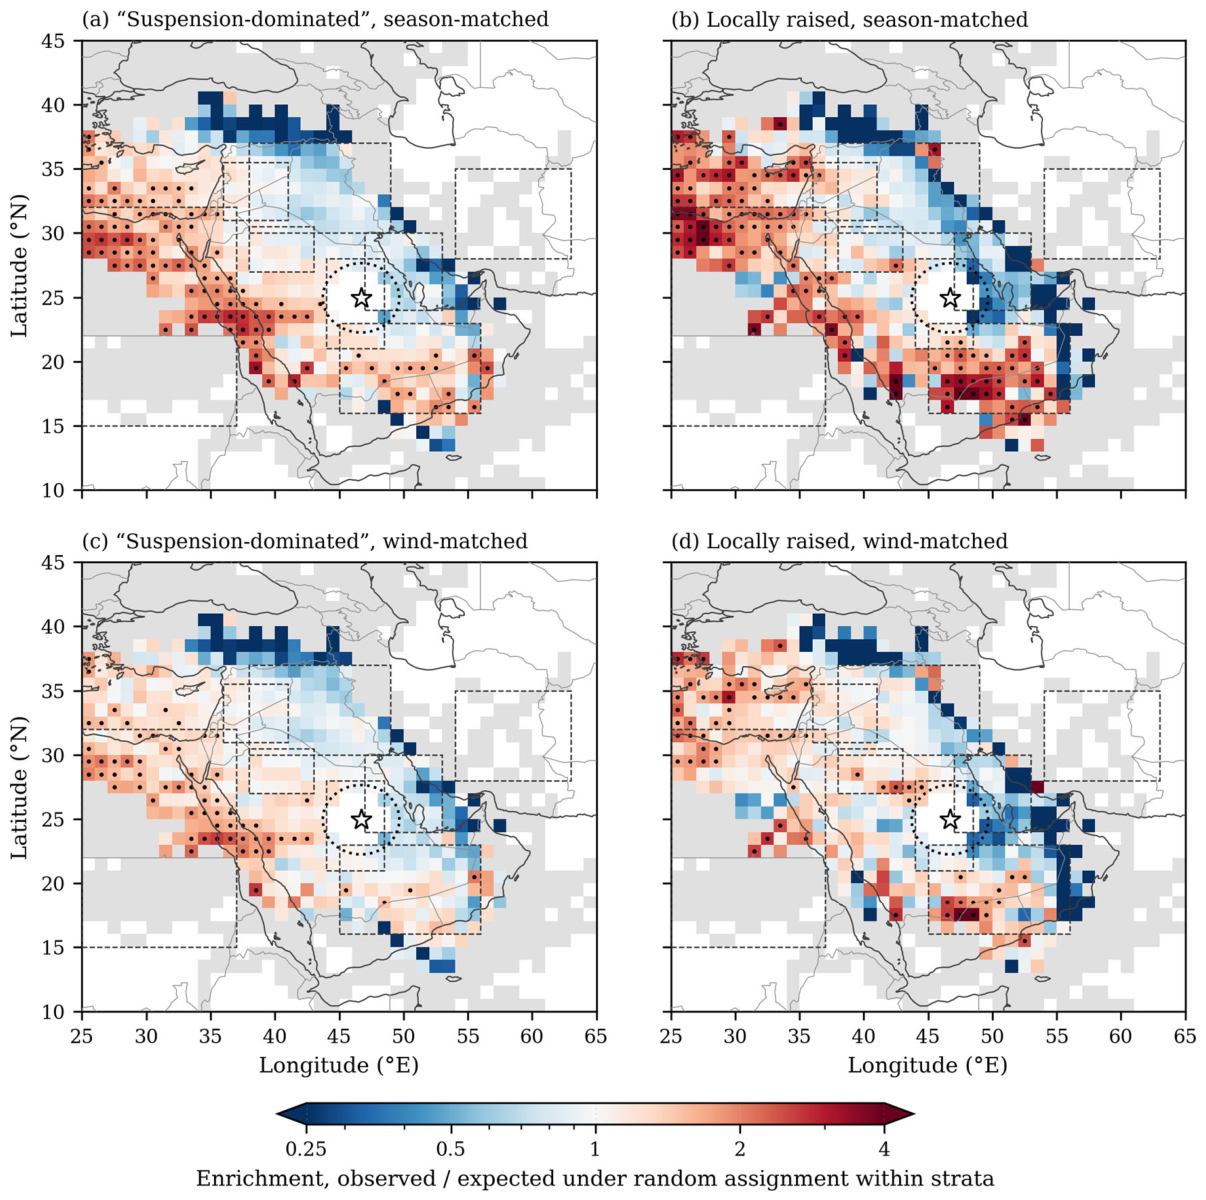
The results of the negative-control comparison appear fairly clear-cut (Table 4, Figure 8). For locally raised dust—which carries evidence consistent with local lifting and so may not require a distant source—the season-matched field returned high apparent source likelihood over the Rub al Khali (mean enrichment 1.52, p ≤ 0.001) and, in the unmatched design, over the Syrian Desert (1.51, p = 0.002; Table S1). A trajectory method that returns strong, spatially coherent distant-source structure for a class whose dust has a clear local origin appears, to that extent, to be responding more to transport climatology than to emission location. Plotted on a common color scale, the control field is visibly the stronger of the two, and the ordering is systematic rather than local: the control outranks the suspension-dominated class in five of the eight candidate regions in both the unmatched and season-matched designs, and over the eight regions together by 0.12 and 0.10 (p ≤ 0.001 and p = 0.007; Figure 7c). The three exceptions are the Ad-Dahna corridor and Eastern Arabia, 71% and 25% of which lie inside the receptor exclusion radius, and the Iranian plateau, which received effectively no trajectory coverage. The inversion appears to hold, in other words, wherever the comparison is well supported, and the mutually exclusive classes show the same ordering (by 0.17 and 0.10; p = 0.005 and p = 0.056).
Table 4.
PSCF enrichment by source region, 2016–2022 dust season (March–June): regional mean (permutation p; ≤0.025 enriched, ≥0.975 depleted). Regions marked * overlap the 300 km receptor exclusion radius and rest on the remaining cells only. Share: of endpoints; Cells: occupied (W = 1); Days: suspension-dominated (S)/locally raised (L) days crossing; Null mean: mean of the permutation nulls.
Figure 8.
Negative-control comparison. Season-matched (a,b) and wind-matched (c,d) enrichment, unweighted, for (a,c) suspension-dominated and (b,d) locally raised dust, on a common color scale; dots mark cells above the 95th percentile of their permutation null, and gray cells are sparsely crossed (W = 0.05). Star, receptor; dotted circle, 300 km exclusion radius; dashed boxes, candidate source regions.
Matching on wind speed removed most of this structure (Figure 8c,d). Mean enrichment over the eight regions exceeded its null by 9% for the locally raised (p = 0.028) and 5% for the suspension-dominated class (p = 0.056), the classes no longer differed (−0.02, p = 0.22), and no candidate region other than northeastern Africa, sampled only at its eastern margin, exceeded its null (p ≤ 0.025) for either class. The event-count-pooled estimator (Section 2.7) would instead have given the locally raised class a Syrian Desert enrichment of 2.62, with 96% of cells above 1.5, but its expected value there under random labels is 2.08; the stratum-standardized value is 1.08 (p = 0.25).
The wind-quintile distribution reveals why the wind-matched estimator matters: locally raised trajectories were entirely absent from the lowest wind quintile (2.2–4.7 m s−1; 0 trajectories against 683 background trajectories) and increased monotonically to 248 (62 days) in the highest (Table 5). Wind speed does not merely covary with dust occurrence at this receptor; it largely determines it, so pooling quintile fields by event count inflates enrichment, most for the locally raised class.
Table 5.
Wind-speed quintile composition of the season-matched sample (March–June 2016–2022), in days/trajectories. Overlap: days meeting both class criteria; pb: share of the quintile’s trajectories arriving on class days; Background: non-class trajectories.
The class-conditional CWT fields pointed the same way (Figure 7d–f; Table S1). With daily maximum extinction the fields were noisier, because a few intense days dominate the numerator, and the contrasts (−0.08, −0.11, and −0.02) were not significant (p ≥ 0.06); with the visibility-independent intensity, the locally raised field again exceeded the suspension-dominated field in the unmatched and season-matched designs (−0.17 and −0.11; p ≤ 0.001 and p = 0.010) but not with wind matching (p = 0.43). In no design or intensity did the suspension-dominated CWT field exceed the locally raised field.
We therefore refrain from interpreting these fields as source attributions at this receptor.
4. Discussion
4.1. Most Dust Days at Riyadh Are Suspension-Dominated Rather than Locally Lifted
Suspension-dominated events outnumber locally raised events by 1.9:1, and the two classes respond differently to local meteorology (AUC 0.914 versus 0.765). The partition carries a direct implication for mitigation. Local lifting occurs on 179 of the 451 dust days (40%); the remaining 272 days (60%) show no evidence of local lifting that meets the three-hour criterion. Surface stabilization and afforestation within and around the city act mainly on the first group. Interventions aimed at the majority of events would have to operate upwind, at least partly in the source regions themselves, which for Riyadh lie largely outside municipal and, in some cases national, jurisdiction. Locally raised events, while fewer, are those in which the source sits immediately beside the population, and their near-surface concentrations may exceed those of suspension-dominated events. Our data resolve the frequency and meteorological controls of the two classes, not their relative exposure burden.
4.2. The 2023–2025 Decline Is Not Explained by Receptor-Side Meteorology
That a locally skillful model (AUC 0.914) does not anticipate an order-of-magnitude decline is reported here alongside its in-sample skill. The deficit affected both classes (observed-to-expected ratios of 0.13–0.27 in 2023–2024), and a model based on local weather that fails under a new regime cannot by itself isolate the missing driver. Local surface conditions in 2024 favored emission on every measured axis, while dust activity sat near a two-decade minimum. This points to a role for upwind dust availability in the source regions, or for the transport pathway, neither of which this study’s domain observes, or for reduced erodibility of the surfaces around Riyadh; we treat these as hypotheses.
A similar decoupling, with the opposite sign, has been reported previously. Notaro et al. [25] attributed the 2007–2013 maximum in Arabian dust activity to persistent drought over the Fertile Crescent [40]: Riyadh’s dust burden responded to soil and vegetation state a thousand kilometers upwind, not to Arabian meteorology. A receptor whose interannual variability is strongly influenced from upwind is exactly where a local-meteorology model should perform poorly across regime shifts, although poor performance alone does not demonstrate upwind control.
The partial recovery in 2025 is consistent with climate variability but does not discriminate between the two candidate explanations for the recent shift. Vegetation cover changes slowly, whereas precipitation and circulation anomalies can reverse year-on-year, so a decline followed by partial reversal is more readily explained by climate variability; the persistent suppression of locally raised days (4–6 per year in 2023–2025), however, could also reflect a change in the local surface, which would require land-cover observations to test. Existing work links Arabian dust variability to ENSO phase through increased precipitation over the Rub’ al Khali and weakened Shamal flow during warm phases [41], and the 2023–2024 El Niño is consistent with the timing, although the link remains a hypothesis here. A single rebound year cannot, however, partition contributions between climate variability and land-surface change, and vegetation observations were not available to this study. Resolving the attribution requires source-region soil moisture and precipitation and NDVI or equivalent vegetation records over the source regions, this being the natural next step, and one that the source-side drought mechanism of Notaro et al. [25] makes testable.
4.3. Trajectory Climatology Strongly Shapes the Apparent Source Fields
The methodological result has the broadest applicability of the findings reported here. At a receptor where dust events are strongly wind-selected and transport is dominated by a single recurrent synoptic regime, the PSCF and CWT fields are shaped largely by the recurrent Shamal transport climatology and the wind selection common to all dust days, which limits their ability to uniquely identify the emitting terrain. No background design made the suspension-dominated class more enriched than the locally lifted control, and wind matching removed most structure from both. Had only the suspension-dominated class been analyzed—the usual practice—the unmatched fields would have suggested a plausible source map over the Rub al Khali and the Ad-Dahna corridor, with nothing in the output to flag the influence of transport climatology.
It helps at this point to distinguish three separate levels of inference. A transport pathway is where receptor air has traveled, which trajectories can estimate fairly directly. A potential source region is an upwind area that could contribute dust, which PSCF and CWT indicate only when event-day and background trajectories differ because of the surface rather than because of the flow. A confirmed emission source would generally require independent evidence—an emission inventory, satellite dust-source activation imagery, or inverse modeling. The negative-control comparison suggests that, at this receptor, the PSCF and CWT fields sit closer to the first level than the second: they largely trace the transport pathway shared by all dust days, so their apparent source regions should probably not be read as confirmed emission areas without further corroboration.
Because the control is imperfect, the inference it supports is directional. Advected dust on locally raised days, most likely on overlap days, could make the two fields alike; for it to make the control the more enriched class, as also found for the exclusive classes, the windy days of local lifting would have to import more distant dust than the days of suspended dust. Either way, the enrichment follows the wind selection of dust days, which wind matching removed, and trajectory statistics cannot distinguish that selection from emission in the regions crossed.
Two common practices can add apparent structure. The endpoint-count weight imposes the same pattern on every field computed from one set of trajectories, so correlations between weighted fields are high even for random labels (about 0.8 here); and pooling stratum-specific ratios by event count inflates enrichment wherever the event rate varies between strata. The mechanism is general: where the event definition and the trajectory geometry are governed by the same variable, the conditional probability PSCF computes is only weakly conditional on source presence. This is consistent with controlled evaluations in which trajectory-statistical methods perform poorly relative to inverse modeling [21]. Riyadh is not unusual: any receptor whose dust events require strong wind from a preferred direction—which describes much of the arid subtropics—is susceptible to the same confounding, and these conditions are common at the dryland stations where PSCF and CWT are most often applied. Many published trajectory-statistical source maps at such receptors report no comparable control.
The result also bears on a premise common in dust-provenance studies: that dust at a receptor can be traced to a discrete source area, so that the remaining problem is one of method, whether geochemical fingerprinting or trajectory statistics. Studies of emission and transport mechanisms show instead that emission is concentrated in small, intermittently active geomorphic units [42], that dust from many such units is mixed along the pathway [43], and that plumes merge far from their origins [44]. A receptor-side method observes the integrated product of emission and transport, and our control shows that, for trajectory statistics, this product can be dominated by the meteorology that selects event days, returning a source map even for dust raised at the receptor itself.
Three practices follow from this result; the first is particularly relevant for single-regime receptors. First, wherever routine surface observations exist, PSCF and CWT applications should run the locally raised class (BLDU/BLSA) as a negative control; present-weather codes supply it at no additional cost, in the observational record itself. A source field that is stronger for the target class than for the control is more defensible; one that is not should not be read as identifying emission sources. Second, absent a control class, studies should report the sensitivity of the source field to background specification; the loss of regional structure we observed under wind matching was itself diagnostic of event selection. Third, source fields and between-class comparisons should be tested against permutation nulls that preserve the trajectory geometry, and matched designs should use stratum-standardized rather than event-count-pooled estimators. Where attribution is required at such receptors, inverse modeling constrained by emission inventories, or satellite dust-source identification independent of trajectory geometry [1,35,45], are the appropriate instruments.
4.4. Limitations
The event catalog rests on human-coded present weather, which carries observer subjectivity, though the parallel visibility record supports its homogeneity. The ERA5 domain terminates at 32° N and therefore excludes the Mesopotamian and Fertile Crescent source regions, precluding any source-side emission diagnostic; this does not affect the indicator model, which uses only the receptor grid point, or the trajectories, which were driven by global GDAS fields. Reanalyses with global coverage, such as ERA5-Land and MERRA-2 [46,47], could supply source-side soil moisture and precipitation and will be used in a follow-up study. GDAS 1° meteorology limits trajectory accuracy, and no trajectory ensemble was computed. The 2023–2025 period contains few events (35 suspension-dominated days), so regime-specific source comparisons are unsupported. Extinction derived from censored visibility compresses the low end of the intensity distribution, which is why a visibility-independent CWT intensity was also used. The suspension-dominated class may also include locally or regionally re-suspended dust, so it is not exclusively of distant origin; conversely, the locally raised class can carry advected dust, which makes it an imperfect negative control. Finally, temperature and vapor pressure deficit remain analytically collinear in the indicator, so their coefficient signs are not interpreted; neither ranks among the leading drivers. The negative-control comparison rests only on the premise that the locally lifted class carries a clear local contribution, so that a distant source is not required to explain its dust; it does not assume that the air above the station is free of transported dust.
5. Conclusions
Ten years of routine surface observations at Riyadh, partitioned by whether dust was raised at the station or arrived in suspension, describe a receptor where most dust days are suspension-dominated and where interannual variability is not explained by receptor-side meteorology. Suspension-dominated days outnumber locally raised days 345 to 179, in every year of the record, and the two classes carry distinct meteorological signatures (held-out AUC 0.914 versus 0.765). Dust activity then underwent a three-regime shift, falling 85.9% below the 2016–2022 baseline in 2023–2024 and remaining 56.0% below in 2025, with timing and magnitude corroborated by the instrument visibility record and by independent national reporting.
Receptor-side meteorology does not, on its own, account for the decline or the recovery. A calibrated model with high held-out skill expected 44.5 and 54.0 dust days in 2023 and 2024 (climatology 57), when 9 and 14 were observed; in every class, observed counts were 13–27% of expectation. In 2024, soil moisture near its record low and Shamal winds above baseline coincided with a two-decade activity minimum. Upwind dust availability, through source-region land-surface state or transport-pathway circulation, and reduced local erodibility remain hypotheses that require source-side observations to test.
In the negative-control comparison, the locally lifted class, whose dust has a clear local origin, returned a stronger apparent source field than the suspension-dominated class in the unmatched and season-matched designs, in five of eight candidate regions and over the eight together; wind matching removed most structure from both. At this receptor, the PSCF and CWT fields are therefore shaped largely by the recurrent Shamal transport climatology and wind selection shared by all dust days, which limits their ability to identify emitting terrain; the same confounding can affect any receptor where events are selected by the variable that also shapes trajectory geometry. Present-weather codes supply a negative-control class at no cost wherever routine surface observations exist, and we recommend that PSCF and CWT source fields at single-regime receptors be interpreted together with such a control and tested against permutation nulls.
Supplementary Materials
The following supporting information can be downloaded at: https://www.mdpi.com/article/10.3390/atmos17111055/s1, Table S1: Regional mean enrichment, with one-sided permutation p in parentheses (1000 day-block permutations within strata; ≤0.025, enriched; ≥0.975, depleted), for (a) PSCF, (b) PSCF of the mutually exclusive classes, and class-conditional CWT with (c) daily maximum extinction and (d) class dust-code hours; (e) between-class correlations of weighted and unweighted (W ≥ 0.70) fields, observed (null mean). S: “suspension-dominated”; L: locally raised. Unmatched: all months of 2016–2022; season- and wind-matched: March–June 2016–2022.
Author Contributions
Conceptualization, S.A.A. and A.S.A.; Methodology, S.A.A. and A.S.A.; Software, S.A.A.; Formal analysis, S.A.A.; Writing—original draft, S.A.A.; Investigation, S.A.A. and A.S.A.; Data curation, S.A.A.; Visualization, S.A.A.; Writing—review and editing, A.S.A. All authors have read and agreed to the published version of the manuscript.
Funding
This research received no external funding.
Institutional Review Board Statement
Not applicable.
Informed Consent Statement
Not applicable.
Data Availability Statement
The METAR archive is publicly available from the Iowa Environmental Mesonet (https://mesonet.agron.iastate.edu (accessed on 27 August 2026)). ERA5 reanalysis is distributed by the Copernicus Climate Data Store (https://cds.climate.copernicus.eu (accessed on 27 August 2026)). HYSPLIT and the GDAS archive meteorology are available from the NOAA Air Resources Laboratory (https://www.ready.noaa.gov (accessed on 27 August 2026)). The data analysis code used in this study is available at https://github.com/salorain/Riyadh_Dust. Further inquiries can be directed to the corresponding author.
Acknowledgments
The authors thank the Iowa Environmental Mesonet for maintaining the public ASOS/METAR archive, ECMWF and the Copernicus Climate Change Service for ERA5, and the NOAA Air Resources Laboratory for the HYSPLIT model and GDAS meteorology. The researchers would like to thank the Deanship of Graduate Studies and Scientific Research at Qassim University (https://www.qu.edu.sa) for financial support (QU-APC-2026).
Conflicts of Interest
The authors declare no conflicts of interest.
References
- Prospero, J.M.; Ginoux, P.; Torres, O.; Nicholson, S.E.; Gill, T.E. Environmental characterization of global sources of atmospheric soil dust identified with the Nimbus 7 Total Ozone Mapping Spectrometer (TOMS) absorbing aerosol product. Rev. Geophys. 2002, 40, 1002. [Google Scholar] [CrossRef] [Scilit]
- Middleton, N.J. A geography of dust storms in South-West Asia. J. Climatol. 1986, 6, 183–196. [Google Scholar] [CrossRef] [Scilit]
- Rezazadeh, M.; Irannejad, P.; Shao, Y. Climatology of the Middle East dust events. Aeolian Res. 2013, 10, 103–109. [Google Scholar] [CrossRef] [Scilit]
- Albugami, S.; Palmer, S.; Cinnamon, J.; Meersmans, J. Spatial and temporal variations in the incidence of dust storms in Saudi Arabia revealed from in situ observations. Geosciences 2019, 9, 162. [Google Scholar] [CrossRef] [Scilit]
- Gandham, H.; Dasari, H.P.; Langodan, S.; Karumuri, R.K.; Hoteit, I. Major changes in extreme dust events dynamics over the Arabian Peninsula during 2003–2017 driven by atmospheric conditions. J. Geophys. Res. Atmos. 2020, 125, e2020JD032931. [Google Scholar] [CrossRef] [Scilit]
- Goudie, A.S. Desert dust and human health disorders. Environ. Int. 2014, 63, 101–113. [Google Scholar] [CrossRef] [Scilit]
- Maghami, M.R.; Hizam, H.; Gomes, C.; Radzi, M.A.; Rezadad, M.I.; Hajighorbani, S. Power loss due to soiling on solar panel: A review. Renew. Sustain. Energy Rev. 2016, 59, 1307–1316. [Google Scholar] [CrossRef] [Scilit]
- Notaro, M.; Alkolibi, F.; Fadda, E.; Bakhrjy, F. Trajectory analysis of Saudi Arabian dust storms. J. Geophys. Res. Atmos. 2013, 118, 6028–6043. [Google Scholar] [CrossRef] [Scilit]
- Yu, Y.; Notaro, M.; Kalashnikova, O.V.; Garay, M.J. Climatology of summer Shamal wind in the Middle East. J. Geophys. Res. Atmos. 2016, 121, 289–305. [Google Scholar] [CrossRef] [Scilit]
- Mashat, A.-W.S.; Awad, A.M.; Alamoudi, A.O.; Assiri, M.E. Monthly and seasonal variability of dust events over northern Saudi Arabia. Int. J. Climatol. 2020, 40, 1607–1629. [Google Scholar] [CrossRef] [Scilit]
- Hamidi, M.; Kavianpour, M.R.; Shao, Y. Synoptic analysis of dust storms in the Middle East. Asia-Pac. J. Atmos. Sci. 2013, 49, 279–286. [Google Scholar] [CrossRef] [Scilit]
- Jish Prakash, P.; Stenchikov, G.; Kalenderski, S.; Osipov, S.; Bangalath, H. The impact of dust storms on the Arabian Peninsula and the Red Sea. Atmos. Chem. Phys. 2015, 15, 199–222. [Google Scholar] [CrossRef] [Scilit]
- Draxler, R.R.; Hess, G.D. An overview of the HYSPLIT_4 modelling system for trajectories, dispersion and deposition. Aust. Meteorol. Mag. 1998, 47, 295–308. [Google Scholar] [CrossRef] [Scilit]
- Stein, A.F.; Draxler, R.R.; Rolph, G.D.; Stunder, B.J.B.; Cohen, M.D.; Ngan, F. NOAA’s HYSPLIT atmospheric transport and dispersion modeling system. Bull. Am. Meteorol. Soc. 2015, 96, 2059–2077. [Google Scholar] [CrossRef] [Scilit]
- Stohl, A. Trajectory statistics—A new method to establish source–receptor relationships of air pollutants and its application to the transport of particulate sulfate in Europe. Atmos. Environ. 1996, 30, 579–587. [Google Scholar] [CrossRef] [Scilit]
- Ashbaugh, L.L.; Malm, W.C.; Sadeh, W.Z. A residence time probability analysis of sulfur concentrations at Grand Canyon National Park. Atmos. Environ. 1985, 19, 1263–1270. [Google Scholar] [CrossRef] [Scilit]
- Seibert, P.; Kromp-Kolb, H.; Baltensperger, U.; Jost, D.T.; Schwikowski, M.; Kasper, A.; Puxbaum, H. Trajectory analysis of aerosol measurements at high alpine sites. In Transport and Transformation of Pollutants in the Troposphere; Borrell, P.M., Borrell, P., Cvitaš, T., Seiler, W., Eds.; SPB Academic Publishing: The Hague, The Netherlands, 1994; pp. 689–693. [Google Scholar]
- Polissar, A.V.; Hopke, P.K.; Paatero, P.; Kaufmann, Y.J.; Hall, D.K.; Bodhaine, B.A.; Dutton, E.G.; Harris, J.M. The aerosol at Barrow, Alaska: Long-term trends and source locations. Atmos. Environ. 1999, 33, 2441–2458. [Google Scholar] [CrossRef] [Scilit]
- Polissar, A.V.; Hopke, P.K.; Harris, J.M. Source regions for atmospheric aerosol measured at Barrow, Alaska. Environ. Sci. Technol. 2001, 35, 4214–4226. [Google Scholar] [CrossRef] [Scilit]
- Hsu, Y.-K.; Holsen, T.M.; Hopke, P.K. Comparison of hybrid receptor models to locate PCB sources in Chicago. Atmos. Environ. 2003, 37, 545–562. [Google Scholar] [CrossRef] [Scilit]
- Fang, X.; Saito, T.; Park, S.; Li, S.; Yokouchi, Y.; Prinn, R.G. Performance of back-trajectory statistical methods and inverse modeling method in locating emission sources. ACS Earth Space Chem. 2018, 2, 843–851. [Google Scholar] [CrossRef] [Scilit]
- World Meteorological Organization (WMO). Manual on Codes, Volume I.1: International Codes (WMO-No. 306); WMO: Geneva, Switzerland, 2019. [Google Scholar]
- Lipsitch, M.; Tchetgen Tchetgen, E.; Cohen, T. Negative controls: A tool for detecting confounding and bias in observational studies. Epidemiology 2010, 21, 383–388, Erratum in Epidemiology 2010, 21, 589. [Google Scholar] [CrossRef] [Scilit]
- Edgell, H.S. Arabian Deserts: Nature, Origin and Evolution; Springer: Dordrecht, The Netherlands, 2006. [Google Scholar] [CrossRef] [Scilit]
- Notaro, M.; Yu, Y.; Kalashnikova, O.V. Regime shift in Arabian dust activity, triggered by persistent Fertile Crescent drought. J. Geophys. Res. Atmos. 2015, 120, 10229–10249. [Google Scholar] [CrossRef] [Scilit]
- Iowa Environmental Mesonet; Iowa State University. ASOS/AWOS/METAR Data Download. Available online: https://mesonet.agron.iastate.edu/request/download.phtml (accessed on 27 August 2026).
- Koschmieder, H. Theorie der horizontalen Sichtweite. Beiträge Phys. Freien Atmos. 1924, 12, 33–53. [Google Scholar]
- Hersbach, H.; Bell, B.; Berrisford, P.; Hirahara, S.; Horányi, A.; Muñoz-Sabater, J.; Nicolas, J.; Peubey, C.; Radu, R.; Schepers, D.; et al. The ERA5 global reanalysis. Q. J. R. Meteorol. Soc. 2020, 146, 1999–2049. [Google Scholar] [CrossRef] [Scilit]
- Allen, R.G.; Pereira, L.S.; Raes, D.; Smith, M. Crop Evapotranspiration: Guidelines for Computing Crop Water Requirements; FAO Irrigation and Drainage Paper 56; Food and Agriculture Organization of the United Nations: Rome, Italy, 1998. [Google Scholar]
- Breiman, L. Random forests. Mach. Learn. 2001, 45, 5–32. [Google Scholar] [CrossRef] [Scilit]
- Pedregosa, F.; Varoquaux, G.; Gramfort, A.; Michel, V.; Thirion, B.; Grisel, O.; Blondel, M.; Prettenhofer, P.; Weiss, R.; Dubourg, V.; et al. Scikit-learn: Machine learning in Python. J. Mach. Learn. Res. 2011, 12, 2825–2830. [Google Scholar]
- Saito, T.; Rehmsmeier, M. The precision-recall plot is more informative than the ROC plot when evaluating binary classifiers on imbalanced datasets. PLoS ONE 2015, 10, e0118432. [Google Scholar] [CrossRef] [Scilit]
- Platt, J.C. Probabilistic outputs for support vector machines and comparisons to regularized likelihood methods. In Advances in Large Margin Classifiers; Smola, A.J., Bartlett, P., Schölkopf, B., Schuurmans, D., Eds.; MIT Press: Cambridge, MA, USA, 1999; pp. 61–74. [Google Scholar]
- Wang, Y.Q.; Zhang, X.Y.; Draxler, R.R. TrajStat: GIS-based software that uses various trajectory statistical analysis methods to identify potential sources from long-term air pollution measurement data. Environ. Model. Softw. 2009, 24, 938–939. [Google Scholar] [CrossRef] [Scilit]
- Ginoux, P.; Prospero, J.M.; Gill, T.E.; Hsu, N.C.; Zhao, M. Global-scale attribution of anthropogenic and natural dust sources and their emission rates based on MODIS Deep Blue aerosol products. Rev. Geophys. 2012, 50, RG3005. [Google Scholar] [CrossRef] [Scilit]
- Wilks, D.S. Resampling hypothesis tests for autocorrelated fields. J. Clim. 1997, 10, 65–82. [Google Scholar] [CrossRef] [Scilit]
- Saudi Gazette. 2023 Is the Lowest Recorded Year for Dust Incidents in Saudi Arabia. 7 January 2024. Available online: https://www.saudigazette.com.sa/article/639383 (accessed on 27 August 2026).
- SPA (Saudi Press Agency). Saudi Arabia Records Lowest Rate of Dust and Sand Storms in May for 20 Years. 2 June 2024. Available online: https://spa.gov.sa/en/N2114971 (accessed on 27 August 2026).
- SPA (Saudi Press Agency). Saudi Arabia Sees Significant 53% Decline in Sand and Dust Storms This Year. 21 August 2025. Available online: https://www.spa.gov.sa/en/N2382841 (accessed on 27 August 2026).
- Kelley, C.P.; Mohtadi, S.; Cane, M.A.; Seager, R.; Kushnir, Y. Climate change in the Fertile Crescent and implications of the recent Syrian drought. Proc. Natl. Acad. Sci. USA 2015, 112, 3241–3246. [Google Scholar] [CrossRef] [Scilit]
- Yu, Y.; Notaro, M.; Liu, Z.; Wang, F.; Alkolibi, F.; Fadda, E.; Bakhrjy, F. Climatic controls on the interannual to decadal variability in Saudi Arabian dust activity: Toward the development of a seasonal dust prediction model. J. Geophys. Res. Atmos. 2015, 120, 1739–1758. [Google Scholar] [CrossRef] [Scilit]
- Bullard, J.E.; Harrison, S.P.; Baddock, M.C.; Drake, N.; Gill, T.E.; McTainsh, G.; Sun, Y. Preferential dust sources: A geomorphological classification designed for use in global dust-cycle models. J. Geophys. Res. Earth Surf. 2011, 116, F04034. [Google Scholar] [CrossRef] [Scilit]
- Scheuvens, D.; Schütz, L.; Kandler, K.; Ebert, M.; Weinbruch, S. Bulk composition of northern African dust and its source sediments—A compilation. Earth-Sci. Rev. 2013, 116, 170–194. [Google Scholar] [CrossRef] [Scilit]
- Schepanski, K. Transport of mineral dust and its impact on climate. Geosciences 2018, 8, 151. [Google Scholar] [CrossRef] [Scilit]
- Schepanski, K.; Tegen, I.; Laurent, B.; Heinold, B.; Macke, A. A new Saharan dust source activation frequency map derived from MSG-SEVIRI IR-channels. Geophys. Res. Lett. 2007, 34, L18803. [Google Scholar] [CrossRef] [Scilit]
- Muñoz-Sabater, J.; Dutra, E.; Agustí-Panareda, A.; Albergel, C.; Arduini, G.; Balsamo, G.; Boussetta, S.; Choulga, M.; Harrigan, S.; Hersbach, H.; et al. ERA5-Land: A state-of-the-art global reanalysis dataset for land applications. Earth Syst. Sci. Data 2021, 13, 4349–4383. [Google Scholar] [CrossRef] [Scilit]
- Gelaro, R.; McCarty, W.; Suárez, M.J.; Todling, R.; Molod, A.; Takacs, L.; Randles, C.A.; Darmenov, A.; Bosilovich, M.G.; Reichle, R.; et al. The Modern-Era Retrospective Analysis for Research and Applications, Version 2 (MERRA-2). J. Clim. 2017, 30, 5419–5454. [Google Scholar] [CrossRef] [Scilit]

Disclaimer/Publisher’s Note: The statements, opinions and data contained in all publications are solely those of the individual author(s) and contributor(s) and not of MDPI and/or the editor(s). MDPI and/or the editor(s) disclaim responsibility for any injury to people or property resulting from any ideas, methods, instructions or products referred to in the content. |
© 2026 by the authors. Licensee MDPI, Basel, Switzerland. This article is an open access article distributed under the terms and conditions of the Creative Commons Attribution (CC BY) license.