


Figure/Table Legend/Caption Correction
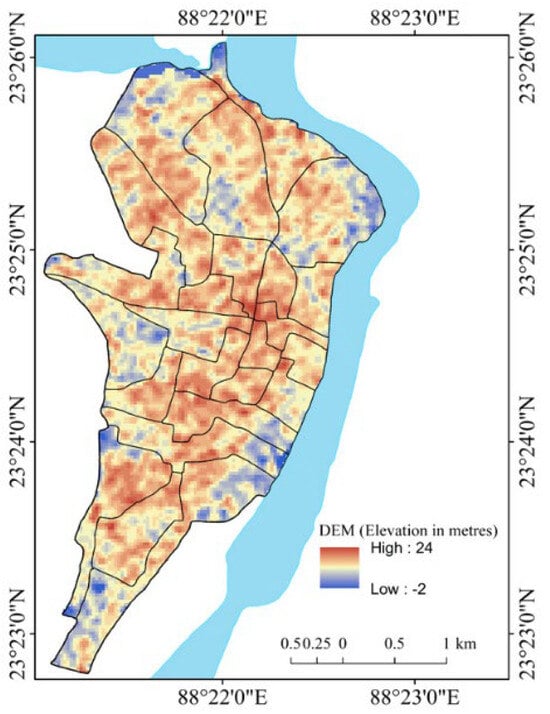
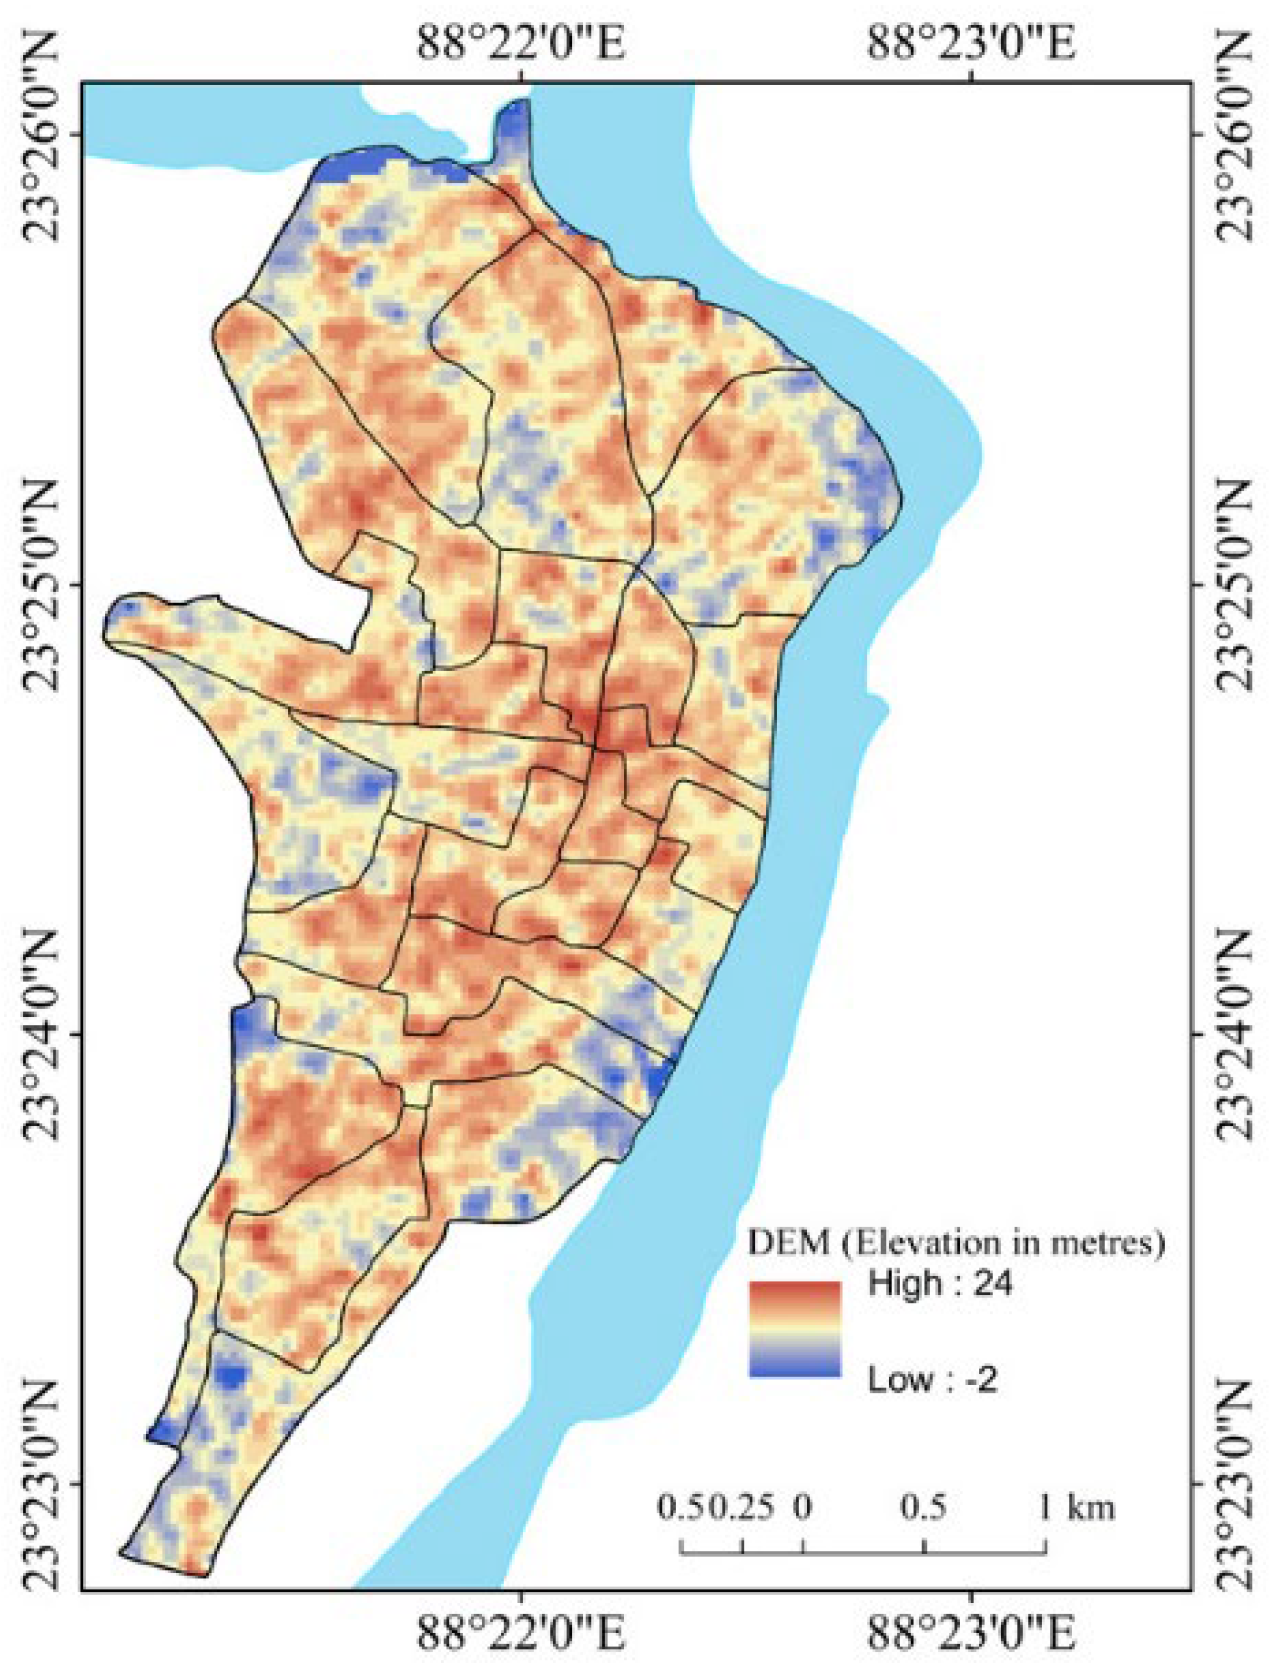
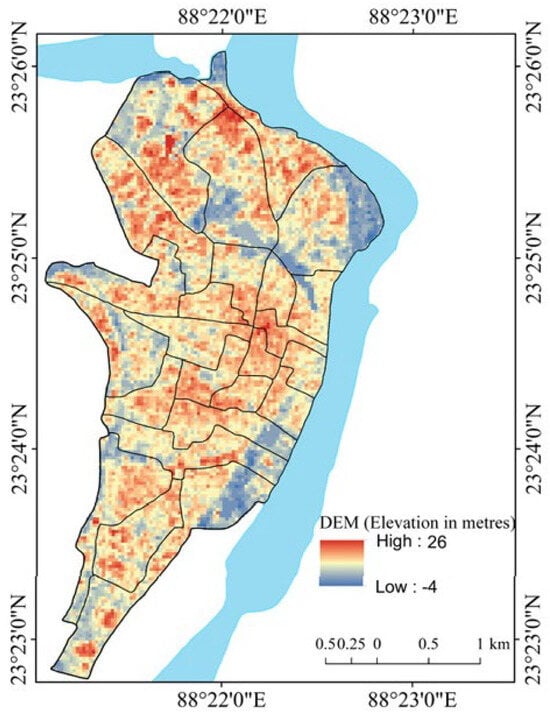
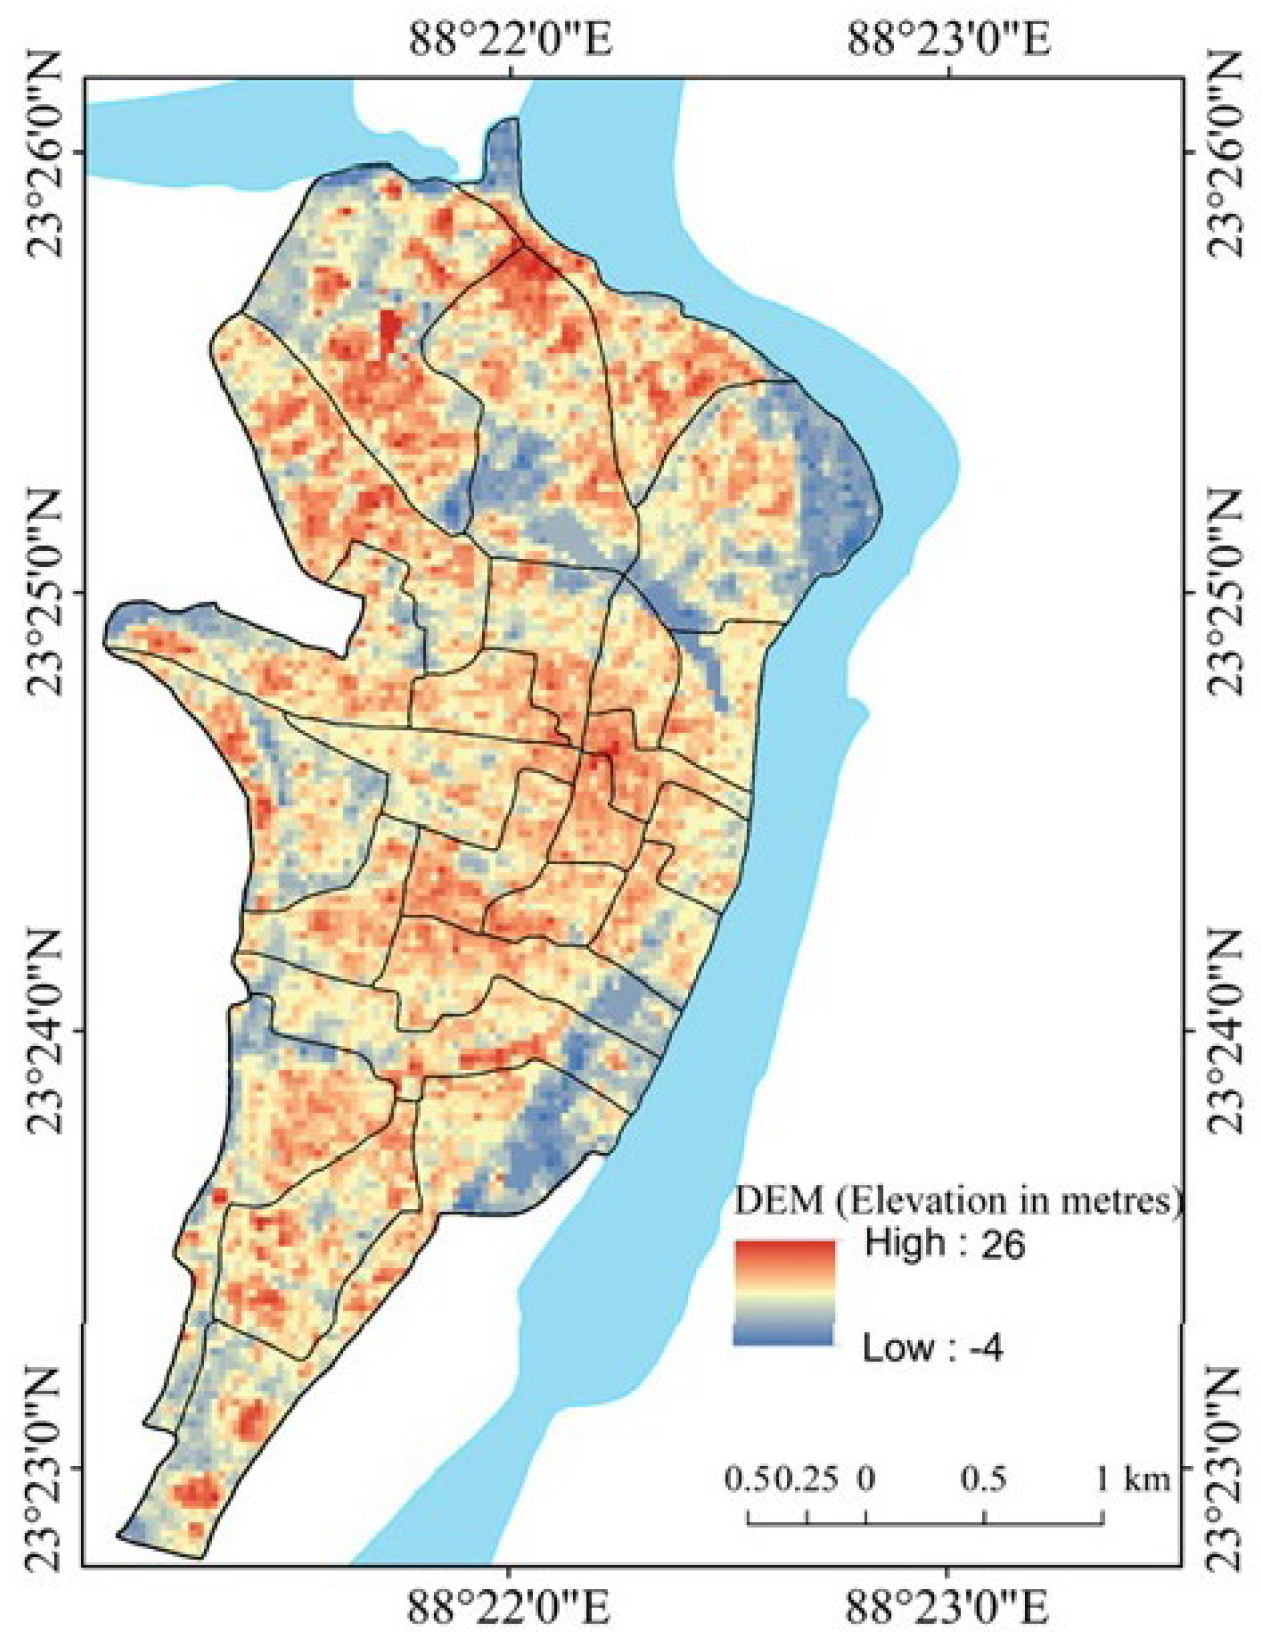
In the original publication [1], there was an error in the legend of Figure 29 (DEM (Elevation, 2015)). The corrected legend, “High: 26, Low: −4,” appears below. There was also a mistake in the caption of Figure 14 (Relief (2000)). The corrected caption of Figure 14 (DEM (Elevation, 2000)) appears below. There was also a mistake in the caption of Figure 29 (Relief (2015)). The correct caption of Figure 29 (DEM (Elevation, 2015)) appears below. There were also mistakes in Table 3 (Details of the parameters and indicators used in the present study), as published. The error, “Relief (R) in m (1 m = 3.28084 feet),” is on page no. 9 of 57. The correction “Elevation in m (1 m = 3.28084 feet)” appears below. In Table 3, another error, “Derived from Digital Elevation Model (DEM)” is on page no. 9 of 57. The correction is “Digital Elevation Model (DEM).” In the same table, “Terrain analysis and relief aspect of the morphometry of drainage basin” is another error, on page no. 9 of 57. The correction is “The primary topographic (elevation) aspect of the morphometry of the drainage basin”. The final error is in “Normalized Difference Flood Index 3 (NDFI2)” on page 10 of 57. The correction “Normalized Difference Flood Index 2 (NDFI2)” appears below. A correction has been made also in Table 7. Correlation matrix of the selected indicators of flood vulnerability (2015) in page no. 33 of 57. The error is “0.455 **” and “0.577” in the Elevation column. Besides, the error regarding the symbology (colour) of the cell containing the correlation value −0.792 ** in Table 7 appears. The error is that “the colour of the cell is light blue”. The correction appears below.
Figure 14.
DEM (2000). A consequence of the negative value of elevation (−2 m) is probably the slight ambiguity of SRTM DEM across riverine and low-lying floodplain areas.
Figure 29.
DEM (2015). The negative value of elevation is consequence probably due to Cartosat DEM artifacts and interpolation effects in riverine areas.
Table 3.
Details of the parameters and indicators used in the present study.
Table 7.
Correlation matrix of the selected indicators of flood vulnerability (2015).


Text Correction
In the original publication [1], a correction has been made to Sections 3 “Materials and Methods”, 3.4 “Methods and Techniques”, and 3.4.2. “Digital Elevation Model (DEM) and Raster Analyses” (page no. 9 of 57, lines 2 and 3 of the 1st paragraph). The error was “The DEM analysis has measured the relief in meters (1 m = 3.28084 feet)”, and the correction is “The DEM analysis has measured the elevation in meters (1 m = 3.28084 feet),”.
A correction has been made to Sections 4 “Results” and 4.2. “Factors and Zonation of Flood Vulnerability” (page no. 21 of 57, lines 1 and 2 of the 1st paragraph). The error is “related to flood vulnerability: relief (DEM)”. The correction, “related to flood vulnerability: elevation (DEM),” appears in the paragraph below. In Sections 4 “Results” and 4.2. “Factors and Zonation of Flood Vulnerability” (page no. 21 of 57, line 6 of the 1st paragraph), a correction has been made. The error is “Significant positive or negative correlations between”. The correction is “Significant correlations between”.
In Sections 4 “Results” and 4.2. “Factors and Zonation of Flood Vulnerability” (page no. 21 of 57, lines 9, 10, 13 and 15 of the 1st paragraph), a correction has been made. The errors are “have been found.”, “greater than 0.7.”, “Significant positive or negative correlations between”, “NDBI, and NDTI”, “normalized difference flood index (NDFI)”, “NDFI values”. The corrections “have been found in 2000”, “greater than ± 0.7”, “Significant correlations between”, “NDBI and NDTI”, “normalized difference flood index2 (NDFI2)”, “NDFI2 values” appear below. A correction has been made to Sections 4 “Results” and “4.2. “Factors and Zonation of Flood Vulnerability” (page no. 21 of 57, lines 25–27 of the 1st paragraph). The error is “Elevation (relief) shows the highest standard deviation (SD) (mean = 16.15, SD = 2.64), and flow distance shows the lowest (mean = 1.88, SD = 2.02).”. The correction, “Flow direction showed the highest standard deviation (SD) (mean = 34.4583, SD = 28.90502), and NDVI and NDTI showed the lowest (mean = −0.0867, SD = 0.02213).,” appears in the paragraph below. In Sections 4 “Results” and 4.2. “Factors and Zonation of Flood Vulnerability” (page no. 21 of 57, line 30 of the 1st paragraph) a correction has been made. The error is “(F 0.05)”, and the correction, “(F < 0.05)”, appears in the paragraph below. Other corrections have been made in Sections 4 “Results” and 4.2. “Factors and Zonation of Flood Vulnerability” (page no. 21 of 57, lines 33 and 34 of the 1st paragraph). The error is “Here, NDFI2 increased with increasing”, “decreased”. The correctios are “Here, NDFI2 had positive correlation values with”, “negative correlation values”.
Corrections have been made to Section 5 “Major Findings, Discussion, and Policy Suggestions” (page no. 49 of 57, lines 13–17). The errors are “The flood index increased with increasing elevation, slope, flow direction, flow length, line density, NDWI, and NDTI, whereas it decreased with increasing flow distance, NDSI, the distance of municipal wards from the old river course, and the distance of municipal wards from the new river course. )”of the 1st paragraph, “A highly concretized relief and slope can increase the flood vulnerability in the study area,”. The corrections are “The flood index was increased with increasing elevation, slope, flow direction, flow length, line density, NDWI, and NDTI, whereas it was decreased with increasing flow distance, NDSI, the distance of municipal wards from the old river course, and the distance of municipal wards from the new river course and vice versa.” “A highly concretized relief and slope can increase the flood vulnerability by drainage congestion in the study area,” which appears in the paragraph below. Other corrections have been made in Section 5 “Major Findings, Discussion, and Policy Suggestions” (page no. 50 of 57, lines 44–46, 58 and 64 of the 1st paragraph). The errors are “Contrarily, some of the underdeveloped wards located relatively in a high-elevation area of the city fringe showed less vulnerability to flooding occurrences than some of the developed wards located at low elevations and closer to the city center.”, “areas were analyzed”, “the SWOC have been ranked separately” The corrections are “Contrarily, some of the underdeveloped wards that are located comparatively in a high-elevation area of the city fringe showed less vulnerability to flood occurrences than some of the wards situated in the lower elevation area and closer to the city center. The scenario was particularly followed near the levee of the old river course in the western part of the city.”, “area was analyzed”, “the SWOC parameters have been ranked separately”.
Corrections have been made in Section 6 “Conclusions” (page no. 52 of 57, lines 33 and 34 of the 1st paragraph). The error is “In the years 2000 and 2015, the normalized difference flood index indicated a variety of relationships with the predictor variables.”, “are required to mitigate”. The correction is “In the year 2015, the normalized difference flood index shows the highest statistical relationship with the normalized difference turbidity index.”, “is required to mitigate”.
References Correction
References 53 and 54 in the original publication [1] required correction. With this correction, the order of some references has been adjusted accordingly.
Error Reference:
[Page No. 55 of 57, Reference No. 53]
53. Smith, K.G. Standards for grading texture of erosional topography. Am. J. Sci. 1950, 248, 655–668.
Corrected Reference:
53. Moore, I.D.; Grayson, R.B.; Ladson, A.R. Digital terrain modelling: A review of hydrological, geomorphological, and biological applications. Hydrol. Process. 1991, 5, 3–30. https://doi.org/10.1002/hyp.3360050103.
Error Reference:
54. Schumm, S.A. Evolution of drainage systems and slopes in badlands at Perth Amboy, New Jersey. Geol. Soc. Am. Bull. 1956, 67, 597–646.
[Page No. 56 of 57, Reference No. 54]
Corrected Reference:
54. Wilson, J.P.; Gallant, J.C. (Eds.) Terrain Analysis: Principles and Applications; Wiley: New York, NY, USA, 2000.
The authors state that the scientific conclusions are unaffected. The Academic Editor approved these corrections. The original publication has also been updated.
Reference
- Basu, T.; Mondal, B.K.; Abdelrahman, K.; Fnais, M.S.; Praharaj, S. Assessing Urban Flood Hazard Vulnerability Using Multi-Criteria Decision Making and Geospatial Techniques in Nabadwip Municipality, West Bengal in India. Atmosphere 2023, 14, 669. [Google Scholar] [CrossRef] [Scilit]
Disclaimer/Publisher’s Note: The statements, opinions and data contained in all publications are solely those of the individual author(s) and contributor(s) and not of MDPI and/or the editor(s). MDPI and/or the editor(s) disclaim responsibility for any injury to people or property resulting from any ideas, methods, instructions or products referred to in the content. |
© 2026 by the authors. Licensee MDPI, Basel, Switzerland. This article is an open access article distributed under the terms and conditions of the Creative Commons Attribution (CC BY) license.