


Abstract
Carbon dioxide (CO2) and methane (CH4) are important greenhouse gases emitted by vehicles, yet their spatial pattern within urban road networks remains poorly characterized. This study conducts mobile measurements of CO2 and CH4 along the 1st Ring Road (mean speed of the monitoring vehicle: 22 km h−1), 2nd Ring Road (22 km h−1), and Ring Expressway (90 km h−1) in Xi’an, China, to investigate their spatial distribution and influencing factors. Average CO2 and CH4 concentrations on the three ring roads exhibited a clear decline with increasing distance from the city center. Both CO2 and CH4 showed higher concentrations at lower vehicle speeds and at higher traffic volumes, but CH4 hotspots differed spatially from CO2 and exhibited weaker dependence on vehicle speed, indicating additional off-road CH4 sources (e.g., natural gas leaks, nearby livestock farms). In a tunnel case study, CO2, CH4, and CO concentrations increased concurrently from entrance to exit, resulting in strong correlations between CH4 and CO2 (R2 = 0.86) and between CO and CO2 (R2 = 0.66). This produced emission ratios (ΔCH4/ΔCO2 = 0.160 ppb ppm−1; ΔCO/ΔCO2 = 3.151 ppb ppm−1), representative of incomplete combustion under congestion. Our results provide direct observational evidence linking urban traffic dynamics to greenhouse gas emissions and emphasize the need for congestion mitigation to reduce on-road climate-relevant emissions.
1. Introduction
The increasing atmospheric concentrations of carbon dioxide (CO2) and methane (CH4) are the main drivers of current and future climate change. These two gases are the most abundant anthropogenic greenhouse gases (GHGs) in the atmosphere. Notably, CH4 has a global warming potential approximately 28–36 times higher than that of CO2 over a 100-year timeframe, making both gases crucial targets for emission mitigation efforts [1,2]. Urban areas are responsible for ~70% of global fossil fuel CO2 emissions due to dense populations, industrial activity, and heavy transportation demand [3]. Among these sources, on-road transportation contributes substantially and increasingly to CO2 and CH4 emissions, particularly in rapidly developing cities where vehicle ownership and fuel consumption continue to grow [4,5,6]. Understanding the spatial pattern of these emissions is therefore essential for improving urban carbon accounting and guiding effective climate mitigation policies.
Previous studies have investigated CO2 concentrations and emissions in urban environments using stationary measurements and bottom-up emission inventories [7,8,9]. These methods have provided valuable insights into long-term emission trends and source attribution [10]. However, they often lack the spatial resolution needed to capture fine-scale variability associated with traffic dynamics and road network structure. In addition, urban-scale CO2 emissions estimated from inventory data often differ from real CO2 emissions because of limitations in statistical data [11,12]. Mobile observation techniques, where in situ instruments are mounted on vehicles to continuously measure gas concentrations, offer a powerful means of detecting spatial variability and identifying localized emission hotspots [13,14,15,16,17]. Despite their advantages, most mobile studies have focused primarily on CO2, with relatively few examining CH4 in detail, especially in traffic-dominated urban areas [18,19,20].
CH4 emissions from vehicles are inherently more complex than those of CO2. While CO2 is the direct product of fossil fuel combustion, CH4 emissions may arise from incomplete combustion or from non-tailpipe sources such as fuel evaporation, natural gas leakage, rainwater/sewage pipelines, or off-road infrastructure [2,21,22,23]. Consequently, the spatial behavior of CH4 often differs from that of CO2, both in magnitude and distribution [18]. For example, CH4 hotspots may not always coincide with high-traffic areas, indicating the presence of additional, non-traffic-related emission sources [18,24]. Aside from this, previous mobile studies in China and elsewhere have primarily focused on CO2 and/or CH4 enhancements and their spatial patterns, e.g., [7,19], with limited measurements of carbon monoxide (CO), which is a key combustion by-product that provides essential constraints for interpreting vehicle emission characteristics. Moreover, observational constraints on real-world CH4/CO2 and CO/CO2 emission ratios are also scarce, particularly under controlled conditions such as tunnels where vehicle emissions can be isolated. Taken together, these complexities highlight the need for simultaneous, high-resolution measurements of CO2, CH4 and CO within diverse traffic environments to better understand their relationships and improve urban GHG inventories.
Xi’an is one of China’s major carbon-emitting cities, where transportation represents a substantial share of total CO2 emissions [25,26,27]. Xi’an also features a concentric road network (including the 1st Ring Road, 2nd Ring Road, and Ring Expressway) with traffic density decreasing and vehicle speeds increasing progressively from the city center outward. In this study, we conducted simultaneous mobile measurements of CO2, CH4 and CO concentrations along the three ring roads in Xi’an to assess their spatial distributions and examine how vehicle speed and traffic conditions (congested versus smooth flow) influence on-road emissions. Furthermore, a tunnel case study provides a controlled environment to assess the buildup of vehicular-emitted CO2, CH4 and CO, and to quantify the emission ratios of CH4 and CO relative to CO2 under real-world congested driving conditions. These findings provide a scientific basis for estimating city-scale GHG emissions and offer insights for developing effective urban emission-reduction and traffic management policies.
2. Materials and Methods
2.1. Sampling
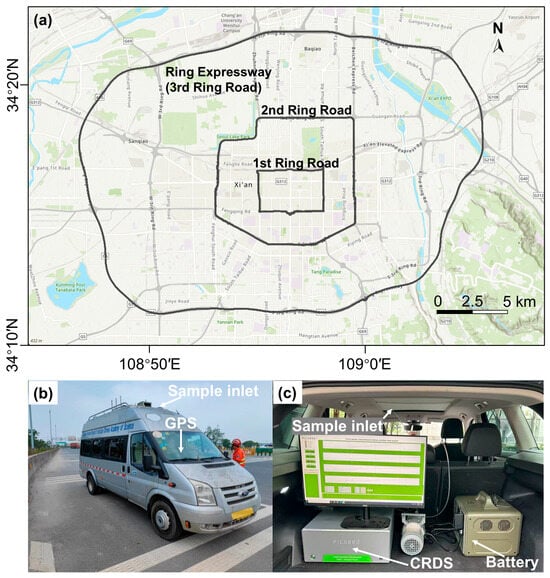
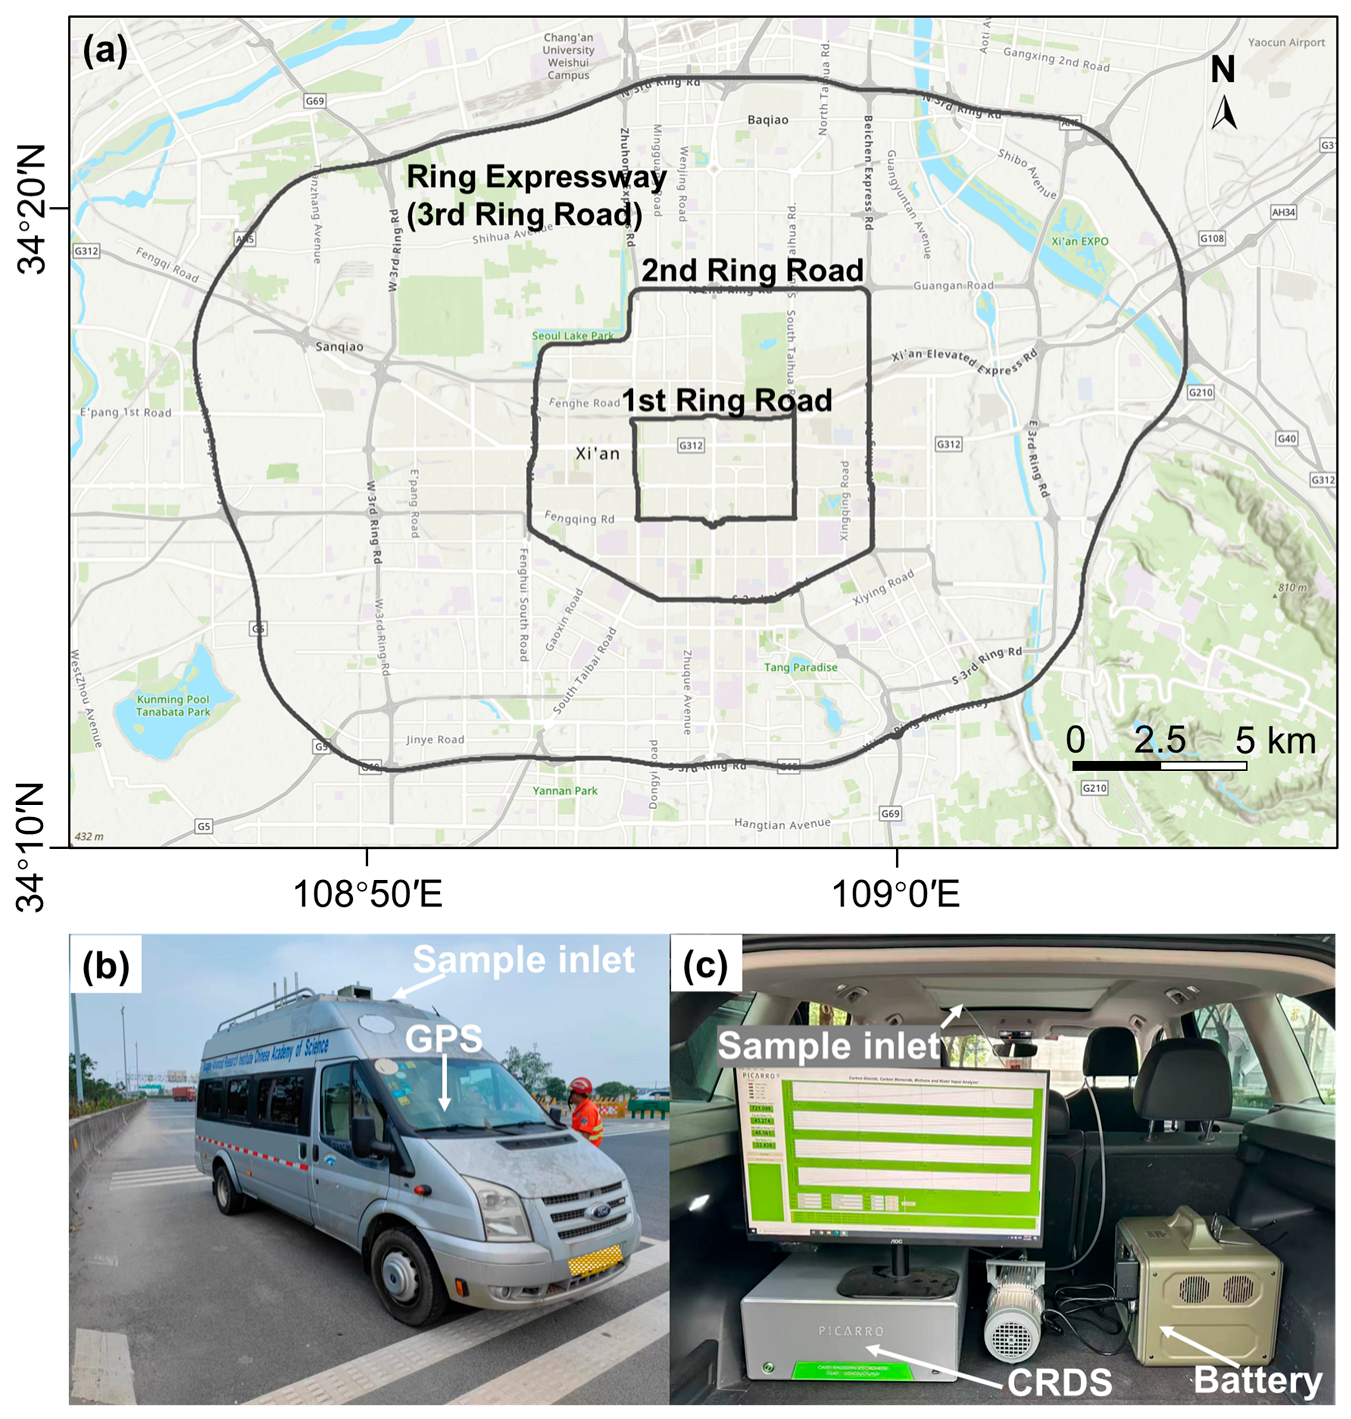
Mobile on-road measurements of GHGs (CO2 and CH4) and CO concentrations were conducted on 31 May 2025 along the major ring roads of Xi’an, a megacity in northwest China (Figure 1). The campaign covered the 1st Ring Road, 2nd Ring Road, and Ring Expressway. The 1st Ring Road (total length: 15 km) closely follows the perimeter of the Xi’an city wall and has a speed limit of 60 km h−1. The 2nd Ring Road (total length: 34 km) lies within the central built-up area, functioning as an urban expressway with a speed limit of 80 km h−1. The Xi’an Ring Expressway (speed limit of 120 km h−1) is an 88 km-long expressway ring road encircling Xi’an. Together, these three ring roads form the backbone of Xi’an’s urban transportation network, playing a critical role in regulating traffic flow. The fleet composition in Xi’an is dominated by gasoline-powered passenger vehicles, especially within the 1st and 2nd Ring Roads. Public buses in the central areas are largely fueled by compressed natural gas (CNG) or electricity. Heavy-duty diesel trucks are generally restricted from entering the 1st and 2nd Ring Roads during daytime hours under Xi’an’s traffic management policies. The Ring Expressway, located in the outer urban area, carries a higher proportion of heavy-duty diesel trucks, contributing to greater emission heterogeneity.
Figure 1.
(a) Measurement routes for the mobile on-road measurements of greenhouse gases on the 1st Ring Road, 2nd Ring Road, and Ring Expressway in Xi’an City; (b) The monitoring vehicle used for investigation that equipped with instruments; (c) Interior view of the monitoring vehicle showing the sampling setup, including the cavity ring-down spectrometer (CRDS).
Our measurement started at around 11:00 and went one cycle after another until 18:00. The traffic volume data are not publicly available. We therefore use driving speed as a proxy indicator. Road segments with relatively low vehicle speeds are likely to correspond to higher traffic volumes. The 1st Ring Road, 2nd Ring Road, and Ring Expressway took approximately 84 min, 188 min, and 54 min, with a mean speed of 22 km h−1, 22 km h−1, and 90 km h−1, respectively. Our mobile measurement was conducted on a clear day without precipitation and abrupt synoptic weather changes.
2.2. Instrumentation
In this study, a cavity ring-down spectrometer (CRDS; model G2401, Picarro, Inc., Santa Clara, CA, USA) was installed in a monitoring vehicle to measure atmospheric CO2, CH4, and CO concentrations on roads with a time resolution of 1 s while the vehicle was in motion. This setup allows us to obtain instantaneous ambient concentrations along the driving path. The time resolution corresponds to a spatial resolution of 8 m for a driving speed of 30 km h−1. To minimize potential influence from exhaust emissions of the monitoring vehicle, the gas inlet was installed at the top front of the vehicle (about 1.8 m above ground; Figure 1b,c), where it samples on-road air that was influenced by diluted vehicle exhaust from surrounding traffic. While small contributions from the monitoring vehicle’s exhaust cannot be fully excluded, particularly at stop or during idling, the on-road variability of CO2, CH4 and CO due to traffic is much larger, ensuring that the measured concentrations predominantly reflect emissions from surrounding vehicles.
Drying of the sampled air was not applied; however, CO2 and CH4 concentrations were converted from wet to dry values using simultaneously measured water vapor. This correction is necessary because absorption features of CO2 and CH4 are affected by the presence of water vapor, due to overlapping absorption lines and dilution. In contrast, CO absorbs at a wavelength that is much less affected by water vapor, and no correction was applied for its measured concentrations. All measurements reported by the instrument are in ppm (parts per million). In this study, CH4 and CO are converted to ppb (parts per billion) due to their lower concentrations relative to CO2. The overall uncertainty in our reported concentrations includes instrument precision, calibration accuracy, and additional measurement uncertainties inherent to mobile sampling. Specifically, the precision of this instrument is approximately 17 ppb for CO2, 0.5 ppb for CH4, and 3.5 ppb for CO at 5 s from the factory report. The instrument was calibrated before and after mobile measurement using standard gases traceable to the WMO X2007 scale for CO2 (491.43 ppm), the WMO X2004A scale for CH4 (3029.3 ppb), and WMO X2014A for CO (427.4 ppb) at the Institute of Earth Environment, CAS (IEECAS). In addition, a GPS unit was mounted at the front of the monitoring vehicle to record its location and speed during the measurement period. Data from the CRDS and GPS were combined according to local time, and a small time-matching offset (typically ~1s) may occur, introducing a minor additional uncertainty. Overall, these uncertainties are small compared with the larger on-road variability of CH4, CO2, and CO concentrations that mainly caused by traffic emissions.
2.3. Determination of Background Concentrations
To determine urban background concentrations, stationary measurements of CO2 and CH4 were conducted using a CRDS instrument at an urban background site at IEECAS. During the measurement period, the average CO2 and CH4 concentrations were 445 ppm and 2086 ppb, respectively. However, a stationary CO measurement was not conducted in this study. Instead, background CO concentrations were evaluated using data from an urban background station in Xi’an, reported by the China Ministry of Ecology and Environment, which recorded a value of 283 ppb. These background values are substantially lower than the mean concentrations measured on each ring road.
3. Results
3.1. Spatial Distribution of CO2
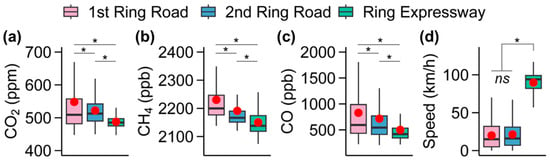
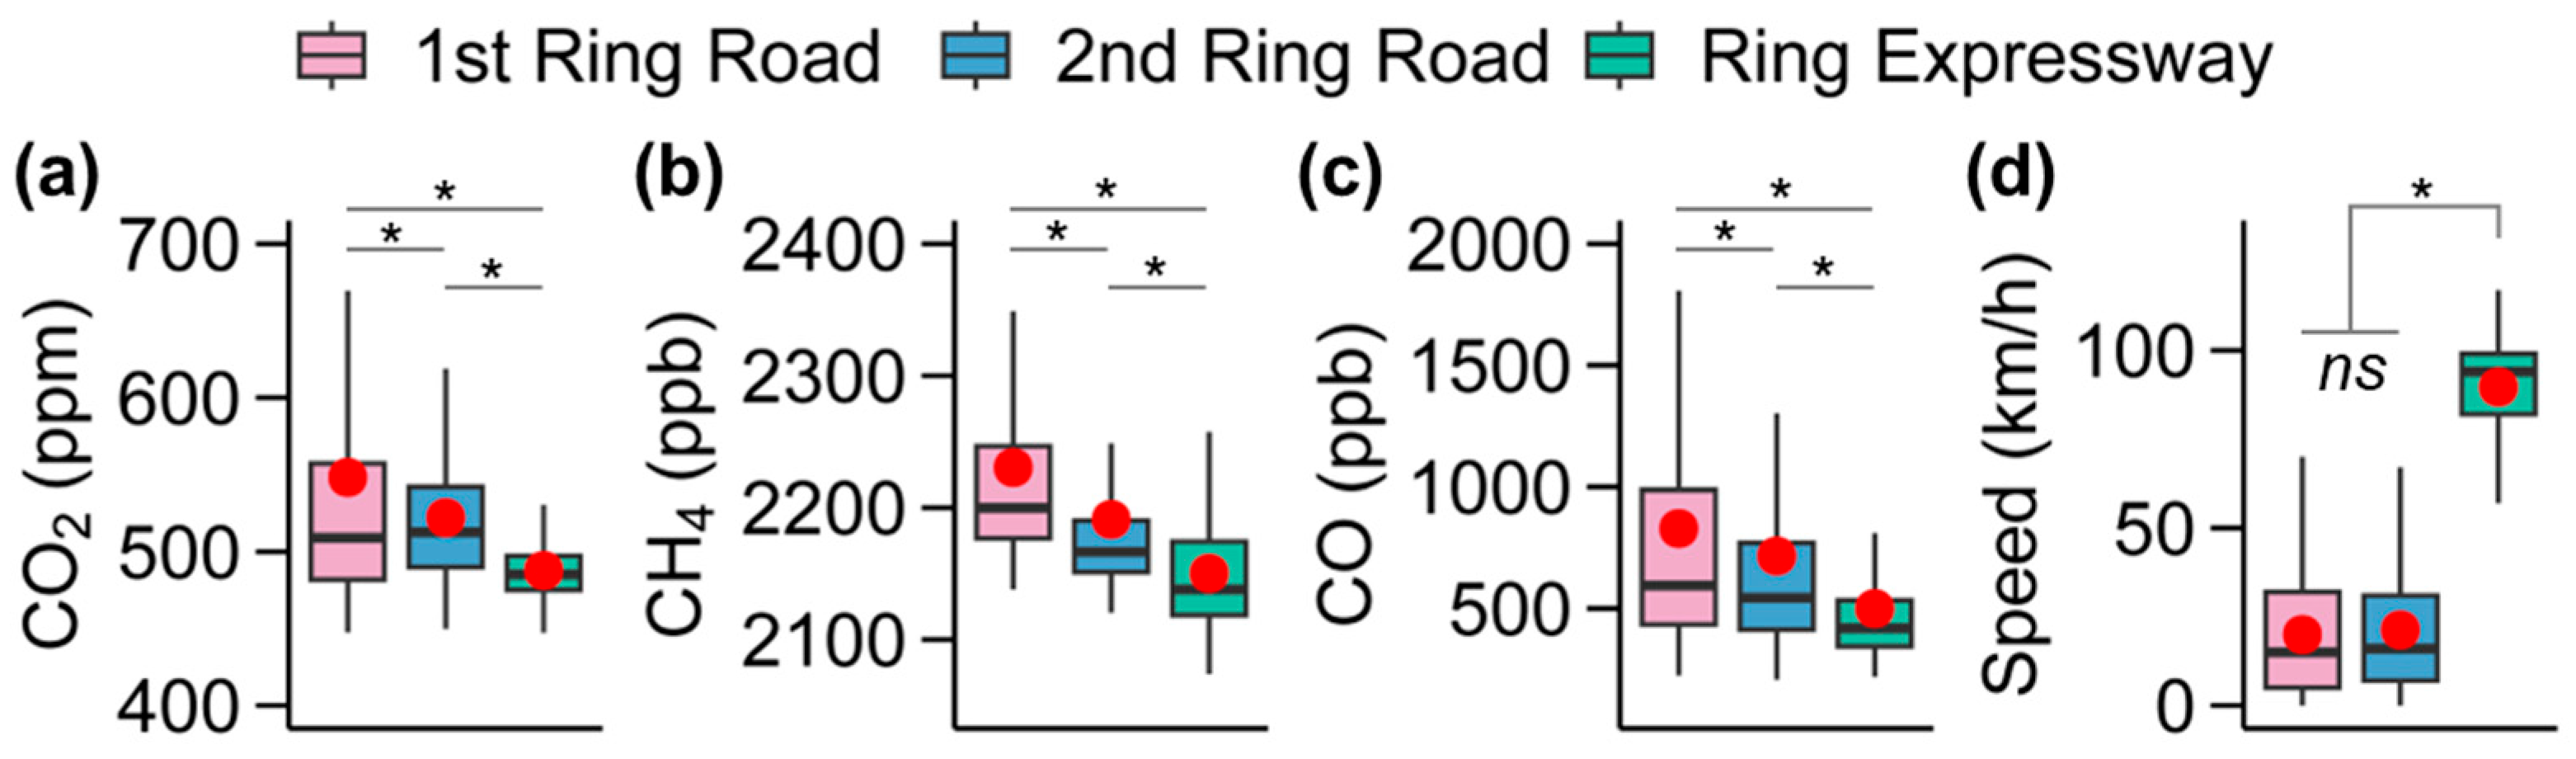
Average CO2 concentrations were 548 ± 128, 522 ± 50, and 488 ± 18 ppm on the 1st Ring Road, 2nd Ring Road, and Ring Expressway in Xi’an, respectively, showing a clear decreasing trend with distance from the city center (all p values < 0.05; Figure 2a; Table 1). All three ring roads showed significantly higher CO2 levels than the urban background concentration of 445 ppm measured at the IEECAS monitoring site (all p values < 0.05), which is located between the 2nd Ring Road and the Ring Expressway. In contrast, the lowest 5th percentile concentrations (P5) were relatively similar across the three roads (460 ppm, 466 ppm, and 462 ppm, respectively). This convergence suggests that mean CO2 concentrations reflect the strong influence of local traffic emissions, particularly within the urban core (1st and 2nd Ring Roads), whereas the lower tail of the distribution is primarily governed by the regional urban background, which remains consistently elevated across the road network (i.e., above the Xi’an natural background levels of ~435 ppm measured in May 2021 and 2022) [28].
Figure 2.
Boxplot showing the variability in the concentrations of CO2 (a), CH4 (b), and CO (c), as well as vehicle driving speed (d) measured on the 1st Ring Road, 2nd Ring Road, and Ring Expressway in Xi’an. In each panel, the red-filled circle represents the mean. p values determined by t-tests at 95% confidence interval are shown [ns, not significant; * p < 0.05].
Table 1.
Concentrations of CO2, CH4, and CO, as well as driving speed on each ring road.
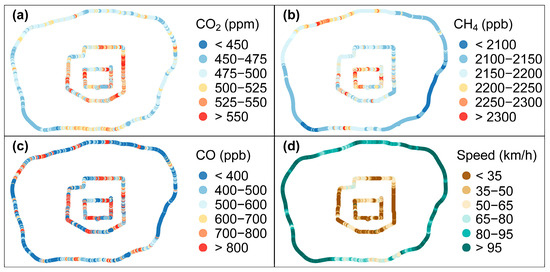
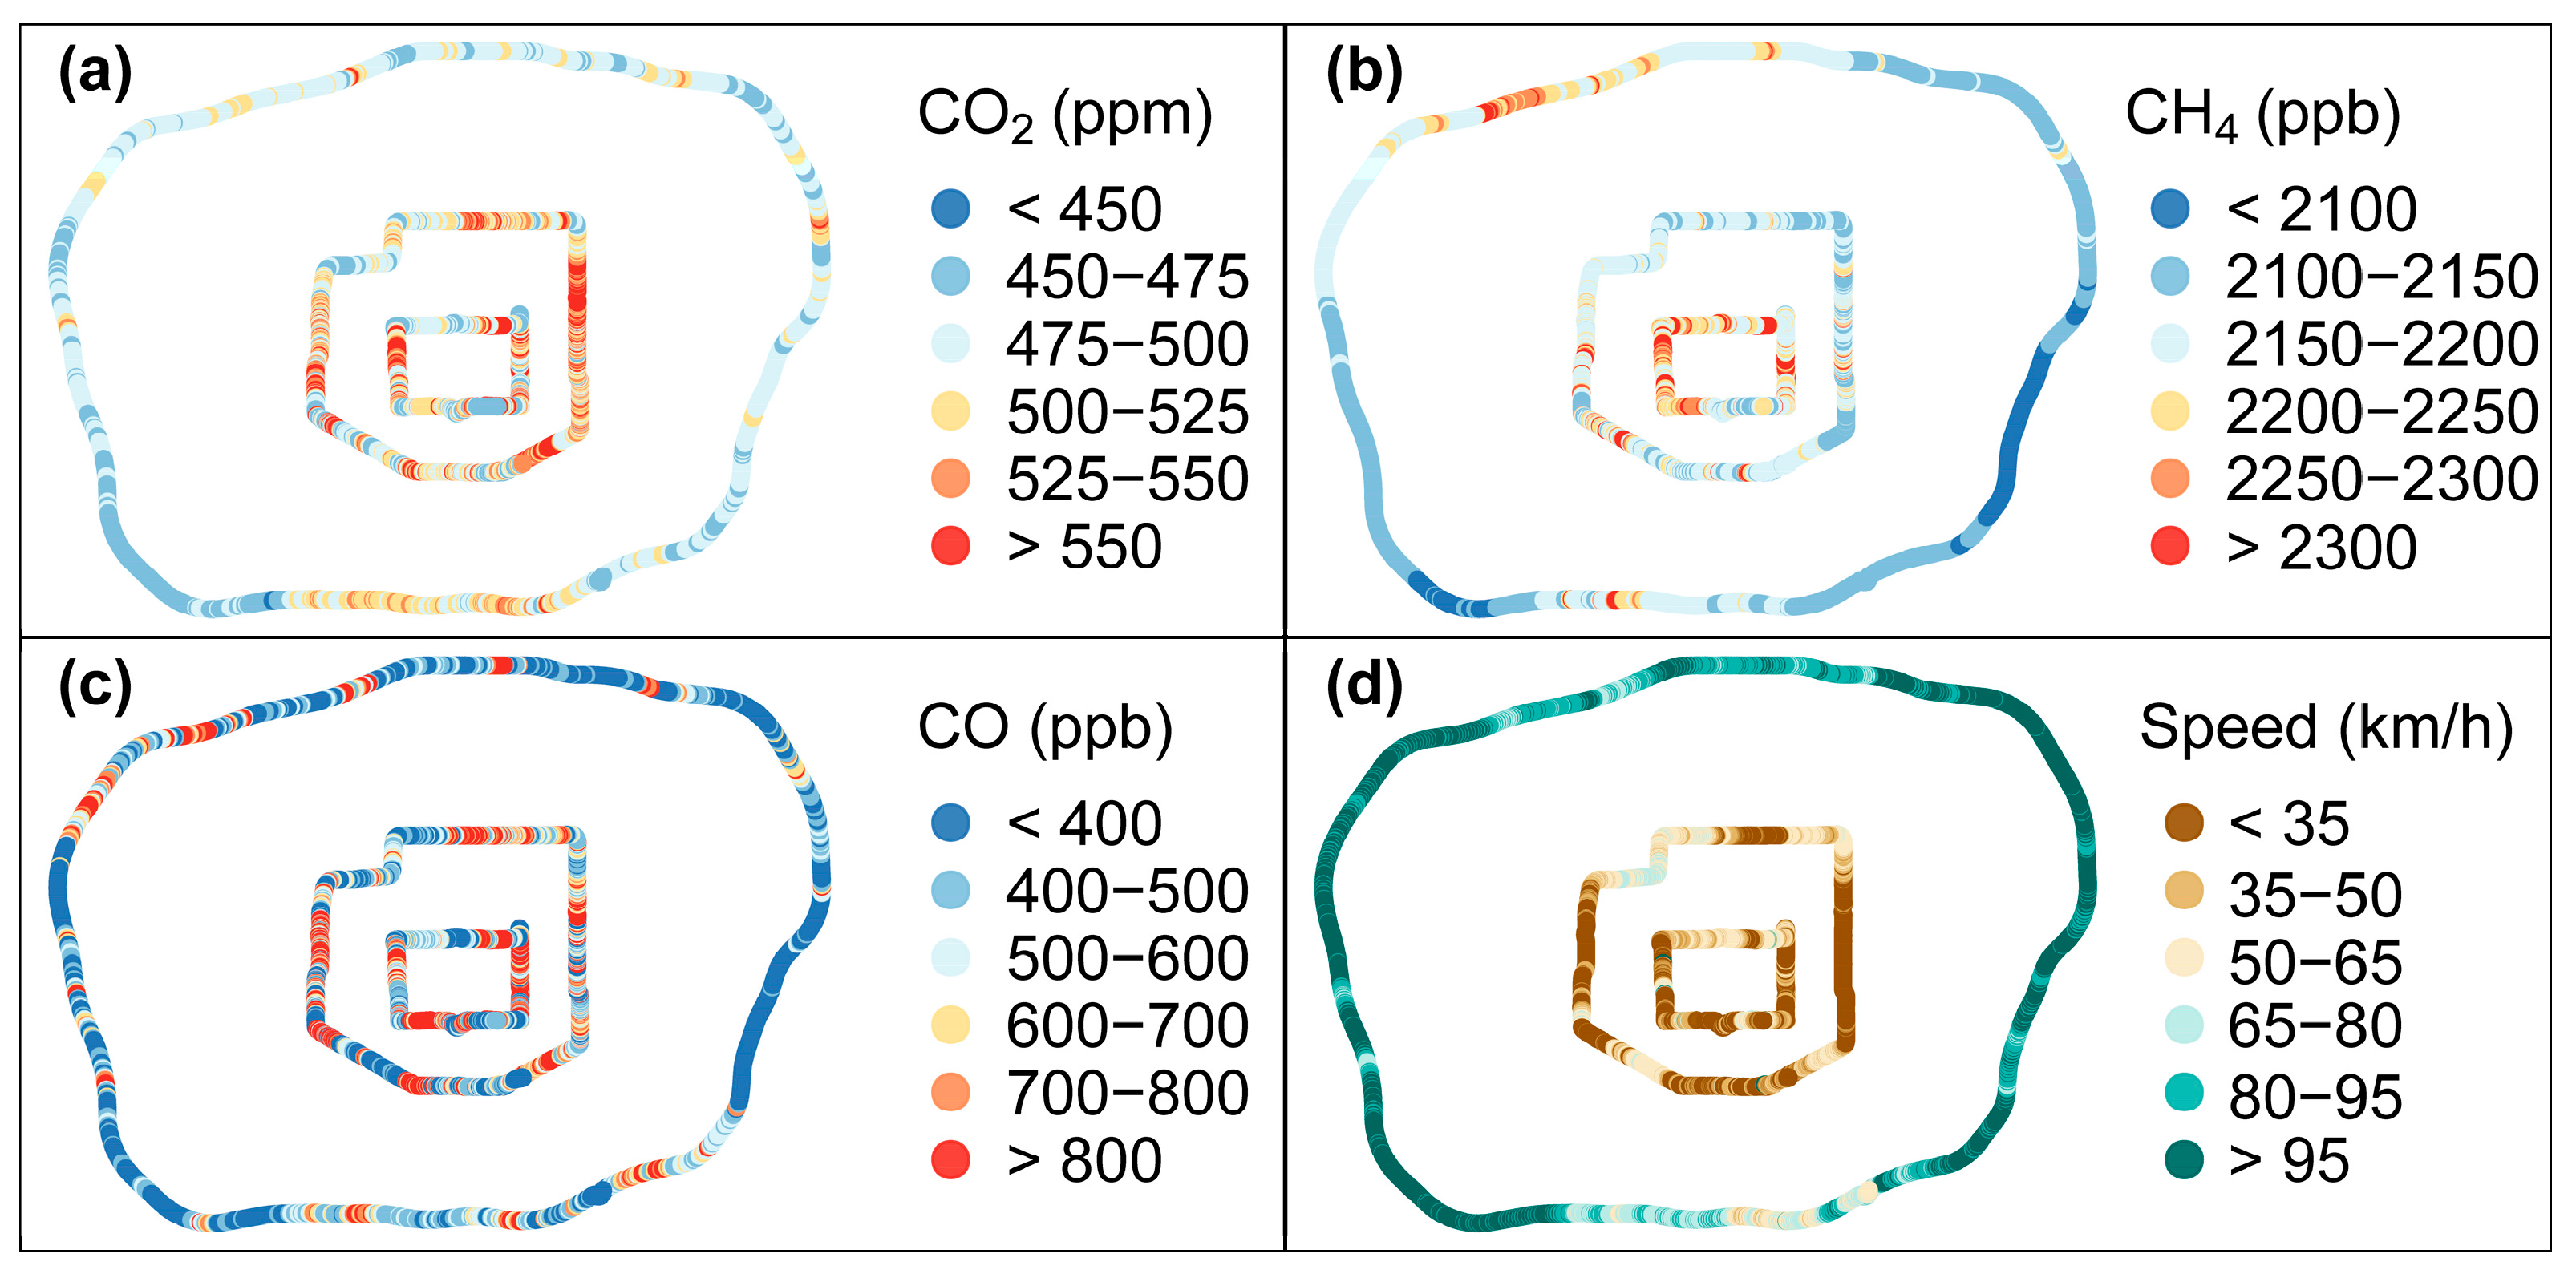
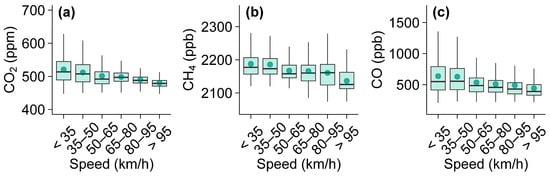
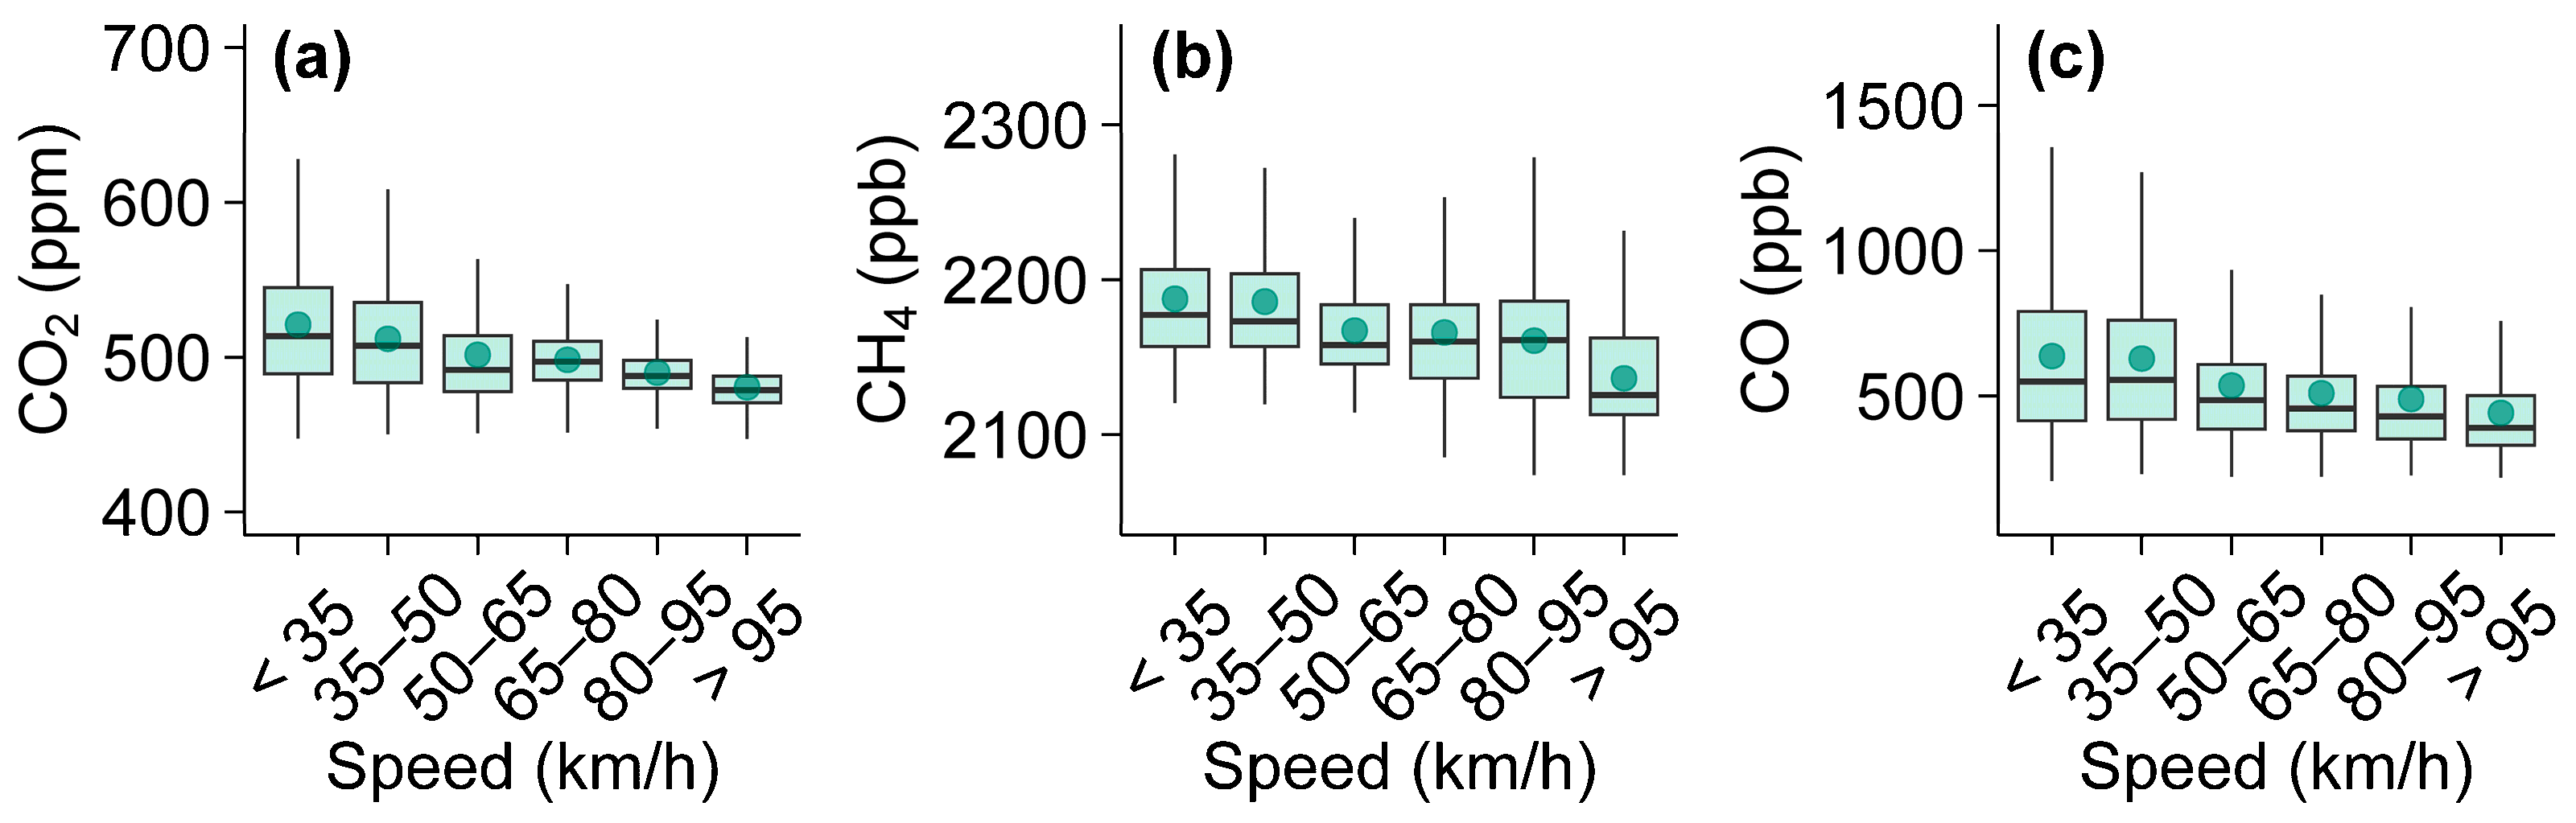
Elevated CO2 concentrations were primarily observed in the northwest segment of the 1st Ring Road, the northeast 2nd Ring Road, and the southern Ring Expressway, whereas comparatively lower concentrations were detected in the northern 1st Ring Road, northwest 2nd Ring Road, and the southwest Ring Expressway (Figure 3a). In this study, these CO2 hotspots on ring roads correspond to bottlenecks, intersections, or merging zones where traffic slows down frequently. The CO2 hotspots generally coincided with locations where vehicle speeds were relatively low (Figure 3d), which was attributed to high traffic volume. As shown in Figure 4a, CO2 concentrations decreased from 538 ppm to 480 ppm with increasing vehicle driving speed from <35 km h−1 to >95 km h−1. CO concentrations also decreased as vehicle speed increased (Figure 4c). At low speeds, traffic congestion and frequent idling lead to higher cumulative emissions due to inefficient combustion and greater fuel consumption per distance.
Figure 3.
Spatial patterns of the concentrations of CO2 (a), CH4 (b), and CO (c), as well as vehicle driving speed (d), measured on the 1st Ring Road, 2nd Ring Road, and Ring Expressway in Xi’an. The driving speed was affected by the real-time traffic volume.
Figure 4.
Concentrations of CO2 (a), CH4 (b), and CO (c) as a function of vehicle speed measured on the 1st Ring Road, 2nd Ring Road, and Ring Expressway in Xi’an. In panels (a–c), the filled circle within each box indicates the mean, the box denotes the interquartile range with the box center line representing the median.
Overall, the observed spatial pattern of CO2 hotspots—strongly correlated with low vehicle speeds and high traffic volumes—demonstrates that urban road traffic, particularly in congested zones, is the dominant source of CO2 emissions in urban areas. This highlights the urgent need for targeted interventions such as congestion reduction.
3.2. Spatial Distribution of CH4
Similarly to CO2, the CH4 concentrations exhibit a clear decline with increasing distance from the city center, with mean CH4 concentrations of 2230 ± 129, 2191 ± 208, and 2150 ± 48 ppb on the 1st Ring Road, 2nd Ring Road, and Ring Expressway, respectively, all of which are higher than the urban background levels of 2086 ppb measured at IEECAS (all p values < 0.05). This spatial gradient suggests that CH4 emissions are more concentrated in the dense urban core, where traffic volumes, fuel combustion, and possibly leakage from natural gas distribution systems are higher. However, unlike CO2, the lowest 5th percentile concentrations (P5) for CH4, representing the lowest observed values and approximating background levels, were not uniform across the three ring roads. Instead, P5 concentrations for CH4 showed a decreasing trend with the distance from the city center (2151 ppb, 2135 ppb, and 2088 ppb, respectively). While CO2 shows relatively consistent P5 concentrations due to a well-mixed and spatially uniform urban background, CH4 exhibits a clear gradient even in its lower tail. This indicates that even the lowest CH4 concentrations along the driving routes are influenced by spatially heterogeneous off-road sources. Inner-city areas along the 1st and 2nd ring roads contain more natural gas leaks, sewage pipelines, or waste management, all of which elevate background CH4 levels. As the monitoring route moves outwards towards areas with fewer such sources, the background CH4 concentrations decrease accordingly. The spatially varying P5 concentrations for CH4, in contrast to the uniform P5 concentrations for CO2 across the three ring roads, provide strong evidence that CH4 emissions in Xi’an arise from a more diverse and spatially distributed source mix than the predominantly combustion-driven CO2 emissions.
Figure 3b shows the pronounced spatial variability of CH4 concentrations. Notably, the hotspots of CH4 were different from those of CO2, suggesting that the two gases originate from distinct sources on urban roads. Higher CH4 levels were mainly found along the northwest and east segments of 1st Ring Road, the southwest 2nd Ring Road, and the northwest Ring Expressway. Unlike CO2 concentrations that show a clear decreasing trend with increasing vehicle driving speed, CH4 concentrations show only a slight decreasing trend with speed (Figure 4b). For CH4, the weak speed dependence suggests that road traffic is a smaller contributor to on-road CH4 levels. Possible explanations for these CH4 hotspots include nearby livestock farms, natural gas leaks, and/or bacterial anaerobic emissions from sewage pipelines and landfills, whose emissions are not directly related to traffic activity. For example, the northwest Ring Expressway is situated near several livestock farms, including Junsheng Livestock Farm (Shaanxi Province), and emissions from these could potentially contribute to CH4 hotspots along this segment. In contrast, the CH4 hotspots observed on the 1st and 2nd Ring Roads are less likely to be influenced by livestock, due to the scarcity of livestock farms within the urban core. Instead, these patterns may be consistent with CH4 contributions from the anaerobic processes in sewage pipelines, natural gas leakage from pipelines, domestic gas use, and/or the moat surrounding the ancient wall. Nevertheless, additional measurements, including target leak surveys and tracer-based analyses, would be required to conclusively identify the dominant CH4 sources responsible for the hotspots on each ring road.
In summary, similar to CO2, the observed CH4 concentrations on three ring roads declined with increasing distance from the city center, indicating stronger CH4 emission sources in the urban core. Spatial variability in CH4 was pronounced, with hotspots distinct from those of CO2, reflecting different sources. While CO2 emissions were strongly linked to driving speed, CH4 showed only a weak speed dependence, implying off-road sources (e.g., nearby livestock farms, natural gas leaks) besides on-road source contributions.
3.3. CO2 and CH4 in Road Tunnels
Road tunnels provide suitable environments for measuring vehicle emissions, as they represent confined spaces with minimal influence from non-traffic sources [29,30,31]. The Wenchangmen–Hepingmen Tunnel, the longest tunnel (~0.9 km) on the 1st Ring Road in Xi’an, was selected for mobile measurements of CO2 and CH4 concentrations under different traffic conditions: traffic-congested conditions (west–east direction; driving speed of 10–20 km h−1) and smooth-flowing traffic (east–west direction; driving speed of 60–80 km h−1). As expected, the average concentrations of CO2 and CH4 in the tunnel were higher under traffic-congested conditions (922 ± 183 ppm and 2245 ± 32 ppb, respectively) than during smooth-flowing traffic (646 ± 14 ppm and 2206 ± 20 ppb, respectively).
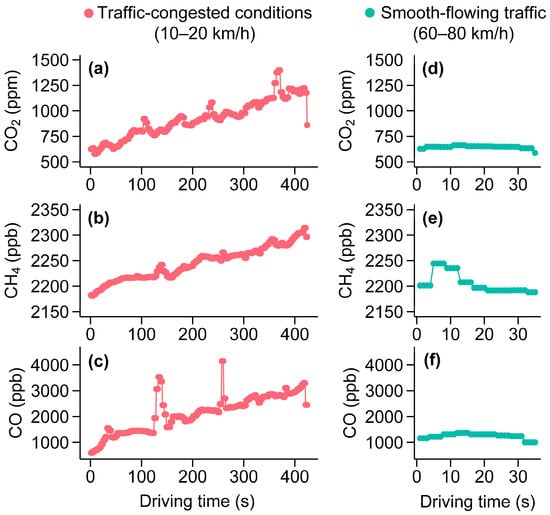
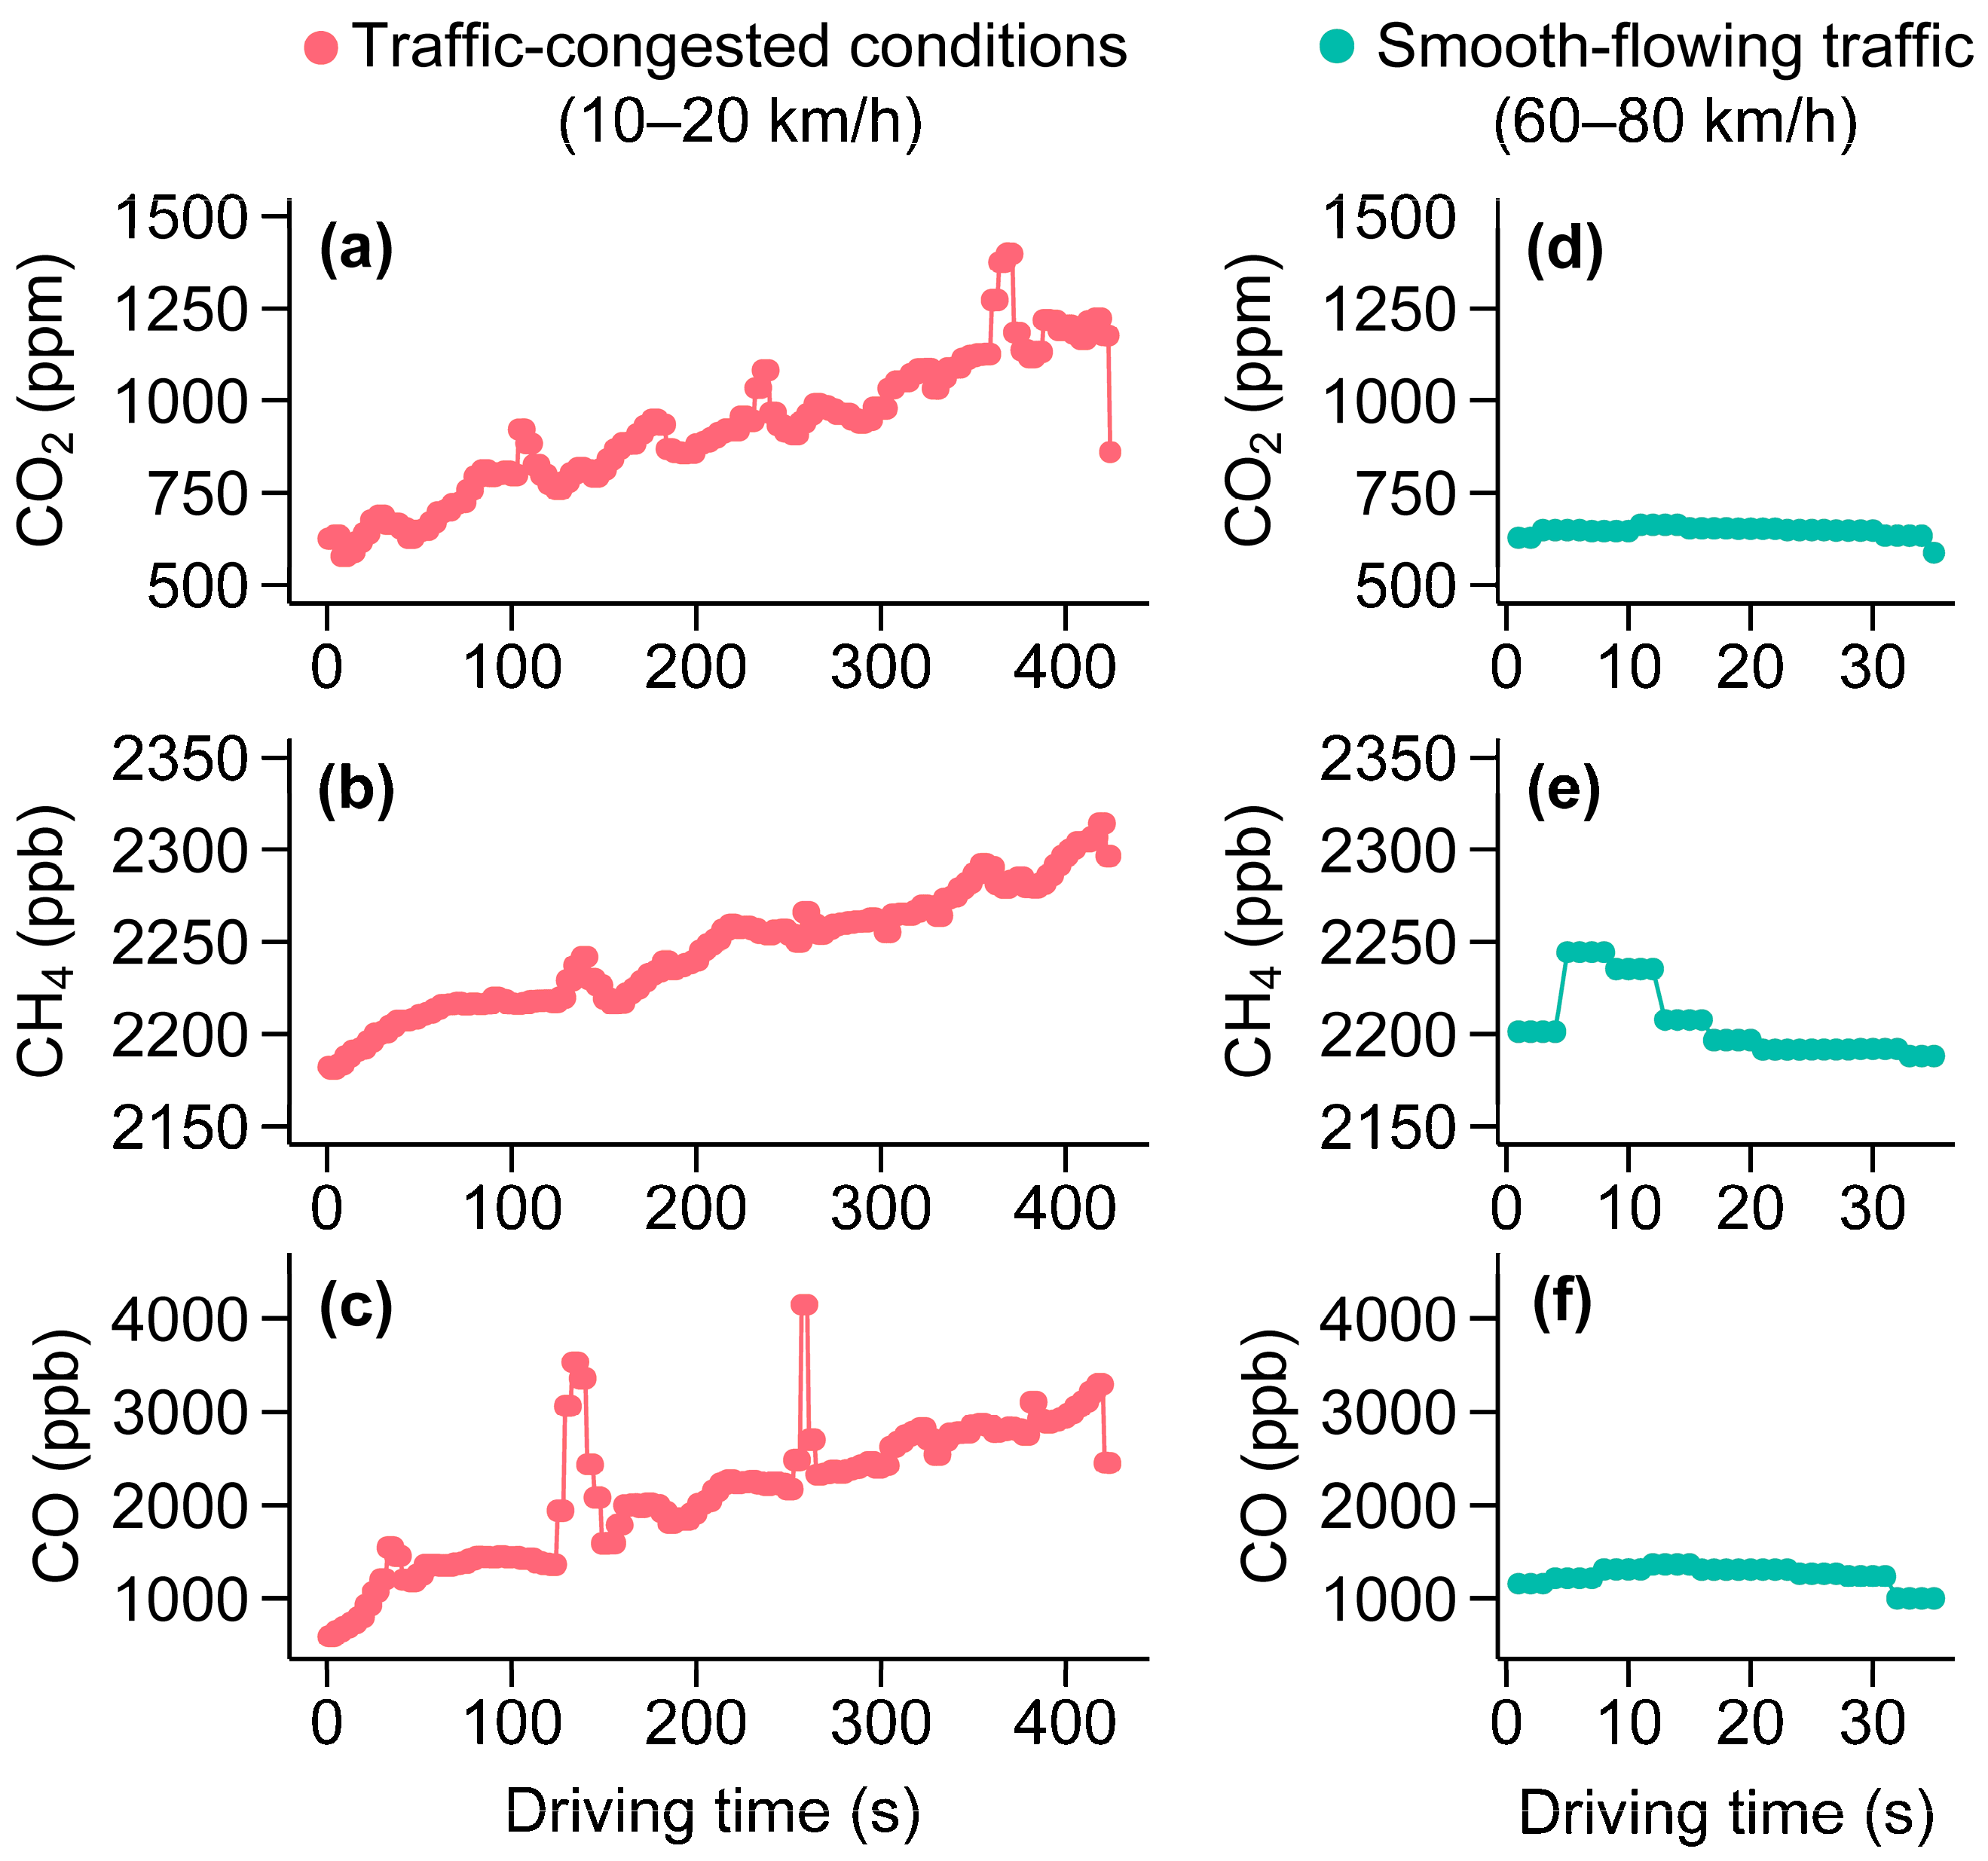
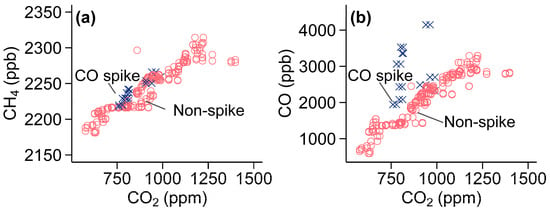
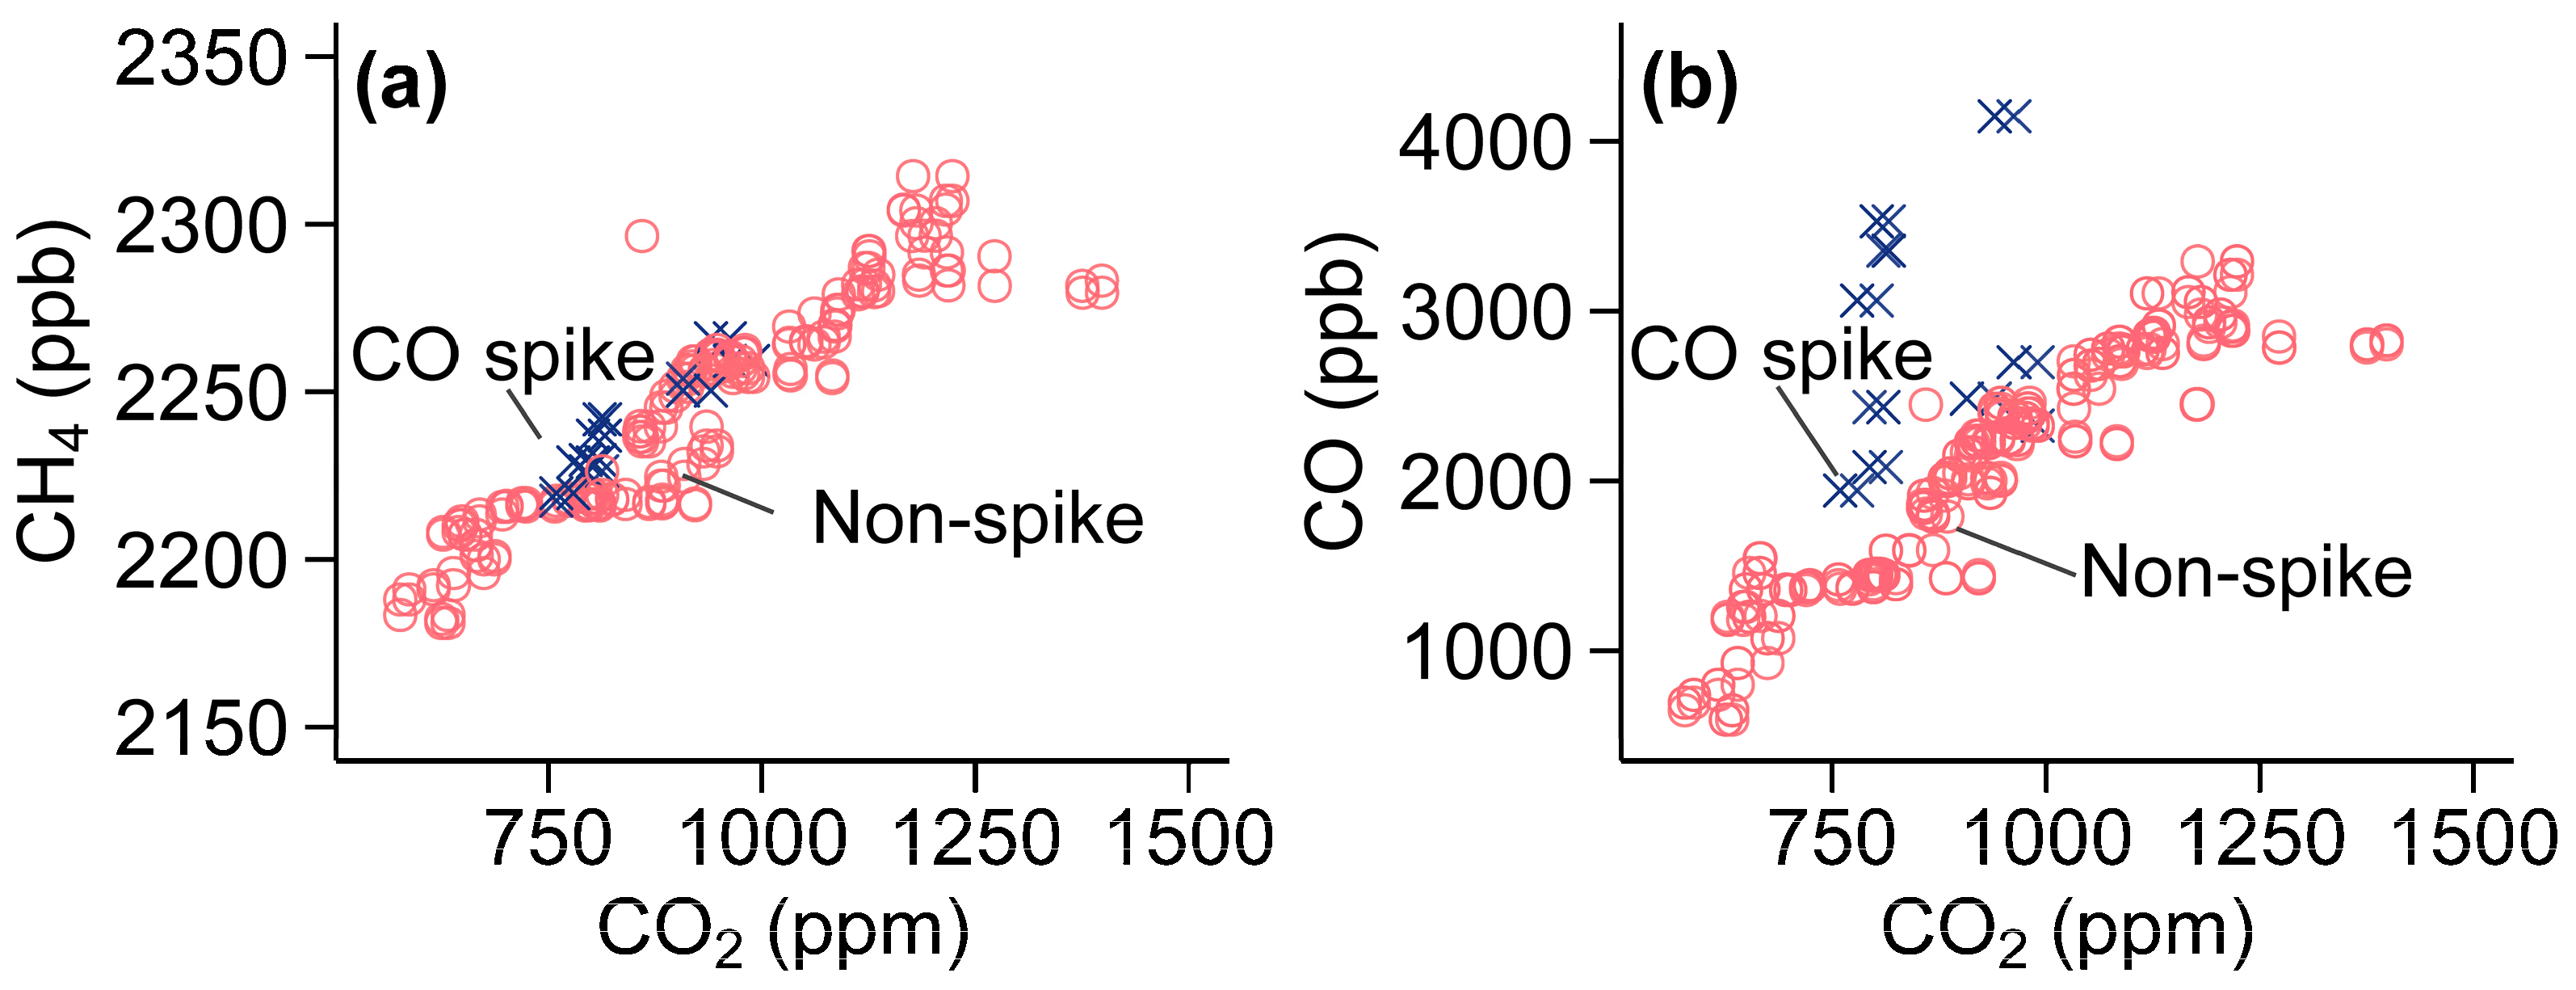
Figure 5 presents concentrations of CO2 and CH4 as a function of driving time from the tunnel entrance under the two conditions. Traffic-congested conditions led to a dramatic build-up of vehicular CO2 and CH4 in the tunnel. CO2 concentrations increased from approximately 600 ppm at the entrance to over 1300 ppm at the exit, while CH4 increased from ~2180 ppb to ~2320 ppb. In contrast, during smooth-flowing traffic, both CO2 and CH4 concentrations remained relatively stable, fluctuating around 630–660 ppm (CO2) and 2200–2250 ppb (CH4) before declining slightly at the exit, showing that emissions were effectively diluted and dispersed during smooth-flowing traffic. CO, the typical incomplete combustion product, exhibited similar variable patterns to CO2 and CH4 under both congested and smooth-flowing traffic conditions. Traffic congestion reduces vehicle speeds, leading to more vehicles idling in the tunnel, where emissions from engine combustion (CO2, CO, CH4) and evaporative losses of unburned CH4 can accumulate due to limited ventilation. In Figure 5c, two pronounced CO spikes were observed at approximately 125 s and 253 s. During the CO spikes, CO concentrations increased more substantially than CO2, as evidenced by the larger CO/CO2 ratios in Figure 6b, while the CH4/CO2 ratio remained nearly unchanged (Figure 6a). This pattern indicates that the spikes were caused by vehicles emitting abnormally high CO relative to CO2, without a corresponding increase in CH4, such as old gasoline vehicles passing by or vehicles with malfunctioning catalytic converters passing by, both of which emit high CO relative to CO2 without a corresponding increase in CH4. Such vehicles typically exhibit reduced CO oxidation efficiency and consequently release large amounts of CO [32,33]. In contrast, CH4 emissions from gasoline vehicles are intrinsically low and largely insensitive to catalyst performance. As a result, short-term exhaust plumes dominated by high-CO vehicles appear as strong CO enhancements without corresponding increases in CH4.
Figure 5.
Changes in CO2, CH4, and CO concentrations from the entrance to the exit in the Wenchangmen–Hepingmen Tunnel under two different traffic conditions: traffic-congested conditions (a–c) and smooth-flowing traffic (d–f).
Figure 6.
CO spike and non-spike illustrated in CH4 vs. CO2 (a) and CO vs. CO2 (b) plots for the Wenchangmen–Hepingmen Tunnel under traffic-congested conditions. The corresponding time series of CO2, CH4, and CO concentrations are shown in Figure 5a–c, with the CO spikes illustrated here corresponding to the spikes that can be clearly seen in Figure 5c.
Taken together, the significant increase in CO2 and CH4 concentrations during traffic-congested conditions, compared to their relatively stable levels during smooth-flowing conditions, demonstrates a direct and strong correlation between traffic congestion and the accumulation of vehicular greenhouse gas emissions in a tunnel. Our results underscore the importance of reducing traffic congestion as a key component of urban carbon neutrality strategies. Measures aimed at improving traffic flow, optimizing signal coordination, and reducing urban bottlenecks could therefore contribute directly to lowering short-term urban GHG peaks.
3.4. CH4/CO2 and CO/CO2 Ratios in Road Tunnels
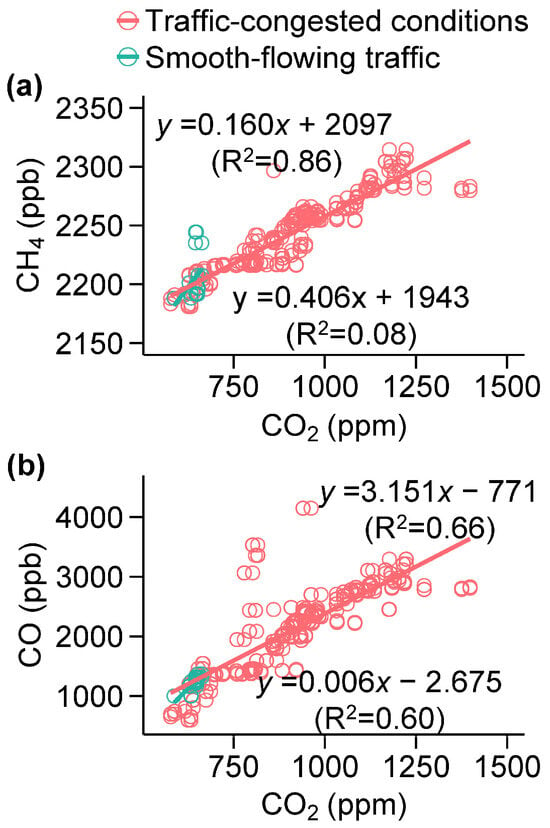
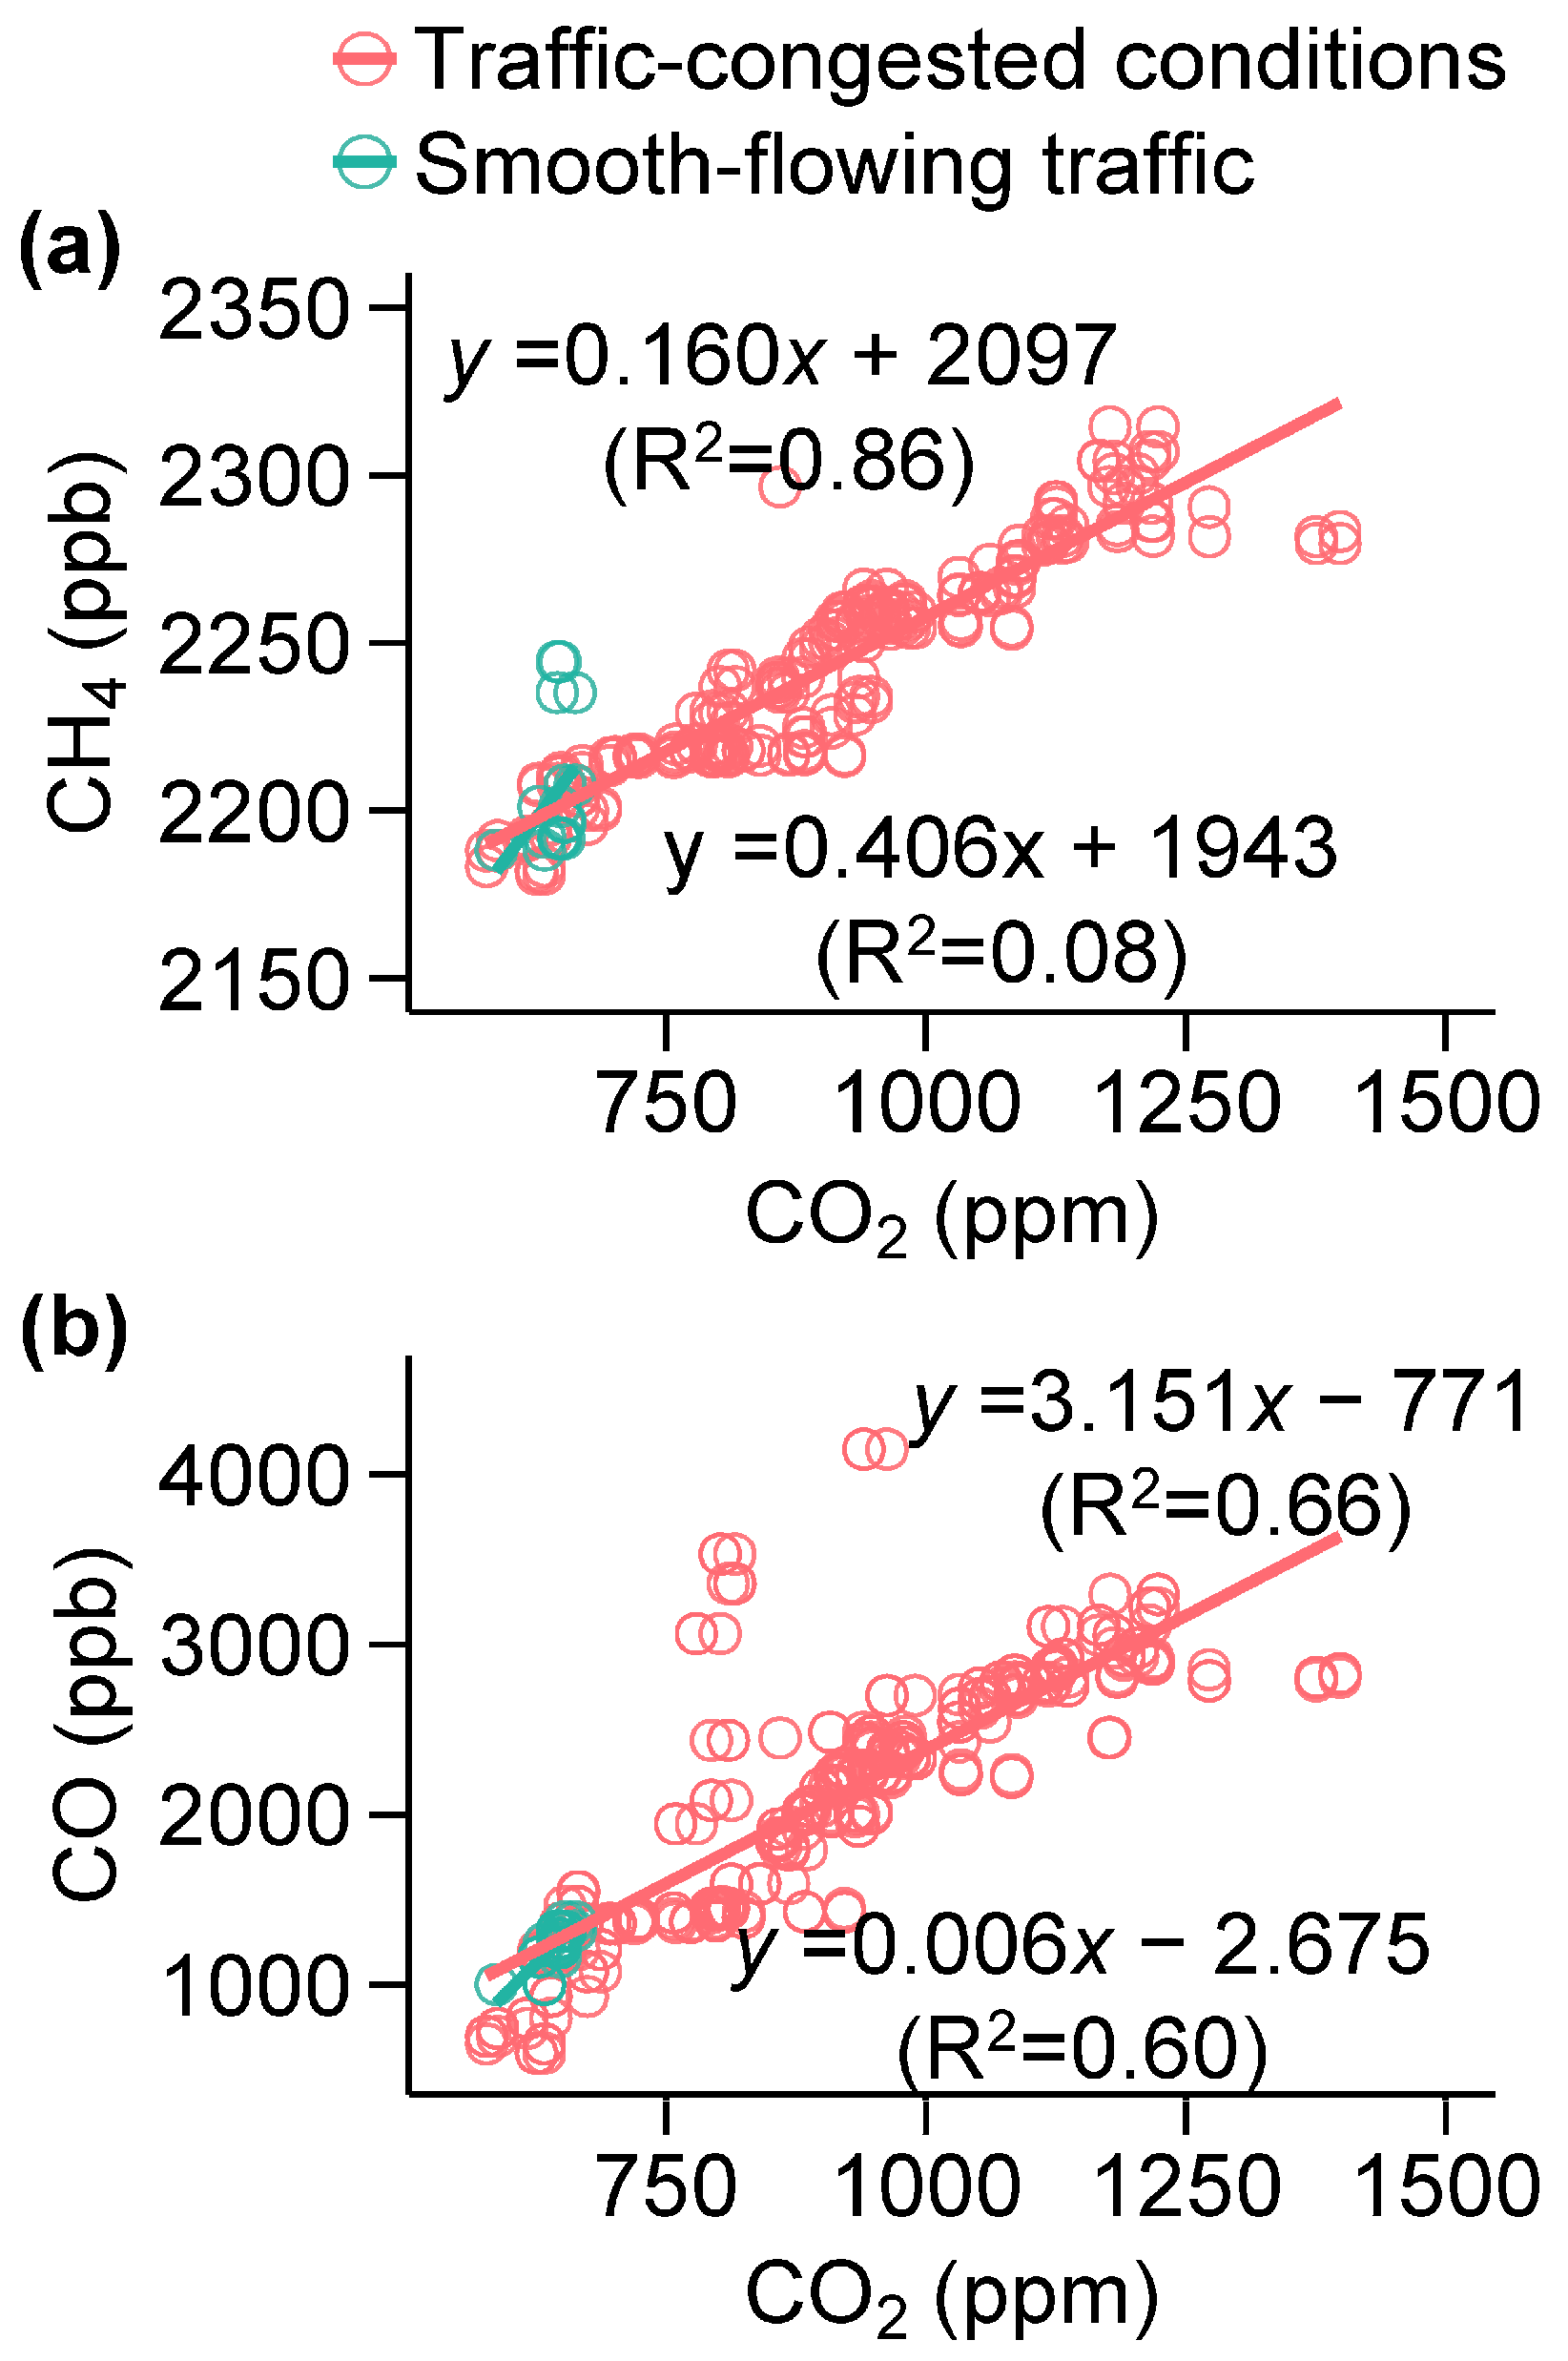
Figure 7 shows the relationships between CO2 and CH4, and between CO2 and CO under traffic-congested and smooth-flowing conditions in the Wenchangmen–Hepingmen Tunnel. Under congested conditions, both CH4 and CO exhibited strong positive correlations with CO2 (R2 = 0.86 and 0.66, respectively), directly reflecting that these pollutants were co-emitted from vehicular exhaust under inefficient combustion. More specifically, the linear regression effectively captures the co-variation between pollutants that originate from vehicles; therefore, the slope of the regression line between CH4, and CO2 (∆CH4/∆CO2 = 0.160 ppb ppm−1), or between CO and CO2 (∆CO/∆CO2 = 3.151 ppb ppm−1) in the tunnel can approximate their respective emission ratios, reflecting incomplete combustion processes typical of idling and stop-and-go traffic. In contrast, under smooth-flowing traffic, with improved combustion efficiency and better ventilation within the tunnel, the simple co-variations among these pollutants were broken; the correlations were weaker (R2 = 0.08 for CH4 and 0.60 for CO with CO2), and the observed slopes are either not significant (low R2) or not physically meaningful due to limited datapoints. In short summary, the tunnel case study shows that both CH4 and CO exhibited strong correlations with CO2 under congested conditions. The resulting regression slopes represent real-world emission ratios (ΔCH4/ΔCO2 = 0.160 ppb ppm−1 and ΔCO/ΔCO2 = 3.151 ppb ppm−1) characteristic of incomplete combustion in a gasoline-dominated vehicle fleet. These derived emission ratios provide valuable observational constraints for improving urban emission inventories and can be incorporated into bottom-up traffic emission models to better represent the effects of congestion on real-world emissions. Moreover, because the emission ratios reflect on-road emissions under congestion, they offer a quantitative basis for assessing the effectiveness of traffic management strategies (such as congestion mitigation, dynamic speed control, or tunnel ventilation improvements) in reducing on-road pollution emissions.
Figure 7.
CH4 vs. CO2 concentrations (a), and CO vs. CO2 concentrations (b) in the Wenchangmen–Hepingmen Tunnel under two different traffic conditions: traffic-congested conditions and smooth-flowing traffic.
Compared with earlier observations in tunnels, ∆CH4/∆CO2 ratios in this study under traffic-congested conditions (0.160 ppb ppm−1) were comparable to those reported for the Yan’an E. Rd. Tunnel (0.144 ppb ppm−1) and Shangzhong Road Tunnel (0.152 ppb ppm−1) measured in 2017 in Shanghai, China [18]. Similarly to our findings, these tunnels also observed concurrent variations of CH4 and CO2, supporting co-emission processes from traffic. The consistent ∆CH4/∆CO2 ratios across these tunnels suggest similar emission characteristics and fuel compositions, and can be used as a representative ratio to estimate traffic emissions of CH4, mainly representing congested traffic dominated by gasoline vehicles. These ratios are lower than those recommended for the U.S. on-road vehicle fleet (0.409 ± 0.109 ppb ppm−1) [34], mainly due to differences in vehicle fleet composition, as the latter includes gasoline-, diesel-, and natural gas-powered vehicles.
For CO, few studies have evaluated ∆CO/∆CO2 ratios in tunnels in China and elsewhere. Our ∆CO/∆CO2 ratios for vehicle emissions (3.151 ppb ppm−1) are generally lower than those reported in previous studies conducted between 2004 and 2012 in Switzerland, the USA, and France (4.15–9.3 ppb ppm−1) [30,35,36,37]. This decline likely reflects technological advancements over the past two decades, particularly the widespread adoption of catalytic converters that effectively oxidize CO to CO2. Our ∆CO/∆CO2 ratios are representative of gasoline-dominated traffic under congested conditions. Under smooth-flowing traffic, the ∆CO/∆CO2 ratios are expected to decrease due to more efficient combustion and lower CO emissions relative to CO2. Overall, these comparisons suggest that the observed emission ratios are influenced by vehicle fleet composition, driving behavior, congestion level, fuel type, and emission control technologies such as catalytic converters, underscoring the need for continued monitoring to capture evolving emission characteristics under real-world traffic conditions and to support more accurate, region-specific emission inventories.
4. Conclusions
Although the contribution of vehicular CO2 and CH4 to climate change is well recognized, their spatial distribution and influencing factors within urban road networks are not well understood. In this study, in situ mobile measurements along Xi’an’s 1st Ring Road (15 km), 2nd Ring Road (34 km), and Ring Expressway (88 km) revealed distinct spatial gradients and emission characteristics for CO2 and CH4. Both gases decreased with increasing distance from the city center, and lower concentrations on the Expressway were associated with higher driving speeds (90 km h−1 vs. 22 km h−1 on the 1st and 2nd Ring Roads), reduced traffic density, and improved combustion efficiency. More specifically, both CO2 and CH4 concentrations exhibited a negative dependence on vehicle speed, decreasing as driving speed increased; however, the dependence was weaker for CH4. Moreover, CH4 hotspots were spatially distinct from those of CO2 across the three ring roads. Taken together, these patterns suggest the presence of additional off-road or near-road CH4 sources (such as natural gas leaks or livestock activities) beyond vehicular emissions. A tunnel case study revealed pronounced CO2 and CH4 buildup under congested traffic conditions compared to smooth conditions, highlighting the effects of inefficient combustion and poor ventilation. Strong correlations between CH4 and CO2 (R2 = 0.86) and between CO and CO2 (R2 = 0.66) under traffic-congested conditions yielded emission ratios (ΔCH4/ΔCO2 = 0.160 ppb ppm−1 and ΔCO/ΔCO2 = 3.151 ppb ppm−1) characteristic of incomplete combustion in a gasoline-vehicle-dominated fleet.
We note, however, that all measurements were conducted on a single day. As such, meteorological variability, day-to-day fluctuations in traffic conditions, and temporal changes in off-road CH4 sources could influence the observed patterns. Therefore, while our results provide a valuable snapshot of urban greenhouse gas behavior under the conditions sampled, longer-term and multi-day measurements are necessary to assess the temporal robustness and generality of these spatial gradients and source characteristics. Nevertheless, further monitoring is needed to account for fleet composition and driving conditions, which can also influence emission ratios. Our findings provide direct observational evidence linking urban traffic dynamics to greenhouse gas accumulation and highlight the need for congestion mitigation and improved fuel efficiency as effective strategies to reduce transportation-related climate impacts.
Author Contributions
Conceptualization, F.W., H.N. and C.W.; methodology, C.W., H.N., Z.M. and Y.C.; validation, S.W., W.C., J.T., C.Z. and C.W.; investigation, J.Z., X.Z., Q.L. and N.C.; resources, Y.C. and C.W.; data curation, Y.Z., J.T. and C.W.; writing—original draft preparation, F.W., H.N. and C.W.; writing—review and editing, F.W., J.W., H.N. and C.W.; visualization, J.W. and J.T.; project administration, H.N. and C.W.; funding acquisition, F.W., J.Z., Y.C. and C.W. All authors have read and agreed to the published version of the manuscript.
Funding
The authors acknowledge the project grants from Shaanxi 2023 Transportation Research Project (grant No. 23-65R), the Youth Innovation Promotion Association of the Chinese Academy of Sciences (No. 2022416), the Natural Science Basic Research Program of Shaanxi (No. 2024JC-YBQN-0328), the Key Research and Development Projects of Shaanxi Province (No. 2025SF-YBXM-520), the National Natural Science Foundation of China (No. 42503062), the Science and Technology Commission of Shanghai Municipality (No. 24ZR1474200), the Open Fund of State Key Laboratory of Loess Science (No. SKLLQG2327), Shaanxi Key Laboratory of Carbon Dioxide Sequestration and Enhanced Oil Recovery (No. YJSYZX25SKF0020) and Key Laboratory of Groundwater Resources and Environment (Jilin University), Ministry of Education (202506ZDKF14).
Institutional Review Board Statement
Not applicable.
Informed Consent Statement
Not applicable.
Data Availability Statement
The original contributions presented in this study are included in the article. Further inquiries can be directed to the corresponding authors.
Acknowledgments
We thank the support of the instrument from Centry Chaoyang Technology from Beijing (Cen-Sun), China.
Conflicts of Interest
Authors affiliated with Shaanxi Transportation Holding Green Development Group Co., Ltd. and Research Institute of Yanchang Petroleum Co., Ltd. are employees of these companies. The companies had no role in the design of the study; in the collection, analyses, or interpretation of data; in the writing of the manuscript; or in the decision to publish the results. The authors declare no other conflicts of interest.
Abbreviations
The following abbreviations are used in this manuscript:
| CO2 | Carbon dioxide |
| CH4 | Methane |
| CO | Carbon monoxide |
| GHGs | Greenhouse gases |
| CRDS | Cavity ring-down spectrometer |
References
- Crippa, M.; Guizzardi, D.; Pisoni, E.; Solazzo, E.; Guion, A.; Muntean, M.; Florczyk, A.; Schiavina, M.; Melchiorri, M.; Hutfilter, A.F. Global anthropogenic emissions in urban areas: Patterns, trends, and challenges. Environ. Res. Lett. 2021, 16, 074033. [Google Scholar] [CrossRef] [Scilit]
- Friedlingstein, P.; O’Sullivan, M.; Jones, M.W.; Andrew, R.M.; Gregor, L.; Hauck, J.; Le Quéré, C.; Luijkx, I.T.; Olsen, A.; Peters, G.P.; et al. Global carbon budget 2022. Earth Syst. Sci. Data 2022, 14, 4811–4900. [Google Scholar] [CrossRef] [Scilit]
- Seto, K.C.; Dhakal, S.; Bigio, A.; Blanco, H.; Delgado, G.C.; Dewar, D.; Huang, L.; Inaba, A.; Kansal, A.; Lwasa, S.; et al. Human Settlements, Infrastructure and Spatial Planning. In Climate Change 2014: Mitigation of Climate Change; Contribution of Working Group III to the Fifth Assessment Report of the Intergovernmental Panel on Climate Change; Edenhofer, O., Pichs-Madruga, R., Sokona, Y., Farahani, E., Kadner, S., Seyboth, K., Adler, A., Baum, I., Brunner, S., Eickemeier, P., et al., Eds.; Cambridge University Press: Cambridge, UK; New York, NY, USA, 2014. [Google Scholar]
- Gurney, K.R.; Liang, J.; Patarasuk, R.; Song, Y.; Huang, J.; Roest, G. The Vulcan Version 3.0 High-resolution fossil fuel CO2 emissions for the United States. J. Geophys. Res. Atmos. 2020, 125, e2020JD032974. [Google Scholar] [CrossRef] [Scilit]
- Li, S.; Wang, S.; Wu, Q.; Zhang, Y.; Ouyang, D.; Zheng, H.; Han, L.; Qiu, X.; Wen, Y.; Liu, M.; et al. Emission trends of air pollutants and CO2 in China from 2005 to 2021. Earth Syst. Sci. Data 2023, 15, 2279–2294. [Google Scholar] [CrossRef] [Scilit]
- Akbari, A.; Sarvi, H.; Maleki, M.; Bahreyni, S.; Azimi, R.; Radpour, A. Characteristics, emissions, capture, storage, and utilization of carbon dioxide: A comprehensive review of challenges and technologies for greenhouse gas mitigation. Pet. Res. 2025; in press.
- Wei, C.; Wang, M.; Fu, Q.; Dai, C.; Huang, R.; Bao, Q. Temporal characteristics of greenhouse gases (CO2 and CH4) in the megacity Shanghai, China: Association with air pollutants and meteorological conditions. Atmos. Res. 2020, 235, 104759. [Google Scholar] [CrossRef] [Scilit]
- Huang, X.; Wang, T.; Talbot, R.; Xie, M.; Mao, H.; Li, S.; Zhuang, B.; Yang, X.; Fu, C.; Zhu, J.; et al. Temporal characteristics of atmospheric CO2 in urban Nanjing, China. Atmos. Res. 2015, 153, 437–450. [Google Scholar] [CrossRef] [Scilit]
- Le Quéré, C.; Raupach, M.R.; Canadell, J.G.; Marland, G.; Bopp, L.; Ciais, P.; Conway, T.J.; Doney, S.C.; Feely, R.A.; Foster, P.; et al. Trends in the sources and sinks of carbon dioxide. Nat. Geosci. 2009, 2, 831–836. [Google Scholar] [CrossRef] [Scilit]
- Tiemoko, T.D.; Ramonet, M.; Yoroba, F.; Kouassi, K.B.; Kouadio, K.; Kazan, V.; Kaiser, C.; Truong, F.; Vuillemin, C.; Delmotte, M.; et al. Analysis of the temporal variability of CO2, CH4 and CO concentrations at Lamto, West Africa. Tellus B Chem. Phys. Meteorol. 2021, 73, 1863707. [Google Scholar] [CrossRef] [Scilit]
- Solazzo, E.; Crippa, M.; Guizzardi, D.; Muntean, M.; Choulga, M.; Janssens-Maenhout, G. Uncertainties in the Emissions Database for Global Atmospheric Research (EDGAR) emission inventory of greenhouse gases. Atmos. Chem. Phys. 2021, 21, 5655–5683. [Google Scholar] [CrossRef] [Scilit]
- Newman, S.; Xu, X.; Gurney, K.R.; Hsu, Y.K.; Li, K.F.; Jiang, X.; Keeling, R.; Feng, S.; O’Keefe, D.; Patarasuk, R.; et al. Toward consistency between trends in bottom-up CO2 emissions and top-down atmospheric measurements in the Los Angeles megacity. Atmos. Chem. Phys. 2016, 16, 3843–3863. [Google Scholar] [CrossRef] [Scilit]
- Chen, J.; Cui, P.; Zhou, C.; Yu, X.; Wu, H.; Jia, L.; Zhou, M.; Zhang, H.; Teng, G.; Cheng, S.; et al. Detection of CO2 and CH4 concentrations on a Beijing urban road using vehicle-mounted tunable diode laser absorption spectroscopy. Photonics 2023, 10, 938. [Google Scholar] [CrossRef] [Scilit]
- Kolb, C.E.; Herndon, S.C.; McManus, J.B.; Shorter, J.H.; Zahniser, M.S.; Nelson, D.D.; Jayne, J.T.; Canagaratna, M.R.; Worsnop, D.R. Mobile laboratory with rapid response instruments for real-time measurements of urban and regional trace gas and particulate distributions and emission source characteristics. Environ. Sci. Technol. 2004, 38, 5694–5703. [Google Scholar] [CrossRef] [Scilit]
- Lee, J.K.; Christen, A.; Ketler, R.; Nesic, Z. A mobile sensor network to map carbon dioxide emissions in urban environments. Atmos. Meas. Technol. 2017, 10, 645–665. [Google Scholar] [CrossRef] [Scilit]
- Park, C.; Jeong, S.; Kim, C.; Shin, J.; Joo, J. Machine learning based estimation of urban on-road CO2 concentration in Seoul. Environ. Res. 2023, 231, 116256. [Google Scholar] [CrossRef] [Scilit] [PubMed]
- Sun, D.; Zhang, Y.; Xue, R.; Zhang, Y. Modeling carbon emissions from urban traffic system using mobile monitoring. Sci. Total Environ. 2017, 599–600, 944–951. [Google Scholar] [CrossRef] [Scilit] [PubMed]
- Wei, C.; Wang, M. Spatial distribution of greenhouse gases (CO2 and CH4) on expressways in the megacity Shanghai, China. Environ. Sci. Pollut. Res. 2020, 27, 31143–31152. [Google Scholar] [CrossRef] [Scilit]
- Ueyama, M.; Umezawa, T.; Terao, Y.; Lunt, M.; France, J.L. Evaluating urban methane emissions and their attributes in a megacity, Osaka, Japan, via mobile and eddy covariance measurements. Atmos. Chem. Phys. 2025, 25, 12513–12534. [Google Scholar] [CrossRef] [Scilit]
- Sun, W.; Deng, L.; Wu, G.; Wu, L.; Han, P.; Miao, Y.; Yao, B. Atmospheric monitoring of methane in Beijing using a mobile observatory. Atmosphere 2019, 10, 554. [Google Scholar] [CrossRef] [Scilit]
- Saunois, M.; Martinez, A.; Poulter, B.; Zhang, Z.; Raymond, P.A.; Regnier, P.; Canadell, J.G.; Jackson, R.B.; Patra, P.K.; Bousquet, P.; et al. Global methane budget 2000–2020. Earth Syst. Sci. Data 2025, 17, 1873–1958. [Google Scholar] [CrossRef] [Scilit]
- Saunois, M.; Stavert, A.R.; Poulter, B.; Bousquet, P.; Canadell, J.G.; Jackson, R.B.; Raymond, P.A.; Dlugokencky, E.J.; Houweling, S.; Patra, P.K.; et al. The global methane budget 2000–2017. Earth Syst. Sci. Data 2020, 12, 1561–1623. [Google Scholar] [CrossRef] [Scilit]
- Kirschke, S.; Bousquet, P.; Ciais, P.; Saunois, M.; Canadell, J.G.; Dlugokencky, E.J.; Bergamaschi, P.; Bergmann, D.; Blake, D.R.; Bruhwiler, L.; et al. Three decades of global methane sources and sinks. Nat. Geosci. 2013, 6, 813–823. [Google Scholar] [CrossRef] [Scilit]
- Takano, T.; Ueyama, M. Spatial variations in daytime methane and carbon dioxide emissions in two urban landscapes, Sakai, Japan. Urban Clim. 2021, 36, 100798. [Google Scholar] [CrossRef] [Scilit]
- Bo, Y.n.; Zhang, L.; Zhong, J.; Zhong, W.; Zhu, P. Bottom-up analysis for carbon emissions from passenger and freight transport sectors in Xi’an: A city-level study using MOVES and LMDI models. Environ. Res. Commun. 2025, 7, 025010. [Google Scholar] [CrossRef] [Scilit]
- Gao, W.; He, W.; Zhang, J.; Chen, Y.; Wei, Z. County-level carbon emissions in the guanzhong area of Shaanxi province: Towards achieving China’s dual carbon goals. Front. Environ. Sci. 2024, 12, 1447728. [Google Scholar] [CrossRef] [Scilit]
- Liu, Z.; Han, L.; Liu, M. High-resolution carbon emission mapping and spatial-temporal analysis based on multi-source geographic data: A case study in Xi’an City, China. Environ. Pollut. 2024, 361, 124879. [Google Scholar] [CrossRef] [Scilit]
- Liu, W.; Niu, Z.; Feng, X.; Zhou, W.; Liang, D.; Lyu, M.; Wang, G.; Lu, X.; Liu, L.; Turnbull, J.C. Atmospheric CO2 and 14CO2 observations at the northern foot of the Qinling Mountains in China: Temporal characteristics and source quantification. Sci. Total Environ. 2024, 920, 170682. [Google Scholar] [CrossRef] [Scilit]
- Wang, X.; Ho, K.-F.; Chow, J.C.; Kohl, S.D.; Chan, C.S.; Cui, L.; Lee, S.-c.F.; Chen, L.-W.A.; Ho, S.S.H.; Cheng, Y.; et al. Hong Kong vehicle emission changes from 2003 to 2015 in the Shing Mun Tunnel. Aerosol Sci. Technol. 2018, 52, 1085–1098. [Google Scholar] [CrossRef] [Scilit]
- Popa, M.E.; Vollmer, M.K.; Jordan, A.; Brand, W.A.; Pathirana, S.L.; Rothe, M.; Röckmann, T. Vehicle emissions of greenhouse gases and related tracers from a tunnel study: CO : CO : CO2, N2O : CO2, CH4 : CO2, O2 : CO2 ratios, and the stable isotopes 13C and 18O in CO2 and CO. Atmos. Chem. Phys. 2014, 14, 2105–2123. [Google Scholar] [CrossRef] [Scilit]
- Marinello, S.; Lolli, F.; Gamberini, R. Roadway tunnels: A critical review of air pollutant concentrations and vehicular emissions. Transp. Res. D Transp. Environ. 2020, 86, 102478. [Google Scholar] [CrossRef] [Scilit]
- Zhan, T.; Ruehl, C.R.; Bishop, G.A.; Hosseini, S.; Collins, J.F.; Yoon, S.; Herner, J.D. An analysis of real-world exhaust emission control deterioration in the California light-duty gasoline vehicle fleet. Atmos. Environ. 2020, 220, 117107. [Google Scholar] [CrossRef] [Scilit]
- Pielecha, J.; Pryciński, P. Deterioration of exhaust emissions in ageing gasoline vehicles assessed by RDE testing. Energies 2025, 18, 5822. [Google Scholar] [CrossRef] [Scilit]
- Nam, E.K.; Jensen, T.E.; Wallington, T.J. Methane emissions from vehicles. Environ. Sci. Technol. 2004, 38, 2005–2010. [Google Scholar] [CrossRef] [Scilit] [PubMed]
- Ammoura, L.; Xueref-Remy, I.; Gros, V.; Baudic, A.; Bonsang, B.; Petit, J.E.; Perrussel, O.; Bonnaire, N.; Sciare, J.; Chevallier, F. Atmospheric measurements of ratios between CO2 and co-emitted species from traffic: A tunnel study in the Paris megacity. Atmos. Chem. Phys. 2014, 14, 12871–12882. [Google Scholar] [CrossRef] [Scilit]
- Vollmer, M.K.; Juergens, N.; Steinbacher, M.; Reimann, S.; Weilenmann, M.; Buchmann, B. Road vehicle emissions of molecular hydrogen (H2) from a tunnel study. Atmos. Environ. 2007, 41, 8355–8369. [Google Scholar] [CrossRef] [Scilit]
- Bishop, G.A.; Stedman, D.H. A decade of on-road emissions measurements. Environ. Sci. Technol. 2008, 42, 1651–1656. [Google Scholar] [CrossRef] [Scilit] [PubMed]

Disclaimer/Publisher’s Note: The statements, opinions and data contained in all publications are solely those of the individual author(s) and contributor(s) and not of MDPI and/or the editor(s). MDPI and/or the editor(s) disclaim responsibility for any injury to people or property resulting from any ideas, methods, instructions or products referred to in the content. |
© 2025 by the authors. Licensee MDPI, Basel, Switzerland. This article is an open access article distributed under the terms and conditions of the Creative Commons Attribution (CC BY) license (https://creativecommons.org/licenses/by/4.0/).