Article

Black Carbon in Urban and Suburban Hangzhou: Spatiotemporal Variation, Precipitation Scavenging, and Policy Impacts

1
Zhejiang Lin’an Atmospheric Background National Observation and Research Station, Hangzhou 311300, China
2
Jiande Meteorological Bureau, Hangzhou 311699, China
*
Author to whom correspondence should be addressed.
Atmosphere 2025, 16(10), 1212; https://doi.org/10.3390/atmos16101212
Submission received: 11 August 2025 / Revised: 27 September 2025 / Accepted: 13 October 2025 / Published: 20 October 2025
(This article belongs to the Section Aerosols)

Abstract

Black carbon (BC) aerosols significantly impact regional air quality and global climate as important light-absorbing atmospheric particles. Using high-temporal resolution BC observation data from urban and suburban sites in Hangzhou and PM10 concentrations, this study analyzed the temporal and spatial distribution characteristics of BC concentrations, precipitation scavenging efficiency, and the efficacy of emission mitigation policies. The results showed that (1) suburban BC concentrations presented a significant interannual decline. Seasonal variation displayed a single peak, with high concentrations in winter and low concentrations in summer. A characteristic bimodal diurnal variation pattern was observed, with peaks during morning and evening rush hours. In terms of spatial distribution, the annual average concentration in urban areas was 20.7% higher than in suburban areas, with the largest difference in winter. (2) The scavenging efficiency of precipitation showed nonlinear characteristics. The average efficiency of light rain was the highest, whereas heavy rainfall showed more complex characteristics. The scavenging efficiency of continuous 12 h precipitation was significantly higher than that of short-term heavy rainfall. (3) Emission mitigation policy implementation had a marked effect, with diesel vehicle restrictions and biomass combustion control reducing BC concentrations by 11% and 19%, respectively.

1. Introduction

As important light-absorbing carbonaceous aerosols in the atmosphere, black carbon (BC) aerosols have become a core issue in the study of global climate change and regional air pollution [1,2]. Such particles not only change the radiation balance of the Earth through long-distance transmission but also directly penetrate the human alveolar barrier, leading to cardiovascular and respiratory diseases [3,4]. Research has revealed that the warming caused by BC has exceeded that of methane, becoming the second warming component in the world, second only to CO2 [1]. The BC concentration level of urban agglomerations in eastern China is generally 40–60% higher than that of developed countries in Europe and the United States [5]. Therefore, observations and research on BC concentration levels are increasingly important worldwide. Many studies have shown that BC concentrations exhibit significant temporal and spatial differences, which are mainly due to regional heterogeneity in the energy structure and emission characteristics. For example, vehicle exhaust and industrial emissions are dominant in urban areas of China [6,7], while biomass combustion and loose coal use are common in rural areas [8].
As the BC observation network has improved, China has made important progress in the field of BC research. Multi-site joint observations show that BC concentrations in China present a macro pattern of “high in the East and low in the West, high in the North and low in the South” and have significant seasonal variation characteristics [9,10]. For example, BC concentrations in the Beijing–Tianjin–Hebei region in winter can reach levels 2–3 times higher than that in summer, which is closely related to the increase in heating emissions and decrease in boundary layer height [11]. In the Yangtze River Delta, diurnal variations in BC usually present early and late bimodal characteristics [12,13], which are highly consistent with the urban traffic flow. However, key limitations remain in existing research. First, current domestic research on the temporal and spatial distribution of BC concentrations is mostly limited to time series analyses of a single site, and comparisons of different regions are usually based on single-season data, with limited research on changes in BC concentrations in the suburbs relative to that of the city [14]. Second, differences in instrument models (such as AE-31 and AE-33 aethalometers) and calibration methods used in different studies may lead to data comparability problems [15]. Moreover, relatively few studies have focused on the contribution of dry and wet deposition to carbon sink concentrations in urban areas [16].
Hangzhou is the core city in the southern wing of the Yangtze River Delta urban agglomeration, and its unique urban and suburban environmental gradient provides a suitable location for BC research. Urban stations in Hangzhou are mainly affected by vehicle exhaust and building construction, whereas suburban sites are simultaneously affected by agricultural activities and mountainous terrain [17]. Based on observation data on high-temporal resolution BC concentrations from Lin’an Regional Atmospheric Background Station (hereinafter referred to as Lin’an Station) and Hangzhou National Reference climate station (hereinafter referred to as Mantoushan Station), combined with hourly precipitation observation data from Lin’an Station, this study focuses on the following three scientific problems: (1) clarify the temporal and spatial distribution characteristics of BC concentrations in the urban and suburban areas of Hangzhou on interannual, seasonal, and daily scales; (2) analyze the scavenging efficiency and time lag effect of precipitation events with different intensities on BC; and (3) evaluate the environmental benefits of emission mitigation policies in combination with government policy documents through a correlation analysis between changes in BC and PM10 (particulate matter with an aerodynamic diameter of ≤10 microns in ambient air is one of the main air pollutants) [3] concentrations and the implementation nodes of regional policies.

2. Data and Methods

2.1. Study Area and Data

Hangzhou is situated in the central region of the Lower Yangtze River and serves as a representative city for robust economic development in the Yangtze River Delta. In this study, BC aerosol observations were conducted at two sites: Lin’an Station (suburban) and Mantoushan Station (urban) in Hangzhou. Lin’an Station is located in Lin’an District, which is on the southwestern edge of the Yangtze River Delta, China’s largest economic region. Established in 1983, it was one of the first atmospheric background monitoring stations in China as proposed by the World Meteorological Organization (WMO). The surrounding area is predominantly characterized by hills, woodland, and farmland, and exhibits dense vegetation coverage. Observational data from this station effectively represent the atmospheric background conditions of the Yangtze River Delta region. Mantoushan Station is situated in Hangzhou’s Shangcheng District, within the city’s old urban area, and is surrounded primarily by residential zones.
The BC data used in this study were monitored with high precision using the AE-33 black carbon aethalometers produced by Magee Scientific Co., Portland, OR, USA, with a time resolution of 1 minute. The AE-33 model adopts the innovative DualSpot™. The dual spot measurement technology not only improves the sensitivity of the measurement but also enhances data compensation and correction, ensuring data accuracy and stability. Lin’an Station and Mantou Mountain Station both use AE-33 black carbon aethalometers, and the black carbon concentration data of Lin’an Station from 2021 to 2024 and Mantou Mountain Station from 2024 were selected to ensure consistency and comparability of data collection. In addition, the study also simultaneously obtained precipitation data and PM10 data from Lin’an Station, with a time resolution of 1 hour for both precipitation and PM10 data.
This study used a black carbon mass concentration aethalometer based on the light attenuation method to observe the mass concentration of black carbon aerosols in the ambient atmosphere. This instrument calculates the mass concentration of black carbon by measuring the light attenuation of aerosol samples at multiple wavelengths (370 nm, 470 nm, 520 nm, 590 nm, 660 nm, 880 nm, and 950 nm). Its working principle is based on dual point sampling technology, which significantly improves measurement accuracy by real-time correction of filter membrane load effects. In this study, the standard BC mass concentration was obtained from the 880 nm channel according to the established protocol.
The main technical specifications of the instrument are as follows: measurement range of 0–100,000 ng/m3, detection limit ≤ 5 ng/m3 (880 nm, 1 min), resolution ≤ 1 ng/m3, optical detection precision ≤ 2%, accuracy ≤ ±5%. The data sampling interval can be set from 1 s to 60 m and supports long-term storage of 1 m-level data (≥180 days). The instrument is equipped with modules such as a sample collection unit, a light source and an optical measurement unit, a filter membrane control unit, a flow control unit, etc., to ensure automated operation and real-time monitoring. In addition, the instrument meets strict electromagnetic compatibility (GB/T 17626 series standards) [18,19,20] and environmental adaptability requirements (working temperature 0–60 °C, humidity 0–95% RH). The observation data includes information such as black carbon mass concentration at various wavelengths, reference signals, sampling flow rate, temperature, and pressure. The data processing is completed through built-in algorithms, including optical attenuation calculation, load effect correction, and mass concentration conversion. The use of instruments provides high-precision and highly reliable black carbon concentration observation data for research.

2.2. Data Preprocessing and Analysis Methods

Firstly, we perform quality control on the raw data, including removing outliers during instrument maintenance periods and filtering out interference data under extreme weather conditions.
In the quality control of meteorological data, the standard deviation method (Z-Score) is a commonly used statistical outlier detection method. This method assumes that the data approximately follows a normal distribution and identifies outliers by calculating the degree of deviation between the data points and the mean. Specifically, for dataset X, its Z-Score is defined as follows:
Z = ( X μ ) / σ
Among them, μ and σ are the mean and standard deviation, respectively.
If ∣Z∣ > 3, the data point is considered an outlier, as about 99.7% of the data falls within the range of μ ± 3σμ ± 3σ under normal distribution [21]. For non-normally distributed data (such as precipitation), logarithmic transformation or median absolute deviation (MAD) was used for data correction [22]. After screening, the data integrity of Lin’an Station and Mantou Mountain Station reached more than 95%.
In order to ensure the temporal integrity of the data, this study uses the K-nearest neighbor (KNN) interpolation method for filling. In contrast, the KNN interpolation method is a nonparametric local interpolation method that does not assume that the data follows a specific distribution but rather interpolates by finding similar observation points in the time dimension. The basic idea of KNN interpolation is that in time series data, missing values often have a strong similarity with their observed values that are close in time. Therefore, missing values can be filled by calculating adjacent observation points in the time dimension. Specifically, the main steps of the KNN interpolation method include, first, searching for K observation points in the time dimension that are closest to the missing values, then estimating the missing values by weighting the values of these neighboring observation points. In this study, K = 3 was selected as the nearest neighbor number, and a distance-based weighting method was used to ensure that closer observations contribute more to the interpolation results, thereby improving the accuracy of the interpolation. After KNN processing, data integrity is guaranteed, providing more reliable input data for subsequent data analysis.
For the precipitation data, this study first screened precipitation events with a total precipitation of ≥0.5 mm and durations of ≥1 h and eliminated extreme values of BC concentrations outside the 1% and 99% quantiles. The relative change method was used to calculate the scavenging efficiency, and the core formula was as follows:
efficiency   =   ( 1     post _ min / pre _ BC )   ×   100
where pre_BC represents the 2 h moving average of BC concentrations prior to precipitation onset and post_min denotes the minimum BC concentration during nonprecipitation periods within 12 h after precipitation initiation.

3. Results and Analysis

3.1. Temporal and Spatial Characteristics of BC Concentrations

3.1.1. Interannual Variation Characteristics

Based on continuous observation data from Lin’an Station from 2021 to 2024 (Figure 1), annual BC concentrations initially increased and then decreased and showed an obvious downward trend. The annual average concentration was 1.713 μg/m3 in 2021, which dropped to 1.514 μg/m3 by 2024, for a cumulative decline of 11.6%. Although an overall downward trend was observed, there was a slight increase from 2021 to 2022. Analysis of Figure 1 shows that the winter season from the end of 2021 to the beginning of 2022 was significantly higher. This may be related to the recovery of local and surrounding industrial activity levels under the guidance of the “Revitalize Industrial Economy” policy during the same period [23]. Research has shown that emissions from industrial production activities and industrial coal combustion may lead to an increase in BC concentrations [13]. However, after 2022, a small initial decline was followed by a large decline, which may have been related to the Hangzhou government’s implementation of effective emission mitigation measures in 2023. The average annual concentration in 2022 was 1.848 μg/m3, and the total rate of decline reached 18.1% by 2024. This trend is consistent with the results of Li et al. [24] and Zheng et al. [25] for the Yangtze River Delta, who reported that the average annual decline rate of BC in the region from 2008 to 2017 was >6%.

3.1.2. Seasonal Variation Characteristics

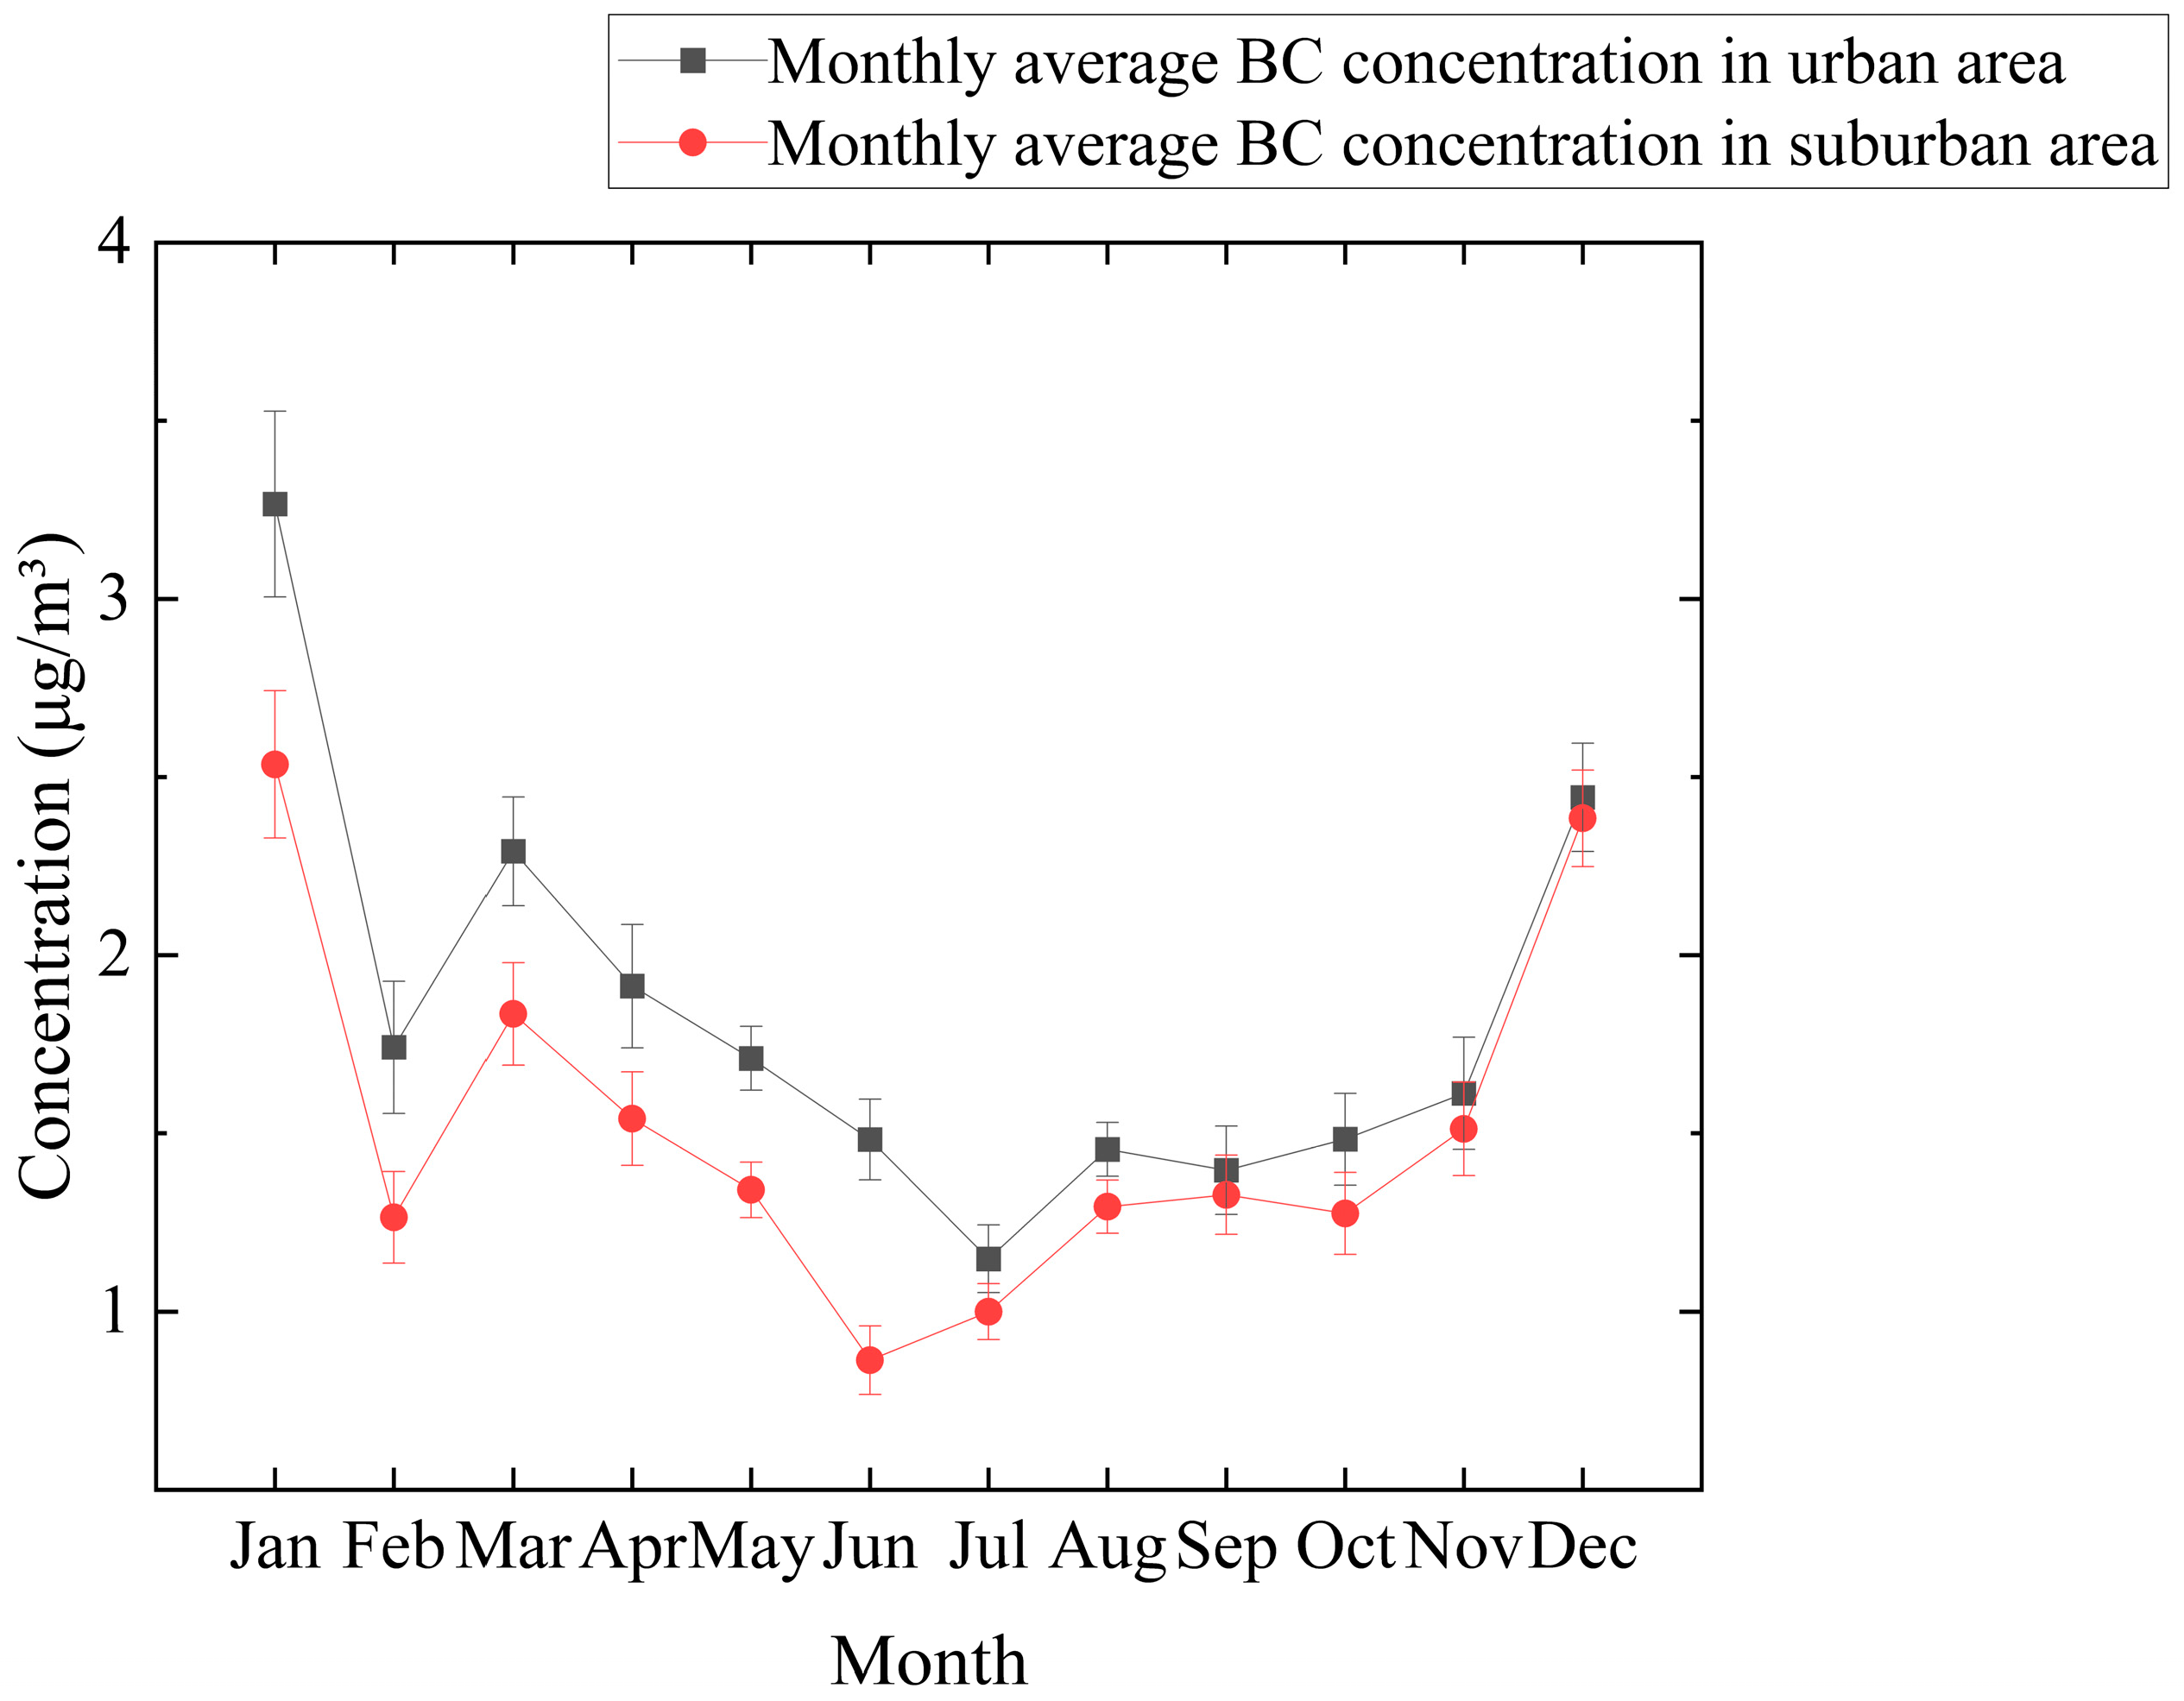
In Figure 2, winter periods are highlighted, and the results indicate that BC concentrations exhibited a typical seasonal unimodal variation trend, with high levels in winter, low levels in summer, and moderate levels in spring and autumn. The monthly average concentration was highest in January at 2.551 μg/m3 and lowest in July at 1.115 μg/m3. The average concentration in winter (2.260 μg/m3) was 1.77 times that in summer (1.276 μg/m3). This change amplitude was equivalent to the findings of Zeng et al. [26], who found that winter concentrations were 1.7 times higher than summer concentrations in the Suzhou area. This seasonal difference may have been related to three factors: first, biomass combustion, particularly agricultural waste burning, was more frequent in winter; second, the temperature and atmospheric boundary layer were low in winter [27], which is not conducive to the diffusion of pollutants; third, prevailing winter winds, including pollutant transport in the North China Plain, contribute to regional transmission [28]. Notably, significant concentration changes were observed during the seasonal transition period, which may be related to changes in atmospheric circulation caused by the monsoon transition [29].

3.1.3. Diurnal Variation Characteristics

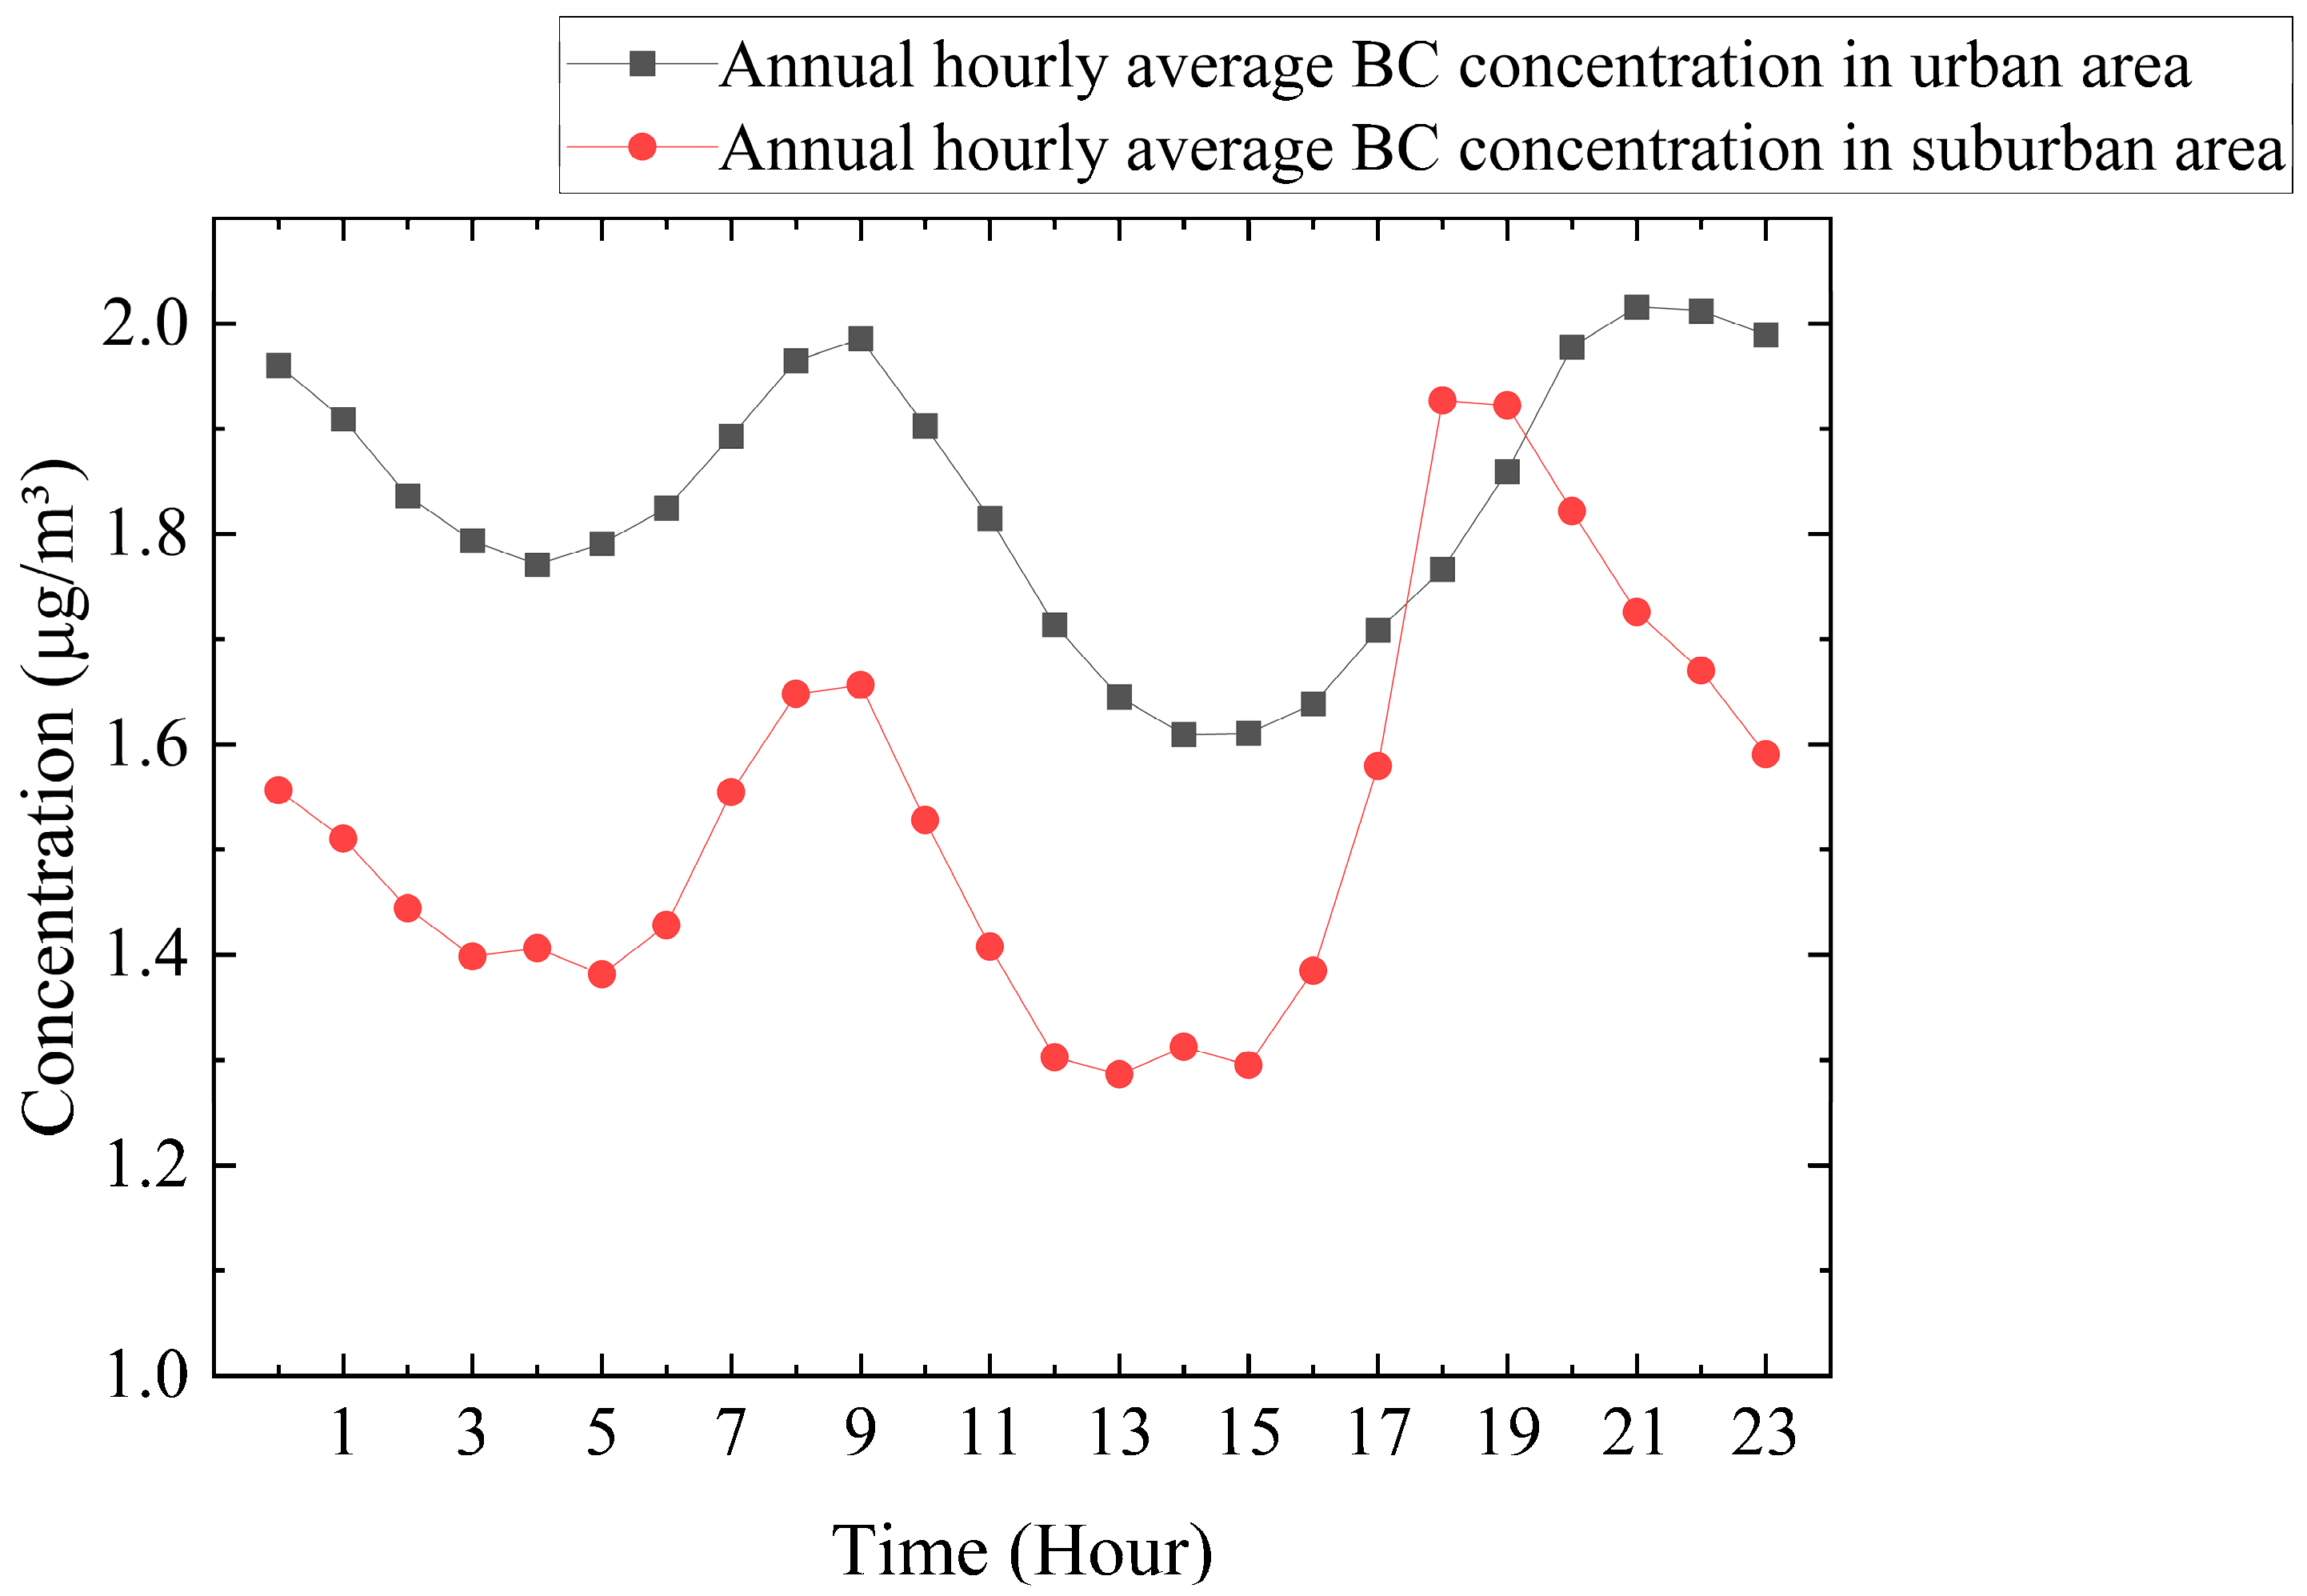
To ensure that the daily variation analysis was more representative, the annual average of BC concentration hourly data in 2024 was calculated according to the time of day after eliminating missing measured values. The results are displayed on a 24 h horizontal axis, thus reflecting the diurnal variation characteristics of BC concentrations (Figure 3). Urban and suburban areas both showed double peaks in the morning and evening, which were closely related to the laws of human activities. The morning peak rule was similar in urban and suburban areas, and an obvious concentration peak occurred from 7:00 to 9:00, which is closely related to the morning peak of traffic. After the morning peak, BC concentrations decreased rapidly and reached a minimum value, which was mainly due to increases in solar radiation absorption by the ground during the day and frequent heat exchange between the Earth and atmosphere, resulting in a rapid increase in boundary layer height and an improvement in atmospheric diffusion conditions [27]. In the late peak period, the urban late peak concentration was high, and the duration was long. When the evening peak in the suburbs, which is the second peak, arrived, the peak reached 1.926 μg/m3. The peak value of evening rush hour in urban areas was 2.015 μg/m3. It can be observed that the evening rush hour in suburban areas was lower than that in urban areas, but the arrival time of the evening rush hour in suburban areas was earlier than that in urban areas. This may be due to the fact that people in urban areas have a later working time. The difference in BC concentrations between urban and suburban areas can reflect the different characteristics of pollution sources. For example, while the urban peak was mainly affected by motor vehicle emissions during commuting hours, the suburban peaks in the morning and evening were also affected by traffic emissions; the degree of impact was smaller than that in the urban areas, especially in the late peak period. This may have been related to residents’ domestic coal and biomass combustion activities in winter [30].

3.1.4. Spatial Differences Between the Urban and Suburban Areas

A comparative analysis of the annual observation data from 2024 (Figure 4) revealed significant differences between urban and suburban areas. In terms of annual average concentration, the urban area (1.829 μg/m3) was 20.7% higher than the suburban area (1.514 μg/m3). Although the variation trends in BC concentrations in urban and suburban areas were similar, this spatial difference had obvious seasonal characteristics, with the largest difference observed in winter. In January, for example, the concentration in the urban area was 3.266 μg/m3, while that in the suburban area was only 2.535 μg/m3. This result was also consistent with the above analysis of seasonal variations in BC concentrations. Moreover, the seasonal difference in BC concentrations was more significant in the urban area. A comparison of data from different periods revealed that the difference between urban and suburban areas on weekdays was significantly greater than that on weekends, which further confirmed the important contribution of traffic emissions to urban pollution.

3.2. Analysis of Precipitation Scavenging Efficiency

3.2.1. Scavenging Efficiency Characteristics

Based on the precipitation intensity classification standards of the National Oceanic and Atmospheric Administration (NOAA) [31] and WMO [32], this study used the hourly precipitation data of Lin’an Station in 2024 and screened 138 effective precipitation events (77 light rain, 41 moderate rain, 20 heavy rain) according to the hourly precipitation. In addition, it systematically analyzed scavenging efficiency, which revealed the nonlinear influence mechanism of precipitation scavenging efficiency on BC.
The statistical results in Table 1 and Figure 5a demonstrate that the average scavenging efficiency of light rain events (0.1–2.5 mm/h) reached 27.1%. However, significant fluctuations were observed, with a standard deviation as high as 27.3%. This fluctuation may be closely related to changes in the stability of the boundary layer. Under a stable boundary layer, the scavenging efficiency of light rain on pollutants near the ground is more significant [33]. In Figure 5b, the interquartile range (IQR) of moderate rainfall events (2.5–8.0 mm/h) is between 18% and 23%, indicating that 50% of the efficiency values fall within this narrow range, demonstrating the most stable clearing characteristics. Although the average efficiency was the lowest (20.5%), the scavenging efficiency of moderate rain events lasting >6 h could reach 35–40% after analysis, which fully reflected the important impact of precipitation duration on scavenging efficiency. These dynamics are consistent with the “precipitation duration effect” theory proposed by Andronache [34].
Heavy rainfall events (≥8.0 mm/h) showed the most complex removal characteristics, and the efficiency distribution range was very wide (from a negative value to 75%), as shown in Figure 5b. Notably, as shown in Figure 5a, when the precipitation intensity exceeded 15 mm/h, the average removal efficiency decreased. This phenomenon is likely related to downdrafts caused by heavy rainfall, which leads to particle resuspension or secondary entrainment effects [34]. The difference in the removal efficiencies of precipitation events with different intensities revealed the complex interaction mechanism between the precipitation process and BC removal.
The results showed that the scavenging of BC by precipitation events with different intensities exhibited significant nonlinear characteristics. Although the removal efficiency of light rain was high, it fluctuated obviously. The removal efficiency of moderate rain was relatively stable, and the longer the duration, the better the effect. However, the removal effect of heavy rainfall differed significantly because it involves complex dynamic processes. These findings provide an important scientific basis for a more in-depth understanding of the scavenging mechanism of atmospheric pollutants by precipitation and help to more accurately assess the actual impact of precipitation on atmospheric environmental quality.

3.2.2. Typical Event Analysis

The continuous precipitation event during 28–29 February 2024 (Figure 6) is a typical case. In this event, precipitation lasted for 12 h, and the cumulative rainfall reached 22.2 mm. Average BC concentrations decreased from 1.187 μg/m3 in the 2 h before the precipitation event to a minimum of 0.712 μg/m3 after the event, which could be calculated according to the scavenging efficiency formula. Moreover, scavenging efficiency reached 39.9%. BC concentrations began to recover when the precipitation event approached its end, while the overall trend continued to fluctuate and decline. The arrival of the second peak may have been slightly affected by the precipitation event but was mainly related to biomass combustion and man-made traffic emissions in the suburbs in the evening.
In contrast, the maximum precipitation intensity of the heavy rainfall event (Figure 7) during 10–11 September 2024, exceeded 9 mm/h. However, compared with the previous event, the duration was significantly shortened at only 8 h, while average BC concentrations decreased from 0.578 μg/m3 in the 2 h before the precipitation to a minimum of 0.431 μg/m3 after the event. According to the scavenging efficiency formula, efficiency was 25.4%. It could be concluded that precipitation duration may be more important for the scavenging efficiency of precipitation on BC concentrations than the instantaneous intensity of precipitation.
A comparative analysis of these two typical events showed that precipitation had a significant immediate scavenging effect on BC concentrations. BC concentrations increased after the end of the precipitation event, while a continuous downward trend was observed after reaching its peak. This trend continued until 12 h after the end of the precipitation event, indicating that precipitation may have a lasting impact on the scavenging effect of BC.

3.3. Effect Evaluation of Emission Mitigation Policy

Hangzhou has implemented strong emission reduction policies and measures, among which the “14th Five-Year Plan for Air Quality Improvement in Hangzhou” is representative [35]. From 2023 to 2024, Hangzhou implemented a comprehensive emission reduction policy, vigorously promoted the popularization of new energy vehicles, and orderly promoted the “five gas CO governance” policy. Based on the PM10 concentration and BC concentration data of Lin’an Station from 2023 to 2024, this study briefly evaluated and analyzed the emission reduction policies of Hangzhou. Hangzhou implemented a new energy vehicle purchase tax reduction policy in 2023. BC concentrations decreased significantly in the second half of 2023, reaching 11%, while the PM10 concentration did not change significantly. In January 2024, biomass combustion control (prohibiting the open burning of agricultural and forestry wastes) was implemented. Following this policy implementation, BC concentrations decreased by 19% compared with that in the same period in 2023, and the PM10 concentrations decreased by >10%.

4. Conclusions and Prospects

4.1. Main Conclusions

To systematically investigate BC aerosols in Hangzhou, we analyzed their concentrations, spatiotemporal distribution patterns, and precipitation scavenging efficiency across urban (Mantoushan Station, 2024) and suburban (Lin’an Station, 2021–2024) areas. Based on high-time-resolution BC concentrations combined with precipitation and PM10 concentration data and policy timelines, this study discussed the interannual variation, seasonal differences, and spatial distribution characteristics of BC concentrations in urban and suburban areas, quantified the scavenging efficiency of precipitation events with different intensities on BC aerosols, and evaluated the actual effect of emission mitigation policies. The main conclusions are as follows.
(1) During the study period, BC concentrations in Hangzhou showed a significant interannual downward trend, with a cumulative decline of 11.6% from 2021 to 2024 and a decrease in annual average concentrations from 1.713 to 1.514 μg/m3. Seasonal variations showed a single-peak pattern of high concentrations in winter and low concentrations in summer. The average concentration in winter was 2.260 μg/m3, which was 1.77 times the average concentration in summer (1.276 μg/m3). Diurnal variations were characterized by double peaks in the morning and evening, and the contribution of traffic emissions was significant. BC concentrations in urban areas were significantly affected by the traffic peak compared with that in the suburbs, while the late peak BC concentration in the suburbs may have been affected by the combustion of residential coal and biomass during winter. In terms of spatial distribution, the annual average concentration of 1.829 μg/m3 in urban areas was significantly higher than that of 1.514 μg/m3 in suburban areas, and the difference was most obvious in winter.
(2) The effect of precipitation on BC removal efficiency showed significant nonlinear characteristics. The average removal efficiency of light rain reached 27.1%, although it fluctuated greatly. The removal efficiency of moderate rain was the most stable, with an average efficiency of 20.5%, although it increased to 35–40% for events longer than 6 h. The removal efficiency during heavy rainfall events was more complex. The difference in removal efficiency of precipitation events with different intensities reveals the complex interaction mechanism between precipitation processes and BC removal.
(3) The effect of implementing emission reduction policies was remarkable. After the promotion of new energy vehicles in 2023, BC concentrations in the second half of the year decreased by 11%. In 2024, biomass combustion control promoted year-on-year decreases in BC and PM10 concentrations of 19% and 10%, respectively.

4.2. Prospects

There is room for improvement in policy evaluations. This study only infers the emission reduction effect through the correlation between concentration changes and the implementation time of the policy and lacks a direct emission reduction estimation of specific measures (such as diesel vehicle restriction). Simultaneously, interannual changes in meteorological conditions, such as precipitation frequency and boundary layer height, may interfere with the attribution analysis of the policy effect. In the future, the meteorological normalization method could be used in combination with the model to make policy evaluation more accurate. In addition, a collaborative control strategy for BC, ozone, and other pollutants could be explored to provide scientific support for the treatment of regional composite atmospheric pollution.

Author Contributions

Conceptualization, H.X. and M.Z.; methodology, M.S., Y.D. and Y.L.; software, M.Z.; formal analysis, M.Z.; writing—review and editing, H.C. All authors have read and agreed to the published version of the manuscript.

Funding

This research was funded by the Zhejiang Meteorological Bureau Science and Technology Programs “Spatiotemporal Variation Characteristics of Black Carbon Aerosol Concentrations and Precipitation Scavenging Analysis in Urban and Suburban Hangzhou” (Grant 2024QN13), “Compiling and Data Mining of Long-sequence Atmospheric Background Observation Data” (Grant 2024ZD17) and “Competitive Science and Technology Tackling Project of Quzhou Science and Technology Bureau” (Grant 2022K35).

Institutional Review Board Statement

Not applicable.

Informed Consent Statement

Not applicable.

Data Availability Statement

The data presented in this study are available on request from the corresponding author (due to privacy).

Conflicts of Interest

The authors declare no conflicts of interest.

Abbreviations

The following abbreviations are used in this manuscript:
BCBlack carbon
WMOWorld Meteorological Organization
NOAANational Oceanic and Atmospheric Administration

References

  1. Bond, T.C.; Doherty, S.J.; Fahey, D.W.; Forster, P.M.; Berntsen, T.; DeAngelo, B.J.; Flanner, M.G.; Ghan, S.; Kärcher, B.; Koch, D.; et al. Bounding the role of black carbon in the climate system: A scientific assessment. J. Geophys. Res. Atmos. 2013, 118, 5380–5552. [Google Scholar] [CrossRef]
  2. IPCC. Climate Change 2021: The Physical Science Basis; Cambridge University Press: Cambridge, UK, 2021. [Google Scholar]
  3. World Health Organization (WHO). WHO Global Air Quality Guidelines; WHO: Geneva, Switzerland, 2021; Available online: https://apps.who.int/iris/handle/10665/345329 (accessed on 12 October 2025).
  4. Janssen, N.A.H.; Hoek, G.; Simic-Lawson, M.; Fischer, P.; van Bree, L.; ten Brink, H.; Keuken, M.; Atkinson, R.W.; Anderson, H.R.; Brunekreef, B.; et al. Black carbon as an additional indicator of the adverse health effects of airborne particles compared with PM10 and PM2.5. Environ. Health Perspect. 2012, 120, 1183–1189. [Google Scholar]
  5. Wang, R.; Tao, S.; Wang, W.T.; Liu, J.; Shen, H.; Shen, G.; Wang, B.; Liu, X.; Li, W.; Huang, Y.; et al. Black carbon emissions in China from 1949 to 2050. Environ. Sci. Technol. 2012, 46, 7595–7603. [Google Scholar] [CrossRef] [PubMed]
  6. Wu, Q.T. Pollution Characteristics and Source Apportionment of Atmospheric Black Carbon Concentration in Urban Environments Based on Mobile Platform Monitoring. Master’s Thesis, East China Normal University, Shanghai, China, 2023. (In Chinese) [Google Scholar] [CrossRef]
  7. Liu, H.J. Study on characteristics and source distribution of black carbon pollutants in Shanghai. In Proceedings of the 28th Annual Meeting of the Chinese Meteorological Society—S9 Atmospheric Physics and Atmospheric Environment, Xiamen, China, 2 November 2011; Department of Atmospheric and Oceanic Sciences, School of Physics, Peking University: Beijing, China, 2011. 150p. (In Chinese). [Google Scholar]
  8. Zhang, L.; Kong, S.F.; Zheng, H.; Hu, Y.; Zeng, Y.; Qi, S. Black carbon aerosol concentration and sources in rural areas of southern North China Plain. Environ. Sci. 2022, 43, 2363–2372. (In Chinese) [Google Scholar] [CrossRef]
  9. Zhao, N.; Cao, F.S.; Tian, Q.; Chen, Y.; Liu, Q.; Huang, Y.; Wang, Y. Spatiotemporal characteristics of absorbing aerosols in the Yangtze River Delta region. Environ. Sci. 2019, 40, 3898–3907. (In Chinese) [Google Scholar] [CrossRef]
  10. Zhang, X.; Yu, Y.J.; Xie, S.Y.; Meng, X.Y.; Qi, W.H.; Wang, S.; Pan, B.F. Characteristics of black carbon concentration in national atmospheric background regions of China. China Environ. Monit. 2018, 34, 32–40. (In Chinese) [Google Scholar] [CrossRef]
  11. Zhao, X.C. Source Apportionment of Black Carbon Aerosols During Heavy Haze Episodes in the Beijing-Tianjin-Hebei Region. Master’s Thesis, Nanjing University of Information Science and Technology, Nanjing, China, 2020. (In Chinese) [Google Scholar] [CrossRef]
  12. Zhang, X.L.; Rao, R.Z.; Huang, Y.B.; Mao, M.; Berg, M.J.; Sun, W.B. Black carbon aerosols in urban central China. J. Quant. Spectrosc. Radiat. Transf. 2015, 150, 3–11. [Google Scholar] [CrossRef]
  13. Jin, A.K. Pollution Characteristics and Source Analysis of Black Carbon in the Yangtze River Delta Region. Master’s Thesis, Nanjing University of Information Science and Technology, Nanjing, China, 2019. (In Chinese) [Google Scholar] [CrossRef]
  14. Xiao, X.Z.; Liu, P.F.; Geng, F.H.; Gao, W.; Zhen, C.; Zhao, C. Comparative observation of black carbon aerosols between urban and suburban areas in Shanghai. J. Appl. Meteorol. Sci. 2011, 22, 158–168. (In Chinese) [Google Scholar]
  15. Drinovec, L.; Močnik, G.; Zotter, P.; Prévôt, A.S.H.; Ruckstuhl, C.; Coz, E.; Rupakheti, M.; Sciare, J.; Müller, T.; Wiedensohler, A.; et al. The “dual-spot” Aethalometer: An improved measurement of aerosol black carbon with real-time loading compensation. Atmos. Meas. Tech. 2015, 8, 1965–1979. [Google Scholar] [CrossRef]
  16. Tan, Y.L. Precipitation Scavenging, Source Apportionment and Carbon Sink Contribution of Aerosol Carbon in Nanchang Region. Ph.D. Thesis, Nanchang University, Nanchang, China, 2019. (In Chinese) [Google Scholar] [CrossRef]
  17. Lan, W.G.; Kong, W.L.; Zang, K.P.; Chen, Y.; Liu, S.; Yin, J.; Hong, H.; Qiu, X.; Fang, S.; Lin, Y. Volution characteristics and potential source analysis of atmospheric sulfur dioxide and aerosol concentrations in urban and suburban Hangzhou. Acta Sci. Circumst. 2024, 44, 287–297. (In Chinese) [Google Scholar] [CrossRef]
  18. GB/T 17626.2-2018; Electromagnetic Compatibility—Testing and Measurement Techniques-Electrostaic Discharge Immunity Test. Standardization Administration of China: Beijing, China, 2018. Available online: https://openstd.samr.gov.cn/bzgk/gb/newGbInfo?hcno=88FC56474149E07039BCD95FB13B8360 (accessed on 14 May 2025).
  19. GB/T 17626.4-2018; Electromagnetic Compatibility-Testing and Measurement Techniques-Electrical Fast Transient/Burst Immunity Test. Standardization Administration of China: Beijing, China, 2018. Available online: https://openstd.samr.gov.cn/bzgk/gb/newGbInfo?hcno=877FD741E1D1BFFD7DC74AFCCE84E9FC (accessed on 14 May 2025).
  20. GB/T 17626.5-2019; Electromagnetic Compatibility—Testing and Measurement Techniques-Surge Immunity Test. Standardization Administration of China: Beijing, China, 2019. Available online: https://openstd.samr.gov.cn/bzgk/gb/newGbInfo?hcno=534499018FB30E7FC5E646F89937B3A8 (accessed on 14 May 2025).
  21. Barnett, V.; Lewis, T. Outliers in Statistical Data; John Wiley & Sons: New York, NY, USA, 1994. [Google Scholar]
  22. Leys, C.; Ley, C.; Klein, O.; Bernard, P.; Licata, L. Detecting outliers: Do not use standard deviation around the mean, use absolute deviation around the median. J. Exp. Soc. Psychol. 2013, 49, 764–766. [Google Scholar] [CrossRef]
  23. National Development and Reform Commission. Notice on the Implementation Plan for Boosting the Operation of Industrial Economy and Promoting High Quality Industrial Development. 2021. Available online: https://www.ndrc.gov.cn/xwdt/tzgg/202112/t20211214_1307767.html (accessed on 14 May 2025).
  24. Li, M.; Liu, H.; Geng, G.N.; Hong, C.; Liu, F.; Song, Y.; Tong, D.; Zheng, B.; Cui, H.; Man, H. Anthropogenic emission inventories in China: A review. Natl. Sci. Rev. 2017, 4, 834–866. [Google Scholar] [CrossRef]
  25. Zheng, B.; Tong, D.; Li, M.; Liu, F.; Hong, C.; Geng, G.; Li, H.; Li, X.; Peng, L.; Qi, J.; et al. Trends in China’s anthropogenic emissions since 2010 as the consequence of clean air actions. Atmos. Chem. Phys. 2018, 18, 14095–14111. [Google Scholar] [CrossRef]
  26. Zeng, C.; Zhu, J.; Li, J.; Yang, Y. Distribution characteristics and source analysis of black carbon aerosols in Suzhou region. J. Mar. Meteorol. 2023, 43, 87–100. (In Chinese) [Google Scholar] [CrossRef]
  27. Abudurexiati, A. Pollution Characteristics, Source Apportionment and Long-Term Trends of Black Carbon Aerosols in Northern Suburban Nanjing. Ph.D. Thesis, Nanjing University of Information Science and Technology, Nanjing, China, 2023. (In Chinese) [Google Scholar] [CrossRef]
  28. Sun, X.Y. Variation of PM2.5 Pollution and the Role of Atmospheric Boundary Layer in Regional Transport Over the Two-Lake Basin. Ph.D. Thesis, Nanjing University of Information Science and Technology, Nanjing, China, 2023. (In Chinese) [Google Scholar] [CrossRef]
  29. Fang, C.W. Spatiotemporal Variation, Sources and Interactions with East Asian Summer Monsoon of Black Carbon in East Asia. Ph.D. Thesis, Nanjing University of Information Science and Technology, Nanjing, China, 2024. (In Chinese) [Google Scholar] [CrossRef]
  30. Yuan, Z.H.; Zeng, S.Y.; Zhang, X.L.; Li, J.Z.; He, Y.L.; Yuan, L.; Wang, J.Y. Characteristics and source apportionment of black carbon concentration in the Sie Mountain region on the eastern slope of the Tibetan Plateau. China Environ. Monit. 2025, 41, 65–75. Available online: http://kns.cnki.net/kcms/detail/11.2861.x.20250523.1027.003.html (accessed on 14 May 2025). (In Chinese) [CrossRef]
  31. Perica, S.; Kane, D.; Dietz, S.; Maitaria, K.; Martin, D.; Pavlovic, S.; Roy, I.; Stuefer, S.; Tidwell, A.; Trypaluk, C.; et al. NOAA Atlas 14 Volume 7 Version 2.0, Precipitation-Frequency Atlas of the United States, Alaska. 2012. Available online: https://www.weather.gov/media/owp/oh/hdsc/docs/Atlas14_Volume7.pdf (accessed on 14 May 2025).
  32. WMO. Manual on Precipitation Measurement and Estimation (WMO-No. 587); WMO: Geneva, Switzerland, 1994. [Google Scholar]
  33. Zhang, X.Y.; Wang, Y.Q.; Zhang, X.C.; Guo, W.; Gong, S.L. Carbonaceous aerosol composition over various regions of China during 2006. J. Geophys. Res. Atmos. 2008, 113, D14111. [Google Scholar] [CrossRef]
  34. Andronache, C. Estimated variability of below-cloud aerosol removal by rainfall for observed aerosol size distributions. Atmos. Chem. Phys. 2003, 3, 131–143. [Google Scholar] [CrossRef]
  35. Hangzhou Municipal People’s Government. 14th Five-Year Plan for Air Quality Improvement in Hangzhou. 2022. Available online: https://epb.hangzhou.gov.cn/art/2022/1/7/art_1229354834_4008171.html (accessed on 14 May 2025).
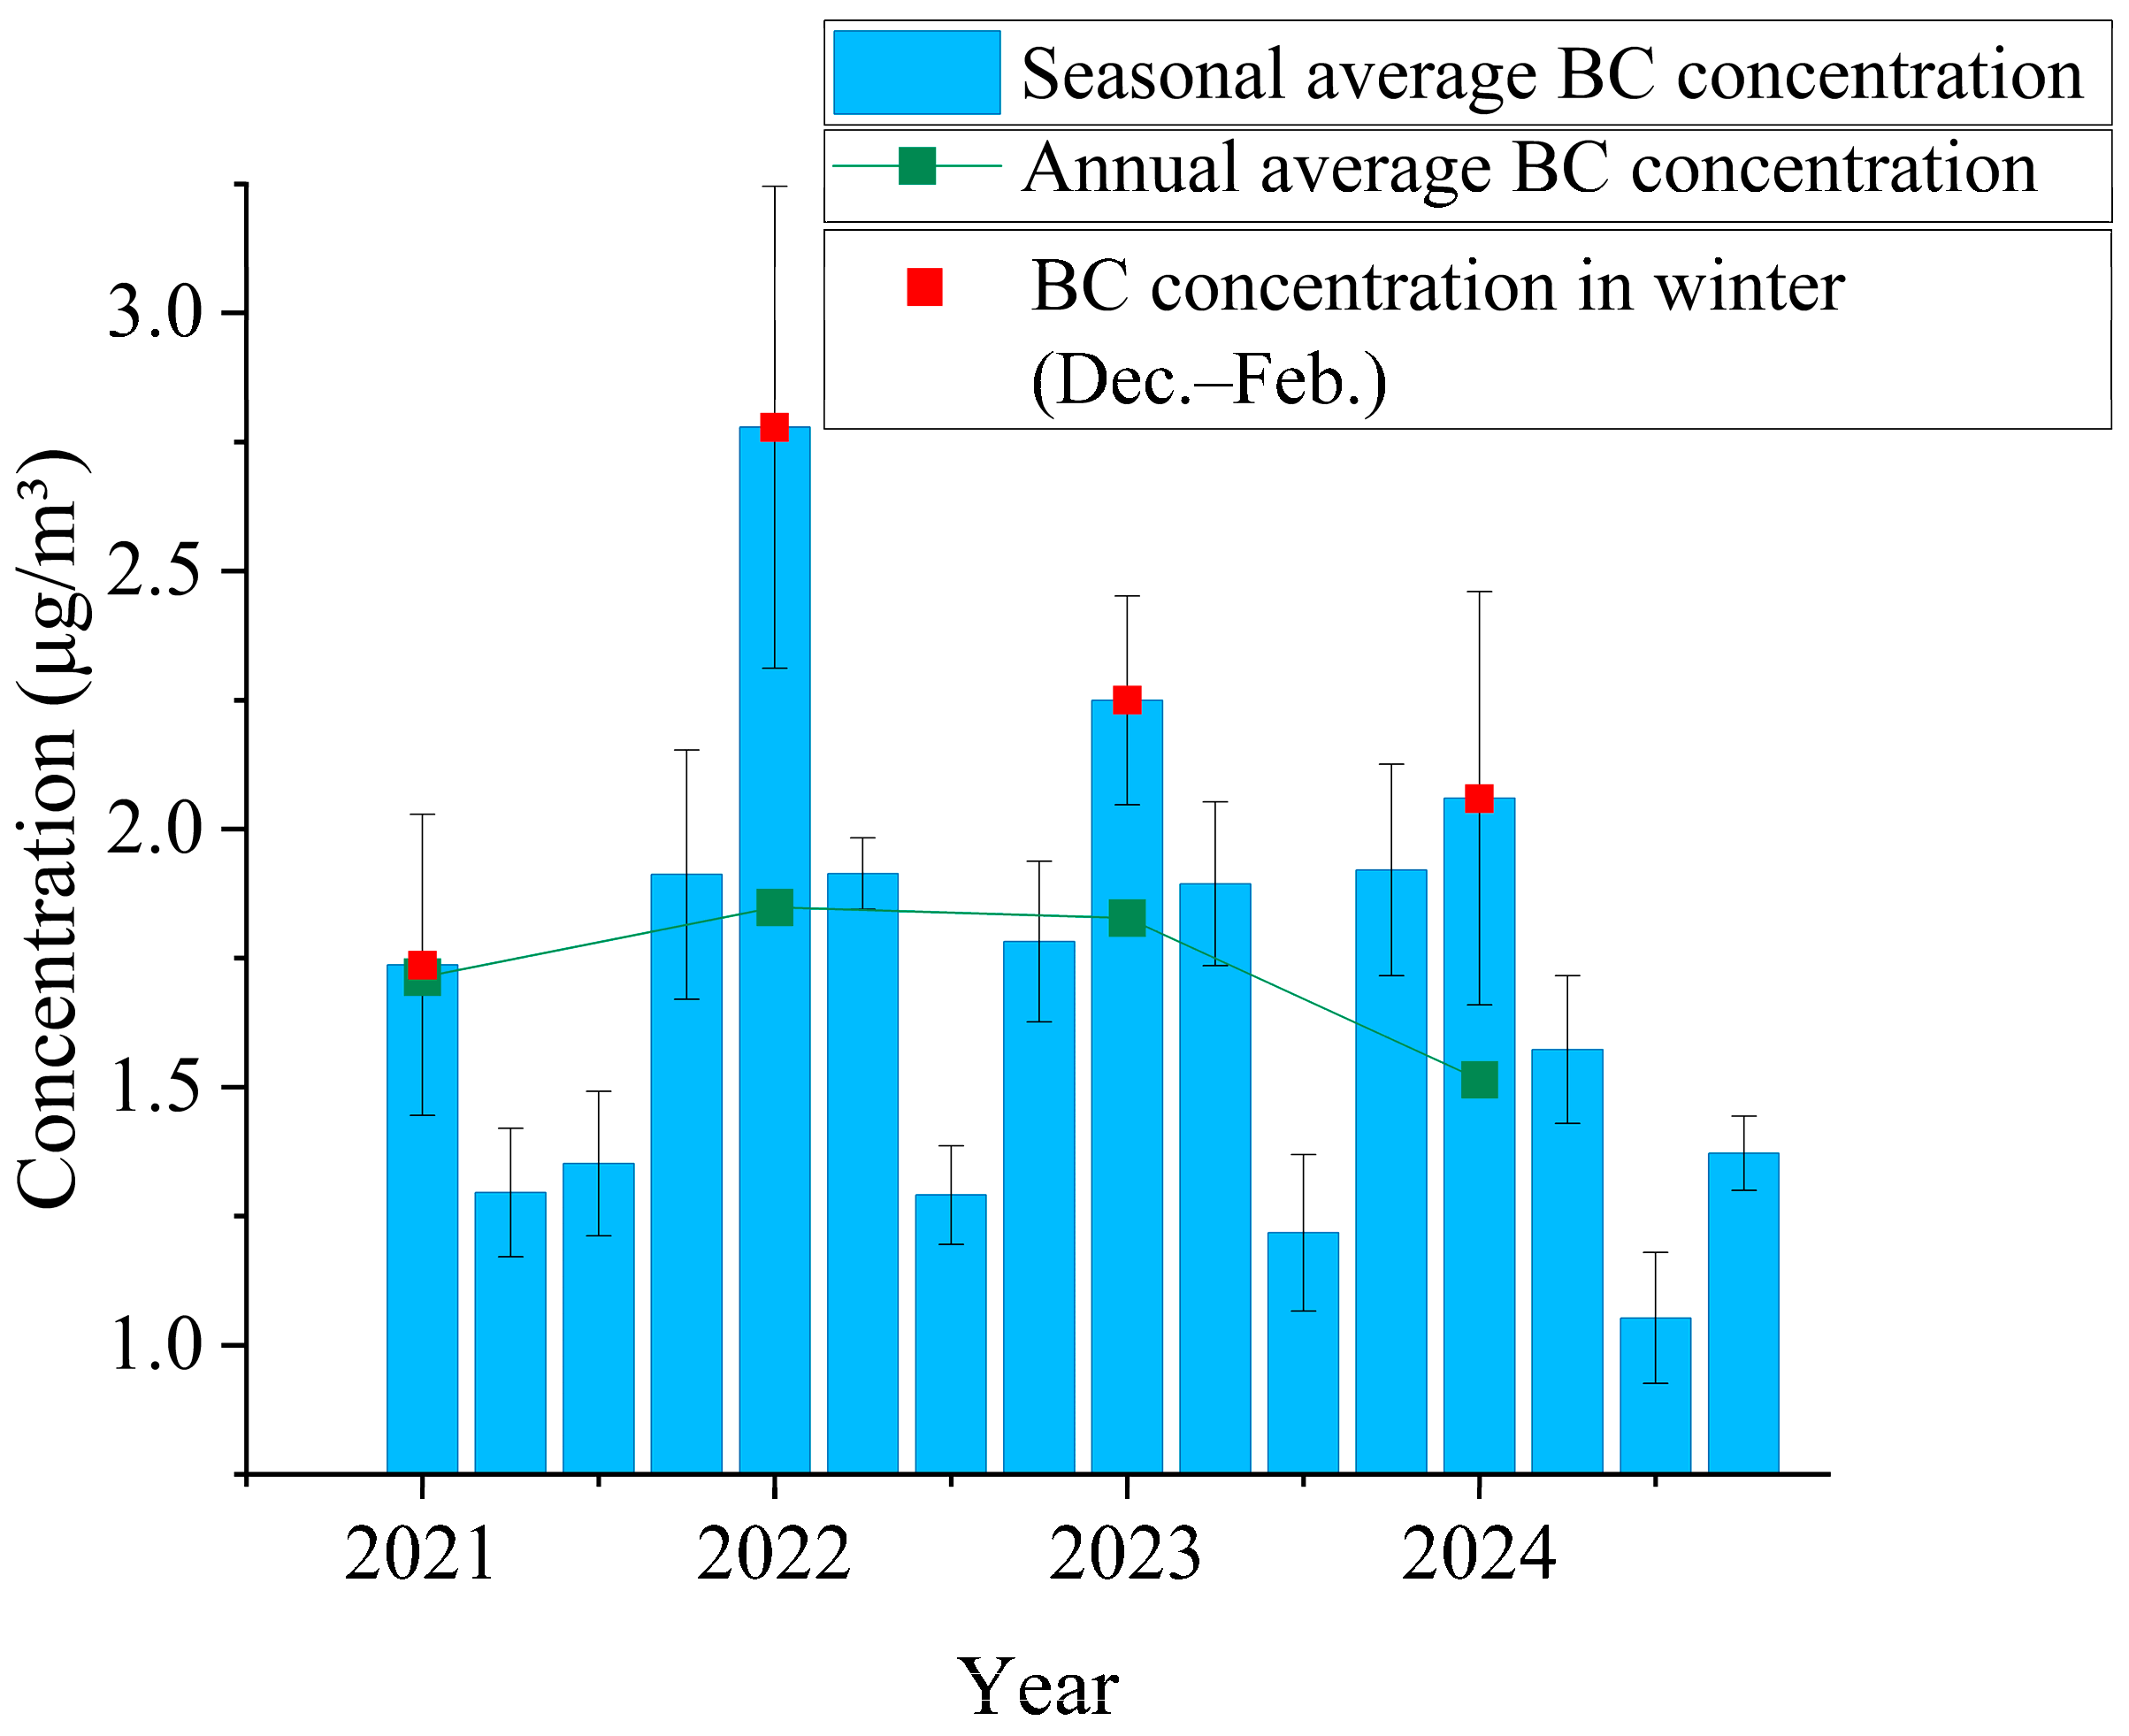
Figure 1. Interannual and seasonal variations (especially in winter) of BC concentrations at Lin’an Station (2021–2024).
Atmosphere 16 01212 g001
Figure 2. Monthly variation (especially in winter) of BC concentrations at Lin’an Station (2021–2024).
Atmosphere 16 01212 g002
Figure 3. Comparison of annual hourly average BC concentrations in urban and suburban areas of Hangzhou in 2024.
Atmosphere 16 01212 g003
Figure 4. Comparison of monthly average BC concentrations in urban and suburban areas of Hangzhou in 2024.
Atmosphere 16 01212 g004
Figure 5. (a) Scatter plot of BC scavenging efficiency as a function of maximum precipitation intensity. (b) Distribution of scavenging efficiency across precipitation intensity categories.
Atmosphere 16 01212 g005
Figure 6. Variation in precipitation and BC concentrations from 20:00 on 28 February to 23:00 on 29 February 2024.
Atmosphere 16 01212 g006
Figure 7. Variation in precipitation and BC concentrations from 20:00 on 10 September 2024, to 17:00 on 11 September 2024.
Atmosphere 16 01212 g007
Table 1. Scavenging efficiency of different precipitation classes.
Precipitation ClassIntensity Range (mm/h)Sample_SizeMean_Efficiency (%)Std_EfficiencyMin_IntensityMax_IntensityMean_Duration (h)
Light rain0.1–2.57727.11727.3380.32.44.8
Moderate rain2.5–8.04120.47723.7752.57.69.6
Heavy rain≥8.02022.61232.2678.127.68.8
Disclaimer/Publisher’s Note: The statements, opinions and data contained in all publications are solely those of the individual author(s) and contributor(s) and not of MDPI and/or the editor(s). MDPI and/or the editor(s) disclaim responsibility for any injury to people or property resulting from any ideas, methods, instructions or products referred to in the content.