


Abstract
Hydrochar has emerged as a promising carbonaceous amendment to enhance soil quality, yet its short-term effects on soil carbon (C) and nitrogen (N) dynamics and microbial functioning remain poorly understood. Here, a 77-day greenhouse pot experiment was conducted using a Cambisol cultivated with sunflower (Helianthus annuus L.) under two irrigation regimes simulating well-irrigated (WI) and water-deficit (WD) scenarios. Two doses of chicken-manure-derived hydrochar (3.25 and 6.5 t ha−1, corresponding to 2.35 and 4.69 g kg−1 of dry soil, respectively) and mineral fertilizer (MF) treatments providing equivalent N inputs were evaluated. Hydrochar promoted microbial growth and enhanced enzymatic and respiratory activities despite its low apparent C and nutrient input. After 77 days under WI, the addition of 6.5 t ha−1 hydrochar enhanced the activity of phenol oxidase (POA) and acid phosphomonesterase (AcPA). Concomitantly, the availability of soluble C and N increased, whereas total organic C (TOC) and N decreased relative to the initial values. These responses may suggest enhanced mineralization potentially related to early-stage priming processes. The increase in POA relative to β-glucosidase is in line with a functional shift from a predominant degradation of labile compounds towards an increased oxidation of more complex structures. This interpretation is supported by solid-state 13C NMR data, revealing a higher degradation index of the soil organic matter. Under WD, the overall effects of hydrochar were attenuated or suppressed, particularly those related to C and N dynamics, emphasizing the interactive influence of moisture and amendment dose. Overall, our results show that hydrochar can modulate short-term soil biochemical processes, partly through enhanced microbial responses.
1. Introduction
Soil organic carbon (SOC) and nitrogen (N) are key regulators of soil fertility, microbial functioning, and the potential to mitigate the adverse impacts of global change on soil systems [1,2]. Their dynamics influence nutrient availability, aggregate stability, and the overall resilience of agroecosystems [3,4]. However, modern agricultural systems are often characterized by intensive fertilizer use and reduced organic inputs, leading to soil organic matter (SOM) depletion, nutrient imbalances, and loss of microbial diversity [5,6]. These challenges are expected to intensify under the ongoing context of climate change, as rising temperatures, altered precipitation patterns, and more frequent drought events further accelerate SOM losses and disrupt nutrient cycling processes [7]. Thus, understanding the transformations of carbon (C) and N in soil is essential to design management practices that sustain both productivity and soil health even under climate change challenges.
Mineral fertilizers (MF), although effective in supplying nutrients and increasing crop productivity, can negatively alter soil physical and chemical properties, including pH, electrical conductivity (EC), and structure [8]. In addition, they affect the quantity and quality of SOM and contribute to soil and environmental contamination [8]. Such alterations in soil physical and chemical conditions can accelerate SOM mineralization and modify microbial community structure, potentially affecting long-term soil functioning and fertility [9,10]. Consequently, there is increasing interest in alternative or complementary amendments that can stabilize SOC, improve nutrient cycling efficiency, and support biological activity under changing environmental conditions.
Among these strategies, the use of carbonaceous materials such as biochar and hydrochar has gained attention as a sustainable approach to improve soil quality, while promoting waste valorization and nutrient recycling within a circular economy framework. Biochar is produced by pyrolysis under anoxic conditions (300 °C and 700 °C), whereas hydrochar results from hydrothermal carbonization (HTC) of wet feedstocks at lower temperatures (150–350 °C) but high pressure [11,12]. Compared to biochar, hydrochar contains a higher proportion of oxygenated, aliphatic, and labile organic compounds, making it less biochemically recalcitrant, thus more reactive and transient in soil environments [13,14]. This also confers agronomic relevance, as hydrochar typically exhibits a balanced ratio between plant-available, readily accessible N and more stabilized organic N (Norg) forms that can be gradually mobilized, allowing it to act as a slow-release soil amendment [15]. All these properties may confer hydrochar a greater potential to influence soil biochemistry and microbial functioning. Current evidence suggests that hydrochar may stimulate short-term microbial activity and influence the transformation of SOM through mechanisms beyond simple nutrient supply [16,17]. Its relatively large soluble organic C fraction and reactive surface chemistry can influence soil microbial processes by providing readily available substrates and modifying the microenvironment at the soil–char interface, potentially stimulating microbial activity, inducing priming-like effects, and driving shifts in microbial community metabolism [13,18,19,20]. However, this same labile fraction could initially induce N deficiency through microbially mediated N immobilization [21]. Such responses appear to be highly dependent on factors such as amendment dose, soil type, moisture regime, and feedstock origin.
Whereas the dynamics of C and N in soils amended with biochar have been widely studied [22,23,24,25], our understanding of hydrochar–soil interactions, particularly in the short to medium term, remains limited [17,18,26]. Moreover, few studies have examined the evolution of the C and N pools while assessing changes in organic C quality and microbial responses under different moisture conditions and plant growth [18,20,27]. Therefore, understanding the short-term mechanisms governing C and N transformations in hydrochar-amended soils is crucial to elucidate their role in early-stage soil biochemical processes and to guide the sustainable use of this amendment in agricultural systems.
In a previous study, we produced and chemically characterized a hydrochar derived from free-range chicken manure through HTC [28]. It is characterized by low total organic C (TOC) (5.86%), N (0.47%), and overall nutrient contents, yet it exhibited a favorable balance between plant-available, rapidly released N and more recalcitrant Norg forms. Together with its low heavy metal concentrations and low phytotoxic potential, this balanced N composition makes it suitable as a medium- to long-term soil amendment [28]. This hydrochar also contains relatively high concentrations of dissolved organic C (DOC; 3.48 g kg−1, representing 5.9% of TOC) and dissolved organic N (DON; 0.54 g kg−1, 11.5% of total N), supporting the hypothesis that, despite its modest nutrient content, this material could influence soil microbial activity and short-term C and N dynamics through the release of soluble organic compounds.
In order to test this hypothesis, we performed a short-term (77 days) greenhouse pot experiment using a Cambisol cultivated with sunflower (Helianthus annuus L.) to evaluate hydrochar effects under a planted soil system. To contextualize the effects of hydrochar, the impacts of two doses (3.25 and 6.5 t ha−1) were compared with those caused by equivalent NPK mineral fertilization rates (matched to the same N input). Given the increasing relevance of drought stress under climate change scenarios, a well-irrigated (WI) treatment and a water-deficit (WD) treatment were implemented to evaluate how soil moisture modulates hydrochar-induced effects on C and N dynamics and microbial composition and activity. The main objectives of this study were therefore to the following:
- (i)
- assess the short-term evolution of soil physical and chemical properties (pH, EC, and WHC) and the dynamics of the C and N pools, including their soluble fractions (DOC and DON);
- (ii)
- evaluate changes in SOC quality through solid-state 13C nuclear magnetic resonance (NMR) spectroscopy at the beginning and after 77 days, including the assessment of the alkyl C/O-alkyl C degradation index;
- (iii)
- investigate the effects of hydrochar on soil microbial abundance and activity, including enzymatic (dehydrogenase, β-glucosidase, acid phosphomonoesterase and phenol oxidase) and respiratory (basal and substrate-induced) responses.
We hypothesized that despite its relatively low C and nutrient contents, hydrochar can transiently enhance microbial activity and promote C and N turnover, potentially to a greater extent through indirect, biologically mediated mechanisms. These responses are expected to be further modulated by application rate and soil moisture availability and to differ from those promoted by MF. Thus, this study aims to provide new insights into the short-term interactions between hydrochar, soil C and N dynamics, and microbial functioning under contrasting irrigation regimes, with particular emphasis on mineralization processes, potential indications of priming, and their early implications for C sequestration.
2. Materials and Methods
2.1. Characteristics of the Hydrochar and Soil
The hydrochar utilized was provided by the Leibniz-Institut für Agrartechnik und Bioökonomie e.V (ATB), Potsdam-Bornim (Germany). Its production followed the technical specifications and conditions previously described by Moreno-Racero et al. [28]. The selected feedstock, chicken manure, underwent HTC at a controlled heating rate of 2 °C min−1, reaching 250 °C with a residence time of 30 min. Upon completion of the HTC process, the hydrochar was stored in sealed plastic bags until subsequent physical and chemical characterization and its use in the pot experiment. In our previous study [28], both the feedstock and the resulting hydrochar were thoroughly chemically characterized. For convenience, the most relevant physical and chemical properties of the hydrochar are summarized in Table S1. The soil employed in the pot experiment was collected from the Sierra de Aznalcóllar (Seville, southern Spain; 37°29′34.6″ N-6°20′43.8″ W) and classified as a Cambisol according to the IUSS Working Group WRB (2014). The soil has a sandy loam texture, consisting of 17.0% fine sand, 40.8% sand, 26.0% silt, and 16.2% clay. It has a pH of 7.83, an electrical conductivity (EC) of 245 µS cm−1, and a water holding capacity (WHC) of 58.7%. The soil total organic C (TOC), inorganic carbon (IC), and organic nitrogen (Norg) contents are 59.5, 1.7, and 6.1 g kg−1, respectively. DOC and DON contents are 1.08 and 0.12 g kg−1, respectively. Composite soil samples were obtained by combining subsamples from three sites. Litter and vegetation were manually removed before sampling the upper 10 cm of soil. After drying at 40 °C and further manual removal of remaining plant material, the soil was sieved (<2 mm) and stored for subsequent analysis and experimental use.
2.2. Experimental Conditions and Sampling Procedures
A greenhouse pot experiment was conducted at the ‘Instituto de la Grasa’ (CSIC) in Seville, Spain, over a 77-day period from 6 June to 22 August 2022. Square plastic pots measuring 20 cm on each side and with a height of 27 cm were used for plant cultivation. The pots were filled with 5 kg of soil, and the fertilization treatments were applied prior to sowing. Hydrochar-based treatments were applied on the topsoil and then mixed with the upper 5 cm at doses of 3.25 and 6.5 t ha−1, designated as HC-3.25 and HC-6.5, respectively. These doses were selected to reflect realistic and agronomically relevant application rates, avoiding excessive inputs, and were supported by preliminary experiments conducted in our previous work [28]. For clarity and to facilitate reproducibility in pot-based systems, they correspond to 2.35 and 4.69 g kg−1 of dry soil. In terms of organic C input, this represents additions of 190.5 and 381.0 kg C ha−1 (equivalent to 0.14 and 0.28 g C kg−1 of dry soil). For comparative purposes, commercial MF treatments of Nitrogen-Phosphorus-Potassium (NPK; 12-8-16) were included, ensuring that the total N application was equivalent to that of the hydrochar-amended soils (NPK-3.25 and NPK-6.5, with N applications of 15.18 and 30.36 kg N ha−1, corresponding to 11 and 22 mg N kg−1 of dry soil, respectively). Additional information on the MF, including its composition and nutrient forms, is provided in Table S2. Control pots with untreated soils were included and designated as CTR. The application and incorporation of treatments within the topsoil were designed to reflect common agricultural practices and to ensure consistency with the sampling strategy focusing on the most biologically active soil layer. This approach is also consistent with the agronomic framework of the study and the definition of application rates in area-based units (t ha−1).
The plant selected for our studies was sunflower (Helianthus annuus L.), with one plant grown per pot for 77 days in a greenhouse under natural daylight, with a light flux between 200 μmol m−2 s−1 (minimum) and 1000 μmol m−2 s−1 (maximum). Temperature control was maintained from 16 to 35 °C (±3 °C), and relative humidity was regulated between 30% and 60%. To achieve uniform light and environmental conditions for all plants throughout the experiment, the trays were rotated daily in a clockwise direction. The pots were subjected to two distinct irrigation regimes, with one group receiving 60% of the maximum soil WHC, simulating well-irrigated (WI) conditions, whereas the other received 30%, representing moderate water-deficit (WD) conditions. Irrigation was performed both manually and automatically on a daily basis, with water additions adjusted based on gravimetric measurements of pot weight to maintain the target soil water content. Accordingly, four biological replicates (n = 4) were established for each combination of treatment and irrigation condition (Figure S1), resulting in a total of 40 pots (5 treatments × 2 irrigation conditions × 4 replicates).
For physical, chemical, and microbiological analysis, soil samples were collected from the top 10 cm of each pot using a 3 cm diameter polyethylene corer. Physical and chemical analysis were performed at the beginning and at the end of the cultivation period (0 and 77 days), whereas microbiological analyses were conducted only at the end. To avoid disturbance or removal of treatments during initial sampling, parallel pots were established under identical conditions to permit day-0 sampling without compromising the experimental integrity.
Sampling at this depth (corresponding to the upper portion of the A horizon) was selected to capture the response of the most biologically active soil layer, while avoiding deeper sampling at 77 days that could disturb the root system and introduce fresh organic inputs into the soil. Soil sampling at 77 days was performed immediately prior to harvest to preserve soil structure and avoid altering experimental conditions or the interpretation of results. Sampling was conducted consistently in all pots, targeting an intermediate zone between the centrally positioned plant stem and the pot wall at a similar distance. This approach minimized potential edge effects and avoided zones with atypical root density or moisture distribution. Notably, no evidence of root confinement stress was observed during the experiment. Root systems showed normal development without fully occupying the pot volume, and no difficulties were encountered during soil sampling due to root interference. Moreover, the absence of visible root material in the samples suggests minimal disturbance or bias associated with root distribution, with no apparent impact on the results or their interpretation.
After harvest, plant material was collected for complementary analyses beyond the scope of the present study; therefore, plant performance results are not included here.
Soil samples for physical and chemical analyses were dried at 40 °C for 48 h, whereas those intended for microbiological analyses were stored at −20 °C to preserve their integrity. For genomic DNA extraction, a subsample was freeze-dried. All results are expressed based on soil dry weight (DW), after determining the water content of each sample.
2.3. Soil Analysis
2.3.1. Physical and Chemical Parameters
The pH of the samples was measured in a 1:4 (w/v) soil-to-deionized water suspension using a Crison Basic 20 pH-meter (Crison Instruments, Barcelone, Spain). EC was subsequently measured in the filtered supernatant with a Crison Basic 30+ EC-meter (Crison, Barcelone, Spain). The WHC was assessed by Veihmeyer and Hendrickson [29]. Briefly, 6 g of each sample were placed on a Whatman No. 2 filter paper inside a glass funnel and saturated with distilled water. After a 2 h drainage period, the samples were weighed, and WHC was expressed as the percentage of retained water relative to the dry DW of the soil.
2.3.2. Carbon and Nitrogen Contents in Treated Soils
TOC, IC and Norg contents were directly determined in dried soil samples using a Primacs SNC100 elemental analyzer (SKALAR, Breda, The Netherlands) and a Shimadzu TOC-V analyzer (Shimadzu, Kyoto, Japan). DOC and DON concentrations were determined in 0.5 M K2SO4 extracts obtained at a soil-to-extractant ratio of 1:4 (w:v). The suspensions were shaken for 30 min, filtered through Whatman No. 2 filter paper, and analyzed using a Shimadzu TOC-V analyzer (Shimadzu, Kyoto, Japan). To normalize the DOC and DON contents and enable comparison between treatments, the ratios of DOC to TOC and DON to total Norg in the soil at the corresponding sampling time were calculated.
2.3.3. Solid-State 13C Nuclear Magnetic Resonance Spectroscopy
Solid-state 13C NMR spectra were acquired from soil samples collected at the beginning (0 days) and at the end (77 days) of the experiment using a Bruker Avance III HD 400 MHz WB spectrometer (Bruker, Biospin GmbH & Co. KG, Ettlingen, Germany) equipped with a triple-resonance broadband probe. Before solid-state NMR spectroscopy, both treated and untreated soil samples were first decarbonated with 10% HCl and subsequently demineralized through four consecutive treatments with 10% (w/w) hydrofluoric acid (HF) to enrich the organic matter (OM) content. After removal of the supernatant, the solid residue was washed repeatedly with distilled water until the rinse solution reached a pH above 5 and then freeze-dried [30]. For each treatment, one composite sample was analyzed, obtained by pooling the four replicate samples corresponding to that treatment. Samples were packed into 4 mm (outer diameter) zirconia rotors with KEL-F caps. Spectra were recorded under cross-polarization magic-angle spinning (CP–MAS) conditions at a spinning rate of 14 kHz. To minimize spin modulation of the Hartmann–Hahn matching conditions, a ramped 1H pulse was applied during a contact time of 1 ms. Preliminary tests confirmed that a pulse delay of 1 s was sufficient to avoid signal saturation. Between 80,000 and 120,000 scans were accumulated for each spectrum, applying a line broadening of 50–100 Hz. Spectral processing and quantification were carried out according to Knicker et al. [31], using MestReNova 10 (Mestrelab Research, Santiago de Compostela, Spain). The 13C intensity distribution was determined by integrating the following chemical shift regions: alkyl C (0–45 ppm); N-alkyl/methoxyl C (45–60 ppm); O-alkyl C (60–110 ppm); aryl C (110–140 ppm); O/N-aryl C (140–160 ppm); carboxyl C (160–185 ppm); and carbonyl C (185–225 ppm). At the applied spinning rate, incomplete averaging of the chemical shift anisotropy of crystalline domains led to the occurrence of spinning sidebands symmetrically located around the parent signals, typically between 250–300 ppm and –50–0 ppm. In hydrochar-amended soils, these sidebands are primarily associated with aromatic C signals; therefore, their contribution was included in the integration of the aromatic C region [31]. The chemical shift scale was referenced externally using glycine (COOH at 176.08 ppm), with tetramethylsilane (0 ppm) as the calibration standard.
In addition, the degradation index proposed by Baldock et al. [32] was calculated from the relative intensity of the 13C chemical shift regions assigned to O-alkyl and alkyl C to assess changes in OM quality during the incubation.
2.4. Soil Microbial and Enzymatic Analyses
Colony forming units (CFUs) of predominantly culturable aerobic heterotrophic bacteria were quantified using serial dilution plating. Briefly, 3 g of fresh soil was suspended in 27 mL of Luria–Bertani (LB) medium (pH 7.5; containing 10 g L−1 peptone, 10 g L−1 NaCl, and 5 g L−1 yeast extract) and serially diluted (10−1–10−5). Aliquots (0.1 mL) from appropriate dilutions were spread on LB agar (1.5%) plates (n = 4) and incubated at 25 °C for 48 h. Plates containing 30–300 colonies were selected for counting. The content of microbial biomass C (MBC) and N (MBN), which provides an indication of the active microbial community in soil, was quantified using the chloroform fumigation–extraction method modified by Gregorich et al. [33]. The Shimadzu TOC-V analyzer (Shimadzu, Kyoto, Japan) was used to measure the concentrations of C and N in the extract, and the extraction efficiency coefficient from Vance et al. [34] was employed to calculate MBC and MBN based on the difference in soluble C and N between the fumigated and unfumigated soils.
For qPCR analysis, soil genomic DNA was isolated with the DNeasy PowerSoil Pro Kit (QIAGEN, Hilden, Germany) and measured using a Nanodrop ND-1000 UV-vis spectrophotometer (Thermo, Wilmington, DE, USA).
Primers targeting bacterial 16S rDNA and fungal ITS sequences were used to develop a real-time SYBR® Green PCR assay for estimating the total abundance of bacteria and fungi. We used the universal primer pairs 341-F (5′-CCTACGGGAGGCAGCAG-3′) and 515-R (5′-ATTCCGCGGCTGGCA-3′) [35] to amplify 16S rDNA and ITS5-F (5′- TCCTCCGCTTATTGATATGC-3′) and ITS4-R (5′-GGAAGTAAAAGTCGTAACAAGG -3′) [36] for ITS regions. The qPCR was performed in reaction mixtures (10 µL) with 5 µL of Universal SYBR® Green SuperMix (BIO-RAD, Hercules, CA, USA), 0.5 µM of each primer and 2 µL of diluted DNA extracts using a CFX Connect Real-Time Detection System (BIO-RAD, Hercules, CA, USA). Triplicate qPCR measurements for each sample were conducted using the cycling procedures outlined in Table S3.
Standard curves were generated from serial dilutions of a known amount of PCR product, which was amplified using the primer sets from soil genomic DNA pooled from multiple samples and subsequently purified from the agarose gel using ISOLATE II PCR and Gel Kit (BIOLINE, London, UK). In all runs, the R2 values of the standard curves were at least 0.99. Expected PCR product sizes for each amplicon were also verified on a 1.5% agarose gel and are indicated in Table S3.
The dehydrogenase activity (DHA) was determined according to Trevors [37], by incubating fresh soil samples for 20 h with 2-(4-Iodophenyl)-3-(4-nitrophenyl)-5-phenyl-2H-tetrazolium chloride (p-Iodonitrotetrazolium chloride; INT). The produced 1-(4-Iodophenyl)-5-(4-nitrophenyl)-3-phenylformazan (iodonitrotetrazolium formazan; INTF) was then measured spectrophotometrically at 490 nm.
The β-glucosidase activity (BGA) was assessed following the method of Tabatabai [38], where fresh soil is incubated for 1 h at 37 °C with p-nitrophenyl-β-D-glucopyranoside. After the incubation, the p-nitrophenol (PNP) produced was quantified spectrophotometrically at 400 nm.
At the same absorbance, acid phosphomonoesterase activity (AcPA) was measured following the procedure of Tabatabai and Bremner [39], by quantifying the release of PNP from p-nitrophenyl phosphate after incubating fresh soil with modified universal buffer (MUB) at pH 6.5 for 1 h at 37 °C.
Phenol oxidase activity (POA) was determined following the method of Pind et al. [40], with minor modifications. Briefly, 0.5 g of fresh soil (<2 mm) was mixed with 3 mL of 50 mM sodium acetate buffer (pH 5.0) and 2 mL of 10 mM L-3,4-dihydroxyphenylalanine (L-DOPA) solution as substrate. Samples were incubated at 25 °C for 30 min on a shaker (100 rpm), after which the reaction was stopped by centrifugation at 5 °C for 5 min (12,000 rpm). The absorbance of the supernatant was measured at 475 nm to quantify the oxidation of L-DOPA to dopachrome (ε = 3.7 × 10³ M−1 cm−1). Enzyme activity was expressed as µg dopachrome g−1 dry soil h−1.
Potential substrate-induced respiration (SIR) and basal respiration (BR) were measured using the MicroResp™ method (James Hutton Ltd., Aberdeen, UK), which employs a microplate system to assess the catabolic activity of soil samples [41]. Water and three C substrates recommended in the protocol—D-glucose, N-acetyl-glucosamine (NAG), and L-cysteine—were used. Before the MicroResp™ assay, the samples were thawed and pre-incubated at 25 °C for 24 h. Substrates were prepared at a concentration of 30 mg g−1 soil water, and 25-μL aliquots were pipetted into each deep well containing the soil sample. To prevent the detection of CO2 emissions from non-microbial, abiotic chemical reactions, the plates were left to rest in the dark for 30 min before sealing [42]. The absorbance of the colorimetric gel detector plate was measured at 570 nm before incubation, after which the plate was sealed to the deep-well plate. The indicator plate was prepared according to the manufacturer’s instructions. The MicroResp™ unit was then tightly sealed and incubated at 25 °C for 5 h. After incubation, the absorbance (A570) of the gel detector plate was measured once more, and respiration rates (μg CO2–C g−1 h−1) were calculated according to a standard curve. Results are reported on a soil DW basis following determination of sample water content.
2.5. Statistical Analysis
Statistical analyses were conducted using STATGRAPHICS Centurion XIX software (version 19.6.03; StatPoint Technologies, Warrenton, VA, USA). Data normality was assessed using the Shapiro–Wilk test. Normally distributed variables were analyzed using one-way ANOVA, followed by Tukey’s Honestly Significant Difference test (HSD) with Bonferroni correction. Non-normally distributed variables were analyzed using the Kruskal–Wallis test, followed by Dunn’s post hoc test with Bonferroni-adjusted significance levels. Two-way ANOVA was used to assess the effects of irrigation regime, hydrochar application rate, and their interaction. Temporal changes in key variables related to C and N dynamics were also assessed by calculating the differences between initial and final sampling points (ΔTOC0–77d and ΔN0–77d, expressed in g kg−1), which were analyzed using the same statistical framework.
3. Results and Discussion
3.1. Changes in Soil Chemical and Physical Parameters
The application of hydrochar had no effect on soil pH at the beginning of the experiment, which was expected given the similar pH of the material (pH = 7.92, Table S1) and the soil (pH = 7.83, Table 1). Comparable observations have been reported in slightly alkaline soils amended with hydrochar at moderate application rates [16,43]. A significant effect on pH was observed only for the MF treatments, which decreased from 7.83 to 7.73 and 7.59 for NPK-3.25 and NPK-6.5, respectively. Nevertheless, the application of hydrochar and MF slightly but significantly increased the soil EC, with a much stronger effect for the MF treatments compared to the hydrochar-amended soils (Table 1). No significant differences among treatments were detected for WHC at the onset of the experiment (Table 1), despite the relatively low WHC of the hydrochar (32%, Table S1).
Table 1.
Soil pH, electrical conductivity (EC, µS cm−1), and water-holding capacity (WHC, %) of the treated soils under well-irrigated and water-deficit conditions, measured immediately after treatment application (day 0) and at the end of the experiment (77 days). Values represent the mean (n = 4) ± standard error (SE). Different letters within columns indicate significant differences according to Tukey’s HSD or Dunn’s post hoc test, as appropriate. Effects of irrigation regime, treatment, and their interaction were assessed by two-way ANOVA. Levels of significance: p > 0.05 (“ns”, not significant differences); * p ≤ 0.05. ** p ≤ 0.01. *** p ≤ 0.001.
After 77 days, pH values remained similar to those recorded at day 0 in both the CTR and hydrochar-treated soils under both irrigation regimes, whereas a slight increase was observed in the NPK-treated soils compared to their initial values. This trend likely reflects the progressive removal of fertilizer-derived acidifying species through plant uptake and/or leaching, leading to a partial neutralization of the initial acidification induced by MF application. A comparable pattern was observed for EC, which slightly decreased after 77 days in the MF treatments under both irrigation conditions relative to their initial values.
WHC remained unchanged in the HC-6.5 treatment after 77 days, whereas a slight decrease was observed in the other soils (two-way ANOVA, treatment effect, p < 0.05; Table S4). Given the low porosity of the hydrochar, this suggests that hydrochar addition may have indirectly contributed to maintaining soil structural integrity and water retention, possibly through enhanced microbial activity and root–soil interactions [3,44,45].
3.2. Soil Carbon and Nitrogen Dynamics
No significant differences in TOC, IC, or DOC contents were observed among treatments at the beginning of the experiment (Table 2). This was expected given the low TOC content of this hydrochar (5.86%, Table S1), although a slight increase in DOC could have been anticipated considering its soluble organic C fraction (3.48 g kg−1, Table S1).
Table 2.
Analysis of soil C at the beginning of cultivation (0 days) and at the end of cultivation (77 days): Total Organic C (TOC), Inorganic C (IC), Dissolved Organic C (DOC), DOC:TOC Ratio (DOC:TOC), and TOC difference between day 0 and day 77 (ΔTOC0–77d). Values are means (n = 4) ± SE. Different letters within columns indicate significant differences according to Tukey’s HSD or Dunn’s post hoc test, as appropriate. Effects of irrigation regime, treatment, and their interaction were assessed by two-way ANOVA. Levels of significance: p > 0.05 (“ns”, not significant differences); * p ≤ 0.05. ** p ≤ 0.01. *** p ≤ 0.001.
After 77 days under WI conditions, HC-6.5 showed the strongest decline in TOC (−21%) among treatments, resulting in a final TOC content of 47.4 g kg−1 and higher DOC concentrations (0.28 g kg−1) compared to the MF and CTR treatments (Table 2). Consequently, HC-6.5 displayed a significantly higher DOC:TOC ratio (0.6%) than NPKs and CTR. These results may indicate an enhanced organic C turnover and a shift toward more labile C forms, reflecting increased decomposition dynamics in the HC-6.5 treatment under this irrigation regime, or a potential hydrochar-induced priming effect [18,27]. This effect may reflect increased degradation of either native SOC (positive priming) or the hydrochar itself (negative priming) [46]. Considering the marked 21% decline of TOC observed in HC-6.5 (ΔTOC0–77d = 12.6 g kg−1), which is substantially greater than the C input from hydrochar (0.28 g C kg−1; Section 2.2), the results may suggest a positive priming effect through stimulation of native SOC mineralization following hydrochar addition. The low TOC content observed in NPK-6.5 may suggest a similar process, despite the absence of a significant increase of DOC levels or the DOC:TOC ratio. In line with previous observations for manure-based biochar, positive priming effects have been shown to stimulate the mineralization of native SOC even within 2–3 weeks after application [24]. Although no increase in DOC concentration was detected in the HC-6.5 treatment immediately after application, changes in dissolved OM (DOM) composition cannot be ruled out [25,47]. Ling et al. [25] similarly reported, in a 28-day incubation experiment, that biochar application did not enhance DOC content but altered DOM quality, which in turn promoted greater mineralization of native SOC. A shift in C lability was also observed for the HC-3.25 treatment under WI conditions, as it exhibited DOC contents comparable to HC-6.5 and a significantly higher DOC:TOC than the CTR soil after 77 days. However, HC-3.25 maintained the highest TOC content, suggesting that the increase in soluble C did not translate into a net loss of TOC (ΔTOC0–77d; 0.1 g kg−1), possibly reflecting limited mineralization of these labile fractions at the lower hydrochar dose.
As indicated in Section 2.2, methodological artifacts such as root confinement or edge effects are not expected to have significantly influenced the observed TOC decline in the HC-6.5 treatment. Nevertheless, the potential priming effect inferred here should be interpreted with caution, as it may reflect a transient response rather than a stabilized shift in C mineralization [48]. Further studies, including isotopic approaches, would help to better elucidate the underlying mechanisms and their implications for long-term C sequestration [48,49].
Under WD conditions, no significant differences were observed among treatments for any of the analyzed parameters after 77 days. Although HC-6.5 exhibited the lowest TOC content and the greatest reduction of TOC (ΔTOC0–77d; 5.4 g kg−1) over 77 days, these differences were not statistically significant compared to the other treatments (Table 2). Nevertheless, the pattern was consistent with that observed under WI conditions, suggesting that hydrochar addition may have promoted similar C transformation processes under WD, albeit at a lower intensity due to the reduced microbial activity and thus turnover of SOM under WD [50]. A two-way ANOVA revealed that both treatment and irrigation type had a significant effect on DOC content and the DOC:TOC ratio after 77 days (Table S4). Subsequent variance analysis (one-way ANOVA), considering treatments as a whole (regardless of irrigation), indicated that only the HC-6.5 treatment exhibited significantly higher DOC:TOC (p = 0.037) values than the CTR.
Regarding Norg and DON, no significant differences were observed between treatments at the beginning of the experiment (Table 3).
Table 3.
Analysis of soil N at the beginning of cultivation (0 days) and at the end of cultivation (77 days): Organic Nitrogen (Norg), Dissolved Organic N (DON), DON:N Ratio (DON:N), and N difference between day 0 and day 77 (ΔN0–77d). Values are means (n = 4) ± SE. Different letters within columns indicate significant differences according to Tukey’s HSD or Dunn’s post hoc test, as appropriate. Effects of irrigation regime, treatment, and their interaction were assessed by two-way ANOVA. Levels of significance: p > 0.05 (“ns”, not significant differences); * p ≤ 0.05.
After 77 days under WI conditions, HC-6.5 showed a significantly lower Norg content (4.7 g kg−1) than the CTR (6.0 g kg−1), representing a 22% decrease. This corresponded to a 24% reduction in Norg in HC-6.5–treated soil over the experimental period (ΔN0–77d = 1.5 g kg−1), although this change was not statistically significant compared with CTR. However, consistent with the trend observed for C dynamics and the increase in more soluble fractions, HC-6.5 was the only treatment exhibiting a higher DON:N ratio (1.38%) than CTR (0.71%) and even than its MF counterpart (NPK-6.5; 0.79%). These results point to an enhanced loss or mobilization of N under WI conditions [27]. Short-term 15N tracing experiments have shown that biochar can accelerate soil N transformations by increasing gross mineralization and nitrification, with transfer from recalcitrant to labile Norg pools [23].
The lower water availability in soils under the WD regime did not significantly affect any of the N-related parameters. Likewise, as observed for soil C, the pattern of N dynamics detected under WI conditions was not replicated under WD, indicating that hydrochar-induced responses in soil N processes were less pronounced under water-limited conditions.
3.3. Solid-State 13C NMR Analysis of Soil Organic Carbon Composition
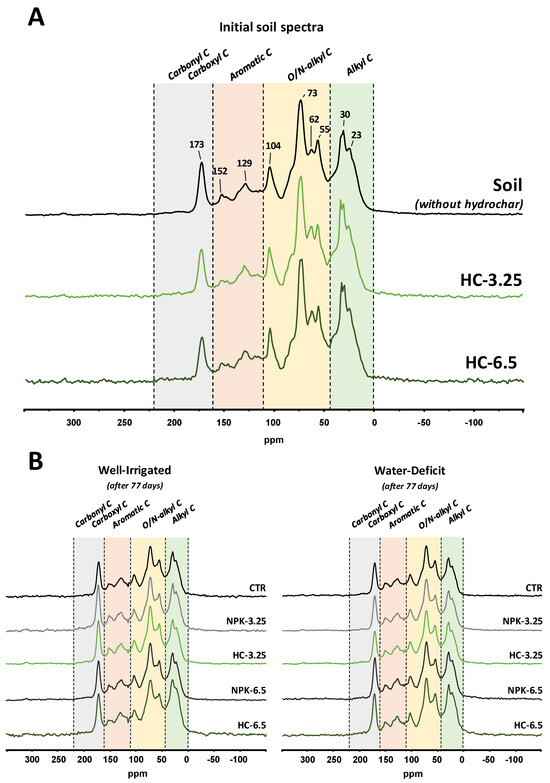
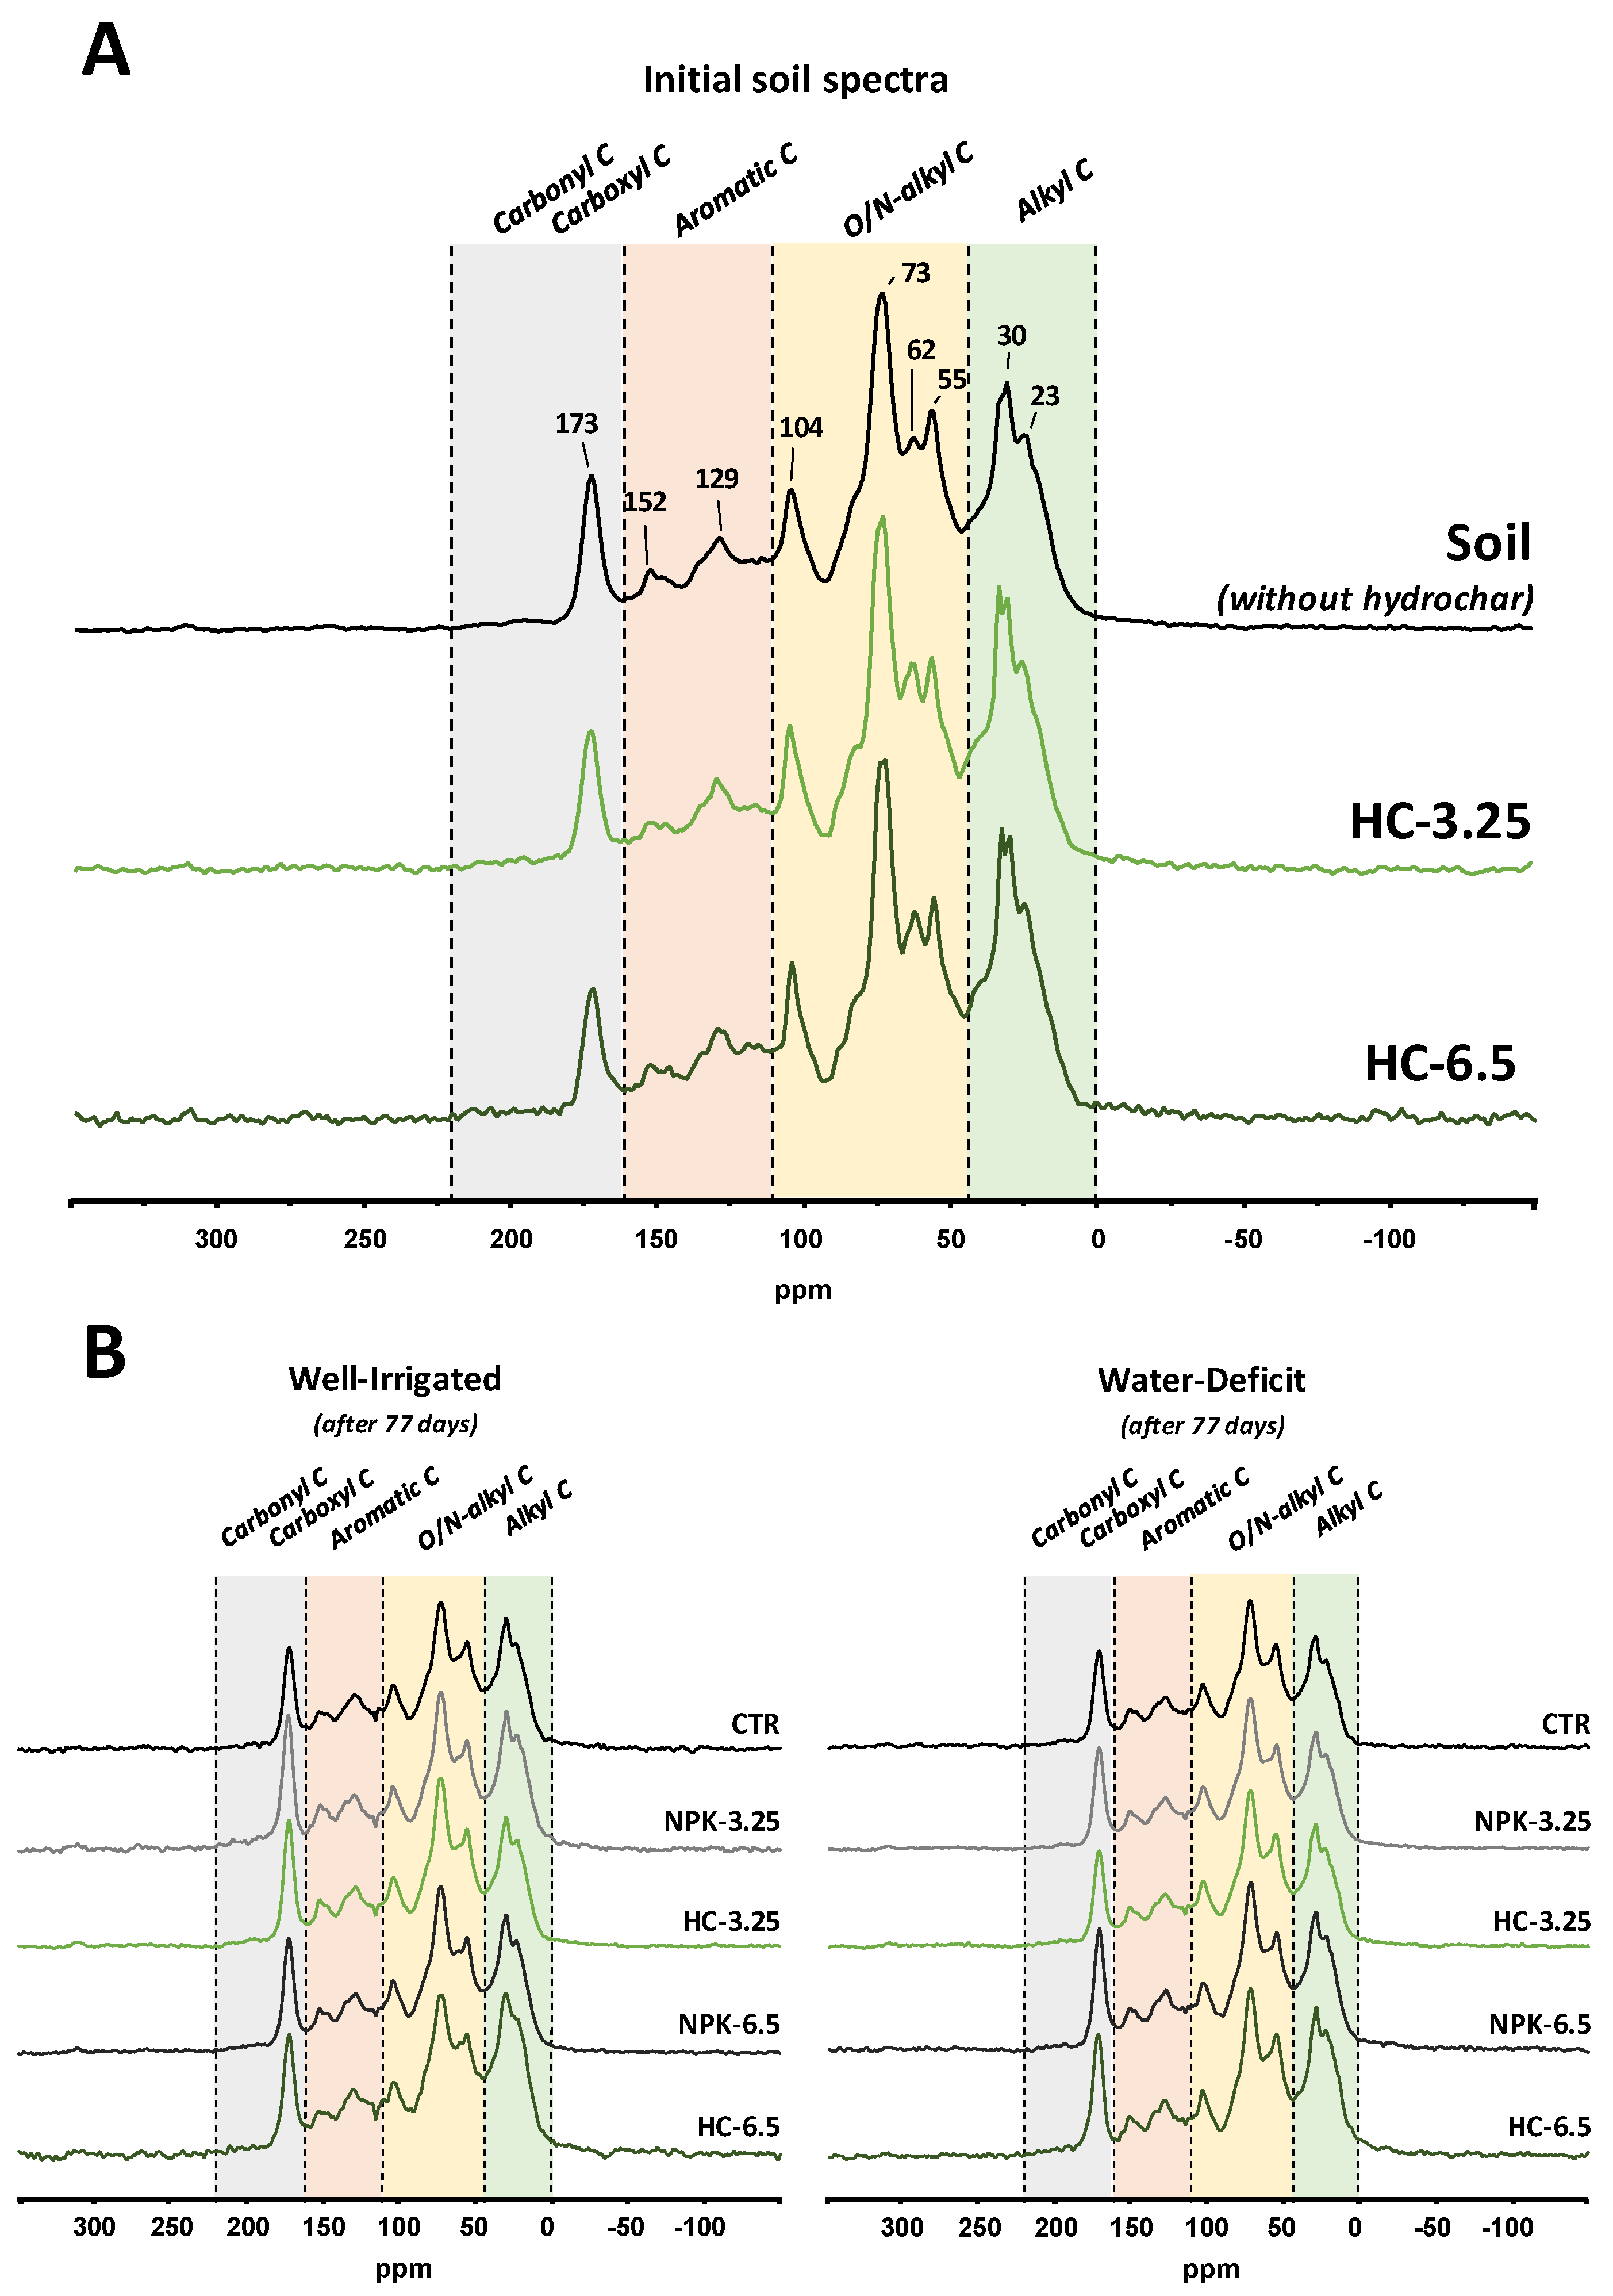
At the beginning of the experiment, the soil without hydrochar exhibited a SOC composition typical for Cambisols from the sampling area [51], dominated by O-alkyl C (36.1%), followed by alkyl C (26.9%), aromatic C (aryl + phenolic; 16.6%), N-alkyl/methoxyl C (12.3%), carboxyl C (7.3%), and a minor contribution of carbonyl C (0.9%) (Table 4, Figure 1A). This distribution is consistent with SOC which is mainly derived from plant residues and microbially processed OM, where O-alkyl C reflects carbohydrate-rich constituents mostly from plants and carboxyl C and alkyl C derives mainly from peptides and lipids in microbial necromass. Plant-derived lignin components contribute to the aromatic C and the methoxyl C region.
Table 4.
Relative intensity distribution (%) of solid-state 13C NMR spectra and degradation index of soils without hydrochar (CTR and NPK) and after hydrochar-amendment at day 0 and after 77 days of cultivation under well-irrigated and water-deficit conditions.
Figure 1.
Solid-state 13C NMR spectra of soils at the beginning and after 77 days of cultivation under different water regimes. (A) Spectra of initial soils without and with amendment of hydrochar at doses of 3.25 and 6.5 t ha−1. (B) Spectra of soils after 77 days of cultivation under well-irrigated (left) and water-deficit (right) conditions; control soils (CTR), soils with mineral fertilization (NPK-3.25 and NPK-6.5), and hydrochar-amended soils (HC-3.25 and HC-6.5).
The application of hydrochar at the beginning of the experiment did not result in substantial changes in the composition of SOC (Table 4, Figure 1A). In particular, no increase in aromaticity was observed, despite the relatively high contribution of aryl and phenolic C (21.4% and 5.9%, respectively) reported for this hydrochar material [28]. Only a slight tendency toward higher alkyl C proportions was detected for hydrochar-amended soils, especially for those treated with the highest dose, which is consistent with the high alkyl C content of this hydrochar (40%) [28] (Table 4). The limited impact of hydrochar addition on SOC composition immediately after application is best explained by the relatively low TOC content of the hydrochar and its low application rate, resulting in a minor amendment of organic C to the soil.
After 77 days of cultivation (Figure 1B), changes in SOC composition were observed across all treatments and irrigation regimes. A generalized decline in the contribution of O-alkyl C was detected, accompanied by a relative increase of carboxyl C (Table 4). This pattern is commonly associated with the preferential decomposition of carbohydrate-rich substrates and the accumulation of more oxidized compounds during microbial processing [32]. Among treatments, HC-6.5 showed the most pronounced loss of O-alkyl C, with relative contributions of 30.3% and 30.6% under both WI and WD conditions, respectively.
Consistently, the alkyl C/O-alkyl C ratio, used as an index of SOC degradation [32], was highest for HC-6.5 (0.94) under both irrigation regimes (Table 4), indicating a more advanced degree of OM transformation relative to the other treatments.
Taken together, these results indicate that hydrochar addition at the highest dose promoted a more extensive transformation of SOC over the 77-day period.
3.4. Analysis of Soil Microbial Abundance
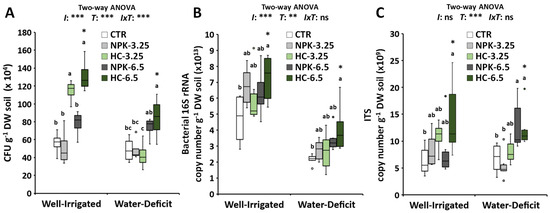
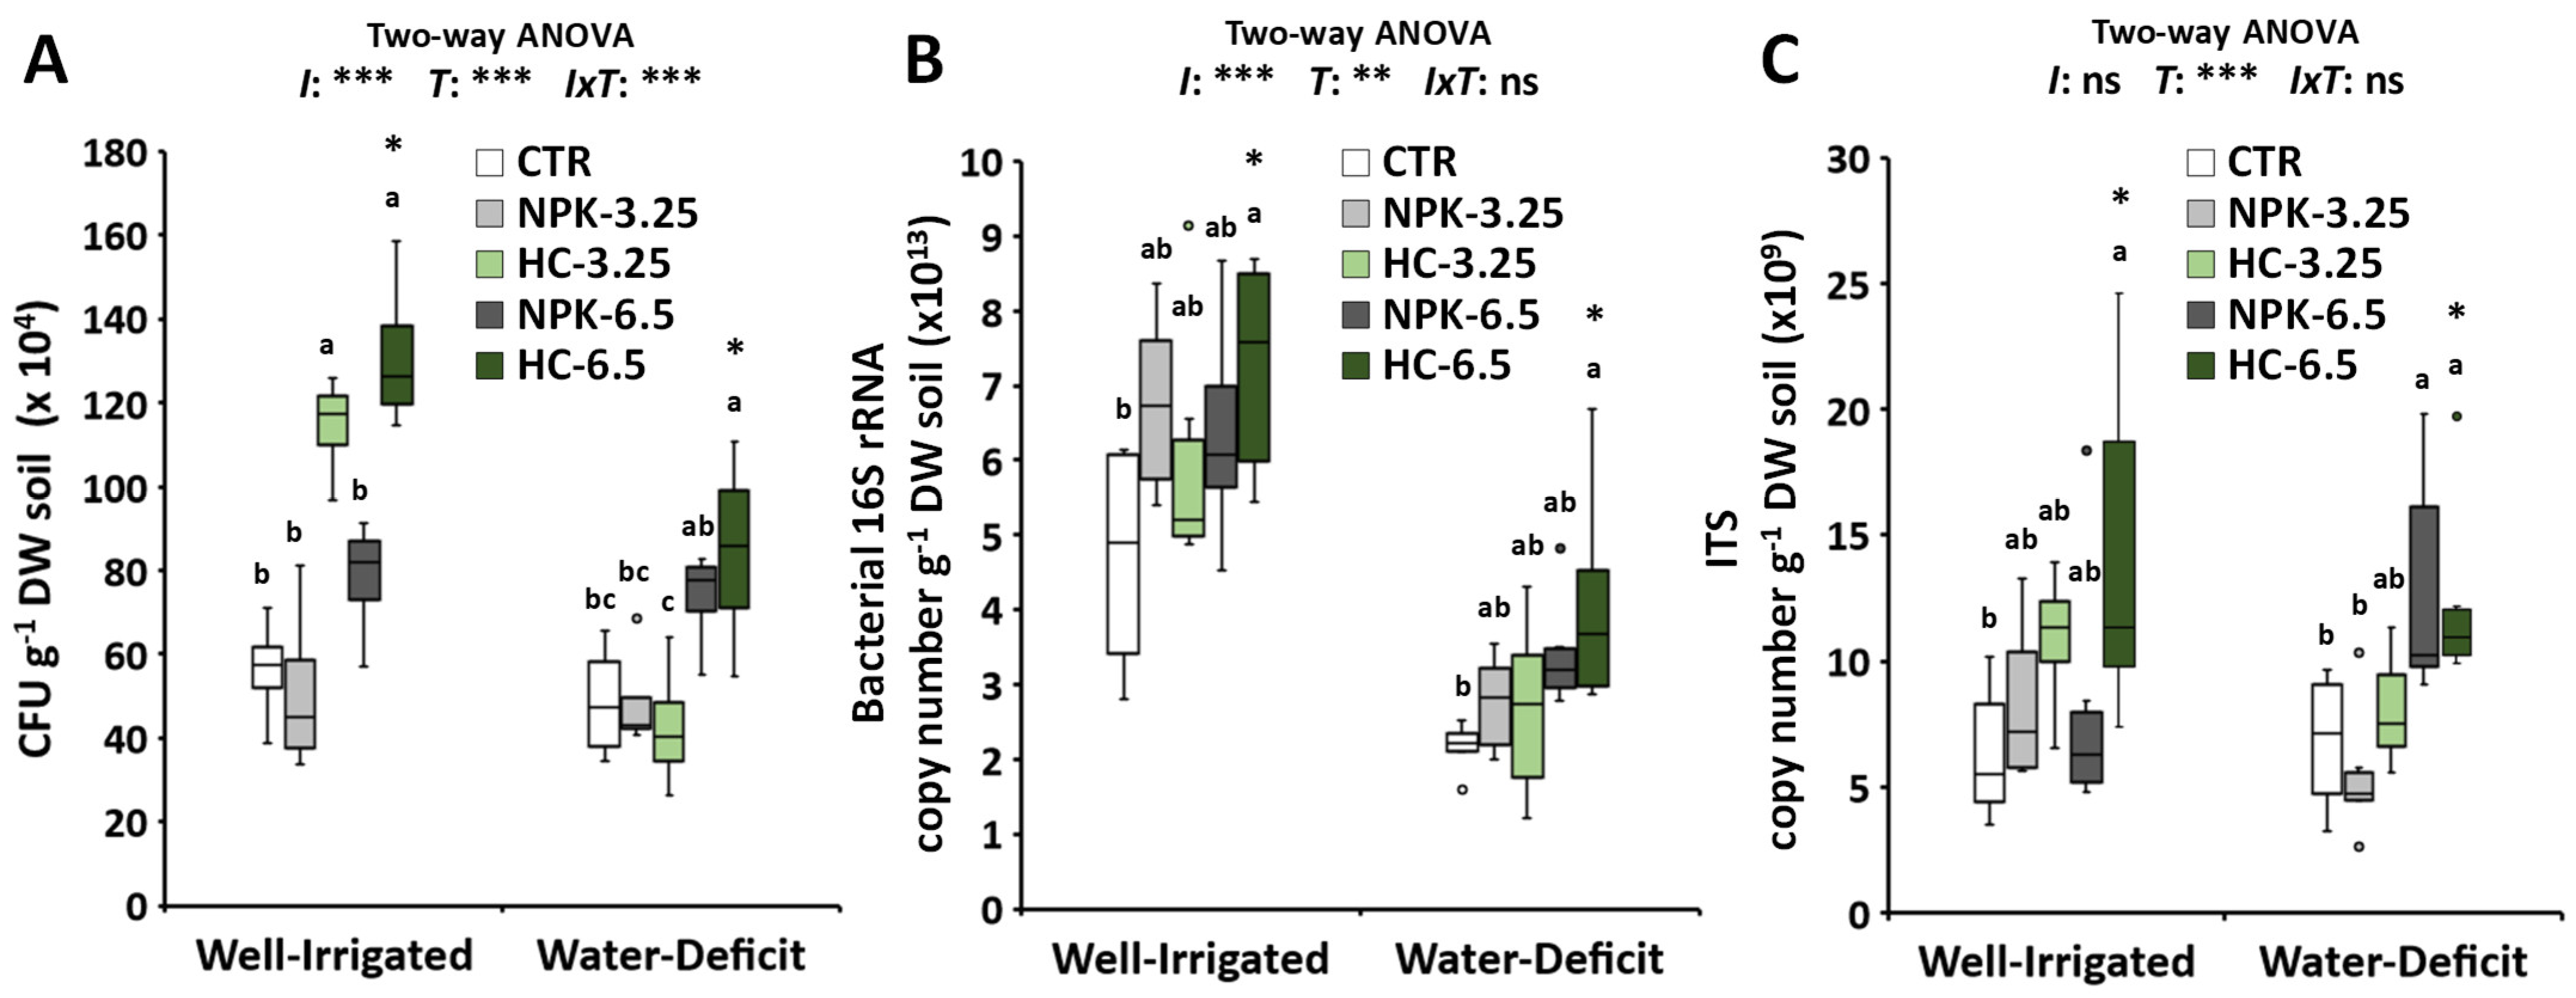
The CFU count analysis revealed that hydrochar-treated soils exhibited substantial increases in the abundance of predominantly culturable aerobic heterotrophic bacteria. Under WI conditions, CFU counts increased significantly by approximately 103–133% in the hydrochar treatments relative to the CTR, whereas under WD conditions a significant increase relative to the corresponding CTR was observed only for the HC-6.5 treatment (+73%) (Figure 2A). In contrast, none of the NPK treatments showed significant differences in CFU abundance relative to the CTR under either irrigation regime. Although explicit CFU responses to hydrochar are scarcely documented, several studies with biochar have observed enhanced microbial abundance [24,52,53], suggesting a potential association with this response.
Figure 2.
Microbial abundance in soil samples collected 77 days after soil treatment. (A) Colony Forming Units (CFU). (B) Bacterial 16S rRNA copies quantified by qPCR. (C) Fungal ITS copies quantified by qPCR. Boxplots represent the median (horizontal line), the interquartile range (boxes), and minimum and maximum values (whiskers) for each treatment (n = 4). Different letters indicate significant differences among treatments according to Tukey’s HSD post hoc test (p ≤ 0.05). Results of the two-way ANOVA evaluating the effects of irrigation regime, fertilization treatment, and their interaction are provided in Table S5. Levels of significance: p > 0.05 (“ns”, not significant differences); * p ≤ 0.05. ** p ≤ 0.01. *** p ≤ 0.001.
Quantification of total bacterial and fungal gene copy numbers by qPCR revealed that the HC-6.5 was the only treatment to show significantly higher abundances of both bacteria and fungi compared to CTR under both irrigation conditions (Figure 2B,C). Consistent with our findings, increased bacterial abundance determined through 16S rRNA gene-based analyses has also been reported in soils amended with hydrochar during short-term incubations [20,54]. However, whereas Yan et al. [20] reported a decline in fungal abundance, contrary to our findings, Watson et al. [54] observed an increase following hydrochar application based on ergosterol quantification. A similar trend of enhanced bacterial abundance accompanied by a reduction of fungal populations has been observed after biochar additions by Chen et al. [55], and Nie et al. [56]. Nevertheless, other studies with biochar have also reported overall increases in bacterial and/or fungal abundance using diverse analytical approaches [24,57,58].
The analysis of MBC and MBN, which provides an estimate of the active microbial biomass in soil, highlighted a strong effect of the irrigation regime on microbial abundance (Table 5). Under WI conditions, HC-6.5 and HC-3.25 showed the highest values, with only HC-3.25 exhibiting a significantly higher MBC than CTR. This trend is broadly consistent with the C dynamics and CFU results observed under WI conditions, where hydrochar treatments were characterized by higher DOC levels after 77 days and increased abundances of culturable aerobic heterotrophic bacteria. In relation to microbial biomass, there is empirical evidence that hydrochar amendments can increase soil MBC and MBN over short incubation periods [21,54].
Table 5.
Analysis of C and N in microbial biomass (MBC, MBN) and the activities of dehydrogenase (DHA), β-glucosidase (BGA), phosphomonoesterase (AcPA) and phenol oxidase (POA) in soils. Values are means (n = 4) ± SE. Different letters within columns indicate significant differences according to Tukey’s HSD or Dunn’s post hoc test, as appropriate. Effects of irrigation regime, treatment, and their interaction were assessed by two-way ANOVA. Levels of significance: p > 0.05 (“ns”, not significant differences); * p ≤ 0.05. ** p ≤ 0.01. *** p ≤ 0.001.
Under WD conditions, no clear pattern with respect to treatment was observed for either MBC or MBN. Both were negatively affected by reduced soil water availability (irrigation effect, p < 0.001; Table S4). Furthermore, the significant interaction between irrigation and treatment (IxT, p < 0.05; Table S4) suggests that hydrochar effects on microbial biomass abundance under WD are less pronounced and depend on the combined influence of dose and soil moisture.
Overall, these findings suggest that increases in microbial abundance in hydrochar-treated soils, particularly under WI conditions, could have a greater influence on relevant biochemical processes, potentially affecting C dynamics. Although TOC or DOC being the main sources of C and energy for microbial growth [59] did not increase immediately after application, it is possible that small amounts of readily available organic compounds within the hydrochar contributed to microbial activation [24]. Previous studies have shown that even trace concentrations of low-molecular-weight substrates, such as simple sugars, amino acids, or root exudates, can elicit rapid microbial responses and stimulate biomass accumulation [60,61]. In this context, the presence of minor fractions of water-soluble organic molecules in chars has been suggested to induce either apparent or real positive priming effects, despite their overall low C content [18,24]. In addition, alternative mechanisms may also contribute to the observed microbial growth responses. Although hydrochar application did not result in significant changes in bulk soil pH or WHC, localized effects cannot be excluded. The presence of fine hydrochar particles may create microscale pH heterogeneity or influence sorption–desorption processes, potentially affecting the accessibility of organic substrates and inorganic nutrients to microorganisms [62]. Furthermore, the relatively small particle size of hydrochar may promote microaggregation, thereby modifying the soil microenvironment and creating favorable conditions for microbial development independently of direct biostimulation [46,63]. The relative contribution of these mechanisms remains to be further elucidated. Moreover, increases in microbial abundance could potentially enhance N immobilization in soil [21], although no significant differences in MBN were observed between hydrochar-treated soils and the CTR. This process may temporarily reduce N availability for plants, with potential implications for nutrient management in agricultural systems, and could also influence N losses through leaching or gaseous emissions [21] (Table 5).
3.5. Analysis of Soil Microbial Activity
Under WI conditions, HC-6.5 was the only treatment leading to significantly higher DHA, AcPA, and POA activities relative to CTR, with increases of 47.2%, 37.6%, and 33.6%, respectively (Table 5). Comparable observations following biochar or hydrochar addition have been reported in previous studies [17,52,53,64], which is in agreement with a general stimulation of microbial oxidative and phosphatase processes after carbonaceous amendments. Conversely, both HC-6.5 and NPK-6.5 showed significant decreases of 49.3% and 45.4%, respectively, for BGA if compared to CTR. A similar reduction in BGA after char amendment has also been reported in previous studies [17,55,65]. This pattern suggests a functional shift from hydrolytic (BGA) toward oxidative pathways (POA). Such reallocation of enzymatic activity may indicate that microorganisms in hydrochar-amended soils invest more resources in the decomposition of complex organic substrates, consistent with the observed decrease in TOC and the increase of the DOC fractions. In contrast, the 14.4% decrease of POA in NPK-6.5 relative to CTR (and 35.9% relative to HC-6.5) suggests that this shift did not occur under MF treatments. This reinforces the notion that the response is specific to hydrochar amendment rather than nutrient input alone.
Enzymatic activities were generally reduced under WD conditions (Table 5 and Table S4), mirroring the lower microbial abundance detected under this irrigation regime and aligning with previous evidences that soil moisture limitation constrains microbial enzymatic activity [50].
Under WD conditions, and in comparison with the WI regime, HC-6.5 displayed an even greater increase in DHA (+68.8%) and POA (+62.7%) relative to CTR, highlighting the high metabolic activity of microbial communities in these soils. Conversely, BGA and AcPA activities under WD were not affected by any treatment. Thus, HC-6.5 again showed a persistent rise in POA relative to BGA. This pattern points towards a functional shift in microbial enzymatic activity from hydrolytic to oxidative pathways, reflecting changes in microbial resource allocation under hydrochar amendment [25].
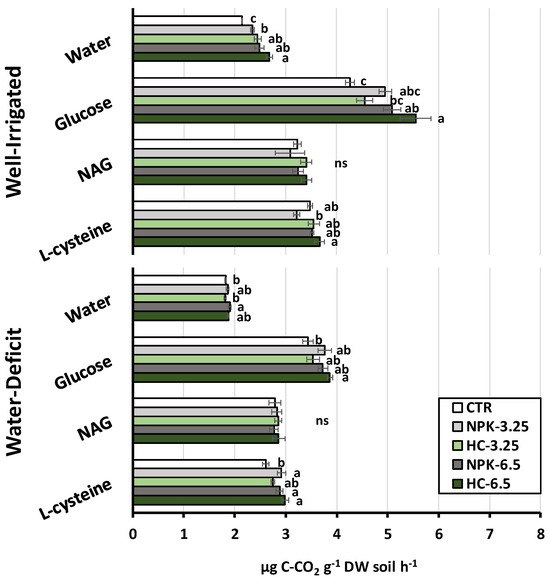
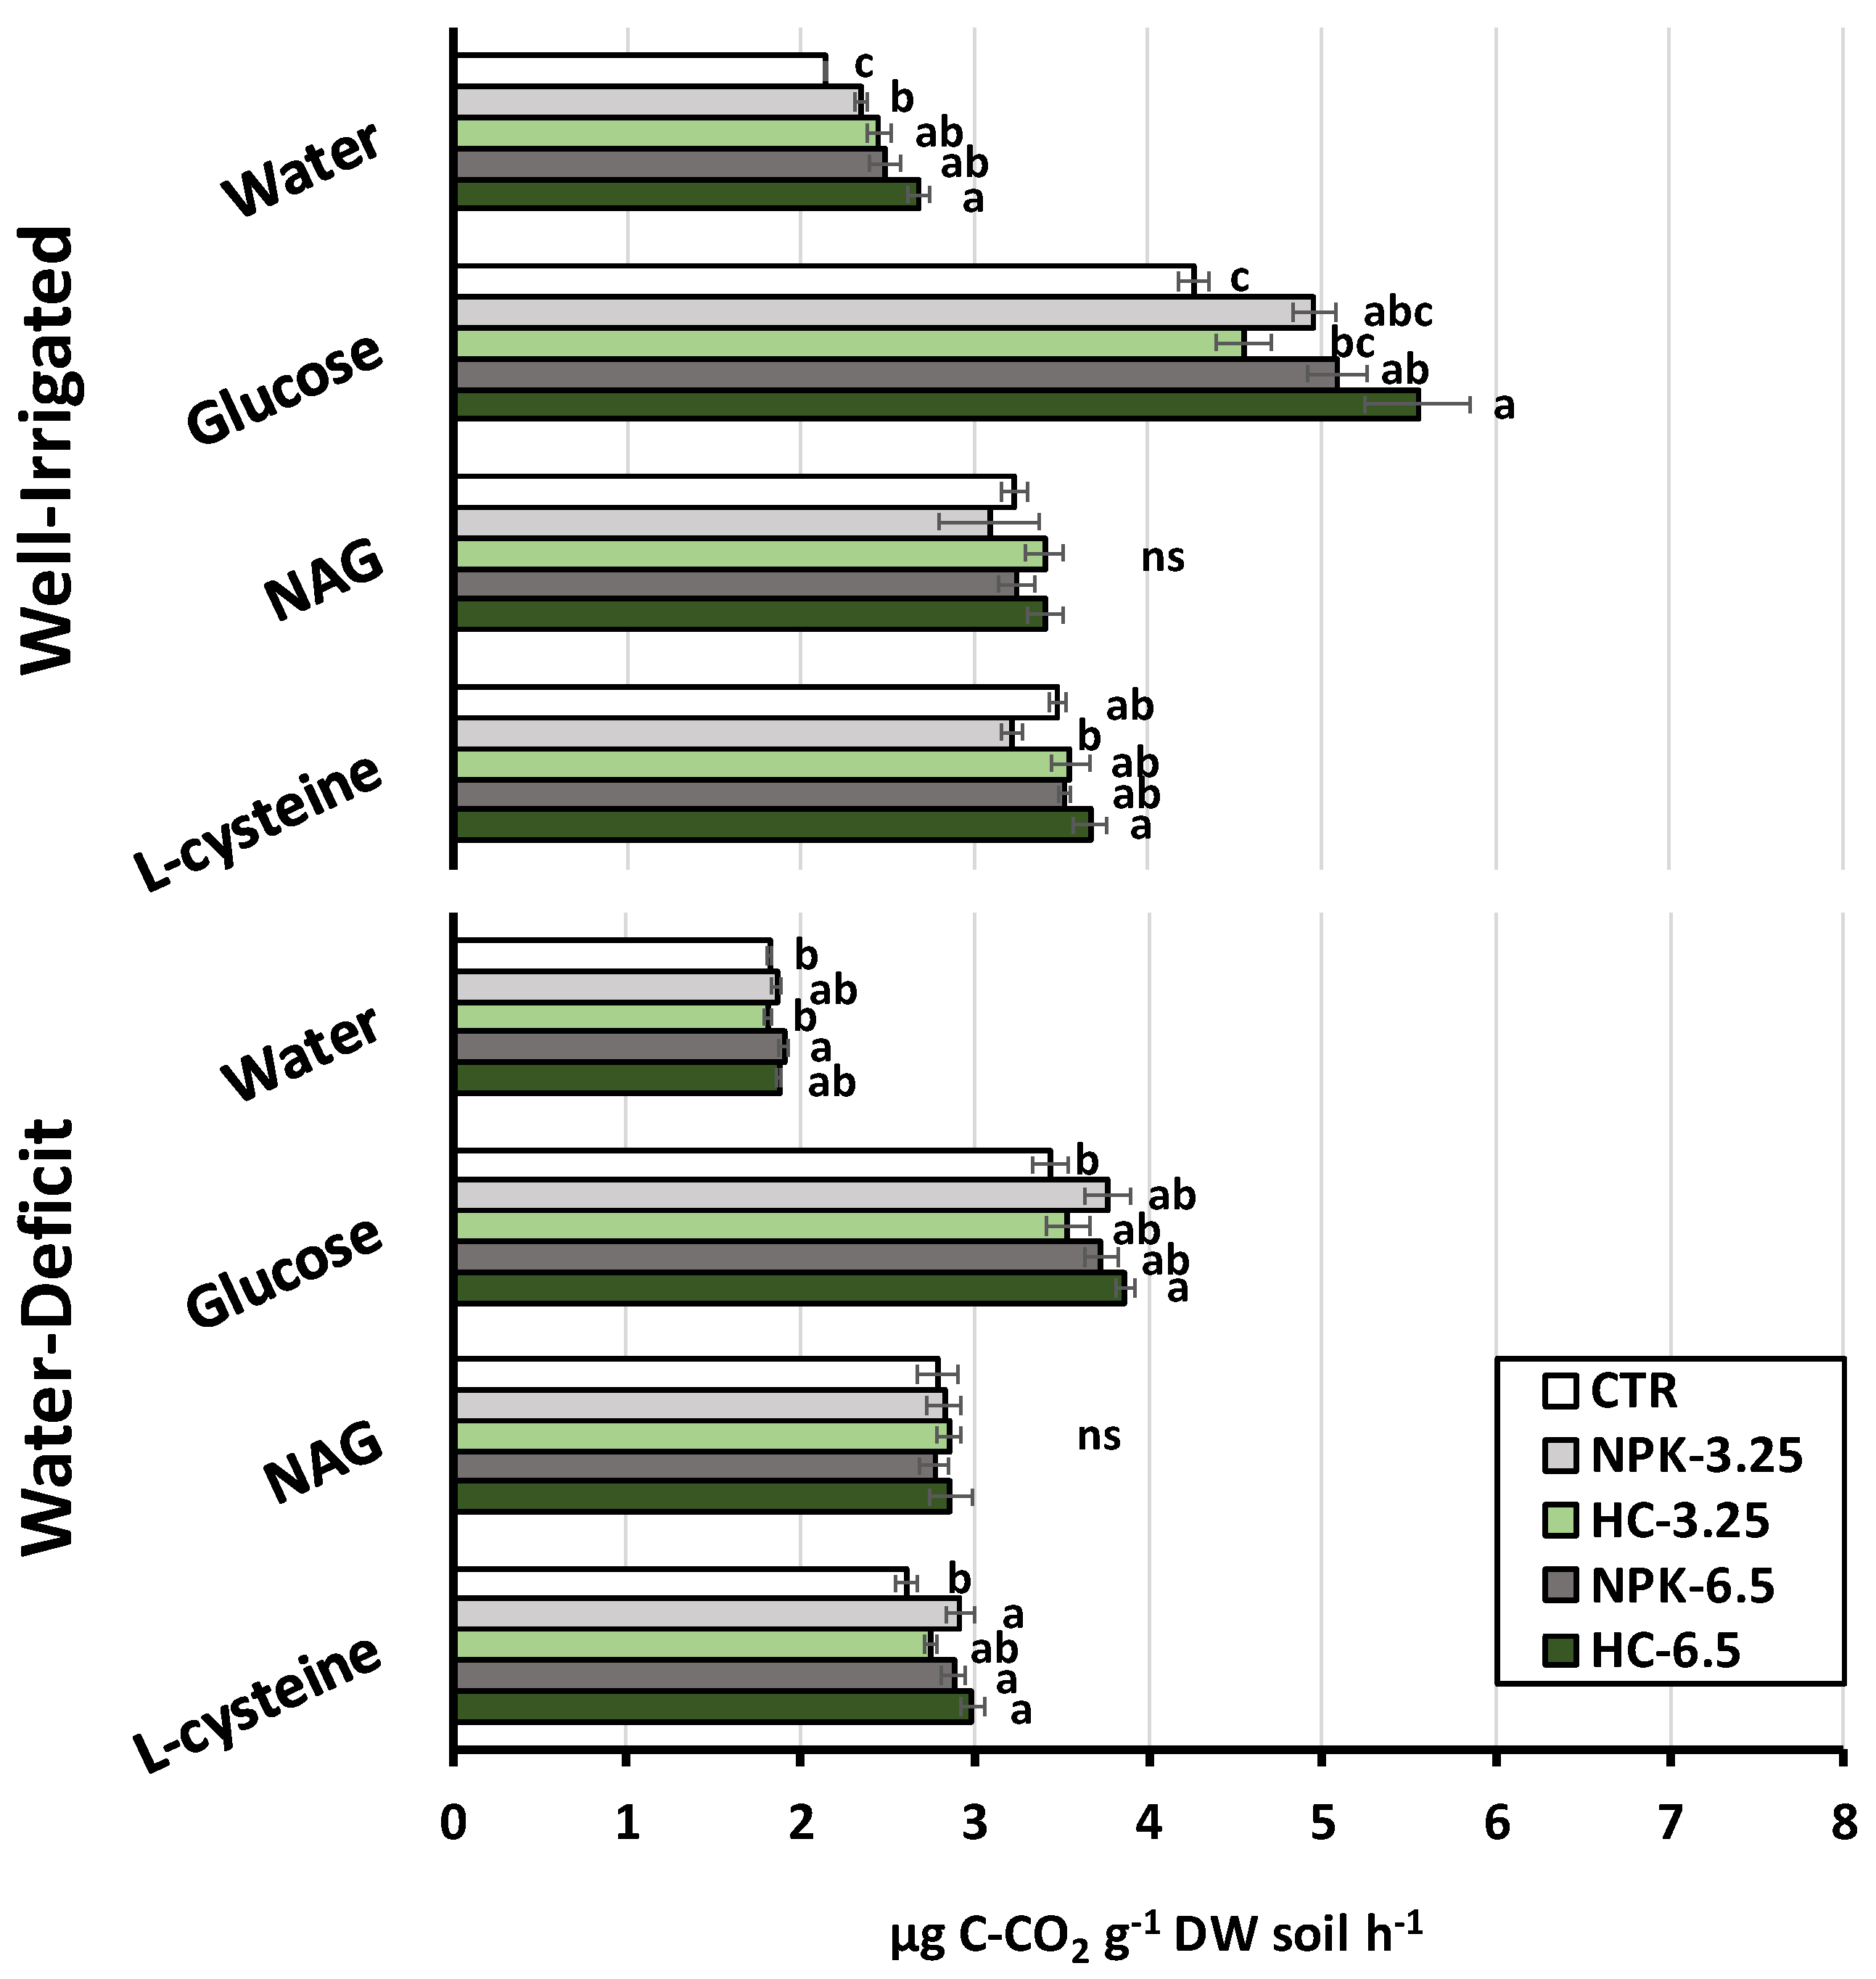
Basal (BR) and substrate-induced respiration (SIR) increased gradually with treatment dose and were strongly negatively influenced by the irrigation regime (Figure 3, Table S5). The higher respiration rates of HC 6.5 relative to CTR for most substrates under both irrigation conditions indicate a strong stimulation of microbial metabolic activity by hydrochar addition, which is in line with other studies [17,54]. This indicates that hydrochar can enhance microbial respiration in the short term [16]. For the NAG substrate, no differences in respiration were observed between treatments under either irrigation regime.
Figure 3.
Analysis of basal respiration (BR) and substrate-induced respiration (SIR) in soil samples. Water refers to BR, whereas glucose, N-acetyl glucosamine (NAG), and L-cysteine were used as substrates for SIR assessment. Values are means (n = 4) ± SE. Different letters indicate significant differences according to Tukey’s HSD or Dunn’s post hoc test, as appropriate. Level of significance p ≤ 0.05; “ns”, not significant differences. Results of the two-way ANOVA evaluating the effects of irrigation regime, fertilization treatment, and their interaction are provided in Table S5.
Although similar increases in respiration rates (BR and some SIR substrates) were observed for HC-6.5 and NPK-6.5 across irrigation regimes, the comparatively higher microbial abundance in HC-6.5-treated soils suggests a more efficient microbial utilization of C and N after hydrochar amendment. In contrast, the response in NPK-6.5 likely reflects a less efficient use of labile soil C, characterized by its rapid mineralization rather than incorporation into microbial biomass, a pattern also reported for biochar-treated soils compared with MF by Asirifi et al. [66].
Taken together, these results indicate that hydrochar addition, especially at the higher dose, enhanced microbial metabolic potential and altered community functioning after 77 days. As observed for the increase in microbial abundance, this response may be associated with the input of readily available organic fractions and potential modifications of the soil microenvironment mediated by hydrochar interactions. It should be noted, however, that this increase in microbial activity and respiration may not necessarily reflect longer-term trends and could represent a transient or early-stage response [48,49]. The combined evidence from enzyme and respiration assays suggests that microorganisms may play an important role in mediating the biochemical changes observed in the hydrochar-treated soils. The apparent functional shift toward phenol oxidase activity under both irrigation regimes may help to explain the increased turnover of soil C and N fractions and the overall acceleration of OM transformation. However, it cannot be ruled out that this observed shift occurred only after the depletion of the more readily available C and N pools, rather than being active from the onset of the experiment.
4. Conclusions
Our findings highlight the importance of characterizing both the properties of hydrochar amendments and the specific organic compounds and substrates they introduce into the soil, as these may contribute to microbial growth and activity even at relatively low application rates. The enhanced microbial abundance and activity observed in hydrochar-treated soils is likely to have played an important role in the observed C and N dynamics, potentially contributing to short-term decomposition and mineralization processes. Nevertheless, additional physical and chemical mechanisms cannot be excluded and require further investigation. Thus, our results indicate that hydrochar can modulate short-term soil biochemical processes. This modulation differ from that induced by MF and is influenced by both application rate and soil water availability. Notably, some of the responses observed in hydrochar-treated soils under WD conditions, particularly those related to C and N dynamics, were attenuated or even suppressed. This suggests that reduced soil water availability may constrain the functional performance of hydrochar amendments in arid or semi-arid environments, or under limited irrigation conditions, such as rainfed agriculture. Therefore, consideration of these aspects when designing hydrochar management strategies is highly relevant. It should be noted that the effectiveness of hydrochar amendments ultimately depends on the intended purpose of their application. In this context, further evaluation of their impact on plant performance, yield, and soil biochemical and ecological responses under different irrigation regimes will be essential to define their most appropriate uses.
From an agronomic perspective, the potential mineralization responses observed in this study may influence the gradual release of nutrients from both the amendment and the native SOM matrix, thereby affecting nutrient availability. From a C sequestration perspective, such processes could also affect the balance between SOM mineralization and stabilization in the amended soil. However, their long-term effects remain to be evaluated in order to determine whether the observed responses represent a stable shift or a transient phenomenon.
The results further suggest that the microbial responses observed in hydrochar-amended soils were not only driven by physical and chemical alterations of the soil environment, but also by biochemical interactions between hydrochar-derived compounds and native SOM. Overall, our results point to the conclusion that hydrochar has the potential to modulate short-term soil biochemical processes mainly through microbial stimulation rather than direct nutrient supply, supporting its role as a potential bio-stimulant amendment in agricultural soils.
Thus, future research should focus on elucidating the link between hydrochar-induced changes in the microbial community, its functionality, and the respective impact on plant growth, nutrient acquisition, and use efficiency. Extending these observations to longer time scales and field conditions, combined with isotopic tracing approaches, will be helpful to disentangle the relative contributions of hydrochar-derived and native C and N to SOM turnover and stabilization.
Supplementary Materials
The following supporting information can be downloaded at https://www.mdpi.com/article/10.3390/agronomy16090917/s1, Table S1: physical and chemical properties, including carbon and nitrogen fractions, of the hydrochar used in this study, Table S2: composition, nutrient forms, and main properties of the mineral fertilizer (NPK 12–8–16) used in this study, Table S3: target genes, primer sequences, qPCR cycling parameters, and amplicon sizes (bp) used in this study, Table S4: two-way ANOVA results for soil physical and chemical properties, C and N fractions, and microbial parameters measured at the end of the experiment (77 days). F-statistics and associated p-values are presented for the effects of irrigation regime, fertilization treatment, and their interaction (Irrigation × Treatment, IxT) on soil pH, electrical conductivity (EC), water holding capacity (WHC), total organic carbon (TOC), inorganic carbon (IC), dissolved organic carbon (DOC), DOC:TOC ratio, ΔTOC0–77d, organic N (Norg), dissolved organic N (DON), DON:N ratio, ΔN0–77d, microbial biomass C (MBC), microbial biomass N (MBN), and enzymatic activities (DHA, BGA, AcPA, POA). The last column indicates the corresponding table where each parameter is reported, Table S5: two-way ANOVA results for microbial abundance and respiration parameters measured at the end of the experiment (77 days). F-statistics and associated p-values are presented for the effects of irrigation regime, fertilization treatment, and their interaction (irrigation × treatment, IxT) on colony-forming units (CFU), bacterial abundance (16S rRNA gene copy number), fungal abundance (ITS gene copy number), basal respiration (BR), and substrate-induced respiration (SIR) responses to glucose, N-acetyl-glucosamine (NAG), and L-cysteine. The final column indicates the figure where the corresponding results are presented, Figure S1: schematic representation of the experimental setup. A total of 40 pots were arranged as 5 treatments × 2 irrigation regimes × 4 biological replicates. Treatments included control soil (CTR), two hydrochar application rates (HC-3.25 and HC-6.5), and two mineral fertilizer treatments providing equivalent N inputs to hydrochar (NPK-3.25 and NPK-6.5). Each treatment was evaluated under well-irrigated (blue rectangle) and water-deficit (orange rectangle) conditions. The figure was digitally illustrated using Adobe Photoshop® CS6 and assembled in Microsoft PowerPoint.
Author Contributions
Conceptualization, F.J.M.-R. and H.K.; methodology, F.J.M.-R., M.V.-M., R.L.-N. and H.K.; software, F.J.M.-R., M.V.-M. and H.K.; validation, F.J.M.-R., M.V.-M. and H.K.; formal analysis, F.J.M.-R. and H.K.; investigation, F.J.M.-R.; resources—H.K.; writing—original draft preparation, F.J.M.-R.; writing—review and editing, H.K., F.J.M.-R., M.V.-M. and R.L.-N.; supervision, H.K.; project administration, H.K.; funding acquisition, H.K. and R.L.-N. All authors have read and agreed to the published version of the manuscript.
Funding
This research was funded by the Junta de Andalucía and the European Regional Development Fund (European Union) (‘SequestCarb’ project; PY20_01065; PAIDI 2020 call). Predoctoral research was supported by the Ph.D. scholarship (PREDOC_00339) awarded by the Junta de Andalucía.
Data Availability Statement
The original contributions presented in this study are included in the article/Supplementary Material. Further inquiries can be directed to the corresponding author.
Acknowledgments
The authors made limited and occasional use of ChatGPT (OpenAI, GPT-5) exclusively to support the translation and refinement of specific terms and expressions into English. All manuscript content was carefully reviewed and approved by the authors, who assume full responsibility for the final version. The authors thank Rocío Reinoso Limones and Cristina García de Arboleya Cañas for their valuable technical assistance. Special thanks are extended to the ATB team in Potsdam-Bornim for hydrochar production, particularly Jürgen Kern and Marcus Fischer. The Central Analytical Service of IRNAS-CSIC is also acknowledged for their support in analytical data acquisition.
Conflicts of Interest
The authors declare no conflicts of interest.
Abbreviations
The following abbreviations are used in this manuscript:
| AcPA | Acid Phosphomonoesterase Activity |
| BR | Basal Respiration |
| BGA | Beta-glucosidase Activity |
| CFU | Colony Forming Unit |
| CP-MAS | Cross-polarization Magic Angle Spinning |
| DHA | Dehydrogenase Activity |
| DOC | Dissolved Organic Carbon |
| DOM | Dissolved Organic Matter |
| DON | Dissolved Organic Nitrogen |
| DW | Dry Weight |
| EC | Electrical Conductivity |
| HF | Hydrofluoric Acid |
| HSD | Honestly Significant Difference |
| HTC | Hydrothermal Carbonization |
| IC | Inorganic Carbon |
| INT | p-Iodonitrotetrazolium chloride |
| INTF | Iodonitrotetrazolium Formazan |
| ITS | Internal Transcribed Spacer |
| L-DOPA | L-3,4-dihydroxyphenylalanine |
| LB | Luria–Bertani |
| MBC | Microbial Biomass Carbon |
| MBN | Microbial Biomass Nitrogen |
| MF | Mineral Fertilizer |
| MUB | Modified Universal Buffer |
| NAG | N-Acetyl-Glucosamine |
| NMR | Nuclear Magnetic Resonance |
| Norg | Organic Nitrogen |
| NPK | Nitrogen-Phosphorus-Potassium |
| OM | Organic Matter |
| PNP | P-Nitrophenol |
| POA | Phenol Oxidase Activity |
| SE | Standard Error |
| SIR | Substrate-induced Respiration |
| SOC | Soil Organic Carbon |
| SOM | Soil Organic Matter |
| TOC | Total Organic Carbon |
| WD | Water-deficit |
| WHC | Water Holding Capacity |
| WI | Well-irrigated |
References
- Rodrigues, C.I.D.; Brito, L.M.; Nunes, L.J.R. Soil carbon sequestration in the context of climate change mitigation: A review. Soil Syst. 2023, 7, 64. [Google Scholar] [CrossRef] [Scilit]
- Parasar, B.J.; Agarwala, N. Unravelling the role of biochar-microbe-soil tripartite interaction in regulating soil carbon and nitrogen budget: A panacea to soil sustainability. Biochar 2025, 7, 37. [Google Scholar] [CrossRef] [Scilit]
- George, C.; Wagner, M.; Kücke, M.; Rillig, M.C. Divergent consequences of hydrochar in the plant–soil system: Arbuscular mycorrhiza, nodulation, plant growth and soil aggregation effects. Appl. Soil Ecol. 2012, 59, 68–72. [Google Scholar] [CrossRef] [Scilit]
- Srivastava, P.; Singh, R.; Tripathi, S.; Singh, H.; Raghubanshi, A.S. Soil carbon dynamics and climate change: Current agro-environmental perspectives and future dimensions. Energy Ecol. Environ. 2016, 1, 315–322. [Google Scholar] [CrossRef] [Scilit]
- Kopittke, P.M.; Menzies, N.W.; Wang, P.; McKenna, B.A.; Lombi, E. Soil and the intensification of agriculture for global food security. Environ. Int. 2019, 132, 105078. [Google Scholar] [CrossRef] [Scilit] [PubMed]
- Gupta, A.; Singh, U.B.; Sahu, P.K.; Paul, S.; Kumar, A.; Malviya, D.; Singh, S.; Kuppusamy, P.; Singh, P.; Paul, D.; et al. Linking soil microbial diversity to modern agriculture practices: A review. Int. J. Environ. Res. Public Health 2022, 19, 3141. [Google Scholar] [CrossRef] [Scilit]
- Leal Filho, W.; Eisma, J.A.; Amiraslani, F.; Baidoo, A.A.; Limones, N.; Brearley, F.Q. The silent witness: How soil dynamics are influenced by climate change. Soil Adv. 2025, 3, 100054. [Google Scholar] [CrossRef] [Scilit]
- Pahalvi, H.N.; Rafiya, L.; Rashid, S.; Nisar, B.; Kamili, A.N. Chemical fertilizers and their impact on soil health. In Microbiota and Biofertilizers; Dar, G.H., Bhat, R.A., Mehmood, M.A., Hakeem, K.R., Eds.; Springer: Cham, Switzerland, 2021; Volume 2, pp. 1–20. [Google Scholar] [CrossRef] [Scilit]
- Francioli, D.; Schulz, E.; Lentendu, G.; Wubet, T.; Buscot, F.; Reitz, T. Mineral vs. organic amendments: Microbial community structure, activity and abundance of agriculturally relevant microbes are driven by long-term fertilization strategies. Front. Microbiol. 2016, 7, 1446. [Google Scholar] [CrossRef] [Scilit] [PubMed]
- Semenov, M.V.; Krasnov, G.S.; Semenov, V.M.; van Bruggen, A. Mineral and organic fertilizers distinctly affect fungal communities in the crop rhizosphere. J. Fungi 2022, 8, 251. [Google Scholar] [CrossRef] [Scilit]
- Liu, Y.; Yao, S.; Wang, Y.; Lu, H.; Brar, S.K.; Yang, S. Bio-and hydrochars from rice straw and pig manure: Inter-comparison. Bioresour. Technol. 2017, 235, 332–337. [Google Scholar] [CrossRef] [Scilit] [PubMed]
- Cavali, M.; Junior, N.L.; de Sena, J.D.; Woiciechowski, A.L.; Soccol, C.R.; Belli Filho, P.; Bayard, R.; Benbelkacem, H.; de Castilhos Junior, A.B. A review on hydrothermal carbonization of potential biomass wastes, characterization and environmental applications of hydrochar, and biorefinery perspectives of the process. Sci. Total Environ. 2023, 857, 159627. [Google Scholar] [CrossRef] [Scilit] [PubMed]
- Libra, J.A.; Ro, K.S.; Kammann, C.; Funke, A.; Berge, N.D.; Neubauer, Y.; Titirici, M.M.; Fühner, C.; Bens, O.; Kern, J.; et al. Hydrothermal carbonization of biomass residuals: A comparative review of the chemistry, processes and applications of wet and dry pyrolysis. Biofuels 2011, 2, 71–106. [Google Scholar] [CrossRef] [Scilit]
- Masoumi, S.; Borugadda, V.B.; Nanda, S.; Dalai, A.K. Hydrochar: A review on its production technologies and applications. Catalysts 2021, 11, 939. [Google Scholar] [CrossRef] [Scilit]
- Paneque, M.; De la Rosa, J.M.; Kern, J.; Reza, M.T.; Knicker, H. Hydrothermal carbonization and pyrolysis of sewage sludges: What happen to carbon and nitrogen? J. Anal. Appl. Pyrol. 2017, 128, 314–323. [Google Scholar] [CrossRef] [Scilit]
- De Jager, M.; Giani, L. An investigation of the effects of hydrochar application rate on soil amelioration and plant growth in three diverse soils. Biochar 2021, 3, 349–365. [Google Scholar] [CrossRef] [Scilit]
- Di Santo, T.; Marzaioli, R.; Coppola, E.; Zaccariello, L.; Battaglia, D.; Castaldi, S.; D’Ascoli, R.; Papa, S.; Strumia, S.; Battipaglia, G.; et al. Enhancing soil health with hydrochar: Improvements in chemical and biological properties. J. Environ. Manag. 2025, 385, 125659. [Google Scholar] [CrossRef] [Scilit]
- Sun, K.; Han, L.; Yang, Y.; Xia, X.; Yang, Z.; Wu, F.; Li, F.; Feng, Y.; Xing, B. Application of hydrochar altered soil microbial community composition and the molecular structure of native soil organic carbon in a paddy soil. Environ. Sci. Technol. 2020, 54, 2715–2725. [Google Scholar] [CrossRef] [Scilit]
- Khosravi, A.; Zheng, H.; Liu, Q.; Hashemi, M.; Tang, Y.; Xing, B. Production and characterization of hydrochars and their application in soil improvement and environmental remediation. Chem. Eng. J. 2022, 430, 133142. [Google Scholar] [CrossRef] [Scilit]
- Yan, T.; Zhang, Z.; Zhang, Z.; Wang, W.; Li, D.; Zhang, T.; Zhu, Z. Applying hydrochar affects soil carbon dynamics by altering the characteristics of soil aggregates and microbes. Agronomy 2024, 14, 1015. [Google Scholar] [CrossRef] [Scilit]
- Yu, W.; Zhang, Q.; Huai, S.; Jin, Y.; Lu, C. Hydrochar as a potential soil conditioner for mitigating h+ production in the nitrogen cycle: A comparative study. Agronomy 2025, 15, 1777. [Google Scholar] [CrossRef] [Scilit]
- Bruun, E.W.; Ambus, P.; Egsgaard, H.; Hauggaard-Nielsen, H. Effects of slow and fast pyrolysis biochar on soil C and N turnover dynamics. Soil Biol. Biochem. 2012, 46, 73–79. [Google Scholar] [CrossRef] [Scilit]
- Nelissen, V.; Rütting, T.; Huygens, D.; Staelens, J.; Ruysschaert, G.; Boeckx, P. Maize biochars accelerate short-term soil nitrogen dynamics in a loamy sand soil. Soil Biol. Biochem. 2012, 55, 20–27. [Google Scholar] [CrossRef] [Scilit]
- Singh, B.P.; Cowie, A.L. Long-term influence of biochar on native organic carbon mineralisation in a low-carbon clayey soil. Sci. Rep. 2014, 4, 3687. [Google Scholar] [CrossRef] [Scilit]
- Ling, L.; Luo, Y.; Jiang, B.; Lv, J.; Meng, C.; Liao, Y.; Reid, B.J.; Ding, F.; Lu, Z.; Kuzyakov, Y.; et al. Biochar induces mineralization of soil recalcitrant components by activation of biochar responsive bacteria groups. Soil Biol. Biochem. 2022, 172, 108778. [Google Scholar] [CrossRef] [Scilit]
- Jafari Tarf, O.; Akça, M.O.; Donar, Y.O.; Bilge, S.; Turgay, O.C.; Sınağ, A. The short-term effects of pyro-and hydrochars derived from different organic wastes on some soil properties. Biomass Convers. Biorefinery 2021, 12, 129–139. [Google Scholar] [CrossRef] [Scilit]
- Naisse, C.; Girardin, C.; Lefevre, R.; Pozzi, A.; Maas, R.; Stark, A.; Rumpel, C. Effect of physical weathering on the carbon sequestration potential of biochars and hydrochars in soil. GCB Bioenergy 2015, 7, 488–496. [Google Scholar] [CrossRef] [Scilit]
- Moreno-Racero, F.J.; Velasco-Molina, M.; López-Núñez, R.; Libra, J.A.; Knicker, H. Chemical changes during hydrothermal carbonization of manure derived from free-range bred chickens and its potential as organic fertilizer for tomato, lettuce and sunflower plants. Environments 2025, 12, 444. [Google Scholar] [CrossRef] [Scilit]
- Veihmeyer, F.J.; Hendrickson, A.H. Methods of measuring field capacity and wilting percentages of soils. Soil Sci. 1949, 68, 75–94. [Google Scholar] [CrossRef] [Scilit]
- Gonçalves, C.N.; Dalmolin, R.S.; Dick, D.P.; Knicker, H.; Klamt, E.; Kögel-Knabner, I. The effect of 10% HF treatment on the resolution of CPMAS 13C NMR spectra and on the quality of organic matter in Ferralsols. Geoderma 2003, 116, 373–392. [Google Scholar] [CrossRef] [Scilit]
- Knicker, H.; Totsche, K.U.; Almendros, G.; González-Vila, F.J. Condensation degree of burnt peat and plant residues and the reliability of solid-state VACP MAS 13C NMR spectra obtained from pyrogenic humic material. Org. Geochem. 2005, 36, 1359–1377. [Google Scholar] [CrossRef] [Scilit]
- Baldock, J.A.; Oades, J.M.; Nelson, P.N.; Skene, T.M.; Golchin, A.; Clarke, P. Assessing the extent of decomposition of natural organic materials using solid-state 13C NMR spectroscopy. Aust. J. Soil Res. 1997, 35, 1061–1083. [Google Scholar] [CrossRef] [Scilit]
- Gregorich, E.G.; Wen, G.; Voroney, R.P.; Kachanoski, R.G. Calibration of a rapid direct chloroform extraction method for measuring soil microbial biomass C. Soil Biol. Biochem. 1990, 22, 1009–1011. [Google Scholar] [CrossRef] [Scilit]
- Vance, E.D.; Brookes, P.C.; Jenkinson, D.S. An extraction method for measuring soil microbial biomass C. Soil Biol. Biochem. 1987, 19, 703–707. [Google Scholar] [CrossRef] [Scilit]
- López-Gutiérrez, J.C.; Henry, S.; Hallet, S.; Martin-Laurent, F.; Catroux, G.; Philippot, L. Quantification of a novel group of nitrate-reducing bacteria in the environment by real-time PCR. J. Microbiol. Methods 2004, 57, 399–407. [Google Scholar] [CrossRef] [Scilit]
- Schoch, C.L.; Seifert, K.A.; Huhndorf, S.; Robert, V.; Spouge, J.L.; Levesque, C.A.; Chen, W.; Fungal Barcoding Consortium. Nuclear ribosomal internal transcribed spacer (ITS) region as a universal DNA barcode marker for Fungi. Proc. Natl. Acad. Sci. USA 2012, 109, 6241–6246. [Google Scholar] [CrossRef] [Scilit]
- Trevors, J.T. Dehydrogenase activity in soil: A comparison between the INT and TTC assay. Soil Biol. Biochem. 1984, 16, 673–674. [Google Scholar] [CrossRef] [Scilit]
- Tabatabai, M.A. Methods of soil analysis, part 2. Chemical and microbiological properties. In Agronomy Monography; American Society of Agronomy: Madison, WI, USA, 1982; Volume 9, pp. 903–947. [Google Scholar]
- Tabatabai, M.A.; Bremner, J.M. Use of p-nitrophenyl phosphate for assay of soil phosphatase activity. Soil Biol. Biochem. 1969, 1, 301–307. [Google Scholar] [CrossRef] [Scilit]
- Pind, A.; Freeman, C.; Lock, M.A. Enzymic degradation of phenolic materials in peatlands—Measurement of phenol oxidase activity. Plant Soil. 1994, 159, 227–231. [Google Scholar] [CrossRef] [Scilit]
- Campbell, C.D.; Chapman, S.J.; Cameron, C.M.; Davidson, M.S.; Potts, J.M. A rapid microtiter plate method to measure carbon dioxide evolved from carbon substrate amendments so as to determine the physiological profiles of soil microbial communities by using whole soil. Appl. Environ. Microbiol. 2003, 69, 3593–3599. [Google Scholar] [CrossRef] [Scilit]
- Creamer, R.E.; Bellamy, P.; Black, H.I.; Cameron, C.M.; Campbell, C.D.; Chamberlain, P.; Harris, J.; Parekh, N.; Pawlett, M.; Poskitt, J.; et al. An inter-laboratory comparison of multi-enzyme and multiple substrate-induced respiration assays to assess method consistency in soil monitoring. Biol. Fertil. Soils 2009, 45, 623–633. [Google Scholar] [CrossRef] [Scilit]
- De Jager, M.; Röhrdanz, M.; Giani, L. The influence of hydrochar from biogas digestate on soil improvement and plant growth aspects. Biochar 2020, 2, 177–194. [Google Scholar] [CrossRef] [Scilit]
- Lehmann, J.; Rillig, M.C.; Thies, J.; Masiello, C.A.; Hockaday, W.C.; Crowley, D. Biochar effects on soil biota—A review. Soil Biol. Biochem. 2011, 43, 1812–1836. [Google Scholar] [CrossRef] [Scilit]
- Teutscherova, N.; Lojka, B.; Houška, J.; Masaguer, A.; Benito, M.; Vazquez, E. Application of holm oak biochar alters dynamics of enzymatic and microbial activity in two contrasting Mediterranean soils. Eur. J. Soil Biol. 2018, 88, 15–26. [Google Scholar] [CrossRef] [Scilit]
- Kuzyakov, Y. Priming effects: Interactions between living and dead organic matter. Soil Biol. Biochem. 2010, 42, 1363–1371. [Google Scholar] [CrossRef] [Scilit]
- Smebye, A.; Alling, V.; Vogt, R.D.; Gadmar, T.C.; Mulder, J.; Cornelissen, G.; Hale, S.E. Biochar amendment to soil changes dissolved organic matter content and composition. Chemosphere 2016, 142, 100–105. [Google Scholar] [CrossRef] [Scilit]
- Malghani, S.; Jueschke, E.; Baumert, J.; Thuille, A.; Antonietti, M.; Trumbore, S.; Gleixner, G. Carbon sequestration potential of hydrothermal carbonization char (hydrochar) in two contrasting soils; results of a 1-year field study. Biol. Fertil. Soils 2015, 51, 123–134. [Google Scholar] [CrossRef] [Scilit]
- Malghani, S.; Gleixner, G.; Trumbore, S.E. Chars produced by slow pyrolysis and hydrothermal carbonization vary in carbon sequestration potential and greenhouse gases emissions. Soil Biol. Biochem. 2013, 62, 137–146. [Google Scholar] [CrossRef] [Scilit]
- Schimel, J.P. Life in Dry Soils: Effects of Drought on Soil Microbial Communities and Processes. Annu. Rev. Ecol. Evol. Syst. 2018, 49, 409–432. [Google Scholar] [CrossRef] [Scilit]
- López-Martín, M.; Velasco-Molina, M.; Knicker, H. Variability of the quality and quantity of organic matter in soil affected by multiple wildfires. J. Soils Sediments 2016, 16, 360–370. [Google Scholar] [CrossRef] [Scilit]
- Guo, J.; Yang, S.; He, Q.; Chen, Y.; Zheng, F.; Zhou, H.; Hou, C.; Du, B.; Jiang, S.; Li, H. Improving benzo(a)pyrene biodegradation in soil with wheat straw-derived biochar amendment: Performance, microbial quantity, CO2 emission, and soil properties. J. Anal. Appl. Pyrolysis 2021, 156, 105132. [Google Scholar] [CrossRef] [Scilit]
- Kerner, P.; Struhs, E.; Mirkouei, A.; Aho, K.; Lohse, K.A.; Dungan, R.S.; You, Y. Microbial responses to biochar soil amendment and influential factors: A three-level meta-analysis. Environ. Sci. Technol. 2023, 57, 19838–19848. [Google Scholar] [CrossRef] [Scilit]
- Watson, C.; Schlösser, C.; Vögerl, J.; Wichern, F. Hydrochar, digestate, and process water impacts on a soil’s microbial community, processes, and metal bioavailability. Soil Sci. Soc. Am. J. 2021, 85, 717–731. [Google Scholar] [CrossRef] [Scilit]
- Chen, J.; Liu, X.; Zheng, J.; Zhang, B.; Lu, H.; Chi, Z.; Pan, G.; Li, L.; Zheng, J.; Zhang, X.; et al. Biochar soil amendment increased bacterial but decreased fungal gene abundance with shifts in community structure in a slightly acid rice paddy from Southwest China. Appl. Soil Ecol. 2013, 71, 33–44. [Google Scholar] [CrossRef] [Scilit]
- Nie, C.; Yang, X.; Niazi, N.K.; Xu, X.; Wen, Y.; Rinklebe, J.; Ok, Y.S.; Xu, S.; Wang, H. Impact of sugarcane bagasse-derived biochar on heavy metal availability and microbial activity: A field study. Chemosphere 2018, 200, 274–282. [Google Scholar] [CrossRef] [Scilit]
- Lu, W.; Ding, W.; Zhang, J.; Li, Y.; Luo, J.; Bolan, N.; Xie, Z. Biochar suppressed the decomposition of organic carbon in a cultivated sandy loam soil: A negative priming effect. Soil Biol. Biochem. 2014, 76, 12–21. [Google Scholar] [CrossRef] [Scilit]
- Herath, I.; Iqbal, M.C.; Al-Wabel, M.I.; Abduljabbar, A.; Ahmad, M.; Usman, A.R.; Ok, Y.S.; Vithanage, M. Bioenergy-derived waste biochar for reducing mobility, bioavailability, and phytotoxicity of chromium in anthropized tannery soil. J. Soils Sediments 2017, 17, 731–740. [Google Scholar] [CrossRef] [Scilit]
- Bolan, S.; Sharma, S.; Mukherjee, S.; Kumar, M.; Rao, C.S.; Nataraj, K.C.; Singh, G.; Vinu, A.; Bhowmik, A.; Sharma, H.; et al. Biochar modulating soil biological health: A review. Sci. Total Environ. 2023, 914, 169585. [Google Scholar] [CrossRef] [Scilit]
- De Nobili, M.; Contin, M.; Mondini, C.; Brookes, P.C. Soil microbial biomass is triggered into activity by trace amounts of substrate. Soil Biol. Biochem. 2001, 33, 1163–1170. [Google Scholar] [CrossRef] [Scilit]
- Jenkins, S.N.; Rushton, S.P.; Lanyon, C.; Whiteley, A.S.; Waite, I.S.; Brookes, P.C.; Kemmitt, S.J.; Evershed, R.P.; O’donnell, A.G. Taxon-specific responses of soil bacteria to the addition of low level C inputs. Soil Biol. Biochem. 2010, 42, 1624–1631. [Google Scholar] [CrossRef] [Scilit]
- Gronwald, M.; Don, A.; Tiemeyer, B.; Helfrich, M. Effects of fresh and aged chars from pyrolysis and hydrothermal carbonization on nutrient sorption in agricultural soils. Soil 2015, 1, 475–489. [Google Scholar] [CrossRef] [Scilit]
- De Jager, M.; Schroeter, F.; Wark, M.; Giani, L. The stability of carbon from a maize-derived hydrochar as a function of fractionation and hydrothermal carbonization temperature in a Podzol. Biochar 2022, 4, 52. [Google Scholar] [CrossRef] [Scilit]
- Akmal, M.; Maqbool, Z.; Khan, K.S.; Hussain, Q.; Ijaz, S.S.; Iqbal, M.; Aziz, I.; Hussain, A.; Abbas, M.S.; Rafa, H.U. Integrated use of biochar and compost to improve soil microbial activity, nutrient availability, and plant growth in arid soil. Arab. J. Geosci. 2019, 12, 232. [Google Scholar] [CrossRef] [Scilit]
- Gascó, G.; Paz-Ferreiro, J.; Cely, P.; Plaza, C.; Mendez, A. Influence of pig manure and its biochar on soil CO2 emissions and soil enzymes. Ecol. Eng. 2016, 95, 19–24. [Google Scholar] [CrossRef] [Scilit]
- Asirifi, I.; Werner, S.; Heinze, S.; Saba, C.K.; Lawson, I.Y.; Marschner, B. Short-term effect of biochar on microbial biomass, respiration and enzymatic activities in wastewater irrigated soils in urban agroecosystems of the West African savannah. Agronomy 2021, 11, 271. [Google Scholar] [CrossRef] [Scilit]

Disclaimer/Publisher’s Note: The statements, opinions and data contained in all publications are solely those of the individual author(s) and contributor(s) and not of MDPI and/or the editor(s). MDPI and/or the editor(s) disclaim responsibility for any injury to people or property resulting from any ideas, methods, instructions or products referred to in the content. |
© 2026 by the authors. Licensee MDPI, Basel, Switzerland. This article is an open access article distributed under the terms and conditions of the Creative Commons Attribution (CC BY) license.