


Abstract
To enhance the energy efficiency and environmental sustainability of solar greenhouses, precise microclimate control is essential. Composite thermal blankets critically influence heating demand and carbon footprint, yet conventional heat transfer models often neglect their internal structural characteristics, limiting simulation accuracy and optimization. Accordingly, a heat transfer model for composite thermal blankets was developed based on the law of energy conservation. The model discretizes the internal structure and integrates radiation, convection, conduction, and latent heat from condensation. It uniquely incorporates dynamic environmental factors and blanket properties including layered composition, porosity, and moisture content. Accuracy was validated through numerical simulations and field experiments in both traditional brick-wall and prefabricated flexible-wall solar greenhouses under various weather conditions. Validation showed strong agreement: for the brick-wall greenhouse, mean absolute error (MAE) was 1.21 °C, root mean square error (RMSE) 1.27 °C, and R2 0.97; for the flexible-wall greenhouse, MAE was 0.56 °C, RMSE 1.08 °C, and R2 0.85. These indicators confirm that the model reliably quantifies the impact of thermal insulation blanket material and structure on thermal performance, providing a basis for design optimization and a reduction in supplemental heating demand and carbon emissions. Further analysis examined the porosity and moisture effects on spray-bonded cotton, PE foam, and needle-punched felt. Under low moisture, higher porosity reduced thermal conductivity by up to 27.4%, 57.6%, and 52.4%, respectively. However, under high moisture, conductivity increased with porosity in materials with interconnected pores (spray-bonded cotton and Needle-punched felt) due to continuous water channels, while closed-cell PE foam conductivity continued decreasing. All materials showed linearly increasing conductivity with moisture content, with higher-porosity materials exhibiting greater sensitivity. For example, at porosities of 0.95, 0.95, and 0.85, moisture content rising from 0 to 0.225 increased conductivity by 264%, 209.6%, and 196.7%. This model provides a robust theoretical foundation for the scientific selection, structural optimization, and performance evaluation of composite thermal blankets in greenhouse applications.
1. Introduction
In the pursuit of sustainability in protected agriculture, a core challenge lies in balancing crop yield, operational costs, and environmental impact. As a highly efficient and energy-saving agricultural facility, the solar greenhouse plays a crucial role in overcoming seasonal climatic constraints and ensuring year-round crop production [1,2]. Its core principle lies in optimizing thermal environment management to provide suitable conditions for crop growth [3]. The enclosure structure serves as the primary interface for heat exchange between the greenhouse and the external environment, and its heat transfer performance directly affects the stability of the indoor thermal environment and energy utilization efficiency [4,5]. Research indicates that heat loss through the transparent covering layer of the enclosure structure constitutes the major portion of total greenhouse heat loss, typically exceeding 60% and even reaching 80% [6,7]. Therefore, a deep understanding of the heat transfer mechanism of the transparent covering layer is central to optimizing the greenhouse thermal environment. This is directly related to reducing fossil fuel consumption and lowering greenhouse gas emissions, making it a critical element in achieving low-carbon, energy-efficient, protected agriculture. Based on the winter crop overwintering insulation and production demands in northern China, thick composite thermal blankets are often required to reduce heat dissipation [3]. Composite thermal blankets are widely used due to the significant advantages their of high efficiency, energy saving potential, cold protection, and low cost [8,9]. The rapid development of composite thermal blankets has driven the diversification of their materials and structures. In the aspect of material selection and performance optimization for composite thermal blankets, researchers have conducted several explorations. For instance, Tang et al. [10] compared various surface fabrics (reinforced non-woven fabric, laminated non-woven fabric, PE foam, etc.) and insulation core materials (spray-bonded cotton, mixed wool, microporous foam materials, etc.) and developed high-performance thermal blankets using spray-bonded cotton and mixed wool, with insulation rates reaching 84.0 and 83.3%, respectively. Xu et al. [11,12] addressed the challenge of waterproofing and moisture resistance by adopting PE closed-cell foam self-waterproofing material as the core and polyester cloth as the surface layer, applying double-sided overall bonding technology. This composite structure significantly improved the thermal insulation, waterproofing, mechanical strength, and durability of the thermal blanket.
However, numerous challenges remain in the research, development, and application of thermal blankets. For example, differences in the porosity of fibrous porous fluffy materials significantly affect their loftiness, thereby impacting thermal insulation performance. Yet, the quantitative relationship of this influence and the optimal balance between insulation performance and cost-effectiveness are not yet clear [13]. The presence of moisture in thermal blankets can significantly alter the thermal conductivity of materials, affecting their insulation effectiveness [14]. However, the specific role and extent of the influence of moisture content in constituent materials on thermal performance are not fully understood. Consequently, problems such as degradation in insulation performance due to factors like material aging, mechanical compaction, and changes in external environmental conditions (e.g., temperature, humidity, wind speed, radiation) leading to variations in porosity and moisture content are common in production [15]. Currently, the rate and mechanism of this insulation performance degradation have not been sufficiently elucidated. Therefore, there is an urgent need to establish a theoretical analysis method to clarify the influence of factors such as different material constructions and usage environments on the insulation performance of thermal blankets. This will provide a theoretical basis for the scientific design and selection of thermal blankets and for seeking the optimal balance between insulation performance and economic efficiency.
The heat transfer coefficient is a key comprehensive parameter characterizing the overall thermal insulation performance of solar greenhouse composite thermal blankets under the coupled effects of multiple processes [16,17]. Traditional methods for determining the heat transfer coefficient of composite thermal blankets mainly include field testing and laboratory measurement [18,19]. Field testing is entirely dependent on environmental conditions, with parameters which are difficult to control. Test results are susceptible to interference and prone to significant errors. Laboratory equipment, primarily based on the hot box method, can independently regulate environmental parameters, yielding relatively accurate and stable results. However, its testing conditions are usually stable and singular, and it still relies on physical samples of composite thermal blankets, increasing the economic and time costs of research and development. More critically, the heat transfer process of composite thermal blankets in practical applications dynamically changes with the external environment (temperature, humidity, wind speed, radiation, etc.). Experimental results obtained under static or simplified conditions are difficult to accurately reflect their complex and variable actual performance. To address this, previous scholars have established methods for solving the heat transfer coefficient of greenhouse covering layers from different perspectives. Papadakis et al. [20] made preliminary explorations in solving the heat transfer coefficient of greenhouse covering layers, but they simplified the greenhouse spatial layout and neglected crop influence. Ma et al. [21] proposed a theoretical analysis method for quantitatively calculating the heat transfer coefficient of covering materials based on the energy balance of the covering layer. Based on previous research, Zhang [22] and Liu et al. [23] established theoretical heat transfer models for multi-layer greenhouse covers and implemented corresponding computational programs. In these approaches, individual material layers (e.g., plastic film, thermal screen, air gap) are typically treated as homogeneous slabs with fixed thermophysical properties and are characterized by a single effective thermal conductivity. Such models do not resolve the internal microstructural gradients within thick, porous insulation layers, nor do they account for the coupled heat and moisture transfer mechanisms associated with water vapor condensation. Luo et al. [24] developed a comprehensive south roof model for solar greenhouses that successfully quantifies overall heat loss pathways; however, their model treats the composite thermal blanket as a monolithic entity with a prescribed thermal resistance and does not discretize the quilt into individual grid cells for detailed analysis. Consequently, the influence of material-specific parameters—such as porosity, moisture content, and pore morphology—on the dynamic thermal performance of the quilt has remained theoretically unexplored.
This study aims to develop a theoretical model that accurately describes the heat transfer process in greenhouse composite thermal blankets, bridging from microscopic features (e.g., fiber arrangement, pore distribution) to macroscopic properties (e.g., layer thickness, interface characteristics). Its primary contributions are twofold: (1) to establish a discretized, multi-process coupled model that reveals how the internal architecture of the quilt (layer sequencing, pore connectivity, and moisture distribution) governs its overall thermal resistance; and (2) to apply this model to evaluate the actual thermal performance of composite blankets under dynamic environmental conditions. More importantly, serve as a foundational assessment tool to quantify the energy efficiency of these blankets under different materials, structures, and environmental conditions. This provides scientific guidance for selecting environmentally friendly materials, optimizing insulation structure design, and formulating energy-saving management strategies, ultimately contributing to enhancing the overall sustainability of greenhouse agriculture.
2. Heat Transfer Model Development
2.1. Heat Transfer Mechanism
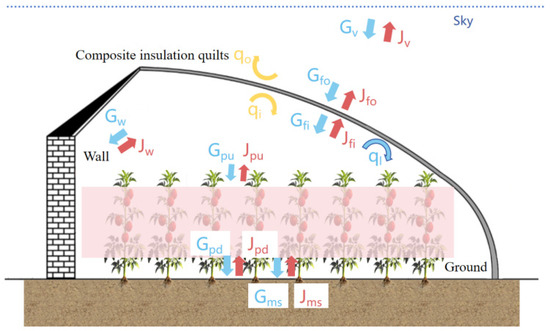
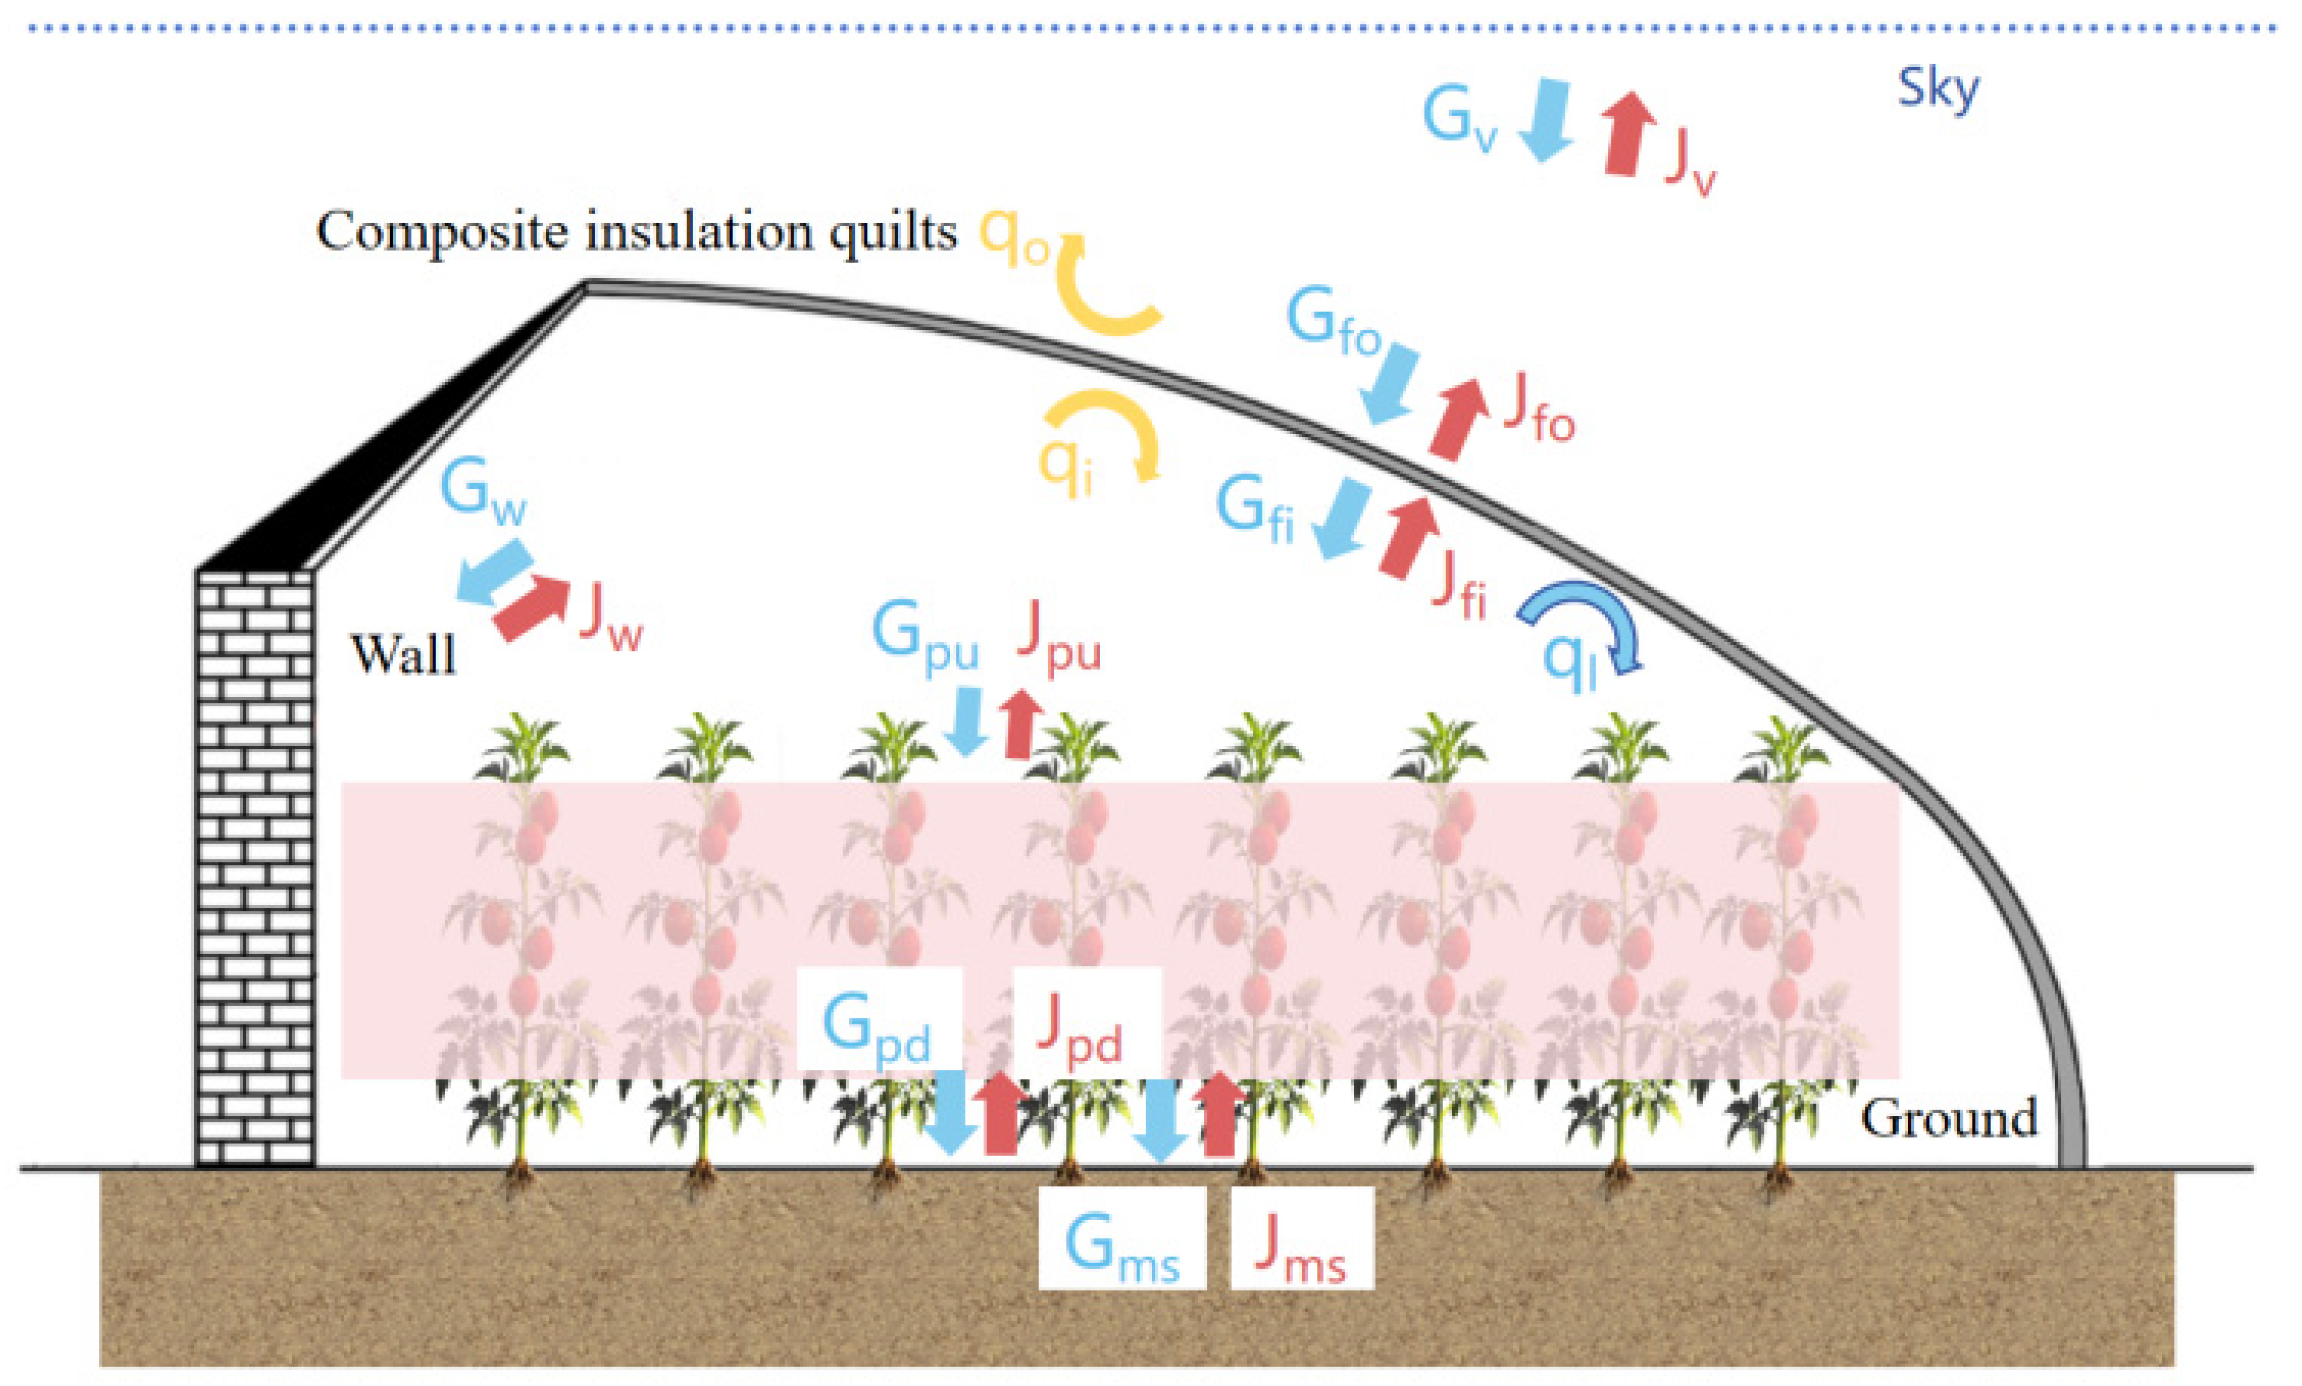
The internal environment of a solar greenhouse constitutes an enclosed space formed by the covering layer, the soil layer, and the walls (including the north wall, north roof, east wall, and west wall). The actual thermal environment within the greenhouse results from the coupling of four heat transfer mechanisms: conduction, convection, radiation, and latent heat exchange. Its dynamic equilibrium is influenced by both external meteorological conditions and internal control strategies. During winter production, composite thermal blankets are typically applied over the transparent covering layer to reduce heat loss and achieve thermal insulation. The heat transfer process of the composite thermal blanket encompasses multiple aspects, as illustrated in Figure 1. Within the composite thermal blanket, heat transfer is primarily through conduction. Its inner surface engages in radiation heat exchange with surfaces such as walls and crops, in convective heat exchange with the indoor air, and potentially in latent heat exchange due to water vapor condensation. The outer surface engages in longwave radiation exchange with the sky background and convective heat exchange with the outdoor air. This model will calculate the inner and outer surface temperatures of the composite thermal blanket based on known thermophysical property parameters of each object’s surface, greenhouse structural parameters, and environmental parameters. Subsequently, it will determine the comprehensive heat transfer coefficient and heat loss, ultimately completing a quantitative analysis of the heat transfer process.
Figure 1.
Heat transfer model and heat exchange mechanism of solar greenhouse covering layer.
2.2. Model Simplifications
While ensuring model accuracy, the following simplifications are made to facilitate calculation and analysis:
(1) Based on blackbody radiation theory, the non-uniform outdoor environment is treated as an infinite blackbody system with a unified temperature boundary. The equivalent environmental temperature is given by Tv = 0.0552 × T01.5 (where T0 is the outdoor temperature) [25].
(2) According to Fourier’s law, given that the characteristic thickness δ and surface area A of the thermal blanket satisfy δ/A < 10−3, its internal conduction process is simplified to one-dimensional transient conduction along the thickness direction [26].
(3) Regarding the radiating surfaces within the greenhouse, the emissivity ε and reflectivity ρ of each surface satisfy Kirchhoff’s law ε = 1 − ρ, and their directional radiation properties conform to Lambert’s cosine law (angle deviation < 5%). A diffuse-gray surface model system is established within the 8–14 μm infrared wavelength band. Within the wavelength range relevant to its heat transfer (infrared longwave radiation), its transmittance, emissivity, and reflectivity are assumed independent of the radiation wavelength [27].
(4) When considering radiation heat exchange, the north wall, north roof, east wall, and west wall of the greenhouse are treated as a single radiator (enclosure wall). The temperature and thermal radiative property parameters (reflectivity, emissivity) of this radiator are defined as the weighted averages of the respective parts.
The equivalent sky temperature formulation (Tv) may underestimate the effective sky radiative temperature under heavily overcast or snowy conditions, thereby modestly overpredicting nocturnal radiative heat loss. This error remains within acceptable limits for engineering applications. Moreover, the model provides only an area-averaged representation of the heat transfer process and cannot resolve spatial variations in surface convection under strongly non-uniform wind fields, nor can it capture the localized thermal effects of uneven snow accumulation. To avoid compromising structural safety, snow accumulation on the surface is promptly cleared during production. Therefore, this model does not account for snow cover conditions.
2.3. Heat Transfer Analysis of the Model
2.3.1. Equation and Grid Discretization
In constructing the mathematical model for the internal heat conduction process of the composite thermal blanket applied to the covering layer of a solar greenhouse, The thermal cover of the solar greenhouse is simplified as a one-dimensional heat transfer problem along the thickness direction, denoted as x. The heat transfer process follows the law of energy conservation. In the heat transfer analysis of the cover, the thickness direction is discretized into several grid cells. Internal cells exchange heat only with adjacent cells via conduction. The boundary cells at the inner and outer surfaces, however, exchange heat not only with adjacent cells through conduction but also through various boundary heat exchange mechanisms at the respective surfaces. On the inner surface, these include radiative and convective heat exchange with the indoor air, crops, and walls, as well as latent heat exchange due to condensation of water vapor. On the outer surface, they include convective heat exchange with the outdoor air and long-wave radiative heat exchange with the sky. These boundary heat exchanges are incorporated into the calculation as heat source terms in the corresponding grid cells, thereby affecting the heat exchange of those cells. The core governing equation is as follows:
where is the material density of grid , in kg m−3; is the specific heat capacity of the material in grid , in J kg−1 K−1; T is is the gradient operator along the thickness direction; is the thermal conductivity of the material, in W m−1 K−1; and S is the heat source term of the grid, representing the additional heat flux from various boundary heat exchanges.
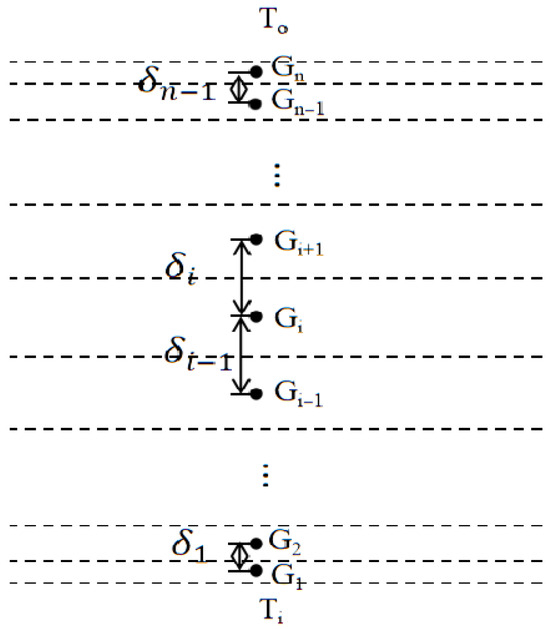
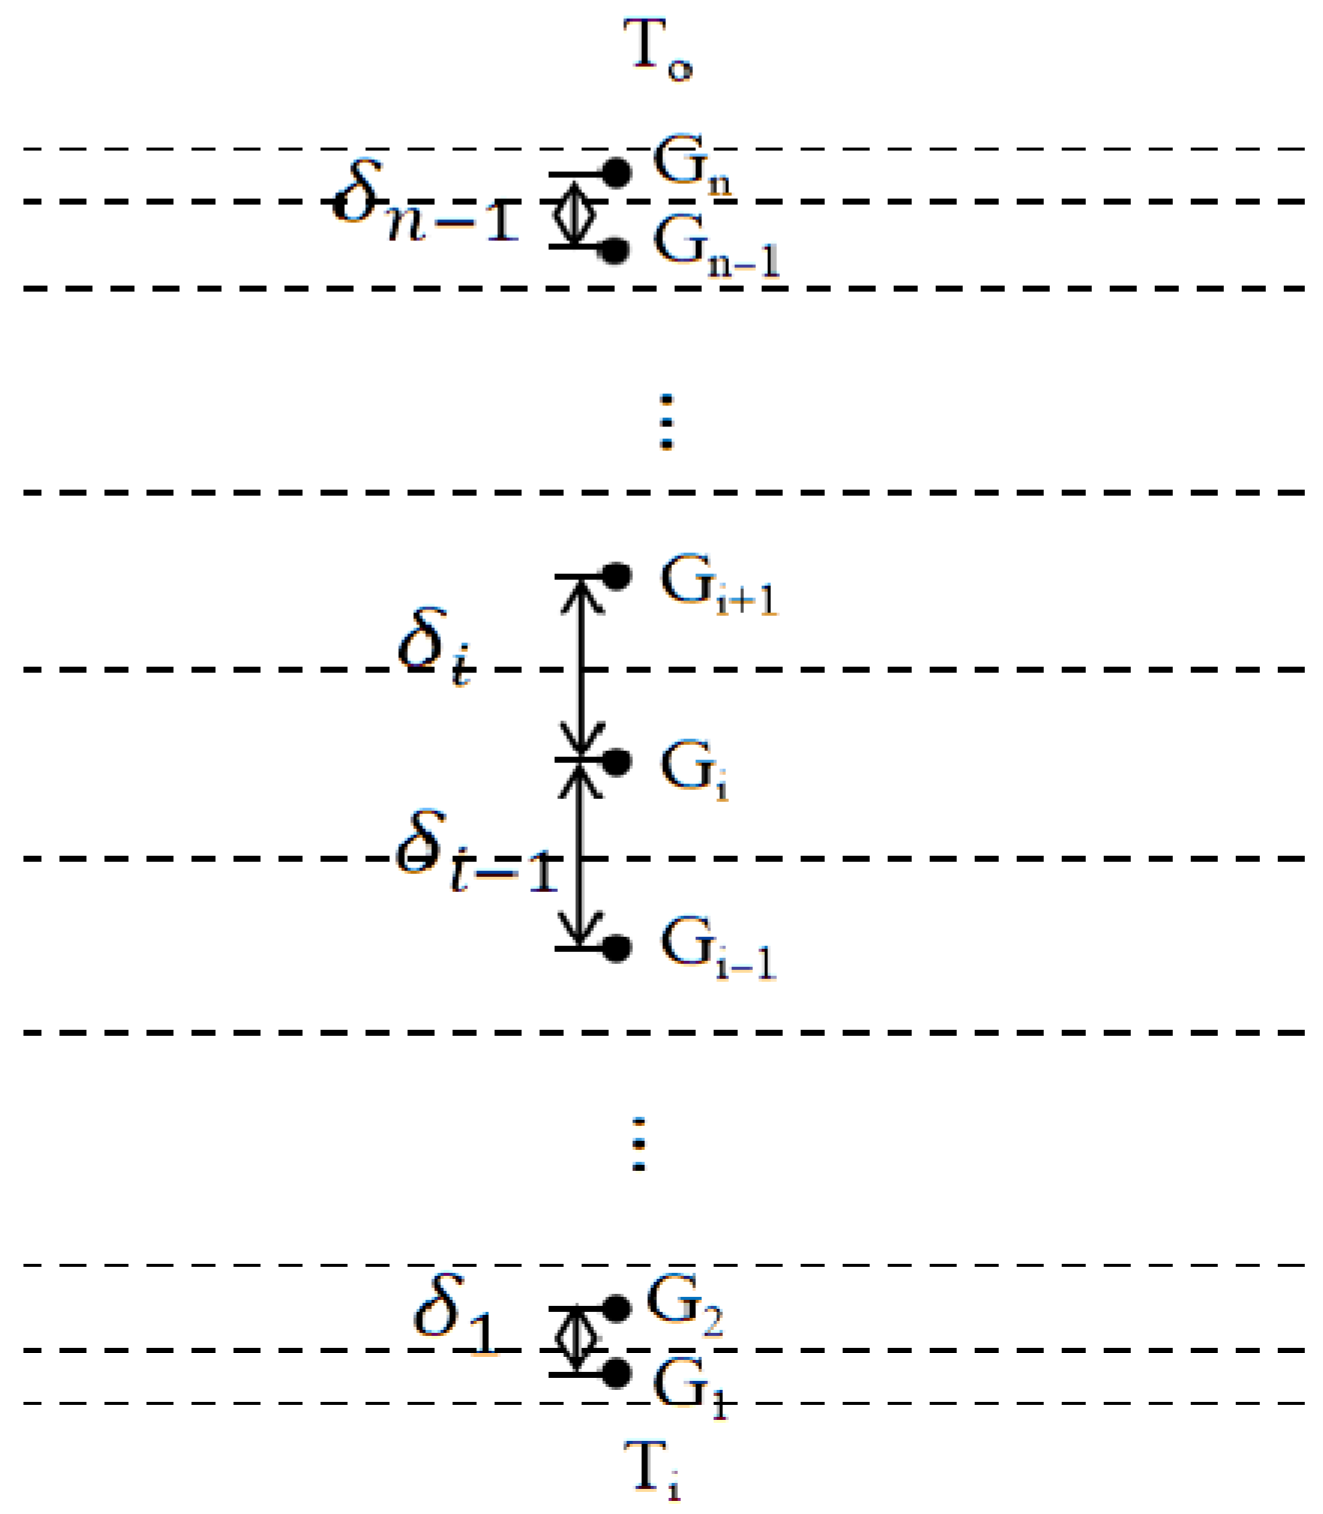
For the multilayer structure consisting of the transparent cover and the composite thermal blanket, the grid is discretized along the thickness direction from the indoor side to the outdoor side, taking into account the actual material layers and their thermal properties. Based on the actual heat transfer process, a non-uniform grid with coarser spacing in the middle and finer spacing near the boundaries is adopted: grid cells are refined near the boundaries where the temperature gradient is large, while coarser spacing is used in the interior where the temperature variation is smooth. The grid cells are denoted as Gi (where i = 1, 2, …, n − 1, n), with the distance between the central points of adjacent grids is . The first cell on the indoor side is G1 and the last cell on the outdoor side is Gn. The specific grid layout is shown in Figure 2.
Figure 2.
Internal grid division of the composite thermal insulation.
Based on the finite difference method, the governing equations above are discretized into a difference form that can be solved iteratively:
where is the grid length, in mm; is the time step, in s; and are the thermal conductivities at the interfaces between grids and grids , in W m−1·K−1; is the distance between the center points of grid and grid , in mm; is the distance between the center points of grid and grid , in mm; , and are the temperatures of grid , and at time step , respectively, in K; is the heat source term within grid at time step .
For interior grids (i ≠ 1, n), heat exchange occurs only by conduction with the adjacent grids above and below, with no additional boundary heat exchange terms. Therefore, the difference equation simplifies to:
For the bottom boundary grid (i = 1, indoor side), heat is exchanged by conduction with the adjacent grid G2 above it, while below it, radiative heat exchange occurs with various indoor surfaces, convective heat exchange occurs with the indoor air, and latent heat exchange due to water vapor condensation also takes place. These boundary heat exchanges are incorporated into the equation as grid heat source terms. Therefore, the finite difference expression for the bottom boundary grid is:
For the top boundary grid (i = n, outdoor side), heat is exchanged by conduction with the adjacent grid Gn−1 below it, while above it, long-wave radiative heat exchange occurs with the outdoor sky background and convective heat exchange occurs with the outdoor air. These boundary heat exchanges are likewise incorporated as source terms. Therefore, the finite difference expression for the top boundary grid is:
To simplify the solution of the system of equations, we introduce the following coefficient substitutions:
Substituting these yields the complete system of linear equations:
This system of equations is a standard tridiagonal linear system, which can be further written in matrix form as follows:
Using the Thomas algorithm (also known as the tridiagonal matrix algorithm) to solve this matrix, the temperatures for all grids at each time step—, , …, —_can be efficiently obtained through iteration, thereby yielding the dynamic temperature field distribution within the composite thermal blanket.
2.3.2. Initial Conditions
Initial conditions employ field-measured surface temperatures at τ = 0 with internal grid values obtained through linear interpolation between the two surfaces. For novel, untested blanket structures, initial temperatures may be reasonably assigned based on typical local meteorological data and standard greenhouse operating states. The model then runs repeated 24 h cycles with a 60 s time step. After each diurnal cycle, the temperature field is compared to the cycle’s start. Iteration ceases when the maximum absolute nodal temperature difference falls below 0.05 °C, confirming a quasi-steady periodic state has been reached [28].
2.3.3. Boundary Conditions
The upper and lower boundary conditions of the governing equations correspond to three types of heat exchange processes that occur between the inner and outer surfaces of the composite thermal blanket and the surrounding environment: radiation, convection, and water vapor condensation. The lower boundary condition describes the heat exchange between the inner surface of the blanket and the indoor environment, while the upper boundary condition describes the heat exchange between the outer surface of the blanket and the outdoor air and sky background. Together, these two boundary conditions determine the overall heat loss of the thermal blanket.
- (1)
- Lower boundary conditions
Radiation heat exchange: the composite thermal blanket and the walls, as opaque surfaces, have effective radiation that includes their own emitted radiation and the reflected portion of effective radiation from other surfaces. The incident radiation on the inner surface of the thermal blanket originates from the upper surface of the crop, the thermal blanket itself, and the walls. The incident radiation on the walls originates from the upper surface of the crop, the walls themselves, and the inner surface of the covering layer.
The crop within the greenhouse, as a three-dimensional radiating body, has leaves with diverse spatial angles, making it difficult to accurately calculate the view factors between it and surrounding surfaces. Therefore, when simulating crop radiation heat exchange, based on plant canopy radiation transfer theory, the three-dimensional crop population is equivalent to a semi-transparent medium layer with a characteristic thickness H and an equivalent extinction coefficient k. Both its upper and lower boundaries are treated as gray body surfaces satisfying diffuse reflection conditions. The effective radiation , from the upper and lower surfaces of the crop includes their own emitted radiation, reflected radiation from the inner surface of the composite thermal blanket or the soil surface, and transmitted radiation. The incident radiation on the upper crop surface primarily involves radiation exchange with the inner surfaces of the greenhouse walls and the composite thermal blanket, while the incident radiation on the lower surface involves radiation exchange only with the soil surface.
Under actual production conditions, plastic mulch is often laid in the greenhouse. For radiative heat transfer analysis, the plastic mulch and soil are considered as an equivalent composite surface, using the emissivity and reflectivity of the mulch surface. The soil surface is also treated as an opaque surface. Its effective radiation consists of its own emitted radiation and the reflection of effective radiation from the lower crop surface. Its incident radiation involves radiation exchange only with the lower surface of the crop layer.
where , , , and are the effective radiation of the inner surface of the covering layer, the inner surface of the wall, the upper and lower surfaces of the crop layer, and the soil surface at time step , respectively, in W m−2; , , , and are the incident radiation on each surface at time step , respectively, in W m−2. is the Stefan–Boltzmann constant, with a value of ; , , and are the surface areas of the covering layer, wall, crop, and soil, respectively, in m2; is the view factor from surface a to surface b; , , and are the emissivities of each surface; , , and are the reflectivities of each surface; is the transmittance of the crop layer to longwave radiation; , , , and are the temperatures of each surface at time step respectively, in K.
Convective heat exchange: indoor air forms natural convection due to temperature differences, or forced convection due to ventilation systems, crop transpiration, etc., resulting in convective heat exchange with the inner surface of the composite thermal blanket. The convective heat exchange formula between indoor air and the inner surface of the thermal blanket is as follows [29]:
where is the convective heat exchange between indoor air and the inner surface of the covering layer at time step 1, in W m−2; is the convective heat transfer coefficient of the inner surface of the covering layer at time step ; is the indoor air temperature at time step , in K; is the temperature of the inner surface of the covering layer at time step , in K.
Water vapor condensation heat exchange: when indoor humidity is high, condensation may occur on the inner surface of the thermal blanket if its temperature falls below the dew point, releasing latent heat and further influencing surface heat exchange. This process is coupled with convective heat exchange, jointly determining the comprehensive heat transfer characteristics of the covering layer [30,31].
The dew point temperature is calculated as follows:
The latent heat flux due to water vapor condensation on the inner surface of the covering layer is:
The saturation vapor pressure at the temperature of the covering layer’s inner surface is:
where is the dew point temperature at time step , in K; is the indoor air temperature at time step , in K; is the latent heat flux due to water vapor condensation on the inner surface of the covering layer at time step , in W m−2; is a humidity calculation constant, in Pa K−1; is the indoor water vapor pressure at time step , in Pa; is the saturated vapor pressure at the inner surface of the overburden at time step corresponding to the temperature , in Pa.
Combining the three types of heat exchange—radiation, convection, and condensation—the expression for the heat source term at the bottom boundary grid G1 is given by:
- (2)
- Upper boundary conditions
Radiation heat exchange: long-wave radiation exchange continuously occurs between the outer surface of the thermal blanket and the sky background , with the two exchanging energies through the mutual emission and reflection of thermal radiation. The effective radiation of the outer surface consists of its own thermal radiation plus the reflected portion of the downward long-wave radiation from the sky background. Likewise, the effective radiation of the sky background is composed of its own thermal radiation plus the reflected portion of the upward radiation from the outer surface of the blanket. The corresponding calculation formulas are as follows:
where and are the effective radiation of the sky background and the outer surface of the covering layer at time step , respectively, in W m−2; , are the incident radiation on each surface at time step , respectively, in W m−2; is the surface area of the sky background, in m2; are the emissivities of each surface; , are the reflectivities of each surface; , are the temperatures of each surface at time step , respectively, in K.
Convective heat exchange: forced convection heat exchange, primarily driven by external wind, occurs between the outer surface of the covering layer and the outdoor air.
The convective heat exchange formula between outdoor air and the outer surface of the thermal blanket is as follows:
where is the convective heat exchange between outdoor air and the outer surface of the covering layer at time step , in W m−2; is the outdoor wind speed at time step , in m s−1; is the outdoor air temperature at time step , in K; is the temperature of the outer surface of the covering layer at time step , in K.
Based on the governing equations, a program was developed. By inputting the initial conditions and boundary condition parameters into the program, the required numerical results were calculated.
Combining radiative and convective heat transfer, the expression for the heat source term at the top boundary grid Gn is:
2.4. Heat Transfer Analysis of the Internal Conduction Within the Thermal Blanket
The composite thermal blanket used on solar greenhouse coverings is typically constructed from multi-functional surface layer materials and fibrous porous core materials. Its core thermal function is to significantly increase the overall thermal resistance of the covering layer through its porous medium characteristics, thereby suppressing the heat dissipation process dominated by conduction. Therefore, the composite thermal blanket is treated as two parts for calculation: the dense surface layer material and the porous material.
The heat flux due to conduction, is calculated as follows:
where and are the thicknesses of the dense surface layer and the fibrous porous material, respectively, in m; and are the thermal conductivities of the corresponding materials, in W∙m−1·K−1; and and are the temperatures of the inner and outer surfaces of the thermal blanket at time τ + 1, in K.
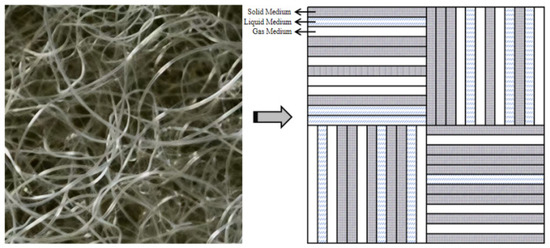
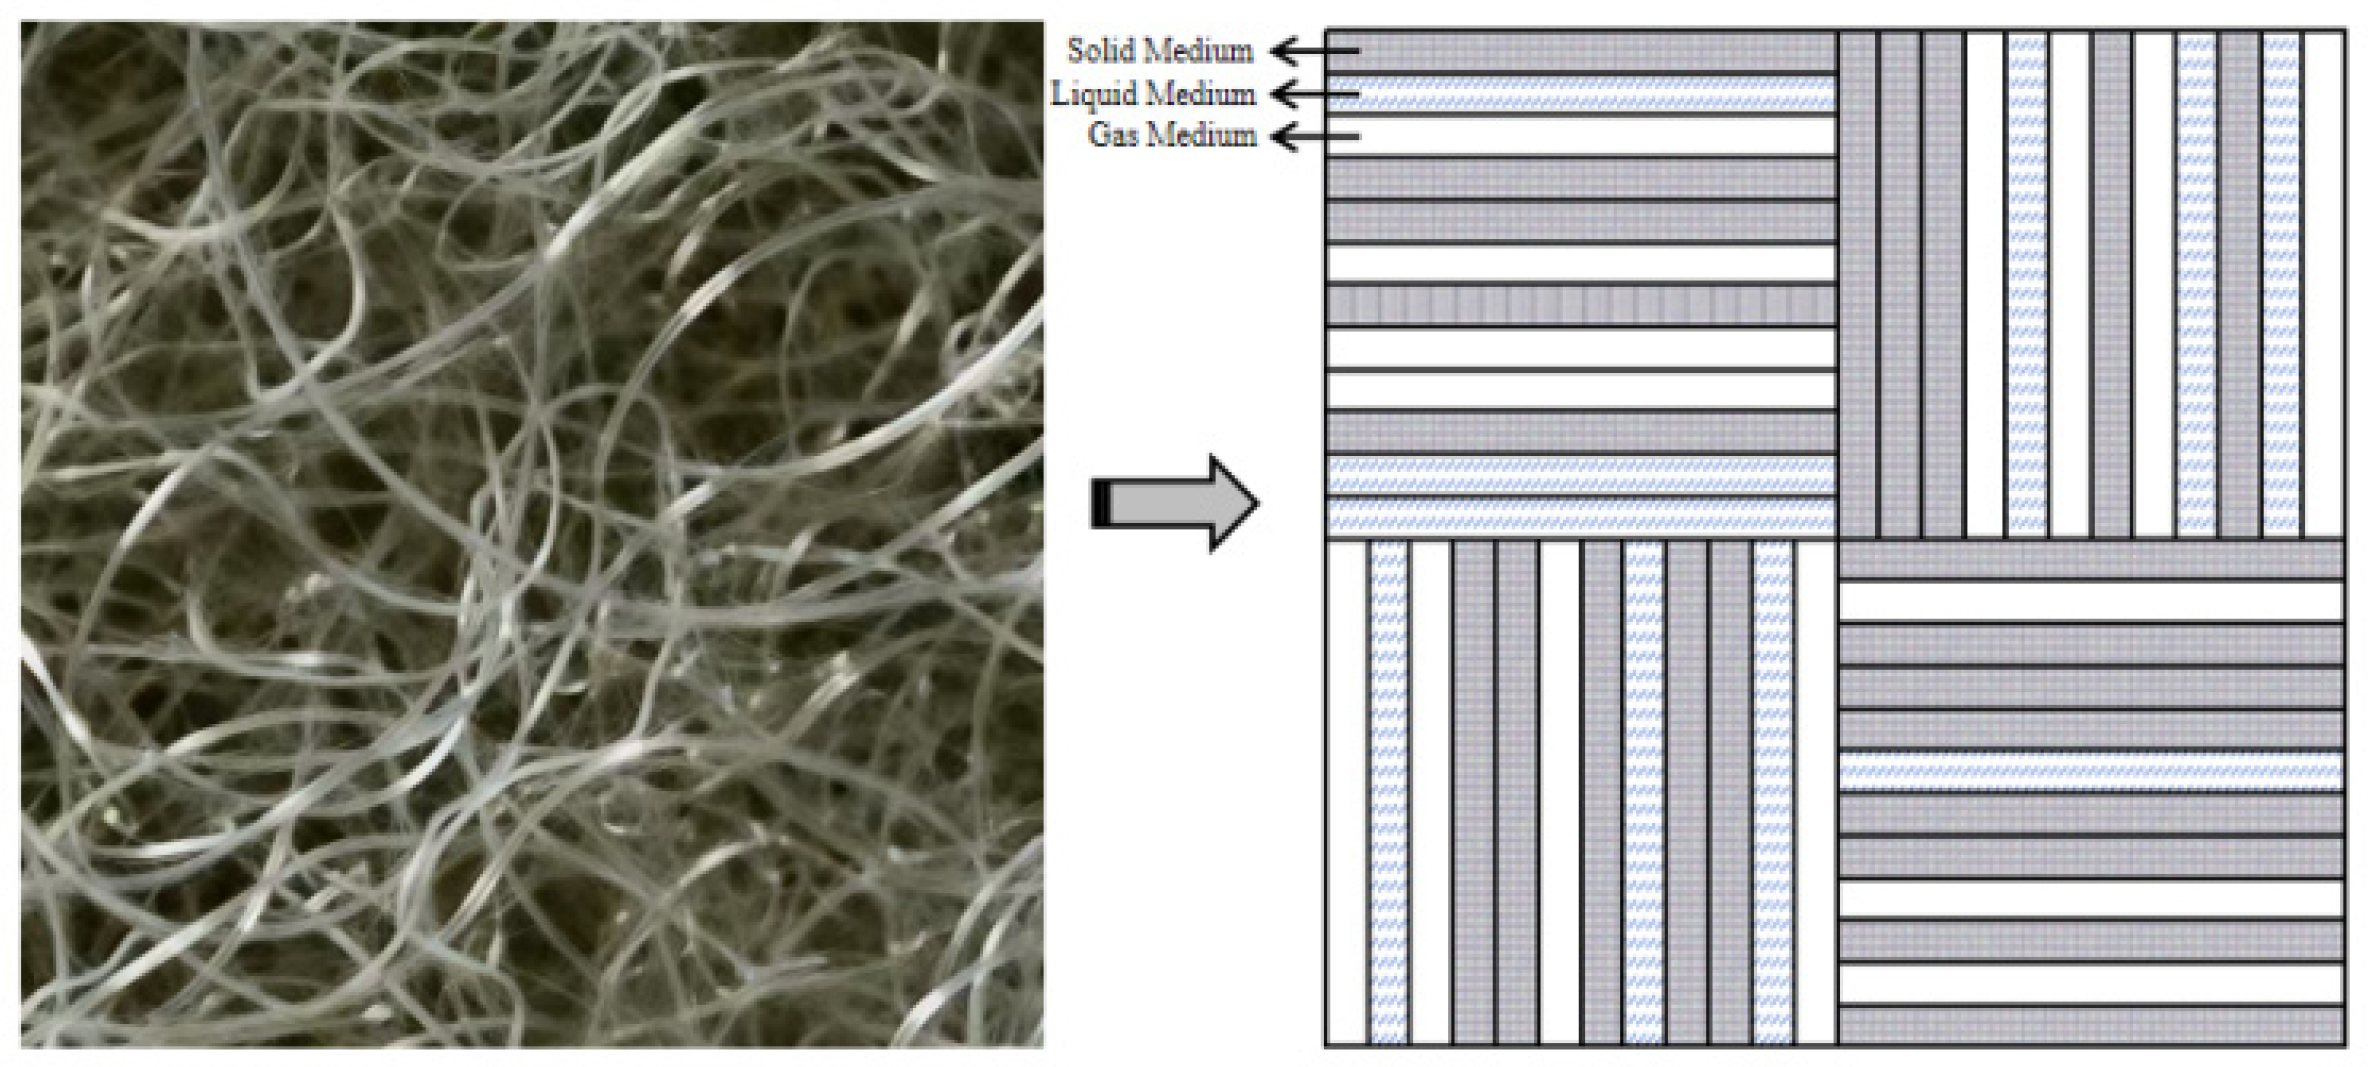
For the fibrous porous material, the internal fibers often exhibit a randomly oriented distribution. The conductive pathways are tortuous and complex, making accurate calculation difficult. In its quantitative analysis, the internal paths are proportionally simplified as a random arrangement of solid, liquid, and gas phases. The conductive paths are considered to be randomly distributed both horizontally and vertically, meaning the conductive thermal resistances are added according to their distribution proportion in series and parallel combinations [32]. The simplification process is illustrated in Figure 3.
Figure 3.
The simplified the process of spray-bonded cotton.
The simplified thermal conductivity of the fibrous porous material is [33]:
where is the pore channel distribution coefficient; , and are respectively the thermal conductivity of solid, liquid, and gas media, in W m−1·K−1; is the porosity; is the moisture content; is the tortuosity; is the filling rate; is the grammage, in ; H is the filter material thickness, in m; is the filter material fiber density, with the unit of .
In this study, porosity () and moisture content (φ) were initially selected based on reported ranges in the literature for each material type [34,35]: = 0.75–0.975 for spray-bonded cotton, = 0.70–0.95 for PE foam, and = 0.30–0.85 for needle-punched felt. Moisture content (φ) varied from 0 to 0.25 to cover dry to near-saturation conditions. These literature-derived parameters were then examined within the model and subsequently adjusted through iterative comparison with field experimental measurements to ensure the selected values accurately represented the actual material states encountered in the field validation scenarios.
2.5. Comprehensive Heat Transfer Coefficient
The comprehensive heat transfer coefficient is a key parameter for evaluating the thermal insulation performance of the covering layer. Its numerical value directly reflects the overall insulation performance of a composite structure. When a temperature difference exists between the indoor and outdoor environments, heat continuously transfers from the warmer indoors to the cooler outdoors through the coupled mechanisms of radiation, convection, conduction, and latent heat exchange. Based on key thermophysical parameters such as the apparent thermal conductivity, density, and specific heat capacity of the materials, the comprehensive heat transfer coefficient is quantified by calculating the heat flux density through the composite structure under a given indoor-outdoor temperature difference.
The heat flux through the covering layer from the inner side at time step is calculated by:
The formula for calculating the comprehensive heat transfer coefficient of the covering layer at time step + 1 is:
where is the heat flux from the inner side through the covering layer at time step , in W m−2; is the comprehensive heat transfer coefficient of the covering layer at time step , in W∙m−2·K−1.
Based on the governing equations described above, a numerical program is developed. By substituting the initial and boundary conditions as well as the thermophysical properties of the materials into the program and solving iteratively, the temperature field of each grid within the composite thermal blanket, the overall heat transfer coefficient, the heat flux distribution, and other computational results can be obtained.
3. Materials and Methods
3.1. Overview of Field Greenhouses
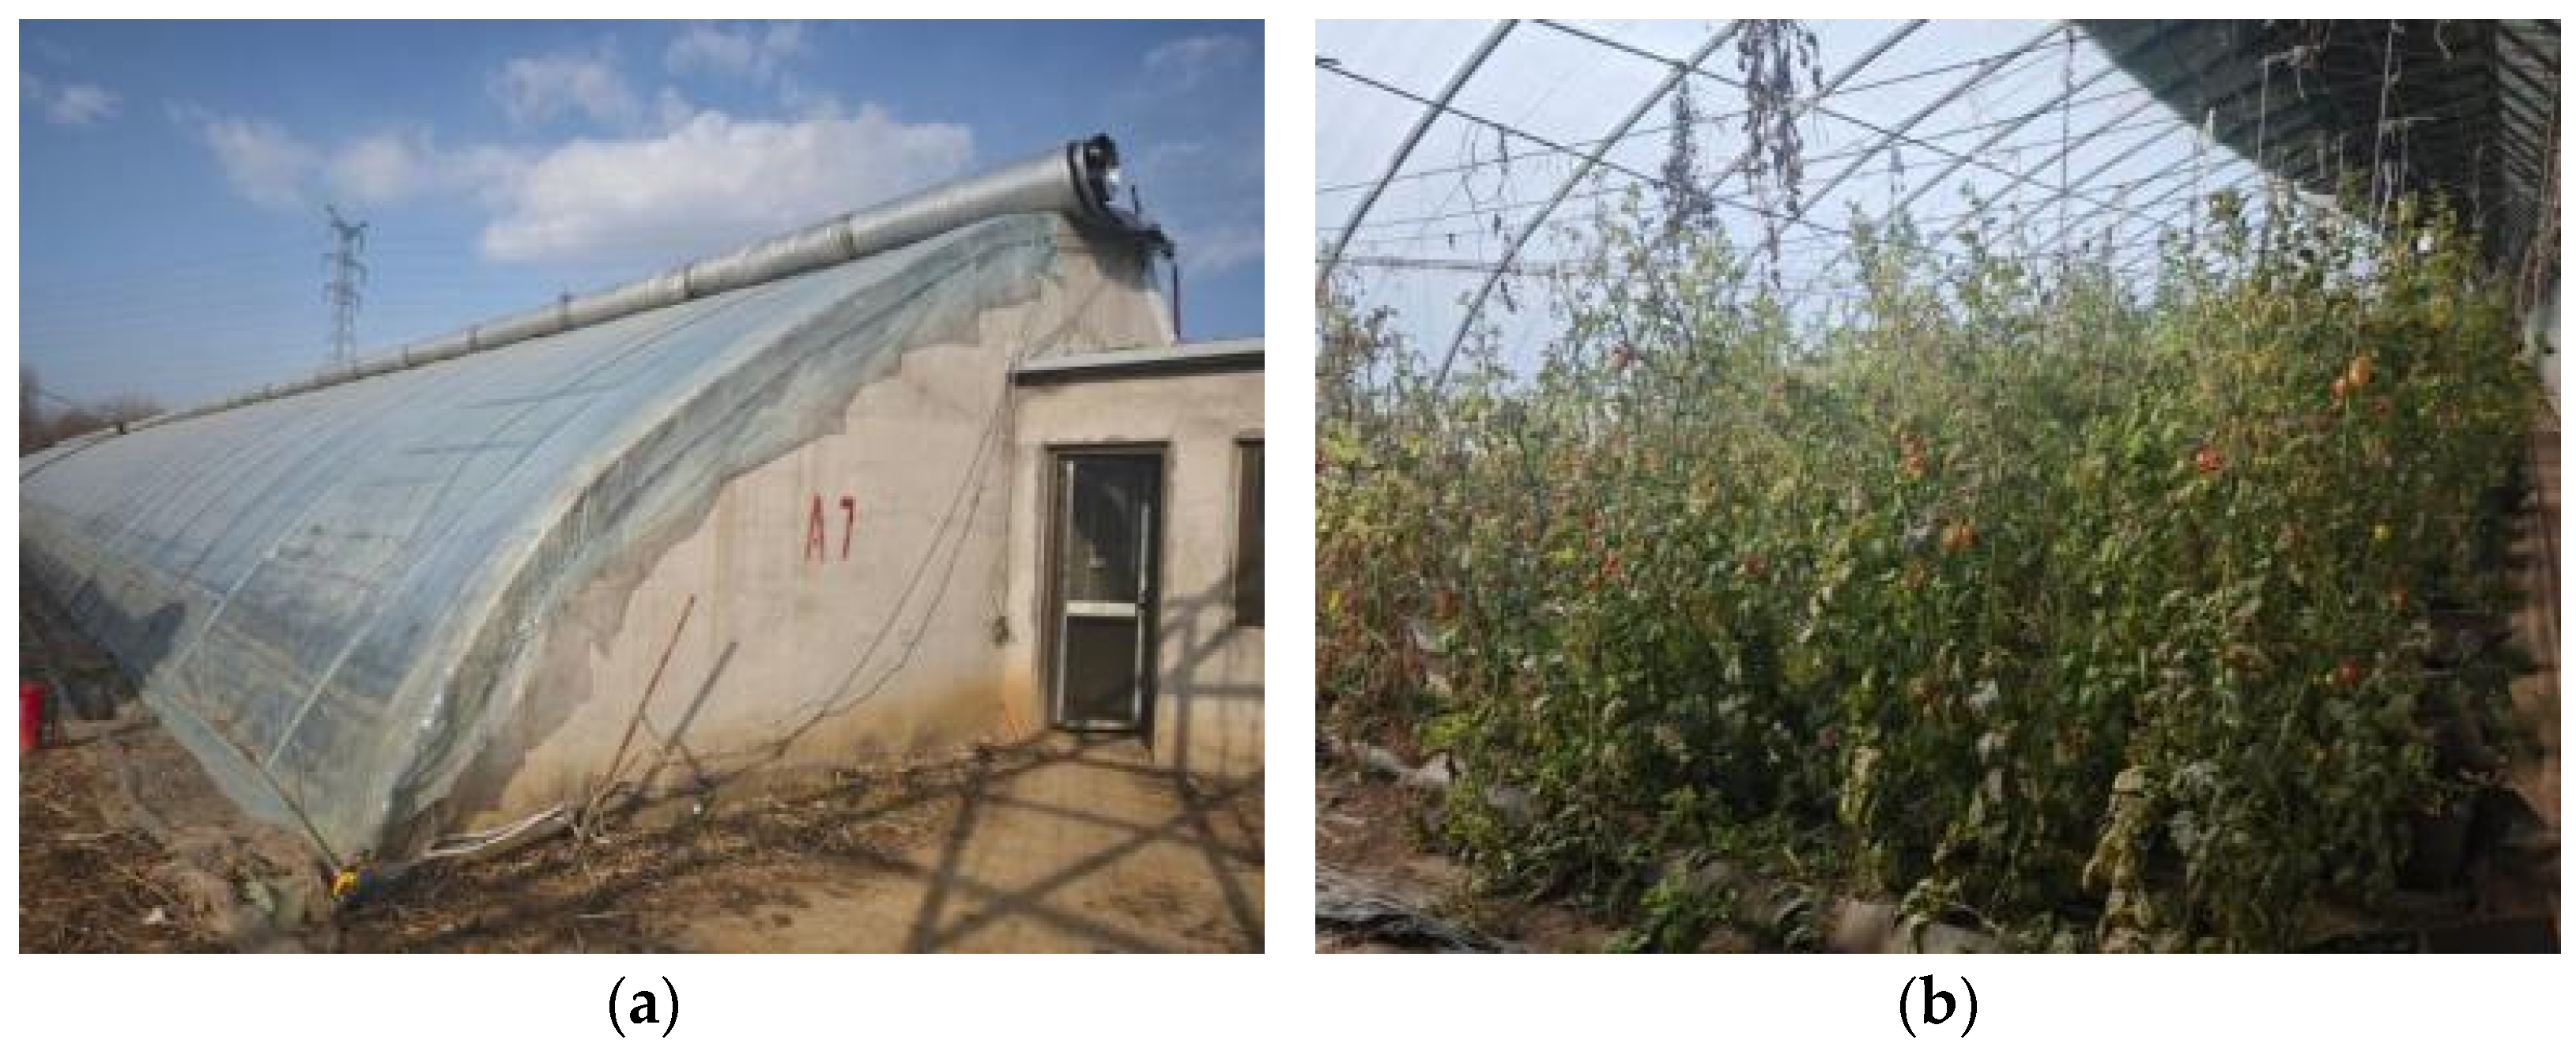
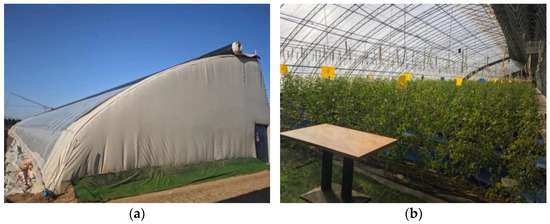
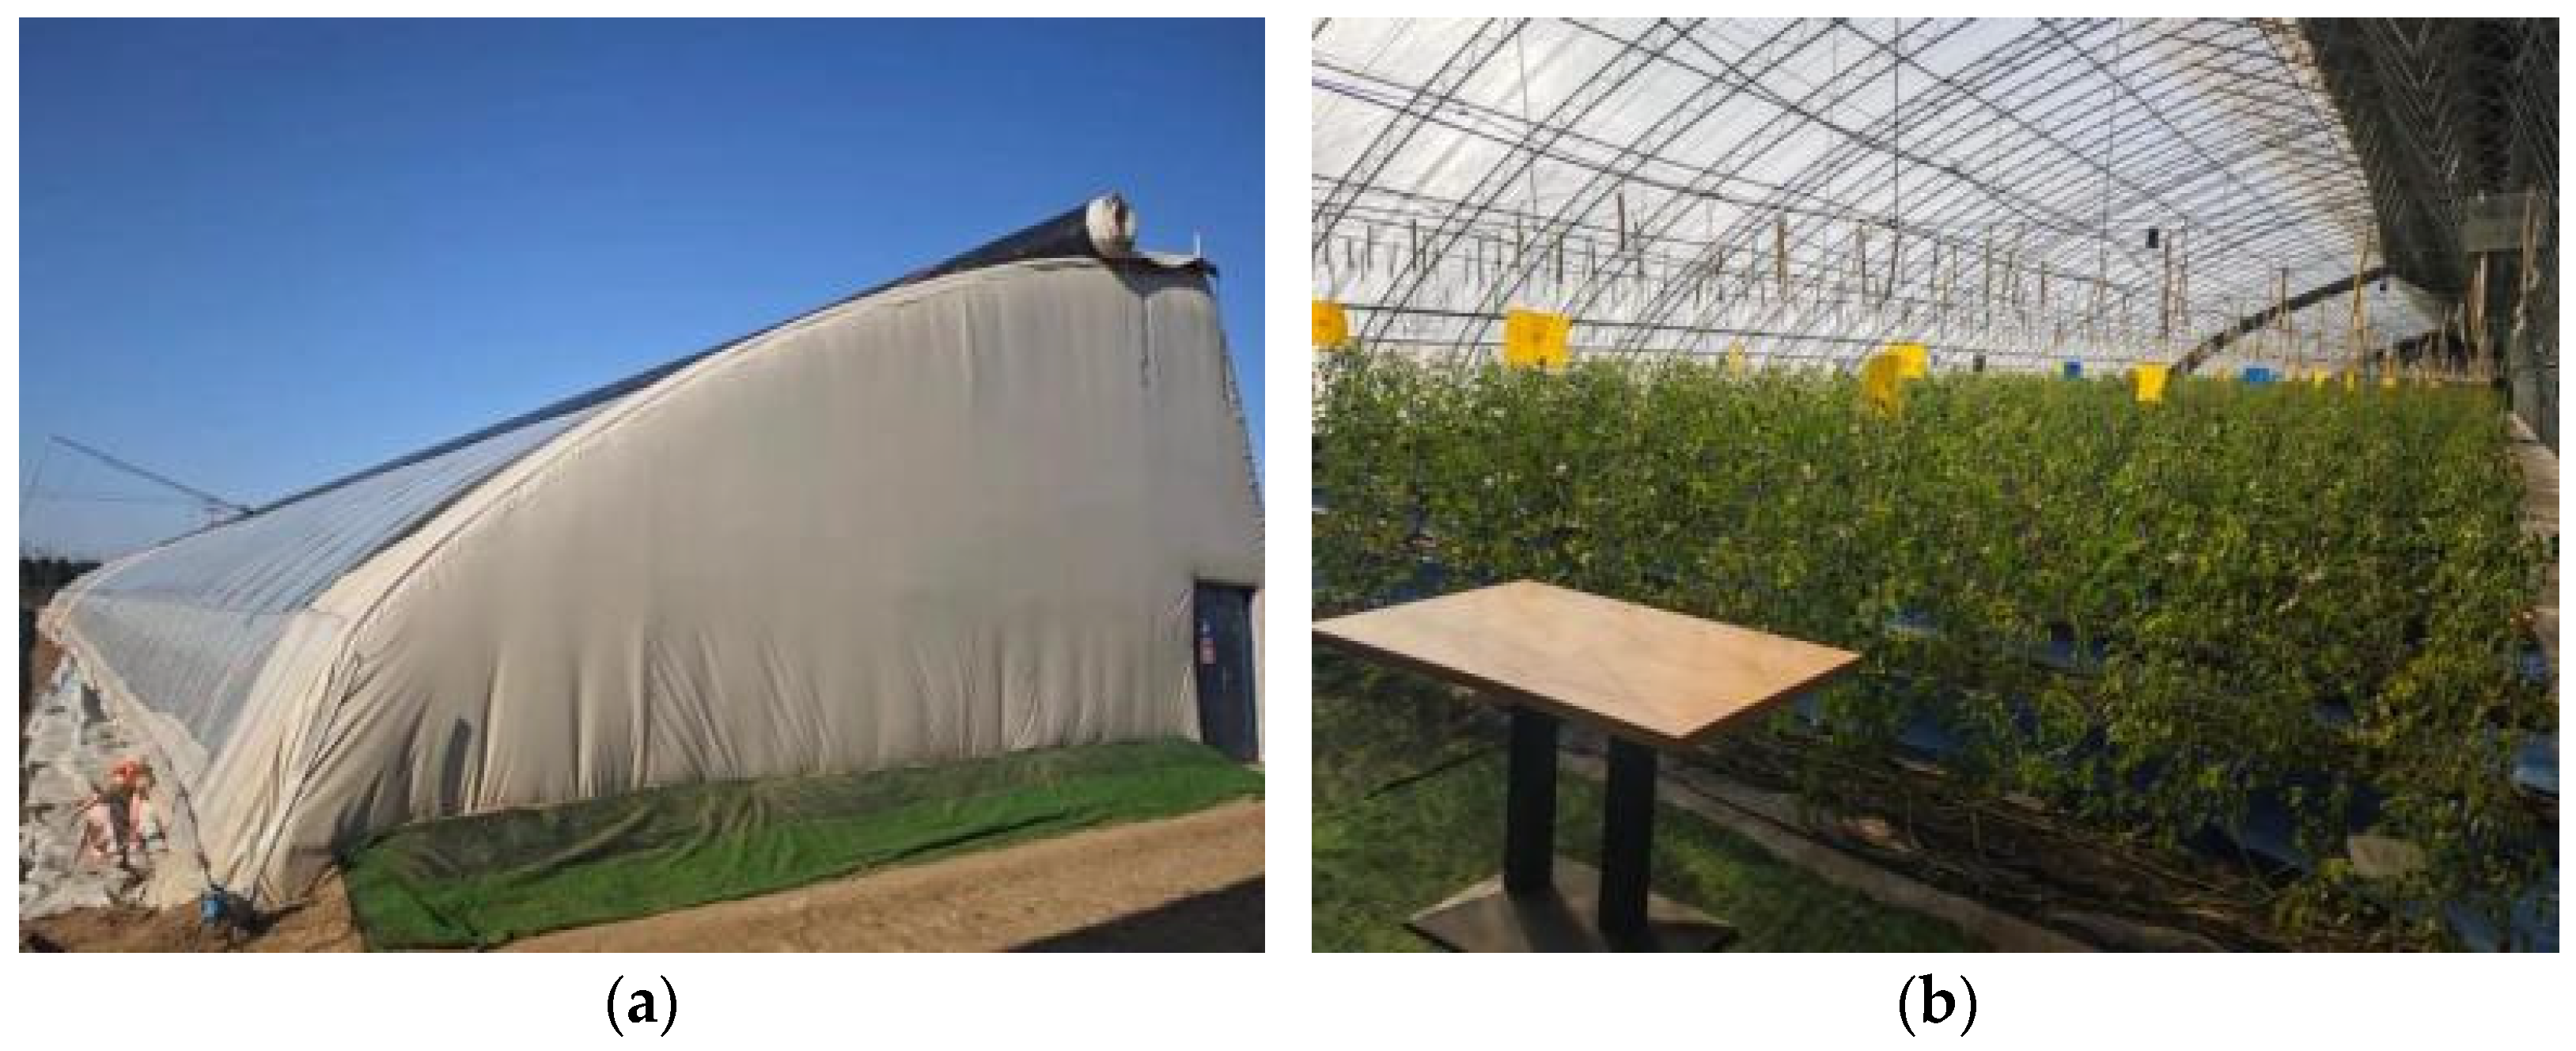
Greenhouse 1 is a traditional brick-wall solar greenhouse located at Hongke Farm in Fangshan District, Beijing (39°74′ N, 116°14′ E). The indoor and outdoor environments of the greenhouse are shown in Figure 4. The greenhouse is oriented east–west, with a length of 85 m, a north–south span of 9 m, a north wall height of 3.1 m, and a ridge height of 4.6 m. The south roof is covered with a 0.1 mm thick PO (Polyolefin) film as the base layer, and a composite thermal blanket as the upper layer. The structure of the composite blanket is: silver aluminized PE woven fabric + PE foam + spray-bonded cotton (1050 g) + silver PE (Polyethylene) woven fabric, with a thickness of 45 cm. During January 2025, the greenhouse was planted with tomato crops in the harvesting period. The composite thermal blanket was typically rolled up around 9:30 a.m. and deployed around 4:30 p.m. daily, with specific times adjusted according to sunrise and sunset.
Figure 4.
On-site environment of a traditional brick-wall solar greenhouse. (a) Outdoor environment; (b) indoor environment.
Greenhouse 2 is a prefabricated solar greenhouses with flexible walls located at the experimental base of Beijing Taimin Tongfeng Agricultural Technology Co., Ltd. in Miyun District, Beijing, China (40°13′ N, 116°39′ E). The indoor and outdoor environments are shown in Figure 5. The greenhouse is oriented east–west, with a length of 75 m, a north–south span of 12 m, and a ridge height of 5.8 m. The south roof is covered with a PO film as the base layer, and a composite thermal blanket as the upper layer. The blanket structure is: brown PVC (Polyvinyl chloride) fabric + spray-bonded cotton + PE foam + black PVC fabric, with a thickness of 32 cm. The north wall and the east–west walls are composed of: black felt (both sides) + two layers of recycled cotton quilt + two layers of PO film + one layer of 0.5 cm cement mortar + 3 cm PVC thermal blanket. During January 2025, the greenhouse was also planted with tomato crops in the harvesting period. The composite thermal blanket operation schedule was similar, deployed around 9:30 a.m. and rolled up around 4:30 p.m. daily.
Figure 5.
On-site environment of the prefabricated solar greenhouses with flexible walls. (a) Outdoor environment; (b) indoor environment.
3.2. Experimental Instruments and Measurement Point Layout
The main parameters of the instruments used in the experiment are listed in Table 1 below. Among them, platinum resistance thermometers (PRTs) were used as temperature sensors to collect temperature data. Temperature data were acquired via a resistance data logger, while solar global radiation, humidity, and wind data were acquired via a current data logger. The data acquisition interval for all instruments was set to 10 min. The collected data were transmitted in real-time to a cloud platform via a 24G communication module.
Table 1.
Parameters of greenhouse testing instruments.
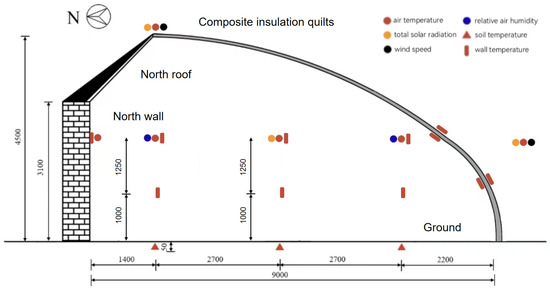
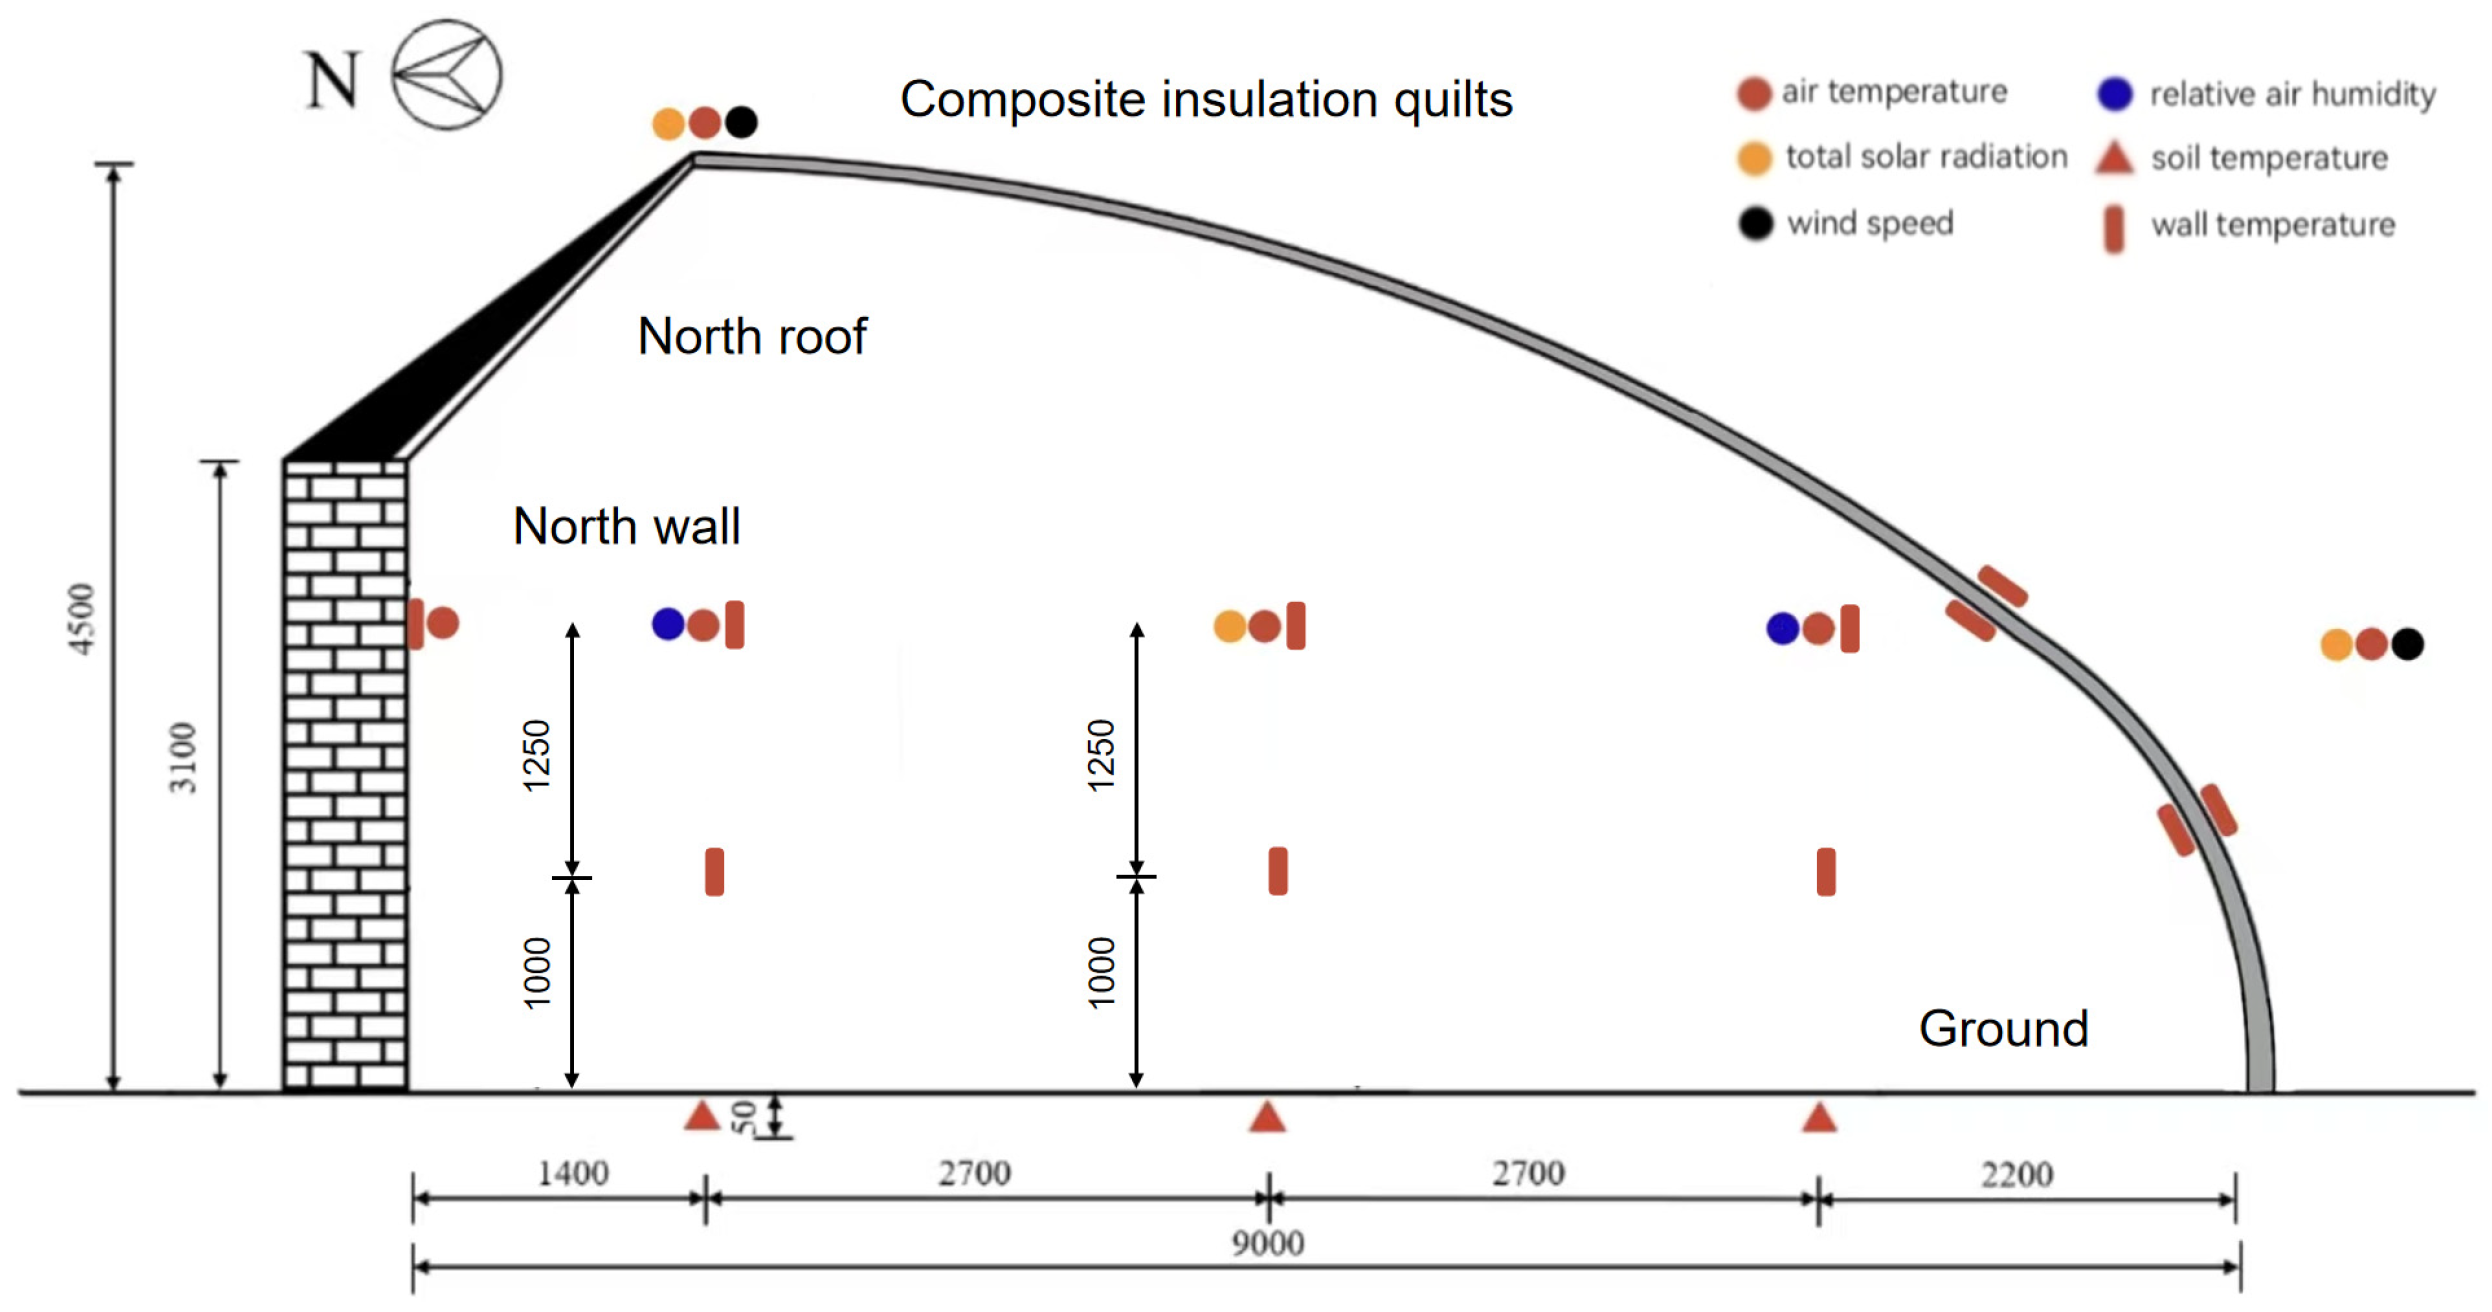
The locations of measurement points in the traditional brick-wall solar greenhouse (Greenhouse 1) are shown in Figure 6. Four temperature measurement points for the inner and outer surfaces of the composite thermal blanket were symmetrically placed at heights of 2.25 and 1.0 m. A cross-section located 30 m from the east wall of the greenhouse was selected as the test section. Along this section, air temperature, crop surface temperature and soil temperature measurement points were evenly arranged in the south, middle, and north positions, with an interval of 2.7 m between adjacent points. Two air relative humidity measurement points were set in the south and north positions. One solar global radiation measurement point was placed at the mid-span of the greenhouse. The air temperature points were at heights of 2.25 m; the crop surface temperature measurement points were at heights of 2.25 and 1.0 m; and the soil temperature points were at a depth of 0.05 m. The wall temperature point, solar radiation point, and air humidity point were at a height of 2.25 m. Spatially averaged arithmetic means of each sensor group were taken as the respective model inputs. An outdoor weather station was installed at the southern part and the ridge of the greenhouse to record external meteorological data synchronously.
Figure 6.
Layout of measurement points in a traditional brick-wall solar greenhouse.
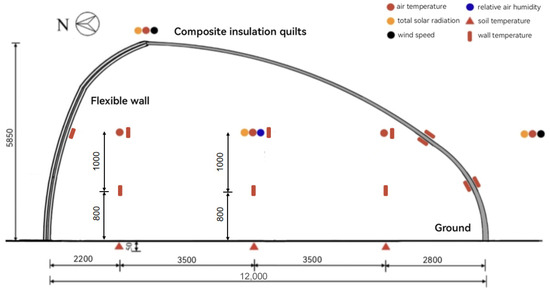
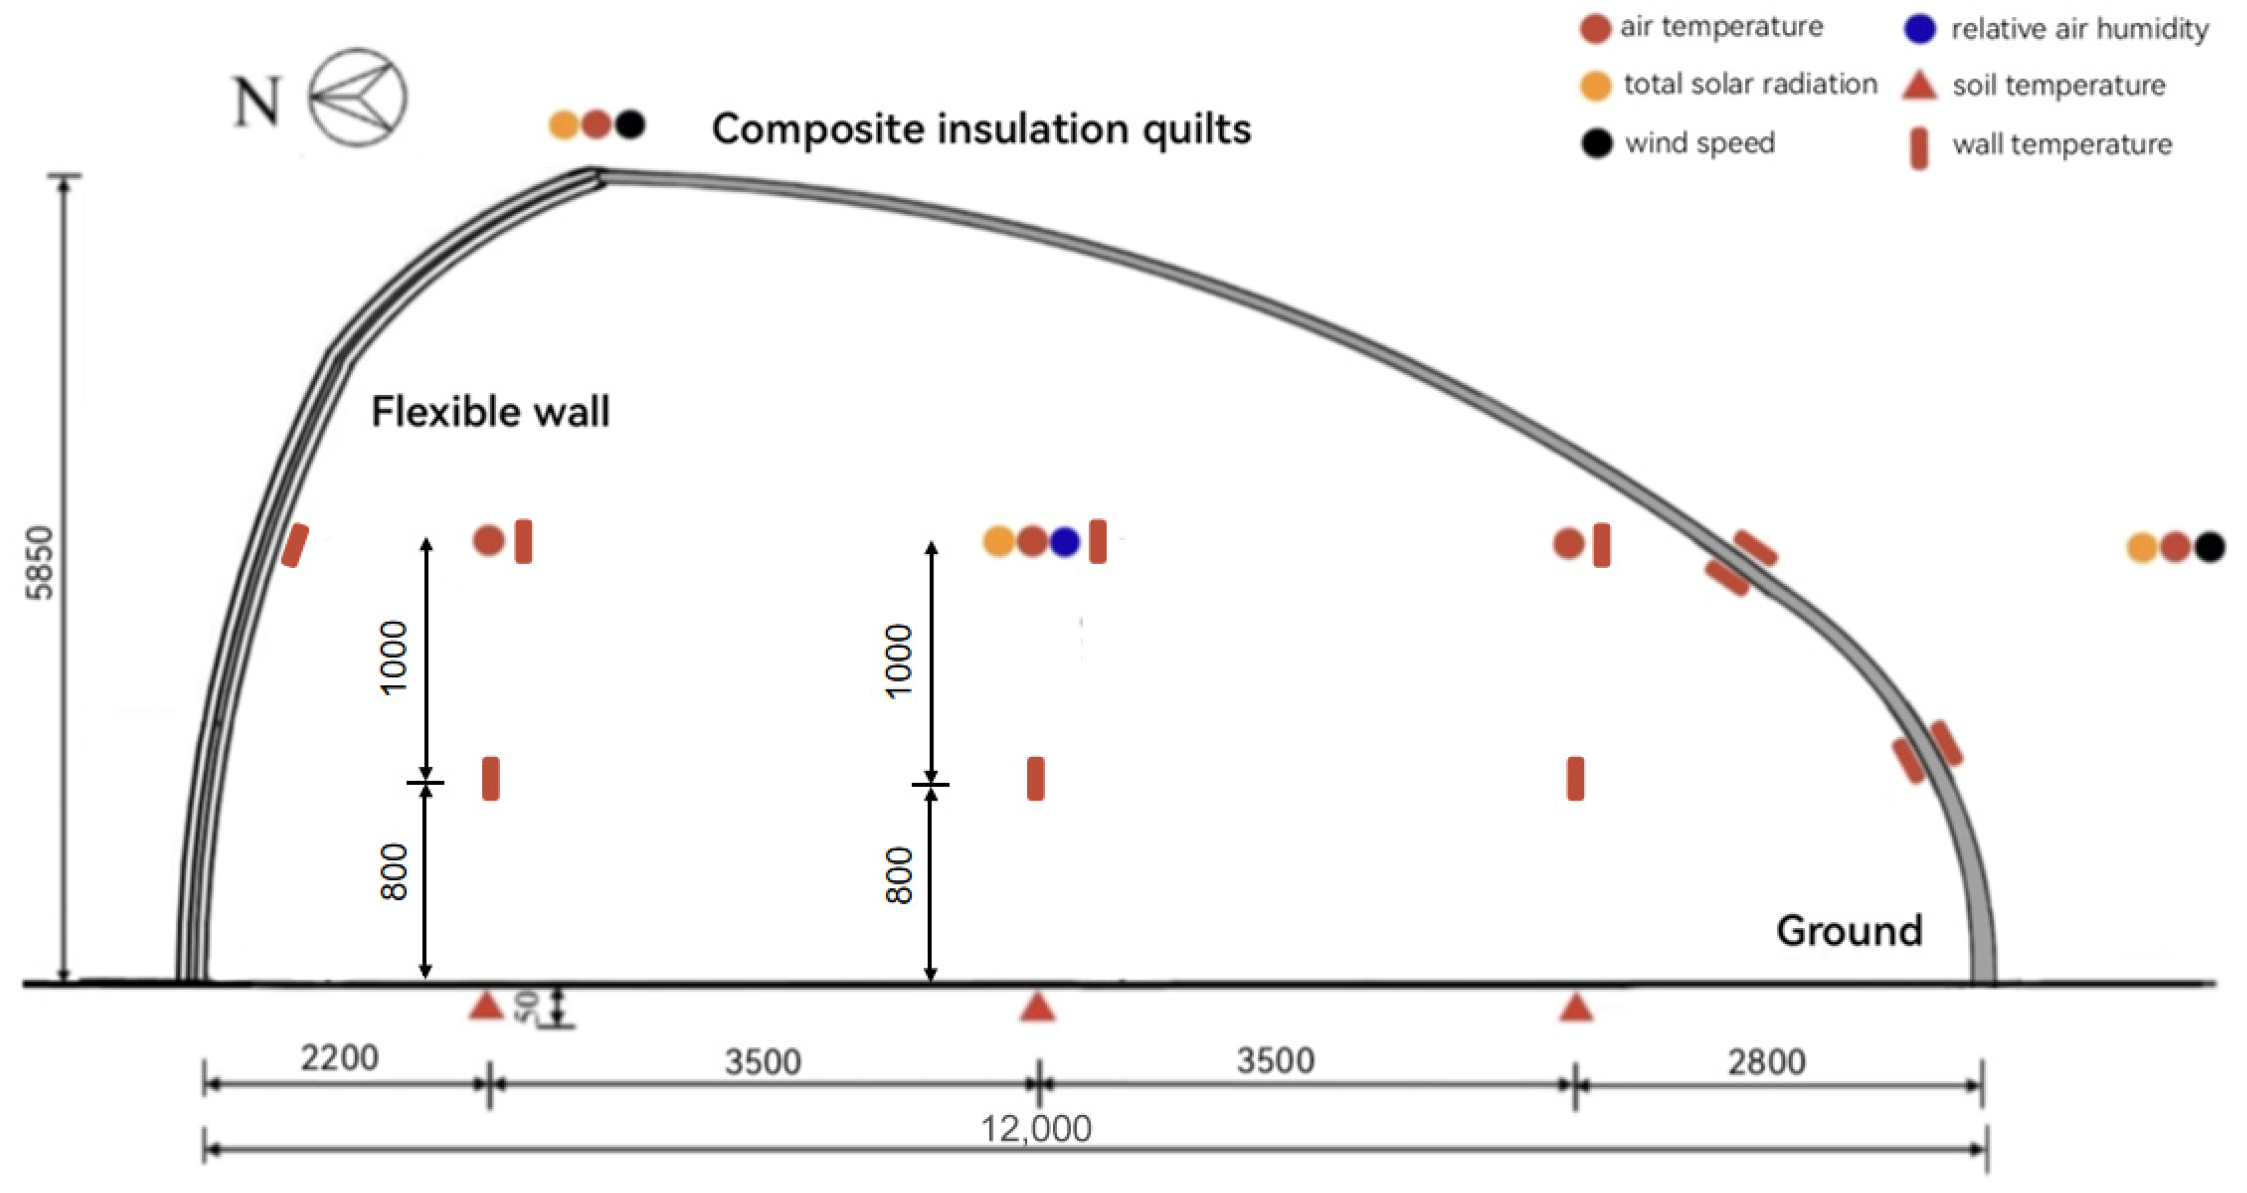
The locations of measurement points in the prefabricated solar greenhouses with flexible walls are shown in Figure 7. Four temperature measurement points for the inner and outer surfaces of the composite thermal blanket were symmetrically placed at heights of 1.8 and 0.8 m. Similarly, a cross-section located 30 m from the east wall was selected as the test section. Along with this section, air temperature, crop surface temperature and soil temperature measurement points were evenly arranged in the south, middle, and north positions, with an interval of 3.5 m between adjacent points. One solar global radiation measurement point and one air relative humidity measurement point were placed at the mid-span of the greenhouse. The air temperature points were at heights of 1.8 m; the crop surface temperature measurement points were at heights of 1.8 and 0.8 m; and the soil temperature points were at a depth of 0.05 m. The wall temperature point, solar radiation point, and air humidity point were at a height of 1.8 m. Spatially averaged arithmetic means of each sensor group were taken as the respective model inputs. An outdoor weather station was installed at the southern part and the ridge of the greenhouse to record external meteorological data synchronously.
Figure 7.
Layout of measurement points for a prefabricated solar greenhouse with flexible walls.
The multi-process coupled heat transfer model for composite thermal blankets in solar greenhouses constructed in this study requires input parameters including the temperatures of the wall, soil surface, crop surface, indoor and outdoor air, as well as outdoor solar radiation, outdoor wind speed, and indoor relative humidity. Model validation was based on measured data, wherein the temperatures of the wall and soil surface were input as weighted average temperatures. The system of equations was solved using Python (3.13.7) programming, with the model output being the inner surface temperature of the composite thermal blanket.
4. Results and Analysis
4.1. Model Validation
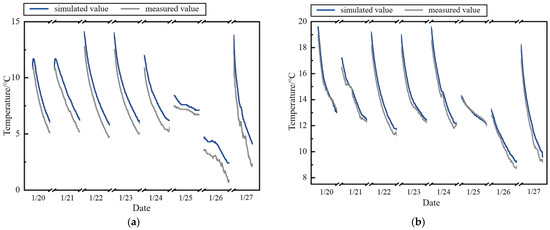
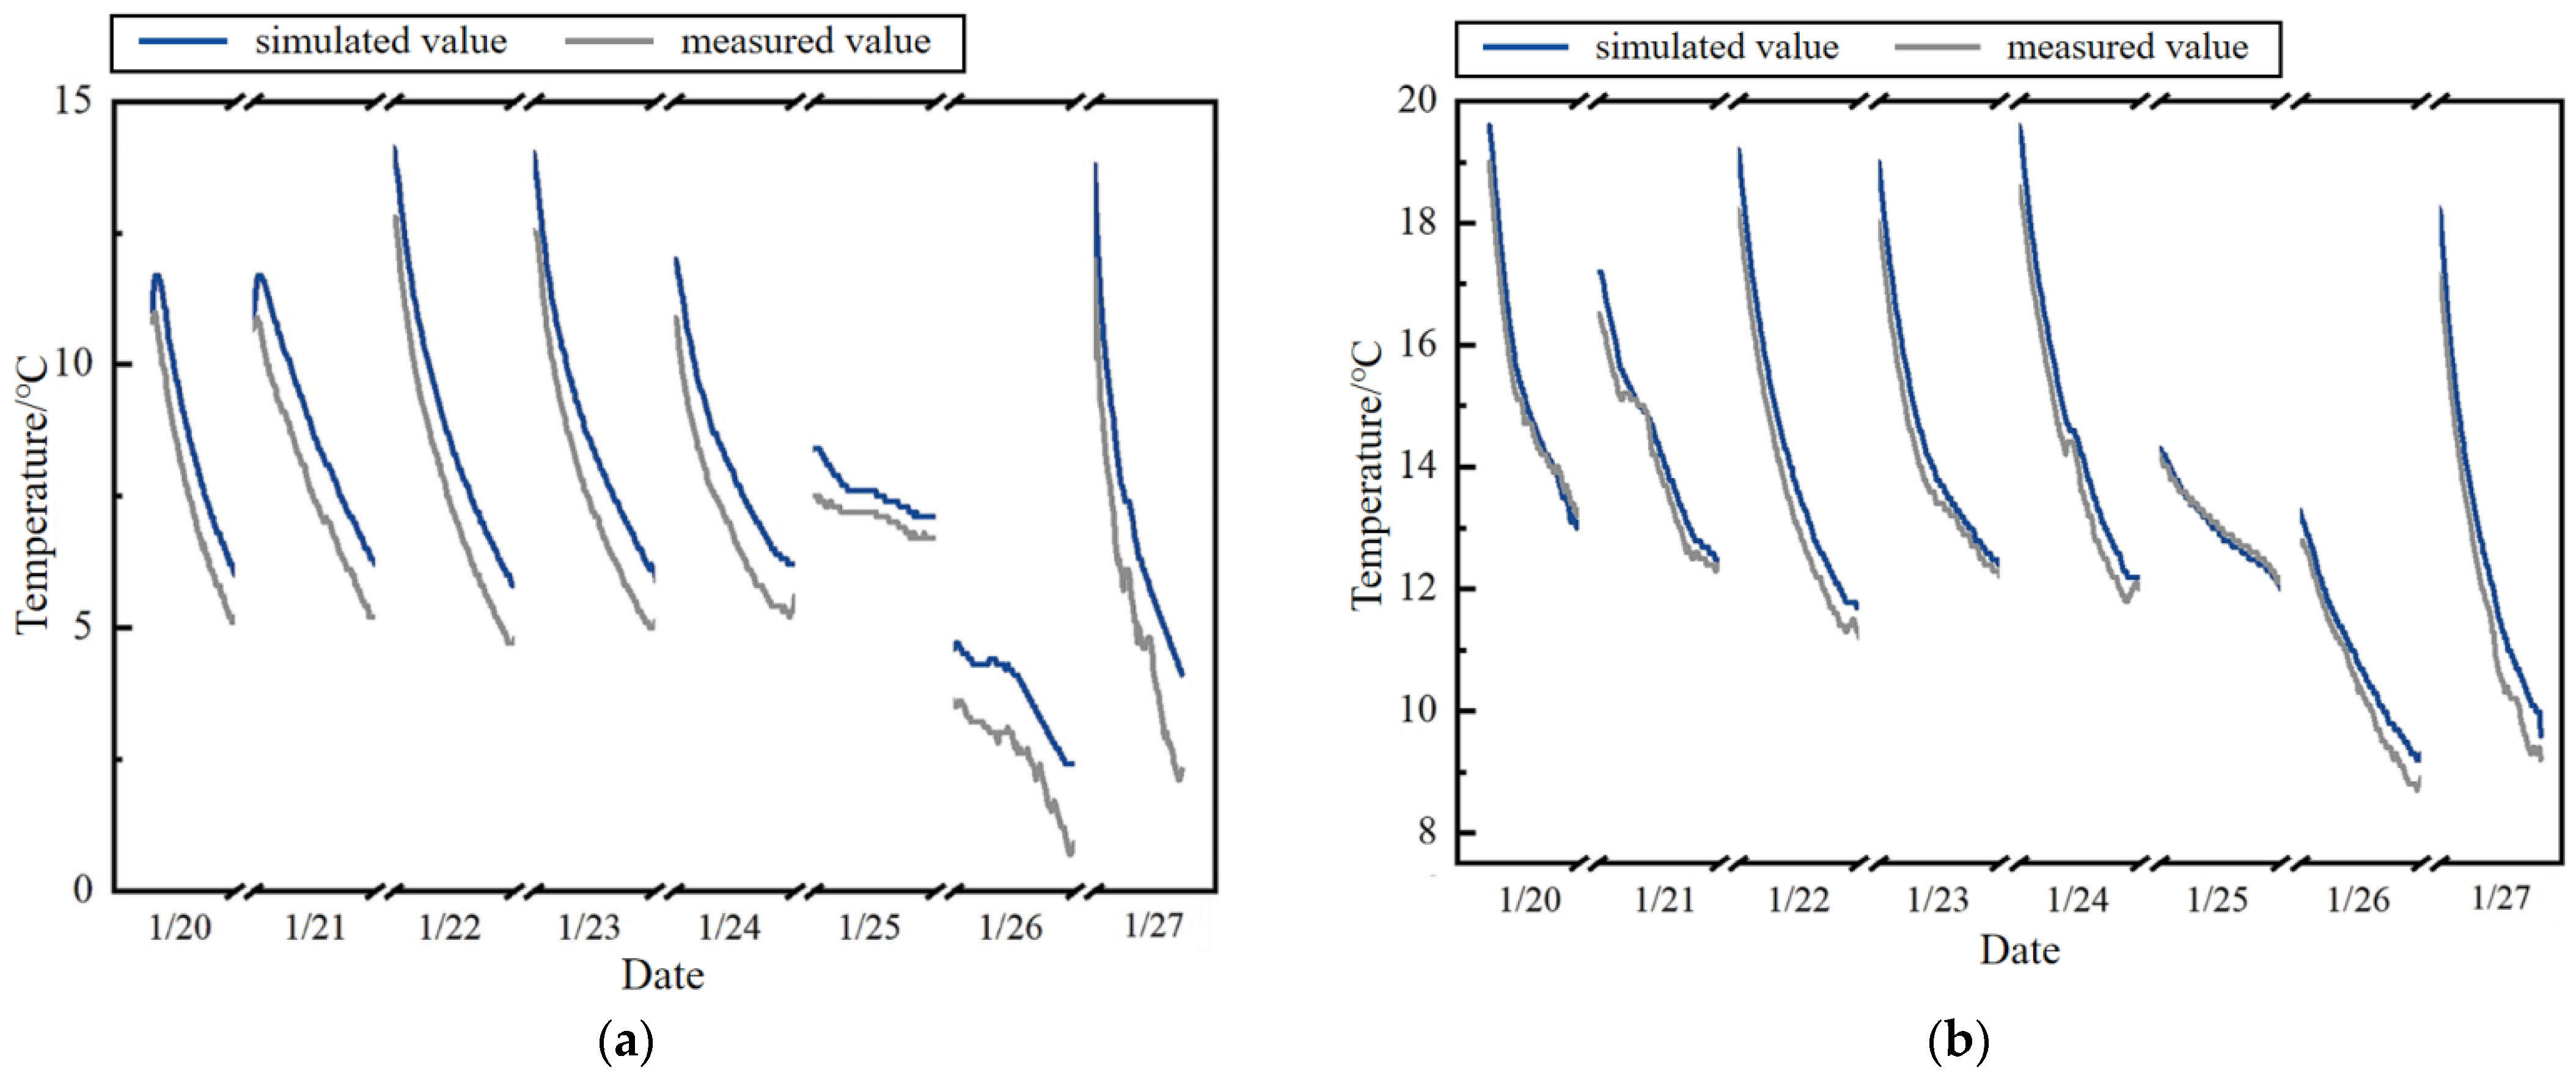
To verify the model’s accuracy and stability, this study selected a traditional brick-wall greenhouse in Beijing’s Fangshan District and a prefabricated solar greenhouse with flexible walls in Miyun District as research subjects. Measured data from 20 January to 27 January 2025 were used for model validation. A comparative analysis was conducted between the measured and simulated values of the thermal blanket’s inner surface temperature, with the results shown in Figure 8. This period falls around the “Great Cold” solar term and features comprehensive weather conditions, covering various types such as sunny days (20, 21, 27 January), cloudy days (22–24 January), and overcast days (25–26 January), providing strong meteorological representativeness. This study focuses on the heat transfer process after the thermal blanket is deployed at night; therefore, the daily analysis period was defined from 17:00 to 08:00 the next day.
Figure 8.
Comparison of simulated values and a measured values blanket of the solar greenhouse. (a) the traditional brick-wall solar greenhouses; (b) the prefabricated solar greenhouses with flexible walls.
Simulation accuracy was quantitatively assessed by calculating the mean absolute error (MAE), root mean square error (RMSE), and coefficient of determination (R2) between the simulated and measured values. As the results show, for the Fangshan greenhouse, MAE was 1.21 °C, RMSE was 1.27 °C, and R2 was 0.97. For the Miyun greenhouse, MAE was 0.56 °C, RMSE was 1.08 °C, and R2 was 0.85. Overall, the error metrics for both greenhouses were at low levels, strongly demonstrating that the constructed model has good predictive capability for both structural types of greenhouses. However, in the traditional brick-wall greenhouse, the splicing sections of the composite thermal blanket suffer from inadequate sealing, which leads to the formation of localized thermal bridges. Coupled with the continuous nocturnal heat loss from the greenhouse, these localized heat leaks accumulate over time, such that by dawn the measured inner surface temperature falls below the simulated value by approximately 1.5 °C. This deviation corresponds to a 5–15% degradation in effective thermal resistance relative to the idealized prediction. Accordingly, the model output may be regarded as a design benchmark for material selection and layer optimization. For structures employing simple lap joints or unsealed hook-and-loop fasteners, a correction factor of 1.05–1.15 should be applied to the simulated overall heat transfer coefficient (Kfl) when estimating heating demand. Persistent deviations between simulated and measured temperatures may also serve as a diagnostic tool to identify areas of excessive air leakage and prioritize targeted sealing retrofits. Further analysis of the model’s performance under different weather conditions revealed that under sunny conditions, the simulated values showed the highest agreement and smallest errors with the measured values. Under cloudy and overcast conditions, despite significant variations in sky radiation, the model maintained high stability, showing only slight deviations during momentary meteorological fluctuations, with the overall simulation trend consistent with the measured data.
To contextualize these validation results, we note that prior greenhouse heat transfer models have reported RMSE values ranging from approximately 1.0 °C to 2.0 °C [10,14]. For instance, the comprehensive south roof model developed by Luo et al. [24] achieved RMSE values of 1.69 °C and 1.92 °C for Beijing and Lhasa sites, respectively, with relative errors of 8.17–18.54%. The present model’s RMSE values (1.27 °C and 1.08 °C) and MAE values (1.21 °C and 0.56 °C) represent a substantial improvement in predictive accuracy, which we attribute to the explicit discretization of the quilt’s internal structure and the integration of material-specific parameters (porosity and moisture content) that are not resolved in coarser, layer-averaged approaches. This progressive deviation is characteristic of thermal bridge effects, wherein localized zones of lower thermal resistance—in this case, air gaps at quilt splicing junctions and the quilt-to-wall interface—create preferential pathways for heat loss. Building science literature estimates that thermal bridges typically account for 5–10% of total envelope heat loss, with values reaching up to 30% in poorly detailed assemblies [11]. The 5–15% performance degradation inferred from our temperature deviation is consistent with this range and reflects the impact of non-ideal installation sealing.
4.2. Influence of Material Porosity
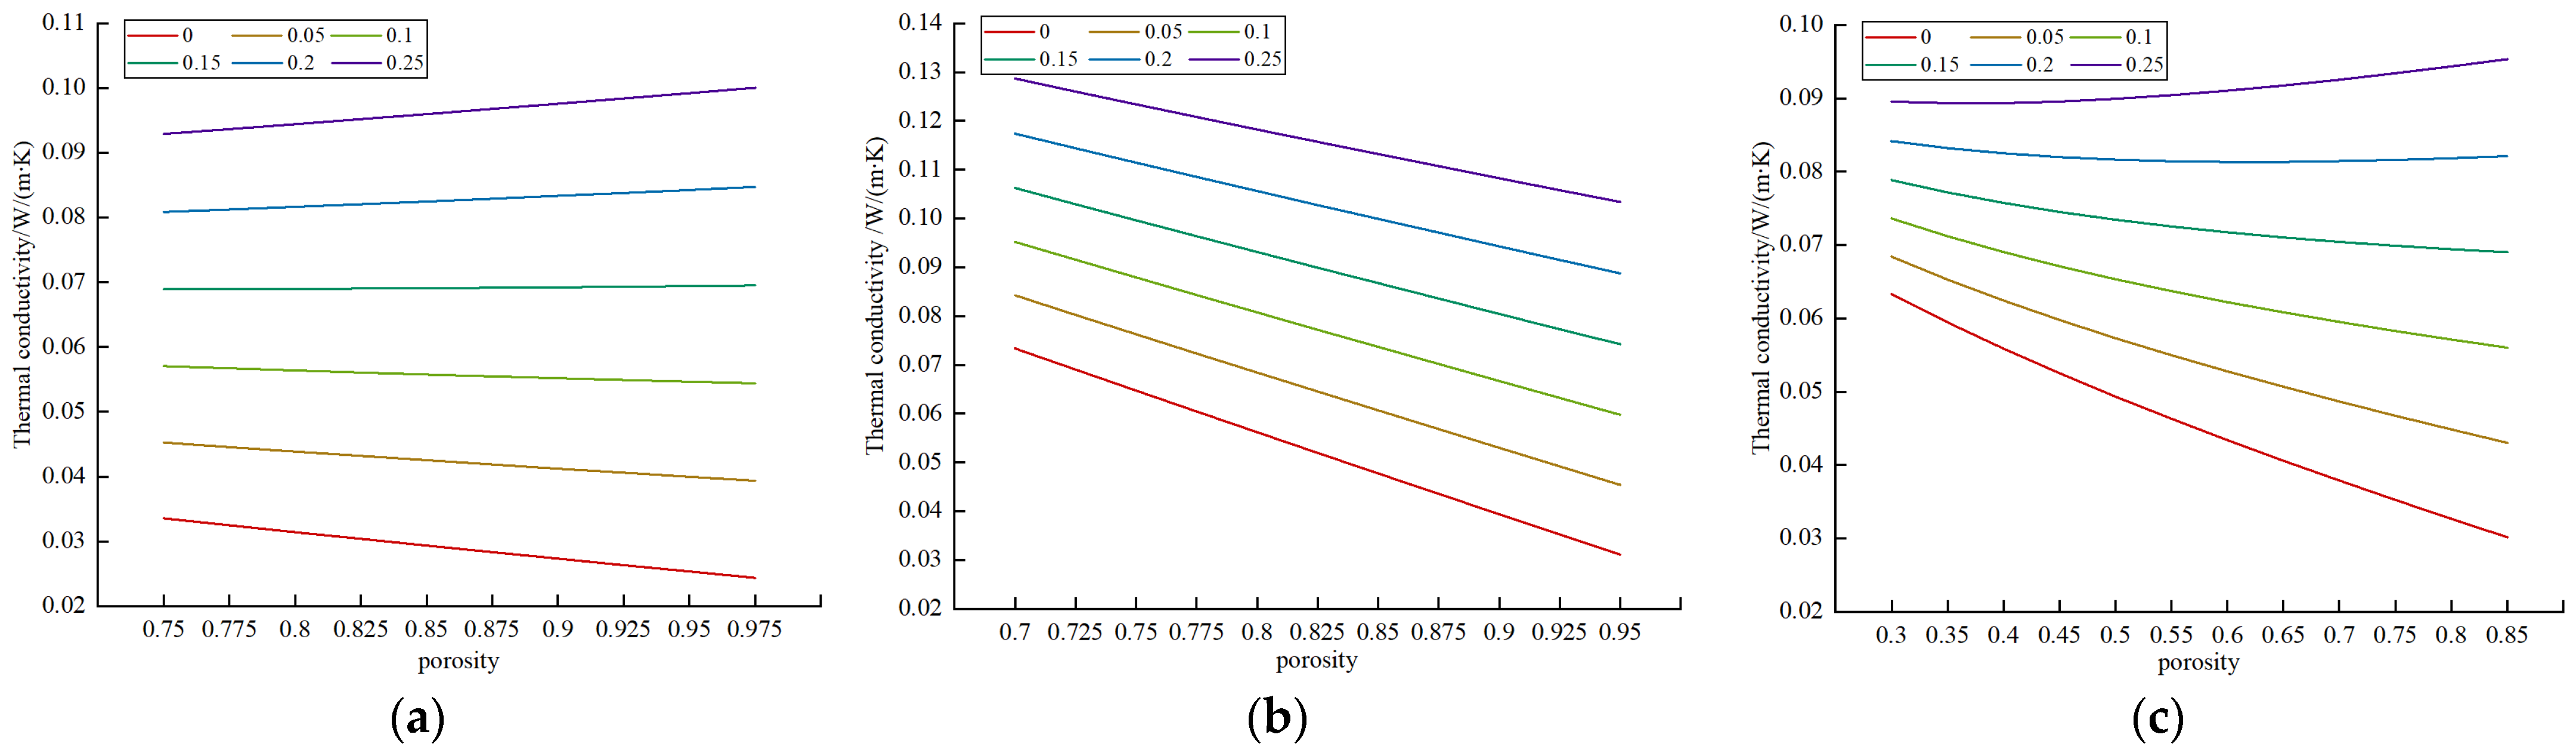
As shown in Figure 9, when the polyester wadding has a low moisture content (≤0.05), its thermal conductivity decreases with increasing porosity. At 0 moisture content, an increase in porosity from 0.75 to 0.975 reduces the thermal conductivity from 0.034 to 0.024 W m−1·K−1, a 27.4% decrease. The influence of porosity on thermal conductivity is minimal at intermediate moisture levels (0.1, 0.15). Conversely, at high moisture content (≥0.2), thermal conductivity shows a slight increase with rising porosity. For instance, at a moisture content of 0.25, increasing the porosity from 0.75 to 0.975 raises the thermal conductivity from 0.093 to 0.1 W m−1·K−1, an increase of 7.7%. For polyethylene (PE) foam, thermal conductivity consistently decreases with increasing porosity across all moisture contents from 0 to 0.25. At zero moisture content, an increase in porosity from 0.7 to 0.95 lowers the thermal conductivity from 0.073 to 0.031 W m−1·K−1, a reduction of 57.6%. Similarly, at a moisture content of 0.25, the same porosity increase causes a drop from 0.12 to 0.1 W m−1·K−1, a 19.6% decrease. In the case of needle-punched felt, thermal conductivity decreases with increasing porosity when the moisture content is between 0 and 0.15. Specifically, at zero moisture content, increasing porosity from 0.3 to 0.85 reduces thermal conductivity from 0.063 to 0.03 W m−1·K−1, a 52.4% decrease. Porosity has a negligible effect at a moisture content of 0.2. However, at a high moisture content of 0.25, thermal conductivity increases slightly with porosity; an increase from 0.3 to 0.85 raises it from 0.089 to 0.095 W m−1·K−1, a 6.5% increase.
Figure 9.
Thermal conductivity of materials under different porosities. (a) spray-bonded cotton; (b) PE foam; (c) needle-punched felt. Note: The thermal conductivity values presented in this parametric analysis are deterministic predictions derived from the theoretical model and are not statistical means of experimental measurements.
The underlying mechanism is related to pore structure and moisture distribution. Higher porosity generally means a greater volume of low-conductivity air, reducing overall thermal conductivity. When moisture content increases, higher-conductivity water replaces the air in the pores, leading to an overall increase in thermal conductivity. Both polyester wadding and needle-punched felt have loose fibrous structures with predominantly interconnected pores. At low moisture levels, these pores are air-filled, so higher porosity (more air) results in lower conductivity. At intermediate moisture levels (0.1, 0.15), water does not fully saturate the interconnected pores; the competing conductive effects of air and water offset each other, minimizing the impact of porosity changes and stabilizing thermal conductivity. At high moisture levels, the interconnected pores allow water to form continuous conductive pathways. Consequently, greater porosity facilitates more extensive water channels, which increases thermal conductivity. In contrast, PE foam is a closed-cell structure. The isolated cells restrict water movement between pores, preventing the formation of continuous conductive pathways. Therefore, even with increased moisture, higher porosity continues to lower the thermal conductivity.
The inverse relationship between porosity and thermal conductivity under dry conditions is consistent with porous media theory. Sarwar and Majumdar [36] developed a unit-cell model demonstrating that pore geometry critically governs this relationship in wet composite media. Wang et al. [37] proposed a fractal-based solid–liquid–gas model that quantitatively captures the effects of porosity, pore size distribution, and moisture content on the effective thermal conductivity of moist porous materials. Similarly, fractal analyses by Kan et al. [38] confirm that at low moisture contents, effective thermal conductivity decreases with increasing porosity, while the series-parallel framework of Zhu et al. [39] shows that tortuous conduction paths in high-porosity fibrous media substantially reduce overall thermal conductivity. The lower moisture sensitivity of closed-cell PE foam compared to interconnected-pore materials (spray-bonded cotton and needle-punched felt) aligns with observations on moisture transport in loose-fill fibrous insulation, which emphasize that transport is governed primarily by fiber structure, moisture content, and the presence of pore air [40]. In PE foam, the closed-cell morphology isolates water within discrete bubbles, thereby preventing the formation of continuous conductive pathways.
Futhermore, Parametric analysis showed that replacing a needle-punched felt core (ϕ = 0.65) with high-porosity spray-bonded cotton (ϕ = 0.9) at identical low moisture (φ = 0.05) reduced effective thermal conductivity by approximately 20%, lowering the overall heat transfer coefficient from 1.28 to 1.03 W∙m−2∙K−1. For a 400 m2 solar greenhouse in northern China, a heating season of 120 days, and a daily nocturnal heating period of 12 h, this equates to annual heating energy savings of roughly 10.4 GJ and a reduction of ~1.33 metric tons of CO2 per heating season (coal-fired baseline), substantiating the model’s contribution to energy-efficient, low-carbon protected agriculture.
4.3. Influence of Material Moisture Content
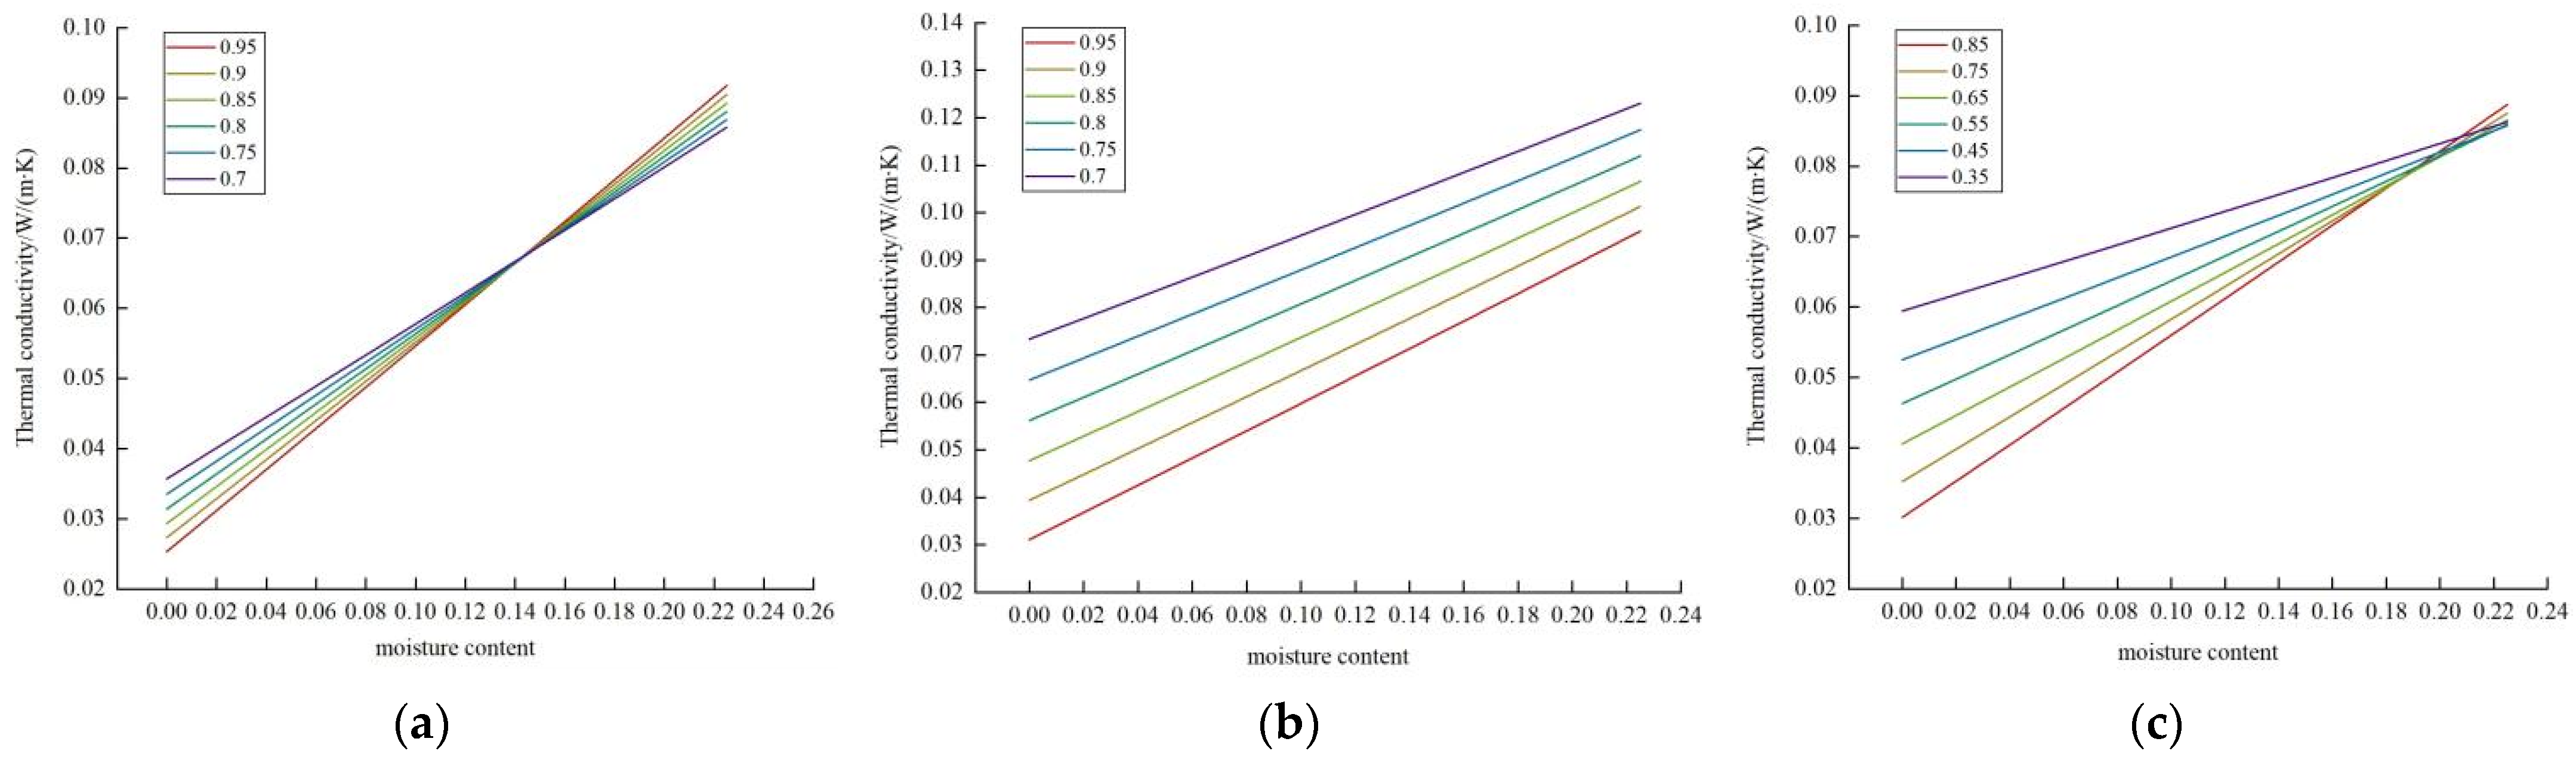
As shown in Figure 10, when material porosity is constant and moisture content increases from 0 to 0.225. For spray-bonded cotton with a porosity of 0.7, the thermal conductivity increases from 0.036 to 0.086 W m−1·K−1, representing a 138.9% increase; When the porosity is 0.95, the thermal conductivity rises from 0.025 to 0.091W m−1·K−1, corresponding to a 264% increase. For PE foam with a porosity of 0.7, the thermal conductivity increases from 0.073 to 0.123 W m−1·K−1, a rise of 68.5%; When the porosity is 0.95, the thermal conductivity increases from 0.031 to 0.096 W m−1·K−1, representing a 209.6% increase. For needle-punched felt with a porosity of 0.35, the thermal conductivity increases from 0.059 to 0.086 W m−1·K−1, a rise of 45.8%; When the porosity is 0.85, the thermal conductivity increases from 0.03 to 0.089 W m−1·K−1, corresponding to a 196.7% increase.
Figure 10.
Thermal conductivity of materials with different moisture contents under the same porosities. (a) spray-bonded cotton; (b) PE foam; (c) needle-punched felt. Note: The thermal conductivity values presented in this parametric analysis are deterministic predictions derived from the theoretical model and are not statistical means of experimental measurements.
Under moist conditions, the thermal conductivity of all three materials—spray-bonded cotton, PE foam, and needle-punched felt—increases linearly with moisture content. This behavior is governed primarily by pore morphology. PE foam, characterized by a closed-cell structure, traps moisture within isolated bubbles, thereby inhibiting the formation of continuous conductive water pathways. In contrast, spray-bonded cotton and needle-punched felt possess interconnected fibrous pore networks. Under dry conditions, higher porosity improves insulation by increasing the air fraction; under moist conditions; however, the interconnected pores facilitate continuous liquid water channels that act as high-conductivity thermal bridges, such that higher-porosity materials exhibit greater thermal conductivity at elevated moisture levels. Parametric analysis reveals that the thermal conductivity of spray-bonded cotton increases by up to 264% as moisture content rises from 0 to 0.225. This prediction aligns with experimental observations: Abdou and Budaiwi [41] reported up to a 260% increase in fiberglass insulation from dry to near-saturation conditions, and Tariku, F et al. [42] confirmed that flat-roof insulation conductivity can rise by 75% to over 260% when moisture content reaches 30% by volume, with moisture uptake governed more by micro-climatic exposure than by service age. Similarly, Kosiński P [40] documented an approximate 90% increase in wood-fiber insulation conductivity after several years of accumulated moisture. More broadly, Yun et al. [43] found that recycled fiber-based insulation conductivity varied from 0.037 to 0.062 W∙m−1∙K−1 depending on fiber type and density, “confirming the sensitivity of thermal transport to moisture-related sorption behavior.” The present model’s predicted conductivity range (0.024–0.10 W∙m−1∙K−1) aligns well with these experimental ranges, lending credibility to the theoretical formulation.
These findings underscore the importance of waterproof layer integrity for long-term thermal performance. The model provides a parametric framework that allows users to quantify the extent of performance degradation caused by moisture ingress by prescribing elevated moisture content values representative of different degradation states—for example, φ = 0.05 (intact), 0.15 (moderate aging), and 0.25 (severe failure). The model can identify the critical moisture content at which the thermal resistance of the quilt falls below a specified design target, thereby informing material selection, maintenance scheduling, or replacement intervals.
4.4. Analysis of Heat Transfer Characteristics
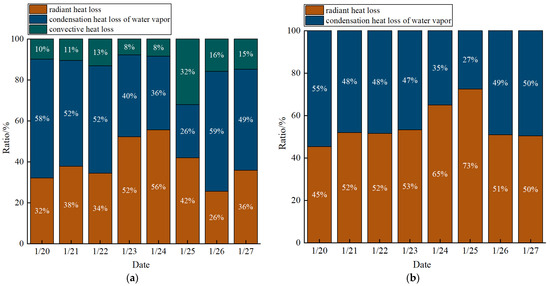
This study compared the proportional contributions of different heat loss pathways to elucidate differences in heat transfer mechanisms between composite thermal blankets used in traditional brick-wall and prefabricated flexible-wall solar greenhouses.
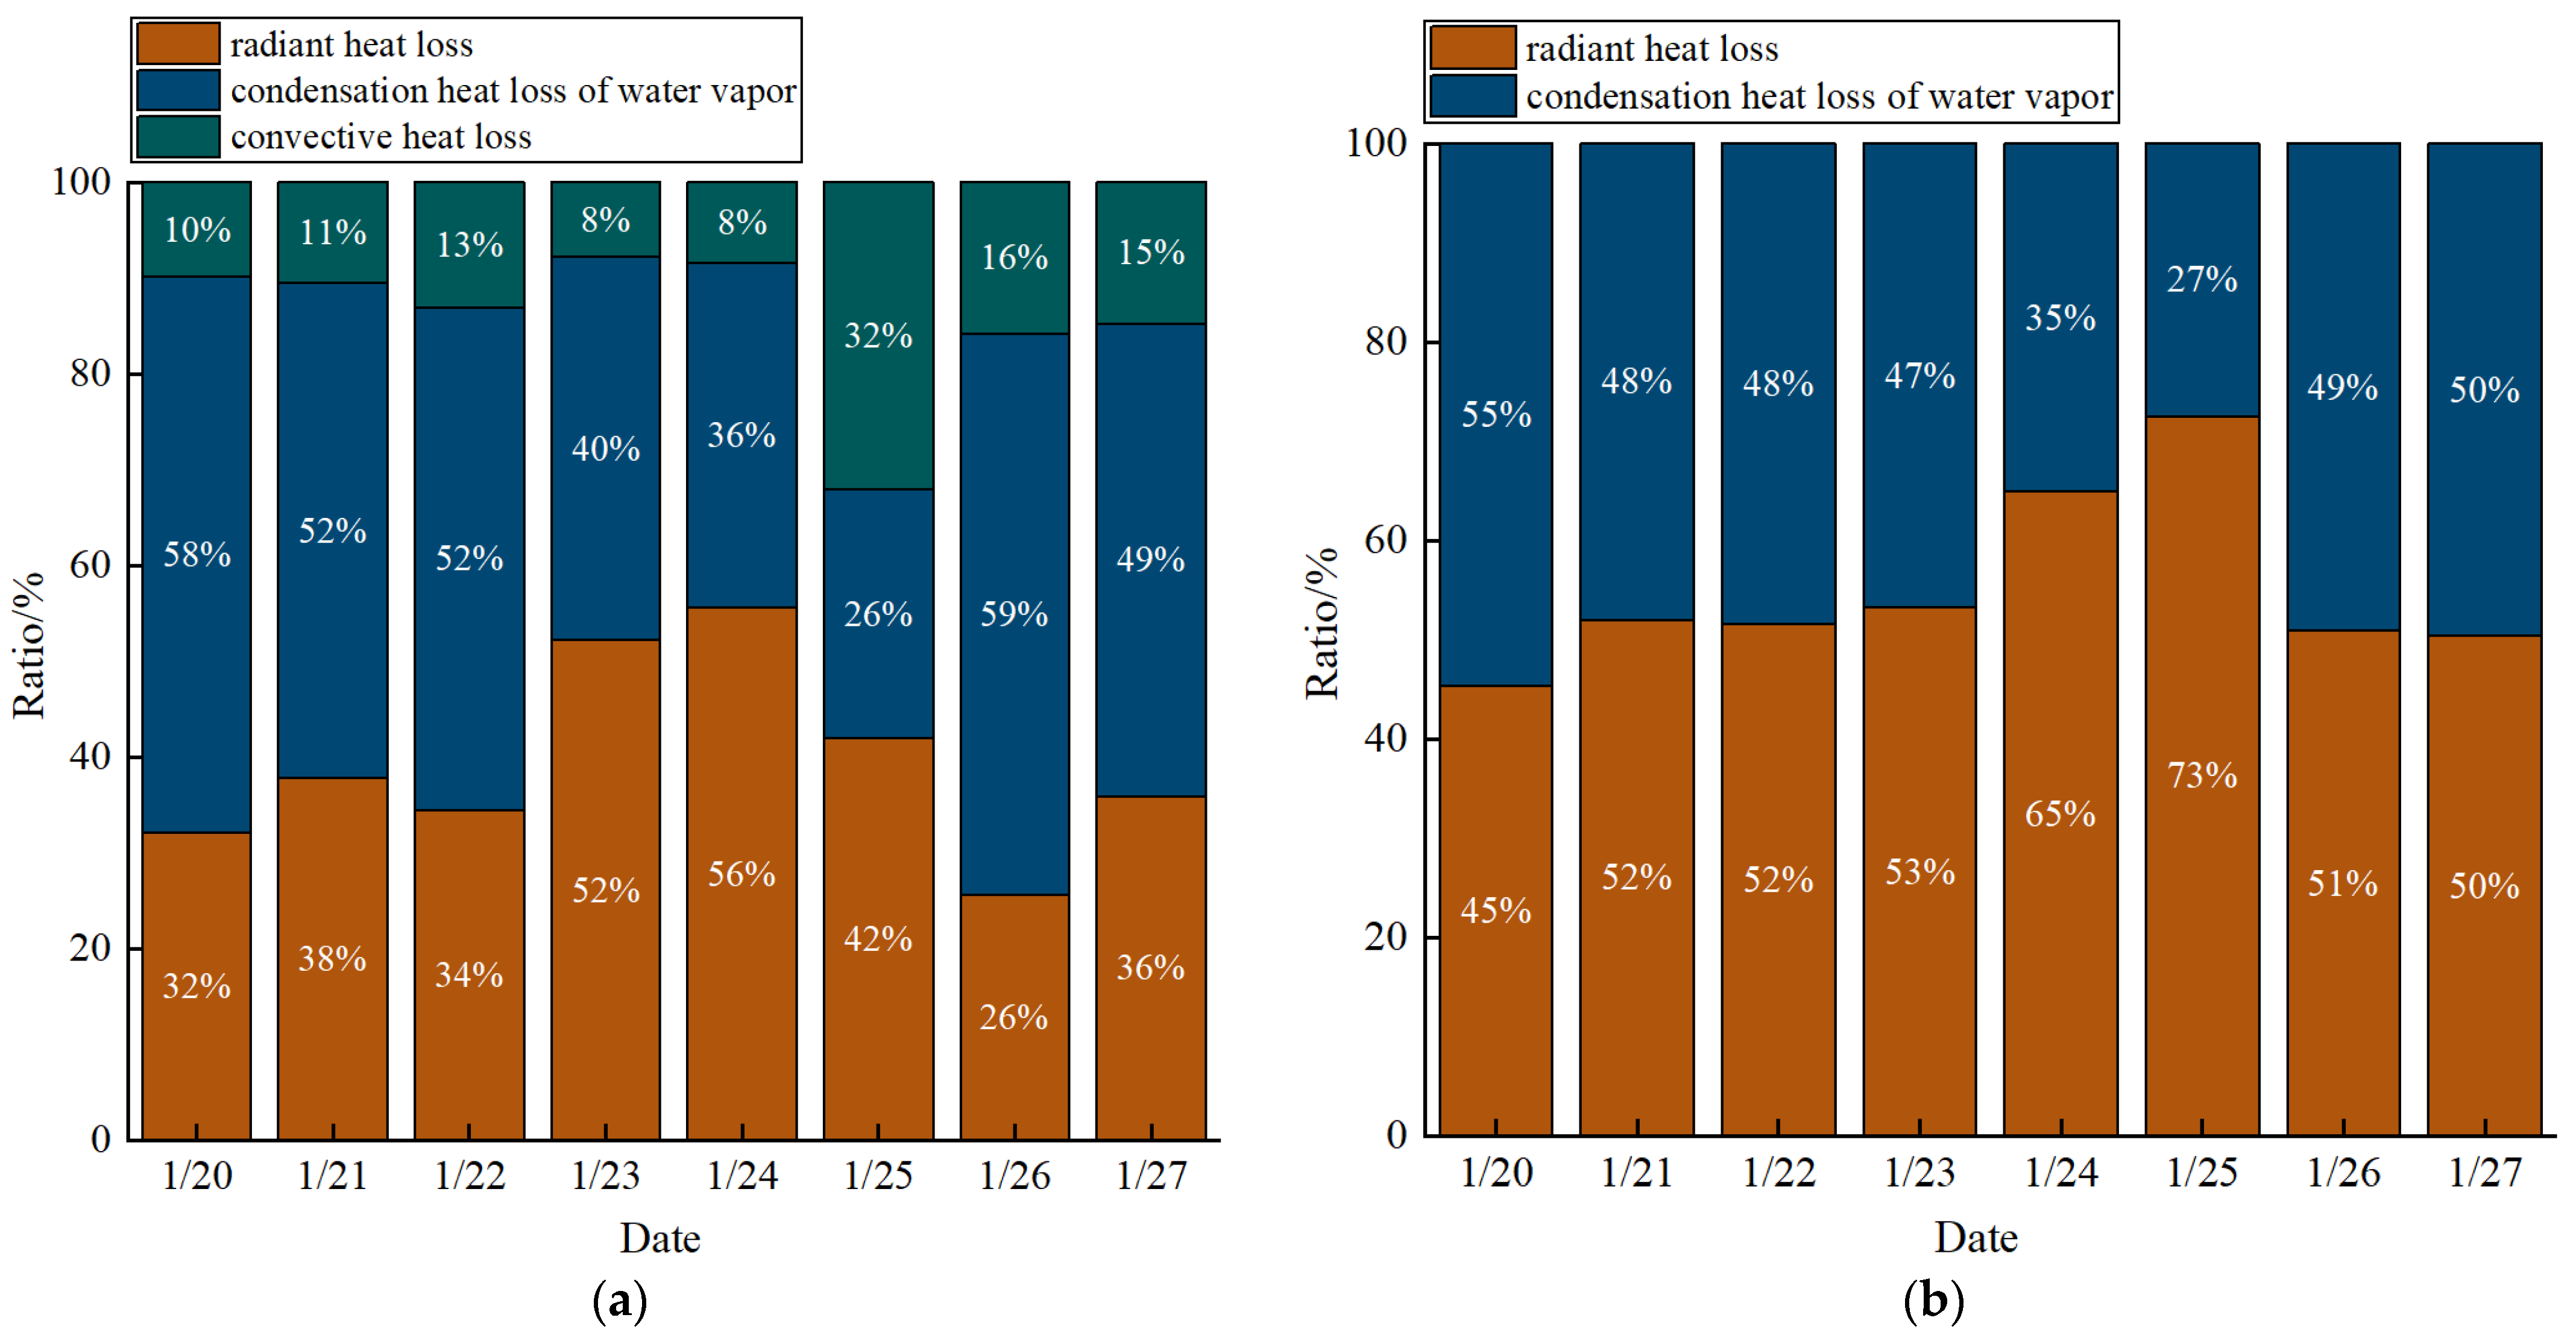
As shown in Figure 11, nocturnal heat loss in the brick-wall greenhouse is dominated by radiation (26–56%) and condensation latent heat (26–59%), with convective loss contributing 8–32%. In the flexible-wall greenhouse, radiation accounts for 45–73%, condensation for 27–55%, and convection is minimal. This disparity stems from differences in sealing integrity and structural geometry. The brick-wall greenhouse relies on nylon hook-and-loop fasteners alone, which permit significant air leakage and convective loss. In contrast, the flexible-wall greenhouse employs both hook-and-loop fasteners and surface bonding, achieving superior airtightness that suppresses convection. Additionally, its larger span and gently curved roof promote a stable, thermally stratified air layer adjacent to the inner quilt surface, further inhibiting natural convection. The high emissivity (ε ≈ 0.90–0.95) of the brown PVC inner surface enhances radiative coupling with interior elements, reducing the quilt–indoor air temperature difference and further limiting convective flux. Conversely, the massive brick-concrete wall in the traditional greenhouse acts as a stronger radiation barrier, lowering the radiative loss fraction. Both greenhouse types experience condensation latent heat loss during winter nights owing to high indoor humidity and low cover surface temperatures, a finding consistent with Luo et al. [24] who reported that condensation accounts for a significant portion of nocturnal heat dissipation in CSGs and should not be neglected in winter thermal balance calculations.
Figure 11.
The proportion of radiation, convection and condensation heat transfer in the greenhouse cover layer. (a) the traditional brick-wall solar greenhouse; (b) the prefabricated solar greenhouses with flexible walls.
Accordingly, optimization strategies should be structure-specific. For brick-wall greenhouses, emphasis should be placed on suppressing radiation, condensation, and convection by employing high-reflectivity, waterproof surface layers, improving ventilation and dehumidification, and enhancing sealing while incorporating insulating core materials such as foams or aerogels. For flexible-wall greenhouses, which already exhibit low convective loss, further gains can be achieved by adopting high-reflectivity surface layers to mitigate radiation and implementing precise humidity control (e.g., scheduled dehumidification) to reduce condensation loss.
5. Conclusions
This study developed a physically based, multi-process coupled heat transfer model for composite thermal blankets in solar greenhouses. The model discretizes the internal blanket structure and explicitly couples conduction, convection, radiation, and latent heat from condensation, offering realistic representation under actual operating conditions. Validation against field measurements from traditional brick-wall and prefabricated flexible-wall solar greenhouses demonstrated strong predictive performance across varied weather.
The model reveals that the thermal performance of composite blankets is governed by a complex interplay between material microstructure (porosity and pore morphology) and environmental moisture. Under dry conditions, increased porosity significantly enhances insulation capacity; whereas under moist conditions, interconnected pore networks facilitate the formation of high-conductivity water bridges, drastically degrading performance. Closed-cell structures exhibit markedly lower sensitivity to moisture ingress.
Nighttime heat loss mechanisms vary significantly by construction type, with radiation and condensation dominating, while convective losses are highly dependent on installation sealing integrity. The model provides a practical, interpretable framework for optimizing thermal blanket design, guiding material selection, and advancing precision energy management in controlled environment agriculture.
Despite these contributions, the present study treats moisture content and porosity as static input parameters. Future efforts should investigate the long-term degradation of waterproofing performance and aging resistance in different materials across multiple growing seasons. Additionally, incorporating frost deposition physics and extending field validation across broader climatic zones and greenhouse structures will further enhance the model’s utility and robustness.
Author Contributions
Conceptualization, L.W. and S.Z.; methodology, L.W. and Q.L.; software, L.W.; validation, L.W.; formal analysis, L.W.; investigation, L.W.; resources, S.Z. and X.Z.; data curation, L.W. and J.C.; writing—original draft preparation, L.W.; writing—review and editing, L.W., Q.L., Y.Z. and S.Z.; visualization, L.W.; supervision, Y.Z. and S.Z.; project administration, S.Z., R.C. and X.Z.; funding acquisition, S.Z. All authors have read and agreed to the published version of the manuscript.
Funding
This research was funded by Inner Mongolia Science and Technology Program Projects, grant number “2025YFHH0290” and Beijing Innovation Consortium of Agriculture Research System, grant number “BAIC01-2025”.
Data Availability Statement
The original contributions presented in this study are included in the article. Further inquiries can be directed to the corresponding author.
Conflicts of Interest
The authors declare that they have no known competing financial interests or personal relationships that could have appeared to influence the work reported in this paper.
References
- Maxwell, R.S.; Belmecheri, S.; Taylor, A.H.; Davis, K.J.; Ocheltree, T.W. Carbon isotope ratios in tree rings respond differently to climatic variations than Tree-ring width in a mesic temperate Forest. Agric. For. Meteorol. 2020, 288, 108014. [Google Scholar] [CrossRef] [Scilit]
- Shufrin, I.; Pasternak, E.; Dyskin, A. Environmentally Friendly Smart Construction—Review of Recent Developments and Opportunities. Appl. Sci. 2023, 13, 12891. [Google Scholar] [CrossRef] [Scilit]
- Li, Y.M.; Yue, X.; Zhao, L.; Xu, H.; Liu, X.A.; Li, T.L. Effect of north wall internal surface structure on heat Storage-release performance and thermal environment of Chinese solar Greenhouse. J. Build. Phys. 2021, 45, 507–527. [Google Scholar] [CrossRef] [Scilit]
- Elakrout, O.; Ghriss, O.; Bouabidi, A.; Castellanos, H.G.; Mohtaram, S.; Kecebas, A.; Aryanfar, Y. Investigative analysis of the influence of diverse fin configurations on the performance of a dual pass solar air Collector. Therm. Sci. Eng. Prog. 2024, 50, 102545. [Google Scholar] [CrossRef] [Scilit]
- Siagian, P.; Napitupulu, F.H.; Ambarita, H.; Sihombing, H.V.; Sibagariang, Y.P.; Siagian, H.S. The Effect of Varying the Air Flow in a Solar Collector on the Quality of Arabica Coffee Beans. Fluids 2024, 9, 75. [Google Scholar] [CrossRef] [Scilit]
- Zhou, T.T.; Luo, X.; Liu, X.J.; Zhai, X.X.; Sun, Y.K.; Liu, G.C.; Liu, J.H.; Gao, Y.R.; Dang, D.F.; Li, N.; et al. The green and Low-carbon development pathways in the urban and rural building sector in Shaanxi Province, China. Energy Build. 2024, 306, 113952. [Google Scholar] [CrossRef] [Scilit]
- Modi, P.A.; Mahmoud, A.M.; Abakr, Y.A. Scopes for Improvements in Energy Conservation and Thermomechanical Performance of Building Blocks in the Kingdom of Bahrain: A Literature Review. Buildings 2024, 14, 861. [Google Scholar] [CrossRef] [Scilit]
- Hetimy, S.; Megahed, N.; Eleinen, O.A.; Elgheznawy, D. Exploring the potential of sheep wool as an Eco-friendly insulation material: A comprehensive review and analytical Ranking. Sustain. Mater. Technol. 2024, 39, e00812. [Google Scholar] [CrossRef] [Scilit]
- Hasanzadeh, R.; Azdast, T.; Lee, P.C.; Park, C.B. A review of the State-of-the-art on thermal insulation performance of polymeric Foams. Therm. Sci. Eng. Prog. 2023, 41, 101808. [Google Scholar] [CrossRef] [Scilit]
- Xiao, T.; Zhang, H.; Wu, H.; Jin, X.; Wang, B. Structural Design and Thermal Performance Study of a New Thermal Blanket for Solar Greenhouses. J. Anhui Agric. Sci. 2016, 44, 233–237. [Google Scholar]
- Xu, G.; Zhou, C. Development and Performance Testing of a PE Foam Self-Waterproofing Thermal Blanket for Solar Greenhouses. Trans. Chin. Soc. Agric. Eng. 2005, 21, 128–131. [Google Scholar]
- Xu, G.; Zhang, L. Application Research on Self-Waterproofing Thermal Blankets and Their Mechanical Transmission Devices. Agric. Eng. Technol. (Greenh. Hortic.) 2006, 11, 12–13. [Google Scholar]
- Wang, J.H.; Liu, L.P.; Dong, W.L.; Tao, J.H.; Fu, R.; Liu, Y.H.; Yang, X.; Yu, H.Q.; Sai, H. Ultra-High Radial Elastic Aerogel Fibers for Thermal Insulation Textile. Adv. Funct. Mater. 2024, 35, 2417873. [Google Scholar] [CrossRef] [Scilit]
- Zhao, J.X.; Li, H.B.; Choi, D.; Lee, P.C. Micro-layered film and foam alternating structures: A novel passive daytime radiative cooling Material. Nano Energy 2024, 127, 109695. [Google Scholar] [CrossRef] [Scilit]
- Teng, F.; Tu, L.X.; Wang, X.; Shen, H.; Xue, W.L. Ultralight Air-filled hollow yarn fabrics for efficient thermal insulation and its heat and mass transfer Mechanism. Compos. Part A Appl. Sci. Manuf. 2024, 185, 108281. [Google Scholar] [CrossRef] [Scilit]
- Zhao, S.; Ma, C.; Liu, C.; Zhang, Y.; Sun, G. Engineering Calculation Method for Heat Transfer Coefficient and Heat Saving Rate of Multi-Layer Greenhouse Coverings. Trans. Chin. Soc. Agric. Eng. 2011, 27, 264–269. [Google Scholar]
- Jiang, L.; Zhang, C.; Zou, P. Performance Comparison and Selection of Homogeneous Layer Materials for Solar Greenhouse Thermal Blankets. Agric. Eng. Technol. 2021, 41, 48–51. [Google Scholar]
- Kim, H.; Ryou, Y.; Kim, Y.; Lee, T.; Oh, S.; Kim, Y. Estimating the Thermal Properties of the Cover and the Floor in a Plastic Greenhouse Estimating the thermal properties of the cover and the floor in a plastic greenhouse. Energies 2021, 14, 1970. [Google Scholar]
- Lee, H.W.; Lee, J.W.; Diop, S.; Na, O.H. Measurement of Overall Heat Transfer Coefficient of Covering Material with Thermal Screens for Plastic Greenhouse. In International Symposium on New Technologies for Environment Control, Energy-Saving and Crop Production in Greenhouse and Plant Factory; ISHS: Korbeek-Lo, Belgium, 2014; Volume 1037, pp. 219–224. [Google Scholar]
- Papadakis, G.; Frangoudakis, A.; Kyritsis, S. Theoretical and experimental investigation of thermal radiation wansfer in polyethylene covered greenhouses. J. Agric. Eng. Res. 1989, 44, 97–111. [Google Scholar] [CrossRef]
- Ma, C.; Zhang, J.; Qin, M.; Liu, R. Theoretical Analysis and Validation of Heat Transfer Coefficient for Horticultural Facility Covering Materials Based on Covering Layer Energy Balance Method. Trans. Chin. Soc. Agric. Eng. 2006, 22, 1–5. [Google Scholar]
- Zhang, Y. Study on Heat Transfer of Multi-Layer Greenhouse Coverings and Thermal Performance of Aluminized Film; China Agricultural University: Beijing, China, 2010. [Google Scholar]
- Liu, C.; Ma, C.; Wang, P.; Zhao, S.; Cheng, J.; Wang, M. Theoretical Analysis and Validation of Heat Transfer in Thermal Blankets for Solar Greenhouses. Trans. Chin. Soc. Agric. Eng. 2015, 31, 170–176. [Google Scholar]
- Luo, Q.; Wang, J.; Zhao, L.; Zhao, S.; Wang, P.; Liang, C.; Zhang, K. Evaluation of thermal loss of Chinese solar greenhouse cover under all operating conditions. Sol. Energy 2023, 265, 112–137. [Google Scholar] [CrossRef] [Scilit]
- Nijskens, J.; Deltour, J.; Coutisse, S.; Nisen, A. Heat transfer through covering materials of greenhouses. Agric. For. Meteorol. 1984, 33, 193–214. [Google Scholar] [CrossRef] [Scilit]
- Zhuge, Y.; Liu, F. Recent Progress of Bionic Hierarchical Structure in the Field of Thermal Insulation Protection. J. Bionic Eng. 2023, 21, 1–18. [Google Scholar] [CrossRef] [Scilit]
- Lamba, R.; Montero, F.J.; Rehman, T. PCM-based hybrid thermal management system for photovoltaic modules: A comparative Analysis. Environ. Sci. Pollut. Res. 2023, 31, 46397–46416. [Google Scholar] [CrossRef] [Scilit]
- Ma, C.; Zhao, S.; Li, R.; Cao, Y.; Wang, S.; Yang, P. Two-Dimensional Model and Simulation Program Development for Underground Heat Transfer in Solar Greenhouses. In Chinese Society of Agricultural Engineering (CSAE), Proceedings of the 2011 Annual Conference of the Chinese Society of Agricultural Engineering; Key Laboratory of Agricultural Engineering in Facilities, Ministry of Agriculture, China Agricultural University: Beijing, China, 2011; pp. 963–968. [Google Scholar]
- Rouphael, Y.; Colla, G. Modelling the transpiration of a greenhouse zucchini crop grown under a Mediterranean climate using the Penman-Monteith equation and its simplified version. Aust. J. Agric. Res. 2004, 55, 931. [Google Scholar] [CrossRef] [Scilit]
- Yu, C. Heat Conduction and Its Mumerical Analysis; Tsinghua University Press: Beijing, China, 1981. [Google Scholar]
- Tong, G.; Christopher, D.M.; Li, B. Numerical modelling of temperature variations in a Chinese solar greenhouse. Comput. Electron. Agric. 2009, 68, 129–139. [Google Scholar] [CrossRef] [Scilit]
- Wang, Z.; Zhao, Z.; Zheng, G.; Yan, G.; Zhu, Y.; Song, Y. A “Three-Box” Analysis Model for Heat Transfer in Thermal Porous Materials Based on REV. J. Eng. Thermophys. 2021, 42, 1950–1957. [Google Scholar]
- Tomadakis, M.M.; Sotirchos, S.V. Ordinary, transition, and knudsen regime diffusion in random capillary structures. Chem. Eng. Sci. 1993, 48, 3323–3333. [Google Scholar] [CrossRef] [Scilit]
- Ishtiaque, S.M.; Mawkhlieng, U.; Yadav, V.K. Fabric comfort by modifying yarn structure: Part II—Low-stress mechanical, thermal and transmission characteristics of fabrics. Indian J. Fibre Text. Res. 2020, 45, 19–25. [Google Scholar]
- Mao, N.; Russell, S.J. Modelling of Nonwoven Materials; Woodhead Publishing: Sawston, UK, 2010; pp. 180–224. [Google Scholar]
- Sarwar, M.K.; Majumdar, P. Thermal conductivity of wet composite porous media. Heat Recovery Syst. CHP 1995, 15, 369–381. [Google Scholar] [CrossRef] [Scilit]
- Wang, Y.Y.; Ma, C.; Liu, Y.F.; Wang, D.J.; Liu, J.P. A model for the effective thermal conductivity of moist porous building materials based on fractal theory. Int. J. Heat Mass Transf. 2018, 125, 387–399. [Google Scholar] [CrossRef] [Scilit]
- Kan, A.K.; Cao, D.; Zhang, X.L. Analytical Fractal Model for Calculating Effective Thermal Conductivity of the Fibrous Porous Materials. J. Nanosci. Nanotechnol. 2015, 15, 3200–3205. [Google Scholar] [CrossRef] [Scilit] [PubMed]
- Zhu, F.L.; Cui, S.Z.; Gu, B.H. Fractal analysis for effective thermal conductivity of random fibrous porous materials. Phys. Lett. A 2010, 374, 4411–4414. [Google Scholar] [CrossRef] [Scilit]
- Kosiński, P. Moisture Transport in Loose Fibrous Insulations under Steady-State Boundary Conditions. Materials 2023, 16, 7656. [Google Scholar] [CrossRef] [Scilit]
- Abdou, A.; Budaiwi, I. The variation of thermal conductivity of fibrous insulation materials under different levels of moisture content. Constr. Build. Mater. 2013, 43, 533–544. [Google Scholar] [CrossRef] [Scilit]
- Tariku, F.; Shang, Y.A.; Molleti, S. Thermal performance of flat roof insulation materials: A review of temperature, moisture and aging effects. J. Build. Eng. 2023, 76, 107142. [Google Scholar] [CrossRef] [Scilit]
- Yun, B.Y.; Kang, Y.; Jin, D.; Kin, S. Influence of Hygrothermal Environment on the Thermophysical Properties of Recycled Fiber-based Insulation. Int. J. Thermophys. 2025, 46, 184. [Google Scholar] [CrossRef] [Scilit]

Disclaimer/Publisher’s Note: The statements, opinions and data contained in all publications are solely those of the individual author(s) and contributor(s) and not of MDPI and/or the editor(s). MDPI and/or the editor(s) disclaim responsibility for any injury to people or property resulting from any ideas, methods, instructions or products referred to in the content. |
© 2026 by the authors. Licensee MDPI, Basel, Switzerland. This article is an open access article distributed under the terms and conditions of the Creative Commons Attribution (CC BY) license.