


Abstract
The accurate delineation of mega-environments (MEs) and the rigorous evaluation of test locations are critical for optimizing regional variety trial schemes, particularly when addressing unbalanced datasets from multi-year, multi-location wheat (Triticum aestivum L.) trials. This study aimed at refining the regional wheat trial framework in the Huanghuai Winter Wheat Region (HWWR) of China using an integrated BLUP-GGE biplot approach, which combines best linear unbiased prediction (BLUP) values with genotype main effect plus genotype-by-environment interaction (GGE) biplot analysis to account for temporal variability and experimental error. We systematically evaluated the BLUP-GGE biplot approach, focusing on its goodness of fit and its ability to resolve inter-location relationships. We further assessed test location representativeness, discriminating ability, and overall desirability via the BLUP-GGE biplot, and contrasted ME delineation outcomes between the traditional “which-won-where” polygon method and the test location clustering-based approach. The BLUP-GGE biplot explained 72.9% of total phenotypic variation, with all location vectors displaying positive correlations (maximum angle = 88.8°), confirming the ecological homogeneity of the target region and yielding robust evaluation results. Based on the ideal tester view, Puyang was identified as the most desirable location, followed by Zhumadian, Shangqiu, and Huixian, while Lianyungang and Suqian exhibited relatively poor comprehensive performance. MEs delineated by the “which-won-where” method showed strong inter-ME correlations and insufficient differentiation, whereas the location clustering-based method markedly enhanced inter-ME discrimination (maximum vector angle > 60°), stably partitioning the HWWR into three distinct MEs with clear cultivar–ME interaction patterns: ME1 (Lianyungang, Suqian, Fuyang, Suzhou, Guoyang, Huixian, Huai’an, Xinmaqiao, Huayin, and Yangling), ME2 (Luoyang, Xinxiang, Zhumadian, Shangqiu, Puyang, and Luohe), and ME3 (Baoji, Xuzhou, Yuanyang, Sheyang, and Xingyang). This study confirms the superiority of the BLUP-GGE biplot for analyzing unbalanced multi-year multi-environment trial data and validates a robust clustering strategy for ME delineation. The findings provide a scientific basis for optimizing wheat regional trial systems and facilitating precise cultivar deployment in the HWWR, and offer a reference for analogous studies on other crops or ecological regions.
1. Introduction
Wheat (Triticum aestivum L.) is the third-largest food crop in China, with a planting area second only to rice and maize, and it serves as a cornerstone of national food security [1]. Its production stability is critical for safeguarding China’s agricultural economy and food self-sufficiency [2]. The Huanghuai Winter Wheat Region (HWWR) is the most strategically important wheat-producing area in China, contributing over 60% of the nation’s total wheat cultivation area and yield, and its ecological and agronomic characteristics directly determine national wheat production capacity [1,3]. Stretching approximately 1200 km east–west from the coastal plains of Sheyang (Jiangsu Province) to the Guanzhong Plain of Baoji (Shaanxi Province), the HWWR spans Shaanxi, Henan, Anhui, and Jiangsu provinces, with an average inter-test location distance of 385 km, forming a naturally extensive and heterogeneous experimental network.
The HWWR exhibits profound ecological heterogeneity, driven by complex topographical variations and a climatic gradient transitioning from subtropical in the south to warm-temperate in the north. This gradient results in significant spatial variations in annual precipitation, temperature regimes, and soil typologies [4], which inevitably induce strong genotype-by-environment (G × E) interactions. Such interactions cause cultivar performance—including yield formation, growth duration, and stress resistance—to vary substantially across locations, posing major challenges for the precise evaluation of new varieties and their rational spatial deployment. Accurate mega-environment (ME) delineation based on robust G × E interaction analysis is therefore a practical necessity for crop breeding and regional trial research, as it enables the maximization of cultivar yield potential by matching superior genotypes to their optimal growing conditions [5], thereby enhancing overall production efficiency and sustainability.
Multi-environment variety trials (METs) are the fundamental basis for assessing the yield potential, stability, adaptability, and stress resistance of new wheat cultivars. The scientific rigor and statistical reliability of METs directly determine the quality of variety registration decisions and subsequent promotion strategies [6,7]. A critical component of successful MET analysis is the systematic evaluation of test locations and scientifically defensible delineation of MEs. Historically, ecological subregions in the HWWR were defined based on administrative boundaries or broad climatic classifications [1], which reflect geographical proximity rather than the specific G × E interaction patterns that govern cultivar performance. This limitation frequently results in suboptimal cultivar recommendations, as micro-environmental variations and soil–climate interactions can alter cultivar performance within traditionally defined zones [2]. Advanced statistical models that analyze MET data to uncover biological patterns of cultivar response to environmental cues provide a more objective, data-driven alternative for ME delineation and test location evaluation.
Statistical methodologies for MET analysis have advanced significantly in recent decades [8,9,10,11]. Traditional methods such as analysis of variance (ANOVA) and the genotype main effect plus genotype-by-environment interaction (GGE) biplot have provided valuable insights, with the GGE biplot being widely adopted for its ability to visually integrate genotype main effects (G) and genotype-by-environment interaction effects (GE). This tool facilitates cultivar comparison, test location evaluation, and ME identification via the intuitive “which-won-where” pattern [12,13]. However, conventional GGE biplot analysis relies on raw phenotypic means and is grounded in fixed-effect model assumptions, including homogeneous error variances across test locations and balanced datasets—conditions that are rarely met in real-world regional trials due to practical constraints [4,14].
Real-world regional trial data often deviates from these statistical assumptions in two key ways: first, the “rolling” participation of cultivars (where poorly performing varieties are replaced with new candidates annually) creates unbalanced data structures with missing values across years and locations; second, the ecological diversity of test locations inherently leads to heterogeneous error variances, as environmental variability differentially impacts trial precision at each site. These complexities render traditional fixed-model analyses less accurate and potentially biased for evaluating test location representativeness, discriminating ability, and precise ME delineation.
To address these limitations, the integration of best linear unbiased prediction (BLUP) with the visualization strengths of the GGE biplot has emerged as a superior analytical framework. Based on linear mixed models, the BLUP method efficiently handles unbalanced data without deleting cultivars/locations with missing values or imputing missing entries with environmental means, accounts for heterogeneous variances across environments, and provides accurate genotypic value estimates by treating genotypes as random effects—enabling the shrinkage of estimates toward the mean and improved predictive accuracy [15,16]. Fitting multi-year data with mixed models allows BLUP to calculate adjusted means for each genotype-by-location combination, overcoming the challenges of missing data and producing values closer to true breeding values by correcting for environmental noise and trial error [17,18]. When these robust BLUP values are used to construct a cultivar × location two-way table for GGE biplot analysis, the results enable more reliable test location evaluation and scientifically sound ME delineation. A growing body of research on wheat [19], peanut [18], and forest trees [14] has demonstrated the utility of the BLUP-GGE biplot for resource allocation and cultivar recommendation in multi-environment trials, particularly in the context of unbalanced data [20,21,22].
While the “which-won-where” polygon view of the GGE biplot is widely used for ME delineation, it is heavily influenced by the performance of a few high-yielding super cultivars, which can disproportionately affect test location grouping and fail to reflect the overall similarity of environmental effects on all cultivars [23,24]. For clustering environments into biologically meaningful MEs, the ME biplot—based on the projection and clustering of test location coordinates—is more appropriate and stable, as it focuses on the similarity of environmental effects on the entire set of genotypes and is less sensitive to outlier cultivars [25].
In this study, we utilized five consecutive years (2021–2025) of yield data from national wheat METs conducted at 21 strategically distributed test locations across the HWWR, covering core ecological subregions including the Guanzhong Plain, Northern/Central/Eastern Henan Plains, Huaibei Plain, and Northern Jiangsu Plain. The extensive spatial coverage captures a wide spectrum of environmental conditions, providing a robust basis for analyzing G × E interactions and delineating MEs. The primary objectives of this study were to (1) quantify the relative contributions of genotype (G), environment (E), and G × E interaction to yield variation using a linear mixed model; (2) calculate BLUP values for each genotype-by-location combination to construct an adjusted two-way table corrected for data imbalance and environmental noise; (3) systematically evaluate the discriminating ability and representativeness of test locations using the BLUP-GGE biplot; (4) delineate scientifically based MEs in the HWWR via the ME biplot applied to BLUP-adjusted data, minimizing the undue effect of superior genotypes on environmental clustering; and (5) identify superior cultivars with specific adaptation to each delineated ME.
The findings of this study are expected to provide a robust scientific basis for optimizing the HWWR regional trial network by identifying core representative test locations, enabling targeted cultivar promotion strategies, and supporting breeding programs for ME-specific varieties. Ultimately, this work aims at contributing to sustainable yield improvement and production stability in this vital agricultural region, and the integrated BLUP-GGE biplot approach presented here serves as a reference paradigm for MET analysis in other crop production systems facing similar ecological and experimental challenges.
2. Materials and Methods
2.1. Test Locations and Dataset
This study was based on grain yield data from national multi-environment wheat trials conducted in the HWWR from 2021 to 2025. Over the five-year experimental period, 256 unique genotypes (including the check cultivar Zhoumai 36) were evaluated: 132 cultivars were tested for two consecutive years, and 124 cultivars were tested for one year before exclusion from further trials. Trials were conducted annually at the same 21 test locations (Table 1; the full name of each site and its corresponding code are provided in Table 1), establishing a consistent and stable multi-environment testing network that covers the core ecological and geographical range of the HWWR.
Table 1.
Main environmental characteristics of the 21 test locations in the Huanghuai Winter Wheat Region used for the regional trials in China (2021–2025).
At each experimental site, trials were established in representative fields using a randomized complete block design (RCBD) with three replications. The plot area was no less than 13.3 m2 (actual sown area: 13.3–17 m2), and grain yield was determined by whole-plot harvesting to ensure the accurate evaluation of actual yield potential. All test sites implemented a unified technical protocol in accordance with the National Wheat Variety Regional Trial Implementation Scheme. Sowing was conducted with a plot seeder between 10 and 20 October at a seeding density of 240–270 plants m−2. Field management practices (tillage, irrigation, fertilization, and pest and disease control) followed local high-yield agronomic standards to ensure trial results reflected the genetic potential of each cultivar, free from the confounding effects of inappropriate management.
The test locations span four provinces in the HWWR and exhibit distinct ecological gradients: altitude ranges from 2.5 m (SY) to 612.9 m (BJ); topographic types include coastal flats, alluvial plains, and low hills; soil types comprise fluvo-aquic soil, Shajiang black soil, Lou soil, saline soil, and paddy soil; mean annual temperatures range from 13.1 to 15.3 °C; and annual precipitation ranges from 570 to 1075 mm. This diversity ensures that the trial network captures the full range of environmental conditions governing wheat growth and development in the HWWR.
2.2. Statistical Analysis
The analytical strategy was designed to achieve two core objectives: (1) evaluate the discriminating ability and representativeness of test locations, and (2) delineate MEs based on G × E interaction patterns. The analysis employed a two-step approach integrating BLUP and GGE biplot analysis, with all statistical analyses performed using Genstat 24th edition (VSN International Ltd., Hemel Hempstead, UK) and GGEbiplot™ software Version 7.10 (https://www.ggebiplot.com).
2.2.1. Estimation of Adjusted Means via BLUP
Given the unbalanced dataset arising from rolling cultivar participation across years, the BLUP method was used to derive adjusted means for each cultivar-by-location combination [14,15,19,26]. Based on a linear mixed model, this approach treats location and year as fixed factors, while cultivar, cultivar × location and cultivar × year as random factors, effectively addressing unbalanced data and heterogeneous variances across environments [15]. Of the overall set of genotypes evaluated, 132 unique genotypes (including the check cultivar Zhoumai 36) that were tested for two consecutive years were subjected to BLUP-GGE biplot analysis. BLUP values for each cultivar–location combination were extracted to construct an adjusted cultivar × location two-way table for subsequent GGE biplot analysis; this table contains predicted grain yields corrected for experimental design effects and unbalanced data structure.
The linear mixed model fitted via the restricted maximum likelihood (REML) algorithm is as follows [14]:
where yijkl is the yield observation of the i-th cultivar in the j-th test location in the k-th year in the l-th replication, μ is the grand mean, Gi is the i-th cultivar, Lj is the j-th test location, Yk is the k-th year, GLij is the interaction effect between the i-th cultivar and the j-th test location, GYik is the interaction effect between the i-th cultivar and the k-th year, LYjk is the interaction effect between the j-th test location and the k-th year, GLYijk is the interaction effect among the i-th cultivar, the j-th test location, and the k-th year, Rl(jk) is the block effect within the location by year combination, and εijkl is the residual error.
yijkl = μ + Gi + Lj + Yk + GLij + GYik + LYjk + GLYijk + Rl(jk) + εijkl
2.2.2. GGE Biplot Analysis
The adjusted two-way matrix of BLUP values for all cultivar–location combinations was subjected to GGE biplot analysis using GGEbiplot™ software, a specialized platform for visualizing MET data. The discriminating ability and representativeness of each test location were visualized and interpreted using the discriminating ability vs. representativeness view of the GGE biplot: discriminating ability was quantified by the length of the environmental vector extending from the biplot origin (a longer vector indicates a greater capacity to differentiate among cultivars) [23,25,27], and representativeness was defined by the angle between the location vector and the average environment axis (AEA) (a smaller angle indicates higher representativeness of the average environmental conditions across the testing network) [28]. An “ideal” test location is characterized by the longest vector (highest discriminating ability) and a zero angle with the AEA (perfect representativeness). The desirability index of each location was depicted in the ideal tester view of the GGE biplot, where proximity to the ideal location marker correlates with higher desirability [28].
MEs were initially delineated using the traditional “which-won-where” polygon view of the GGE biplot [29], a method highly sensitive to the performance of top-yielding cultivars [24]. To alleviate this limitation, a test location clustering-based method was adopted for ME identification: hierarchical clustering was performed using Euclidean distances calculated from the coordinates of test locations in the BLUP-GGE biplot, whereby test locations grouped into the same cluster were assigned to the same ME, as they induced consistent genotypic performance across all evaluated cultivars. This strategy provides a more stable and reliable foundation for ME delineation, essential for rational cultivar deployment. To clearly illustrate inter-ME relationships, an ME biplot was constructed [25]: the mean performance of each ME was represented by a vector from the biplot origin to the mean coordinate of all locations within the ME, and intra-ME variation was visualized by connecting the ME mean coordinate to the coordinate of each individual location. An extended ME biplot was constructed to highlight cultivar–ME interaction effects, with locations depicted as small circles and selected representative cultivars labeled for clarity.
The GGE biplot model based on the cultivar–location matrix is expressed as [30]:
where Yij is the trait mean value of genotype i in environment j; μ is the grand mean; βj is the main effect of environment j; μ + βj is the average yield of all genotypes in environment j; λ1 and λ2 are the singular values (SV) of the first and second principal components, respectively; ξi1 and ξi2 are the eigenvectors of genotype i on the first and second principal components, respectively; ηj1 and ηj2 are the eigenvectors of environment j on the first and second principal components, respectively; εij is the residual of genotype i in environment j. The GGE biplot takes the first principal component score (PC1) of varieties and test sites as the abscissa and the second principal component score (PC2) as the ordinate.
Yij = μ + βj + λ1ξi1ηj1 + λ2ξi2ηj2 + εij
3. Results
3.1. Variance Component Analysis of Grain Yield via Linear Mixed Model
Variance components of grain yield in the multi-environment trials were decomposed using the REML method based on the linear mixed model (Table 2). Total phenotypic variation was primarily driven by environmental factors, with genotypic main effects and G × E interactions contributing comparatively little—a pattern consistent with previous crop regional trial studies [4,20]. Test location was the largest single source of variation, accounting for 40.5% of total variance with a significant effect (Z-ratio > 1.5), indicating that environmental heterogeneity (soil, climate, and topography) among locations was the primary factor governing yield expression. The year effect accounted for 19.5% of total variation (marginally non-significant), while the year × location interaction was the second-largest source (30.7% of total variance; highly significant), implying that the combined year–location environment strongly modulated phenotypic performance. Collectively, the year effect and its interactions with location accounted for 55.1% of total variation, and the combined variance components of year, location, and their interactions exceeded 90% of total variation—confirming that temporal and spatial environmental effects were the dominant drivers of yield variation in the HWWR trials.
Table 2.
Variance components of grain yield from national wheat variety trials in the Huanghuai Winter Wheat Region of China (2021–2025) estimated via a linear mixed model.
Notably, the Z-ratio for test location was 2.89 (significant), indicating substantial heterogeneous experimental error across locations, which was attributed to inherent ecological differences among sites (soil properties, climatic conditions, and topography). This validates the rationality and necessity of using linear mixed models with heterogeneous variance structures for variance component analysis in this study.
For genotypic and interaction effects, the cultivar main effect accounted for 2.3% of total variation (highly significant), confirming genuine genetic divergence among the tested cultivars. The cultivar × location interaction contributed 2.1% of total variation (highly significant), demonstrating significant G × E interactions and specific environmental adaptability of cultivars across locations. The G × L × Y three-way interaction accounted for 4.8% of total variation (highly significant), further highlighting the complexity of environmental effects on yield. The block effect within location–year combinations constituted a small proportion of total variation, indicating that field management, plot layout, and experimental operations were standardized, random errors were effectively controlled, and experimental data quality was reliable.
3.2. Inter-Location Relationships via BLUP-GGE Biplot
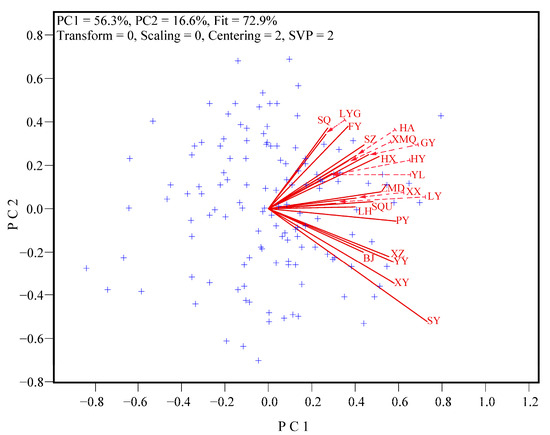
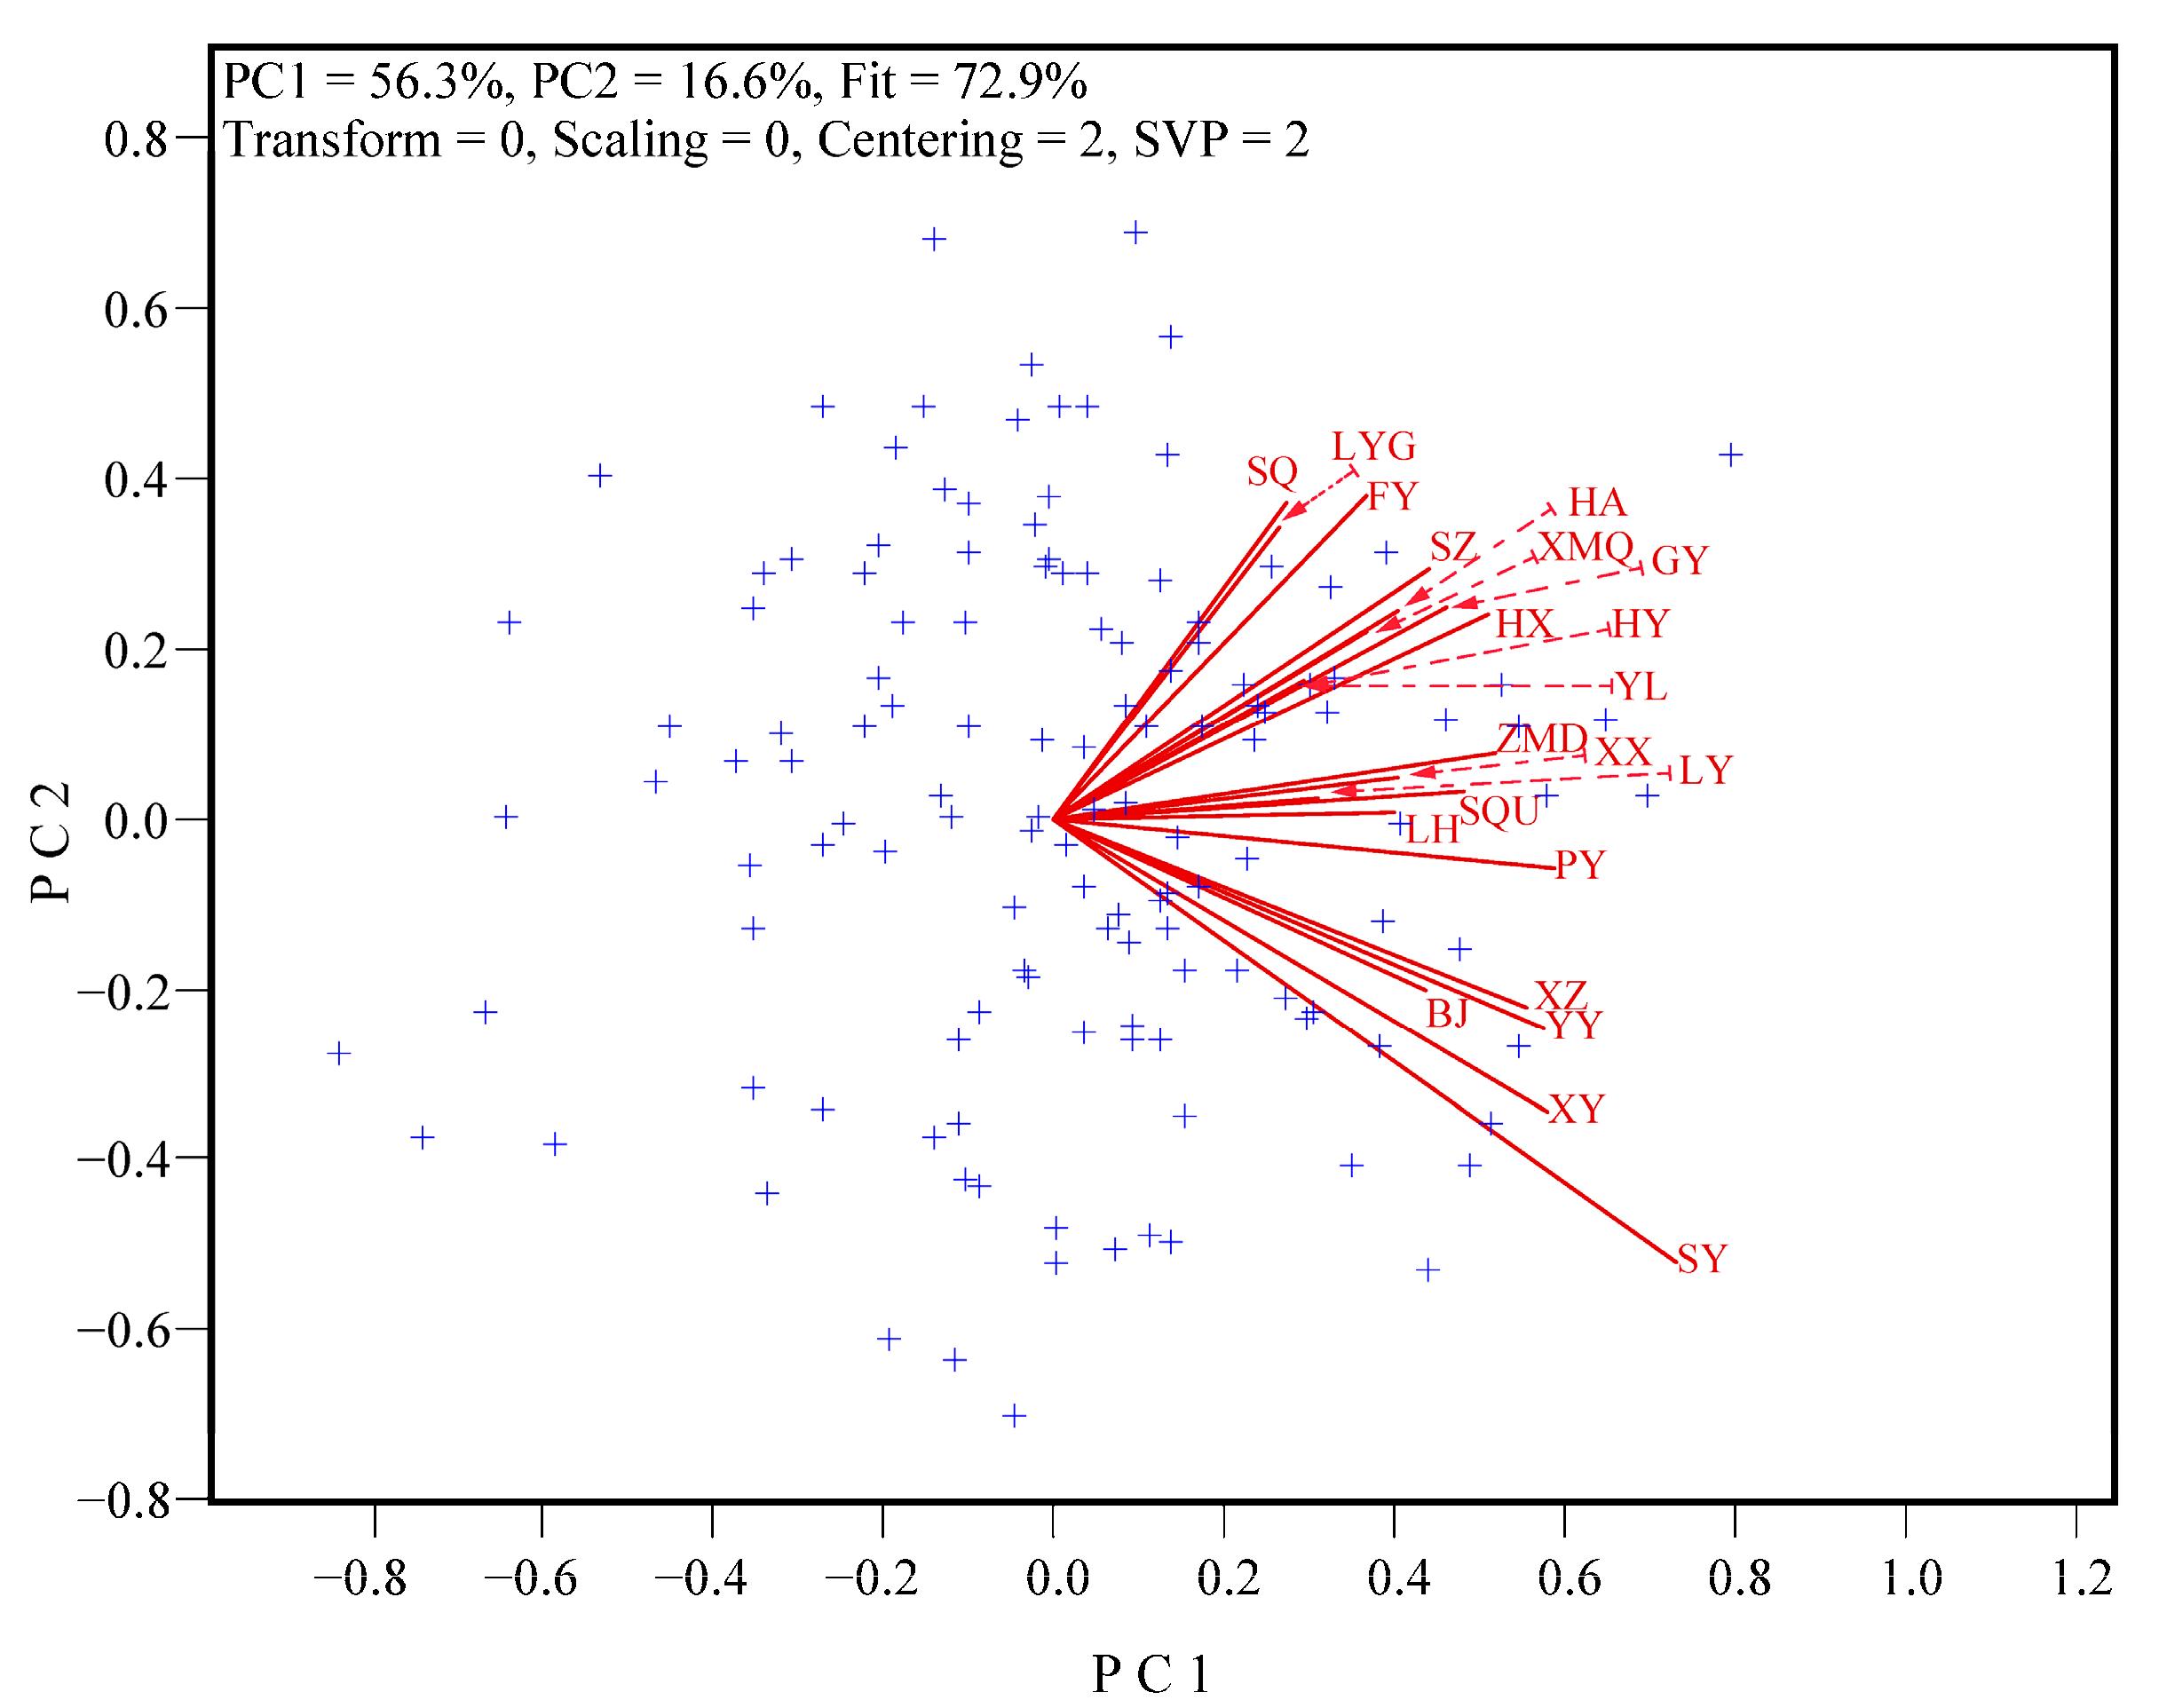
To evaluate inter-location relationships, the relation among testers view of GGE biplots was constructed for BLUP values (Figure 1). The BLUP-GGE biplot exhibited distinct characteristics: all location vectors formed acute angles (<90°), with the maximum angle (88.8°) between SQ and SY, confirming positive correlations among all test locations. PC1 and PC2 explained 56.3% and 16.6% of total variation, respectively (combined 72.9%). This high explanatory power supports the reliability of cultivar selection, test location evaluation, and ME delineation. The BLUP model’s ability to account for year, location, cultivar, and their interaction effects enabled the estimation of phenotypic values adjusted for environmental noise and experimental error. While all locations showed positive correlations, weak correlations persisted between some sites, suggesting potential subregional clustering: relatively strong associations were observed among XZ, YY, BJ, XY, and SY; among LY, XX, ZMD, SQU, PY, and LH; and among the remaining 10 locations. These clusters represent distinct potential MEs, providing a scientific basis for targeted cultivar selection in the HWWR.
Figure 1.
Relation among testers view of GGE biplot based on cultivar-location two-way matrices of BLUP values for wheat in the Huanghuai Winter Wheat Region (2021–2025). Red uppercase letters = location abbreviations (full names in Table 1); to improve clarity due to overlapping, the red arrow is used to connect certain locations to their coordinates; rays from the origin = location vectors; “+” = genotype markers (for clarity). Biplot parameters: Scaling = 0 (genotype-by-location matrix not scaled); Centering = 2 (matrix centered on the mean of each location); SVP = 2 (singular values fully partitioned to locations, optimal for location evaluation).
3.3. Test Location Evaluation via BLUP-GGE Biplot
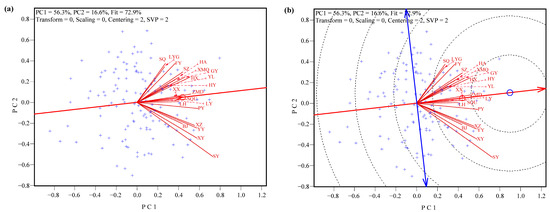
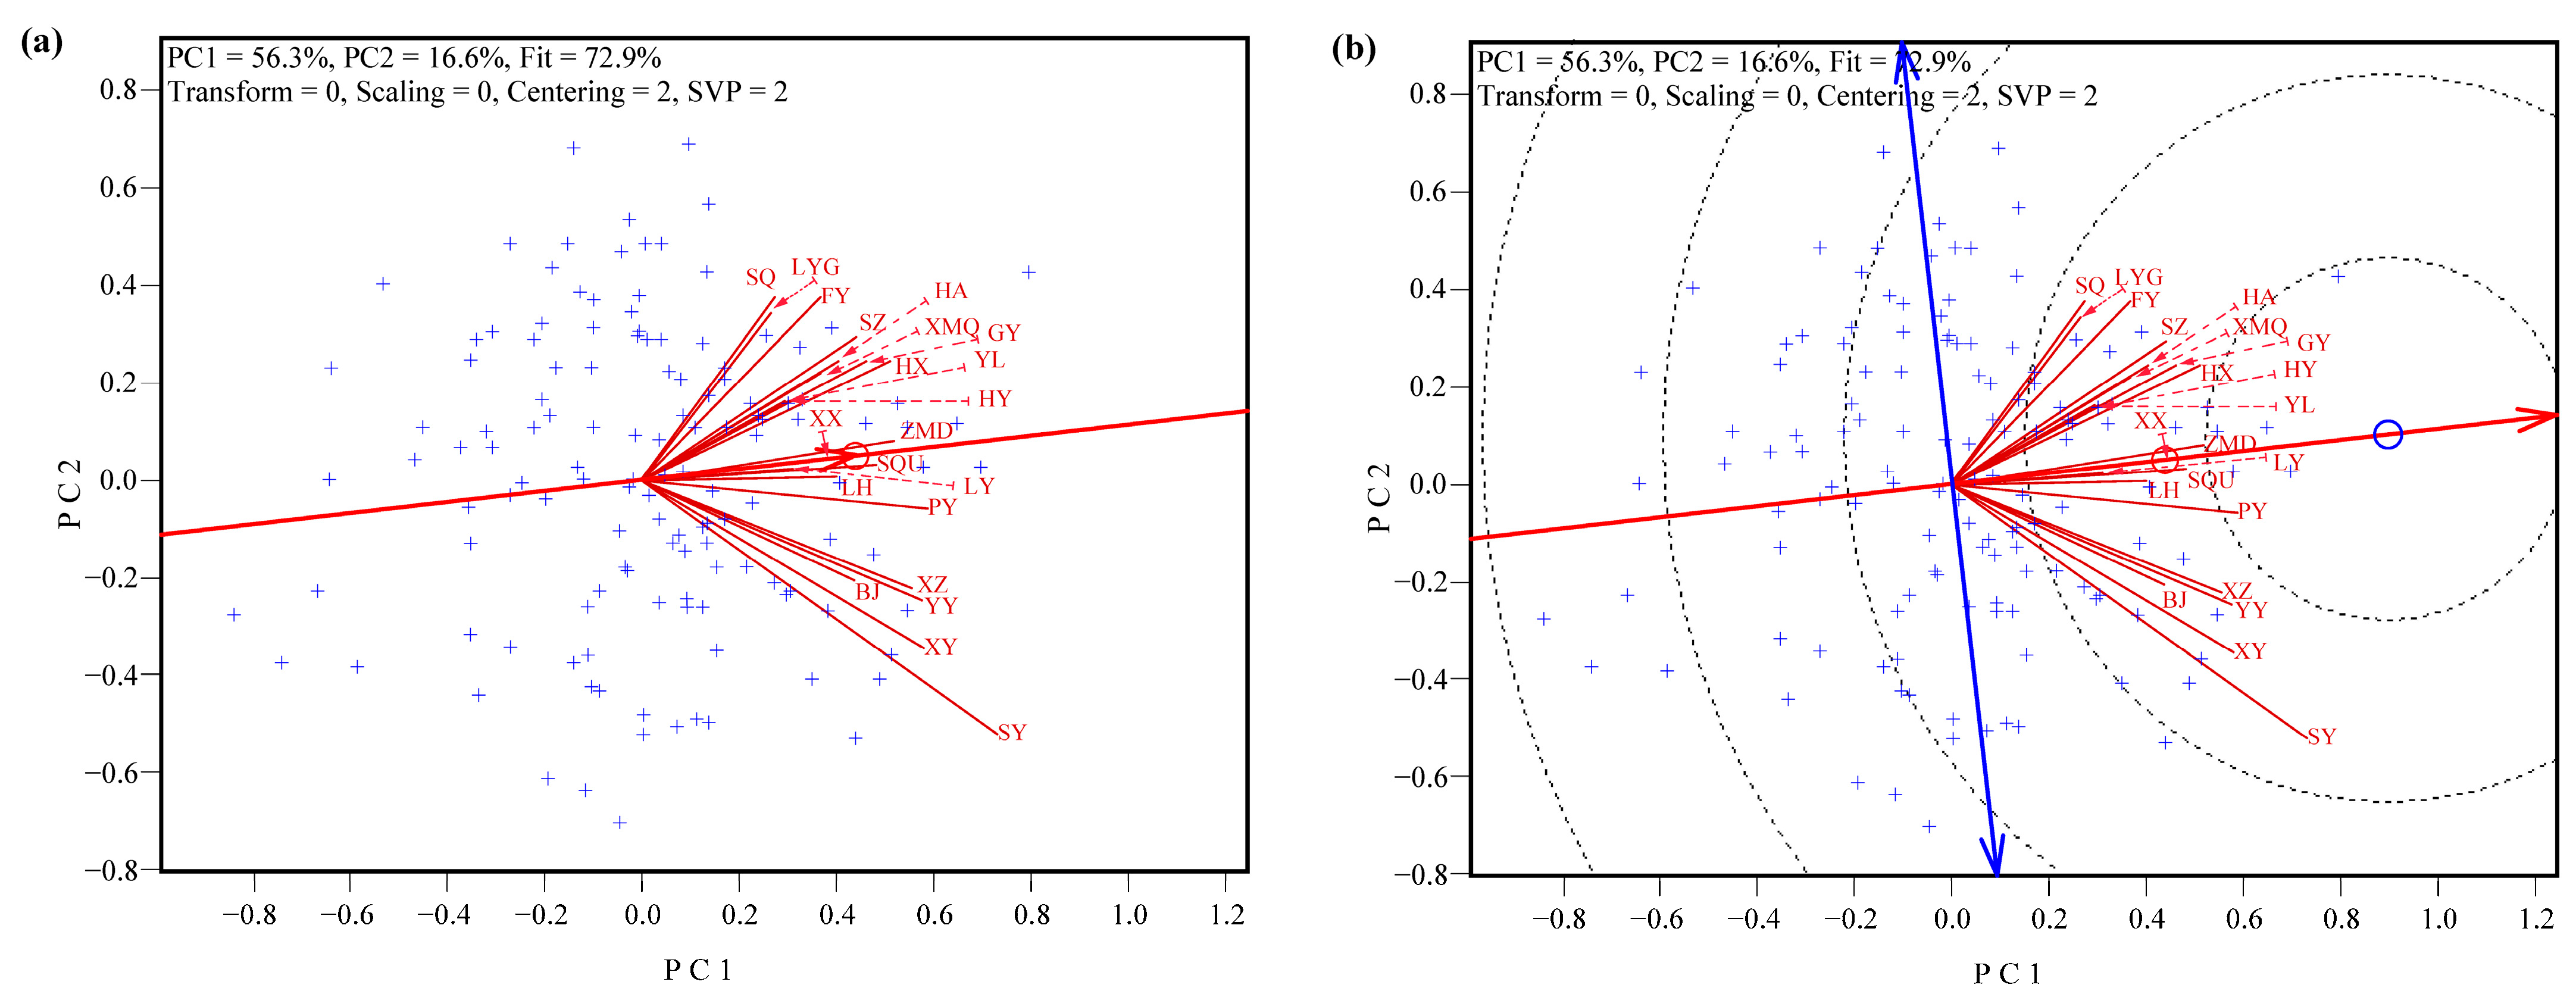
The discriminating ability vs. representativeness view (Figure 2a) and the ideal tester view (Figure 2b) of the BLUP-GGE biplot were used to evaluate test location performance, with representativeness, discriminating ability, and desirability index values presented in Table 3.
Figure 2.
BLUP-GGE biplots for wheat grain yield in the Huanghuai Winter Wheat Region (2021–2025): (a) discriminating ability vs. representativeness view; (b) ideal tester view. Red uppercase letters = location abbreviations (full names in Table 1); to improve clarity due to overlapping, the red arrow is used to connect certain locations to their coordinates; rays from the origin = location vectors; “+” = genotype markers; red circle = average environment marker; red ray = average environment axis (AEA); central blue circle = ideal location marker; blue ray = the vertical axis of the AEA. Biplot parameters: Scaling = 0 (genotype-by-location matrix not scaled); Centering = 2 (matrix centered on the mean of each location); SVP = 2 (singular values fully partitioned to locations, optimal for location evaluation).
Table 3.
Numerical values of test location representativeness, discriminating ability, and desirability index derived from BLUP-GGE biplot analysis (Figure 2).
In Figure 2a, XX and ZMD lies exactly on the AEA, reflecting optimally high representativeness of the target ME; LY, SOU, and LH also form small angles with the AEA, indicating excellent representativeness of HWWR ecological conditions. In contrast, SY, XY, BJ, YY, and XZ (below the AEA) and SQ, LYG, FY, and SZ (above the AEA) form large angles with the AEA, suggesting poor representativeness. Discriminating ability was defined by vector length: SY, XY, YY, XZ, PY, HX, ZMD, GY, SZ, and FY had long vectors (strong discriminating ability), while XX, LH, HY, YL, and LY had short vectors (weak discriminating ability).
In the ideal tester view (Figure 2b), concentric circles serve as reference lines, with the central blue circle representing the ideal location marker. PY was the closest to the ideal marker, followed by ZMD, SQU, and HX, while LYG and SQ were the farthest, exhibiting moderately inferior comprehensive performance.
Table 3 presents the ranking of the 21 test locations for the three key indicators: (1) representativeness (best to worst): ZMD > XX > LY > SQU > LH > PY > HX > HY > YL > GY > XMQ > HA > SZ > XZ > YY > BJ > XY > FY > SY > LYG > SQ; (2) discriminating ability (strongest to weakest): SY > XY > YY > XZ > PY > HX > ZMD > GY > SZ > FY > BJ > SQU > HA > SQ > LYG > XMQ > XX > LH > HY > YL > LY; (3) comprehensive desirability index (best to worst): PY > ZMD > SQU > HX > XZ > YY > GY > XX > LH > SZ > XY > HA > BJ > XMQ > LY > HY > YL > FY > SY > LYG > SQ.
3.4. ME Delineation via the “Which-Won-Where” View of the BLUP-GGE Biplot
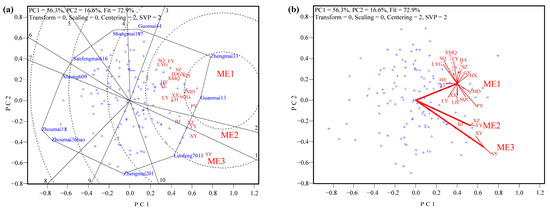
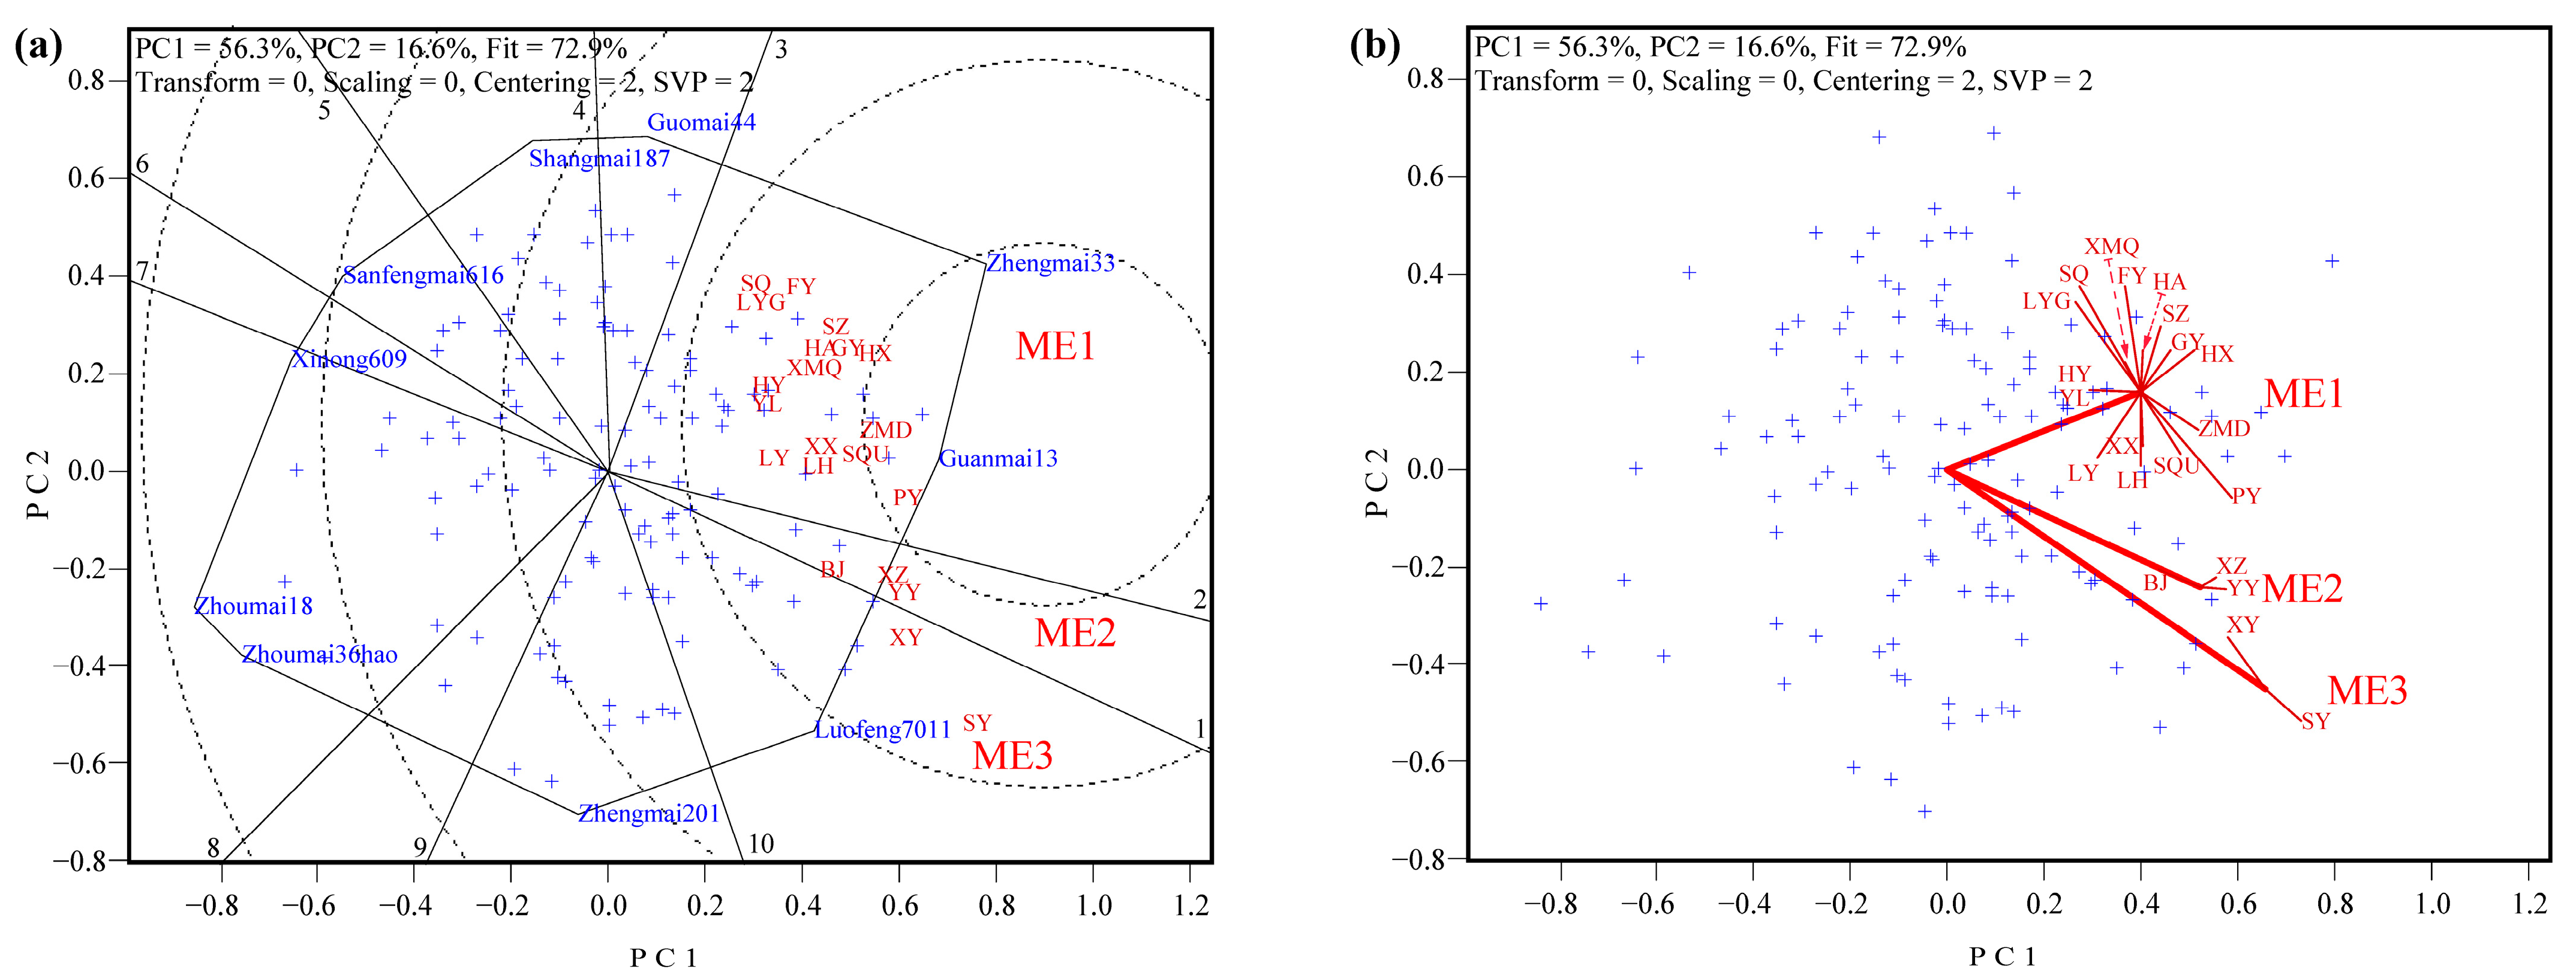
Despite positive inter-location correlations in the BLUP-GGE biplot (Figure 1 and Figure 2), weak correlations among some sites lead to inconsistent cultivar performance, justifying further ME delineation. The “which-won-where” polygon view (Figure 3a) was used for traditional ME delineation, with the corresponding ME biplot (Figure 3b) constructed to visualize inter-ME correlations and intra-ME variation.
Figure 3.
BLUP-GGE biplots for wheat grain yield in the Huanghuai Winter Wheat Region (2021–2025): (a) “which-won-where” polygon view; (b) mega-environment (ME) view. Red uppercase letters = location abbreviations (full names in Table 1); blue labels = top-performing cultivars at polygon vertices; “+” = remaining genotype markers; ME vectors = rays from origin to ME mean coordinates; thin red lines = intra-ME variation (ME mean coordinate to individual locations). Biplot parameters: Scaling = 0 (genotype-by-location matrix not scaled); Centering = 2 (matrix centered on the mean of each location); SVP = 2 (singular values fully partitioned to locations, optimal for location evaluation).
The “which-won-where” view (Figure 3a) partitions the HWWR into three sectors (MEs), with the cultivar at each polygon vertex identified as the top-performing genotype for the corresponding sector (blue labels): (1) ME1 (16 locations: SQ, FY, LYG, SZ, HA, GY, HX, XMQ, HY, YL, LY, XX, LH, SQU, ZMD, and PY)—Zhengmai 33 as the superior cultivar; (2) ME2 (3 locations: BJ, XZ, and YY)—Guanmai 13 as the superior cultivar; (3) ME3 (2 locations: XY and SY)—Luofeng 7011 as the superior cultivar. The remaining genotype markers are represented by “+” for clarity.
The ME biplot (Figure 3b) quantifies inter-ME correlations (vector angles) and intra-ME variation (distance from ME mean coordinate to individual locations): ME vectors are defined as rays from the origin to the mean coordinate of each ME’s locations, with smaller vector angles indicating stronger inter-ME correlations. The delineated MEs exhibited strong positive correlations: the ME2-ME3 angle was extremely small (10.0°), and the ME1-ME3 angle was 56.5° (maximum among all ME pairs). Limited differences in representativeness or desirability index were observed among the three MEs (Section 3.6), indicating insufficient inter-ME differentiation. This failure to meet the core ME delineation criterion—maximizing inter-ME variation and minimizing intra-ME variation—limits the practical value of the “which-won-where” view for targeted cultivar selection. Additionally, ME delineation via this method was highly sensitive to super cultivars: the inclusion or exclusion of top-performing genotypes significantly altered sector partitioning and ME classification, demonstrating poor robustness for multi-year multi-location data analysis.
Collectively, MEs delineated by the “which-won-where” view exhibit strong inter-ME correlations and insufficient differentiation, providing limited guidance for the targeted selection of cultivars with specific environmental adaptation—a core objective of wheat breeding and regional deployment in the HWWR.
3.5. ME Delineation via Test Location Clustering-Based Method
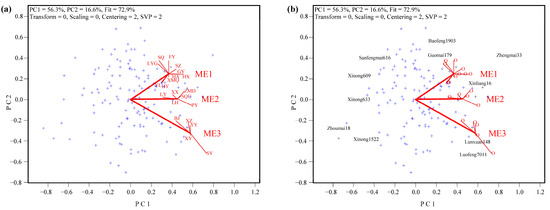
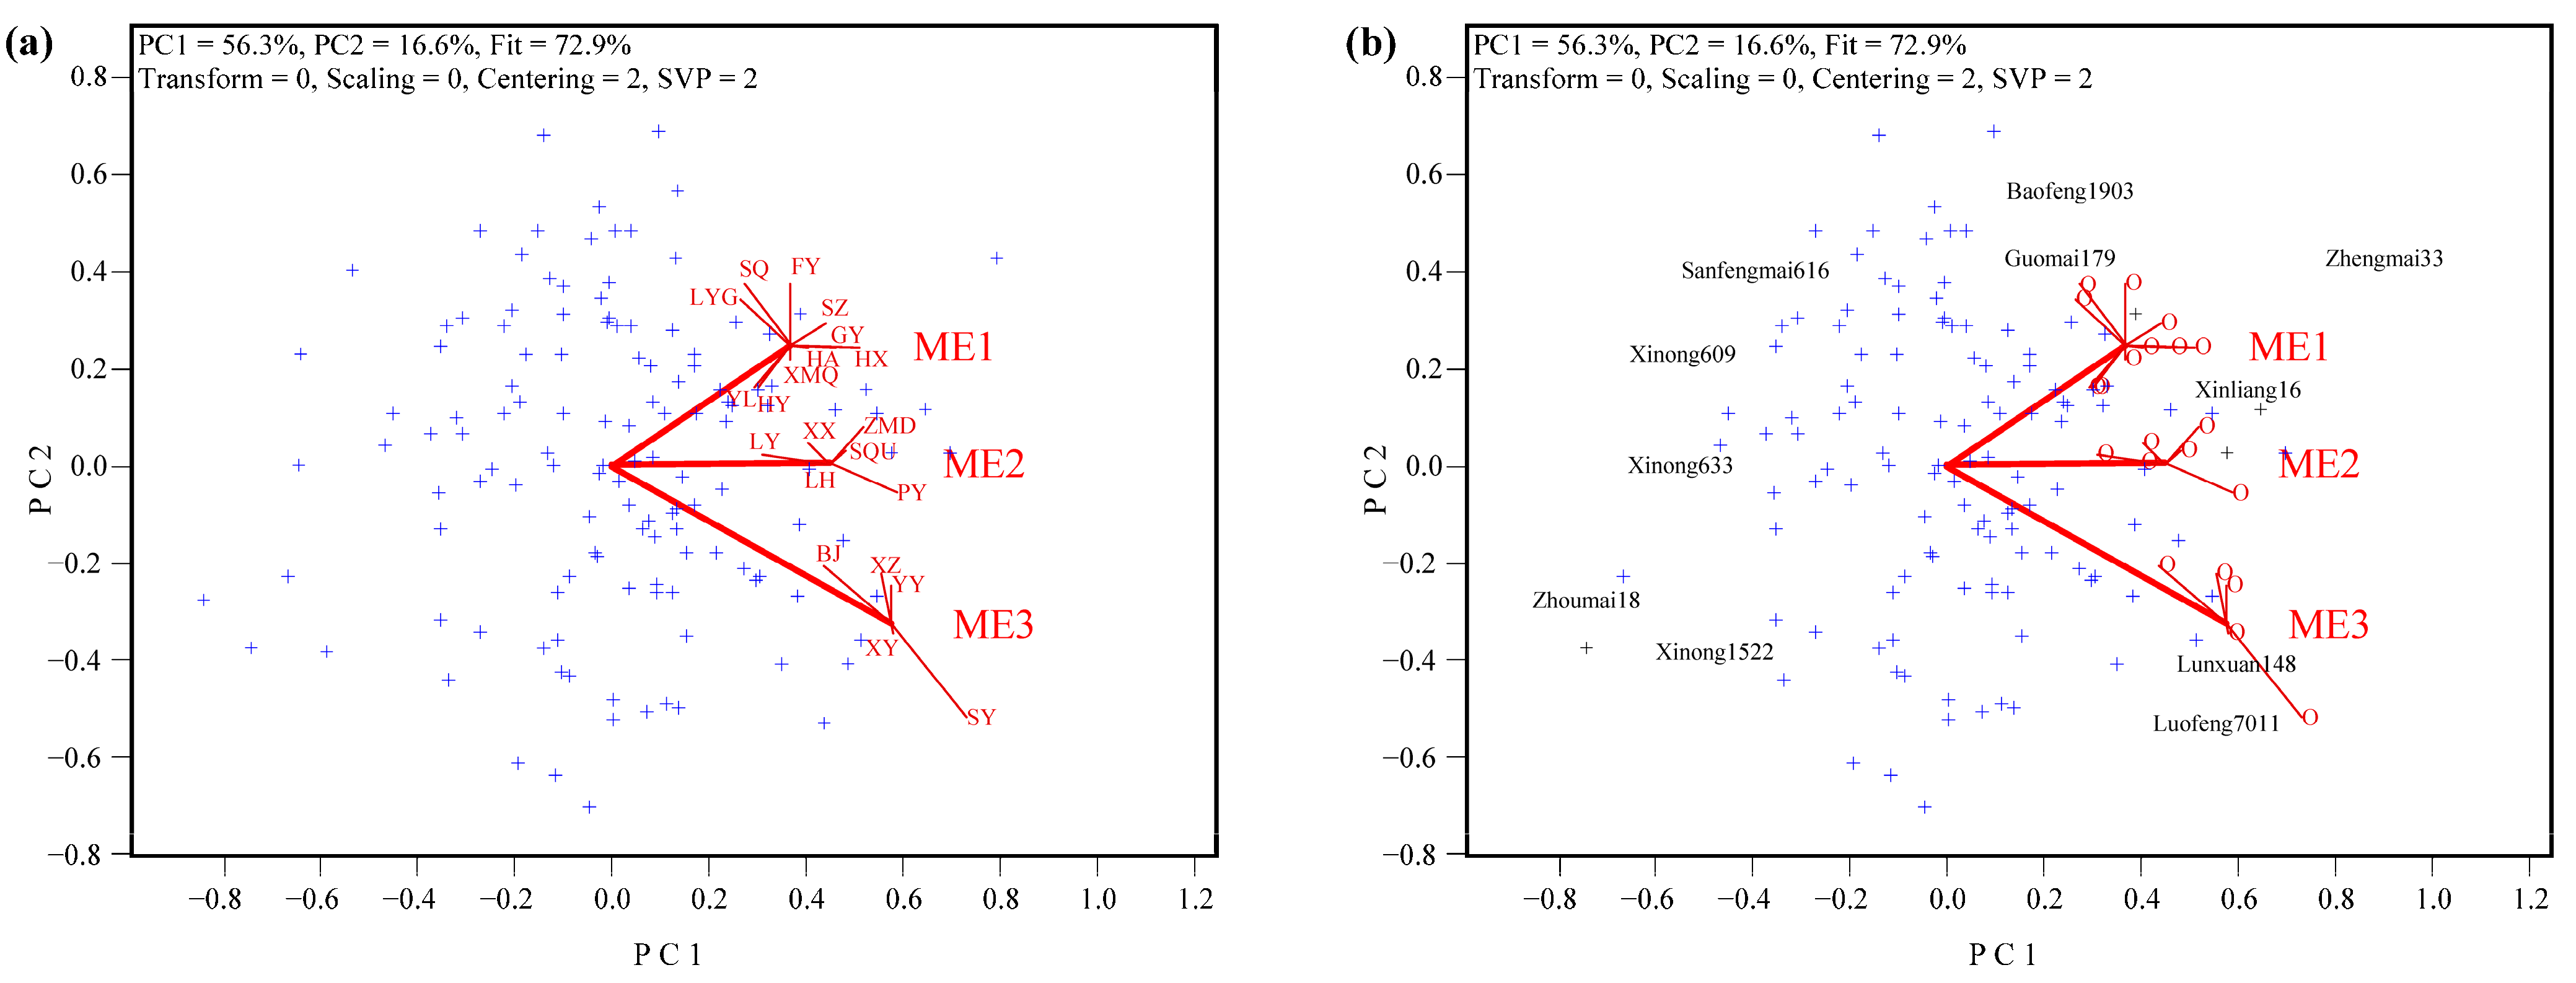
In contrast to the “which-won-where” view, test location coordinates in the BLUP-GGE biplot are determined by the aggregate performance of all evaluated cultivars, rendering them stable and less susceptible to distortion by extreme genotypes. The clustering-based ME biplot (Figure 4a) stably partitions the HWWR into three distinct MEs: (1) ME1 (10 locations: LYG, SQ, FY, SZ, GY, HX, HA, XMQ, HY, and YL); (2) ME2 (6 locations: LY, XX, ZMD, SQU, PY, and LH); (3) ME3 (5 locations: BJ, XZ, YY, SY, and XY). Inter-ME differentiation was markedly enhanced relative to the “which-won-where” view: the ME1-ME3 vector angle was 60.6° (near-right angle; weak positive correlation), ME2 occupied a transitional position between ME1 and ME3, and the ME1-ME2 (18.5°) and ME2-ME3 (41.6°) angles were more evenly distributed than the corresponding angles in the “which-won-where” ME biplot (Figure 3b). These results confirm that the clustering-based method produces MEs with substantially improved inter-ME differentiation and greater robustness.
Figure 4.
ME biplots based on test location clustering of BLUP-GGE biplot coordinates for wheat grain yield in the Huanghuai Winter Wheat Region (2021–2025): (a) ME clustering view (inter-ME correlations and intra-ME variation); (b) cultivar–ME interaction view (simplified location circles, labeled representative cultivars). Red uppercase letters = location abbreviations (full names in Table 1); to improve clarity due to overlapping, the red arrow is used to connect certain locations to their coordinates; ME vectors = rays from origin to ME mean coordinates; thin red lines from ME mean coordinate to location marker = intra-ME variation; red small circles = test locations; the combination of black letters and numbers = representative cultivars; “+” = remaining genotype markers. Biplot parameters: Scaling = 0 (genotype-by-location matrix not scaled); Centering = 2 (matrix centered on the mean of each location); SVP = 2 (singular values fully partitioned to locations, optimal for location evaluation).
The extended ME biplot (Figure 4b) reveals clear cultivar–ME interaction effects, with each ME having an optimally adapted cultivar: Xinliang 16 exhibited superior performance in ME2; Lunxuan 148 and Luofeng 7011 performed exceptionally well in ME3 but moderately in ME1; Baofeng 1903 and Guomai 179 showed the inverse pattern (excellent in ME1and poor in ME3); Xinong 1522 performed suboptimally in ME1; and Sanfengmai 616 performed poorly in ME3. While most genotype markers are represented by “+” for clarity, numerous other cultivars exhibited analogous interaction patterns. These observations firmly confirm significant cultivar–ME interaction effects, which form the fundamental basis for ME delineation in wheat METs.
3.6. Comparative Analysis of ME Delineation Methods
Here, ME delineation was based on the coordinates of each test location in the BLUP-GGE biplot. To quantitatively compare the performance of the “which-won-where” view and the test location clustering-based method, we summarized the key quantitative indicators (discriminating ability, representativeness, and desirability index) for the delineated MEs (Table 4) and calculated inter-ME correlation coefficients and vector angles (Table 5). Multiple comparisons were conducted using the least significant difference (LSD) method (p < 0.05 and p < 0.01) to statistically test the significance of overall mean differences among the delineated MEs.
Table 4.
Comparison of numerical indicators for MEs delineated by the “which-won-where” view and test location clustering-based method (BLUP-GGE biplot, 2021–2025).
Table 5.
Inter-ME correlation coefficients and vector angles for MEs delineated by the “which-won-where” view and test location clustering-based method (BLUP-GGE biplot, 2021–2025).
For MEs delineated by the “which-won-where” view (Table 4), no significant differences were detected in desirability index among the three MEs; the representativeness of ME3 was significantly higher than ME1 (p < 0.05), whereas no significant differences were observed between ME1 and ME2; the discriminating ability of ME3 was significantly higher than ME2 (p < 0.05) and highly significantly higher than ME1 (p < 0.01). This indicates that representativeness and overall desirability are comparable across MEs, with only ME3 exhibiting relatively strong discriminating ability. Since discriminating ability is determined by vector length—a parameter weakly associated with sector partitioning in the “which-won-where” view—this method produces MEs with limited inter-ME differentiation, constraining its theoretical and practical utility for the HWWR.
In contrast, MEs delineated by the clustering-based method (Table 4) exhibited highly significant differences in all three key indicators: (1) discriminating ability: ME3 >> ME1 = ME2 (p < 0.01); (2) representativeness: ME2 >> ME1 = ME3 (p < 0.01); (3) desirability index: ME2 > ME1 = ME3 (p < 0.01) and ME2 > ME3 (p < 0.05). These results demonstrate clear functional characterization of the clustering-based MEs: ME2 (6 locations) has the highest comprehensive desirability and strongest representativeness (core HWWR production area); ME3 (10 locations) has the strongest discriminating ability (distinct environmental characteristics); ME1 (5 locations) has moderate overall performance (low representativeness and weak discriminating ability).
Table 5 further quantifies inter-ME differentiation via correlation coefficients and vector angles: the “which-won-where” view produces small vector angles (10.0° to 56.5°) and high correlation coefficients, confirming strong inter-ME correlations; the clustering-based method produces substantially larger vector angles (18.5° to 60.6°) and lower correlation coefficients, with the maximum ME1-ME3 angle exceeding 60°. These results confirm that the clustering-based method achieves the core ME delineation criterion of maximizing inter-ME divergence, yielding more robust and reliable ME classification for wheat METs in the HWWR.
4. Discussion
4.1. Implications of Variance Component Magnitudes for Selection Strategies
As shown in Table 2, the variance component for Cultivar ( = 0.02876, 2.28% of total) is substantially smaller than that for Year × Location ( = 0.38788, 30.70% of total), which dominates the phenotypic variation in this multi-year, multi-location trial. This indicates that genotype-by-environment interaction (G × E)—particularly the interaction between year and location—is the primary source of phenotypic variation, rather than genetic differences among cultivars alone.
The relatively large G × E variance implies that selection based solely on performance in a single environment may be misleading. Instead, selection strategies should prioritize multi-environment testing to capture the full range of environmental effects and identify cultivars with consistent performance across years and locations. Furthermore, the significant Year × Location × Cultivar interaction (4.77%) suggests that some cultivars respond uniquely to specific environmental combinations, which may warrant targeted deployment in favorable environments rather than broad-spectrum use.
In contrast, the small but highly significant Cultivar variance (p < 0.01) confirms that genetic differences do contribute meaningfully to yield variation, supporting the value of genetic improvement as a breeding objective. However, given the dominance of environmental and G × E effects, selection indices should incorporate stability metrics (e.g., regression coefficients or environmental indices) alongside mean yield to optimize cultivar performance under variable conditions.
4.2. Superiority of the BLUP-GGE Biplot in Analyzing Multi-Environment Variety Trial Data
The accurate dissection of G × E interactions is central to interpreting crop regional trial data, as the choice of statistical methodology directly dictates the reliability of test location evaluation and ME delineation efficacy [4,20]. Traditional GGE biplot analysis relies on raw phenotypic means and is constrained by fixed-effect model assumptions (homogeneous error variances and balanced datasets) that are rarely met in real-world METs [14,19,31], which hinders reliable location evaluation and ME classification. This suboptimal performance arises because raw phenotypic means conflate year, location, cultivar, and their interaction effects, leading to severe environmental noise interference and obscuring true genetic differences among cultivars and ecological correlations among test locations—consistent with recent studies demonstrating that raw-data GGE biplots are prone to bias in complex multi-year multi-location trial systems [17,20].
The integration of BLUP with GGE biplot analysis effectively overcomes these limitations by leveraging the strengths of linear mixed models [15,16]. Treating genotypes and environments as random effects, the BLUP framework efficiently accommodates unbalanced data from rolling cultivar participation and fully decomposes/adjusts for year, location, and G × E interaction effects. In this study, the BLUP-GGE biplot explained 72.9% of total phenotypic variation and all test location vectors formed acute angles (maximum = 88.8°), confirming consistent positive inter-location correlations and the ecological homogeneity of the HWWR. BLUP estimates attenuate environmental noise and experimental error, accurately capturing inherent inter-location relationships and true genotypic performance—advantages that have also been documented in related studies [21].
For test location evaluation, the BLUP-GGE biplot clearly discriminated the discriminating ability and representativeness of each of the 21 test locations, identifying PY as the most ideal location (highest desirability index), followed by ZMD, SQU, and HX, while LYG and SQ exhibited inferior comprehensive performance. This provides a clear quantitative basis for optimizing the HWWR regional trial network, including strengthening core location construction and adjusting/replacing low-desirability locations. Collectively, these results demonstrate that the BLUP-GGE biplot provides a reliable framework for multi-year multi-environment trial analysis, and offers a robust statistical tool for test location evaluation in the ecologically complex HWWR.
4.3. Limitations of the “Which-Won-Where” View for Multi-Year Multi-Location ME Delineation
The “which-won-where” view is an extensively applied method for ME delineation in crop METs, with successful applications in oat [32], wheat [33], cotton [25,34], maize [35], soybean [36,37], and other crops [38,39]. However, in this study, we identify clear limitations when the method is directly applied to multi-year multi-location trial data in the HWWR, stemming from its original design for single-year multi-location data analysis [23,24].
First, the “which-won-where” view cannot effectively eliminate year effects and other confounding sources of variation. The cultivar-by-location two-way table from multi-year trials integrates cumulative temporal effects, and the lack of year-effect decomposition obscures the genuine ecological characteristics of test locations. In this study, MEs delineated by this method exhibited strong inter-ME correlations (vector angles 10.0–56.5°) and no significant differences in desirability index, failing to meet the core ME delineation criterion of maximizing inter-ME variation. This renders the delineation outcomes of limited practical value for targeted cultivar selection and deployment in the HWWR.
Second, the method is highly susceptible to interference from super cultivars (top-yielding genotypes). Designating the polygon vertex cultivar as the top-performing genotype for each sector means that the inclusion/exclusion of these cultivars can substantially alter test location sector partitioning and ME delineation results. In this study, ME classification via the “which-won-where” view varied with changes in core super cultivars, demonstrating poor robustness for multi-year multi-location data analysis.
Conventional improved methods for multi-year multi-location data analysis also have critical limitations: the “year-by-year analysis with multi-year induction” method [24] is extremely cumbersome in practical operation, and substantial annual environmental variability in the HWWR leads to poor repeatability and practicality of year-by-year ME delineation results; the location grouping method proposed by Yan (2019) [23] suffers from high annual variation and unclear regularity, with successful applications limited to a small number of studies [25,40], making it difficult to popularize in the ecologically complex HWWR.
The fundamental reason for these limitations is that the “which-won-where” view is predicated on a relatively homogeneous annual environmental background (single-year data), and it fails to accommodate the complex G × L×Y three-way interaction in multi-year datasets [23,24]. This leads to the confounding of multiple temporal and spatial effects, distorting ME delineation results. Collectively, the direct application of the “which-won-where” view to multi-year multi-location wheat trial data in the HWWR does not yield reliable ME delineation outcomes, highlighting the need to optimize and refine ME delineation methods based on the unique characteristics of multi-year trial data.
4.4. Advantages of the Test Location Clustering-Based Method for ME Delineation
To address the limitations of the “which-won-where” view, in this study, we proposed a test location clustering-based method for ME delineation in the HWWR: constructing an ME biplot via hierarchical clustering of test locations and using a Euclidean distance matrix derived from location coordinates in the BLUP-GGE biplot. This method is grounded in the BLUP-GGE biplot framework, inheriting the key advantages of BLUP values—effective attenuation of environmental noise and accurate capture of inherent ecological correlations among test locations. Most importantly, it abandons the sector-partitioning logic of the “which-won-where” view (susceptible to super cultivar interference) and adopts the overall similarity of test location responses to all evaluated cultivars as the clustering criterion. This fundamental methodological shift significantly enhances the stability and reliability of ME delineation outcomes for complex multi-year multi-location trial data.
The clustering-based ME biplot exhibited three distinct advantages in this study: (i) Enhanced inter-ME differentiation: The method produced substantially larger inter-ME vector angles (18.5–60.6°) than the “which-won-where” view (10.0–56.5°), with the ME1-ME3 angle exceeding 60° (near-right angle; weak positive correlation). Multiple comparisons confirmed significant differences in all key indicators (discriminating ability, representativeness, and desirability index) among the three MEs, forming clearly functionally characterized MEs aligned with the core ME delineation criterion. (ii) High robustness to super cultivar interference: Clustering is based on the overall coordinate characteristics of test locations in the BLUP-GGE biplot, which integrate the comprehensive responses of all cultivars to the test location environment. This avoids the one-sidedness of the “which-won-where” view, which focuses solely on top-performing cultivars, and ensures that ME delineation results are not distorted by extreme genotypes. (iii) Clear cultivar–ME interaction effects: The method explicitly reveals cultivar-ME interactions, with each ME having its own optimally adapted cultivars (Xinliang 16 in ME2, Lunxuan 148/Luofeng 7011 in ME3, and Baofeng 1903/Guomai 179 in ME1). This clear cultivar–ME matching relationship provides a direct scientific basis for the precise deployment and promotion of wheat cultivars in the HWWR, enabling the maximization of cultivar genetic potential and regional yield levels.
By utilizing BLUP values as the data foundation and hierarchical clustering as the core analytical approach, the test location clustering-based ME biplot effectively resolves the issue of confounding effects in multi-year multi-location data analysis and compensates for the deficiencies of the “which-won-where view” [29], Yan’s location grouping method [23], and the “year-by-year analysis with multi-year induction” method [24,41]. Beyond its applicability to wheat regional trials in the HWWR, this method offers a novel reference for ME delineation in other crops characterized by complex ecological conditions and long-term regional trial datasets [22,42], holding significant popularization and application value in crop breeding and regional trial research.
4.5. Practical Implications for Optimizing the HWWR Wheat Regional Trial System
The findings of this study hold important practical implications for optimizing the wheat regional trial system in the HWWR, a core wheat-producing area in China, with recommendations for test location layout, ME-based cultivar promotion, and statistical methodology application.
- Test location layout optimization: The BLUP-GGE biplot identified core test locations with high discriminating ability and strong representativeness (PY, ZMD, SQU, and HX). We recommend strengthening the construction of these core locations, standardizing trial management protocols, and ensuring the stability and reliability of trial data to serve as benchmark sites for the HWWR trial network. For test locations with low comprehensive desirability (LYG and SQ), we suggest three strategies: (i) adjust trial layout to improve ecological representativeness; (ii) optimize field management practices to enhance discriminating ability; or (iii) replace with more representative alternative locations. These measures will improve the efficiency and cost-effectiveness of the HWWR regional trial network.
- ME-based precise cultivar promotion: The three MEs delineated by the clustering-based method encompass the main ecological types of the HWWR, enabling targeted cultivar deployment based on ME characteristics: (i) ME2 (6 core locations): the most favorable comprehensive ecological conditions, suitable for promoting high-yield, widely adaptable cultivars (Xinliang 16); (ii) ME3 (5 locations with distinct environmental characteristics, e.g., coastal saline–alkali soil): strong discriminating ability, ideal for breeding and promoting stress-tolerant, specialized cultivars (Lunxuan 148 and Luofeng 7011); (iii) ME1 (10 locations with low representativeness): conduct targeted cultivar selection tailored to local ecological conditions (e.g., Baofeng 1903 and Guomai 179 for ME1 adaptation). The precise matching of cultivars to their optimal MEs will effectively unlock cultivar genetic potential and elevate the overall wheat yield level in the HWWR.
- Statistical methodology popularization: We recommend adopting the BLUP-GGE biplot in HWWR wheat regional trials to handle unbalanced data and provide stable estimates for test location evaluation and cultivar selection. Additionally, the test location clustering-based ME biplot should be adopted as the preferred method for the ME delineation of multi-year multi-location trial data in the HWWR, providing a more scientific basis for the rational spatial layout of wheat cultivars [4,20]. These methodological improvements will enhance the scientific rigor and practical value of the HWWR wheat regional trial system, supporting the development and promotion of ME-adapted wheat cultivars.
5. Conclusions
Based on national wheat regional trial yield data from 21 test locations in the Huanghuai Winter Wheat Region (2021–2025), in this study, we systematically evaluated the performance of the BLUP-GGE biplot for MET analysis, and explored the applicability of the traditional “which-won-where” view and a novel test location clustering-based method for mega-environment (ME) delineation. The BLUP-GGE biplot effectively eliminated environmental noise and experimental errors by decomposing year, location, and genotype-by-environment (G × E) interaction effects, explaining 72.9% of total phenotypic variation and providing more reliable test location evaluation results—confirming its effectiveness for analyzing unbalanced multi-year multi-environment trial data in the ecologically complex HWWR. PY was identified as the most desirable test location, followed by ZMD, SQU, and HX, while LYG and SQ exhibited relatively poor comprehensive performance, providing a quantitative basis for trial network optimization.
The traditional “which-won-where” view exhibited obvious limitations for multi-year multi-location data analysis, including failure to eliminate confounding temporal effects, high susceptibility to super cultivar interference, and insufficient inter-ME differentiation (vector angles 10.0–56.5°), which constrains its practical utility for targeted cultivar selection. In contrast, the proposed test location clustering-based method—grounded in the BLUP-GGE biplot and Euclidean distance hierarchical clustering—effectively overcomes these limitations, stably delineating the HWWR into three distinct MEs (ME1: LYG, SQ, FY, SZ, GY, HX, HA, XMQ, HY, and YL; ME2: LY, XX, ZMD, SQU, PY, and LH; ME3: BJ, XZ, YY, SY, and XY) with markedly enhanced inter-ME differentiation (maximum vector angle > 60°). These MEs exhibited significant differences in key performance indicators (discriminating ability, representativeness, and desirability index) and clear cultivar–ME interaction effects, with each ME having an optimally adapted cultivar (Xinliang 16 in ME2, Lunxuan 148 and Luofeng 7011 in ME3, and Baofeng 1903 and Guomai 179 in ME1).
This study establishes a comprehensive technical system for test location evaluation and ME delineation in the HWWR based on the BLUP-GGE biplot, optimizing the ME delineation method for multi-year multi-location trial data and offering a new path for the scientific optimization of wheat regional trial systems and precise cultivar promotion in the region. The proposed test location clustering-based ME biplot also has important significance for multi-environment trial analysis and ME delineation of other crops with complex ecological conditions, contributing to the improvement of crop breeding and regional trial research efficiency worldwide.
Author Contributions
Conceptualization, L.L., B.P., G.W., G.Y. and J.X.; Methodology, N.X., B.P., J.X. and L.L.; Validation, B.P., L.L., H.L., M.Z., N.X., G.Y., Y.L., G.W. and J.X.; Formal Analysis, N.X., B.P., J.X. and L.L.; Investigation, N.X., B.P., G.W., H.L., J.X. and L.L.; Resources, G.W., N.X., X.X., B.P. and J.X.; Data Curation, N.X., J.X., B.P., M.Z., P.Q., X.X., Y.L. and G.W.; Writing—Original Draft Preparation, N.X., B.P. and J.X.; Writing—Review and Editing, N.X., M.Z., B.P., J.X. and L.L.; Supervision, N.X., G.Y., H.L., J.X. and B.P.; Project Administration, L.L., B.P., J.X., N.X. and P.Q.; Funding Acquisition, L.L., B.P., J.X., P.Q. and N.X. All authors have read and agreed to the published version of the manuscript.
Funding
This research was funded by the Science and Technology Innovation Project of BAAFS, China (grant number KJCX20250920), Beijing Rural Revitalization Agricultural Science and Technology Project (grant number NY2401050025, NY2601590126), the National Natural Science Foundation of China (grant number 32572366) and Jiangsu Agricultural Science and Technology Innovation Fund (grant number CX(24)3120).
Data Availability Statement
The original contributions presented in this study are included in the article. Further inquiries can be directed to the corresponding authors.
Conflicts of Interest
The authors declare no conflicts of interest.
References
- He, Z.; Zhuang, Q.; Cheng, S.; Yu, Z.; Zhao, Z.; Xu, L. Wheat Production and Technology Improvement in China. J. Agric. 2018, 8, 99–106. [Google Scholar]
- Hu, X.; Sun, L.; Zhou, G.; Wu, L.; Lu, W.; Li, W.; Wang, S.; Yang, X.; Song, J.; Wang, B. Quality characteristics of national regional trial varieties in northern and Huanghuai winter wheat regions from 2000 to 2015. Acta Agron. Sin. 2016, 49, 4677–4686. [Google Scholar]
- Meng, F.; Feng, L.; Zhang, F.; Zhang, Y.; Wu, L.; Wang, C.; Yan, J.; Peng, M.; Mo, Z.; Yu, W. Spatiotemporal variation characteristics of winter wheat overwintering freezing injury in northern winter wheat region. Acta Agron. Sin. 2019, 45, 1576–1585. [Google Scholar] [CrossRef] [Scilit]
- Zhang, W.; Hu, J.; Yang, Y.; Lin, Y. One compound approach combining factor-analytic model with AMMI and GGE biplot to improve multi-environment trials analysis. J. For. Res. 2020, 31, 123–130. [Google Scholar] [CrossRef] [Scilit]
- Yan, W. Analysis and handling of G × E in a practical breeding program. Crop Sci. 2016, 56, 2106–2118. [Google Scholar] [CrossRef] [Scilit]
- Xu, N.; Fok, M.; Li, J.; Yang, X.; Yan, W. Optimization of cotton variety registration criteria aided with a genotype-by-trait biplot analysis. Sci. Rep. 2017, 7, 17237. [Google Scholar] [CrossRef] [Scilit]
- Yan, W.; Frégeau-Reid, J.; Martin, R.; Pageau, D.; Mitchell-Fetch, J. How many test locations and replications are needed in crop variety trials for a target region? Euphytica 2015, 202, 361–372. [Google Scholar] [CrossRef] [Scilit]
- Crespo-Herrera, L.A.; Crossa, J.; Huerta-Espino, J.; Autrique, E.; Mondal, S.; Velu, G.; Vargas, M.; Braun, H.J.; Singh, R.P. Genetic yield gains in CIMMYT’s international elite spring wheat yield trials by modeling the genotype × environment interaction. Crop Sci. 2017, 57, 789–801. [Google Scholar] [CrossRef] [Scilit] [PubMed]
- Mohammadi, R.; Farshadfar, E.; Amri, A. Interpreting genotype × environment interactions for grain yield of rainfed durum wheat in Iran. Crop J. 2015, 3, 526–535. [Google Scholar] [CrossRef] [Scilit]
- Gauch, H.G.; Zobel, R.W. Identifying mega-environments and targeting genotypes. Crop Sci. 1997, 37, 311–326. [Google Scholar] [CrossRef] [Scilit]
- Mohammadi, R.; Amri, A. Analysis of genotype × environment interactions for grain yield in durum wheat. Crop Sci. 2009, 49, 1177–1186. [Google Scholar] [CrossRef] [Scilit]
- Yan, W. GGE biplot—A Windows application for graphical analysis of multienvironment trial data and other types of two-way data. Agron. J. 2001, 93, 1111–1118. [Google Scholar] [CrossRef] [Scilit]
- Yan, W.; Tinker, N.A. Biplot analysis of multi-environment trial data: Principles and applications. Can. J. Plant Sci. 2006, 86, 623–645. [Google Scholar] [CrossRef] [Scilit]
- Li, Z.; Liu, N.; Zhang, W.; Dong, Y.; Ding, M.; Huang, Q.; Ding, C.; Su, X. Application of BLUP-GGE in growth variation analysis in southern-type Populus deltoides seedlings in different climatic regions. Forests 2022, 13, 2120. [Google Scholar] [CrossRef] [Scilit]
- Fu, W.; Li, S.; Dai, X.; Wu, H.; Yin, T. Growth performance and stability analysis of poplar clones based on BLUP and GGE biplot under two different geographic sites in China. Ind. Crops Prod. 2025, 230, 121039. [Google Scholar] [CrossRef] [Scilit]
- Smith, A.B.; Cullis, B.R.; Thompson, R. The analysis of crop cultivar breeding and evaluation trials: An overview of current mixed model approaches. J. Agric. Sci. 2005, 143, 449–462. [Google Scholar] [CrossRef] [Scilit]
- Deng, L.; Ren, L.; Guo, M.; Miao, J.; Lu, Z.; Yin, J.; Wang, P. Analysis of the interaction effect between peanut yield genotypes and environment based on BLUP and GGE Biplot. Seed 2024, 43, 91–96. [Google Scholar]
- Ren, L.; Guo, M.; Miao, J.; Deng, L.; Yin, J.; Li, Y.; Lu, Z.; Hu, J.; Gu, J. Comprehensive analysis of peanut variety with high oleic acid based on BLUP value and GGE-biplot. Mol. Plant Breed. 2024, 22, 1568–1574. [Google Scholar]
- Krishnappa, G.; Khan, H.; Amaresh; Vinayaka; Pathy, T.L.; Gupta, A.; Mahendru-Singh, A.; Ahlawat, A.K.; Patel, J.M.; Biradar, S.S.; et al. Deciphering low nitrogen tolerance of wheat in mega-environments using integrated multivariate approaches. Eur. J. Agron. 2026, 173, 127919. [Google Scholar] [CrossRef] [Scilit]
- Bai, L.; Huang, X.; Li, Z.; Li, S.; Lv, C.; Zhang, K.; Dai, J. Stability and adaptability of wheat cultivars with low cadmium accumulation based on farmland trials. Eur. J. Agron. 2023, 144, 126764. [Google Scholar] [CrossRef] [Scilit]
- Liu, N.; Ding, C.; Li, B.; Ding, M.; Su, X.; Huang, Q. Analysis of the genotype interaction of four-year-old Populus euramericana using the BLUP-GGE technique. Forests 2021, 12, 1759. [Google Scholar] [CrossRef] [Scilit]
- Cheng, L.; Zhang, X.; Zhang, X.; Zhang, W.; Lin, Y. Forestry multi-environment trial analysis based on BLUP and GGE biplot. J. Northwest AF Univ. 2018, 46, 87–93. [Google Scholar]
- Yan, W. LG biplot: A method for mega-environment investigation using existing crop variety trial data. Sci. Rep. 2019, 9, 7130. [Google Scholar] [CrossRef] [Scilit]
- Xu, N.; Fok, M.; Zhang, G.; Li, J.; Yang, X.; Zhou, Z. The application of GGE biplot analysis for evaluating test locations and mega-environment investigation of cotton regional trials. J. Integr. Agric. 2014, 13, 1921–1933. [Google Scholar] [CrossRef] [Scilit]
- Xu, N.; Qiao, Y.; Zhao, S.; Yang, X.; Li, J.; Fok, M. Optimizing the test locations and replicates in multi-environmental cotton registration trials in southern Xinjiang, China. Crop Sci. 2022, 62, 1866–1879. [Google Scholar] [CrossRef] [Scilit]
- Amrate, P.K.; Nataraj, V.; Shivakumar, M.; Shrivastava, M.K.; Rajput, L.S.; Mohare, S.; Agrawal, N.; Mandloi, S.; Anand, K.J.; Ratnaparkhe, M.B.; et al. Best linear unbiased prediction (BLUP)-based models aided in selection of high yielding charcoal rot and yellow mosaic resistant soybean genotypes. Genet. Resour. Crop Evol. 2025, 72, 5593–5611. [Google Scholar] [CrossRef] [Scilit]
- Ayalew, H.; Wondale, L.; Teshager, A. GGE biplot analysis on the performance of wheat genotype for hectolitre weight and mega environments identification in north western Ethiopia. Aust. J. Crop Sci. 2014, 8, 1435–1440. [Google Scholar]
- Yan, W.; Holland, J.B. A heritability-adjusted GGE biplot for test environment evaluation. Euphytica 2010, 171, 355–369. [Google Scholar] [CrossRef] [Scilit]
- Yan, W.; Pageau, D.; Frégeau-Reid, J.; Lajeunesse, J.; Goulet, J.; Durand, J.; Marois, D. Oat mega-environments and test-locations in Quebec. Can. J. Plant Sci. 2011, 91, 643–649. [Google Scholar] [CrossRef] [Scilit]
- Hailemariam Habtegebriel, M. Adaptability and stability for soybean yield by AMMI and GGE models in Ethiopia. Front. Plant Sci. 2022, 13, 950992. [Google Scholar] [CrossRef] [Scilit]
- Rahmati, S.; Azizi-Nezhad, R.; Pour-Aboughadareh, A.; Etminan, A.; Shooshtari, L. Analysis of genotype-by-environment interaction effect in barley genotypes using AMMI and GGE biplot methods. Heliyon 2024, 10, e38131. [Google Scholar] [CrossRef] [Scilit] [PubMed]
- Yan, W. Mega-environment analysis and test-location evaluation based on unbalanced multiyear data. Crop Sci. 2015, 55, 113–122. [Google Scholar] [CrossRef] [Scilit]
- Mohammadi, R.; Amri, A. Analysis of genotype × environment interaction in rain-fed durum wheat of Iran using GGE-biplot and non-parametric methods. Can. J. Plant Sci. 2012, 92, 757–770. [Google Scholar] [CrossRef] [Scilit]
- Baxevanos, D.; Goulas, C.; Rossi, J.; Braojos, E. Separation of cotton cultivar testing sites based on representativeness and discriminating ability using GGE biplots. Agron. J. 2008, 100, 1230–1236. [Google Scholar] [CrossRef] [Scilit]
- Shojaei, S.H.; Mostafavi, K.; Bihamta, M.R.; Omrani, A.; Mousavi, S.M.N.; Illés, Á.; Bojtor, C.; Nagy, J. Stability on maize hybrids based on GGE biplot graphical technique. Agronomy 2022, 12, 394. [Google Scholar] [CrossRef] [Scilit]
- Obua, T.; Sserumaga, J.P.; Tukamuhabwa, P.; Namara, M.; Awio, B.; Mugarra, J.; Tusiime, G.; Chigeza, G. Unravelling yield and yield-related traits in soybean using GGE biplot and path analysis. Agronomy 2024, 14, 2826. [Google Scholar] [CrossRef] [Scilit]
- Obua, T.; Sserumaga, J.P.; Awio, B.; Nganga, F.; Odong, T.L.; Tukamuhabwa, P.; Tusiime, G.; Mukasa, S.B.; Nabasirye, M. Multi-environmental evaluation of protein content and yield stability among tropical soybean genotypes using GGE biplot analysis. Agronomy 2021, 11, 1265. [Google Scholar] [CrossRef] [Scilit]
- Kebede, G.Y.; Assen, K.Y.; Shuro, A.R. GGE biplot analysis for yield performance and stability of faba bean (Vicia faba L.) genotypes under multi-environmental condition. Ecol. Genet. Genom. 2025, 34, 100325. [Google Scholar] [CrossRef] [Scilit]
- Olanrewaju, O.S.; Oyatomi, O.; Babalola, O.O.; Abberton, M. GGE biplot analysis of genotype × environment interaction and yield stability in Bambara groundnut. Agronomy 2021, 11, 1839. [Google Scholar] [CrossRef] [Scilit]
- Yan, W. A systematic narration of some key concepts and procedures in plant breeding. Front. Plant Sci. 2021, 12, 724517. [Google Scholar] [CrossRef] [Scilit]
- Yan, W. Optimal use of biplots in analysis of multi-location variety test data. Acta Agron. Sin. 2010, 36, 1805–1819. [Google Scholar]
- Ling, J.; Xiao, Y.; Hu, J.; Wang, F.; Ouyang, F.; Wang, J.; Weng, Y.; Zhang, H. Genotype by environment interaction analysis of growth of Picea koraiensis families at different sites using BLUP-GGE. New For. 2020, 52, 113–127. [Google Scholar] [CrossRef] [Scilit]

Disclaimer/Publisher’s Note: The statements, opinions and data contained in all publications are solely those of the individual author(s) and contributor(s) and not of MDPI and/or the editor(s). MDPI and/or the editor(s) disclaim responsibility for any injury to people or property resulting from any ideas, methods, instructions or products referred to in the content. |
© 2026 by the authors. Licensee MDPI, Basel, Switzerland. This article is an open access article distributed under the terms and conditions of the Creative Commons Attribution (CC BY) license.