Article

Methodical Nitrogen–Water Distribution System Enhances Rice Yield While Reducing Environmental Losses: Evidence from 15N Isotope Tracing

1
Rice Research Institute, Sichuan Agricultural University, Chengdu 611130, China
2
Crop Ecophysiology and Cultivation Key Laboratory of Sichuan Province, Chengdu 611130, China
3
Pilot-Scale R&D Platform of Sichuan Province for New Rice Varieties and Technologies, Meishan 611130, China
4
Chuanzhong Seed Industry, Chengdu 611532, China
*
Authors to whom correspondence should be addressed.
Agronomy 2026, 16(8), 801; https://doi.org/10.3390/agronomy16080801
Submission received: 17 March 2026 / Revised: 5 April 2026 / Accepted: 12 April 2026 / Published: 14 April 2026

Abstract

Sustainable rice production necessitates innovative strategies optimizing productivity while minimizing environmental impacts. This study developed and evaluated a Methodical Nitrogen–Water Distribution (MNWD) system, employing 15N isotopic tracing to quantify the fate of nitrogen under three management regimes: Farmer’s Practice (FP), Nitrogen–Water Coupling (NWC), and MNWD. Among them, NWC is conventional N–water coupling management, while MNWD is optimized management with reduced N, saved water and synchronous N–W uniform application. Two-year field experiments (2019–2020) demonstrated that MNWD achieved yield increases of 9.01–15.60% over FP and 2.51–5.73% over NWC, while reducing nitrogen application by 20%. Based on 15N tracing, the nitrogen recovery efficiency of MNWD reached 52.9–56.6%, and leaching losses were reduced by 65.4% compared to FP. The modular design of MNWD requires only moderate increases in labor input and basic fertigation infrastructure, ensuring its applicability to smallholder systems. The trade-off between emissions and efficiency confirmed the environmental benefits of MNWD: it resulted in 34.0% lower N2O emissions than NWC while achieving a 5.45–5.49 percentage-point higher nitrogen recovery efficiency. Relative to FP, MNWD reduced total nitrogen losses by 48.5–61.4% with only a 3.4% increase in N2O emissions. This indicates that nitrogen conservation was predominantly achieved through enhanced plant uptake rather than conversion to alternative loss pathways. The MNWD system demonstrates a viable pathway for sustainable rice intensification by successfully decoupling productivity gains from nitrogen input intensity.

1. Introduction

Global rice demand is projected to increase by 25–30% by 2050 to meet the needs of a growing population [1]. This trend necessitates the development of sustainable intensification strategies that optimize resource use efficiency while minimizing environmental impacts. Current rice production systems exhibit considerable resource intensity, with irrigation consuming 34–43% of global agricultural freshwater withdrawals [1]. In addition, the water consumption per unit yield ranges from 1.43 to 2.50 m3 kg−1, which is 2–3 times higher than dryland cropping systems [2,3]. Simultaneously, the nitrogen input intensity averages 120–180 kg N ha−1 globally, with China averaging 150–200 kg N ha−1 nationally [4], significantly exceeding that of dryland cereals [5]. Despite these intensive inputs, the partial factor productivity of nitrogen remains at 30–40 kg grain kg−1 N, substantially below the target of >50 kg kg−1 achieved in advanced production systems [6].
China’s rice production, contributing 27% of global output [7], exemplifies these sustainability challenges and their environmental consequences. Under conventional nitrogen application and continuous flooding practices commonly adopted in Chinese rice systems, nitrogen use efficiency remains low (30–40%), with substantial nitrogen losses occurring through volatilization, denitrification, and leaching processes [8].This anthropogenic disturbance has resulted in severe groundwater nitrate contamination in China. The national median nitrate concentration rose from 3.84 mg/L in 1990 to 6.94 mg/L in 2020, with more than 44.7% of groundwater samples exceeding the World Health Organization (WHO) drinking water standard (10 mg N/L, equivalent to 50 mg NO3 L−1), posing significant health risks to millions of rural residents [9,10]. The crisis stems from a structural contradiction of “high-input, low-efficiency”: irrigation efficiency in the Yangtze Basin averages 45–50%, compared to 70–80% in developed countries [11], while water consumption per unit yield remains 2.5–3 times that of dryland systems [12].
These challenges have driven the evolution of water–fertilizer management through three distinct technological paradigms, each with specific advantages and limitations. The conventional Farmer’s Practice employs continuous flooding and concentrated basal-tillering fertilization, resulting in irrigation water productivity below 0.6 kg m−3 and nitrogen recovery efficiency of only 25–35% [13]. Building upon this foundation, the Nitrogen–Water Coupling (NWC) mode achieves passive synergy through alternate wetting and drying irrigation combined with optimized nitrogen topdressing, increasing grain yield by 5–12% compared to conventional practices [14]. However, its lack of real-time regulation leads to 30–40% increases in nitrogen runoff losses during critical growth stages under extreme rainfall events [15]. Advanced precision water–fertilizer management systems elevate nitrogen use efficiency to 50–60% via dynamic monitoring, yet the high cost of sensors and automated systems restricts adoption among smallholder farmers to below 10% in major rice-producing regions [6,16].
Recognizing these limitations, the Methodical Nitrogen–Water Distribution (MNWD) management system represents a novel paradigm that integrates agronomic simplification with technological innovation. The novelty of MNWD lies not merely in combining existing practices, but in establishing a methodical regulation framework in which coordinated water–nitrogen management enables active control over the spatiotemporal distribution and availability of nitrogen. This system integrates the nitrogen reduction and efficiency benefits of SPAD-based nitrogen management with the operational simplicity of leaf age-based split nitrogen application and further incorporates the concept of integrated water–nitrogen management. Unlike passive coupling approaches, MNWD achieves active nitrogen–water synergy through systematic seven-split nitrogen applications coupled with precision fertigation and real-time soil moisture monitoring using mechanical tensiometers. The approach creates irrigation-driven vertical redistribution of fertilizers, inducing nitrogen enrichment in the root-dense zone while maintaining optimal soil moisture conditions. Preliminary studies suggest that MNWD can reduce nitrogen input while maintaining yield through enhanced nutrient use efficiency [17], but the mechanistic basis and environmental implications remain incompletely understood.
Three critical knowledge gaps impede broader implementation of MNWD systems and limit confidence in their reliability. In particular, although MNWD has shown promise in improving nitrogen and water use efficiency, its underlying mechanisms remain insufficiently understood, especially regarding how coordinated water–nitrogen regulation influences nitrogen fate, crop response, and the trade-off between productivity and environmental losses under field conditions. First, whether nitrogen reduction sustains yield stability through physiological optimization remains unverified under field conditions across varying environmental scenarios. Second, quantitative allocation of applied nitrogen among plant uptake, soil retention, and environmental losses requires comprehensive elucidation via isotopic tracing methodologies to understand the mechanistic basis of efficiency improvements. Third, the reliability of achieving simultaneous high yield with low emissions under diverse environmental conditions is unproven, limiting confidence in system robustness for large-scale adoption. Based on the above considerations, we hypothesized that MNWD would (1) maintain yield stability with reduced nitrogen input through optimized nutrient–plant synchronization, (2) reduce environmental nitrogen losses via enhanced spatial distribution and temporal matching, and (3) demonstrate consistent performance across varying environmental conditions.
Therefore, this study employed 15N isotopic tracing to decode nitrogen fate characteristics across different water–nitrogen management regimes, comparing their yield stability and environmental performance. The research aims to provide mechanistic insights and replicable technical paradigms for sustainable rice intensification that successfully decouples productivity gains from nitrogen input intensity, achieving simultaneous yield enhancement, resource conservation, and environmental protection.

2. Materials and Methods

2.1. Experimental Design Framework

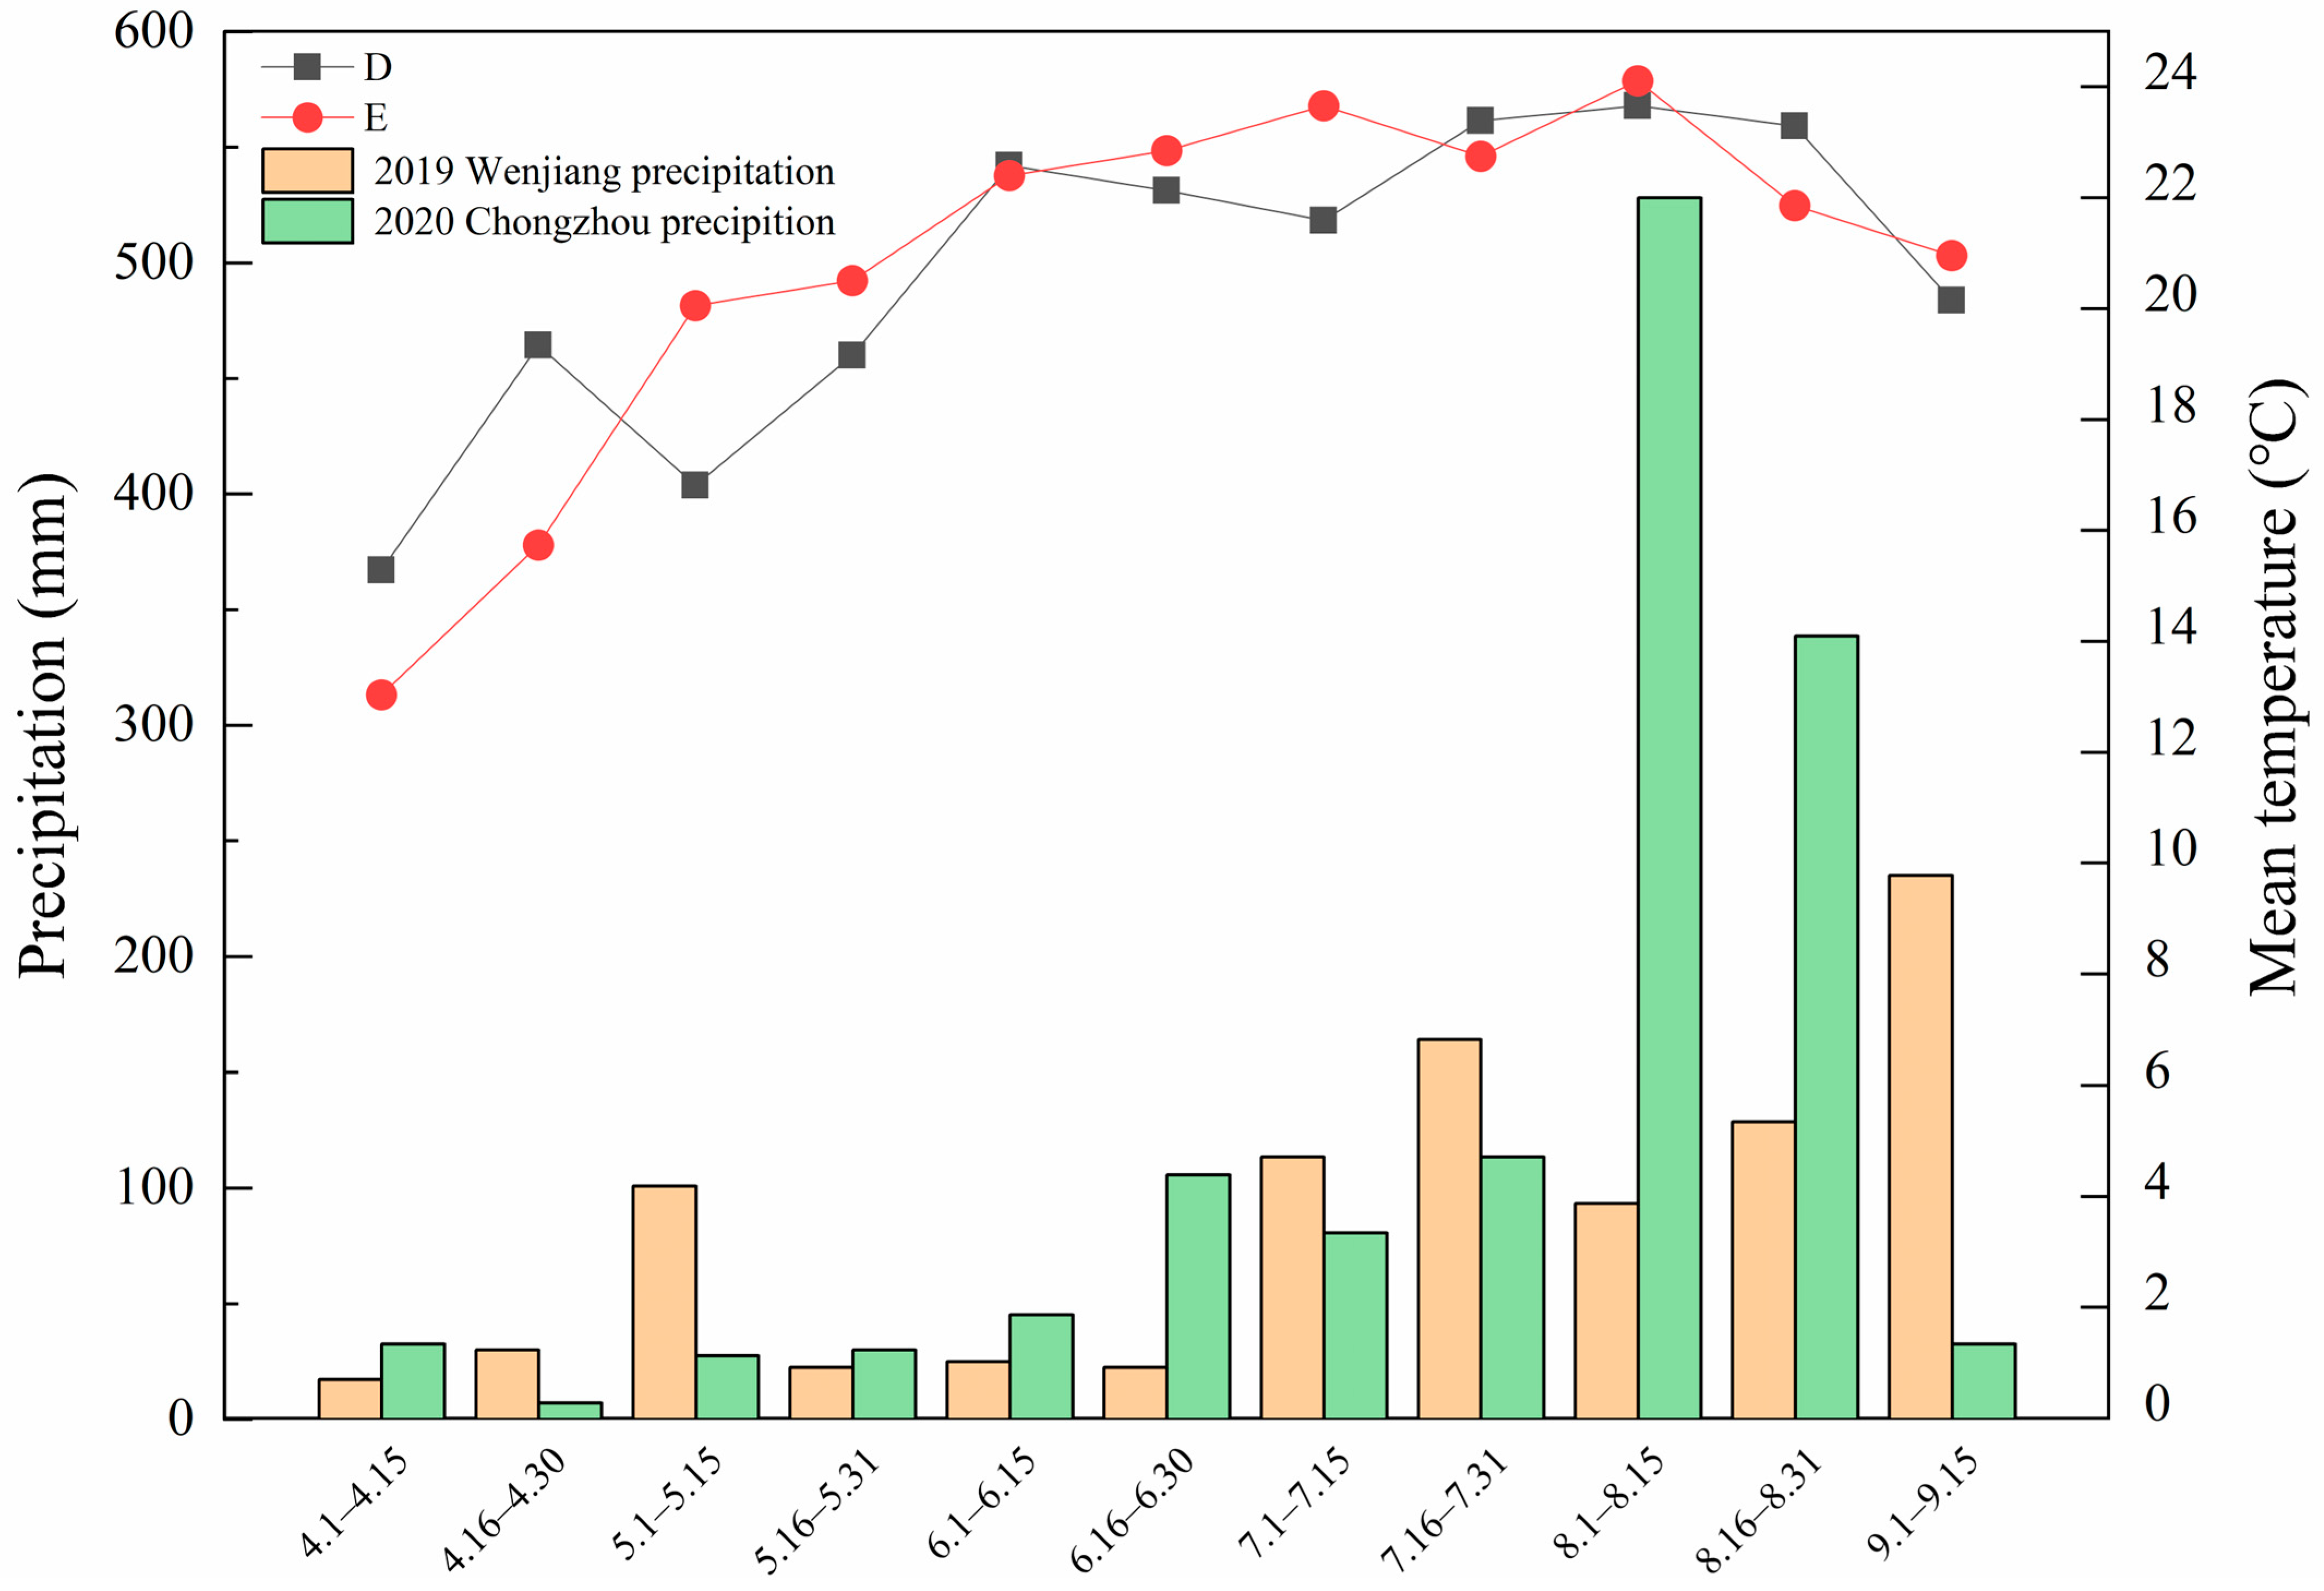
A field experiment was conducted during the 2019–2020 rice growing seasons at representative sites in Sichuan Province, Southwest China, employing a randomized complete block design with three replicates. Experimental sites featured typical paddy soils (Hydragric Anthrosols according to FAO classification) with clay loam texture, representative of major rice-growing regions in Southwest China. The 2019 growing season received 1247 mm of precipitation with a mean temperature of 24.8 °C, while 2020 had 1156 mm precipitation and a 25.3 °C mean temperature (Figure 1).
The experimental framework achieved dual objectives through integrated approaches. Conventional agronomic evaluation assessed production performance under field-scale conditions, while specialized 15N isotopic tracing quantified nitrogen fate pathways. Each experimental unit consisted of a main plot (5 m × 10 m) for standard agronomic measurements and yield assessment, complemented with strategically embedded micro-plot systems for isotopic analysis. This dual-scale design ensured representative field conditions while enabling precise quantification of nitrogen fate. Site characteristics, including climatic conditions and soil properties, are presented in Figure 1 and Table 1, respectively. Soil chemical analyses followed standard protocols [18].

2.2. Treatment Implementation and Management Protocols

Three water–nitrogen management regimes were evaluated, representing distinct technological paradigms in rice production: Farmer’s Practice (FP), Nitrogen–Water Coupling (NWC), and Methodical Nitrogen–Water Distribution (MNWD). Detailed management specifications for each regime are provided in Table 2. The indica rice cultivar Yixiangyou 2115 was transplanted on 11 May at a standardized density (18 hills m−2, 33.3 cm × 16.7 cm spacing) with a single seedling establishment per hill.
Plot isolation was achieved through 30 cm-high compacted soil bunds wrapped with polyethylene film (0.2 mm thickness) extending 50 cm below ground surface to prevent lateral nutrient seepage. The application of phosphorus (75 kg P2O5 ha−1) and potassium (150 kg K2O ha−1) remained consistent across treatments, applied at non-limiting levels as basal fertilizers or split-applied at the basal and panicle initiation stages, respectively.
The three management regimes represented the progressive intensification of water–nitrogen integration. FP employed conventional continuous flooding with two-split nitrogen application (150 kg N ha−1 total), representing typical farmer practices. NWC integrated alternate wetting and drying irrigation with four-split nitrogen application (150 kg N ha−1 total), achieving passive synergy between water and nutrient management. MNWD implemented precision fertigation with seven-split nitrogen application (120 kg N ha−1 total, derived from previous studies [17]), creating active synergy through irrigation-driven nutrient redistribution coupled with real-time soil moisture monitoring, as detailed in Table 2 and Figure S1.
It should be noted that irrigation management was not standardized across treatments. The three water–nitrogen management regimes (FP, NWC, and MNWD) employed distinct irrigation strategies, including continuous flooding, alternate wetting and drying, and soil moisture-based precision irrigation, respectively. Therefore, the irrigation frequency and total water input were not identical among treatments.

2.3. Integrated Micro-Plot System for 15N Tracing

Within each main plot, five specialized micro-plots (66.6 cm × 50.1 cm) were established for comprehensive nitrogen fate analysis. Each micro-plot contained six rice hills (2 rows × 3 hills) and was designated for specific analytical purposes: leachate collection, surface runoff monitoring, greenhouse gas sampling, destructive soil analysis, and plant tissue analysis at physiological maturity. This configuration maintained a representative plant population density consistent with the main plot conditions.
Micro-plot isolation employed custom-fabricated PVC frames (66.6 cm × 50.1 cm × 150 cm) inserted 100 cm below ground with 50 cm above-ground extension to prevent lateral nutrient migration while preserving natural soil–plant interactions. The insertion depth exceeded the primary root zone (0–80 cm) by 20 cm to ensure effective isolation of the nitrogen cycling system.
Nitrogen applications within micro-plots utilized 15N-enriched urea (Shanghai Research Institute of Chemical Industry, Shanghai, China, 10.13 atom% 15N excess) applied at identical rates and timing schedules as corresponding main plot treatments. Isotope-labeled fertilizer was dissolved in deionized water and applied uniformly using calibrated microsyringes to ensure precise isotope distribution. Following application, gentle soil incorporation (2–3 cm depth) minimized surface volatilization while maintaining soil structure integrity.
Environmental monitoring within micro-plots employed automated data logging systems with soil temperature sensors (±0.5 °C precision), moisture sensors (±2% accuracy), and tensiometers (±1 kPa precision) installed at 15 cm depth. All other management practices, including irrigation scheduling, pest, disease and weed control, and crop maintenance, remained synchronized between the main plots and micro-plots to maintain experimental validity; this included regular field monitoring, pesticide application when necessary, early-stage chemical weed control, and mechanical weeding during the growing period, in coordination with irrigation and fertilization management. Micro-plot representativeness was validated through correlation analysis with main plot yields (r > 0.95, p < 0.001), confirming accurate reflection of field-scale nitrogen dynamics.

2.4. Environmental Loss Monitoring Systems

Surface runoff and subsurface leaching were monitored using complementary collection systems designed to capture both episodic storm-driven losses and continuous gravitational drainage. Surface runoff collection utilized gravity-flow systems featuring vertically installed PVC pipes (5 cm diameter × 90 cm height) positioned at downstream micro-plot boundaries. Collection inlets were precisely aligned with soil surface level and connected via flexible tubing to sealed polyethylene collection vessels (20 L capacity).
Subsurface water movement quantification employed vacuum-assisted lysimeter networks strategically positioned within the 15–25 cm soil horizon to capture gravitational water flux at the primary root zone boundary. Perforated lysimeter units (5 mm diameter pores) were horizontally installed beneath each designated micro-plot and connected to vacuum extraction systems (−80 kPa suction pressure) via sealed collection lines.
Sampling protocols followed systematic temporal frameworks: routine collection every 3 days within 10-day post-fertilization periods to capture peak nutrient mobilization and event-triggered sampling immediately following precipitation events exceeding collection capacity. All samples underwent immediate field preservation (4 °C), laboratory filtration (0.45 μm cellulose acetate membranes within 24 h), and automated colorimetric analysis (Skalar SAN++ continuous flow analyzer, Breda, The Netherlands) for nitrogen speciation.

2.5. Greenhouse Gas Emission Monitoring

Nitrous oxide emissions were quantified using static chamber-gas chromatography methodology following the established protocols for paddy field greenhouse gas monitoring [19]. The measurement system employed transparent PVC chambers (33.3 cm × 33.3 cm × 120 cm) equipped with calibrated temperature sensors (±0.1 °C precision) and internal circulation fans (200 rpm) to ensure uniform gas distribution. Chambers were sealed onto permanently installed base frames featuring water-filled perimeter grooves for airtight closure without soil disturbance.
Gas sampling was conducted in the morning (08:30–11:30) at standardized time intervals (0, 10, 20, and 30 min after chamber closure) using gastight syringes, with 12 mL of mixed gas extracted from the chamber at each interval. The sampling was repeated three times. Samples were immediately transferred to pre-evacuated borosilicate vials and analyzed within 24 h using gas chromatography (Clarus 590, PerkinElmer Inc., Shelton, CT, USA) with electron capture detection (sensitivity <0.05 ppmv N2O).

2.6. Yield Assessment and Tissue Analysis

Grain yield evaluation was conducted through the systematic harvest of the central productive area within each main plot, specifically targeting the middle three planting rows while excluding border effects. This approach yielded a representative sampling area of approximately 15 m2 per plot (3 rows × 5 m length), ensuring statistically robust yield estimates under field-scale conditions.
Plant tissue sampling for isotopic analysis employed the systematic collection of six representative hills from designated micro-plot 5 within each main plot at physiological maturity. Samples underwent standardized processing: enzyme deactivation (105 °C, 30 min), controlled drying (75 °C to constant mass), mechanical grinding, and mesh separation (0.25 mm) to achieve analytical homogeneity.
Soil sampling employed stratified depth-interval collection (0–10, 10–20, 20–30, 30–80 cm) using stainless steel auger cores (5 cm diameter) from designated micro-plot 4. Each depth increment was immediately sealed and refrigerated (4 °C) pending analysis.

2.7. Analytical Methods and Statistical Framework

The total nitrogen content was determined using micro-Kjeldahl digestion methodology, while 15N isotopic composition was analyzed using isotope ratio mass spectrometry (IsoPrime 100, Elementar Analysensysteme GmbH, Stockport, UK) with an analytical precision of ±0.0002 atom% 15N. Yield component assessment included systematic measurement of the grain number per panicle, spikelet fertility rates, and 1000-grain weight (duplicate determinations, ±0.01 g precision).
Statistical evaluation employed SPSS version 27.0 with one-way analysis of variance (α = 0.05) and Fisher’s LSD post hoc testing for pairwise comparisons. Data visualization utilized Origin 2022 with standard error representation and statistical significance annotation. Key performance indicators were calculated as follows: Plant nitrogen recovery efficiency (%) = (Plant 15N accumulation/Applied 15N input) × 100; Productive tiller ratio (%) = (Final panicle density/Peak tiller density) × 100; Environmental loss rate (%) = (Surface runoff + Leaching + Gaseous emission + Unaccounted loss)/Applied nitrogen × 100; Soil nitrogen dependency (%) = (Total plant N − Fertilizer-derived N)/Total plant N × 100.

3. Results

3.1. Effects of Water–Nitrogen Management on Rice Yield and Yield Components

Water–nitrogen management regimes significantly affected the rice yield and yield components, with MNWD achieving the study’s primary objective of enhancing productivity while reducing nitrogen input by 20%. MNWD consistently produced the highest grain yields across both years (Table 3), reaching 8087 and 10,284 kg ha−1 in 2019 and 2020, respectively, representing increases of 9.0–15.6% over FP (p < 0.01). NWC showed intermediate performance with 6.3–9.3% yield improvements over FP, while MNWD maintained a 2.5–5.7% advantage over NWC despite lower nitrogen input.
MNWD’s performance advantage was amplified under favorable conditions, increasing from 9.0% over FP in 2019 to 15.6% in 2020. This enhanced response during the higher-yielding year suggests that precision management systems excel when environmental conditions support maximum productivity expression. The 38.5% inter-annual yield variation provided a natural test of system robustness, with MNWD maintaining superiority across contrasting conditions.
Yield component analysis revealed fundamentally different optimization strategies among treatments. MNWD achieved balanced improvements across multiple components: the panicle density increased by 4.0% over FP (178.1 vs. 171.3 × 10⁴ ha−1, p < 0.05), while the spikelet fertility improved by 2.8 percentage points (91.1% vs. 88.3%, p < 0.01). In contrast, NWC primarily enhanced spikelets per panicle (+8.0% over FP) with minimal panicle density gains (+2.3%, p > 0.05). The 1000-grain weight remained stable across treatments (36.2–36.4 g), indicating that the management effects operated through sink establishment and filling efficiency rather than the individual grain size.
The superior spikelet fertility under MNWD translated these components into yield advantages. Despite comparable total spikelet production between MNWD and NWC (250.7–337.6 × 10⁶ ha−1), MNWD’s enhanced fertility rate resulted in more filled grains and higher productivity. This balanced optimization strategy—improving both panicle number and fertility rather than maximizing a single component—demonstrates a more efficient resource utilization pathway.
These results confirm that MNWD maintains yield stability with reduced nitrogen input through optimized nutrient–plant synchronization. The mechanisms underlying this superior performance are revealed through analysis of tillering dynamics, which fundamentally altered plant development patterns and resource allocation efficiency.

3.2. Effects of Water–Nitrogen Management on Rice Tillering Dynamics

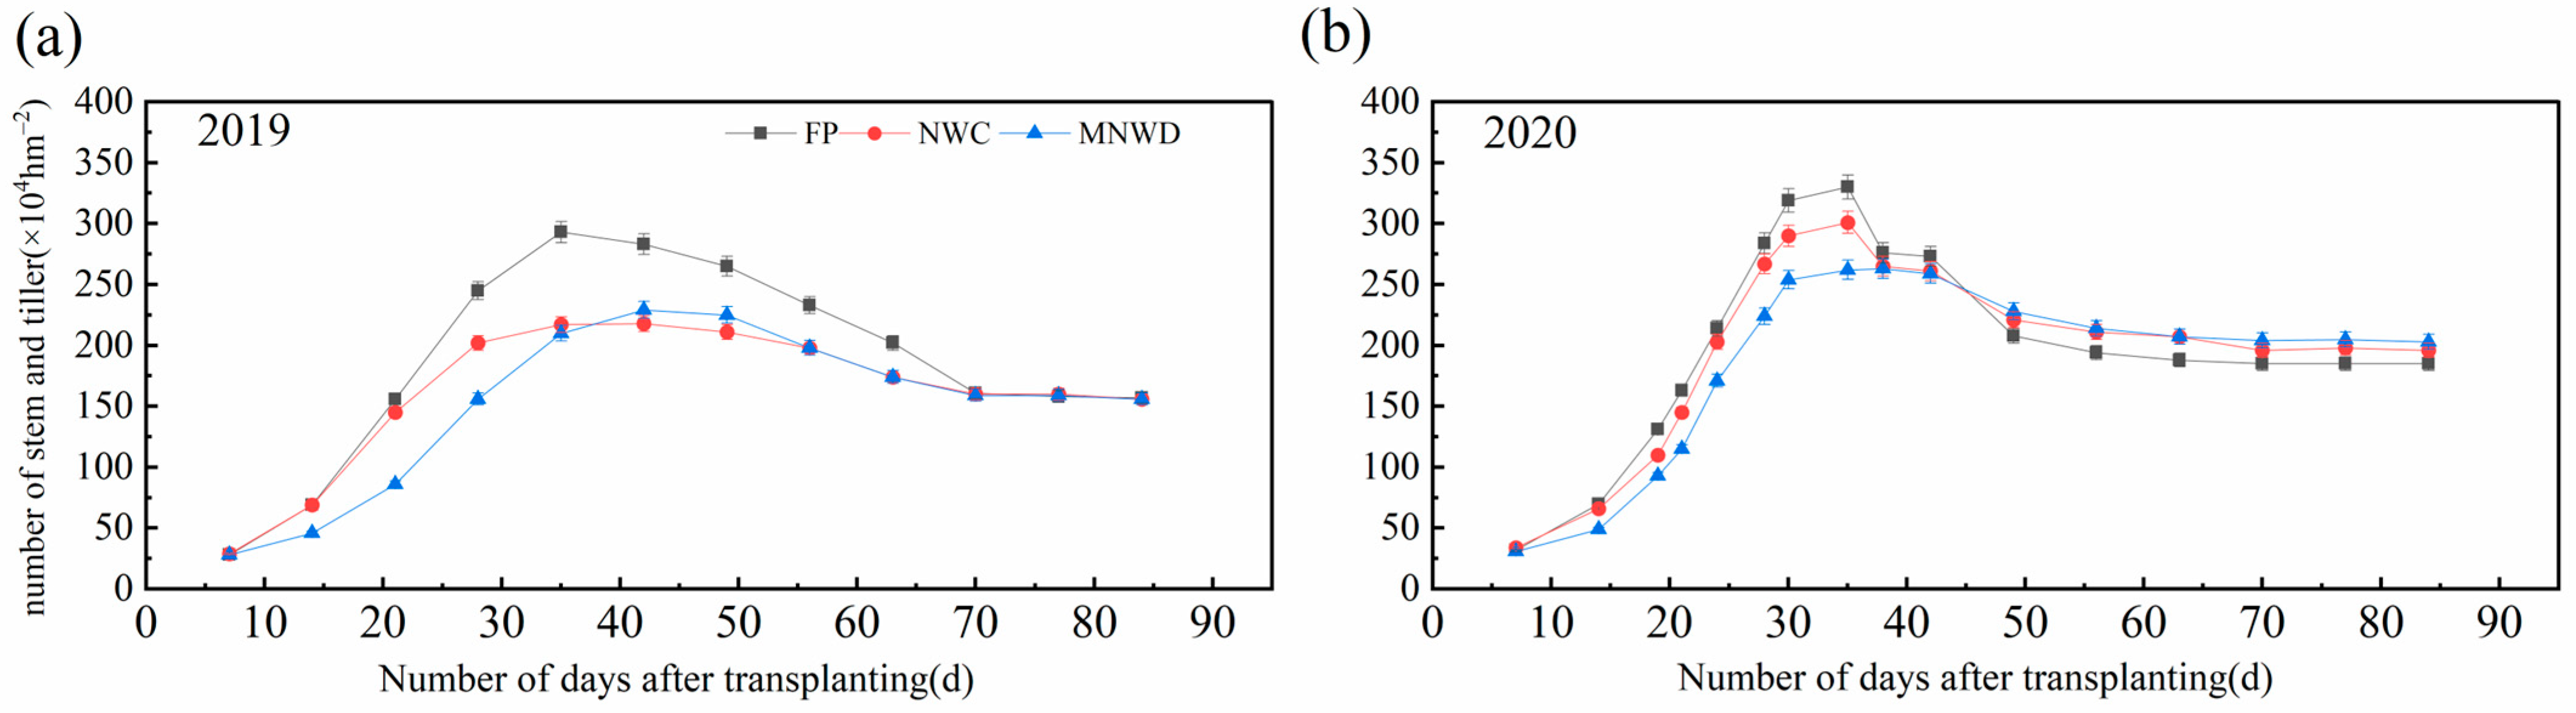
The superior yield performance under MNWD was underpinned by optimized tillering dynamics that maximized the productive tiller conversion efficiency. The water–nitrogen management regimes exhibited contrasting temporal patterns, with MNWD demonstrating a quality-over-quantity strategy (Figure 2).
Peak tiller densities occurred at 35 DAT for both FP and NWC but were delayed to 43 DAT under MNWD. The maximum densities followed the order: FP (308.41 × 10⁴ ha−1) > NWC (260.23 × 10⁴ ha−1) > MNWD (244.35 × 10⁴ ha−1), with MNWD showing a 20.8% reduction compared to FP (p < 0.01). This delayed and controlled tillering reflected MNWD’s systematic nitrogen supply strategy, avoiding excessive early tiller production.
The efficiency advantage emerged during tiller senescence. The senescence rates were 5.15, 3.04, and 2.59 × 10⁴ ha−1 d−1 for FP, NWC, and MNWD, respectively (p < 0.01 for all comparisons). These differential rates resulted in productive tiller ratios of 54.26% (FP), 67.33% (NWC), and 70.12% (MNWD). The 15.86 percentage point advantage of MNWD over FP directly contributed to comparable final panicle densities despite lower peak tiller numbers.
The mechanistic basis lies in temporal nitrogen–plant synchronization. MNWD’s seven-split applications sustained existing tillers throughout development, contrasting with FP’s front-loaded strategy that promoted unsustainable early tillering. Non-productive tillers under FP represented substantial resource waste, with each containing 0.08–0.12 g N. The 137.51 × 10⁴ ha−1 excess non-productive tillers in FP compared to MNWD wasted an estimated 11–16 kg N ha−1.
These dynamics confirm that MNWD achieved yield advantages through physiological optimization rather than resource abundance. The quality-over-quantity strategy enabled efficient resource utilization, providing the foundation for enhanced nitrogen accumulation patterns examined in Section 3.3.

3.3. Nitrogen Accumulation and Partitioning

The enhanced tillering efficiency documented in Section 3.2 translated directly into superior nitrogen utilization patterns, revealing how MNWD achieved higher productivity with 20% less input (Table 4).
Total aboveground nitrogen accumulation followed the order NWC (140.36–172.99 kg ha−1) > MNWD (132.73–165.08 kg ha−1) > FP (112.80–140.34 kg ha−1) across both years (p < 0.01). Similarly, fertilizer-derived nitrogen showed NWC (71.15–76.77 kg ha−1) > MNWD (63.50–67.96 kg ha−1) > FP (46.65–48.17 kg ha−1). However, NWC’s 24.4% higher accumulation than FP did not translate proportionally into yield gains, revealing the efficiency paradox: MNWD achieved superior yield per unit nitrogen through optimization rather than maximization.
The nitrogen recovery efficiency provided the mechanistic explanation for the yield advantages. MNWD achieved 52.92–56.63%, consistently surpassing NWC (47.43–51.18%) by 5.49–5.45 percentage points and FP (31.10–32.11%) by 20.81–25.53 percentage points (p < 0.01). This >50% recovery efficiency reached international advanced levels despite a 20% input reduction, confirming that precision management enhances utilization through improved spatial–temporal matching.
Nitrogen source partitioning revealed contrasting strategies. Soil nitrogen dependency averaged 62.0% under FP versus 52.5–55.5% under NWC and MNWD, indicating enhanced fertilizer utilization under precision management. The improved recovery efficiency directly linked to tillering patterns: MNWD’s 70.12% productive tiller ratio ensured nitrogen was channeled into grain production rather than non-productive biomass, while FP’s excessive early tillers created futile nitrogen sinks.
These results validate that MNWD decouples productivity from input intensity through synchronized nutrient–plant interactions. The combination of enhanced recovery efficiency and balanced source utilization provides the foundation for examining nitrogen fate pathways in the following sections.

3.4. Fate of Nitrogen in Paddy Fields

3.4.1. Residual Differences of Fertilizer-Derived Nitrogen in Soil

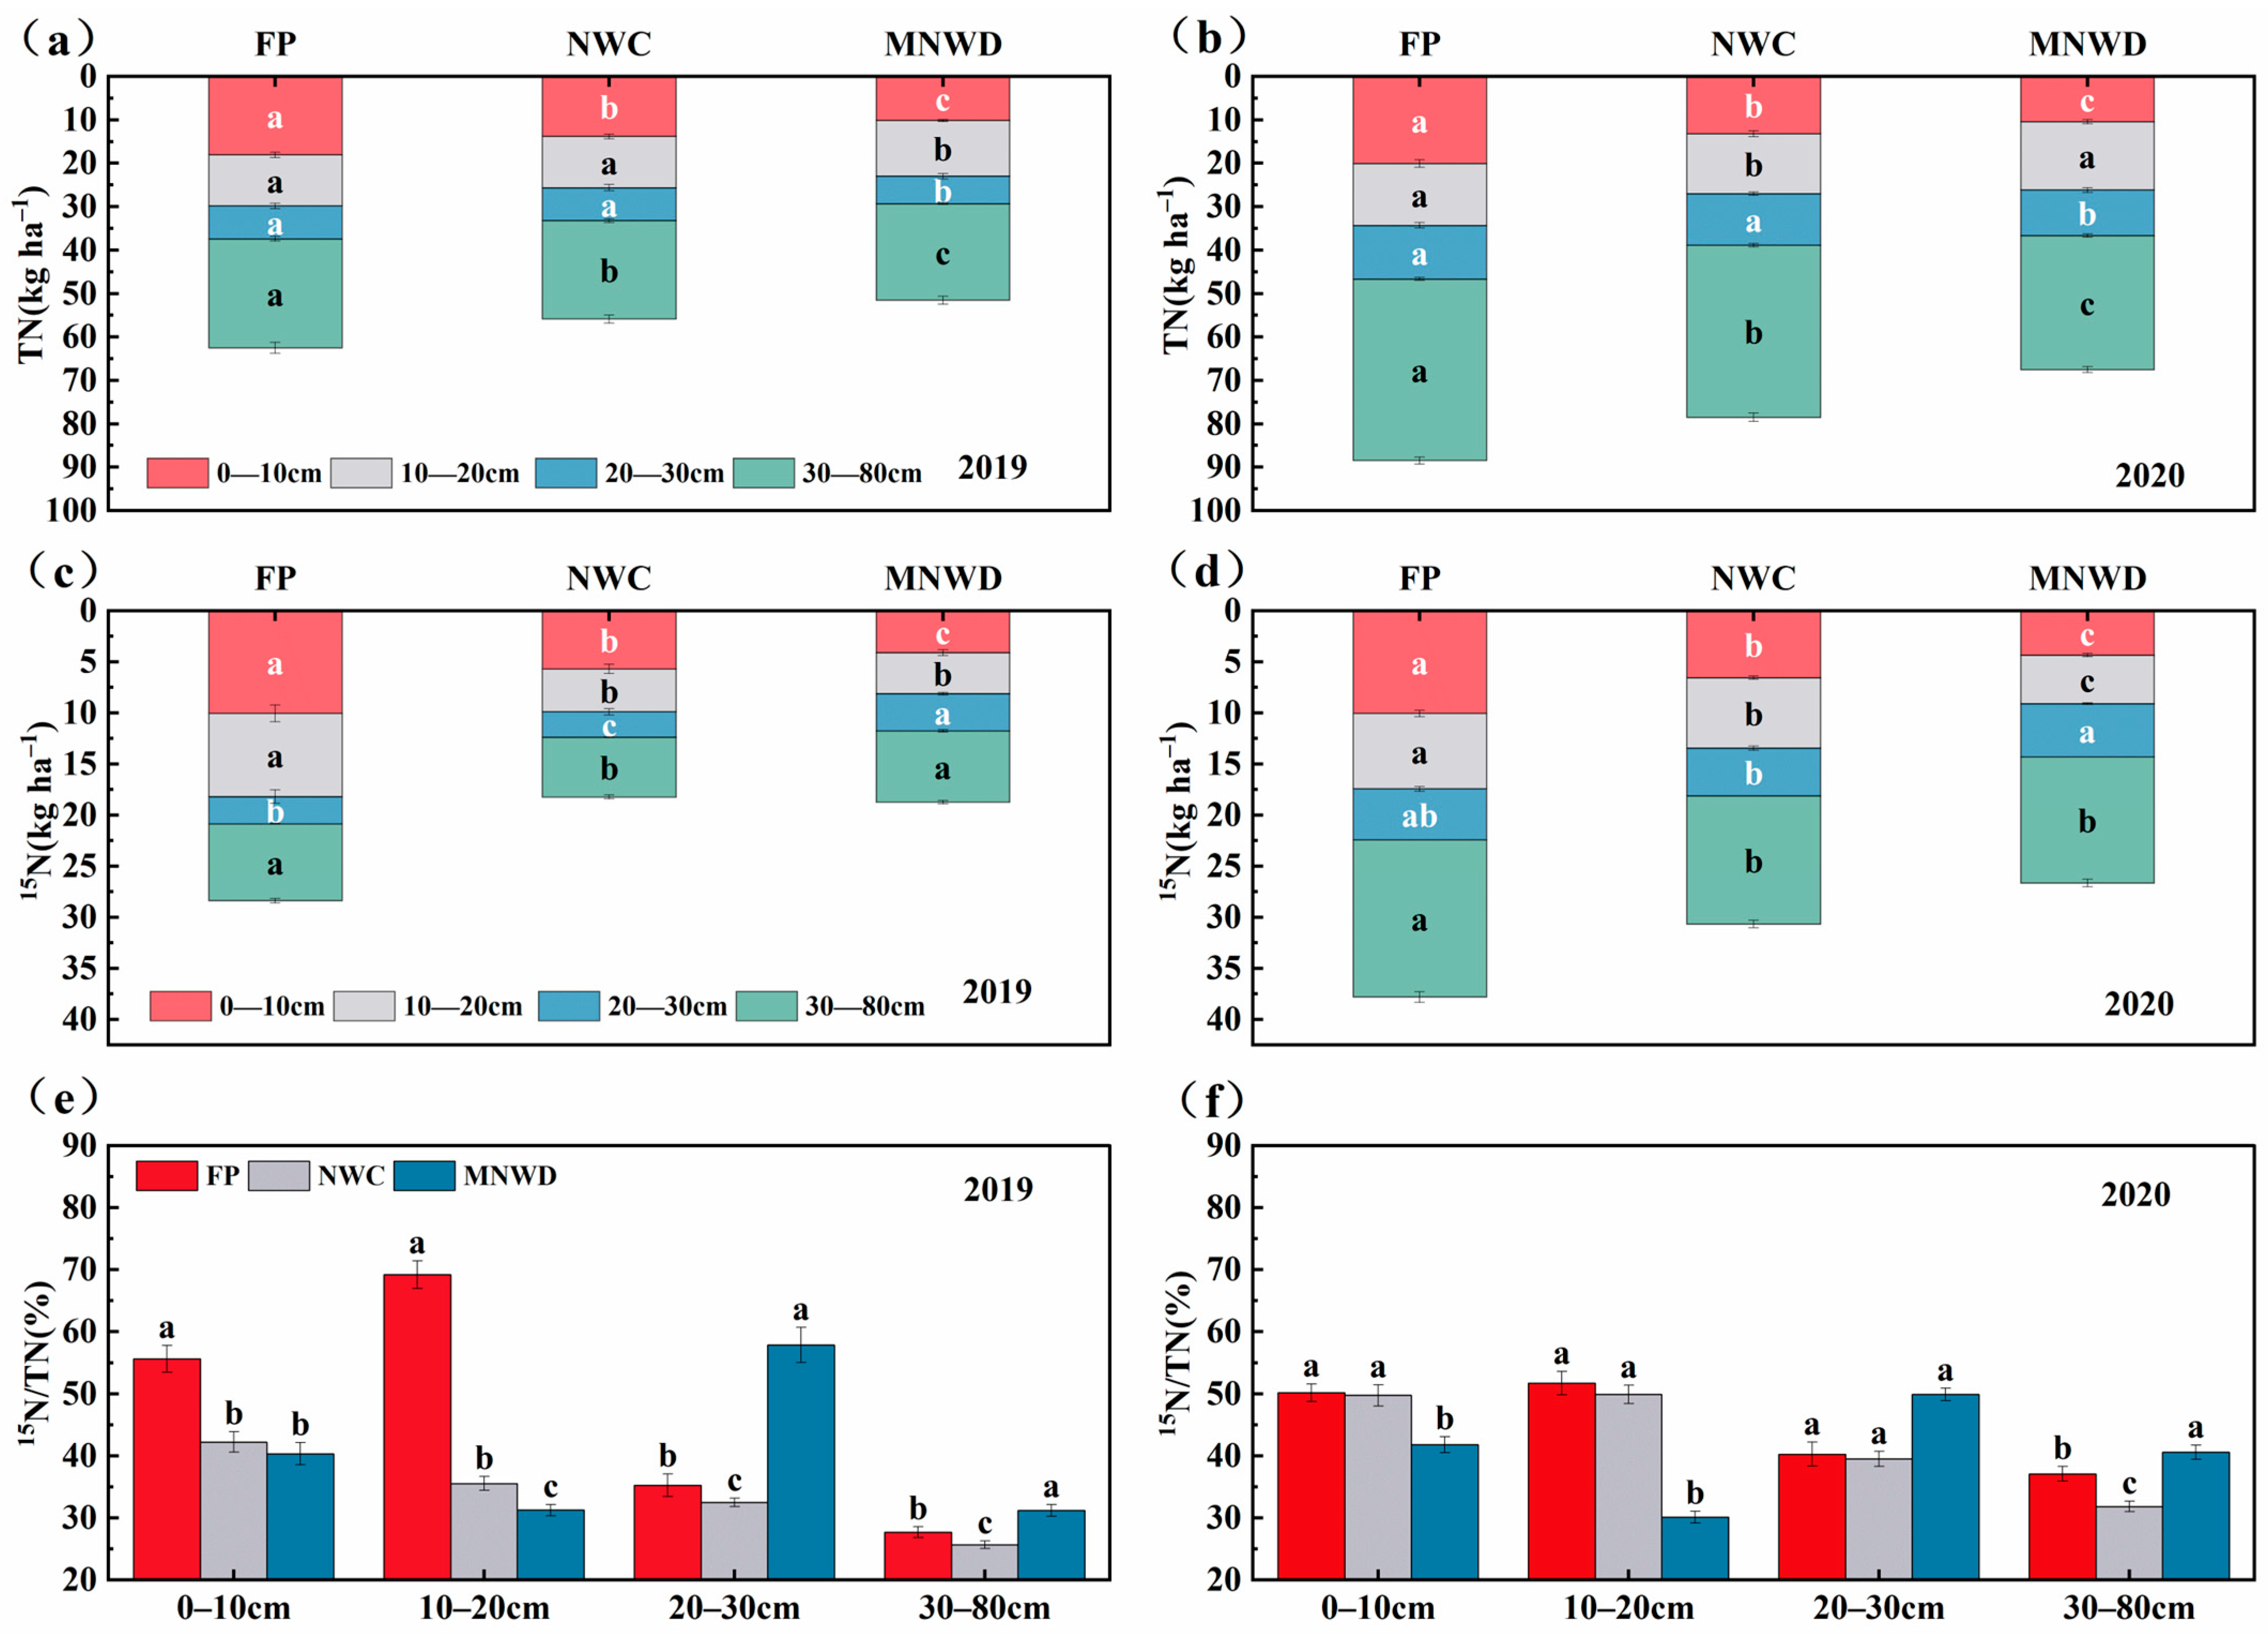
The superior nitrogen recovery efficiency under MNWD (Section 3.3) was mechanistically linked to optimized spatial nitrogen distribution in the soil profile, as revealed by 15N tracing analysis (Figure 3).
The total fertilizer nitrogen residue in the 0–80 cm profile differed significantly among treatments (p < 0.05). FP retained the highest amounts (28.44–38.17 kg ha−1), while NWC and MNWD showed 27.2% and 31.2% reductions, respectively (18.42–30.88 and 18.89–27.15 kg ha−1). This lower residue under precision management, despite higher plant uptake, indicated more complete nitrogen cycling rather than accumulation in unavailable soil pools.
Vertical distribution patterns revealed the fundamental spatial mechanism driving efficiency differences. Under FP, nitrogen concentrated in surface layers with 36.9% (2019) and 27.7% (2020) of total residue in the 0–10 cm zone, reflecting limited vertical migration under continuous flooding. NWC showed intermediate redistribution through enhanced water movement but remained constrained by surface application methods.
MNWD demonstrated an optimized distribution pattern through precision fertigation. Nitrogen concentration in the 10–20 cm root-dense layer exceeded the surface concentrations by 29.2% in 2019 and 57.6% in 2020 (p < 0.01), completely reversing the conventional patterns. This root-zone enrichment created optimal nutrient–root matching, while minimizing surface accumulation vulnerable to volatilization and runoff.
The progressive enhancement from 29.2% to 57.6% suggested system optimization with continued MNWD implementation, potentially reflecting improved preferential flow pathways. This spatial redistribution directly corresponded to the 20.81–25.53 percentage point improvement in recovery efficiency, establishing the quantitative relationship between root-zone enrichment and enhanced uptake. The mechanism validates how irrigation-driven nutrient redistribution enables superior performance with reduced input, setting the context for examining environmental loss pathways.

3.4.2. Fertilizer-Derived Nitrogen Losses via Runoff and Leaching

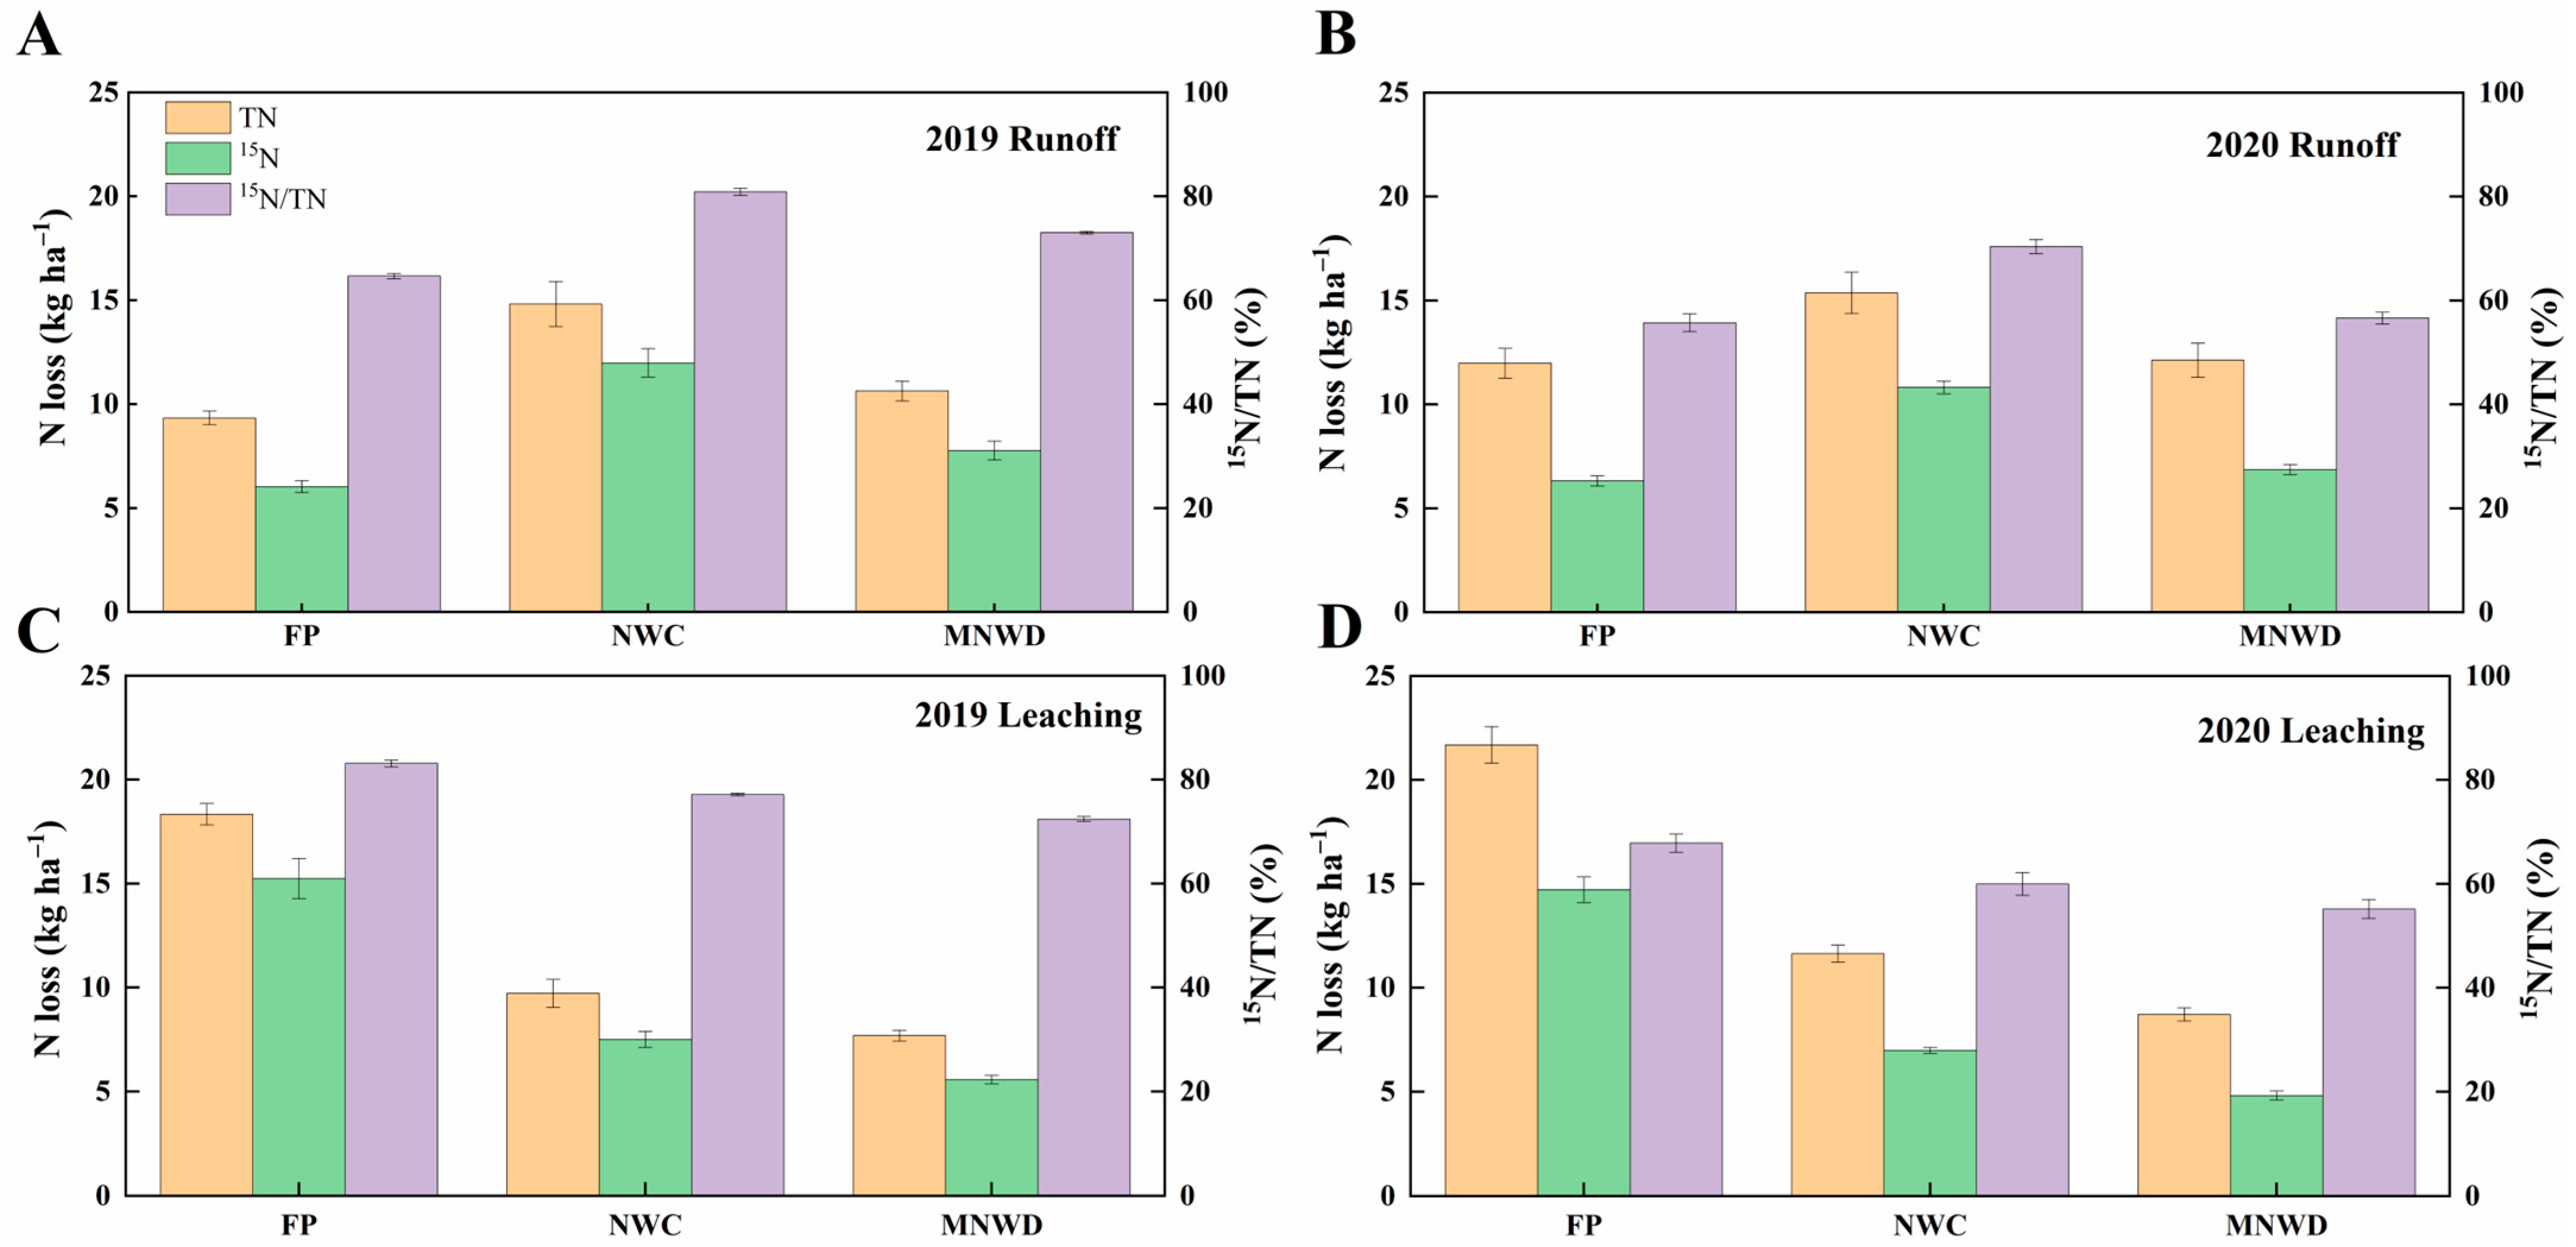
The enhanced root-zone nitrogen retention documented in Section 3.4.1 directly influenced the environmental loss pathways, revealing a critical trade-off mechanism in MNWD’s environmental performance (Figure 4).
The surface runoff losses showed an unexpected pattern: NWC (7.57%) > MNWD (6.06%) > FP (4.08%) of applied nitrogen (p < 0.01). Both precision systems increased the runoff by 85.8% (NWC) and 18.8% (MNWD) compared to FP, reflecting the vulnerability of frequent surface applications to precipitation events. However, MNWD’s substantially lower increase demonstrated better synchronization between fertigation timing and weather conditions.
Conversely, subsurface leaching revealed dramatic improvements under precision management. FP exhibited the highest losses at 10.01% of applied nitrogen, while NWC and MNWD reduced leaching to 4.81% and 4.31%, respectively—reductions of 51.9% and 56.9% (p < 0.01). This enhanced retention resulted from optimized soil moisture control preventing deep percolation, directly supporting the root-zone enrichment patterns in Section 3.4.1.
The total environmental losses demonstrated the net benefit of this trade-off strategy. Despite increased runoff, MNWD achieved the lowest overall losses (11.44–13.43 kg ha−1), representing a 37.4–45.1% reduction compared to FP (20.82–21.42 kg ha−1) and a 24.7–31.3% reduction versus NWC (17.60–19.54 kg ha−1). The mechanism revealed a 3:1 benefit ratio—each 1% runoff increase corresponded to 3.1% leaching reduction.
This strategic trade-off holds critical environmental significance. Surface runoff can be intercepted through buffer strips or constructed wetlands, while leaching represents irreversible groundwater contamination. MNWD’s pathway redirection thus achieves environmental protection through manageable surface losses rather than permanent deep losses, validating precision fertigation as an environmentally superior strategy that complements the spatial optimization benefits.

3.4.3. N2O Emissions

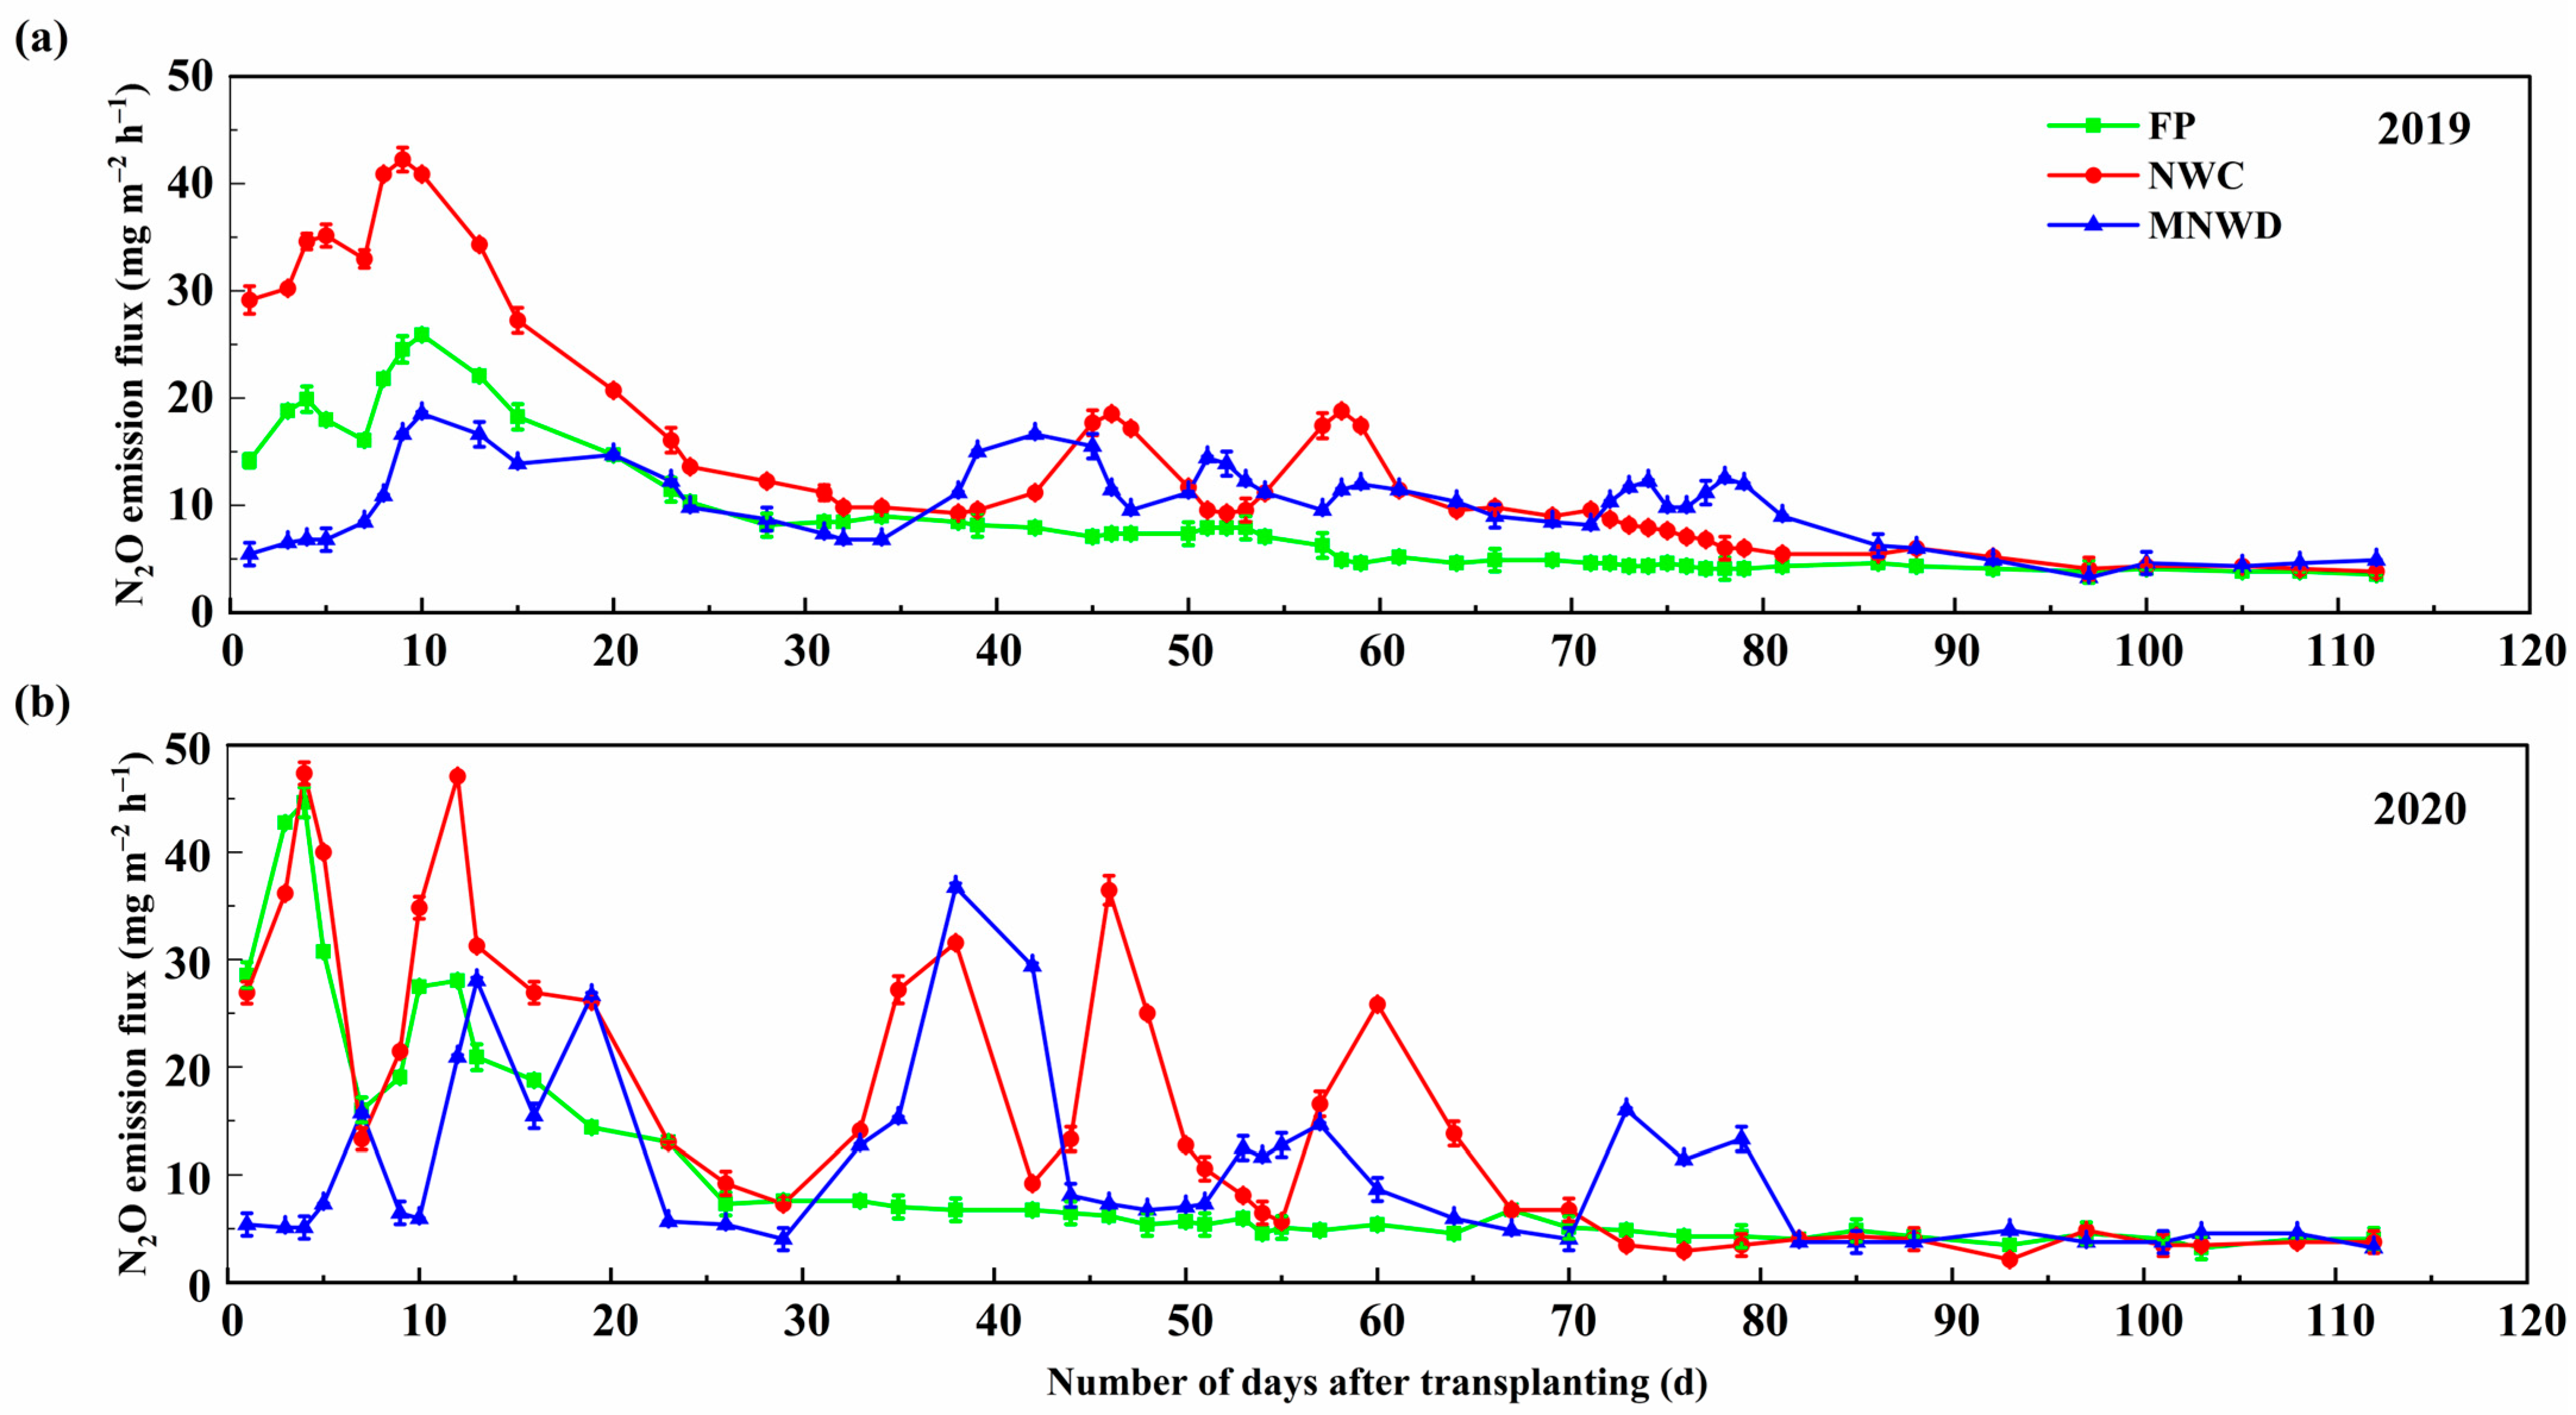
Beyond liquid nitrogen losses, gaseous emissions represented another critical environmental pathway. N2O emission patterns revealed how precision management influenced soil biogeochemical processes, with distinct temporal characteristics linked to fertilization strategies (Figure 5).
Peak N2O fluxes occurred 2–4 days after fertilization across all treatments, with the emission frequency directly correlating with the application schedules: two peaks for FP, four to five for NWC, and seven to eight for MNWD. The maximum flux intensities reached 44.7, 47.4, and 36.7 μg m−2 h−1 for FP, NWC, and MNWD, respectively in 2019, with generally lower values in 2020.
Despite a 3.5-fold higher fertilization frequency, MNWD demonstrated remarkable emission control. The mean N2O fluxes averaged 9.85 (FP), 15.45 (NWC), and 10.19 (MNWD) μg m−2 h−1, representing a 56.9% increase for NWC but only 3.4% for MNWD compared to FP (p < 0.01 and p > 0.05, respectively). This controlled response reflected the effectiveness of low-dose applications (15 kg N ha−1) in maintaining soil nitrogen below the critical thresholds for intensive denitrification.
The mechanistic basis lay in synchronized soil moisture–nitrogen management. MNWD’s consistent −15 kPa threshold maintained predictable redox conditions, contrasting with variable wet–dry cycles under AWD that stimulated denitrification. Combined with reduced nitrogen concentration per application, this prevented the anaerobic hotspots typical of high-dose fertilization.
The emission-efficiency trade-off validated MNWD’s environmental benefits: 34.0% lower N2O emissions than NWC while achieving 5.45–5.49 percentage points higher nitrogen recovery. This demonstrates that the nitrogen conservation documented in Section 3.4.1 and Section 3.4.2 was achieved through enhanced plant uptake rather than conversion to alternative loss pathways, confirming MNWD as an integrated solution for multi-pathway environmental protection.

3.4.4. 15N Balance and Fate

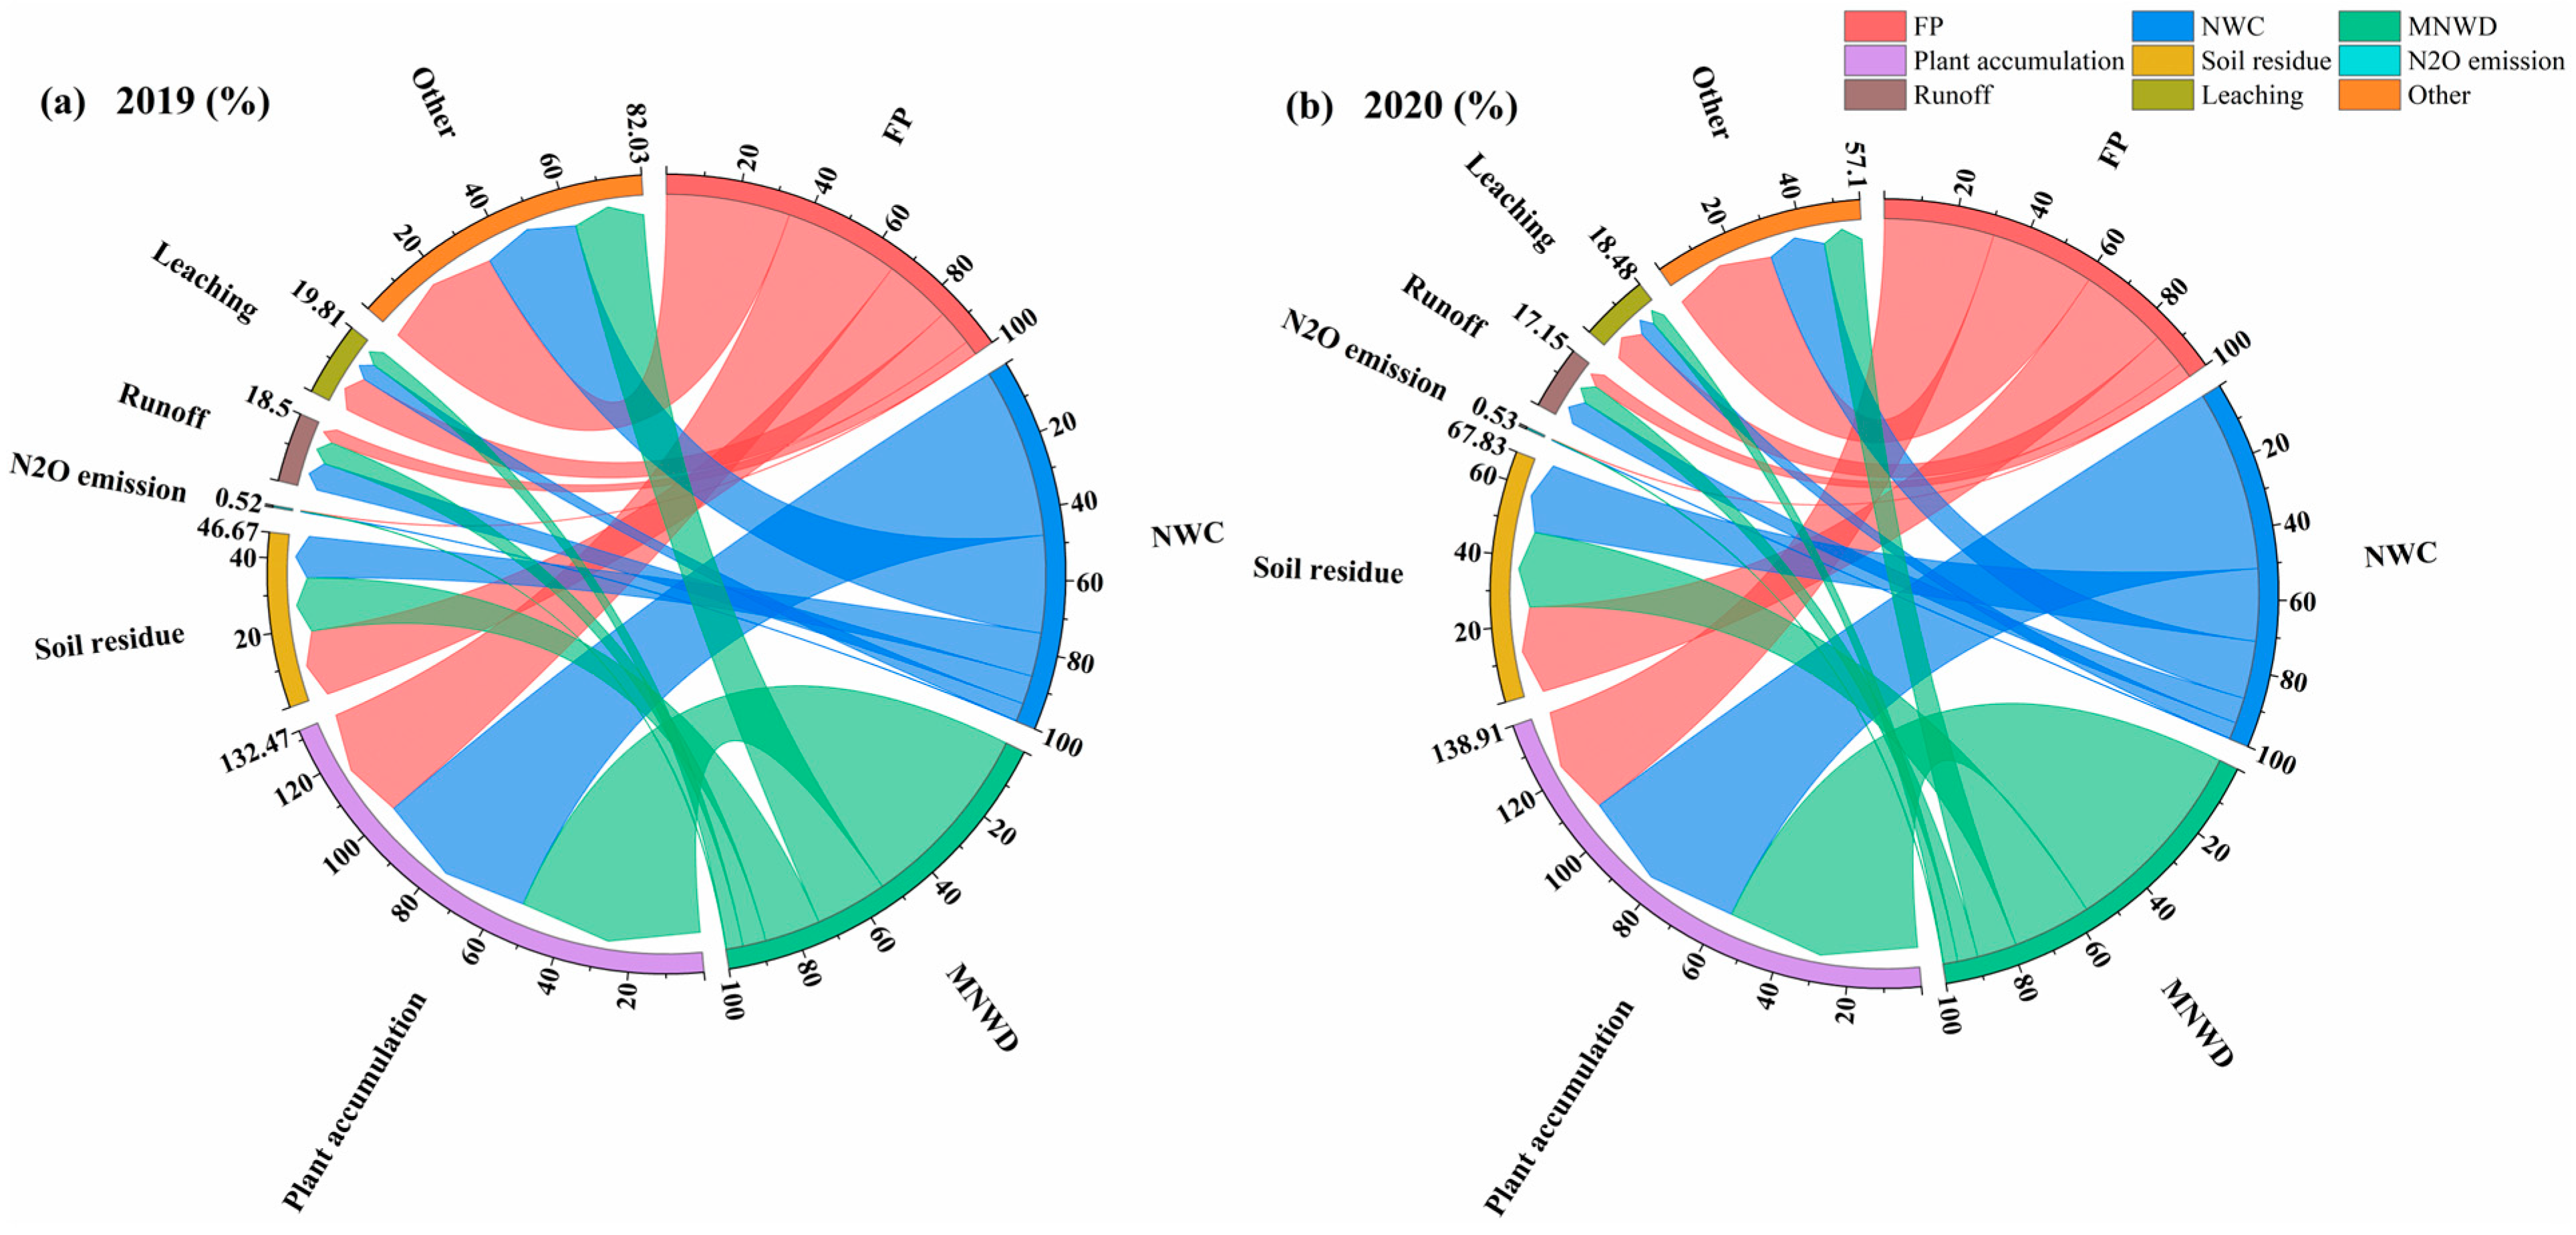
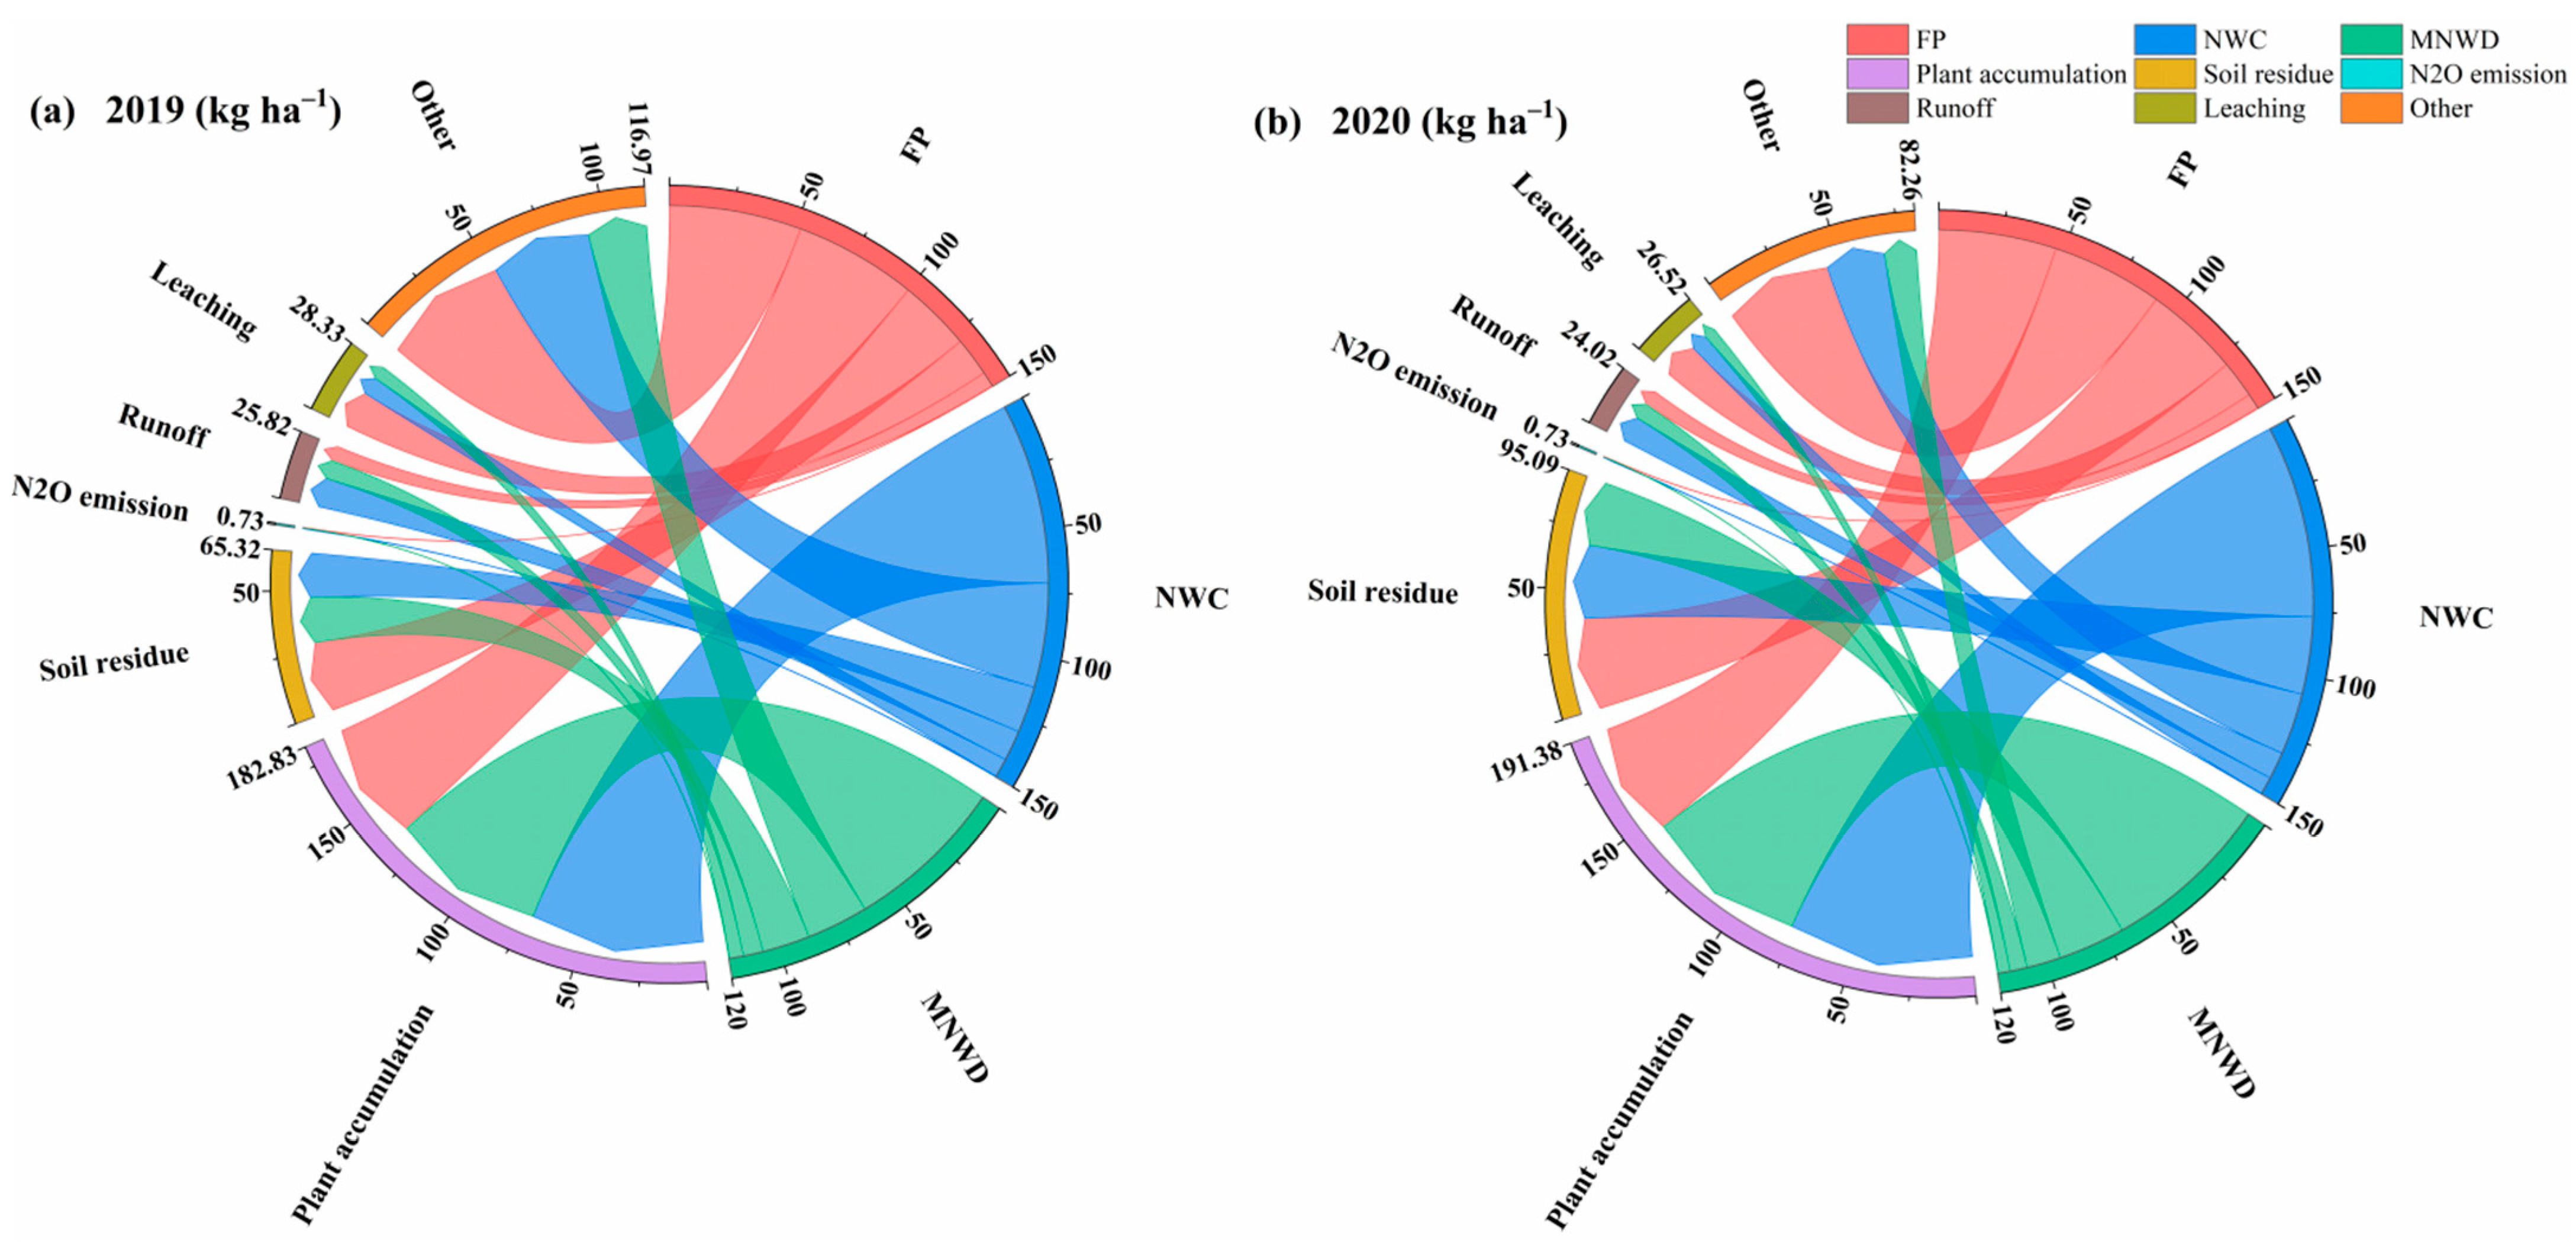
Comprehensive 15N mass balance analysis integrated the spatial redistribution, pathway-specific losses, and gaseous emissions to quantify the fundamental transformation in nitrogen cycling under MNWD (Figure 6 and Figure 7).
The total environmental losses, comprising surface runoff, leaching, gaseous emissions, and unaccounted nitrogen, decreased systematically from 49.0–68.7% under FP to 40.4–45.6% under NWC and 25.4–31.5% under MNWD (p < 0.01). This 48.5–61.4% reduction compared to FP reflected cumulative improvements across all pathways: 65.40% leaching reduction (Section 3.4.2), minimal N2O increase of 3.4% (Section 3.4.3), and manageable surface runoff elevation of 18.8%.
The nitrogen fate transformation was profound. FP represented a loss-dominated system, where >50% of applied nitrogen escaped to the environment, with only 31.10–32.11% recovered by plants. MNWD fundamentally reversed this pattern, achieving >50% plant recovery (52.92–56.63%), while reducing environmental losses to <32%. Soil retention showed intermediate levels under MNWD (15.60–22.19%), suggesting balanced cycling that maintained fertility while maximizing availability.
The mass balance revealed that MNWD’s 20% input reduction was more than compensated by enhanced utilization efficiency. Every kilogram of nitrogen saved through reduced application prevented 1.5–2.0 kg of environmental losses compared to FP, demonstrating the multiplicative benefits of precision management. The favorable 3:1 trade-off ratio between leaching reduction and runoff increase (Section 3.4.2) confirmed that pathway redirection, rather than uniform loss reduction, drove environmental benefits.
This transformation from loss-dominated to utilization-centered nitrogen cycling validates MNWD as a promising technology for sustainable intensification. The achievement of >50% recovery efficiency with <32% environmental losses while reducing input by 20% demonstrates the successful decoupling of productivity from both input intensity and environmental impact.

3.5. Integrated Analysis of Nitrogen Fate and Yield Performance

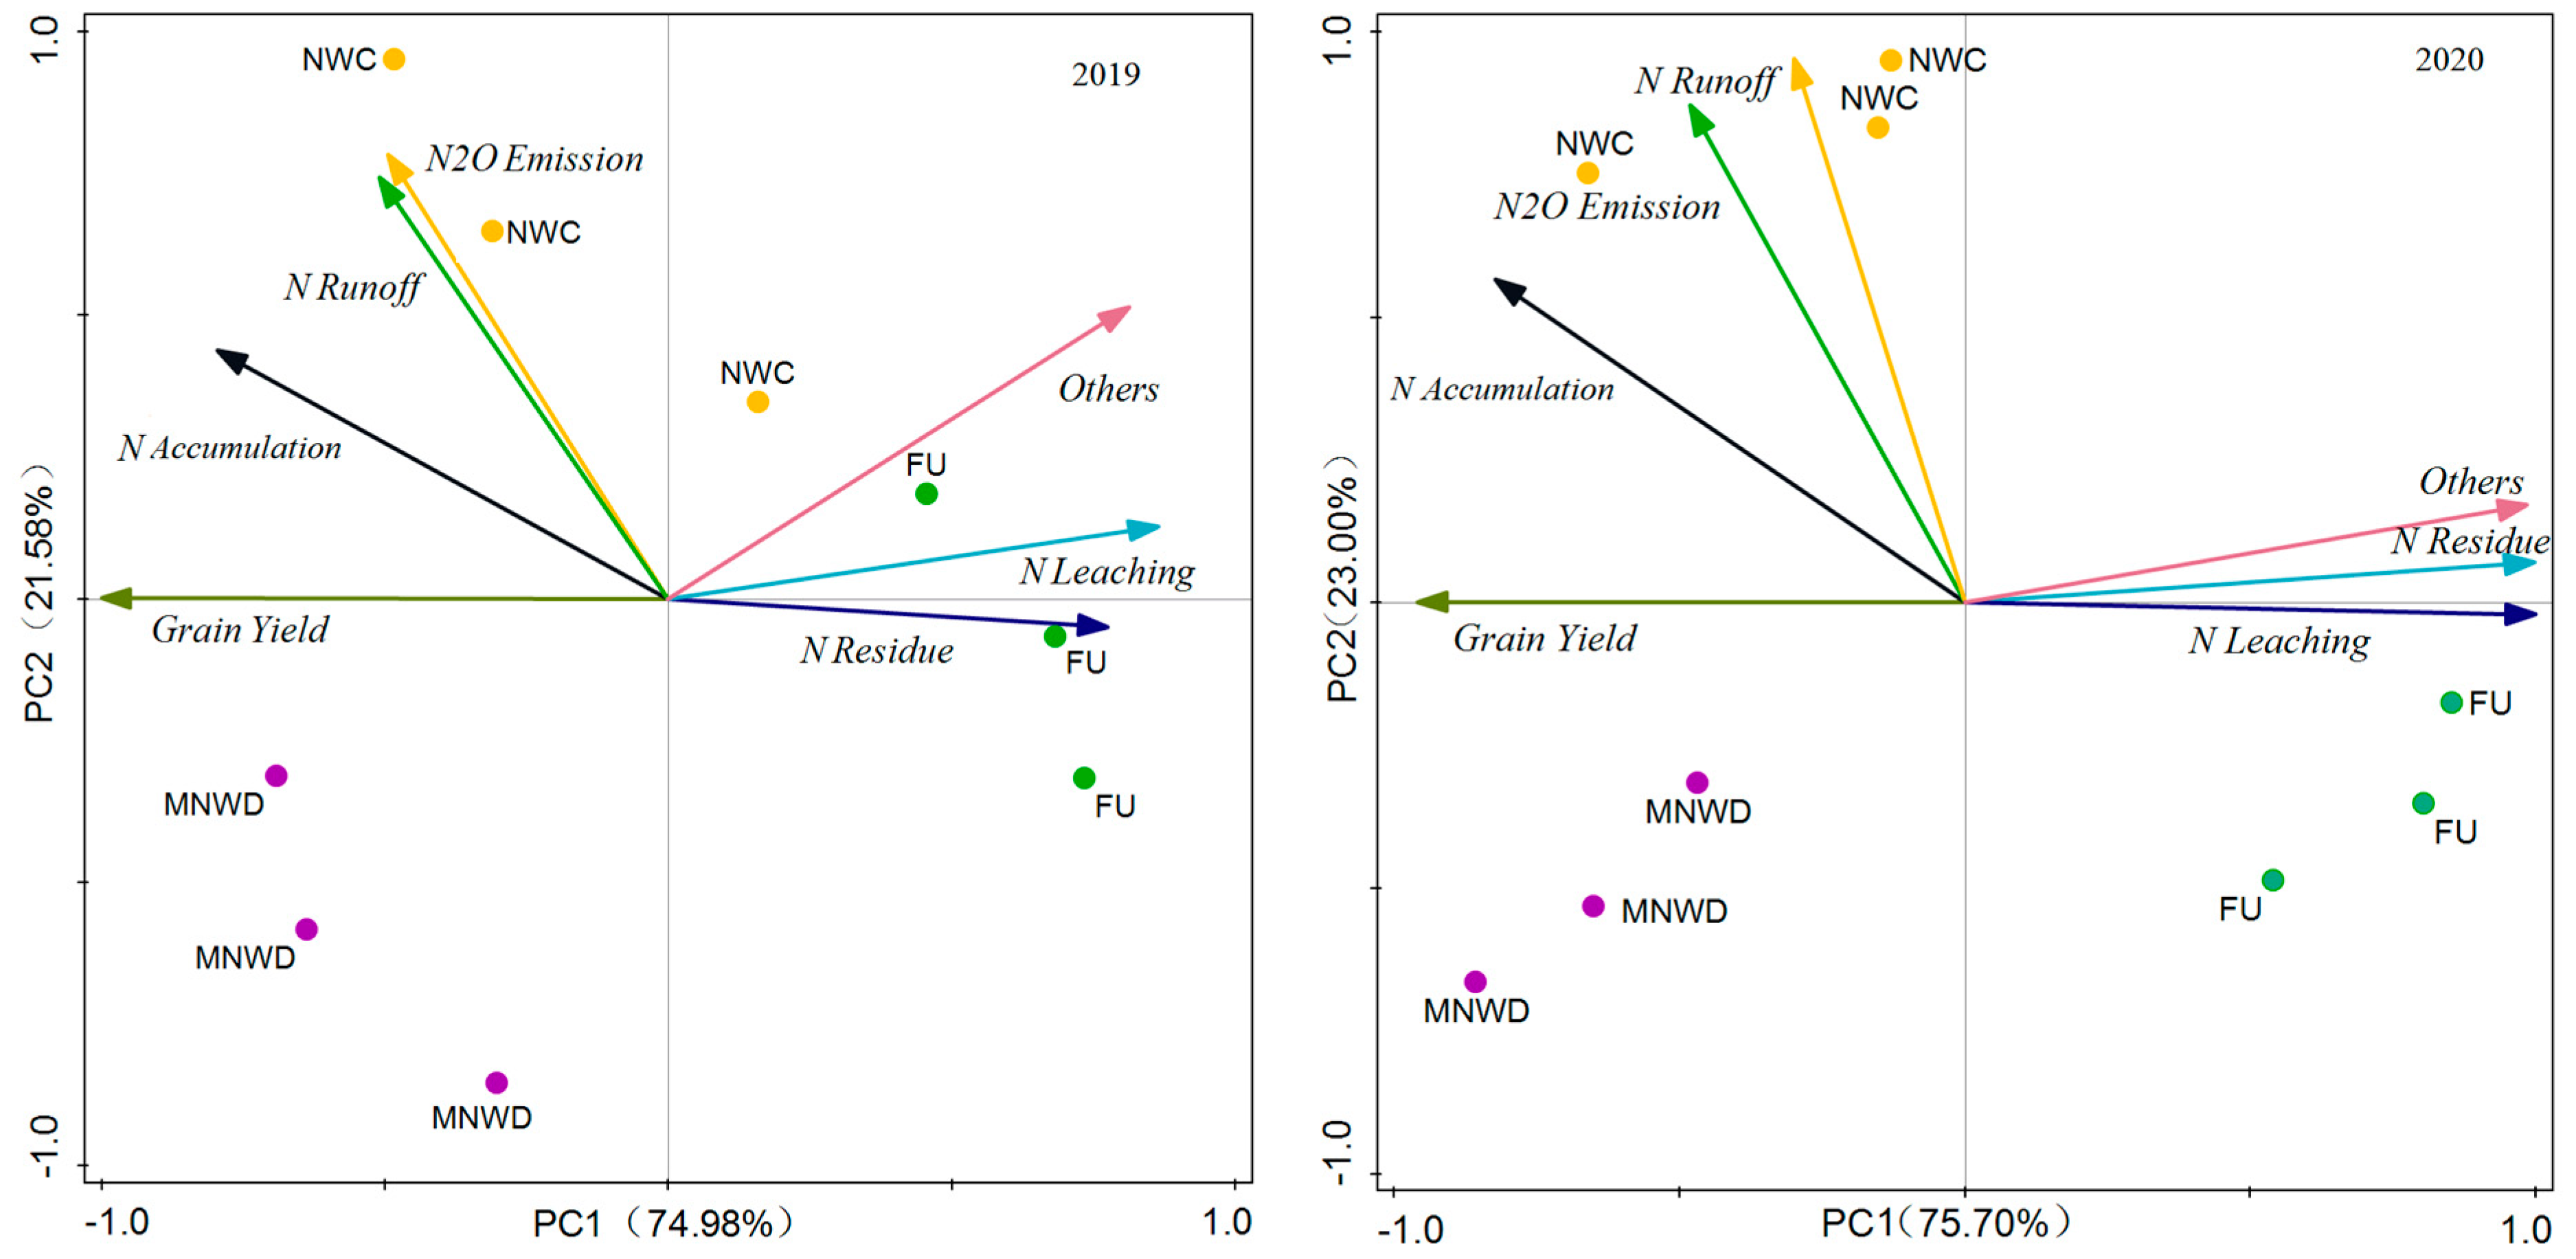
Principal component analysis integrated the nitrogen cycling pathways (Section 3.4.1, Section 3.4.2, Section 3.4.3 and Section 3.4.4) with agronomic performance to reveal systematic relationships among management strategies. The first two components explained 96.56% of total variance (PC1: 74.98%; PC2: 21.58%), effectively capturing the multidimensional trade-offs in rice production systems (Figure 8).
PC1 represented the fundamental productivity–environment axis, with grain yield loading negatively and nitrogen losses (leaching, runoff, unaccounted N) loading positively. PC2 distinguished the loss pathways, separating surface processes (N2O emissions, runoff) from subsurface retention (soil residue, leaching). This orthogonal structure revealed that yield enhancement and environmental protection operate along independent dimensions under different management approaches.
Treatment positioning in PCA space confirmed the contrasting strategies and performance stability. MNWD consistently occupied the high-yield, low-loss quadrant across both years, demonstrating robust performance under 38.5% yield variation. FP clustered in the opposite quadrant characterized by low yields and high environmental losses. NWC showed intermediate but variable positioning—achieving the desired quadrant in 2020 but exhibiting instability in 2019.
The clear spatial segregation validated MNWD’s systematic advantages documented throughout Section 3.1, Section 3.2, Section 3.3 and Section 3.4: enhanced tillering efficiency (70.12% productive tillers), superior nitrogen recovery (52.92–56.63%), optimized spatial distribution (57.6% root-zone enrichment), and minimized losses (25.4–31.5% total). This multivariate confirmation establishes MNWD as a reliable technology for achieving simultaneous productivity enhancement and environmental protection through integrated nitrogen-water management.

4. Discussion

4.1. Physiological and Spatial Mechanisms Underlying Yield Enhancement with Reduced Nitrogen Input

The remarkable achievement of MNWD—increasing yields by 9.01–15.60% while reducing nitrogen input by 20—challenges conventional understanding of resource-yield relationships in rice production. This paradoxical outcome was mechanistically driven by two interrelated optimization processes: enhanced tillering efficiency and distinctive nitrogen spatial redistribution.
The tillering dynamics revealed a fundamental shift from quantity-driven to quality-oriented plant development. MNWD’s productive tiller ratio of 70.12% vastly exceeded FP’s 54.26%, representing a 15.86 percentage point improvement that directly translated into yield advantages. This efficiency gain originated from the delayed but synchronized tillering pattern, with the peak density occurring at 43 DAT compared to 35 DAT under conventional management. The 8-day delay reflected MNWD’s initial moderate nitrogen supply (30 kg N ha−1) that prevented excessive early tillering—a critical departure from FP’s front-loaded approach (105 kg N ha−1 basal). This temporal optimization aligns with recent findings by Tian et al. [20], who demonstrated that delaying tillering nitrogen topdressing until the midtillering phase improved nitrogen use efficiency by 18–27% through enhanced canopy recapture of soil-emitted ammonia. The systematic seven-split strategy maintained a steady nitrogen supply throughout development, sustaining established tillers rather than promoting futile tiller formation. Furthermore, Ju et al. [21] confirmed that pre-transplanting (PT) and panicle initiation (PI) represent nitrogen reduction-sensitive stages, while early tillering (ET) and spikelet differentiation (SD) are relatively insensitive periods, supporting MNWD’s strategic timing approach. Quantitatively, FP’s 137.51 × 10⁴ ha−1 excess non-productive tillers wasted an estimated 11–16 kg N ha−1, accounting for 7–11% of total applied nitrogen—a loss completely avoided under MNWD.
The improved nitrogen recovery efficiency under MNWD cannot be attributed to nitrogen management alone; it also stems from the improved temporal synchronization between nitrogen supply and crop demand. In conventional systems, excessive nitrogen availability in the early stages promotes rapid vegetative growth, which diverts nitrogen away from productive tillers and reproductive development. In contrast, the small split applications under MNWD matched nitrogen supply to key developmental stages, promoting balanced growth and ensuring that nitrogen was allocated more efficiently to productive tillers. This synchronization minimized the occurrence of non-productive tillers and excessive vegetative growth, while also enhancing nitrogen use efficiency by reducing early-season nitrogen loss and optimizing later-stage nitrogen uptake for grain filling.
The spatial redistribution of nitrogen through precision fertigation represented an equally optimized mechanism. 15N tracing revealed that nitrogen concentration in the 10–20 cm root zone exceeded the surface layers by 29.2% (2019) and 57.6% (2020) under MNWD, completely inverting conventional distribution patterns, where 36.9% of residual nitrogen accumulated in the 0–10 cm layer under FP. This root-zone enrichment directly corresponded to the rice root architecture described by Yoshida [22], where 60–70% of active roots concentrate within 10–20 cm depth. Similar mechanisms were demonstrated by Li et al. [23], who showed that deep placement of nitrogen fertilizer at 10 cm depth increased nitrogen recovery efficiency by 42.4–56.7%, closely matching MNWD’s 52.92–56.63% recovery rates. The irrigation-driven vertical redistribution created optimal nutrient-root spatial matching, explaining the 20.81–25.53 percentage point improvement in recovery efficiency. Recent mechanistic studies by Hu et al. [24] demonstrated that localized nitrogen supply in the root zone triggers enhanced lateral root proliferation and upregulates nitrogen transporter genes, providing the molecular basis for MNWD’s superior uptake efficiency.
The synergy between tillering optimization and spatial redistribution amplified individual benefits through integrated water–nitrogen management. Enhanced root-zone nitrogen availability supported the nutritional demands of high-efficiency tillers, while the quality-over-quantity tillering strategy ensured that spatially optimized nitrogen was channeled into productive organs rather than excessive vegetative growth. This approach parallels findings by Yan et al. [25], who demonstrated that rainfall-adapted irrigation systems combined with optimized nitrogen management enhanced root biomass and root length, directly contributing to improved grain yield and nitrogen utilization efficiency. Additionally, Xu et al. [26] showed that precision nitrogen management systems like the Nutrient Expert approach achieved optimal nitrogen application rates around 140 kg ha−1, supporting MNWD’s reduced-input strategy while maintaining high productivity. This dual optimization enabled MNWD to achieve a nitrogen recovery efficiency of 52.92–56.63%, approaching the 55–65% range reported for advanced global systems by Ladha et al. [27], while using substantially less fertilizer. The balanced yield component improvements—4.0% higher panicle density and 2.8 percentage points greater spikelet fertility—reflected this integrated optimization rather than single-factor maximization.
The mechanistic insights reveal that MNWD fundamentally redefines nitrogen management from an input-based to an efficiency-based paradigm. By synchronizing nitrogen supply temporally with plant demand and spatially with root distribution, the technology demonstrates that precision management can enhance productivity while reducing environmental pressure—a critical improvement for the sustainable intensification of global rice systems.

4.2. Environmental Benefits Through Nitrogen Cycling Optimization

MNWD achieved remarkable environmental performance, reducing the total nitrogen losses from 49.0–68.7% under FP to 25.4–31.5% through a strategic trade-off mechanism: 65.40% leaching reduction versus 18.8% runoff increase, resulting in a favorable 3:1 benefit ratio. This leaching reduction substantially exceeds recent benchmarks—Liang et al. [28] achieved 33.8% reduction through site-specific management in Taihu Lake region, while Song et al. [29] reported 37.2% reduction via nitrogen replacement strategies in red paddy soils. The superior MNWD performance reflects the synergistic effects of optimized spatial–temporal matching through precision soil moisture control at the −15 kPa threshold, which maintains optimal water content for nitrogen retention in the root zone while preventing excessive deep percolation. Jin et al. [30] demonstrated that controlled soil moisture management could reduce deep drainage by 72–88% compared to conventional flooding, confirming the hydrological basis for enhanced nitrogen retention. This controlled moisture regime aligns with the nitrogen transformation principles described by Buresh et al. [31], where water potential governs the balance between nitrification-denitrification processes and vertical nitrogen transport.
The 15N mass balance revealed notable changes in nitrogen cycling. The plant recovery efficiency increased by 20.81–25.53 percentage points compared to FP, accompanied by a 31.2% reduction in soil nitrogen residue, indicating enhanced nitrogen mobilization rather than accumulation. The root-zone enrichment pattern documented in Section 3.4.1—where nitrogen concentration in the 10–20 cm layer exceeded surface layers by up to 57.6%—directly supported this enhanced recovery by creating optimal spatial matching between nutrients and active root systems. This irrigation-driven vertical redistribution created optimal nutrient-root matching, explaining the enhanced uptake efficiency through pathway manipulation rather than uniform loss reduction [32].
Greenhouse gas emission control demonstrated superior performance, with N2O emissions increasing only 3.4% under MNWD compared to the 5.94% (incomplete AWD) and 14.79% (complete AWD) reported by Sriphirom et al. [33]. The mechanistic basis involves two synergistic factors: consistent soil moisture maintenance at −15 kPa prevents extreme redox fluctuations that stimulate N2O production, while low-dose nitrogen applications (15 kg N ha−1 per split) maintain substrate concentrations below critical thresholds for intensive denitrification. This combination creates a stable biogeochemical environment that minimizes gaseous losses while maintaining conditions favorable for plant uptake.
The integrated environmental benefits extend beyond individual pathways to system-level transformation. Liang et al. [28] demonstrated that precision nitrogen management could simultaneously reduce ammonia volatilization by 50.1%, leaching by 33.8%, denitrification by 13.3%, and runoff by 42.7%, confirming the multi-pathway benefits of coordinated management approaches. MNWD’s preferential reduction of leaching over runoff holds particular significance for groundwater protection, as surface losses can be intercepted through buffer strips while deep leaching represents irreversible contamination. With 15–20% of Yangtze Basin monitoring wells exceeding WHO nitrate standards, MNWD’s 65.40% leaching reduction addresses the most critical environmental threat. Jiang et al. [34] identified that rice fields typically function as nitrogen sources for water bodies (24.2–28.7 kg N ha−1) but can be transformed into nitrogen sinks through improved management technologies, validating MNWD’s potential for fundamental system transformation.
A recent meta-analysis by Ren et al. [35] confirmed that strategic nitrogen management could reduce the total reactive nitrogen losses by 11.3–26.5% for rice systems, while Amin et al. [36] showed that optimized AWD irrigation reduced nitrogen leaching loads by up to 44% compared to frequent irrigation. MNWD’s achievement of 48.5–61.4% total loss reduction substantially exceeds these benchmarks, establishing it as a viable technology for comprehensive environmental protection that successfully decouples productivity from environmental impact through integrated nitrogen cycling optimization.

4.3. Application Challenges and Implementation Strategies of MNWD Technology in Small-Scale Agriculture

Principal component analysis confirmed MNWD’s robust performance across contrasting environmental conditions, with consistent positioning in the high-yield, low-environmental-loss quadrant despite 38.5% inter-annual yield variation. This stability under diverse conditions addresses the critical requirement for reliable technologies emphasized by Cassman et al. [37], who identified performance consistency as essential for sustainable intensification. Compared to advanced precision agriculture systems that achieve 55–65% nitrogen recovery efficiency but require capital investments of $500–1000 ha−1, MNWD’s 52.92–56.63% efficiency with moderate technology requirements ($200–300 ha−1) offers a more accessible pathway for smallholder farmers in developing regions. This moderate technological approach aligns with the key principles highlighted by Mizik [38] in his systematic review of small-scale precision agriculture development—accelerating precision agriculture adoption through cost reduction and modular technologies.
The technology bridges the gap between sophisticated sensor-based systems and traditional practices through its relative simplicity. While automated fertigation systems employ real-time sensors and computer-controlled applications, MNWD achieves comparable outcomes using mechanical tensiometers and scheduled applications. This intermediate technological approach maintains 90% of the advanced system performance at 20–30% of the cost, making it particularly suitable for the 500 million smallholder farmers who produce 80% of Asia’s rice [38,39]. As Yuan et al. [40] pointed out, the development of smart agriculture in Asia needs to consider geographic and agricultural characteristics, and MNWD technology precisely meets this requirement. The seven-split application schedule, though more intensive than conventional two-split practices, remains manageable within existing labor frameworks and does not require specialized equipment beyond basic fertigation infrastructure.
Economic analysis reveals favorable cost–benefit dynamics supporting adoption feasibility. While seven fertilizer applications increase the labor costs by approximately 15–20% compared to conventional practices, the combined benefits of 20% nitrogen savings (30 kg N ha−1 × $0.50 kg−1 = $15 ha−1) and 12.3% average yield increase (875 kg ha−1 × $0.30 kg−1 = $262 ha−1) result in net profits 8–15% higher than conventional practices. This economic advantage aligns with findings by Lampayan et al. [41], who demonstrated that integrated water–fertilizer management achieves positive returns even with increased management intensity. The payback period for the initial infrastructure investment ranges from two to three growing seasons, making it financially viable for farmers with access to modest credit. Sen et al.’s [42] systematic review indicated that interactive digital extension services play an important role in enhancing agricultural productivity and profitability (acknowledged by 54.6% of reviewed articles), providing effective support for promoting the economic benefits of MNWD technology.
The modular nature of MNWD technology allows gradual adoption, enabling farmers to progressively master technical aspects through demonstration and digital extension services. This flexibility, combined with straightforward technical requirements and demonstrated economic returns, positions MNWD as a practical stepping-stone technology that can facilitate the transition from traditional to precision agriculture while immediately delivering productivity and environmental benefits.

5. Conclusions

This study demonstrates that Methodical Nitrogen–Water Distribution (MNWD) successfully decouples rice productivity from nitrogen input intensity, achieving 9.01–15.60% yield increases with 20% nitrogen reduction. The advantages of this technology can be attributed to two primary mechanisms: optimized tillering dynamics yielding 70.12% productive tiller conversion efficiency and optimized nitrogen spatial redistribution creating 29.2–57.6% enrichment in the root-dense 10–20 cm soil layer.
15N isotope tracing revealed that MNWD enhanced nitrogen recovery efficiency to 52.92–56.63%, while reducing the total environmental losses from 49.0–68.7% under conventional management to 25.4–31.5%. This was achieved primarily through a 65.40% reduction in leaching losses, with only minimal increases in N2O emissions (3.4%). The technology demonstrated robust performance across 38.5% inter-annual yield variation, consistently positioning in the high-yield, low-environmental-loss quadrant in multivariate analysis.
MNWD represents a viable middle-ground solution between traditional practices and high-tech precision agriculture, offering comparable performance at moderate implementation costs. While the increased management intensity poses adoption challenges, the proven economic benefits and environmental protection justify further development and scaling efforts.
Future research should focus on simplifying application protocols, validating performance across diverse agro-ecological zones, and integrating digital tools to facilitate large-scale implementation of this promising technology for sustainable rice intensification. In addition, its long-term robustness and transferability across contrasting environmental conditions require further verification.

Supplementary Materials

The following supporting information can be downloaded at https://www.mdpi.com/article/10.3390/agronomy16080801/s1, Figure S1: Schematic diagram of three water–nitrogen management modes.

Author Contributions

Z.Y.: Writing—Original Draft, Investigation, Conceptualization; Y.L.: Investigation, Formal Analysis, Validation; Y.S. (Yuanqing Shi): Methodology, Software; H.X.: Data Curation, Formal Analysis; B.L.: Visualization, Software; C.S.: Methodology, Investigation; Q.C. (Qingyue Cheng): Investigation, Visualization; S.C.: Resources, Data Curation; Q.C. (Qiqi Chen): Writing—Review and Editing, Investigation; L.W.: Validation, Investigation; H.L.: Formal Analysis, Investigation; Z.P.: Software, Investigation; Z.C.: Investigation, Visualization; Y.S. (Yongjian Sun): Supervision, Resources; J.M.: Supervision, Project Administration, Funding Acquisition; N.L.: Supervision, Writing—Review and Editing, Conceptualization. All authors have read and agreed to the published version of the manuscript.

Funding

This work was supported by the Natural Science Foundation of Sichuan Province (2024NZZJ0003, 2023YFN0046), the National Key Research and Development Program (2024YFD2300401, 2023YFD2301901), and the Chengdu Agricultural Science and Technology Center Program (NASC2024KY10).

Data Availability Statement

The original contributions presented in this study are included in the article/Supplementary Materials. Further inquiries can be directed to the corresponding authors.

Conflicts of Interest

Author Yu Li was employed by the Chuanzhong Seed Industry company. The remaining authors declare that the research was conducted in the absence of any commercial or financial relationships that could be construed as a potential conflict of interest.

References

  1. Arouna, A.; Dzomeku, I.K.; Shaibu, A.-G.; Nurudeen, A.R. Water Management for Sustainable Irrigation in Rice (Oryza sativa L.) Production: A Review. Agronomy 2023, 13, 1522. [Google Scholar] [CrossRef]
  2. Wu, X.H.; Wang, W.; Yin, C.M.; Hou, H.J.; Xie, K.J.; Xie, X.L. Water Consumption, Grain Yield, and Water Productivity in Response to Field Water Management in Double Rice Systems in China. PLoS ONE 2017, 12, e0189280. [Google Scholar] [CrossRef]
  3. Ishfaq, M.; Akbar, N.; Anjum, S.A.; Anwar-ijl-haq, M. Growth, Yield and Water Productivity of Dry Direct Seeded Rice and Transplanted Aromatic Rice under Different Irrigation Management Regimes. J. Integr. Agric. 2020, 19, 2656–2673. [Google Scholar] [CrossRef]
  4. Liu, Y.; Ding, W.; He, P.; Xu, X.; Zhou, W. Estimating Thresholds of Nitrogen, Phosphorus and Potassium Fertilizer Rates for Rice Cropping Systems in China. Front. Plant Sci. 2024, 15, 1470774. [Google Scholar] [CrossRef]
  5. Chen, Z.; Wang, H.; Liu, X.; Liu, Y.; Gao, S.; Zhou, J. The Effect of N Fertilizer Placement on the Fate of Urea-15N and Yield of Winter Wheat in Southeast China. PLoS ONE 2016, 11, e0153701. [Google Scholar] [CrossRef]
  6. Chivenge, P.; Sharma, S.; Bunquin, M.A.; Hellin, J. Improving Nitrogen Use Efficiency—A Key for Sustainable Rice Production Systems. Front. Sustain. Food Syst. 2021, 5, 737412. [Google Scholar] [CrossRef]
  7. FAO. FAOSTAT Database; Food and Agriculture Organization of the United Nations: Rome, Italy, 2023; Available online: http://www.fao.org/faostat/en/#data (accessed on 23 July 2025).
  8. Peng, S.; Buresh, R.J.; Huang, J.; Zhong, X.; Zou, Y.; Yang, J.; Wang, G.; Liu, Y.; Hu, R.; Tang, Q.; et al. Improving Nitrogen Fertilization in Rice by Sitespecific N Management. A Review. Agron. Sustain. Dev. 2010, 30, 649–656. [Google Scholar] [CrossRef]
  9. Zhou, Q.; Zhang, J.; Xing, K.; Wei, J.; Yao, Y. Groundwater Nitrate Contamination in China: Spatial Distribution, Temporal Trend, and Driver Analysis. Environ. Res. 2024, 262, 119932. [Google Scholar] [CrossRef]
  10. Chen, Y.; Li, S.; Zhang, Y.; Li, T.; Ge, H.; Xia, S.; Gu, J.; Zhang, H.; Lü, B.; Wu, X.; et al. Rice Root Morphological and Physiological Traits Interaction with Rhizosphere Soil and Its Effect on Methane Emissions in Paddy Fields. Soil Biol. Biochem. 2019, 129, 191–200. [Google Scholar] [CrossRef]
  11. Alam, M.K.; Islam, M.M.; Salahin, N.; Hasanuzzaman, M. Effect of Tillage Practices on Soil Properties and Crop Productivity in Wheat-Mungbean-Rice Cropping System under Subtropical Climatic Conditions. Sci. World J. 2014, 2014, 437283. [Google Scholar] [CrossRef] [PubMed]
  12. Bouman, B.A.M.; Tuong, T.P. Field Water Management to Save Water and Increase Its Productivity in Irrigated Lowland Rice. Agric. Water Manag. 2001, 49, 11–30. [Google Scholar] [CrossRef]
  13. Guo, J.; Hu, X.; Gao, L.; Xie, K.; Ling, N.; Shen, Q.; Hu, S.; Guo, S. The Rice Production Practices of High Yield and High Nitrogen Use Efficiency in Jiangsu, China. Sci. Rep. 2017, 7, 2101. [Google Scholar] [CrossRef]
  14. Cheng, H.; Shu, K.; Zhu, T.; Wang, L.; Liu, X.; Cai, W.; Qi, Z.; Feng, S. Effects of Alternate Wetting and Drying Irrigation on Yield, Water and Nitrogen Use, and Greenhouse Gas Emissions in Rice Paddy Fields. J. Clean. Prod. 2022, 349, 131487. [Google Scholar] [CrossRef]
  15. Zhao, X.; Zhou, Y.; Min, J.; Wang, S.; Shi, W.; Xing, G. Nitrogen Runoff Dominates Water Nitrogen Pollution from Rice-Wheat Rotation in the Taihu Lake Region of China. Agric. Ecosyst. Environ. 2012, 156, 1–11. [Google Scholar] [CrossRef]
  16. Ali, A.; Jabeen, N.; Farruhbek, R.; Chachar, Z.; Laghari, A.A.; Chachar, S.; Ahmed, N.; Ahmed, S.; Yang, Z. Enhancing Nitrogen Use Efficiency in Agriculture by Integrating Agronomic Practices and Genetic Advances. Front. Plant Sci. 2025, 16, 1543714. [Google Scholar] [CrossRef]
  17. Yang, Z.; Li, N.; Ma, P.; Li, Y.; Zhang, R.; Song, Q.; Guo, X.; Sun, Y.; Xu, H.; Ma, J. Improving Nitrogen and Water Use Efficiencies of Hybrid Rice through Methodical Nitrogen–Water Distribution Management. Field Crops Res. 2020, 246, 107698. [Google Scholar] [CrossRef]
  18. Nelson, D.W.; Sommers, L.E. Total Carbon, Organic Carbon, and Organic Matter. In Methods of Soil Analysis; John Wiley & Sons, Ltd.: Hoboken, NJ, USA, 1996; pp. 961–1010. [Google Scholar]
  19. Zou, J.; Huang, Y.; Jiang, J.; Zheng, X.; Sass, R.L. A 3-Year Field Measurement of Methane and Nitrous Oxide Emissions from Rice Paddies in China: Effects of Water Regime, Crop Residue, and Fertilizer Application. Glob. Biogeochem. Cycles 2005, 19. [Google Scholar] [CrossRef]
  20. Tian, Y.; Zhao, X.; Yin, B.; Yan, X. Delaying Tillering Nitrogen Topdressing until the Midtillering Phase Improves Nitrogen Use Efficiency and Reduces Ammonia Emission via Rice Canopy Recapture. Eur. J. Agron. 2023, 142, 126657. [Google Scholar] [CrossRef]
  21. Ju, C.; Zhu, Y.; Liu, T.; Sun, C. The Effect of Nitrogen Reduction at Different Stages on Grain Yield and Nitrogen Use Efficiency for Nitrogen Efficient Rice Varieties. Agronomy 2021, 11, 462. [Google Scholar] [CrossRef]
  22. Yoshida, S. Fundamental of Rice Crop Science; International Rice Research Institute: Los Baños, Philippines, 1981; p. 269. [Google Scholar]
  23. Li, L.; Tian, H.; Zhang, M.; Fan, P.; Ashraf, U.; Liu, H.; Chen, X.; Duan, M.; Tang, X.; Wang, Z.; et al. Deep Placement of Nitrogen Fertilizer Increases Rice Yield and Nitrogen Use Efficiency with Fewer Greenhouse Gas Emissions in a Mechanical Direct-Seeded Cropping System. Crop J. 2021, 9, 1386–1396. [Google Scholar] [CrossRef]
  24. Hu, R.; Ding, Z.; Tian, Y.; Cao, Y.; Hou, J.; Wang, X. Localized Nitrogen Supply Facilitates Rice Yield and Nitrogen Use Efficiency by Enabling Root-Zone Nitrogen Distribution and Root Growth. Front. Sustain. Food Syst. 2024, 8, 1326311. [Google Scholar] [CrossRef]
  25. Yan, J.; Wu, Q.; Qi, D.; Zhu, J. Rice Yield, Water Productivity, and Nitrogen Use Efficiency Responses to Nitrogen Management Strategies under Supplementary Irrigation for Rain-Fed Rice Cultivation. Agric. Water Manag. 2022, 263, 107486. [Google Scholar] [CrossRef]
  26. Xu, Z.; He, P.; Yin, X.; Struik, P.C.; Ding, W.; Liu, K.; Huang, Q. Simultaneously Improving Yield and Nitrogen Use Efficiency in a Double Rice Cropping System in China. Eur. J. Agron. 2022, 137, 126513. [Google Scholar] [CrossRef]
  27. Ladha, J.K.; Tirol-Padre, A.; Reddy, C.K.; Cassman, K.G.; Verma, S.; Powlson, D.S.; van Kessel, C.; de B. Richter, D.; Chakraborty, D.; Pathak, H. Global Nitrogen Budgets in Cereals: A 50-Year Assessment for Maize, Rice and Wheat Production Systems. Sci. Rep. 2016, 6, 19355. [Google Scholar] [CrossRef]
  28. Liang, H.; Yang, S.; Xu, J.; Hu, K. Modeling Water Consumption, N Fates, and Rice Yield for Water-Saving and Conventional Rice Production Systems. Soil Tillage Res. 2021, 209, 104944. [Google Scholar] [CrossRef]
  29. Song, X.; Zhang, J.; Peng, C.; Li, D. Replacing Nitrogen Fertilizer with Nitrogen-Fixing Cyanobacteria Reduced Nitrogen Leaching in Red Soil Paddy Fields. Agric. Ecosyst. Environ. 2021, 312, 107320. [Google Scholar] [CrossRef]
  30. Jin, X.; Zuo, Q.; Ma, W.; Li, S.; Shi, J.; Tao, Y.; Zhang, Y.; Liu, Y.; Liu, X.; Lin, S.; et al. Water Consumption and Water-Saving Characteristics of a Ground Cover Rice Production System. J. Hydrol. 2016, 540, 220–231. [Google Scholar] [CrossRef]
  31. Buresh, R.J.; Ramesh Reddy, K.; van Kessel, C. Nitrogen Transformations in Submerged Soils. In Nitrogen in Agricultural Systems; John Wiley & Sons, Ltd.: Hoboken, NJ, USA, 2008; pp. 401–436. [Google Scholar]
  32. Xing, G.X.; Zhu, Z.L. An Assessment of N Loss from Agricultural Fields to the Environment in China. Nutr. Cycl. Agroecosyst. 2000, 57, 67–73. [Google Scholar] [CrossRef]
  33. Sriphirom, P.; Chidthaisong, A.; Towprayoon, S. Effect of Alternate Wetting and Drying Water Management on Rice Cultivation with Low Emissions and Low Water Used during Wet and Dry Season. J. Clean. Prod. 2019, 223, 980–988. [Google Scholar] [CrossRef]
  34. Jiang, W.; Huang, W.; Liang, H.; Wu, Y.; Shi, X.; Fu, J.; Wang, Q.; Hu, K.; Chen, L.; Liu, H.; et al. Is Rice Field a Nitrogen Source or Sink for the Environment? Environ. Pollut. 2021, 283, 117122. [Google Scholar] [CrossRef]
  35. Ren, F.; Sun, N.; Misselbrook, T.; Wu, L.; Xu, M.; Zhang, F.; Xu, W. Responses of Crop Productivity and Reactive Nitrogen Losses to the Application of Animal Manure to China’s Main Crops: A Meta-Analysis. Sci. Total Environ. 2022, 850, 158064. [Google Scholar] [CrossRef]
  36. Amin, M.G.M.; Akter, A.; Jahangir, M.M.R.; Ahmed, T. Leaching and Runoff Potential of Nutrient and Water Losses in Rice Field as Affected by Alternate Wetting and Drying Irrigation. J. Environ. Manag. 2021, 297, 113402. [Google Scholar] [CrossRef] [PubMed]
  37. Cassman, K.G.; Dobermann, A.; Walters, D.T.; Yang, H. Meeting Cereal Demand While Protecting Natural Resources and Improving Environmental Quality. Annu. Rev. Environ. Resour. 2003, 28, 315–358. [Google Scholar] [CrossRef]
  38. Mizik, T. How Can Precision Farming Work on a Small Scale? A Systematic Literature Review. Precis. Agric. 2023, 24, 384–406. [Google Scholar] [CrossRef]
  39. Tripathi, R.; Kumar, A.; Guru, P.; Mohanty, S.; Khanam, R.; Shahid, M.; Nayak, A.K. Precision Farming Technologies for Water and Nutrient Management in Rice: Challenges and Opportunities. ORYZA-Int. J. Rice 2021, 58, 126–142. [Google Scholar] [CrossRef]
  40. Yuan, F.; Ospina, R.; Perumal, A.B.; Noguchi, N.; He, Y.; Liu, Y. Smart Agriculture in Asia. Plant Commun. 2025, 6, 101377. [Google Scholar] [CrossRef] [PubMed]
  41. Lampayan, R.M.; Rejesus, R.M.; Singleton, G.R.; Bouman, B.A.M. Adoption and Economics of Alternate Wetting and Drying Water Management for Irrigated Lowland Rice. Field Crops Res. 2015, 170, 95–108. [Google Scholar] [CrossRef]
  42. Sen, L.T.H.; Phuong, L.T.H.; Chou, P.; Dacuyan, F.B.; Nyberg, Y.; Wetterlind, J. The Opportunities and Barriers in Developing Interactive Digital Extension Services for Smallholder Farmers as a Pathway to Sustainable Agriculture: A Systematic Review. Sustainability 2025, 17, 3007. [Google Scholar] [CrossRef]
Figure 1. Daily precipitation and mean temperature during rice growing seasons (2019–2020).
Agronomy 16 00801 g001
Figure 2. Temporal dynamics of rice tiller development under different water–nitrogen management regimes. (a) 2019; (b) 2020.
Agronomy 16 00801 g002
Figure 3. Vertical distribution of total nitrogen (TN) and fertilizer-derived 15N content in soil profiles (0–80 cm depth) under different water–nitrogen management regimes. Values followed by different letters differ significantly at p < 0.05. (a) Vertical distribution of total nitrogen (TN) 2019; (b) Vertical distribution of total nitrogen (TN) 2020; (c) Fertilizer-derived 15N content in soil profiles 2019; (d) Fertilizer-derived 15N content in soil profiles 2020; (e) 15N/TN ratio (%) 2019; (f) 15N/TN ratio (%) 2020.
Agronomy 16 00801 g003
Figure 4. Nitrogen loss pathways through surface runoff and subsurface leaching under different water–nitrogen management regimes. (A) Runoff in 2019; (B) Runoff in 2020; (C) Underground leaching in 2019; (D) Underground leaching in 2020.
Agronomy 16 00801 g004
Figure 5. Temporal patterns of nitrous oxide (N2O) emissions from rice paddies under different water–nitrogen management regimes. (a) 2019; (b) 2020.
Agronomy 16 00801 g005
Figure 6. Proportional distribution of 15N-labeled fertilizer fate under different water–nitrogen management regimes.
Agronomy 16 00801 g006
Figure 7. Absolute quantities (kg ha−1) of 15N-labeled fertilizer fate under different water–nitrogen management regimes.
Agronomy 16 00801 g007
Figure 8. Principal component analysis of nitrogen fate pathways and rice yield relationships under different water–nitrogen management regimes.
Agronomy 16 00801 g008
Table 1. Initial soil properties across depth intervals (0–30 cm) for experimental years 2019 and 2020.
YearDepth (cm)pHOrganic Matter
(g kg−1)
Total N
(g kg−1)
Available N
(mg kg−1)
Available P
(mg kg−1)
Available K
(mg kg−1)
20190~105.9122.941.80111.6123.89107.23
10~205.8316.121.06101.7216.6191.86
20~305.5110.980.9582.8512.1264.72
20200~106.1324.671.93123.1925.67122.81
10~205.9218.391.29116.3018.18108.18
20~305.8712.421.0299.4113.1172.83
Table 2. Water and nitrogen management regimes.
Water and Nitrogen Management ModeNitrogen ManagementWater Management
FPNitrogen fertilizer was applied as urea (46% N) at a total rate of 150 kg N ha−1, partitioned into two applications: 70% (105 kg N ha−1) as basal fertilizer one day before transplanting and 30% (45 kg N ha−1) as tillering fertilizer seven days after transplanting.Continuous flooding irrigation: A water depth of 3–5 cm was maintained throughout the growing period from transplanting to physiological maturity, except during mid-season drainage at the inactive tillering stage when fields were drained and allowed to dry until hairline cracks appeared on the soil surface.
NWCNitrogen fertilizer was applied using a leaf age-based split application strategy comprising four discrete applications: basal fertilizer one day before transplanting, tillering fertilizer seven days after transplanting, panicle initiation fertilizer 42 days after transplanting (6.5–7.0 leaf age), and spikelet fertility fertilizer 56 days after transplanting (8.5–9.0 leaf age) to minimize spikelet degeneration during the reproductive stage. The nitrogen distribution followed a 3:3:2:2 ratio (basal:tillering:panicle initiation:spikelet fertility), with a total application rate of 150 kg N ha−1.Alternate wetting and drying irrigation (AWD): The irrigation regime was implemented through stage-specific water management protocols designed to optimize plant physiological responses while conserving water resources.
During the establishment phase (0–10 days after transplanting), a shallow water layer of 2–3 cm was maintained to facilitate seedling recovery and re-establishment following transplant shock. Throughout the active tillering period, irrigation management followed a systematic wet–dry cycle: fields were initially flooded to 3–5 cm depth, then allowed to drain naturally until soil water potential reached −20 kPa (monitored using NJ-1 tensiometers [Institute of Soil Science, Chinese Academy of Sciences, Nanjing, China] installed at 15–20 cm depth). These tensiometers feature a ceramic probe with stainless steel casing, operating within a 0–85 kPa measurement range, ensuring accurate monitoring of soil moisture thresholds. Re-irrigation was applied when the threshold was reached to restore the target water depth. This alternating cycle continued until the inactive tillering stage, when prolonged drainage was implemented to achieve soil water potential below −30 kPa, creating stress conditions conducive to suppressing non-productive tillers.
During the reproductive phase (booting to heading), a continuous water layer of 3–5 cm was maintained without drainage interruption to ensure optimal panicle development and prevent spikelet abortion under water stress. The grain-filling period employed a modified AWD protocol wherein fields were initially flooded to 5–8 cm depth to support early grain development, followed by controlled drying cycles allowing soil water potential to decrease to −25 kPa before re-irrigation. This wet–dry alternation continued until final drainage approximately seven days before harvest to facilitate grain maturation and enable mechanical harvesting operations.
MNWDFor the uniform nitrogen distribution regime, nitrogen fertilizer was applied according to a systematic seven-split schedule designed to maintain consistent nutrient availability throughout the growing period. Applications were made at 7, 14, 35, 49, 56, 70, and 77 days after transplanting (DAT), corresponding to early tillering, active tillering, stem elongation, panicle initiation, booting, heading, and grain filling stages, respectively. The application rates were 30 kg N ha−1 for the initial application (7 DAT) and 15 kg N ha−1 for each subsequent application (14, 35, 49, 56, 70, and 77 DAT), yielding a total nitrogen input of 120 kg N ha−1.Synchronized fertigation with uniform soil moisture management: This integrated water–fertilizer management system was designed to maintain optimal soil moisture conditions while ensuring precise nutrient delivery throughout the growing season. Following transplanting, a shallow water layer of 2–3 cm was established to facilitate seedling establishment and root development.
The fertigation protocol employed real-time soil moisture monitoring coupled with synchronized nutrient application. During scheduled fertilizer applications, irrigation management followed a dual-threshold strategy: when an existing water layer was present, supplemental irrigation of 2 cm depth was applied to ensure adequate nutrient dissolution and distribution; when fields were at field capacity without standing water, irrigation continued until soil saturation was achieved to create optimal conditions for nutrient infiltration and root uptake. This approach ensured uniform fertilizer distribution while minimizing surface runoff and volatilization losses.
During inter-fertilization periods, the soil water potential was continuously monitored using the same NJ-1 tensiometers [Institute of Soil Science, Chinese Academy of Sciences, Nanjing, China] at 15–20 cm depth, with irrigation triggered when soil water potential declined to −15 kPa. This threshold maintained near-optimal soil moisture conditions, preventing water stress while avoiding anaerobic conditions that could impair root function and nutrient uptake efficiency. Irrigation was terminated approximately seven days before harvest to facilitate grain desiccation and optimize field conditions for mechanical harvesting. (The MNWD system relies solely on conventional field irrigation channels along rice planting rows to deliver diluted nitrogen fertilizer solution, without dedicated fertilizer distribution pipes.)
Table 3. Rice grain yield and yield component responses to integrated water–nitrogen management systems: comparative analysis across experimental years (2019–2020).
YearWater–Nitrogen
Management
Panicle Number
(×104 ha−1)
Spikelets
per Panicle
Spikelet Fertility (%) 1000-Grain
Weight (g)
Total Spikelets
(×106 ha−1)
Grain Yield
(kg ha−1)
2019FP154.53 ± 4.85 a154.17 ± 2.75 b90.85 ± 0.47 b36.15 ± 0.05 b238.19 ± 6.04 b7419 ± 127 b
NWC156.36 ± 6.06 a161.05 ± 6.00 a90.92 ± 1.35 b36.47 ± 0.08 a251.64 ± 2.91 a7889 ± 179 a
MNWD161.76 ± 2.58 a155.01 ± 2.08 b92.67 ± 1.52 a36.48 ± 0.05 a250.74 ± 4.64 a8087 ± 152 a
2020FP188.10 ± 6.48 a156.61 ± 0.82 b85.83 ± 0.62 c36.18 ± 0.02 b294.58 ± 10.51 b8896 ± 188 c
NWC194.04 ± 6.84 a174.47 ± 3.66 a86.40 ± 0.52 c36.22 ± 0.05 b338.41 ± 6.82 a9727 ± 164 b
MNWD194.46 ± 0.18 a173.63 ± 1.25 a89.61 ± 0.40 b36.37 ± 0.02 a337.65 ± 2.63 a10,284 ± 178 a
Note that values followed by different letters differ significantly at p < 0.05.
Table 4. Nitrogen accumulation and partitioning in rice shoots at maturity stage under different water–nitrogen management regimes (2019–2020).
ProjectWater–Nitrogen
Management
Nitrogen Accumulation
in Shoot at Maturity Stage (kg ha−1)
20192020
TN
(kg ha−1)
FP112.80 ± 3.32 c140.34 ± 1.77 c
NWC140.36 ± 2.49 a172.99 ± 1.78 a
MNWD132.73 ± 2.28 b165.08 ± 2.32 b
15N
(kg ha−1)
FP48.17 ± 1.85 c46.65 ± 1.21 c
NWC71.15 ± 2.15 a76.77 ± 2.68 a
MNWD63.50 ± 1.58 b67.96 ± 2.91 b
Soil nitrogen dependency
(%)
FP57.30 ± 1.89 a66.76 ± 1.89 a
NWC49.31 ± 1.59 c55.62 ± 1.26 c
MNWD52.16 ± 0.72 b58.83 ± 1.11 b
Nitrogen fertilizer recovery
(%)
FP32.11 ± 1.23 c31.10 ± 0.94 c
NWC47.43 ± 1.43 b51.18 ± 1.73 b
MNWD52.92 ± 1.32 a56.63 ± 1.44 a
Note that the values followed by different letters differ significantly at p < 0.05.
Disclaimer/Publisher’s Note: The statements, opinions and data contained in all publications are solely those of the individual author(s) and contributor(s) and not of MDPI and/or the editor(s). MDPI and/or the editor(s) disclaim responsibility for any injury to people or property resulting from any ideas, methods, instructions or products referred to in the content.