


Abstract
Asparagine synthase (ASN) is a key enzyme in nitrogen metabolism. It is responsible for the synthesis of asparagine, but the function and molecular mechanism of its superfamily in the seed storage protein of soybean is not yet clear. In this study, a total of 34 members of the ASN superfamily were identified in soybean by in silico analysis (GmASNs). Phylogenetic and structural analyses show that most proteins in the GmASN superfamily contain conserved functional domains, which are predicted to be hydrophilic proteins, and are mainly located in the cytoplasm and chloroplasts, and a few are located in mitochondria. The chromosome distribution shows that they are randomly scattered on 13 chromosomes, and gene replication drives the expansion of the family. In addition, the haplotype analysis of four key GmASN superfamily genes (GmASN11, GmASN16, GmASN20, GmASN29) shows that they are significantly associated with the content of seed storage protein (SSP). Importantly, the aggregation of favorable haplotypes at these loci can significantly improve the SSP level. These results elucidate the evolutionary history of the GmASN gene superfamily and identify valuable haplotypes. These haplotypes are promising targets for the development of high-protein soybean varieties through marker-assisted breeding.
1. Introduction
Soybean (Glycine max) is native to China and is an important cash crop in the world. It has a wide range of applications in food processing, animal feed and industrial raw materials [1]. Soybean seeds are rich in oil and protein, and the oil content is usually between 8.3% and 27.9%, mainly composed of unsaturated fatty acids that are beneficial to the human body [2]. The protein content is generally between 24.1% and 56.8%, containing all the essential amino acids needed by the human body, so soybeans are a high-quality source of plant protein [3]. Clarifying the regulatory mechanism of protein and oil accumulation in soybean seeds is crucial to cultivating high-yielding and high-quality varieties and improving their nutrition and economic value [4].
Asparagine synthase (ASN) is a key enzyme for plant nitrogen metabolism. It mainly catalyzes the conversion of aspartate and glutamine into asparagine and glutamate acid [5], and participates in physiological processes such as absorption of inorganic nitrogen, long-distance transport and intracellular nitrogen storage [6]. Nitrate, ammonium or other forms of nitrogen absorbed by plants are initially assimilated into amino acids such as glutamine through the GS/GOGAT pathway, and then converted into asparagine, which is a key step in efficient nitrogen management and is catalyzed by ASN. Asparagine has a high nitrogen-to-carbon ratio and strong chemical stability, and can efficiently store and transport nitrogen [7,8]. Therefore, ASN plays an important role in maintaining nitrogen homeostasis and supporting cell growth.
The ASN gene plays a key role in seed development and trait formation across many plant species. For example, constitutive overexpression of ASN1 in Arabidopsis can improve the level of free asparagine in the pod and promote the accumulation of seed protein [9]. In rapeseed, sufficient nitrogen supply promotes ASN-mediated protein accumulation [9]. ASN is also very important in the process of seed development. In rice, the loss-of-function of OsASN2 function will lead to abnormal endosperm development, impaired starch granule formation and decreased germination rate. This may be through interaction with PPDK to coordinate carbon and nitrogen metabolism, confirming the core role of asparagine metabolism in seed amino acid transport and storage compound accumulation [10]. In addition, CRISPR/Cas9-mediated knockout of wheat TaASN2 gene significantly reduced the accumulation of free asparagine in seeds, which directly clarified the key regulatory role of this gene in determining the quality characteristics of seed quality traits [11].
The ASN gene also plays a key role in plants’ response to biotic and abiotic stresses. Under different stress conditions, plants usually adjust the expression of ASN genes in order to redistribute nitrogen resources and maintain physiological homeostasis [12,13]. For example, under low-phosphate stress, the soybean gene GmASN5 will be specifically induced, thus enhancing root function of rhizoma and promoting the accumulation of nitrogen and phosphorus [14]. Heterogeneous overexpression of PoASN1 genes can significantly improve the salt tolerance of Arabidopsis and rice [15]. Tobacco mosaic virus (TMV) infection will promote the expression of the tobacco asparagine synthase gene NbAS-B, resulting in an increase in asparagine content, which in turn activates the salicylic acid (SA) signaling pathway and enhances antiviral immunity [16].
The ASN gene family has been well-characterized in several plants, including three members of ASN gene in Arabidopsis thaliana [17] and four members in wheat [18,19]. The expression level of TaASN2 is positive correlated to seed asparagine content [18,19]. OsASN1 in rice is mainly involved in ammonium assimilation at the root, while OsASN2 assists the transport of asparagine between organs [20]. Previous studies in crops such as Arabidopsis, wheat and rice have clarified the conserved function of the core ASN gene in nitrogen assimilation, transport and seed quality formation. However, existing research mainly focuses on these core genes, resulting in the expansion of the ASN superfamily (containing the PF0310 and PF13537 domains) in key crops such as soybean not being fully investigated.
In this study, a total of 34 ASN genes in soybean were identified by integrating bioinformatics and molecular biology approaches. The gene structures, evolutionary relationships, and expression patterns of all ASN members were systematically characterized. Further analysis extended to associations with agronomic traits, and natural variations significantly linked to seed storage protein content were identified through haplotype analysis of key genes. Finally, the breeding potential of stacking favorable haplotypes was evaluated. This work aims to elucidate the functional differentiation of this superfamily and to provide direct genetic resources and breeding targets for the development of high-protein and nitrogen-efficient soybean varieties.
2. Materials and Methods
2.1. Identification of GmASN Superfamily Genes
To comprehensively identify members of the ASN superfamily in soybean, we employed a systematic bioinformatics approach. First, the hidden Markov model (HMM) profiles for two homologous domains (PF00733 and PF13537) characteristic of the ASN superfamily were retrieved from the Pfam database (version 35.0; accessed on 25 November 2025) [21]. Subsequently, the hmmsearch program from the HMMER 3.0 package was used to scan the complete soybean reference proteome (cultivar Williams 82, assembly Glycine_max_Wm82.a2.v1) using the retrieved HMM profiles. An E-value cutoff of <1 × 10⁻⁵ was applied for this initial screening. Second, a complementary BLASTP (https://blast.ncbi.nlm.nih.gov/Blast.cgi; accessed on 25 November 2025) search was performed against the soybean proteome using multiple known ASN protein sequences as queries to identify members with high sequence similarity. Candidate genes from both searches were then subjected to validation using InterProScan (https://www.ebi.ac.uk/interpro/about/interproscan/; accessed on 25 November 2025) to confirm the presence of the PF00733 or PF13537 domain in each corresponding protein. Following the removal of candidate sequences that lacked these essential domains or represented apparent annotation fragments, the remaining genes were definitively classified as members of the soybean ASN superfamily.
Due to significant functional divergence within the subgroup, constructing a reliable interspecies phylogenetic tree including all members was not feasible. Therefore, core ASN genes from wild soybean (Glycine soja), rice (Oryza sativa), and Arabidopsis thaliana were selected for interspecies evolutionary analysis. The screening procedure followed the same protocol used for soybean (Glycine max). Reference genomes employed in this analysis were Glycine soja v1.1, TAIR10 for Arabidopsis thaliana, and Oryza sativa v7.0.
2.2. Construction of Phylogenetic Tree
To analyze the evolutionary relationships among the ASN proteins of the identified soybean, wild soybean, Arabidopsis thaliana and rice, as well as within the GmASN superfamily gene, multiple sequence alignments were conducted for the two groups of data using the MUSCLE algorithm in MEGA11 software (version 11.0) [22]. Subsequently, a phylogenetic tree was constructed using the neighbor-joining method with the following parameters: amino acid substitution model set to Poisson, uniform rate among sites, and gaps/deletions treated as complete deletion. The statistical reliability of the branch topology was evaluated by bootstrap (1000 replicates). The generated tree file (in Newick format) was imported into the online platform ChiPlot (https://www.chiplot.online; accessed on 26 November 2025) for visualization and annotation [23].
2.3. Analysis of Physicochemical Properties and Prediction of Subcellular Localization
The physicochemical properties of each identified GmASNs protein were analyzed using the ExpASy bioinformatics platform (https://www.expasy.org/; accessed on 27 November 2025) developed by SIB Swiss Institute of Bioinformatics. The amino acid sequences (in FASTA format) of all GmASNs superfamily members were submitted to the integrated ProtParam tool to calculate key parameters, including sequence length, theoretical molecular weight (kDa), and isoelectric point (pI) [24].
Subcellular localization predictions were performed using the web server Cell-PLoc 2.0 (http://www.csbio.sjtu.edu.cn/bioinf/Cell-PLoc-2/; accessed on 27 November 2025). For this plant-specific analysis, the Plant-mPLoc predictor within Cell-PLoc 2.0 was employed to predict the most probable subcellular compartments for each GmASNs protein using the default parameters [25].
2.4. Prediction of Protein Secondary Structure
The secondary structures of the GmASNs proteins were predicted using the SOPMA online server (https://npsa-prabi.ibcp.fr/cgi-bin/npsa_automat.pl?page=npsa_sopma.html; accessed on 28 November 2025). The amino acid sequence of each protein (in FASTA format) was submitted individually. Predictions were run with the default parameters as shown in the server interface: the number of conformational states was set to 4 (Helix, Sheet, Turn, Coil), the similarity threshold was set to 8, and the window width was set to 17. The results provided the percentage composition of each secondary structural element for every GmASNs protein.
2.5. Conserved Motif Analysis and Bioinformatics Visualization
Conserved motifs within the GmASNs protein sequences were identified using the MEME online suite (version 5.5.9; https://meme-suite.org/meme/; accessed on 28 November 2025) [26]. The analysis was configured with the following parameters: the motif discovery mode was set to “Classic mode”; the site distribution model was specified as “Zero or One Occurrence Per Sequence (ZOPS)”; and the number of motifs to discover was set to 10. All other parameters were kept at their default settings. The arrangement of conserved motifs, cis-regulatory elements, and genomic synteny, were visualized using TBtools software (version 2.390) for comprehensive graphical representation [27].
2.6. Analysis of Tissue-Specific Expression Patterns
To analyze the expression profiles of the GmASNs genes, transcriptomic data were retrieved from the RNA-Seq Atlas of Glycine max available through the SoyBase database (https://www.soybase.org/; accessed on 28 November 2025). The gene model names of all identified GmASN superfamily members were submitted as queries using the “Search by Gene Name” function on the SoyBase expression module. Normalized expression values (e.g., FPKM or TPM) across multiple tissue types, including root, stem, leaf, nodule, and seeds at various developmental stages, were extracted from the dataset.
For visualization, the extracted expression matrix was log2-transformed [using log2(expression + 1)] and then subjected to row-wise Z-score normalization to highlight gene-specific expression variation across tissues. A clustered heatmap was generated using the visualization function in TBtools software (version 2.390) [27].
2.7. Analysis of Intraspecific Genomic Synteny
Intraspecific synteny analysis of the GmASN genes was performed using the chromosome-level soybean reference genome assembly Glycine_max_Wm82.a2.v1. The genomic sequence (FASTA format) and annotation (GFF3 format) files for this assembly were obtained from the Phytozome database (https://phytozome-next.jgi.doe.gov/; accessed on 28 November 2025). Chromosome sequences were extracted, and the necessary data files for analysis were prepared. Syntenic gene pairs were identified and visualized using the advanced genomic analysis modules within TBtools software (version 2.390).
2.8. RT-qPCR Analysis
To analyze the expression of candidate genes, reverse transcription quantitative polymerase chain reaction (RT-qPCR) was conducted on seeds collected from available high-protein (HP) and low-protein (LP) soybean varieties at three developmental stages: early maturation (EM1), mid-maturation (MM), and late maturation (LM). Gene-specific primers were designed using the NCBI Primer-BLAST tool (https://www.ncbi.nlm.nih.gov/tools/primer-blast/index.cgi?LINK_LOC=BlastHome; accessed on 30 November 2025), with GmActin11 used as the internal reference control [28]. All primers were synthesized by Beijing Ruibo Xingke Biotechnology Co., Ltd. (Beijing, China) and their sequences are listed in Supplementary Table S4. For RNA extraction, 100 mg of fresh seed tissue from each sample was snap-frozen in liquid nitrogen, homogenized using a mortar and pestle, and transferred to a 1.5 mL tube. Total RNA was then isolated using the FastPure Universal Plant Total RNA Isolation Kit (Vazyme Biotech, Nanjing, China). This RNA was reverse-transcribed into cDNA using the HiScript III RT SuperMix for qPCR kit (Vazyme Biotech, Nanjing, China), which includes a gDNA wiper step. Each reaction was performed with three technical replicates. Relative gene expression was calculated using the 2−ΔΔCT method [29].
2.9. Haplotype Analysis
Haplotype analysis of the GmASN superfamily was conducted using publicly available genomic variation data from a diverse panel of 547 soybean germplasm accessions [30]. The vcftools software (v0.1.17) was used to extract the variant sites in the CDS regions of GmASNs and strict quality control screening was implemented. Only variants with a missing rate < 20% and a minor allele frequency (MAF) > 5% were retained. Haplotypes with population frequency exceeding 5% are considered dominant haplotypes. Linkage disequilibrium (LD) between single-nucleotide polymorphisms (SNPs) within the target region was assessed by calculating pairwise r2 values using PLINK software (version 1.9) [31].
To explore associations between haplotypes and extreme phenotypic values, two contrasting groups were established: one comprising accessions from the top 10% (high protein) and bottom 10% (low protein) of the population based on storage protein content. The haplotype composition of the GmASN superfamily was analyzed within each group. Afterwards, Student’s t-tests were performed to determine whether significant differences in protein content existed between accessions carrying haplotypes predominantly associated with high-protein phenotypes (superior haplotypes) and those associated with low-protein phenotypes (inferior haplotypes).
2.10. Haplotype Stacking Analysis
To evaluate the combined effect of superior haplotypes across the GmASN superfamily, a haplotype stacking analysis was performed on the same panel of 547 soybean accessions [30]. First, individual members of the GmASN superfamily were considered for stacking if they harbored a dominant haplotype (frequency > 5.0%) that was significantly associated with higher seed storage protein content (as identified in Section 2.8). For each accession, a “stacking score” was calculated by counting the number of such superior haplotypes it carried across the candidate superfamily members.
Subsequently, the accessions were grouped based on their stacking scores (e.g., 0, 1, 2… superior haplotypes). Differences in seed storage protein content among these stacking groups were assessed to identify significant trends in seed storage protein accumulation with increasing haplotype stacking.
3. Results
3.1. Phylogenetic and Motif Analysis of the GmASN Superfamily
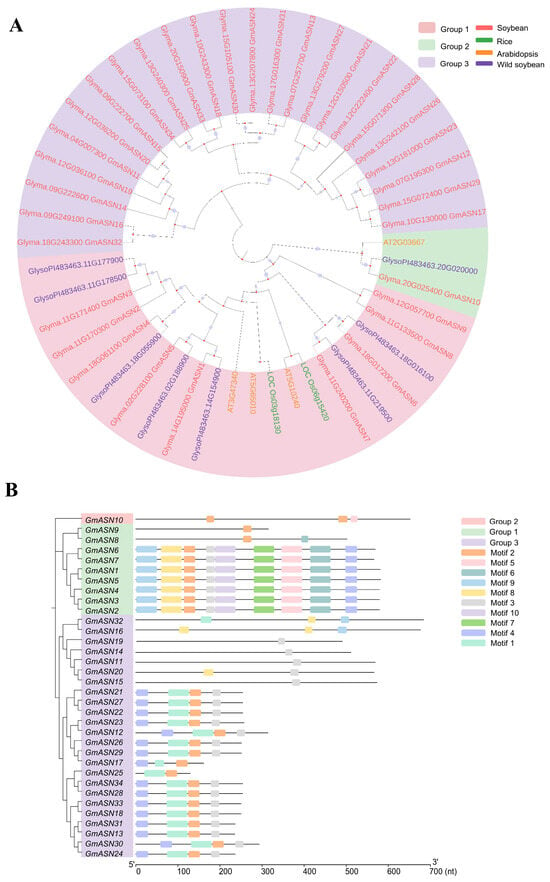
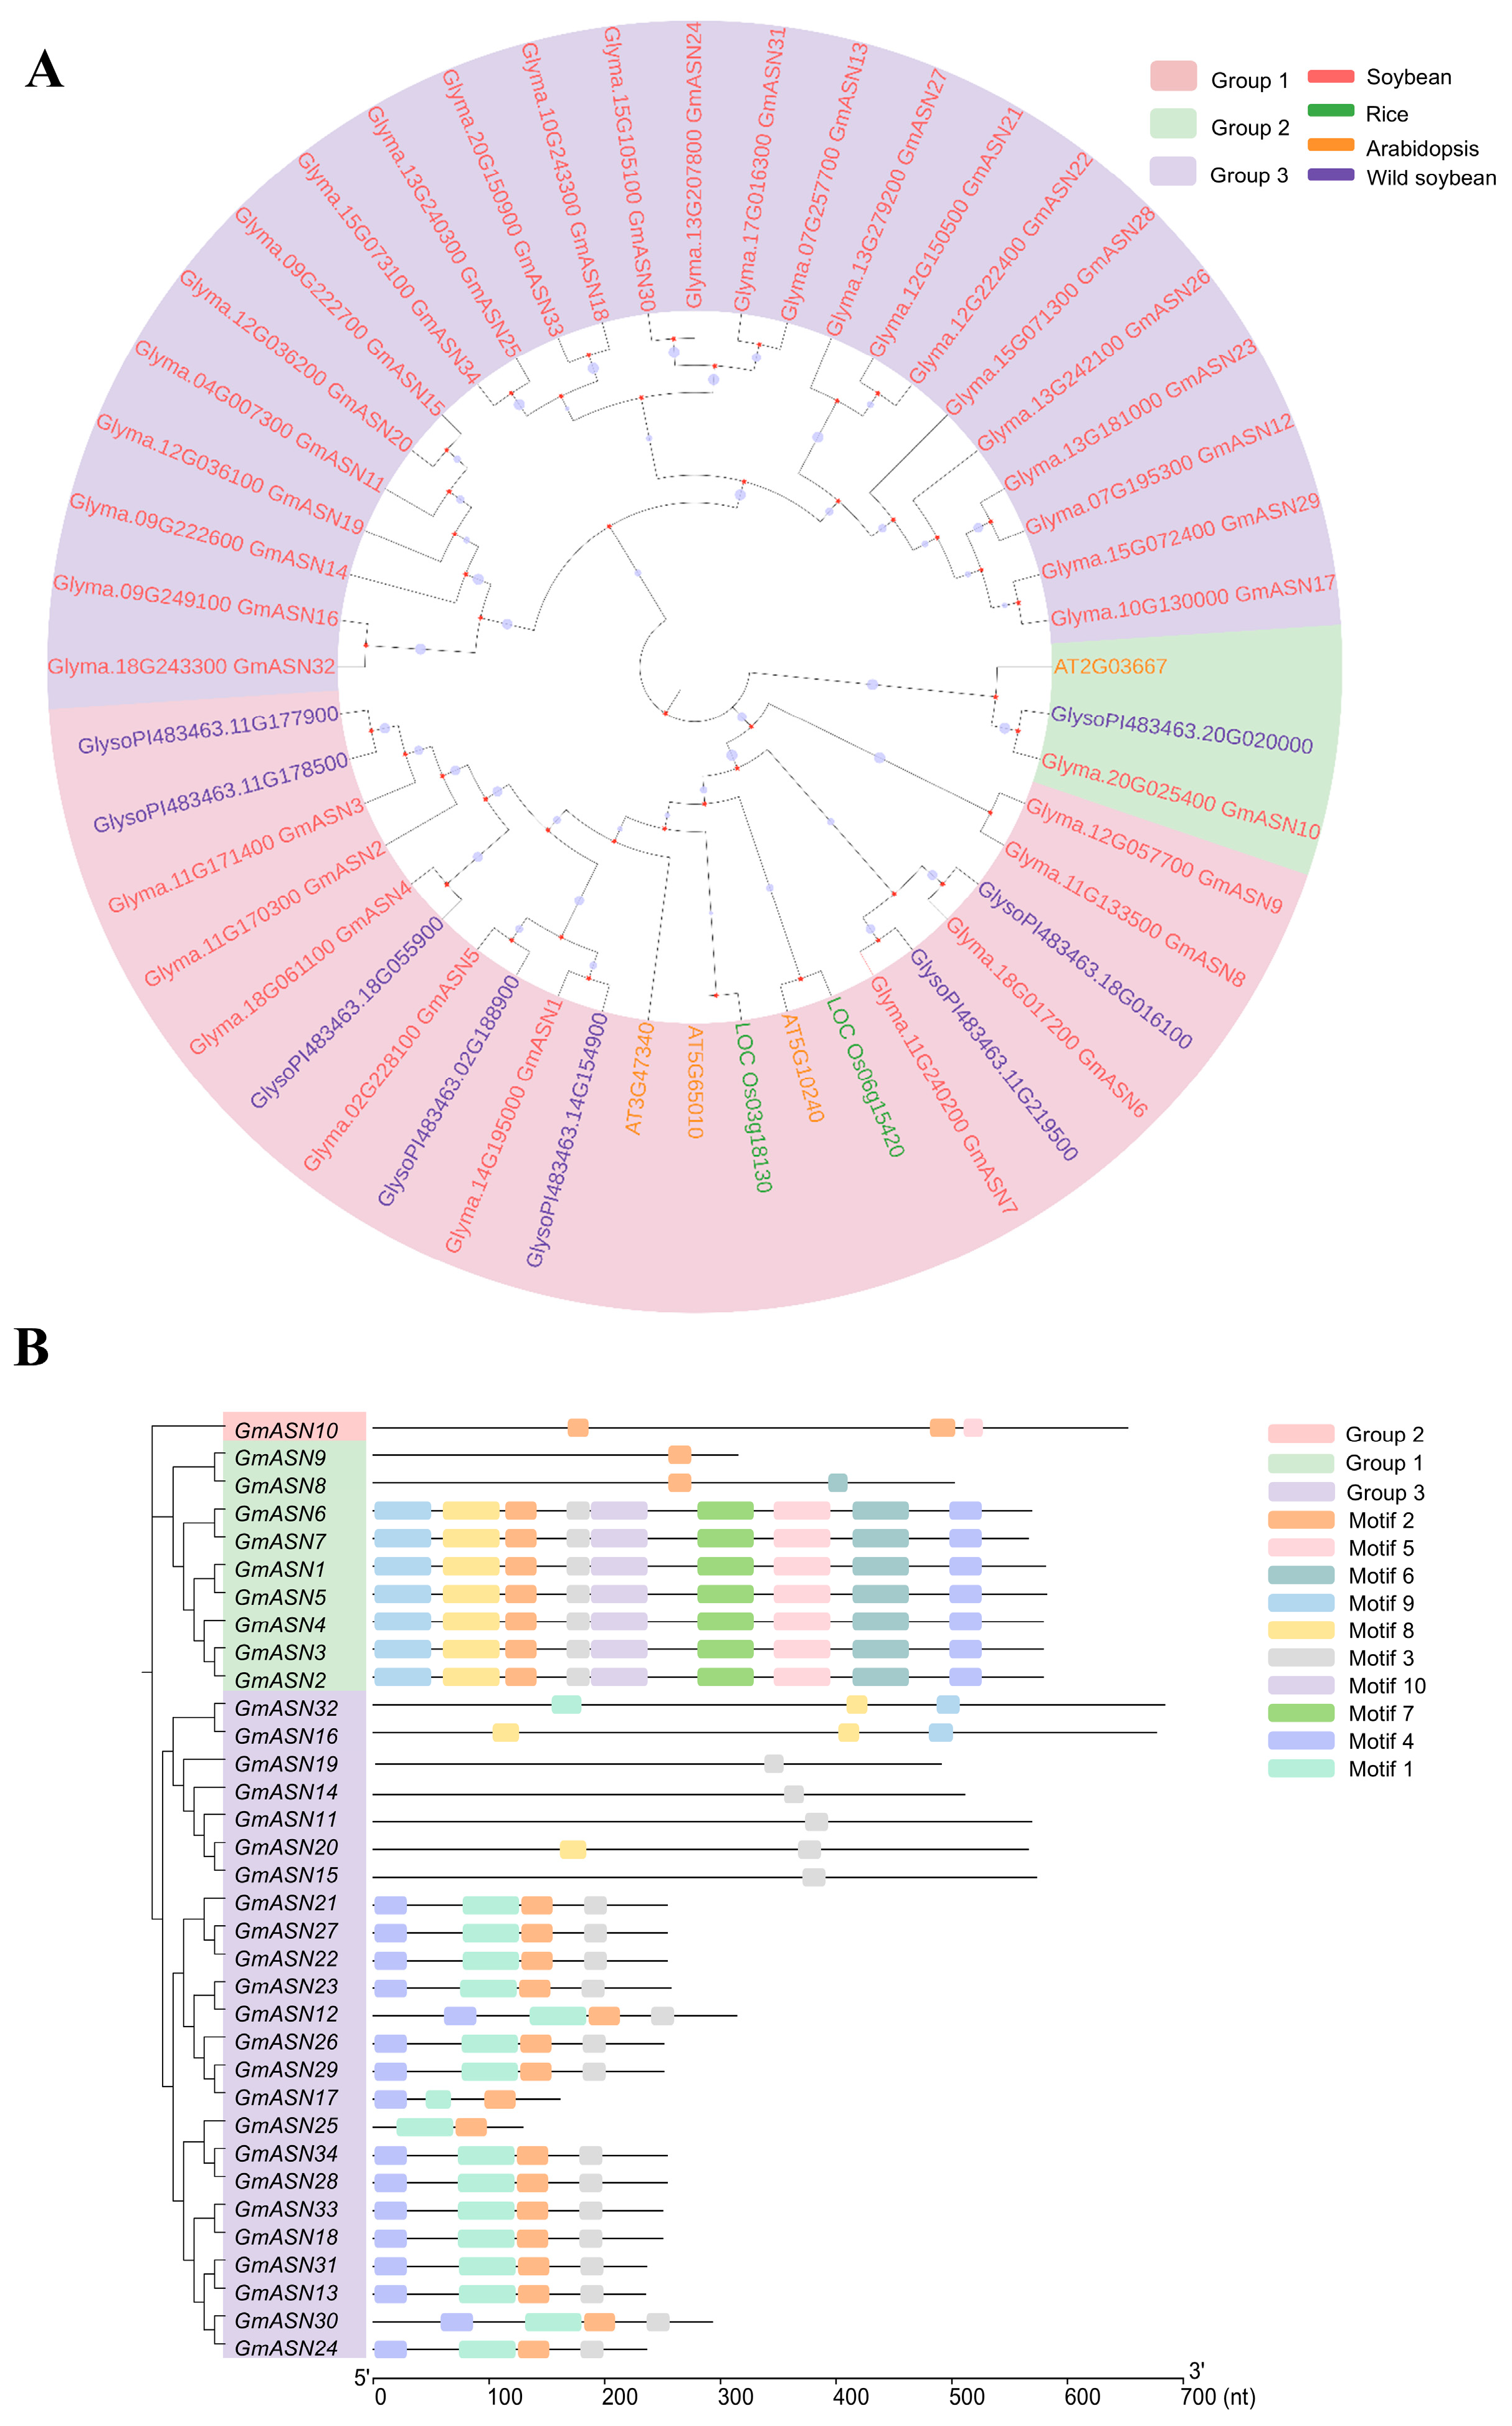
Through phylogenetic analysis, we clarified the evolutionary trajectory of the asparagine synthase (ASN) superfamily in soybean (Glycine max). The study found that the superfamily comprises 34 genes (GmASN1–GmASN34), indicating the occurrence of significant gene family expansion. To analyze the evolutionary relationship among these genes, we constructed a maximum likelihood (ML) phylogenetic tree containing all 34 GmASN proteins and 13 canonical ASN proteins from three representative species (Figure 1A). The phylogenetic tree resolves all proteins into three distinct subgroups (Figure 1A): Subgroup I contains 9 GmASN proteins, which cluster with the canonical ASN proteins from the other three species. Notably, only the proteins encoded by GmASN1–GmASN7 in this subgroup possess a complete, characteristic dual-domain architecture. Subgroup II contains only GmASN10, and its corresponding protein harbors an incomplete catalytic domain. Subgroup III is the largest subgroup (containing 24 genes), which lacks homologs of the canonical ASN proteins from the other three species.
Figure 1.
Phylogenetic analysis and conserved motifs of asparagine synthetase (ASN) superfamily in soybean. (A) Phylogenetic tree. The tree comprises 34 GmASN proteins (red labels) and canonical ASN proteins from Arabidopsis (4, yellow), rice (2, green), and wild soybean (7, purple). The three major subgroups (I, II, III) are colored with red, green, and purple arcs, respectively. (B) Conservation of Motif Architecture. Motifs are shown as colored boxes according to the legend on the panel. The order of proteins is as in (A), and there is a gray scale bar at the bottom indicating the protein length.
Ten conserved motifs were identified by conserved sequence analysis (Figure 1B), and their distribution was highly correlated with the phylogenetic subgroup. Most members of Subgroup I share common conserved motif characteristics (Figure 1B). In contrast, Subgroup III shows higher sequence diversity, and there are even proteins that contain only one conserved motif. In order to evaluate the potential functional significance of the conserved motifs identified in GmASN superfamily proteins, we conducted a detailed comparative analysis of them with the well-characterized catalytic and regulatory domains of the asparagine synthase (AsnB) from Escherichia coli [6]. Motifs 1, 8, and 9 all contain the core residue Cys of the N-terminal glutaminase domain; motif 9 also has the Gln corresponding to the formation of a hydrogen bond with the carbonyl group of glutamine; motif 5 corresponds to the region involved in the coordination of divalent cations (such as Mg2+), which is crucial for stabilizing the ATP in the active site of the synthetase; motif 7 contains the Met corresponding to the key residue on the inner wall of the intramolecular ammonia channel; motif 10 was found to contain the classic P-loop (phosphate-binding loop or Walker A motif), which is essential for ATP binding and hydrolysis in the synthetase domain. Notably, searches for each motif sequence via the NCBI website revealed that, with the exception of motif 4, the remaining nine motifs all contained the core structural domain of asparagine synthetase, belonging to a “superfamily” domain of asparagine synthetase in terms of three-dimensional structure and evolutionary relationships. Five proteins (such as GmASN9, GmASN11) have only one motif. These structurally simplified versions are spread across several subgroups, implying they might be pseudogenes or very divergent genes. Their relationship to canonical ASN activity is not yet clear.
In summary, the GmASN superfamily has undergone substantial expansion and structural diversification. It is divided into subgroups that are evolutionarily distinct, each with a characteristic motif profile, offering a genomic framework for future functional studies.
3.2. Gene Structure and Promoter Cis-Regulatory Element Analysis
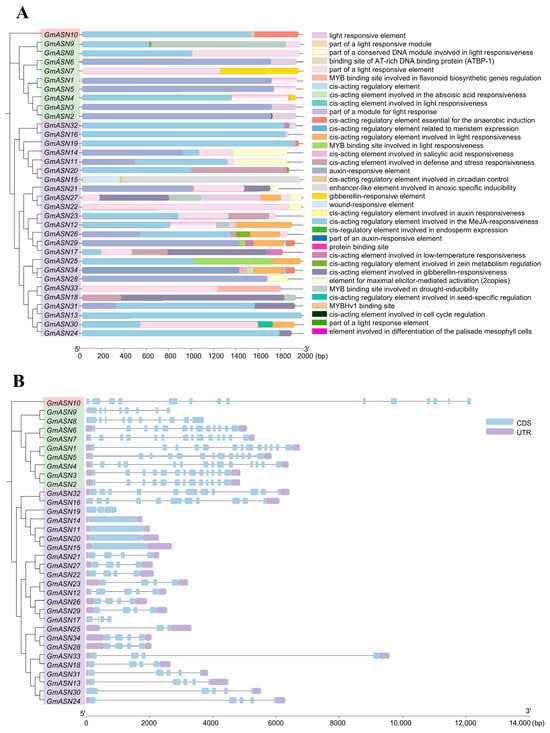
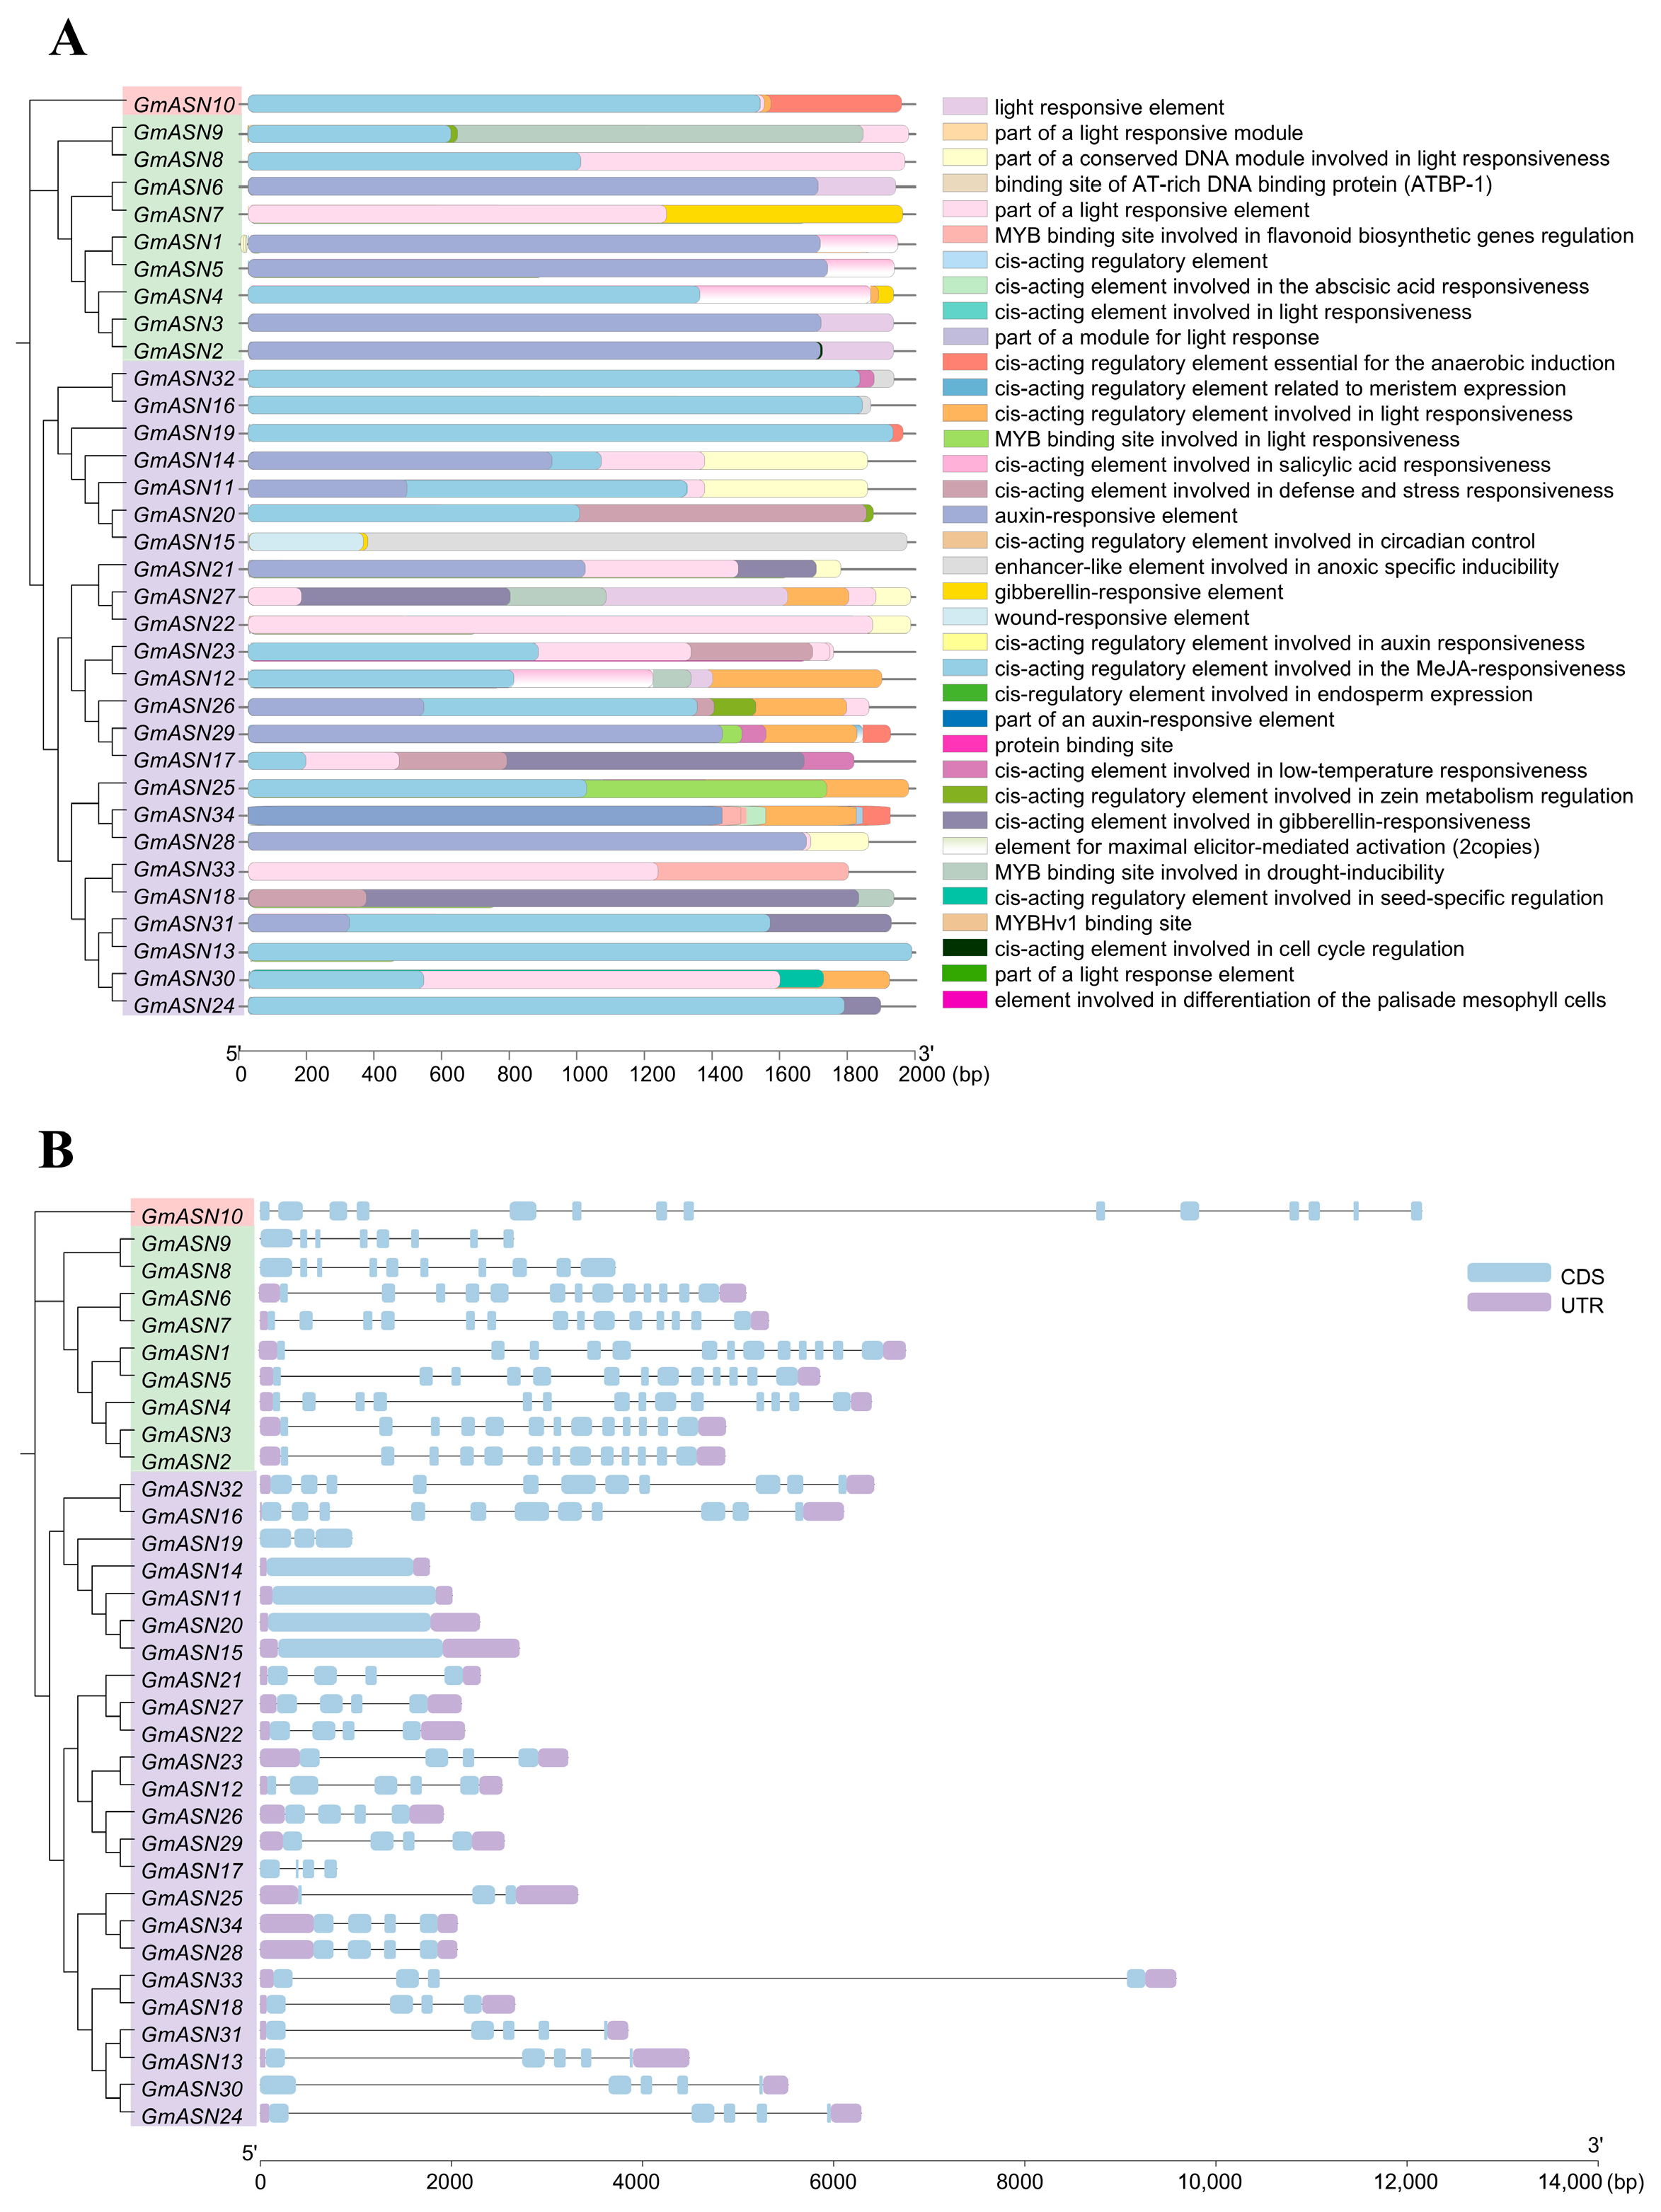
In our analysis of the cis-regulatory elements of the GmASN superfamily, they were classified into four functional groups according to the PlantCARE database annotation (Figure 2A). The ubiquitous presence of light-responsive elements indicates that light-mediated regulation is a common feature of GmASN superfamily genes. The presence of a variety of hormone-responsive elements (such as auxin, abscisic acid, etc.) suggests that these genes may be integrated into complex phytohormone signaling networks. The existence of stress-responsive elements (including salicylic acid (SA)-responsive, drought-inducible, low-temperature-responsive, etc.) indicates their potential role in environmental adaptation. In addition, the presence of development- and tissue-specific elements highlights the requirement for precise spatial and temporal regulation of gene expression (Figure 2A).
Figure 2.
Promoter cis-regulatory element profiles and gene structures of the GmASN superfamily. (A) Distribution of cis-acting elements in the GmASN superfamily. Elements were predicted within the 2 kb promoter region upstream of the start codon (ATG), categorized by function, and represented by colored boxes according to the key. The gene names (vertical axis) are arranged in the same order as the phylogenetic tree in Figure 1. The scale bar at the bottom indicates the position (bp) relative to the translation start site. (B) Exon–intron structures of the GmASN superfamily. Purple rectangles represent untranslated regions (UTRs), blue rectangles represent coding sequences (CDSs), and gray lines represent introns. Gene names are shown on the left. The horizontal scale bar indicates gene length in kilobases (kb).
Gene structure analysis shows that there is significant structural diversity within the GmASN superfamily, and the gene length of individual members varies substantially, ranging from approximately 1 kb to >12 kb (Figure 2B). Exon–intron organization is highly heterogeneous. Most genes have multiple exons, but their number, size, and arrangement vary considerably. Many genes (such as GmASN1 and GmASN14) have a compact structure, but others (such as GmASN10 and GmASN24) have an extended genomic span, probably because of intron expansion (Figure 2B). The structural plasticity closely correlates with the phylogenetic divergence depicted in Figure 1, indicating that different evolutionary subgroups have experienced divergent structural and regulatory development.
3.3. Physicochemical Properties and Subcellular Localization of Soybean GmASNs
The physicochemical properties of the 34 GmASN proteins were analyzed (Table S2). They exhibited considerable variation in length (ranging from 129 to 684 amino acids), molecular weight (approximately 14.5 to 75.1 kDa), theoretical isoelectric point (pI 5.44 to 8.56), and grand average of hydropathicity (GRAVY values from −0.36 to 0.111). The prediction of subcellular localization revealed the diverse distribution of GmASN superfamily proteins. Specifically, 21 members, including GmASN5 and GmASN6, are predicted to be localized exclusively to the chloroplast, which is consistent with the key role of asparagine synthase in nitrogen assimilation and allocation. Notably, three members (GmASN2, GmASN3 and GmASN4) are predicted to be localized to both chloroplasts and mitochondria, suggesting their potential for specialized functions in intracellular nitrogen metabolism. In addition, 4 members (GmASN12, GmASN28, GmASN3 and GmASN34) are predicted to be localized in the cytoplasm, while 6 members (GmASN1, GmASN7, GmASN13, GmASN27 and GmASN31) are predicted to be co-localized to both the cytoplasm and chloroplasts (Table S2). These differences in physicochemical properties and subcellular localization provide a solid foundation for exploring the functional diversification of the GmASN superfamily in nitrogen metabolism.
3.4. Secondary Structure Analysis of GmASNs
Analysis of the 34 GmASN proteins showed that their secondary structures mainly have random coils, α-helices, and extended strands, and there are no β-turns (Table S3). Random coils were the most common element, with 39% (GmASN16) to 61% (GmASN29) of each structure. The α-helix content ranged from 25% (GmASN17, GmASN21, GmASN29) to 44% (GmASN16), while extended strands represented a smaller fraction, varying from 12% (GmASN3, GmASN4, GmASN6, GmASN7) to 22% (GmASN19, GmASN25). Thus, the GmASN superfamily is characterized by a predominance of random coils and α-helices, with β-turns entirely absent in all members.
3.5. Chromosomal Distribution and Synteny Analysis of GmASNs
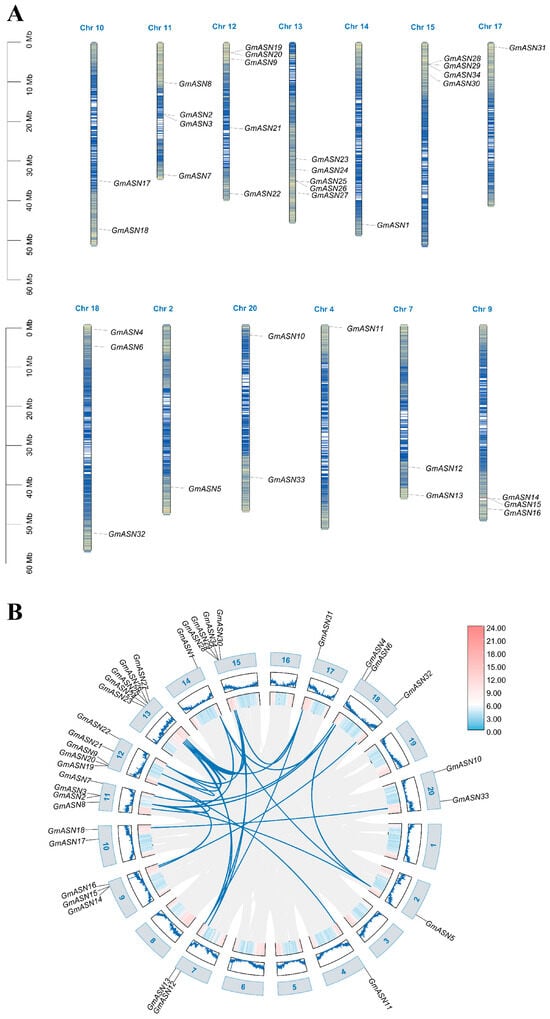
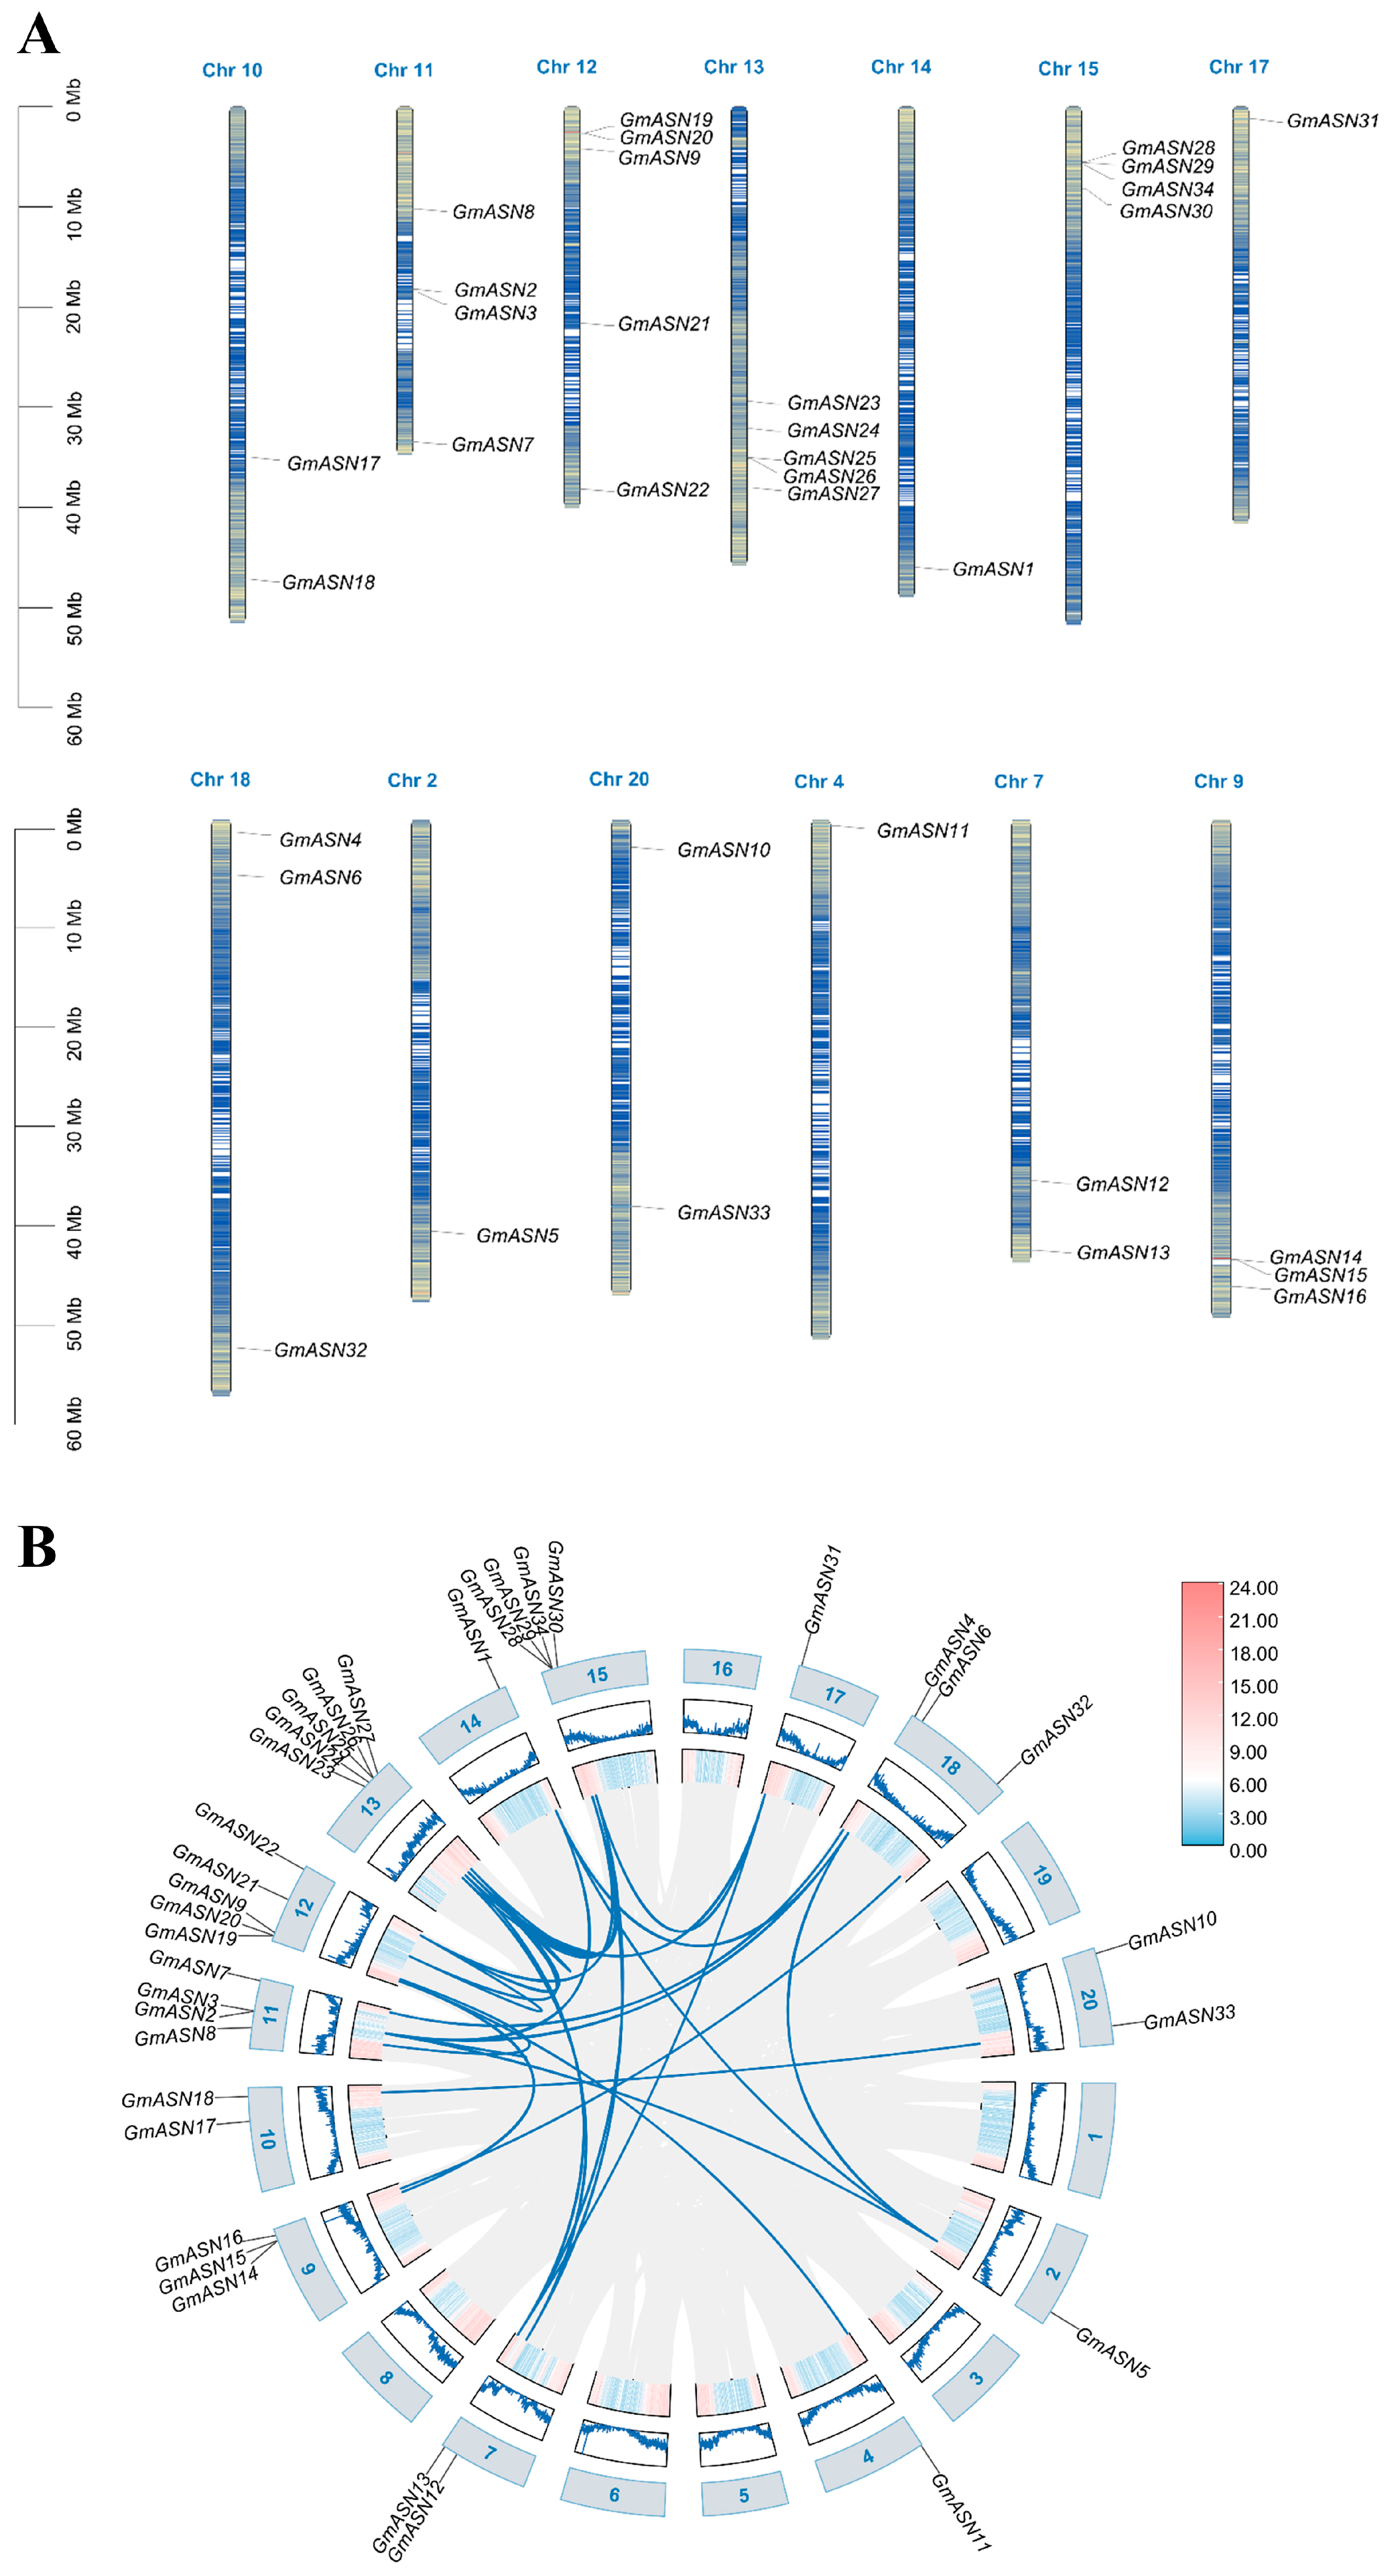
The GmASN superfamily were distributed unevenly across 13 soybean chromosomes (Chr2, 4, 7, 9, 10, 11, 12, 13, 14, 15, 17, 18, and 20). Their specific localizations were determined as follows: GmASN5 on Chr2; GmASN11 on Chr4; GmASN12 and GmASN13 on Chr7; GmASN14, GmASN15, and GmASN16 on Chr9; GmASN17 and GmASN18 on Chr10; GmASN2, GmASN3, GmASN7, and GmASN8 on Chr11; GmASN9, GmASN19, GmASN20, GmASN21, and GmASN22 on Chr12; GmASN23 to GmASN27 on Chr13; GmASN1 on Chr14; GmASN28, GmASN30, and GmASN34 on Chr15; GmASN31 on Chr17; GmASN4, GmASN6, and GmASN32 on Chr18; and GmASN10 and GmASN33 on Chr20 (Figure 3A).
Figure 3.
Chromosomal distribution synteny analysis of GmASNs. (A) Chromosomal distribution GmASNs on soybean genome. The 34 GmASN superfamily genes are unevenly located on 13 chromosomes. Gene names are labeled to the right of each chromosome, and the scale on the left indicates physical positions in megabases (Mb). (B) Synteny analysis of GmASNs. The outer ring lists the names of individual GmASN superfamily members. The circular plot is divided into 20 numbered sectors (1–20), each representing a distinct genomic region, functional cluster, or sample-based enrichment group. In each sector, a heatmap presents the relative density/enrichment levels of each GmASN superfamily gene, with the color gradient (blue to red) indicating values ranging from 0.0 (lowest density) to 24.0 (highest density). Blue connecting lines in the inner circle highlight genes that share similar density profiles across the 20 sectors, indicating closer association in their genomic distribution or functional clustering patterns.
Synteny analysis identified 34 segmental duplication events across these chromosomes (Figure 3B). The duplication frequency varied among genes: GmASN2, GmASN3, GmASN5, GmASN6, GmASN22, GmASN27, and GmASN29 each underwent four duplication events; GmASN1, GmASN12, GmASN13, GmASN19, GmASN21, GmASN23, GmASN24, GmASN25, GmASN30, and GmASN31 experienced two to three events; all remaining genes were duplicated only once. This pattern of recurrent duplication may have furnished the genomic foundation for functional diversification within the GmASN superfamily.
3.6. Transcriptome Analysis of GmASNs
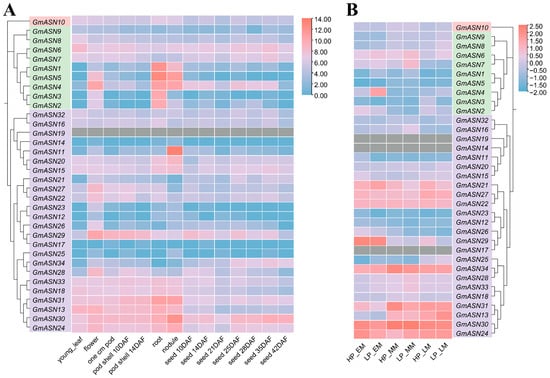
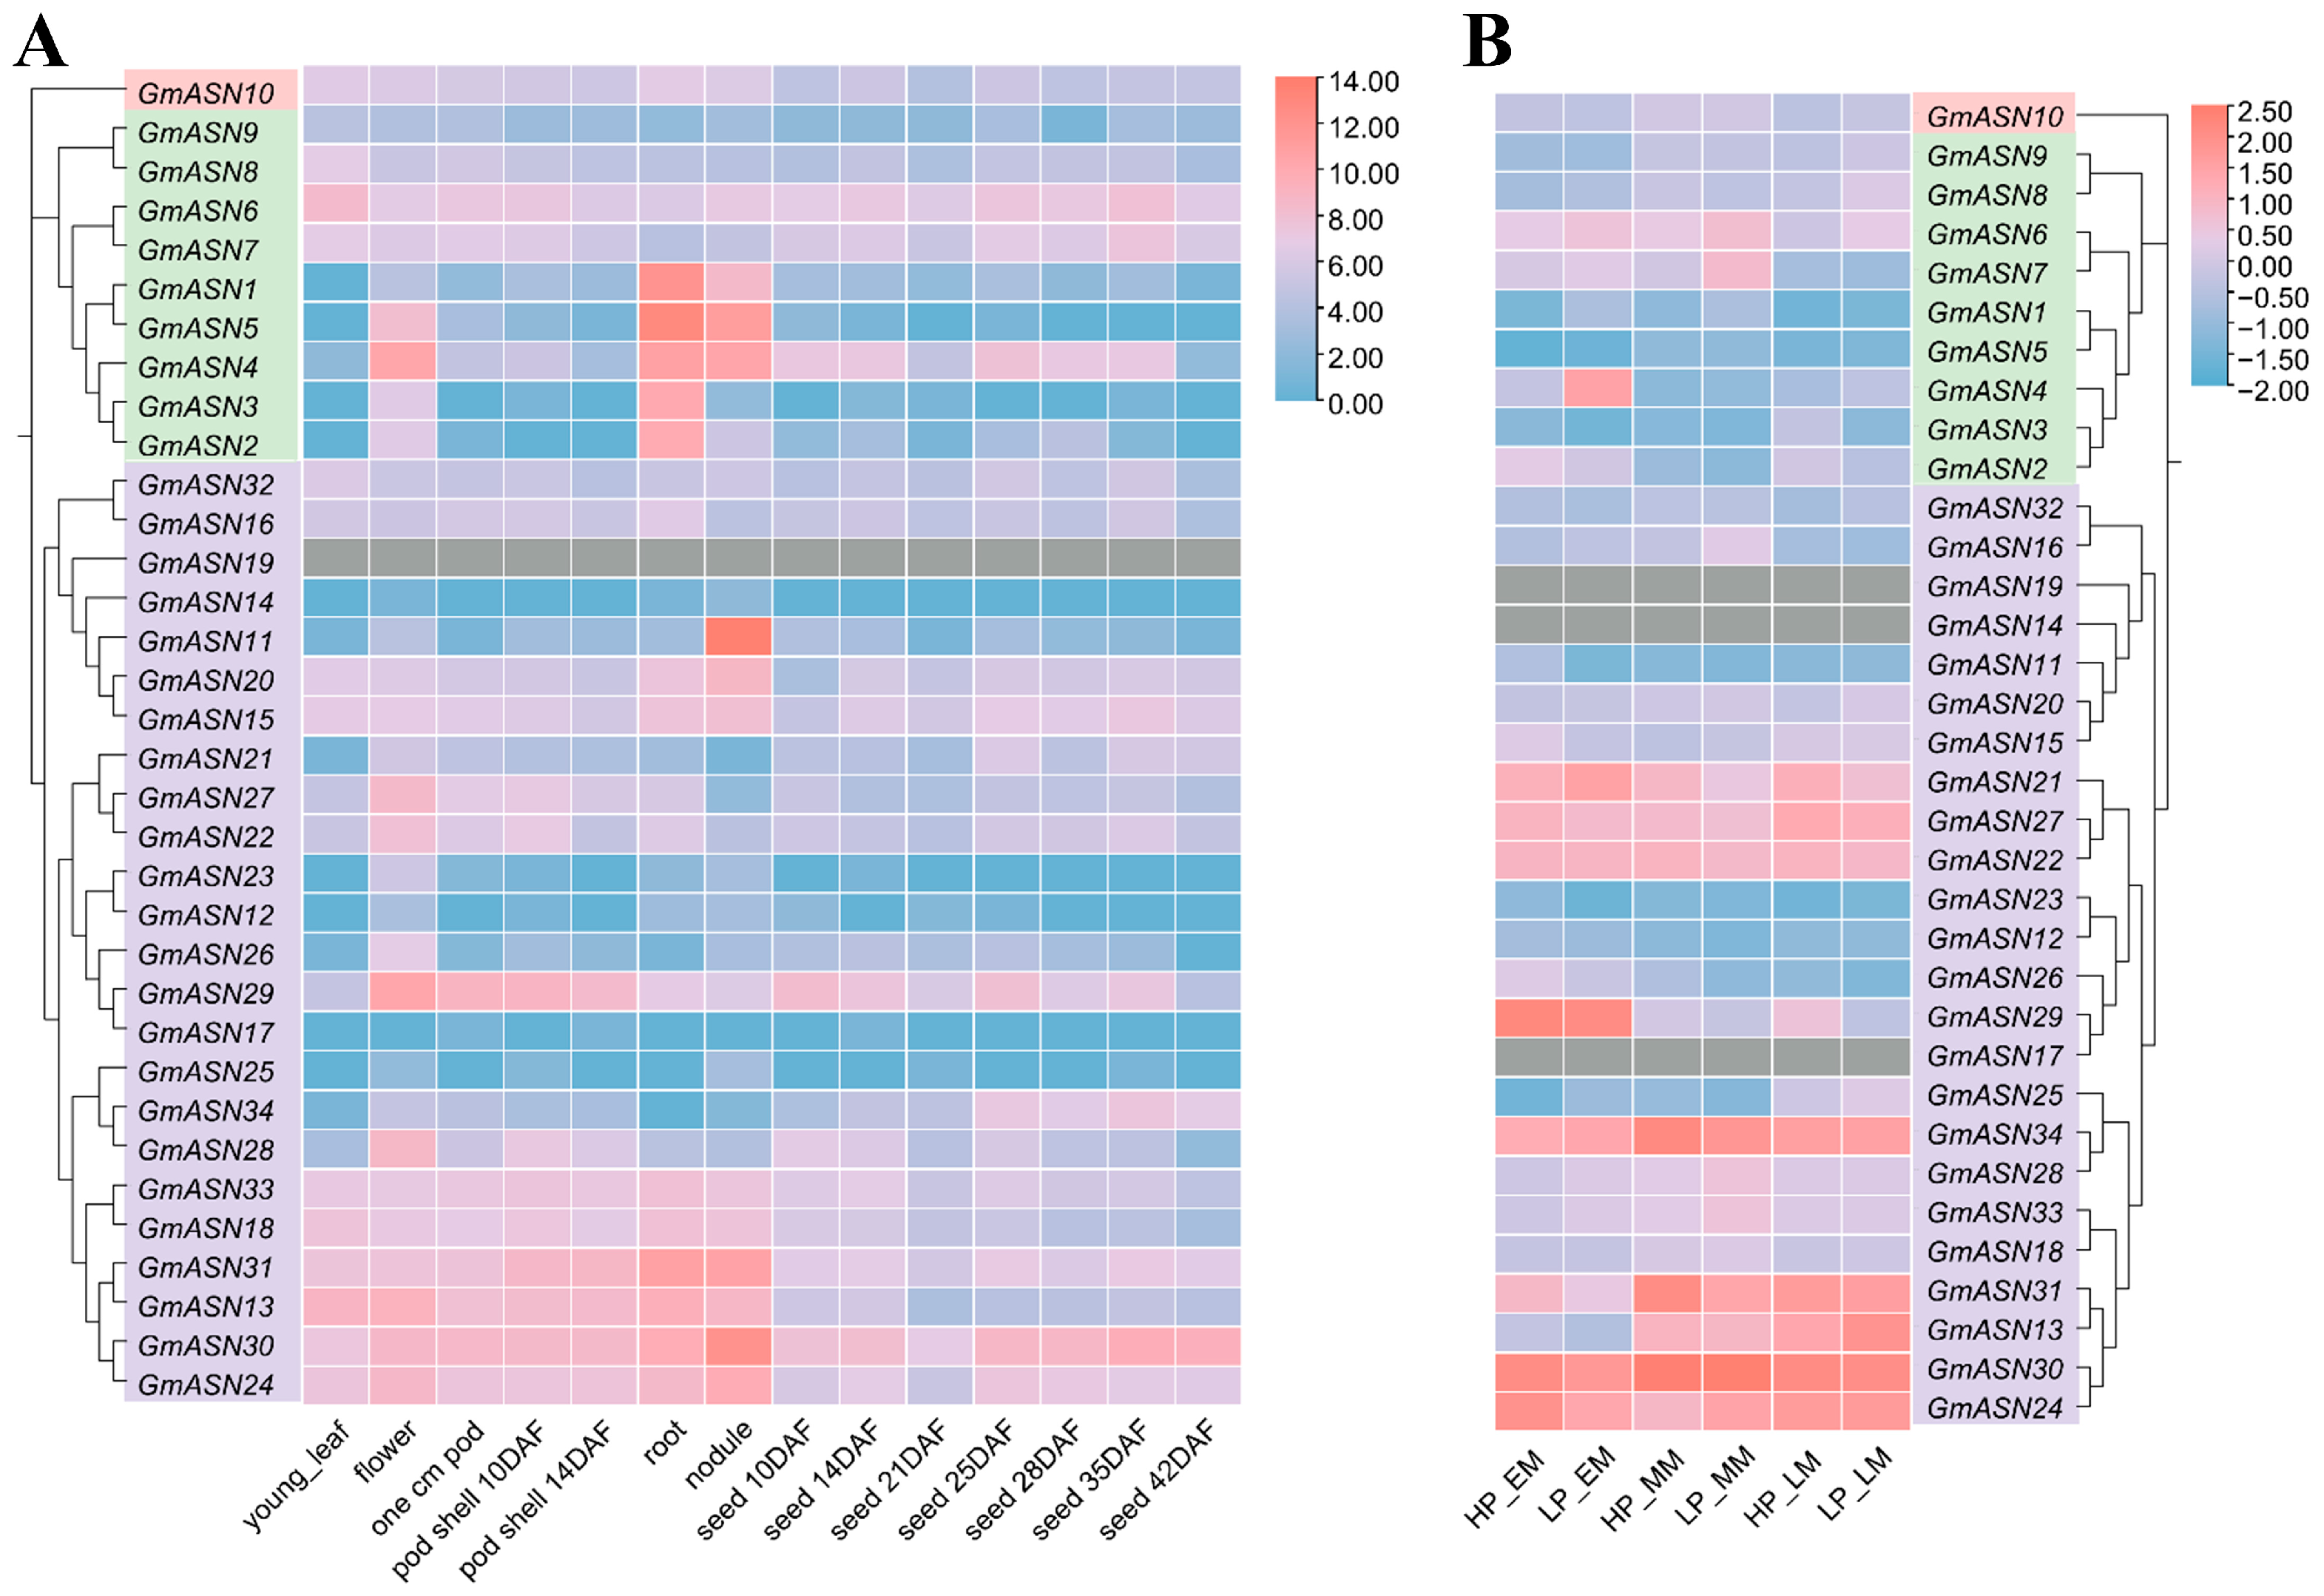
To gain insight into the biological functions of the GmASN gene superfamily, the present study systematically analyzed the expression patterns and performed clustering of GmASN members based on previously published transcriptome data of the soybean cultivar W82, which covered different tissues (roots, leaves, flowers, pods) and various developmental stages of soybean seeds (Figure 4A). The results showed that GmASN1, GmASN5, GmASN4, GmASN3, GmASN2 and GmASN31 exhibited the highest expression levels in roots, GmASN1, GmASN5, GmASN4, GmASN11, GmASN31, GmASN13, GmASN30 and GmASN24 had relatively high expression levels in root nodules, and most genes were expressed in soybean seeds (Figure 4A).
Figure 4.
Expression patterns of the GmASN superfamily genes. (A) Expression patterns of GmASN superfamily genes in different tissues. (B) Expression patterns of GmASN superfamily genes at different stages of seed development in high-protein (HP) and low-protein (LP) soybean varieties. Early Maturity (EM) stage refers to 30–50 days after flowering, Mid Seed Maturity (MM) stage refers to 50–80 days after flowering, and Late Seed Maturity (LM) stage refers to 80–110 days after flowering.
Further detection of the GmASN gene superfamily was performed to analyze the expression of each GmASN superfamily gene at different developmental stages of soybean seeds in high-protein soybean varieties (HP) and low-protein soybean varieties (LP). Results showed that most GmASNs genes exhibited higher expression levels at the early-maturation (EM) and mid-maturation (MM) stages compared with the late-maturation (LM) stage of soybean seeds, with some genes displaying relatively higher expression in the high-protein cultivar than in the low-protein cultivar (Figure 4B).
3.7. Haplotype Analysis of GmASNs
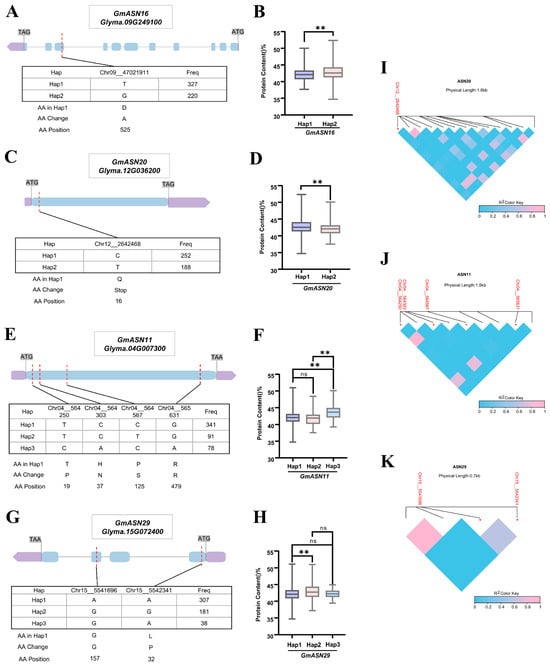
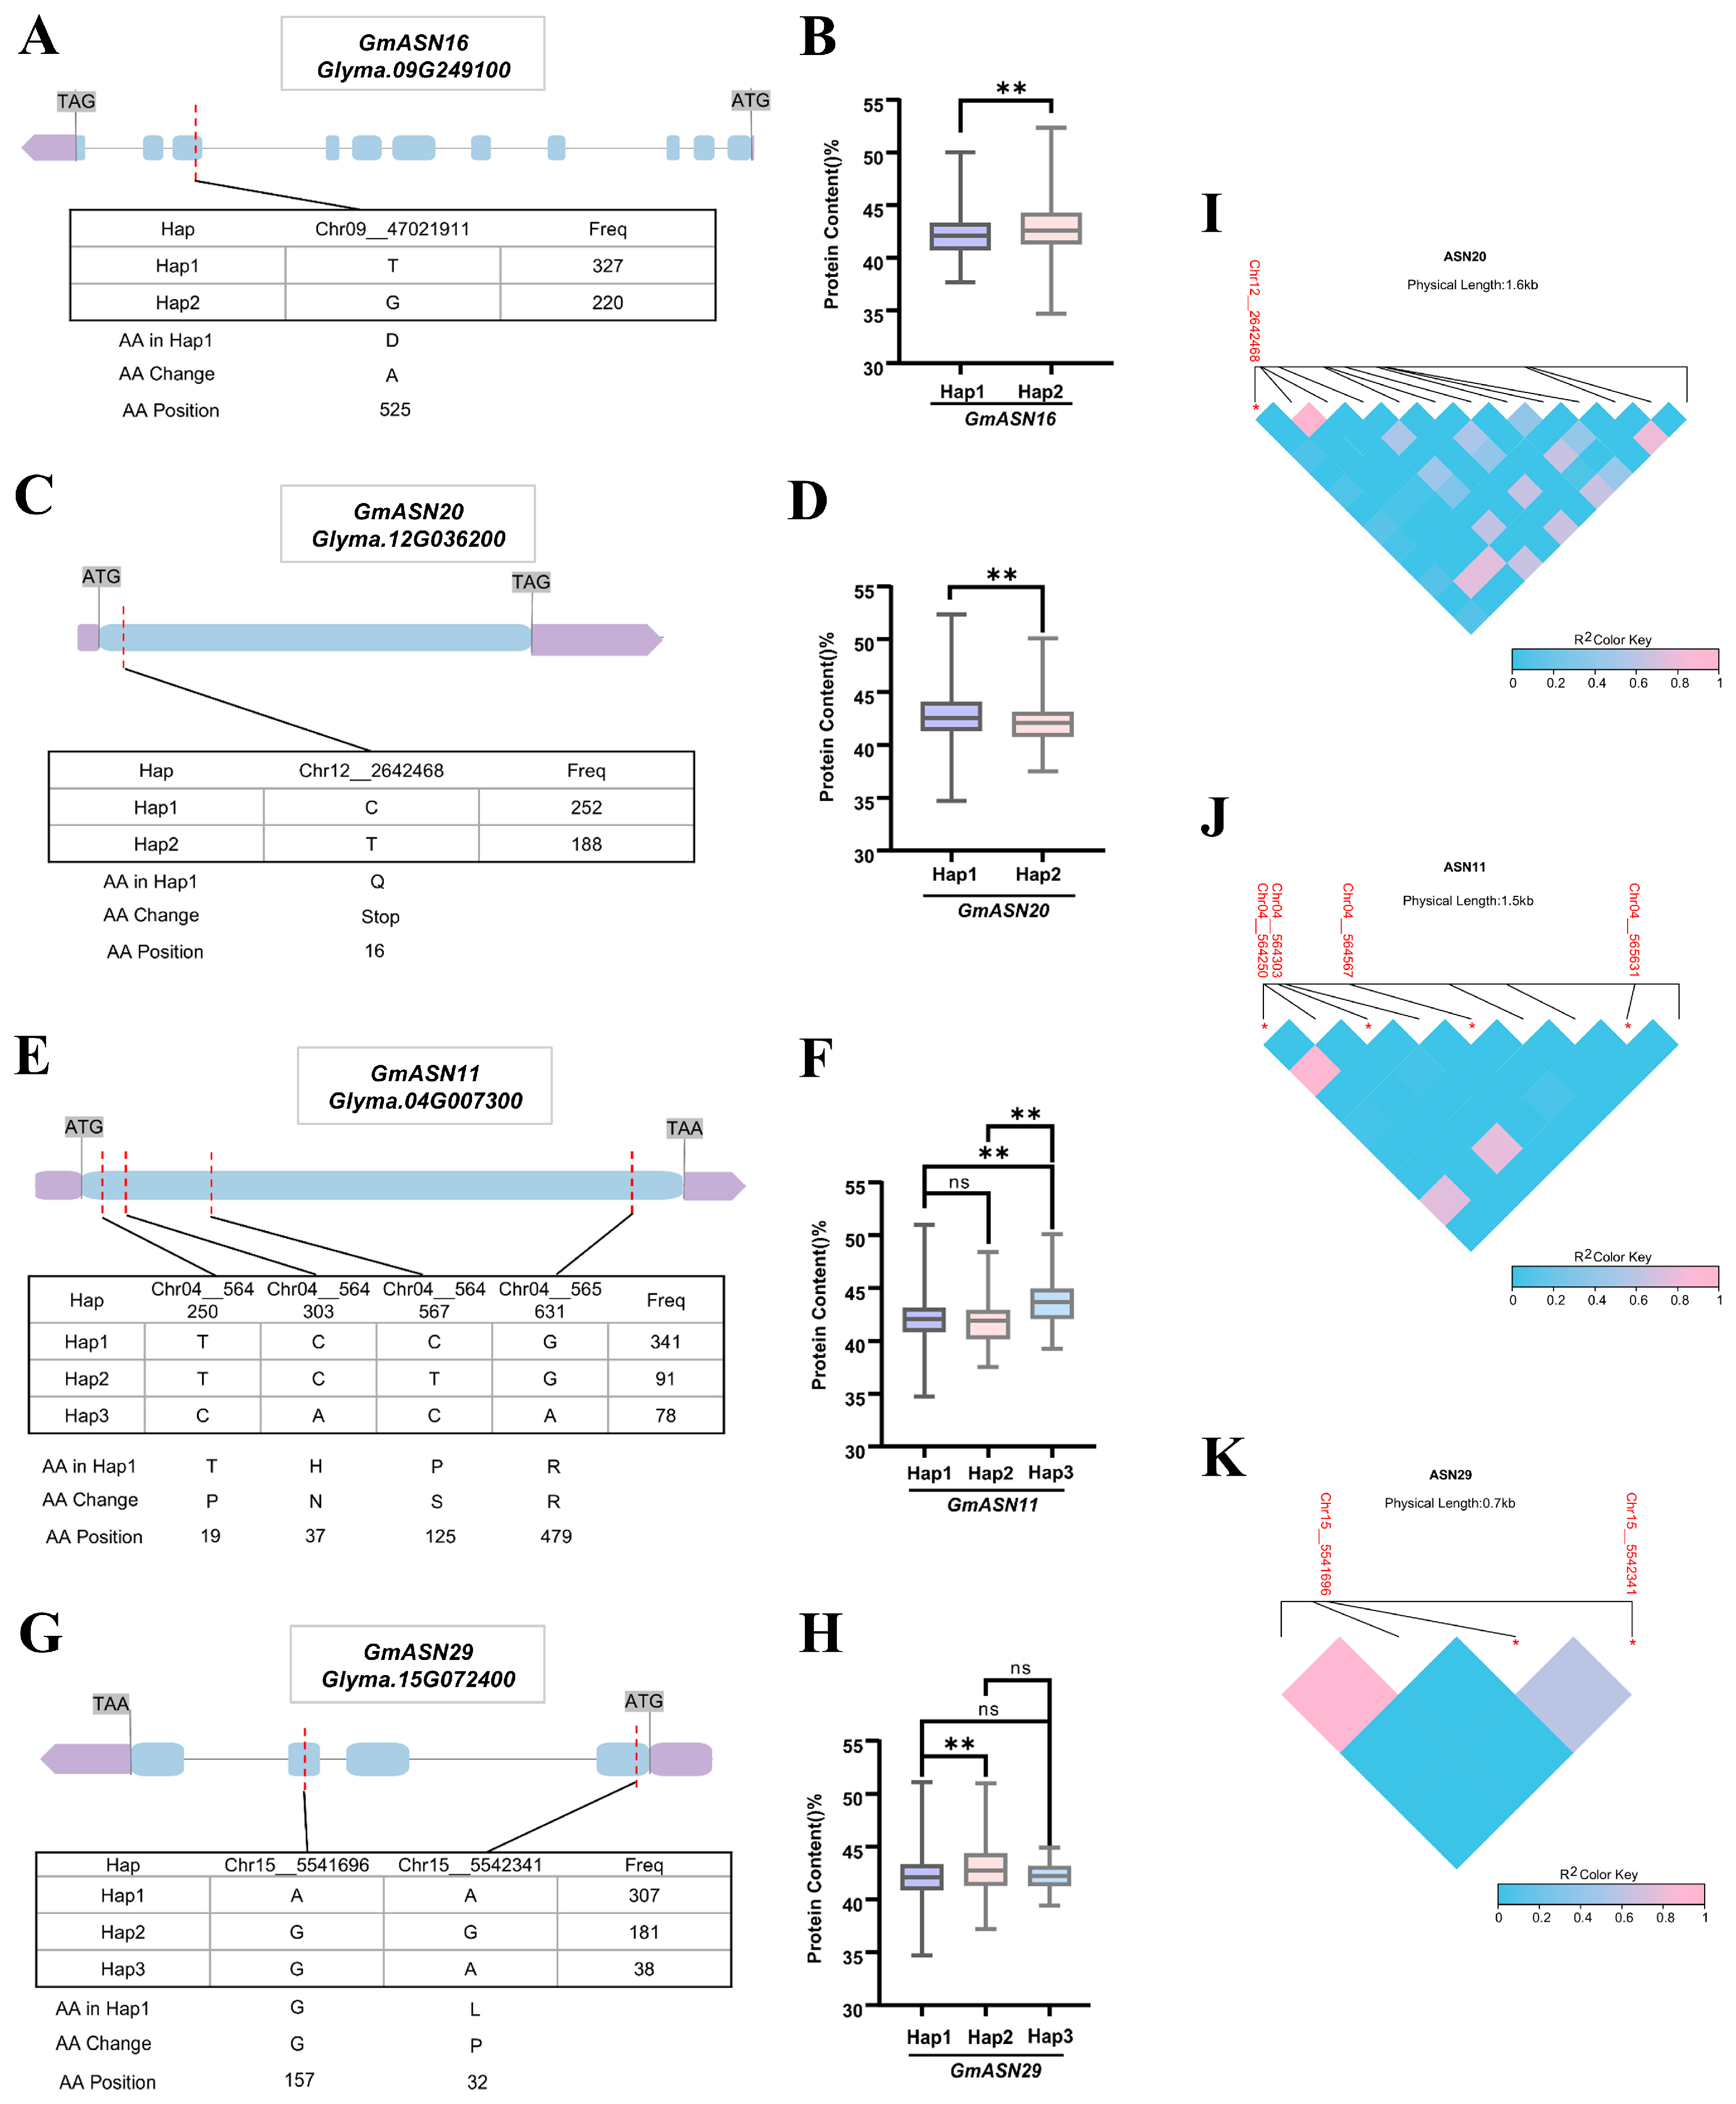
Single-nucleotide polymorphisms (SNPs) are common genetic variations that can significantly influence gene function. Using 547 soybean germplasm resources from a Northeast China core collection [30], we performed haplotype analysis of the GmASN gene superfamily. Four GmASN superfamily genes that are associated with seed protein accumulation were identified. The four candidate genes and their corresponding haplotypes exhibited distinct expression patterns and had notable effects on seed protein content (Figure 5). GmASN20 in roots is highly expressed and carries a premature termination codon at amino acid 16 in Hap2. This haplotype (GmASN20tru16) has a significantly lower seed protein content compared to Hap1 (Figure 5A,B). GmASN1, which is highly expressed in nodules, has a significant difference in seed protein content among most major haplotypes. Hap3 has an amino acid substitution at position 125, and it is linked to the highest seed protein content (Figure 5C,D). GmASN29 has a peak expression during the early seed maturation (EM) stage and carries a polymorphism at amino acid 32 (Hap2), which is linked to altered seed protein content (Figure 5E,F). For GmASN16, an amino acid change at position 525 defines Hap2, which correlates with significantly higher protein content than Hap1 (Figure 5G,H). The significant associations between major haplotypes and seed protein variation strongly suggest that certain members of this gene superfamily may be key regulators of storage protein biosynthesis and accumulation. There are no strong and extensive LD blocks in the CDS regions of the four genes (Figure 5I–K), and the regions have undergone more genetic recombination events, which may help the genes generate more haplotype diversity. It should be noted that the initial association analysis in this study did not correct for the population structure and kinship of the materials. Therefore, the observed associations between haplotypes and phenotypes may partially reflect the differences in genetic background rather than being solely the direct causal effect of the GmASN gene locus.
Figure 5.
Haplotype analysis of GmASNs members. (A) Genetic variations and haplotypes of GmASN20. (B) Variations in soybean seed storage protein levels between the two haplotypes of GmASN20. (C) Genetic variations and haplotypes of GmASN11. (D) Variations in soybean seed storage protein levels between the two haplotypes of GmASN11. (E) Genetic variations and haplotypes of GmASN29. (F) Variations in soybean seed storage protein levels among the three haplotypes of GmASN29. (G) Genetic variations and haplotypes of GmASN16. (H) Variations in soybean seed storage protein levels between the two haplotypes of GmASN16. In the gene structure diagrams, blue rectangles represent coding sequences (CDS), purple rectangles represent the 3′UTR or 5′UTR, and “AA” denotes amino acid. Between-group differences were analyzed using Student’s t-test: ** p < 0.01. (I) Linkage disequilibrium analysis of GmASN20. (J) Linkage disequilibrium analysis of GmASN11. (K) Linkage disequilibrium analysis of GmASN29. * Differential loci in the main haplotypes.
3.8. Haplotype Module Stacking Analysis
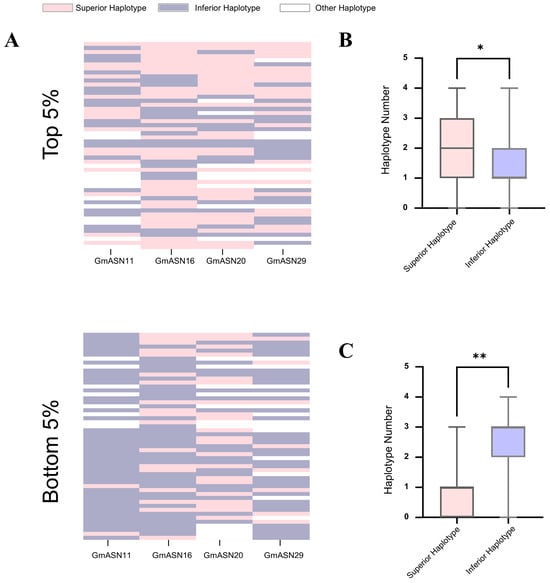
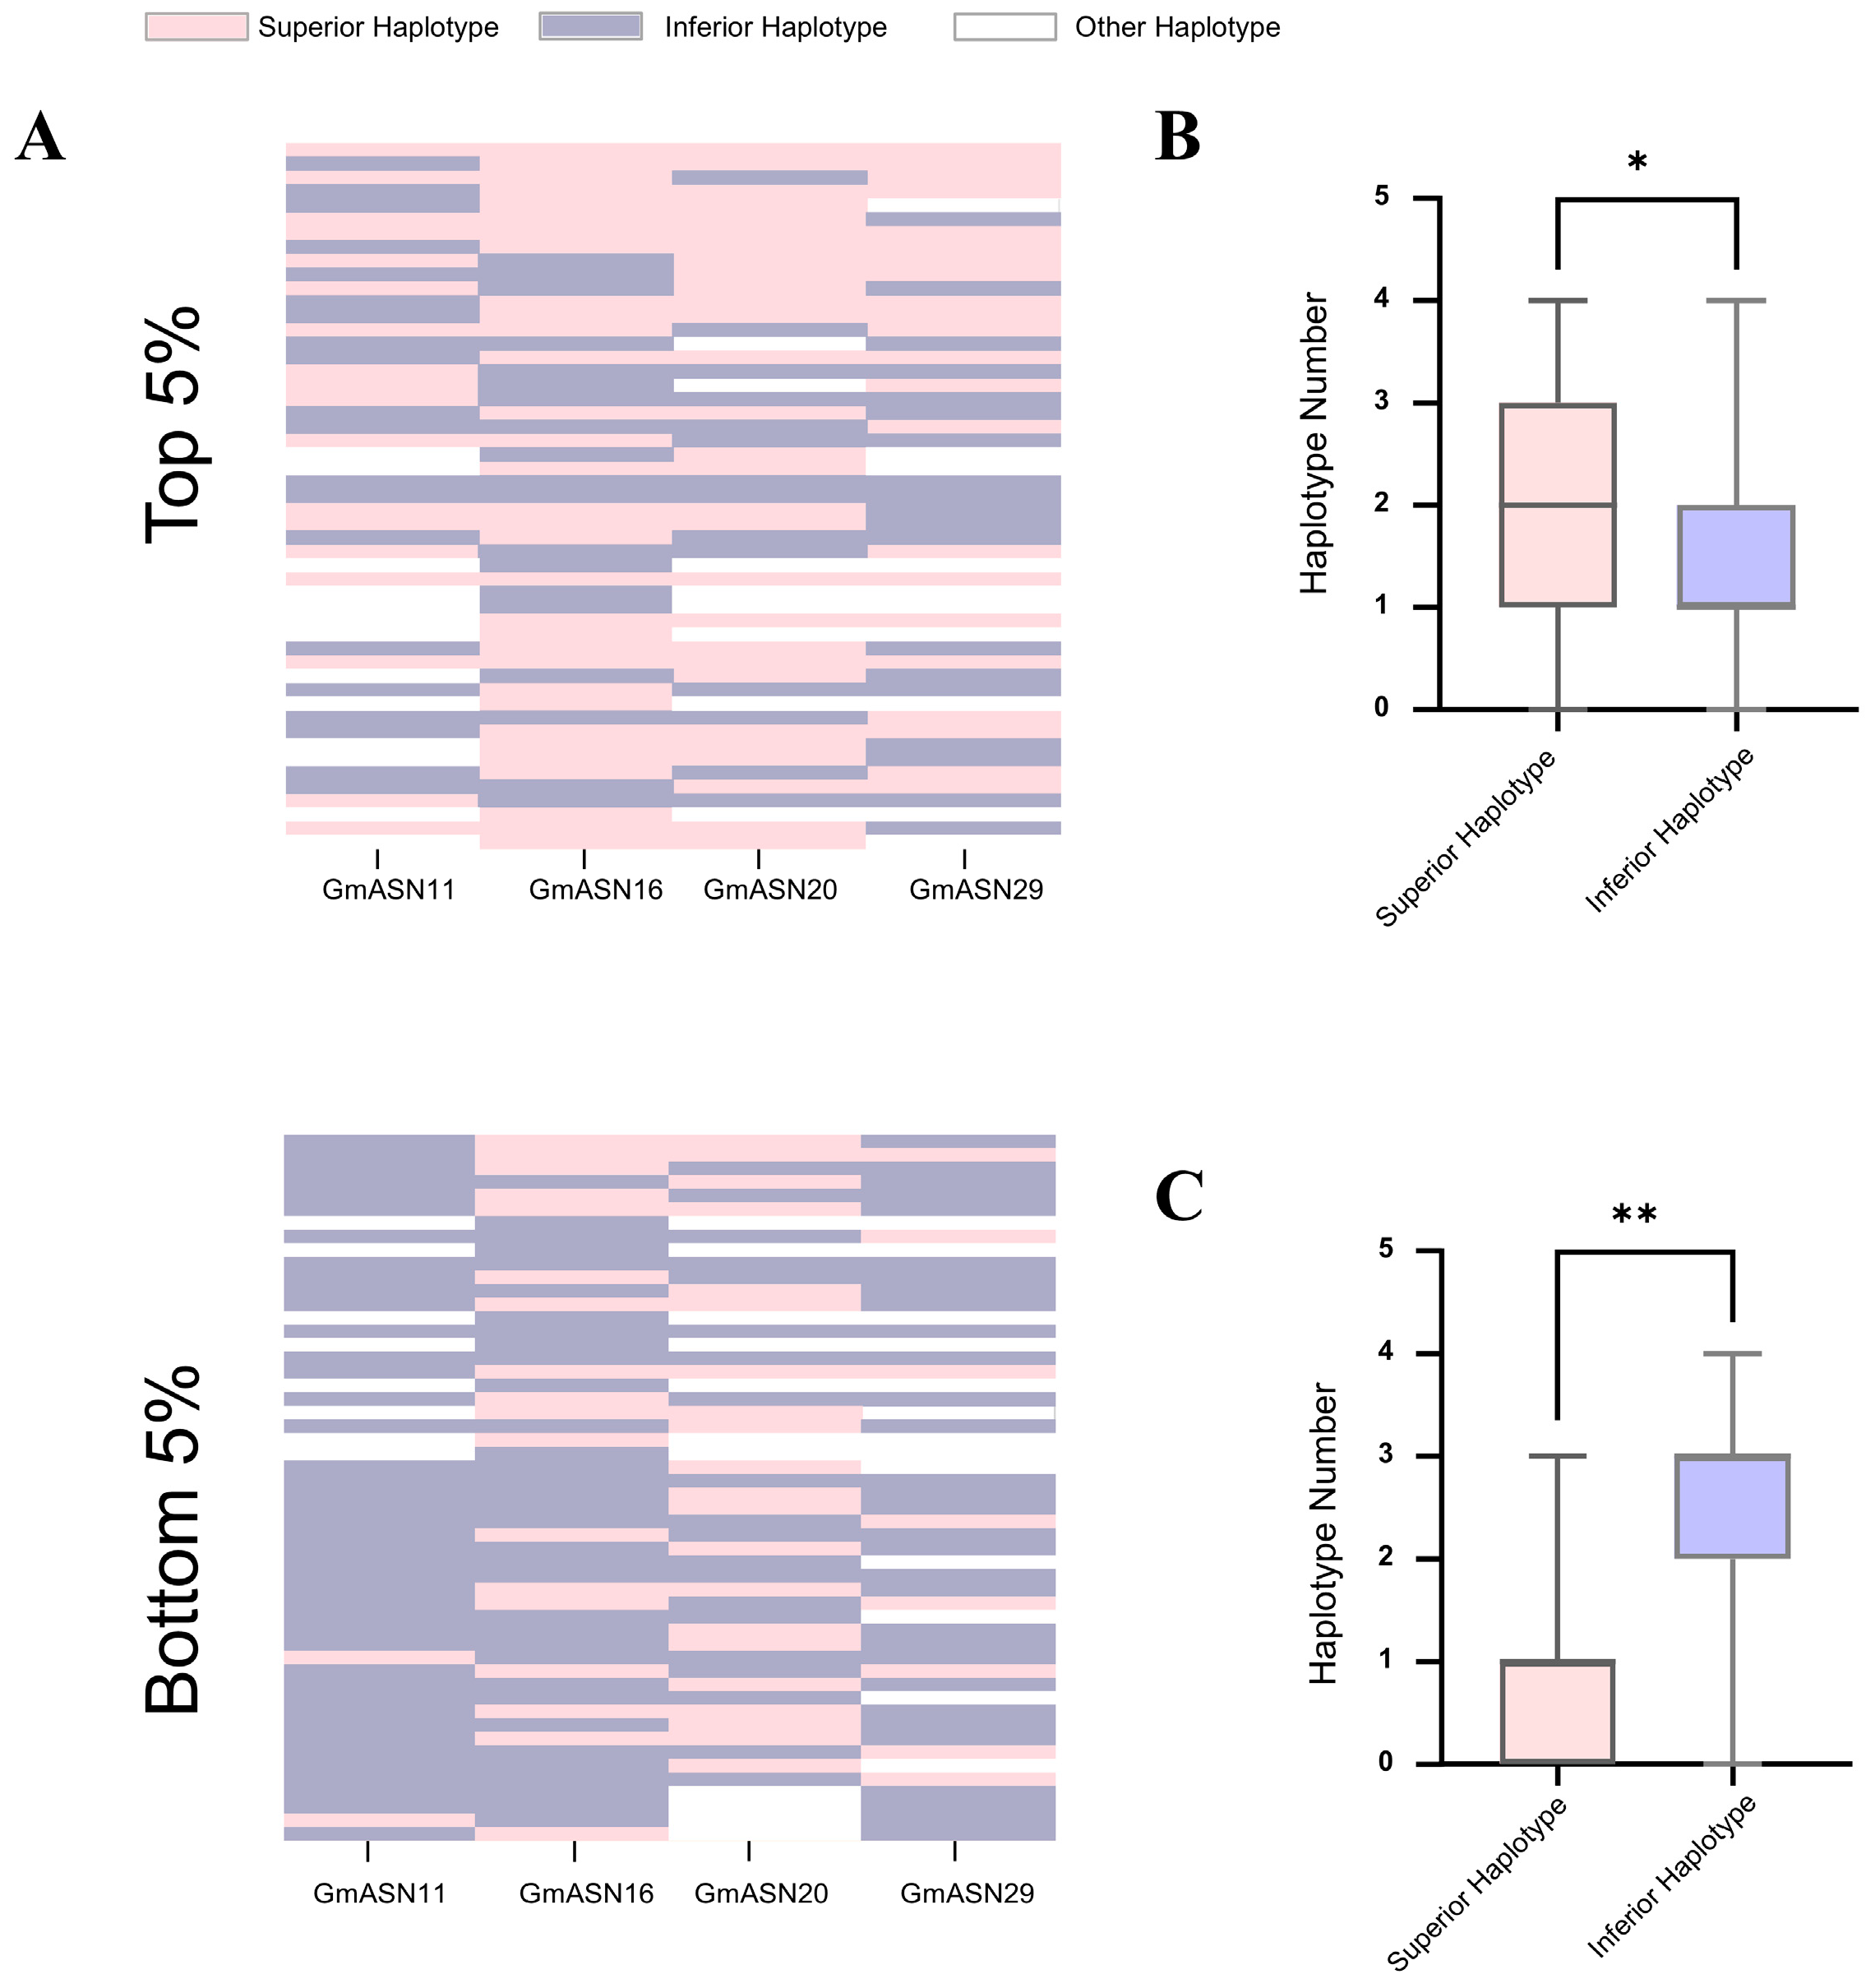
For the four previously identified GmASN superfamily members associated with soybean seed storage protein content, we classified their haplotypes as favorable or unfavorable based on SSP levels. Soybean cultivars from the top and bottom 10% of the population SSP distribution were selected for haplotype stacking analysis (Figure 6A). This analysis revealed that high-SSP germplasm carried significantly more favorable haplotypes (Figure 6B), whereas low-SSP germplasm carried significantly more unfavorable haplotypes (Figure 6C). As illustrative examples, Heikang 06-2 (CX44), which carries four unfavorable haplotypes, had an SSP content of 38.7%, while Qinggang Siliding (JL160), harboring four favorable haplotypes, exhibited an SSP content of 46.5%. These findings collectively support the possibility of a positive correlation between the accumulation of favorable GmASN haplotypes and increased seed storage protein content in soybean (Table S4).
Figure 6.
Haplotype block stacking analysis of GmASNs. (A) Analyze the haplotype blocks of GmASNs in the top 10% and bottom 10% soybean accessions. (B) The count of favorable and unfavorable haplotypes among the top 10% of germplasm accessions. (C) The count of haplotypes that are favorable and unfavorable, among the bottom 10% of germplasm accessions. ** p < 0.01, and * p < 0.05 (Student’s t-test).
4. Discussion
In plants, nitrogen storage and remobilization are key metabolic processes essential for sustaining normal growth and development throughout the life cycle [32,33,34,35]. At the molecular level, asparagine synthetase (ASN) serves as a key enzyme within this pathway. Previous studies have established that the ASN family comprises two subtypes, ASN-A and ASN-B, which share core functional domains but diverge in their structural characteristics, expression patterns, and physiological roles [6,36]. Here, we report a comprehensive genomic and evolutionary analysis of the asparagine synthetase (ASN) superfamily in soybean (Glycine max). Our findings demonstrate gene expansion and functional diversification within this family, a pattern that may reflect the unique physiological demands of soybean as a major legume crop.
A total of 34 GmASN superfamily proteins were identified in soybean, a number substantially greater than that reported for most other plant species. The GmASN superfamily exhibits functional diversity beyond a single, conserved role. Although GmASN1–GmASN7 (with two complete domains) represent the canonical enzymes, members with a single or truncated domain also hold important biological significance. These members exemplify key evolutionary trajectories within the superfamily. Some appear to have evolved into monodomain proteins with potential regulatory functions via gene duplication and functional simplification, while others may fine-tune nitrogen metabolism in an organ-specific or stress-responsive manner through altered expression patterns. This expansion resulted in three distinct clades (Figure 1A). Notably, only GmASN1 through GmASN7 within Subgroup I encode proteins that possess the complete, canonical two-domain architecture (glutaminase and synthetase domains). This conserved structural feature strongly suggests that these members function as canonical asparagine synthetases. The remaining other two members lack complete domains and may represent functionally diverged or specialized variants. In contrast, Subgroup II comprises solely GmASN10. Its distinct structural features account for its isolated phylogenetic position and are consistent with possible neofunctionalization or shifted toward non-catalytic, regulatory roles. Furthermore, the pronounced sequence divergence within Subgroup III reflects extensive structural diversification following gene duplication, a process that may have contributed to functional specialization. This lineage-specific expansion has thus furnished soybean with a more diverse repertoire of ASN-related proteins, potentially enabling more precise regulation of nitrogen metabolism. This diversity may represent a key adaptation to the high nitrogen demand associated with seed development [36].
Conserved motif analysis aligns well with the phylogenetic classification. The stark contrast between the conserved patterns in Subgroup I and the sequence variations and novel motifs in Subgroup III helps delineate their evolutionary pathways (Figure 1B). Promoter analysis (Figure 2A) revealed that all family members harbor multiple cis-regulatory elements. The abundance of light-responsive elements implies a potential key role for light signaling in the regulation of this gene family’s expression [37,38,39]. Furthermore, the co-occurrence of cis-elements linked to hormone response, abiotic stress, and development [40] supports the notion that the GmASN superfamily integrates diverse signaling inputs—including light, hormones, abiotic stresses, and developmental cues—into a precisely regulated transcriptional network, which may facilitate functional diversification.
Subcellular localization predictions suggest that most GmASN proteins are chloroplast-targeted, with a minority predicted to localize to mitochondria or the cytoplasm. Thus, the diversity in subcellular localization probably arose from functional innovation over evolutionary time. For instance, chloroplast-localized isoforms might directly link photosynthesis with nitrogen assimilation, whereas cytoplasmic isoforms could play a role in maintaining cellular amino acid homeostasis. Glutamine and asparagine are the primary amino acids involved in long-distance nitrogen transport from roots to aerial tissues [40]. In rice, glutamine is the main form of nitrogen transported in both xylem and phloem sap, but asparagine is present at lower levels though still significant [41,42,43].
All GmASN proteins are primarily composed of random coils and α-helices, and there are no β-turns. This highly conserved structural architecture implies a foundation of common conformational flexibility that could facilitate diverse functions in substrate binding and metabolic coordination. From a genomic perspective, the soybean asparagine synthetase (GmASN) superfamily exhibits an uneven chromosomal distribution (Figure 3A) and has undergone extensive segmental duplication events (Figure 3B). This pattern strongly suggests that whole-genome duplication was the primary driver behind the superfamily’s expansion. Variations in duplication frequency further indicate that genes undergoing multiple duplication events may have experienced stronger selective pressures, promoting functional diversification [44] and enhancing regulatory adaptability in soybean.
Tissue-specific expression analysis revealed distinct spatiotemporal expression patterns: GmASN1 is highly expressed in roots, GmASN11 and several other members exhibit elevated expression in nodules, while the majority of genes are transcriptionally active in developing seeds (Figure 4A,B). Based on their distinct spatiotemporal expression patterns, we hypothesize that these genes could be involved not only participate in root nitrogen assimilation and long-distance transport [45], but also in nitrogen remobilization and assimilation during seed development [46,47], thereby providing essential precursors for storage protein biosynthesis [48,49].
Haplotype analysis revealed preliminary associations between sequence variation and phenotypic traits within the GmASN superfamily genes, suggesting a potential regulatory role for these variants in seed storage protein accumulation. For example, a nonsense mutation in GmASN20 (GmASN20tru16) results in a premature termination codon, consistent with a model in which loss of function may become a limiting factor for protein accumulation (Figure 5C,D). In contrast, the missense mutations identified in GmASN11, GmASN29, and GmASN16 may fine-tune protein function by altering enzyme activity, protein stability, or protein–protein interaction interfaces (Figure 5A,B,E–H). The distribution of these functionally relevant variant sites across different members further supports the hypothesis that superfamily members might collectively regulate nitrogen assimilation and storage protein accumulation via diverse molecular mechanisms.
Most importantly, haplotype stacking analysis further provides preliminary evidence for cumulative genetic variation. The significant enrichment of favorable haplotypes of GmASN genes in high-protein germplasm in this study (Figure 6A–C) is consistent with the possibility that accumulating beneficial alleles across multiple GmASN genes could collectively enhance seed storage protein content in breeding programs [50]. We note, however, that uncorrected population structure and genetic relatedness may introduce confounding effects. This is particularly relevant for the haplotype stacking analysis, where the observed associations could be influenced by population stratification or underlying genetic structure. While this finding aligns with a polygenic model, the specific effects of these loci require validation in mutant populations with controlled genetic backgrounds for conclusive confirmation. In summary, the identified haplotypes represent high-priority candidates for functional studies. These studies aim to clarify the role of the GmASN superfamily in seed quality and to evaluate its potential for molecular breeding.
5. Conclusions
This study conducted a comprehensive analysis of the soybean GmASN superfamily, investigating 34 superfamily members, and for the first time, fully revealed its genomic composition, evolutionary characteristics, and genetic associations with seed storage protein content. Phylogenetic analysis divided it into three subgroups, which showed significant differences in conserved motif composition and gene structure. These members were unevenly distributed across 13 soybean chromosomes, and gene duplication was the main evolutionary driving force for the expansion of the superfamily. The GmASN superfamily genes exhibited differential tissue expression patterns, with GmASN11 and GmASN20 highly expressed in seeds, nodules, and other tissues. The enrichment of cis-acting elements related to light response and biotic/abiotic stress in their promoter regions indicated that this superfamily was widely involved in regulating soybean growth, development, and environmental adaptation processes. Haplotype analysis identified four key genes (including GmASN20, GmASN11, GmASN29, and GmASN16) and their putative functional haplotypes associated with seed protein content. The coding region CC/TT variation and Q/stop in GmASN20, TT/GG variation and D/A substitution in GmASN16, TT/CC, CC/AA, CC/TT variations and T/P, H/N, P/S substitutions in GmASN11, and AA/GG variation and L/P substitution in GmASN29 were identified as being associated with soybean storage protein content. The preliminary validation of haplotype additive effects using extreme phenotype germplasm revealed favorable haplotypes related to superior phenotypes and their synergistic effects. These findings advance understanding of the GmASN gene superfamily, and GmASN20, GmASN11, GmASN29, and GmASN16 are important candidate genes that warrant further functional validation and investigation of the molecular mechanisms regulating seed protein content.
Supplementary Materials
The following supporting information can be downloaded at https://www.mdpi.com/article/10.3390/agronomy16050517/s1, Table S1: Primers used for RT-qPCR validation of gene expression levels in the GmASN superfamily; Table S2: Prediction of physicochemical properties and subcellular localization of GmASNs; Table S3: Secondary structure analysis of GmASNs; Table S4: Stacking analysis of 4 GmASN members associated with soybean seed protein content based on haplotypes.
Author Contributions
Conceptualization: Z.Q. and Q.C.; resources: Z.Q., L.H. and Q.C.; methodology: Q.T., S.Z. and S.S.; project administration: Z.Q.; supervision: Z.Q. and L.H.; writing—review and editing: Q.T., S.Z., S.S. and Z.Q.; funding acquisition: Z.Q. and Q.C.; writing—original draft: Q.T. and S.Z.; data curation: Q.T., S.Z. and S.S.; formal analysis: Q.T. and S.Z.; investigation: Q.T. and S.S.; visualization: Q.T., S.Z. and S.S.; software: Q.T., S.Z. and J.H.; validation: Q.T. All authors have read and agreed to the published version of the manuscript.
Funding
This research was funded by the Natural Science Foundation of Heilongjiang Province of China (ZL2024C007), the National Natural Science Foundation of China (32472108), the Hainan Seed Industry Laboratory and China National Seed Group (B23YQ1503), and the China Agriculture Research System (CARS-04-PS15).
Data Availability Statement
The original contributions presented in this study are included in the article/Supplementary Materials. Further inquiries can be directed to the corresponding authors.
Conflicts of Interest
The authors declare no conflicts of interest.
References
- Yu, K.; Hu, L.; Sun, B.; Chen, Z.; Li, X.; Zhang, S.; Tian, H.; Zhang, W.; Ren, S.; Han, X.; et al. An α/β-Hydrolase GmABHD6 Controls Seed Oil Content and Yield in Soybean. Plant Biotechnol. J. 2025, 23, 1–13. [Google Scholar] [CrossRef] [Scilit]
- Wilson, R.F. Seed Composition. In Soybeans: Improvement, Production, and Uses, 3rd ed.; Boerma, H.R., Specht, J.E., Eds.; American Society of Agronomy, Crop Science Society of America, Soil Science Society of America: Madison, WI, USA, 2004; pp. 621–677. [Google Scholar]
- Friedman, M.; Brandon, D.L. Nutritional and health benefits of soy proteins. J. Agric. Food Chem. 2001, 49, 1069–1086. [Google Scholar] [CrossRef] [Scilit]
- Ainsworth, E.A.; Yendrek, C.R.; Skoneczka, J.A.; Long, S.P. Accelerating yield potential in soybean: Potential targets for biotechnological improvement. Plant Cell Environ. 2012, 35, 38–52. [Google Scholar] [CrossRef] [Scilit]
- Lomelino, C.L. Asparagine synthetase: Function, structure, and role in disease. J. Biol. Chem. 2017, 292, 19952–19958. [Google Scholar] [CrossRef] [Scilit]
- Larsen, T.M.; Boehlein, S.K.; Schuster, S.M.; Richards, N.G.J.; Thoden, J.B.; Holden, H.M.; Rayment, I. Three-dimensional structure of Escherichia coli asparagine synthetase B: A short journey from substrate to product. Biochemistry 1999, 38, 16146–16157. [Google Scholar] [CrossRef] [Scilit]
- Waterhouse, R.N.; Smyth, A.J.; Massonneau, A.; Prosser, I.M.; Clarkson, D.T. Molecular cloning and characterisation of asparagine synthetase from Lotus japonicus: Dynamics of asparagine synthesis in N-sufficient conditions. Plant Mol. Biol. 1996, 30, 883–897. [Google Scholar] [CrossRef] [Scilit]
- Sieciechowicz, K.; Joy, K.W.; Ireland, R.J. The metabolism of asparagine in plants. Phytochemistry 1988, 27, 663–671. [Google Scholar] [CrossRef] [Scilit]
- Lam, H.M.; Wong, P.; Chan, H.K.; Yam, K.M.; Chen, L.; Chow, C.M.; Coruzzi, G.M. Overexpression of the ASN1 gene enhances nitrogen status in seeds of Arabidopsis. Plant Physiol. 2003, 132, 926–935. [Google Scholar] [CrossRef] [Scilit] [PubMed]
- Hu, R.; Liang, K.; Hu, X.; Li, M.; Ye, Q.; Yin, Y.; Tang, C.; Wang, X.; Fu, Y.; Pan, J.; et al. Asparagine Synthetase Gene OsASN2 Is Crucial for Rice Seed Development and Germination. Plants 2025, 14, 1999. [Google Scholar] [CrossRef] [Scilit]
- Raffan, S.; Sparks, C.; Huttly, A.; Hyde, L.; Martignago, D.; Mead, A.; Hanley, S.J.; Wilkinson, P.A.; Barker, G.; Edwards, K.J.; et al. Wheat with Greatly Reduced Accumulation of Free Asparagine in the Grain, Produced by CRISPR/Cas9 Editing of Asparagine Synthetase Gene TaASN2. Plant Biotechnol. J. 2021, 19, 1602–1613. [Google Scholar] [CrossRef] [Scilit]
- Olea, F.; Pérez-García, A.; Cantón, F.R.; Rivera, M.E.; Cañas, R.; Ávila, C.; Cazorla, F.M.; Cánovas, F.M.; de Vicente, A. Up-regulation and localization of asparagine synthetase in tomato leaves infected by the bacterial pathogen Pseudomonas syringae. Plant Cell Physiol. 2004, 45, 770–780. [Google Scholar] [CrossRef] [Scilit]
- Zurbriggen, M.D.; Carrillo, N.; Tognetti, V.B.; Melzer, M.; Martin, P.; Hause, B.; Hajirezaei, M.R. Chloroplast-generated reactive oxygen species play a major role in localized cell death during the non-host interaction between tobacco and Xanthomonas campestris pv. vesicatoria. Plant J. 2009, 60, 962–973. [Google Scholar] [CrossRef] [Scilit]
- Han, J.; Wang, Y.; Xie, Y.; Li, X.; Zhang, Y.; Li, J.; Liu, K. A GmAS5 Gene for Promoting Legume Plant and Nodule Growth and Its Application. Chinese Patent CN116676325A, 26 September 2023. [Google Scholar]
- Patil, S.S.; Nadaf, A.B.; Pable, A.A.; Ahmed, S.M.; Barvkar, V.T. Heterologous Overexpression of Pandanus odorifer Asparagine Synthetase 1 (PoASN1) Confers Enhanced Salinity Tolerance in Escherichia coli and Rice. Physiol. Plant. 2024, 176, e70200. [Google Scholar] [CrossRef] [Scilit]
- Liu, C.; Tian, S.; Lv, X.; Pu, Y.; Peng, H.; Fan, G.; Ma, X.; Ma, L.; Sun, X. Nicotiana benthamiana Asparagine Synthetase Associates with IP-L and Confers Resistance Against Tobacco Mosaic Virus via the Asparagine-Induced Salicylic Acid Signalling Pathway. Mol. Plant Pathol. 2021, 22, 1548–1565. [Google Scholar] [CrossRef] [Scilit]
- Gaufichon, L.; Marmagne, A.; Belcram, K.; Yoneyama, T.; Sakakibara, Y.; Hase, T.; Grandjean, O.; Clément, G.; Citerne, S.; Boutet-Mercey, S.; et al. ASN1-Encoded Asparagine Synthetase in Floral Organs Contributes to Nitrogen Filling in Arabidopsis Seeds. Plant J. 2017, 91, 371–393. [Google Scholar] [CrossRef] [Scilit] [PubMed]
- Xu, H.; Curtis, T.Y.; Powers, S.J.; Raffan, S.; Gao, R.; Huang, J.; Heiner, M.; Gilbert, D.R.; Halford, N.G. Genomic, Biochemical, and Modeling Analyses of Asparagine Synthetases from Wheat. Front. Plant Sci. 2018, 8, 2237. [Google Scholar] [CrossRef] [Scilit] [PubMed]
- Oddy, J.; Alarcón-Reverte, R.; Wilkinson, M.; Ravet, K.; Raffan, S.; Minter, A.; Mead, A.; Elmore, J.S.; de Almeida, I.M.; Cryer, N.C.; et al. Reduced free asparagine in wheat grain resulting from a natural deletion of TaASN-B2: Investigating and exploiting diversity in the asparagine synthetase gene family to improve wheat quality. BMC Plant Biol. 2021, 21, 302. [Google Scholar] [CrossRef] [Scilit] [PubMed]
- Ohashi, M.; Ishiyama, K.; Kojima, S.; Konishi, N.; Nakano, K.; Kanno, K.; Hayakawa, T.; Yamaya, T. Asparagine synthetase1, but not asparagine synthetase2, is responsible for the biosynthesis of asparagine following the supply of ammonium to rice roots. Plant Cell Physiol. 2015, 56, 769–778. [Google Scholar] [CrossRef] [Scilit]
- Mistry, J.; Chuguransky, S.; Williams, L.; Qureshi, M.; Salazar, G.A.; Sonnhammer, E.L.L.; Tosatto, S.C.E.; Paladin, L.; Raj, S.; Richardson, L.J.; et al. Pfam: The protein families database in 2021. Nucleic Acids Res. 2021, 49, D412–D419. [Google Scholar] [CrossRef] [Scilit]
- Tamura, K.; Stecher, G.; Kumar, S. MEGA11: Molecular Evolutionary Genetics Analysis Version 11. Mol. Biol. Evol. 2021, 38, 3022–3027. [Google Scholar] [CrossRef] [Scilit]
- Xie, J.; Chen, Y.; Cai, G.; Cai, R.; Hu, Z.; Wang, H. Tree Visualization By One Table (tvBOT): A web application for visualizing, modifying and annotating phylogenetic trees. Nucleic Acids Res. 2023, 51, W587–W592. [Google Scholar] [CrossRef] [Scilit]
- Artimo, P.; Jonnalagedda, M.; Arnold, K.; Baratin, D.; Csardi, G.; De Castro, E.; Duvaud, S.; Flegel, V.; Fortier, A.; Gasteiger, E. ExPASy: SIB bioinformatics resource portal. Nucleic Acids Res. 2012, 40, W597–W603. [Google Scholar] [CrossRef] [Scilit]
- Chou, K.-C.; Shen, H.-B. Cell-PLoc 2.0: An improved package of web-servers for predicting subcellular localization of proteins in various organisms. Nat. Sci. 2010, 2, 1090–1103. [Google Scholar] [CrossRef]
- Bailey, T.L.; Johnson, J.; Grant, C.E.; Noble, W.S. The MEME suite. Nucleic Acids Res. 2015, 43, W39–W49. [Google Scholar] [CrossRef] [Scilit]
- Chen, C.; Wu, Y.; Li, J.; Wang, X.; Zeng, Z.; Xu, J.; Liu, Y.; Feng, J.; Chen, H.; He, Y.; et al. TBtools-II: A “one for all, all for one” bioinformatics platform for biological big-data mining. Mol. Plant 2023, 16, 1733–1742. [Google Scholar] [CrossRef] [Scilit]
- Gao, H.; Wang, Y.; Li, W.; Gu, Y.; Lai, Y.; Bi, Y.; He, C. Transcriptomic comparison reveals genetic variation potentially underlying seed developmental evolution of soybeans. J. Exp. Bot. 2018, 69, 5089–5104. [Google Scholar] [CrossRef] [Scilit]
- Wen, Z.; Ding, Y.; Zhao, T.; Gai, J. Genetic diversity and peculiarity of annual wild soybean (G. soja Sieb. et Zucc.) from various eco-regions in China. Theor. Appl. Genet. 2009, 119, 371–381. [Google Scholar] [CrossRef] [Scilit]
- Qi, Z.; Guo, C.; Li, H.; Qiu, H.; Li, H.; Jong, C.; Yu, G.; Zhang, Y.; Hu, L.; Wu, X. Natural variation in Fatty Acid 9 is a determinant of fatty acid and protein content. Plant Biotechnol. J. 2024, 22, 759–773. [Google Scholar] [CrossRef] [Scilit] [PubMed]
- Purcell, S.; Neale, B.; Todd-Brown, K.; Thomas, L.; Ferreira, M.A.; Bender, D.; Maller, J.; Sklar, P.; de Bakker, P.I.; Daly, M.J.; et al. PLINK: A tool set for whole-genome association and population-based linkage analyses. Am. J. Hum. Genet. 2007, 81, 559–575. [Google Scholar] [CrossRef] [Scilit] [PubMed]
- Hwang, I.S.; An, S.H.; Hwang, B.K. Pepper asparagine synthetase 1 (CaAS1) is required for plant nitrogen assimilation and defense responses to microbial pathogens. Plant J. 2011, 67, 749–762. [Google Scholar] [CrossRef] [Scilit] [PubMed]
- Iqbal, A.; Dong, Q.; Wang, Z.; Wang, X.; Gui, H.; Zhang, H.; Pang, N.; Zhang, X.; Song, M. Growth and nitrogen metabolism are associated with nitrogen-use efficiency in cotton genotypes. Plant Physiol. Biochem. 2020, 149, 61–74. [Google Scholar] [CrossRef] [Scilit] [PubMed]
- Iqbal, A.; Dong, Q.; Wang, X.; Gui, H.; Zhang, H.; Zhang, X.; Song, M. Variations in nitrogen metabolism are closely linked with nitrogen uptake and utilization efficiency in cotton genotypes under various nitrogen supplies. Plants 2020, 9, 250. [Google Scholar] [CrossRef] [Scilit]
- Iqbal, A.; Dong, Q.; Wang, X.; Gui, H.; Zhang, H.; Zhang, X.; Song, M. Transcriptome Analysis Reveals Differences in Key Genes and Pathways Regulating Carbon and Nitrogen Metabolism in Cotton Genotypes under N Starvation and Resupply. Int. J. Mol. Sci. 2020, 21, 1500. [Google Scholar] [CrossRef] [Scilit]
- Lam, H.M.; Hsieh, M.H.; Coruzzi, G. Reciprocal regulation of distinct asparagine synthetase genes by light and metabolites in Arabidopsis thaliana. Plant J. 1998, 16, 345–353. [Google Scholar] [CrossRef] [Scilit]
- Lam, H.M.; Peng, S.S.Y.; Coruzzi, G.M. Metabolic regulation of the gene encoding glutamine-dependent asparagine synthetase in Arabidopsis thaliana. Plant Physiol. 1994, 106, 1347–1357. [Google Scholar] [CrossRef] [Scilit]
- Gomez-Cadenas, A.; Zentella, R.; Walker-Simmons, M.K.; Ho, T.H.D. Gibberellin/abscisic acid antagonism in barley aleurone cells: Site of action of the protein kinase PKABA1 in relation to gibberellin signaling molecules. Plant Cell 2001, 13, 667–679. [Google Scholar] [CrossRef] [Scilit]
- Herrera-Rodriguez, M.B.; Maldonado, J.M.; Pérez-Vicente, R. Role of asparagine and asparagine synthetase genes in sunflower (Helianthus annuus) germination and natural senescence. J. Plant Physiol. 2006, 163, 1061–1070. [Google Scholar] [CrossRef] [Scilit]
- Stöhr, C. Nitric oxide—A product of plant nitrogen metabolism. Plant Cell Monogr. 2007, 5, 15–34. [Google Scholar]
- Lea, P.J.; Sodek, L.; Parry, M.A.J.; Shewry, R.; Halford, N.G. Asparagine in plants. Ann. Appl. Biol. 2007, 150, 1–26. [Google Scholar] [CrossRef] [Scilit]
- Luo, L.; Qin, R.; Liu, T.; Yu, M.; Yang, T.; Xu, G. OsASN1 plays a critical role in asparagine-dependent rice development. Int. J. Mol. Sci. 2018, 20, 130. [Google Scholar] [CrossRef] [Scilit] [PubMed]
- Hayashi, H.; Chino, M. Chemical-Composition of Phloem Sap from the Uppermost Internode of the Rice Plant. Plant Cell Physiol. 1990, 31, 247–251. [Google Scholar]
- Noree, C.; Sirinonthanawech, N.; Wilhelm, J.E. Saccharomyces cerevisiae ASN1 and ASN2 Are Asparagine Synthetase Paralogs That Have Diverged in Their Ability to Polymerize in Response to Nutrient Stress. Sci. Rep. 2019, 9, 278. [Google Scholar] [CrossRef] [Scilit]
- Fujihara, S.; Yamaguchi, M. Asparagine formation in soybean nodules. Plant Physiol. 1980, 66, 139–141. [Google Scholar] [CrossRef] [Scilit] [PubMed]
- Hu, B.; Wang, W.; Chen, J.; Liu, Y.; Chu, C. Genetic Improvement toward Nitrogen-Use Efficiency in Rice: Lessons and Perspectives. Mol. Plant 2023, 16, 64–74. [Google Scholar] [CrossRef] [Scilit]
- Liu, Y.; Chu, C. Improving Maize Seed Protein Content and Nitrogen-Use Efficiency by a Teosinte Asparagine Synthetase. Mol. Plant 2023, 16, 497–499. [Google Scholar] [CrossRef] [Scilit]
- Xie, Y.; Nan, Y.; Atif, A.; Shi, D.; Tian, H.; Hui, J.; Zhang, Y.; Jones, A.M.; Gao, Y. Enhancing seed yield and nitrogen use efficiency of Brassica napus L. under low nitrogen by overexpression of G-proteins from Arabidopsis. J. Exp. Bot. 2025, 76, 3954–3971. [Google Scholar] [CrossRef] [Scilit]
- Skokut, T.A.; Varner, J.E.; Schaefer, J.; Stejskal, E.O.; McKay, R.A. [15N]NMR determination of asparagine and glutamine nitrogen utilization for synthesis of storage protein in developing cotyledons of soybean in culture. Plant Physiol. 1982, 69, 308–313. [Google Scholar] [CrossRef] [Scilit]
- Tian, H.; Yin, Y.; Li, X.; Zhang, Z.; Feng, S.; Jin, S.; Han, X.; Yang, M.; Xu, C.; Hu, L. Identification of HSSP1 as a regulator of soybean protein content through QTL analysis and Soy-SPCC network. Plant Biotechnol. J. 2025, 23, 2673–2688. [Google Scholar] [CrossRef] [Scilit]
Disclaimer/Publisher’s Note: The statements, opinions and data contained in all publications are solely those of the individual author(s) and contributor(s) and not of MDPI and/or the editor(s). MDPI and/or the editor(s) disclaim responsibility for any injury to people or property resulting from any ideas, methods, instructions or products referred to in the content. |
© 2026 by the authors. Licensee MDPI, Basel, Switzerland. This article is an open access article distributed under the terms and conditions of the Creative Commons Attribution (CC BY) license.