


Abstract
The selection of superior maize genotypes is complex due to the quantitative and intercorrelated nature of agronomic traits and their strong environmental influence, which limits the efficiency of direct selection and requires multivariate approaches. This study aimed to compare the efficiency of seven selection indices in identifying superior maize hybrids, quantify the genetic gains provided by each method, and evaluate the agreement among indices in genotype classification under Brazilian Cerrado conditions. Seventy-three maize genotypes were evaluated across multiple environments, considering grain yield and lodging resistance as primary traits and plant health, earliness, plant height, and ear height as secondary traits. The evaluated indices included direct and indirect selection, the Smith–Hazel classical index, the desired genetic gains of Pesek and Baker, the weight- and parameter-free index of Elston, the multiplicative index, the rank sum index of Mulamba and Mock, and the Genotype–Ideotype index. The results revealed differences in efficiency among methods for simultaneous trait selection. The Elston, Mulamba and Mock index and the Genotype–Ideotype index provided a better balance between productivity and other agronomic traits, resulting in more balanced genetic gains. In contrast, the Pesek and Baker and multiplicative indices were less efficient for joint selection, while direct selection and the Smith–Hazel index were more effective when applied to isolated traits. Overall, the combined use of indices improved selection reliability and enabled the identification of superior and more stable genotypes for the Cerrado.
1. Introduction
The selection of superior genotypes is highly complex because many agronomic traits of greater economic relevance are quantitative in nature, controlled by multiple loci, influenced by the environment, and often correlated with each other. This complexity hinders direct selection and requires multivariate and predictive approaches to maximize genetic gains [1,2,3,4]. Thus, promising genotypes must simultaneously combine a set of favorable attributes that increase yield and meet market requirements [5,6].
In maize (Zea mays), in addition to high grain productivity, phenotypic characteristics such as reduced plant height, small tassels, prolificacy, precocity, vigorous stalks, adequate ear insertion and formation, lodging tolerance, grain quality, resistance to pests and diseases, tolerance to drought and low temperatures, adaptation to natural and artificial irrigation, good general and specific combining ability, heterotic vigor, low nutritional requirements, and adequate developmental homeostasis are highly desirable [7,8,9,10,11,12].
The simultaneous selection of economically important traits increases the efficiency and likelihood of success of genetic improvement programs, especially when multi-trait selection methods or selection indices are used to maximize aggregate genetic gain [13,14,15].
In this context, selection indices are multivariate tools that integrate information from multiple agronomic traits with the genetic parameters of the evaluated population. These indices generate numerical values that function as an additional theoretical trait resulting from the combination of selected traits defined by the breeder, in which simultaneous selection is desired [16,17,18]. Several indices have been proposed in the literature, each based on different methodologies and, consequently, presenting distinct potentials for genetic gain.
The first parametric index was proposed by Smith [19] and later refined by Hazel [20]. This method uses genotypic and phenotypic variance–covariance matrices and requires the assignment of economic weights to the evaluated traits. Another parametric index, proposed by Pesek and Baker [21] and known as the desired genetic gains index, allows the establishment of target gains for each trait without the need to define relative economic weights. In this approach, the index results in the maximization of gains for each trait according to the relative importance assumed by the breeder when defining the desired gains, subject to the phenotypic and genotypic structure of the population.
Among the non-parametric indices, the Elston index [22] stands out for allowing the definition of minimum critical values, below which genotypes are discarded, making it useful in both the early and final stages of breeding programs. The multiplicative index proposed by Subandi et al. [23] allows the selection of approximately the same genotypes that would be obtained using a linear index, with the advantage of not requiring the assignment of economic weights or the estimation of variances and covariances, thereby facilitating its practical application compared with linear or parametric indices [17,24,25].
Another widely used method is the sum of ranks index developed by Mulamba and Mock [26], which ranks genotypes for each trait according to the desired direction of improvement, assigning better ranks to superior performances. The genotype–ideotype index [27], in turn, is obtained from adjusted phenotypic means and the Euclidean distance between each genotype and an ideal genotype. These indices are subsequently standardized and weighted according to the weights assigned to each trait. Each method presents specific advantages and may result in divergent genotype rankings, especially when applied to large populations evaluated under contrasting environmental conditions.
Although these indices are widely described in the literature, few studies have comparatively evaluated their practical efficiency when applied simultaneously to large populations of experimental maize hybrids grown under real field conditions in the Brazilian Cerrado. This approach is particularly relevant in the early stages of Value for Cultivation and Use (VCU) trials, in which screening efficiency and reliability in identifying superior genotypes are critical for advancing promising materials. Genotypes that outperform commercial hybrids may subsequently be recommended for registration and commercial release.
Therefore, the objective of this study was to compare the selection results obtained using parametric and non-parametric selection indices under Brazilian Cerrado conditions, focusing on grain yield and lodging resistance as primary traits in order to support informed decision-making in early-stage maize breeding. Additionally, the efficiency of seven selection indices was evaluated in terms of selection gains for different agronomic traits and the degree of agreement among indices regarding genotype classification.
2. Materials and Methods
2.1. Experimental Area
The study was conducted at four locations during the second harvest of 2018 in the Brazilian Cerrado region. The experiments were established at Fazenda Rosseto, in Sorriso (SOR1), Mato Grosso (12°52′ S, 55°49′ W; 398 m altitude), with sowing on 2 February 2018; at Fazenda Santa Rita, in Primavera do Leste (PVE1), Mato Grosso (15°28′ S, 54°09′ W; 630 m altitude), with sowing on 30 January 2018; at Fazenda Feijó, in Canarana (CAN1), Mato Grosso (13°35′ S, 52°21′ W; 344 m altitude), with sowing on 14 February 2018; and at Casa Fértil Farm, in Rio Verde (RVE1), Goiás (17°43′ S, 50°58′ W; 825 m altitude), with sowing on 20 February 2018.
Information on average temperature, precipitation, and global radiation at the experimental sites was obtained from weather stations located near the trial areas. The prevailing climate of the Cerrado biome is tropical seasonal, characterized by rainy summers and dry winters. Average annual temperatures range from 22 to 23 °C, with absolute maximum temperatures exceeding 40 °C [28]. The soils of the experimental areas are typical of the Cerrado, predominantly Latosols, characterized as deep, well-drained, and medium- to clay-textured, with low natural fertility [29]. This edaphoclimatic variability among sites contributes to the environmental heterogeneity observed in the trials and allows a more comprehensive assessment of hybrid performance.
2.2. Agricultural Treatments
The experimental plots consisted of four rows spaced 0.5 m apart and 5 m long, totaling 10 m2, with the two central rows considered the usable area. The experiments were planted manually using seed drills after mechanical furrowing of the soil by the planter. Approximately 15 days after plant emergence, thinning was performed to standardize the number of plants per plot, resulting in a final density of 60,000 plants ha−1.
All seeds were treated with two insecticides at the doses recommended by the manufacturer, one belonging to the neonicotinoid class and the other to the diamide class, to control early-season pests such as stink bugs and caterpillars. Fertilization and crop management practices followed the technical recommendations for maize cultivation [30]. Fungicides were not applied at any of the sites due to the low incidence of leaf diseases.
2.3. Data Acquisition
Two primary traits were evaluated: grain yield (GY), expressed in kg ha−1, and lodging resistance (LODG). Lodging resistance was determined as the percentage of lodged plants per plot. These data were transformed using the arcsine square-root transformation for use in the selection indices and were considered in the direction of decrease, as lodging is an undesirable trait.
In addition, four secondary traits were evaluated: general health of each hybrid (HEALTH), assessed on a scale from 1 to 10, where values equal to or close to 1 indicate high plant health and values closer to 10 indicate lower health; earliness (EAR), measured as the number of days from sowing to flowering; plant height (PH), measured in centimeters from the soil surface to the insertion of the last leaf; and ear height (EH), measured from the soil surface to the insertion node of the main ear. All secondary traits were evaluated using a decreasing desirability scale, in which lower values are preferred.
Health assessments were conducted approximately 30 days after flowering, between phenological stages R3 (milk stage) and R4 (dough stage), during the grain-filling period, which represents the phase of greatest assimilate demand by the crop. A scale from 1 to 9 was used to represent the percentage of leaf area affected, with higher scores indicating greater disease severity [31].
In general, plant health is considered an important trait in maize genotype selection. However, due to second-harvest conditions and the unfavorable year for disease development and occurrence, this trait was evaluated as a secondary characteristic in the present study.
2.4. Selection Indices
Seven parametric and non-parametric selection indices were used for genotype selection: the Classic Index of Smith [19] and Hazel [20], Direct and Indirect Selection, the Desired Genetic Gains Index of Pesek and Baker [21], Elston’s Weight-Free and Parameter-Free Index [22], the Multiplicative Index proposed by Subandi et al. [23], the Sum of Ranks Index of Mulamba and Mock [26], and the Genotype–Ideotype Distance Index [27].
For the Classic Smith–Hazel index [19,20], only the grain yield (GY) trait was considered, due to the impossibility of altering the selection direction of the traits involved.
In the Direct and Indirect Selection approach, an increasing selection direction was adopted for GY, whereas a decreasing direction was applied for the remaining traits. Genotypes were ranked individually for each trait, and ten genotypes were selected per trait using this method.
For the Pesek and Baker index [21], desired gains were defined based on the genotypic standard deviation. For GY, due to its greater importance, a desired gain equivalent to twice the genotypic standard deviation was assigned. For LODG and HEALTH, the desired gain was set equal to the genotypic standard deviation. The traits EAR, PH, and EH were considered secondary in this index, with no weight assigned and, consequently, no influence on the selection process.
In the Elston index [22], minimum threshold values were established based on agronomic criteria and the relative performance of the evaluated genotypes to define a selection intensity consistent with the objectives of the study. The minimum grain yield threshold was set at 5600 kg ha−1, representing a value above the mean of the evaluated hybrids and compatible with the performance of commercial controls. A lodging threshold of less than 10% was adopted, reflecting levels considered acceptable in breeding programs due to their association with yield losses and harvesting difficulties. For plant health, a score below 3.5 was adopted, corresponding to approximately 20% of leaf area affected, which is consistent with the low disease pressure observed across the four locations.
For precocity, plant height, and ear height, values lower than the maximum observed were adopted to avoid the selection of extreme genotypes and to favor materials with more balanced agronomic performance. The adoption of these criteria enabled the retention of approximately ten genotypes, ensuring a consistent selection intensity aligned with the VCU stage of the breeding program.
In the Multiplicative Index, a direct relationship was applied only for GY, while an inverse relationship was applied for the remaining traits.
The economic weights used in the Mulamba and Mock [26] and Genotype–Ideotype [27] indices were defined according to the agronomic priorities of the breeding program stage addressed in this study. Grain yield received the highest weight because it represents the main criterion for advancing hybrids to VCU trials and has a direct impact on economic return. Accordingly, greater weight was assigned to GY, followed by ACAM, HEALTH, PREC, AP, and AE, adopting the weight ratios of 9, 4, 2, 1, 1, and 1, respectively. The selection direction for GY was superior, aiming to identify highly productive genotypes adapted to Cerrado conditions, whereas inferior selection was applied to the remaining traits, favoring lower values.
For the Genotype–Ideotype Distance Index [27], Euclidean distances were calculated based on adjusted phenotypic means, considering the maximum value as ideal for grain yield and the minimum values as ideal for the other traits. Minimum and maximum desirable limits were defined to assist in ideotype construction, adopting grain yield equal to or greater than 5600 kg ha−1, lodging below 10%, and health scores lower than 3.5. The same economic weights used in the Mulamba and Mock index [26] were applied, with weights of 9 for GY, 4 for ACAM, 2 for HEALTH, and 1 for PREC, AP, and AE.
For all selection indices, each hybrid received a numerical index value according to the specific criteria of each method. Genotypes were ranked based on these index values, and a fixed selection intensity was applied by selecting the ten highest-ranked genotypes for each index. This quantifiable selection scheme ensured a consistent and comparable basis for evaluating selection efficiency, genetic gains, and the degree of agreement among the different selection indices.
2.5. Experimental Design
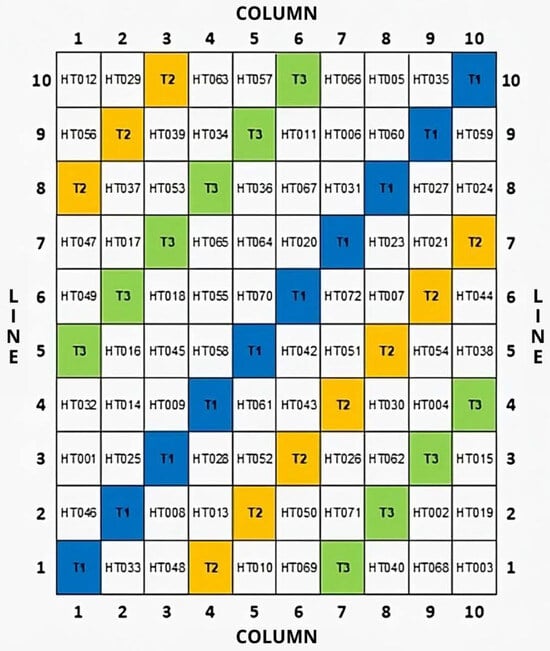
The experiment was conducted in a split-plot design, as proposed by Federer [32], which is appropriate for evaluating a large number of experimental genotypes with restricted repetition. Seventy-three maize genotypes were evaluated, corresponding to triple hybrids, with 70 experimental hybrids evaluated without repetition and three commercial hybrids used as controls. The experiment consisted of 10 blocks, each containing 10 plots, totaling 100 experimental units (Figure 1). In each block, the three controls were repeated systematically and arranged orthogonally so that each commercial hybrid was present in all rows and columns of the experiment, according to the classic structure of the augmented block design. The experimental hybrids were allocated to the remaining plots without repetition within each block.
Figure 1.
Casualization and sketch of the Augmented Block Design trial. Data from [33]. The authors are the original authors and take full responsibility for the data.
The statistical model adopted for data analysis was expressed by:
where
Y(ij) represents the observed value of genotype i in block j;
μ is the overall mean of the experiment;
is the effect of block j;
is the effect of treatment i (genotype);
is the experimental error associated with the observation, assumed to be independent and identically distributed, with zero mean and constant variance.
In the increased block design, only the controls are repeated in all blocks, while the experimental genotypes are evaluated without repetition. Thus, statistical analyses were performed based on adjusted means of genotypes, which were obtained from information provided by the common controls to the blocks while considering the environmental effects estimated from these repetitions.
The analysis of variance (ANOVA) used to evaluate genotypes in the augmented block design is presented in Table 1.
Table 1.
Analysis of variance scheme for the augmented block design.
For this model, the sums of squares and blocks (ignoring treatments) are calculated in the usual way; that is, observations made in each plot are called , and block totals are called , where j represents the number of blocks and i is the total number of treatments. Thus, we have:
To calculate the adjusted treatment sums of squares, the observed values of the experimental genotypes were corrected considering the difference between the mean of the controls in the block and the overall mean of the controls in the experiment, according to the methodology described for this design. The adjusted treatment sums of squares were obtained by the expression:
where i represents the total number of controls, is the adjusted value of each experimental genotype, J is the number of blocks, and CF is the correction factor.
Based on the adjusted means, the selection gains relative to the overall mean of the experiment were estimated, and the genotypes selected for each index were presented, based on the joint analysis of the experiments. The expected gains by direct selection were also estimated, according to the expression:
where
ΔG% is the expected gain with selection (%);
sd is the selection differential;
is the original mean of the trait;
h2 is the broad heritability coefficient, as estimated in the GENES software (version 2013; Universidade Federal de Viçosa, Viçosa, MG, Brazil), according to Cruz [34].
All statistical analyses were performed using GENES software (version 2013; Universidade Federal de Viçosa, Viçosa, MG, Brazil) [34], using specific procedures for augmented block designs, including the adjustment of means based on controls, the estimation of variance components, the calculation of broad-sense heritability, and the prediction of selection gains.
The adoption of the split-plot design was motivated by the large number of experimental hybrids evaluated, which would make the use of completely randomized designs, such as randomized complete block designs, impractical given the limitations of the experimental area, seed availability, time, and cost [35]. This design is widely used in the preliminary stages of genetic improvement programs, in which the primary objective is the efficient screening of a large number of materials that are not yet available in sufficient quantities for full replication [36].
The experimental area exhibited known spatial heterogeneity, reinforcing the need to include repeated control hybrids in all blocks. This strategy allows for the adjustment of environmental effects and the correction of differences among blocks. The systematic inclusion of controls is a central feature of the augmented block design, as it increases the accuracy of estimates for non-replicated genotypes and improves the reliability of genotype ranking. Although control of spatial variation is less robust than in designs with complete replication, the adopted design provides adequate environmental adjustment for the purpose of preliminary selection.
In the present study, analyses were conducted based on adjusted means obtained using the GENES software (version 2013; Universidade Federal de Viçosa, Viçosa, MG, Brazil), considering environmental effects estimated from the control treatments [33]. Classical z-score standardization was not applied to the original data, as the selection indices employed inherently account for scale differences or are based directly on adjusted means. Therefore, comparability among genotypes was ensured through mean adjustment within the augmented block design. Although no additional spatial adjustment models were applied, the experimental design, combined with the systematic distribution of control hybrids, provided sufficient correction for spatial heterogeneity, ensuring the reliability of the estimates used in the selection indices.
Information regarding pedigree, genetic background, and heterotic group classification of the evaluated hybrids could not be included because these data are confidential and belong to the company that owns the germplasm. In breeding programs conducted by private companies, such information is protected by confidentiality agreements, as it describes the genetic basis and heterotic structure underlying the commercial value of the materials. Consequently, only agronomic characteristics and phenotypic data available in the public domain could be disclosed for scientific purposes.
Additionally, agreement between parametric and nonparametric selection strategies was assessed using a Venn diagram, which allowed the quantification of genotypes selected exclusively by each approach as well as those selected simultaneously by both. This analysis provided a concise overview of the overlap and complementarity between the methods. Selection index results were further integrated using a heat map associated with hierarchical clustering analysis, constructed from a binary hybrid selection matrix using Euclidean distance and Ward’s method, implemented in the R software environment (version 4.5.2; R Foundation for Statistical Computing, Vienna, Austria) [37].
3. Results
Hybrid selection was performed using seven selection indices, with a maximum of ten genotypes selected per index. Detailed results for each procedure are presented in Table A1, Table A2, Table A3, Table A4, Table A5 and Table A6 (Appendix A). Overall, the indices differed in their genotype selection patterns, reflecting distinct emphases on the evaluated traits. Parametric indices, particularly those prioritizing grain yield, concentrated selection on higher-yielding hybrids, whereas non-parametric indices showed greater sensitivity to secondary traits such as plant health, lodging, and plant architecture.
3.1. Selection of Hybrids by Different Indices
The application of the Classic Smith–Hazel Index [19,20] and the Direct and Indirect Selection method resulted in the selection of the same set of hybrids, as both procedures considered grain yield as the sole ranking criterion. Consequently, the ten most productive genotypes within the evaluated set were prioritized, with emphasis on hybrids 20A55, HT008, HT007, and HT005, which presented grain yields exceeding 6300 kg ha−1 (Table A1).
The Desired Genetic Gains index proposed by Pesek and Baker [21] selected hybrids with grain yields predominantly below 5800 kg ha−1, values associated with variable health levels and lacking a consistent pattern of joint response among the evaluated traits. No control hybrids were included among the ten genotypes selected using this index (Table A2).
Elston’s Weight-Free and Parameter-Free Index [22] selected seven experimental hybrids and three control hybrids. Among the selected genotypes, 20A55, HT007, and HT008 stood out due to grain yields above 6300 kg ha−1, the absence of lodging, and satisfactory health levels. The remaining selected hybrids exhibited low lodging incidence and intermediate grain yield performance (Table A3).
Application of the Multiplicative Index proposed by Subandi et al. [23] resulted in the selection of hybrids characterized by the complete absence of lodging, good health levels, and greater precocity. However, greater variability was observed for traits related to plant architecture, along with the inclusion of genotypes with lower grain yield, such as hybrid HT067, which yielded less than 4500 kg ha−1 (Table A4).
Using the Sum of Ranks Index of Mulamba and Mock [26], hybrids with grain yields predominantly above 5300 kg ha−1 were selected, associated with good health levels and low lodging incidence. For the traits of precocity, plant height, and ear height, wide variability was observed among the selected genotypes (Table A5).
According to the Genotype–Ideotype Distance Index [27], all selected hybrids corresponded to experimental materials and exhibited high health scores, absence of lodging, and plant architecture considered adequate. The grain yield performance of the selected genotypes was intermediate, with particular emphasis on hybrid HT008, which achieved grain yields exceeding 6300 kg ha−1 (Table A6).
3.2. Agreement Between Selection Indices
Across the evaluated indices, variation was observed in the frequency with which individual hybrids were selected. Some genotypes were identified by multiple indices, whereas others were selected by only one or two methods. The relationship between the selected hybrids and their respective indices is presented in Table 2, which comparatively summarizes the ranking of the ten genotypes indicated by each selection index.
Table 2.
Hybrids selected in each of the selection indices.
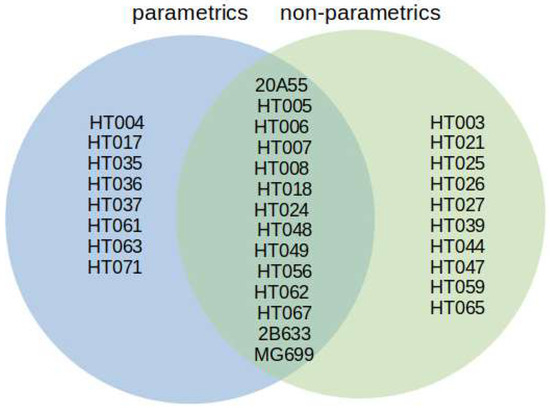
The agreement between parametric and nonparametric selection indices was summarized using a Venn diagram (Figure 2), in which hybrids are presented nominally according to the selection strategy adopted. Of the total number of hybrids evaluated, 14 were selected simultaneously by both approaches: 20A55, HT005, HT006, HT007, HT008, HT018, HT024, HT048, HT049, HT056, HT062, HT067, 2B36, and MG699. In addition, eight hybrids were selected exclusively by the parametric indices, whereas ten hybrids were selected exclusively by the nonparametric indices.
Figure 2.
Venn diagram illustrating the hybrids selected exclusively by parametric indices, exclusively by non-parametric indices, and jointly by both selection strategies. The names of the hybrids are presented to highlight the convergence and complementarity between the methods.
3.3. Cluster Analysis of Hybrids and Indices
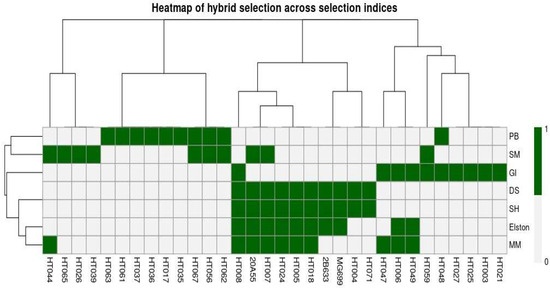
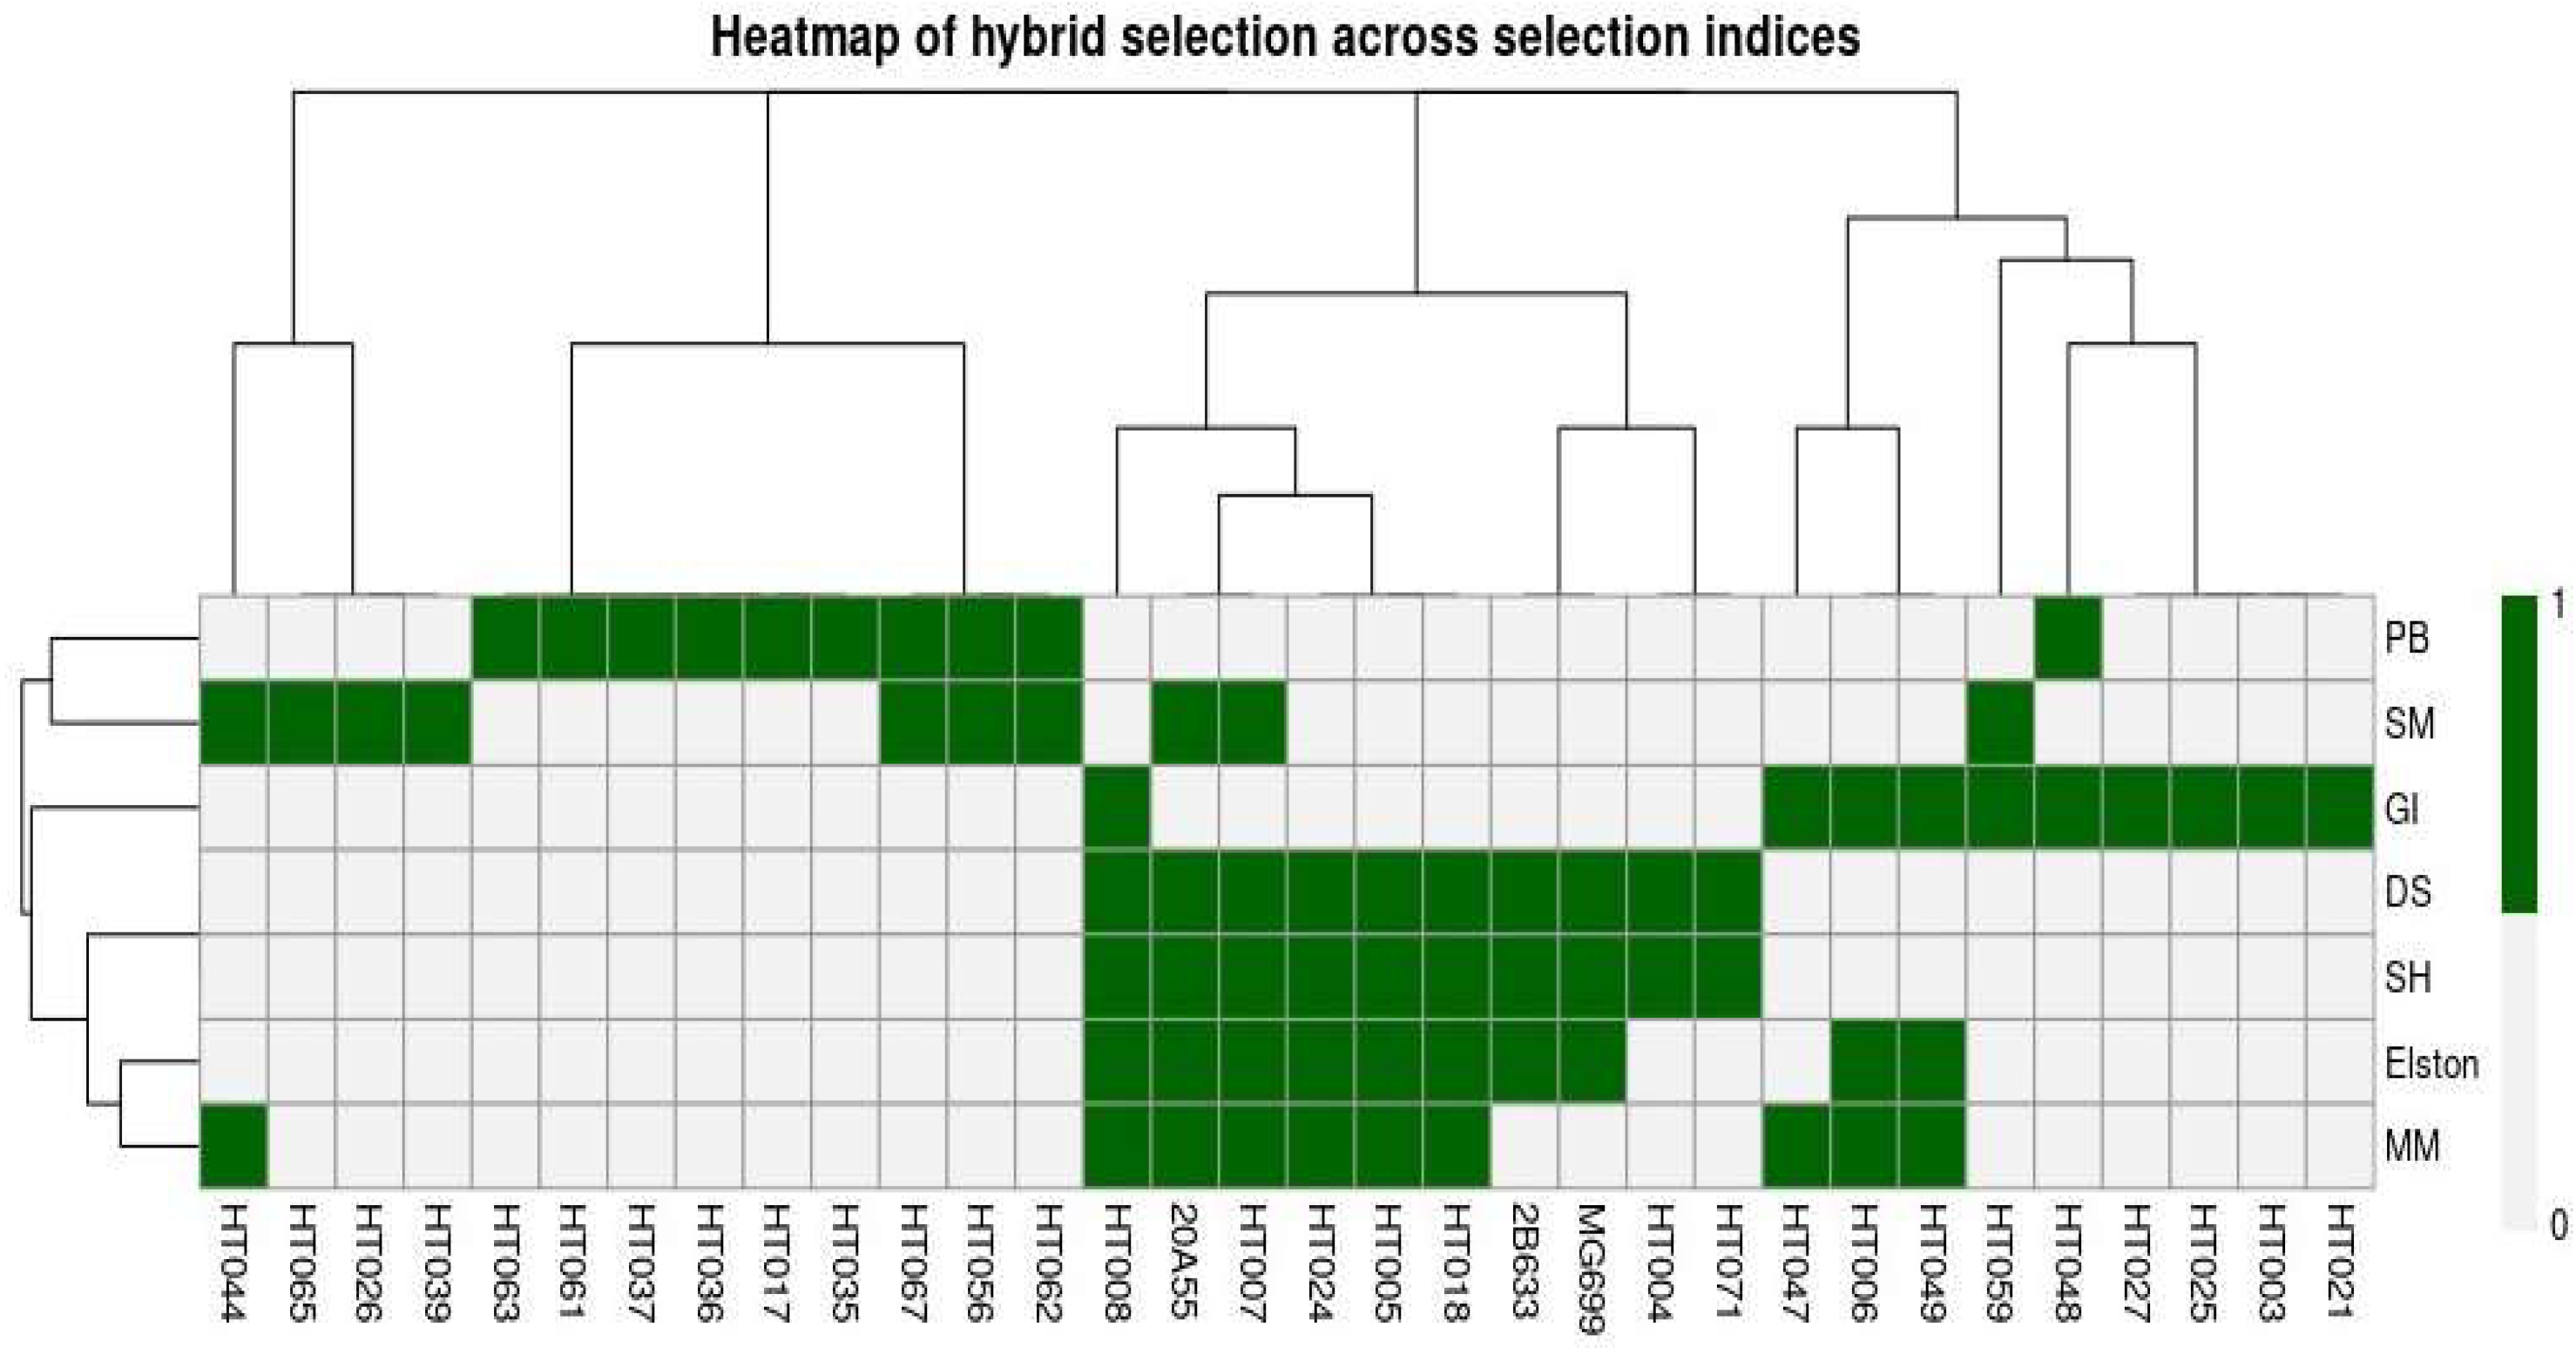
Integration of the results from the different selection indices was further explored using a heat map associated with hierarchical clustering analysis (Figure 3), constructed from a binary hybrid selection matrix (1 = selected; 0 = not selected). The combination of Euclidean distance and Ward’s method resulted in the formation of consistent clusters of both hybrids and indices, based on similarities in selection patterns.
Figure 3.
Heat map of hybrid selection by different selection indices, with hierarchical clustering.
One cluster comprised the most frequently selected hybrids, notably 20A55, HT007, and HT008, which were indicated by five of the seven evaluated indices. A second cluster grouped hybrids selected by four indices, such as HT005, HT018, and HT024, whereas a third cluster included genotypes selected by three indices, including 2B633, MG699, HT006, and HT049. Hybrids selected by only one or two indices exhibited greater dispersion in the heat map and greater hierarchical distance.
Hierarchical clustering applied to the indices also revealed similarities among those that selected comparable sets of hybrids, forming shared branches in the dendrogram. Conversely, indices positioned in more distant branches exhibited more specific selection patterns, contributing to genotype differentiation and reinforcing the complementary nature of the integrative approach.
3.4. Selection Gains
The selection gains obtained by each index, relative to the overall mean of the evaluated genotypes, are presented in Table 3. For grain yield, the highest gains were observed for the Direct and Indirect Selection indices and for the Classic Smith–Hazel Index [19,20], both with a value of 10.23. The Elston index [22] and the Mulamba and Mock index [26] exhibited gains of 9.69 and 8.37, respectively.
Table 3.
Selection gains for each index for each of the characteristics evaluated, in relation to the average of all genotypes evaluated.
For the other variables evaluated, characterized as inverse order, that is, those for which a reduction in the average value is desirable, the indices showed contrasting behaviors.
The Elston [22] and Mulamba and Mock [26] indices also stood out for plant health, promoting reductions of −14.08 and −15.46, respectively, indicating favorable gains for this trait. In contrast, the Pesek and Baker index [21] showed a positive gain (6.72), reflecting an unfavorable response for health. Regarding lodging, the most favorable reductions were obtained with the Genotype–Ideotype Distance Index [27] (−52.76), the Mulamba and Mock index [26] (−43.48), and the Multiplicative Index proposed by Subandi et al. [23] (−42.63), indicating greater efficiency of these methods in reducing this undesirable trait. Similarly, for traits related to plant architecture, such as plant height and ear height, the Genotype–Ideotype Distance Index [27] was the only method to promote consistent reductions, with values of −0.85 and −2.08, respectively.
4. Discussion
4.1. Methodological Considerations
The use of the augmented block design proved appropriate given the large number of experimental maize hybrids evaluated and the operational constraints typical of the early stages of breeding programs, such as limitations in experimental area, seed availability, time, and cost [32]. This design has been widely adopted in preliminary trials to efficiently screen a large number of genotypes that are not yet available in sufficient quantities for experiments with complete replication [36].
The spatial heterogeneity previously identified in the experimental area reinforced the importance of systematically repeating commercial control hybrids in all blocks, allowing for the estimation of environmental effects and the adjustment of differences among blocks. The use of adjusted phenotypic means, obtained using the GENES software based on the performance of repeated controls [34], contributed to reducing the influence of environmental variation on non-replicated genotypes. Although augmented block designs are less rigorous in controlling spatial variability than completely randomized designs with full replication, the strategy adopted in this study provided estimates with sufficient accuracy for preliminary selection and for the application of multivariate selection indices, in line with the proposed objectives.
Environmental heterogeneity among evaluation sites, associated with edaphoclimatic variation, contributed to the variability observed across trials and enabled a more comprehensive assessment of hybrid performance under contrasting conditions.
4.2. Phenological Behavior and Trait Prioritization
Most of the evaluated hybrids were classified as early-cycle genotypes [36], reaching flowering with accumulated thermal sums between approximately 830 and 900 growing degree-days (GDD), corresponding to FAO maturity classes 200 to 300 [38]. This phenological behavior is consistent with the adaptation of maize genotypes to Cerrado conditions, which are characterized by high temperatures and marked seasonal variation in water availability. Minor variations among environments may be associated with microclimatic differences, as meteorological data were obtained from stations located near the experimental areas rather than directly within the plots, which may have influenced heat accumulation estimates.
Although plant health is generally considered a highly relevant trait in maize breeding programs, in the present study it was treated as a secondary trait due to the low disease pressure observed during the second growing season and in the evaluated year. Under these conditions, disease expression was limited, reducing the discriminatory power of this trait among environments.
4.3. Performance and Agreement Between Selection Indices
The results demonstrate that the efficiency of selection indices is directly related to how traits are weighted and integrated into the genotype ranking process, thereby fulfilling the objective of comparing different methods and identifying those most suitable for the conditions of the Brazilian Cerrado. The simultaneous application of parametric and nonparametric indices revealed clear differences in the emphasis assigned to the evaluated traits, reflecting distinct strategies for optimizing genetic merit. The recurrent selection of specific hybrids by multiple indices, particularly 20A55, HT007, and HT008, indicates high agronomic potential and consistent performance under different selection criteria. These hybrids exhibited high grain yield associated with low lodging incidence and adequate plant health, which are essential characteristics for environments such as the Cerrado, characterized by high soil and climatic variability.
The convergence of selection indices in identifying these materials reinforces the robustness of the selection decision and suggests that genotypes with consistent genetic merit tend to be identified regardless of the methodology employed.
The partial agreement observed among the indices, as evidenced by both the Venn diagram and the hierarchical clustering analysis, indicates that divergences among methods do not represent inconsistencies but rather complementary selection strategies. Different indices prioritize specific components of genetic merit, such as maximum productivity, multivariate balance, or conformity to a desirable ideotype. This interpretation is consistent with the findings of Sousa et al. [39], who reported that differences among selection indices arise from the criteria and information used in their construction and do not reflect methodological inadequacy, but instead represent complementary approaches that support decision-making in breeding programs.
Parametric indices, particularly Direct and Indirect Selection and the Classic Smith–Hazel index [19,20], proved highly efficient in maximizing gains in grain yield, as evidenced by the higher selection gain values observed. These results are expected, since both methods explicitly prioritize this trait during the selection process. However, although these approaches promote substantial gains in productivity, their strong emphasis on a single trait may compromise balanced improvements in other agronomic characteristics, as secondary traits are not equally favored [17]. In contrast, more recent multivariate approaches or ranking-based indices, such as the Mulamba and Mock index [26], have shown greater effectiveness in promoting a more balanced agronomic profile and favoring the selection of genotypes with harmonized performance. Similar findings were reported by Ambrósio et al. [17] when evaluating black bean genotypes and by Sousa et al. [39], who highlighted the superiority of these approaches for multi-trait selection in maize breeding programs.
For the Desired Genetic Gains index [21], no control hybrids were selected despite their satisfactory performance, and this index exhibited the lowest gains for grain yield. The results were inconsistent and indicated limited efficiency in selecting superior materials. Similarly, Sayd [40], when evaluating barley genotypes using selection indices, concluded that the Desired Genetic Gains index was not adequate for the simultaneous selection of the three traits of interest in that crop.
In this context, nonparametric indices demonstrated greater efficiency in promoting a balance between grain yield and other agronomic traits. Elston’s Weight-Free and Parameter-Free index [22] showed consistent performance in identifying hybrids with a more balanced agronomic profile, as it is based on the definition of the minimum and maximum thresholds for each trait, leading to the automatic exclusion of genotypes with extreme or unbalanced performance. This approach facilitates the simultaneous selection of multiple traits without the need to assign economic weights, a characteristic considered advantageous in breeding programs conducted under conditions of high environmental variability. Recent studies in different crops have highlighted that nonparametric or weight-free indices can be effective for integrating productivity with secondary traits, particularly when the objective is to achieve balanced gains and identify more stable genotypes [17,41]. However, the efficiency of this index depends strongly on the appropriate definition of the adopted thresholds, which may limit its flexibility in scenarios with wide genetic variability.
The Sum of Ranks index proposed by Mulamba and Mock [26] showed intermediate performance, effectively selecting hybrids with good plant health and low lodging incidence, although it included genotypes with lower productivity compared with the most productive materials. This behavior suggests that adjustments to the weights assigned to the traits could enhance the index’s efficiency for grain yield without compromising the quality of multi-trait selection. Santos Júnior et al. [42] reported that this index was effective in predicting crosses and promoting significant genetic gains for grain yield and popcorn expansion when arbitrary economic weights were assigned by the breeder, favoring higher gains in the first cycle of recurrent selection. Likewise, Sousa et al. [39] demonstrated that the Mulamba and Mock index performed well in concentrating desirable traits and suppressing undesirable ones, making it particularly suitable for the simultaneous selection of multiple traits in half-sib maize populations under tropical conditions. These studies corroborate the efficiency of this index for multi-trait selection, especially in breeding programs targeting tropical environments.
The Genotype–Ideotype Distance Index [27] was particularly effective in reducing undesirable traits such as lodging, plant height, and ear height, promoting consistent gains in plant architecture and health. Although gains in grain yield were moderate, the performance of this index demonstrates its suitability when breeding objectives include the selection of more balanced genotypes adapted to production systems. Similar results were reported by Silva [43], who evaluated selection strategies for agronomic and chemical traits in segregating sweet maize populations using different indices, including the Base Index and the Genotype–Ideotype Index. In that study, the Genotype–Ideotype Index showed balanced performance, with simultaneous gains in productivity, ear diameter, and industrial yield. Overall, this index proved satisfactory and efficient for genotype selection, even though total gains were slightly lower than those obtained with the Base Index.
According to Sayd [40], the Mulamba and Mock [26] and Genotype–Ideotype Distance [27] indices were the most promising for simultaneous selection, as they provided selection gains of satisfactory magnitude for the traits of interest in barley.
In contrast, the Multiplicative Index proposed by Subandi et al. [23] proved inefficient when grain yield was considered the primary selection criterion, since it included low-yielding genotypes among those selected. This behavior confirms limitations previously reported in the literature, indicating that despite integrating multiple traits, this index may not be suitable when the breeding program focuses on maximizing grain yield. Similar results were reported by Zine et al. [44], who observed negative genetic gains for grain yield, equal to minus 0.93 percent, when using the multiplicative index in bread wheat.
Overall, the efficiency of selection indices depends on both the genetic material evaluated and the objectives established by the breeding program. Therefore, the choice of the most appropriate index should consider not only priority traits but also the stage of the selection process and the expected gains at each stage [45]. In this context, the joint application of different selection indices, as adopted in this study, increases the accuracy of identifying superior populations and genotypes [46]. Consequently, the interpretations presented herein should be considered within the context of early-stage hybrid evaluation under Brazilian Cerrado conditions. The hybrids that consistently stood out across multiple indices exhibited comparative advantages over the remaining genotypes, making them promising candidates for both breeding programs and potential commercial recommendation for the Cerrado region. These results reinforce the importance of the combined use of selection indices as efficient tools for identifying superior genotypes in tropical environments, particularly under conditions of high environmental variability such as those observed in the Brazilian Cerrado.
5. Conclusions
The Desired Genetic Gains index proposed by Pesek and Baker and the Multiplicative index proposed by Subandi showed limitations under the evaluated conditions, with a reduced ability to promote consistent joint responses when grain yield was the main selection criterion. In contrast, the Elston, Mulamba and Mock index and the Genotype–Ideotype Distance index proved to be more efficient for the simultaneous selection of multiple characteristics, resulting in more balanced genetic gains.
It is important to emphasize that the results and conclusions of this study are restricted to the environments evaluated within the Brazilian Cerrado and to the single growing season considered, given the experimental design adopted and the use of fixed effects.
The partial agreement observed among the indices allowed the identification of hybrids repeatedly selected by different methods, indicating consistent genetic merit and high agronomic potential under Brazilian Cerrado conditions. Therefore, the combined use of different selection indices represents a robust and efficient strategy to increase selection accuracy and support decision-making in maize breeding programs targeting the Cerrado region.
Author Contributions
Conceptualization, F.Z. and R.F.A.; methodology, F.Z. and M.F.; software, J.V.M.; validation, R.F.A., C.C.d.S., J.V.M., J.V.P.M., A.R.F., B.S.A.F. and M.F.; formal analysis, J.V.M.; investigation, F.Z., C.C.d.S., A.R.F., B.S.A.F. and J.V.P.M.; data curation, J.V.M., J.V.P.M., A.R.F. and B.S.A.F.; writing—original draft preparation, F.Z.; writing—review and editing, C.C.d.S., J.V.P.M., A.R.F., B.S.A.F. and M.F.; supervision, R.F.A. and M.F.; project administration, R.F.A.; funding acquisition, C.C.d.S. All authors have read and agreed to the published version of the manuscript.
Funding
This research received financial support from the Fundação de Apoio à Pesquisa do Distrito Federal (FAPDF) under Edital No. 03/2025—FAPDF Publica (Programa Difusão Científica) (Process No. 00193.00000559/2025-40 for article publication (APC)).
Data Availability Statement
The data presented in this study are available upon request from the corresponding author.
Acknowledgments
The authors would like to thank Embrapa Cerrados for the technical support and infrastructure provided for conducting the experiment. The authors take full responsibility for the final content of the publication.
Conflicts of Interest
The authors declare no conflicts of interest. The funders had no role in the design of the study; in the collection, analyses, or interpretation of data; in the writing of the manuscript; or in the decision to publish the results.
Abbreviations
The following abbreviations are used in this manuscript:
| MT | State of Mato Grosso |
| GO | State of Goiás |
| GY | Grain yield |
| LODG | Resistance to lodging |
| HEALTH | General health of each hybrid |
| EAR | Earliness |
| PH | Plant height |
| EH | Ear height |
| R3 | Phenological stage (milk stage) |
| R4 | Phenological stage (dough stage) |
| VCU | Value for Cultivation and Use |
Appendix A. Tables of Hybrids Selected by Index
Table A1.
Hybrids selected by the Smith and Hazel Index and the Direct and Indirect Selection Index.
Table A2.
Hybrids selected by the Desired Gains Index—Pesek and Baker.
Table A3.
Hybrids selected by the Free Parameter and Weight Index—Elston.
Table A4.
Hybrids selected by the Multiplicative Index—Subandi.
Table A5.
Hybrids selected by the Rank Sum Index—Mulamba and Mock.
Table A6.
Hybrids selected by the Genotype–Ideotype Distance-Based Index.
References
- Ngidi, A.; Shimelis, H.; Abady, S.; Chaplot, V.; Figlan, S. Genetic variation and association of yield, yield components, and carbon storage in sorghum (Sorghum bicolor [L.] Moench) genotypes. BMC Genom. Data 2024, 25, 74. [Google Scholar] [CrossRef] [Scilit]
- Silva, L.A.; Peixoto, M.A.; Peixoto, L.A.; Romero, J.V.; Bhering, L.L. Simultaneous trait selection strategies applied to genome-wide selection for the identification of superior genotypes. Pesq. Agropec. Bras. 2024, 59, e03558. [Google Scholar] [CrossRef] [Scilit]
- Vieira, R.A.; Nogueira, A.P.O.; Fritsche-Neto, R. Optimizing the selection of quantitative traits in plant breeding using simulation. Front. Plant Sci. 2025, 16, 1495662. [Google Scholar] [CrossRef] [Scilit]
- Silva, É.M.; Guedes, M.L..; Crispim Filho, A.J.; Ciappina, A.L.; Fialho dos Reis, E.; Resende, M.P.M. Genetic parameters and selection for multiple traits in recurrent selection populations of maize. Rev. Ceres 2025, 70, 81–90. [Google Scholar] [CrossRef] [Scilit]
- Bester, A.U.; Carvalho, I.R.; Loro, M.V.; Facchinello, P.H.K.; Pradebon, L.C.; Sangiovo, J.P.; Aguiar, G.A.; Streck, E.A.; de Magalhães Júnior, A.M. Seleção de genótipos de arroz com base em caracteres agronômicos e de qualidade comercial de grãos. Rev. Thema 2024, 23, 736–751. [Google Scholar] [CrossRef] [Scilit]
- Filho, I.G.L. Identificação de Genótipos de Feijão Caupi Para Produção de Grãos Verdes Com Potencial Agronômico e Sensorial. Master’s Thesis, Universidade Federal do Ceará, Fortaleza, Brazil, 2024. Available online: https://repositorio.ufc.br/bitstream/riufc/78872/1/2024_dis_iglobofilho.pdf (accessed on 15 January 2025).
- Efendi, R.; Ismayanti, R.; Suwarti; Priyanto, S.B.; Andayani, N.N.; Muliadi, A.; Azrai, M. Evaluating agronomic traits and selection of low N tolerant maize hybrids in Indonesia. AIMS Agric. Food 2024, 9, 856–871. [Google Scholar] [CrossRef] [Scilit]
- Popa, C.; Călugăr, R.E.; Varga, A.; Muntean, E.; Băcilă, I.; Vana, C.D.; Racz, I.; Tritean, N.; Berindean, I.V.; Ona, A.D.; et al. Evaluating maize hybrids for yield, stress tolerance, and carotenoid content: Insights into breeding for climate resilience. Plants 2025, 14, 138. [Google Scholar] [CrossRef] [Scilit]
- Gonçalves, V.M.L. Estratégias de Fenotipagem no Melhoramento Genético do Milho (Zea mays L.): Desenvolvimento de Supercaráter e Recomendação de Híbridos. Ph.D. Thesis, Universidade Estadual do Norte Fluminense Darcy Ribeiro, Campos dos Goytacazes, Brazil, 2025. Available online: https://pgmp.uenf.br/wp%20content/uploads/2025/05/Tese%20DS%20Vivane%20Mirian%20Lanhellas%20Goncalves%20assinada.pdf (accessed on 15 January 2025).
- Carmo, C.M. Estudo de Associação Genômica Ampla no Melhoramento Genético de Milho Para Resistência a Doenças. Master’s Thesis, Universidade Federal de Lavras, Lavras, Brazil, 2025. Available online: https://repositorio.ufla.br/handle/1/60497 (accessed on 15 January 2025).
- Ordóñez, R.A.; Olmedo Pico, L.; Ferela, A.; Trifunovic, S.; Eudy, D.; Archontoulis, S.; Vyn, T.J. Modern maize hybrids have increased grain yield and efficiency tolerances to nitrogen limited conditions. Eur. J. Agron. 2025, 168, 127621. [Google Scholar] [CrossRef] [Scilit]
- Gao, C.; Li, Z.; Zheng, G.; Di, H.; Zhang, L.; Wang, Z.; Dong, L. Analysis of the genetic mechanism of yield-related traits of maize in cold regions. Genes 2025, 16, 941. [Google Scholar] [CrossRef] [Scilit]
- Merrick, L.F.; Herr, A.W.; Sandhu, K.S.; Lozada, D.N.; Carter, A.H. Optimizing plant breeding programs for genomic selection. Agronomy 2022, 12, 714. [Google Scholar] [CrossRef] [Scilit]
- Ruswandi, D.; Maulana, H.; Karuniawan, A.; Mansyur; Ismail, A.; Maxiselly, Y.; Fauzan, M.R.; Abdullah, M.A.; Yuwariah, Y. Multi-traits selection of maize hybrids under sole-crop and multiple-crops with soybean. Agronomy 2023, 13, 2448. [Google Scholar] [CrossRef] [Scilit]
- Atanda, S.A.; Bandillo, N. Genomic-inferred cross-selection methods for multi-trait improvement in a recurrent selection breeding program. Plant Methods 2024, 20, 133. [Google Scholar] [CrossRef] [Scilit]
- Silva, L.A.; Peixoto, M.A.; Peixoto, L.A.; Romero, J.V.; Bhering, L.L. Multi-trait genomic selection indexes applied to identification of superior genotypes. Bragantia 2021, 80, e3621. [Google Scholar] [CrossRef] [Scilit]
- Ambrósio, M.; Daher, R.F.; Santos, R.M.; Santana, J.G.S.; Vidal, A.K.F.; Nascimento, M.R.; Leite, C.L.; Souza, A.G.; Freitas, R.S.; Stida, W.F.; et al. Multi-trait index: Selection and recommendation of superior black bean genotypes as new improved varieties. BMC Plant Biol. 2024, 24, 525. [Google Scholar] [CrossRef] [Scilit] [PubMed]
- Kumar, R.; Kumar, M.; Gangwar, L.K.; Vivek, K.; Sudhanshu, S.; Edhigalla, P.; Rahimi, M. Association and reliability analysis of multi-trait selection methods and selection of superior genotypes across the traits in Indian mustard. Sci. Rep. 2025, 15, 23405. [Google Scholar] [CrossRef] [Scilit]
- Smith, H.F. A discriminant function for plant selection. Ann. Eugen. 1936, 7, 240–250. [Google Scholar] [CrossRef] [Scilit]
- Hazel, L.N. The genetic basis for constructing selection indexes. Genetics 1943, 28, 476–490. [Google Scholar] [CrossRef] [Scilit]
- Pesek, J.; Baker, R.J. Desired improvement in relation to selected indices. Can. J. Plant Sci. 1969, 49, 803–804. [Google Scholar] [CrossRef] [Scilit]
- Elston, R.C. A weight-free index for the purpose of ranking or selection with respect to several traits at a time. Biometrics 1963, 19, 85–97. [Google Scholar] [CrossRef] [Scilit]
- Subandi, W.; Compton, A.; Emeig, L.T. Comparison of the efficiencies of selection indices for three traits in two variety crosses of corn. Crop Sci. 1973, 13, 184–186. [Google Scholar] [CrossRef] [Scilit]
- Olivoto, T.; Nardino, M. MGIDI: Toward an effective multivariate selection in biological experiments. Bioinformatics 2021, 37, 1383–1389. [Google Scholar] [CrossRef] [Scilit]
- Wang, T.; Ren, J.; Huang, Q.; Li, J. Genetic parameters of growth and leaf traits and genetic gains with MGIDI in three Populus simonii × P. nigra families at two spacings. Front. Plant Sci. 2024, 15, 1483580. [Google Scholar] [CrossRef] [Scilit]
- Mulamba, N.N.; Mock, J.J. Improvement of yield potential of the Eto Blanco maize (Zea mays L.) population by breeding for plant traits. Egypt. J. Genet. Cytol. 1978, 7, 40–51. [Google Scholar]
- Cruz, C.D. Programa Genes: Biometria; UFV: Viçosa, Brazil, 2006; 382p. [Google Scholar]
- Silva, L.D.; Bastos, F.G.; Leite, H.P.P.; Freire, L.V.; Higa, A.R.; Victoria, D.d.C.O. O clima no Bioma Cerrado. In SIFLOR—Cerrado, v. 2.; Embrapa Informática Agropecuária: Curitiba, Brazil; Universidade Federal do Paraná: Curitiba, Brazil; Universidade de São Paulo: São Paulo, Brazil, 2021; pp. 12–29. Available online: http://www.alice.cnptia.embrapa.br/alice/handle/doc/1137058 (accessed on 15 January 2025).
- Santos, H.G.d.; Jacomine, P.K.T.; Anjos, L.H.C.d.; Oliveira, V.A.d.; Lumbreras, J.F.; Coelho, M.R.; Almeida, J.A.d.; Araújo Filho, J.C.d.; Oliveira, J.B.d.; Cunha, T.J.F. Sistema Brasileiro de Classificação de Solos, 5th ed.; Embrapa: Brasília, Brazil, 2018; Available online: http://www.infoteca.cnptia.embrapa.br/infoteca/handle/doc/1094003 (accessed on 16 January 2025).
- Fancelli, A.L.; Dourado Neto, D. Produção de Milho; Agropecuária: Guaíba, Brazil, 2000; 360p. [Google Scholar]
- Agroceres. Guia de Sanidade, 2nd ed.; Sementes Agroceres: São Paulo, Brazil, 1996; 72p. [Google Scholar]
- Federer, W.T. Augmented (hoonuiaku) designs. Biom. Unit Tech. Rep. 1956, 55, 191–208. [Google Scholar]
- Zôrzo, F. Seleção de híbridos de milho em múltiplos locais no Cerrado em cultivo de segunda safra. Master’s Thesis, Institutional Repository of the University of Brasília, Brasília, Brazil, 2019. Available online: https://www.repositorio.unb.br/handle/10482/36962 (accessed on 28 January 2026).
- Cruz, C.D. GENES: A software package for analysis in experimental statistics and quantitative genetics. Acta Sci. Agron. 2013, 35, 271–276. [Google Scholar] [CrossRef] [Scilit]
- Cruz, C.D.; Carneiro, P.C.S. Modelos Biométricos Aplicados ao Melhoramento Genético, 4th ed.; UFV: Viçosa, Brazil, 2012; 514p. [Google Scholar]
- Cruz, J.C.; Pereira Filho, I.A.; Alvarenga, R.C.; Gontijo Neto, M.M.; Viana, J.H.M.; Oliveira, M.F.; Matrangolo, W.J.; Albuquerque Filho, M.R. Plantio. In Cultivo do Milho: Sistemas de Produção, 6th ed.; Embrapa Milho e Sorgo: Sete Lagoas, Brazil, 2010; Available online: https://ainfo.cnptia.embrapa.br/digital/bitstream/item/27037/1/Plantio.pdf (accessed on 4 January 2025).
- R Core Team. R: A Language and Environment for Statistical Computing; R Foundation for Statistical Computing: Vienna, Austria, 2025; Available online: https://www.R-project.org/ (accessed on 28 October 2025).
- MBS Inc. MBS Genetic Handbook, 23rd ed.; MBS Inc.: Story City, IA, USA, 1996. [Google Scholar]
- Sousa, A.M.C.B.; Resende, M.P.M.; Crispim-Filho, A.J.; Miranda, G.V.; Reis, E.F.d. Genetic gains and field validation of synthetic populations in tropical maize using selection indexes and REML/BLUP. Plants 2025, 14, 3149. [Google Scholar] [CrossRef] [Scilit] [PubMed]
- Sayd, R.M. Parâmetros Genéticos, Índices de Seleção e Diversidade Genética de Genótipos de Cevada Irrigada no Cerrado. Ph.D. Thesis, Universidade de Brasília, Brasília, Brazil, 2017; 134p. [Google Scholar]
- Tushar, M.A.; Kumaresan, D.; Manonmani, S.; Suresh, R.; Manikanda, N.B.; Sritharan, N. Multi-trait selection indices for identifying elite rice genotypes in rice breeding programs. Plant Sci. Today 2025, 12, 6215. [Google Scholar] [CrossRef] [Scilit]
- Santos Júnior, D.R.d.; Amaral Júnior, A.T.d.; Lima, V.J.d.; Leite, J.T.; Bispo, R.B.; Azeredo, V.C.; Almeida Filho, J.E.d.; Kamphorst, S.H.; Viana, F.N.; Ribeiro, R.M.; et al. Seleção interpopulacional recorrente em pipoca: Da heterose aos ganhos genéticos. Plants 2023, 12, 1056. [Google Scholar] [CrossRef] [Scilit]
- Silva, L.F. Estratégias de Seleção Para Características Agronômicas e Químicas em Populações Segregantes de Milho Doce. Master’s Thesis, Universidade Federal de Uberlândia, Uberlândia, Brazil, 2020. Available online: https://repositorio.ufu.br/handle/123456789/29778 (accessed on 16 January 2025).
- Zine, E.A.F.; Hannachi, A.; Bouzerzour, H. Expected genetic gains from mono-trait and index-based selection in advanced bread wheat (Triticum aestivum L.) populations. Rev. Fac. Nac. Agron. Medellín 2020, 73, 9131–9141. [Google Scholar] [CrossRef] [Scilit]
- Carvalho, A.D.F.; Silva, G.O.; Pereira, G.E. Direct selection for phenotypic traits in carrot genotypes. Hortic. Bras. 2019, 37, 354–358. [Google Scholar] [CrossRef] [Scilit]
- Carvalho, A.F.; Pereira, G.E.; Da Silva, G.O. Estimates of genetic gains in the carrot using different selection indices. Braz. J. Agrar. Environ. Sci. 2022, 16, 7154. [Google Scholar] [CrossRef] [Scilit]

Disclaimer/Publisher’s Note: The statements, opinions and data contained in all publications are solely those of the individual author(s) and contributor(s) and not of MDPI and/or the editor(s). MDPI and/or the editor(s) disclaim responsibility for any injury to people or property resulting from any ideas, methods, instructions or products referred to in the content. |
© 2026 by the authors. Licensee MDPI, Basel, Switzerland. This article is an open access article distributed under the terms and conditions of the Creative Commons Attribution (CC BY) license.