


Abstract
Salinity is an abiotic constraint that limits the growth and productivity of tomato (Solanum lycopersicum L.). However, the role of small ubiquitin-like modifier (SUMO) E3 ligases (SIZs) in the salt stress response in tomato remains unknown. Here, a genome-wide analysis identified four SIZ-type genes in tomato, designated SlSIZ1–SlSIZ4. Gene structure and conserved motif analyses revealed the canonical SAP (SAF-A/B, Acinus, and PIAS) domain and the SP-RING (Siz/PIAS RING finger) domain in all SlSIZ proteins. Phylogenetic analysis grouped SIZ proteins from tomato and representative plant species into five major groups (A–E), with SlSIZ members distributed across distinct clades, and members within each clade shared conserved gene structures. Online transcriptome data and our qRT-PCR analyses showed that SlSIZ4 was highly expressed in leaves, flowers, and fruits, whereas SlSIZ1 showed broad expression, with relatively higher levels in roots, flowers, and multiple fruit stages. Under salt stress, abscisic acid (ABA), and methyl jasmonate (MeJA) treatments, the expression of SlSIZ1 and SlSIZ4 was strongly induced, whereas the expression of SlSIZ2 and SlSIZ3 was rarely promoted. In addition, virus-induced gene silencing (VIGS) of SlSIZ1 and SlSIZ4 markedly reduced salt tolerance of tomato seedlings, as reflected by growth inhibition, chlorophyll loss, increased reactive oxygen species (ROS), reduced proline accumulation, and diminished antioxidant gene expressions. Collectively, these findings identify SlSIZ1 and SlSIZ4 as positive regulators of salt stress tolerance in tomato and provide a framework for further dissection of the SlSIZ gene family.
1. Introduction
Salinity is among the most widespread abiotic stresses limiting global agricultural productivity. Excess salt accumulation in soil leads to osmotic stress, ion imbalance, and oxidative injury, thereby affecting plant growth and yield formation [1,2]. To adapt to such adverse conditions, plants have evolved complex defense mechanisms that include transcriptional regulation, signal transduction, and post-translational modifications (PTMs), all contributing to cellular homeostasis and stress resilience [1,2,3]. Among various PTMs, SUMOylation, the covalent attachment of the small ubiquitin-like modifier (SUMO) to lysine residues of target proteins, is a reversible process that regulates protein stability, localization, and activity [3,4,5,6]. This cascade involves the sequential actions of an E1 activating enzyme, an E2 conjugating enzyme, and an E3 ligase. Among them, the E3 ligase determines substrate specificity and thereby defines the physiological consequences of SUMO modification [3,6,7]. Through SUMOylation of transcription factors and signaling proteins, plants can rapidly reprogram responses to various stresses, including salt stress [3,4,8].
SAP and MIZ1 domain-containing (SIZ; scaffold attachment factor A/B–Acinus–PIAS and MIZ1 domain-containing) proteins represent a conserved subfamily of SUMO E3 ligases and are characterized by the SAP (scaffold attachment factor A/B–Acinus–PIAS) domain, the PINIT (Pro–Ile–Asn–Ile–Thr) motif, the SP-RING (SIZ/PIAS-type RING finger) domain, and the SXS (Ser–X–Ser) motif, and have been reported to participate in plant growth, development, and stress responses [4,6,7]. For example, in A. thaliana, AtSIZ1 regulates flowering time [9] and mediates SUMOylation of the transcription factor MYB30, thereby modulating ABA responses [10]. Meanwhile, in pepper (Capsicum annuum), CaSIZ1/CaDSIZ1 enhances drought tolerance and is involved in ABA-related stress signaling, supporting the role of SIZ-type ligases as integrators of hormonal and stress signaling pathways [11,12]. To date, the regulatory roles of SIZ-type ligases have been observed in rice (O. sativa), maize (Z. mays), soybean (G. max), and wheat (Triticum aestivum), where SIZ homologs contribute to stress adaptation by enhancing antioxidant defense, osmotic adjustment, and hormone signaling crosstalk [3,4,8,13,14]. In tomato, salt tolerance involves restricting Na+ uptake and sequestering it into vacuoles, maintaining K+/Na+ homeostasis, and achieving osmotic adjustment through compatible solutes. These processes are integrated with ABA-dependent signaling, ROS detoxification, and extensive transcriptional reprogramming mediated by stress-responsive transcription factors. Overall, tomato salt tolerance is shaped by coordinated regulation of ion homeostasis, ABA-dependent signaling, and ROS detoxification, yet the contribution of SUMO-mediated regulation to these pathways remains underexplored [1,2]. In previous studies, SlSIZ1 was the only SIZ-type SUMO E3 ligase identified in tomato, functioning in drought and heat tolerance [15,16]. Nevertheless, the SIZ-type SUMO E3 ligase family has not been comprehensively defined in tomato, and the roles of individual SlSIZ members in salt stress adaptation remain poorly understood.
Although SlSIZ1 has been implicated in drought and heat tolerance in tomato, it remains unclear whether additional SIZ-type SUMO E3 ligases exist and how the family has diversified in the tomato genome [15,16]. More importantly, the contribution of SIZ-type ligases to tomato salt stress adaptation and the associated physiological basis (e.g., ROS homeostasis and antioxidant capacity) have not been systematically evaluated [3,4,8,13,14]. Therefore, the key knowledge gap is that the SIZ-type SUMO E3 ligase family in tomato has not been comprehensively defined, and the functional roles of individual SlSIZ members in salt tolerance remain largely unknown. To address this gap, we performed a genome-wide identification and characterization of the SlSIZ gene family, including phylogenetic relationships, conserved domains/motifs, and promoter features. We further profiled SlSIZ expression across tissues and under salt and hormone treatments, and functionally validated SlSIZ1 and SlSIZ4 using virus-induced gene silencing [17,18]. In parallel, we assessed ROS-related physiological responses under salt stress by measuring ROS accumulation and antioxidant capacity, thereby linking SlSIZ1/SlSIZ4 function to redox homeostasis [17,18]. Importantly, establishing the full set of SlSIZ genes provides a family-level reference framework and a valuable resource for the tomato research community, enabling consistent gene nomenclature and cross-study comparisons, and offering a rational starting point to prioritize SUMO-E3 candidates for mechanistic dissection and stress tolerance improvement in tomato. This work provides a family-level framework for SlSIZ genes and provides functional evidence supporting SlSIZ1 and SlSIZ4 as positive regulators of tomato salt tolerance. Relative to previous tomato studies that mainly examined SlSIZ1 [15,16], this work places tomato SIZ-type SUMO E3 ligases in a broader, family-level context. By identifying four SlSIZ candidates in the tomato genome and characterizing their basic features, we provide a reference that may help support more consistent gene nomenclature and cross-study comparisons. This resource also offers a useful basis for selecting SIZ-type SUMO E3 ligase candidates for future functional and mechanistic studies in tomato, including under salinity.
2. Materials and Methods
2.1. Genome-Wide Identification of SlSIZ Gene Family Members in Tomato
The tomato genome sequence and International Tomato Annotation Group release 4.0 (ITAG4.0) annotation data were retrieved from the Phytozome v13 database (https://phytozome.jgi.doe.gov/pz/, accessed on 13 June 2025), whereas the A. thaliana AtSIZ1 protein sequence was acquired from the TAIR database (https://www.arabidopsis.org/index.jsp, accessed on 13 June 2025 locus: AT5G60410; isoform: AT5G60410.2) [19,20]. Using TBtools software (v2.034), candidate coding sequences were extracted using the “GXF Sequence Extraction” module and translated into protein sequences using the “Batch Translation CDS” module [21]. A one-way BLAST search between tomato candidate proteins and the A. thaliana SIZ protein was performed using the “BLAST GUI Wrapper” function [21]. To ensure reliability, reciprocal BLAST verification between tomato and A. thaliana was subsequently conducted in the NCBI database (https://www.ncbi.nlm.nih.gov/, accessed on 14 June 2025) [22]. Candidate sequences were filtered through the ‘BlastXml to Table’ tool for further analysis [21]. Finally, the tomato SlSIZ protein sequences were submitted to the SMART database (http://smart.embl-heidelberg.de/, accessed on 14 June 2025) to validate conserved structural domains and to screen potential members of the SlSIZ gene family [23]. The four SlSIZ gene models identified in tomato correspond to SlSIZ1 (Solyc06g010000.3.1), SlSIZ2 (Solyc06g010100.2.1), SlSIZ3 (Solyc08g008130.4.1), and SlSIZ4 (Solyc11g069160.3.1).
2.2. Gene Structure and Chromosomal Localization of SlSIZ Genes in Tomato
Initially, the ‘visualization of gene structure (from GTF/GFF3 files)’ function in TBtools software (v2.034) was employed to examine the structural characteristics of SlSIZ family members [21]. Subsequently, the ‘visualization of gene positions from GTF/GFF files’ module within TBtools software (v2.034) was applied to map the chromosomal distribution patterns of these genes [21]. Further positional refinement was achieved through the ‘gene position visualization from GTF/GFF files’ module in TBtools software (v2.034), enabling precise genomic localization [21]. Ultimately, each SlSIZ member was systematically designated based on its physical chromosomal coordinates within the tomato genome, following standardized nomenclature protocols aligned with their genomic arrangement.
2.3. Secondary and Tertiary Structure Prediction of SlSIZ Proteins
The online server NPSA (https://npsa-prabi.ibcp.fr/, accessed on 15 June 2025) was used to predict the secondary structures of SlSIZ proteins [24]. The predicted secondary-structure composition, including α-helix, β-turn, random coil, and extended strand, was exported for downstream analysis and visualization. The tertiary structure of each SlSIZ protein was modeled using SWISS-MODEL (https://swissmodel.expasy.org/interactive, accessed on 15 June 2025) [25].
2.4. Conserved Domain Analysis
The conserved domains of SIZ-type SUMO E3 ligase proteins from S. lycopersicum and A. thaliana were identified using multiple databases to ensure annotation accuracy. Protein sequences of the 4 SlSIZ members were obtained from the Phytozome v13 database (https://phytozome.jgi.doe.gov/pz/, accessed on 17 June 2025), based on the S. lycopersicum genome sequence and ITAG4.0 annotation data [19,20]. These correspond to SlSIZ1 (Solyc06g010000.3.1), SlSIZ2 (Solyc06g010100.2.1), SlSIZ3 (Solyc08g008130.4.1), and SlSIZ4 (Solyc11g069160.3.1). The protein sequence of AtSIZ1 was retrieved from the TAIR database (locus: AT5G60410; isoform: AT5G60410.2). Conserved domain prediction was performed using the NCBI Conserved Domain Database (CDD), SMART, and Pfam [23,26,27]. Visualization of domain composition was conducted using TBtools [21]. To reduce bias among databases, we cross-validated the results from the 3 platforms and manually confirmed the domain boundaries using AtSIZ1 structural data reported previously [6,7].
2.5. Phylogenetic Analysis of SlSIZs in Tomato
The SIZ protein sequences of tomato and representative plant species listed in Table S1 were retrieved from the TAIR database for A. thaliana (https://www.arabidopsis.org/index.jsp, accessed on 18 June 2025) and from Phytozome v13 and/or NCBI RefSeq according to the accession IDs in Table S1 (https://phytozome.jgi.doe.gov/pz/, accessed on 18 June 2025). Multiple sequence alignment was performed using MUSCLE implemented in MEGA 11.0 [19,20]. Based on these sequences, a phylogenetic tree comprising 20 SIZ proteins was constructed using the maximum likelihood (ML) method in MEGA 11.0 software, with bootstrap analysis of 1000 replicates [28]. For further refinement of the phylogenetic tree, visualization was performed using the EvolView website (https://evolgenius.info/evolview-v2/, accessed on 18 June 2025) [29]. Accession IDs of all sequences used are provided in Table S1.
2.6. Conserved Motifs of Tomato SlSIZ Proteins
To analyze conserved motifs, tomato SlSIZ protein sequences were submitted to the MEME online analysis platform (http://meme-suite.org/tools/meme, accessed on 19 June 2025) [30]. The conserved motifs of SlSIZ family members were subsequently visualized using the “Gene Structure View (Advanced)” function in TBtools software (v2.034) [21].
2.7. Interaction Analysis of SlSIZ Proteins in Tomato
The protein–protein interaction network for the tomato SlSIZ family members was constructed using the STRING 12.0 database (https://cn.string-db.org/). Interactions with a combined score > 0.400 (medium confidence) were retained for downstream analysis.
2.8. Collinearity Analysis of SlSIZ Genes in Tomato
The genome and annotation files of tomato (S. lycopersicum), A. thaliana, and soybean (G. max) were obtained from the Phytozome v13 online database (https://phytozome.jgi.doe.gov/pz/, accessed on 19 June 2025) [19,20]. The collinearity between tomato and soybean was then obtained using the ‘Text Merge for MCScanX’ function in TBtools [21]. Finally, the results were visualized using the Advanced Circos function in TBtools [21].
2.9. Analysis of Cis-Acting Elements in Tomato SlSIZ Gene Promoters
The 2000 bp promoter sequences upstream of tomato SlSIZ gene coding sequences were extracted. The sequences were analyzed for cis-acting elements using PlantCARE online (http://bioinformatics.psb.ugent.be/webtools/plantcare/html/, accessed on 19 June 2025) and then visualized using TBtools to elucidate the possible transcriptional regulatory network of the SlSIZ gene family [21,31].
2.10. Tissue-Specific Expression Analysis of SlSIZ Genes in Tomato
The transcriptome-based tissue expression profiles of tomato SlSIZ genes were obtained from the Tomato eFP Browser (BAR eFP Browser 2.0; https://bar.utoronto.ca/efp2/Tomato/Tomato_eFPBrowser2.html, accessed on 20 June 2025) [32]. The platform provides pre-processed, normalized expression values; thus, raw RNA-seq reads were not re-mapped or re-quantified in this study. The downloaded expression matrix for SlSIZ genes was subsequently log2-transformed [log2 (x + 1)] and standardized (Z-score) across tissues for each gene prior to heatmap visualization. Heatmaps were generated using TBtools [21].
2.11. Plant Materials, Cultivation Conditions, and Treatments
The ‘Micro-Tom’ tomato cultivar plants were employed in this study. Seeds of the tomato cultivar ‘Micro-Tom’ were purchased from Totally Tomatoes Co. (Randolph, WI, USA). Seeds were surface-sterilized, germinated, and sown in a substrate composed of peat moss, vermiculite, and perlite (3:1:1, v/v/v). Plants were cultivated in a growth chamber under the following controlled environmental conditions: a 14/10 h light/dark photoperiod, day/night temperatures of 22/20 °C, 60% relative humidity, and a photosynthetic photon flux density (PPFD) of 250 μmol m−2 s−1. Two-week-old seedlings were transferred to a hydroponic system, and the uniform 21-day-old plants were selected for subsequent stress treatments: salt stress (200 mM NaCl), abscisic acid (ABA, 100 μM), methyl jasmonate (MeJA, 100 μM), and drought stress (simulated with 20% (w/v) polyethylene glycol PEG 6000), with all chemical treatments prepared in 1/2 Hoagland nutrient solution. The 21-day seedling stage was chosen because plants are developmentally uniform and well suited to hydroponic Hoagland-based treatments, which improves stress consistency for time-course sampling and downstream comparisons. For UV-C stress, the seedlings were exposed to UV-C irradiation at 253.7 nm using a UV-C lamp (Philips, Warsaw, Poland) under identical growth conditions. The 200 mM NaCl treatment was selected to elicit a robust and reproducible transcriptional induction within the short sampling window (0–24 h), thereby enabling reliable comparison of response amplitudes among SlSIZ family members. Shoot tissues were sampled at 0 (untreated control), 6, 12, and 24 h after the initiation of each treatment. For each treatment and time point, three biological replicates were collected, with each replicate consisting of eight seedlings. All the harvested samples were immediately frozen in liquid nitrogen and stored at −80 °C for further analysis.
2.12. RNA Isolation and qRT-PCR
Total RNA was extracted from samples using TRIzol reagent (Invitrogen, Carlsbad, CA, USA), and its purity and concentration were measured on a Pultton P100+ ultra-microspectrophotometer (Wuzhou Dongfang, Beijing, China) following procedures similar to those described previously for tomato [33,34]. Only RNA samples with A260/A280 ratios between 2.0 and 2.1 were selected for subsequent analysis. cDNA was synthesized from the qualified RNA using the FastQuant First-Strand cDNA Synthesis Kit (Tianen, Beijing, China) under the following thermal conditions: 15 min at 37 °C, 5 s at 85 °C, and a final step at 4 °C. qRT-PCR was performed using the SYBR Green Premix Pro Taq HS kit on a LightCycler 480 Real-Time PCR System (Roche, Mannheim, Germany). The 20 µL reaction mixture contained 10 µL of 2× Premix, 0.4 µL each of forward and reverse primer, 2 µL of cDNA template, and 7.2 µL of ddH2O. All primers were designed with Primer Premier 5.0 software (Premier Biosoft, San Francisco, CA, USA), and SlACTIN (NC015447.3) was used as the internal reference gene based on its stable expression documented previously [35]. The primer sequences are listed in Table 1. Relative gene expression levels were calculated by the 2−ΔΔCt method, normalizing all data to the 0 h control [36]. All experiments were conducted with 3 independent biological replicates to ensure the reliability of the results.
Table 1.
Primers used for qRT-PCR analysis of SlSIZ family genes in tomato.
2.13. Salt Tolerance Analysis of VIGS-Silenced Lines
This study utilized ‘Micro-Tom’ tomato as a plant material and employed a tobacco rattle virus (TRV)-based vector for virus-induced gene silencing (VIGS). Gene-specific fragments targeting the coding sequences (CDS) of SlSIZ1 and SlSIZ4 were amplified using primers listed in Table 2 and subsequently cloned into the TRV2 vector. The TRV1 and TRV2 vectors (including the empty TRV2 control, TRV:00) were kindly provided by Prof. Xia Xiaojian, Zhejiang University, China. The sequence-verified recombinant plasmids were transformed into Agrobacterium tumefaciens strain GV3101. Following the method described by Liu et al. [37], robust seedlings were selected for agroinfiltration: TRV1 was mixed separately with the empty TRV2 vector (TRV:00) and the recombinant silencing vectors (TRV: SlSIZ1 and TRV: SlSIZ4) at a 1:1 ratio, and the mixtures were infiltrated into the abaxial side of both cotyledons, ensuring over 80% infiltration coverage [37]. Three days post-infiltration, plants were transferred to a hydroponic system. After a two-day acclimation period with water, the medium was replaced with half-strength Hoagland nutrient solution. Systemic upper (non-infiltrated) newly emerged leaves at a uniform developmental stage were collected 21 days after sowing for qRT-PCR to assess silencing efficiency. Plants exhibiting 60–80% silencing efficiency were selected for salt stress treatment. The qualified plant materials were divided into two groups: one was cultivated in standard Hoagland solution (non-stress control), and the other was treated with Hoagland solution supplemented with 150 mmol L−1 NaCl (salt stress). A moderate salinity level (150 mmol L−1 NaCl) was used for VIGS plants to avoid non-specific, overwhelming injury associated with viral burden and plant-to-plant variability, while still producing stable stress phenotypes that allow gene-dependent differences to be resolved. Both groups contained wild-type, TRV:00 (empty vector), and TRV: SlSIZ1/TRV: SlSIZ4 (gene-silencing) plants. Phenotypic observations and measurements of relevant physiological indicators were then performed. Under NaCl treatment, the wild-type and TRV:00 plants served as the control groups for salt stress. Phenotypic observations and measurements of relevant physiological indicators were subsequently conducted.
Table 2.
Primers used for vector construction in the virus-induced gene-silencing (VIGS) assay.
2.14. Plant Phenotypic Analysis
Plant architecture was documented by imaging tomato seedlings positioned uniformly against a dark background. Morphometric parameters, including plant height and stem diameter, were determined using a digital caliper. For biomass quantification, whole plants in each replicate were blotted dry with filter paper and weighed to determine the fresh weight (FW). The samples were subsequently oven-dried at 80 °C for 2 days until the constant weight was achieved to obtain the dry weight (DW) [38]. Leaf area and root system architecture were assessed using a STD4800 root scanner (Regent Instruments Inc., Quebec, QC, Canada). The fully expanded leaves of each plant were evenly arranged on the scanning platform for image acquisition, and the total leaf area was quantified using the WinRHIZO 5.0 software. The shoots were then excised, and the root systems were imaged and analyzed using the same instrument, following the WinRHIZO (v5.0) workflow and parameter definitions [38]. The experiments above were performed with three biological replicates, with each replicate consisting of eight seedlings.
2.15. Physiological Measurements and Histochemical Staining
Chlorophyll a, b, and total chlorophyll content were extracted and quantified following the method of Dionisio-Sese and Tobita [39]. Briefly, fresh tomato leaf samples were immersed in 10 mL of 80% acetone and incubated in darkness for 48 h until complete decolorization was achieved. Following extraction, the absorbance of the supernatants was measured at 663 nm and 645 nm using a spectrophotometer, with the 80% acetone solution serving as the blank. Hydrogen peroxide and superoxide anion levels were detected by 3,3′-diaminobenzidine (DAB) and nitroblue tetrazolium (NBT) staining, respectively [40]. The malondialdehyde (MDA) content was determined by the thiobarbituric acid (TBA) assay [41]. The free proline concentration was measured using the acid-ninhydrin method [42]. Leaf cell membrane integrity was assessed by the electrolyte leakage assay [2,43].
2.16. Measurement of Antioxidant Enzyme Activity
Antioxidant enzyme activities were determined using previously described spectrophotometric methods with minor modifications [39,44]. Briefly, fresh tomato leaf samples (0.5 g) were homogenized in 5 mL of ice-cold phosphate buffer (pH 7.8) and centrifuged at 10,000× g for 15 min at 4 °C. The phosphate buffer was prepared by mixing solution A (23.279 g Na2HPO4·7H2O L−1) and solution B (10.14 g NaH2PO4·H2O L−1) at a volume ratio of 917.5:116. The resulting supernatant was used for all enzyme assays. Enzyme activities were quantified using spectrophotometric procedures, as described below. The superoxide dismutase (SOD; EC 1.15.1.1) activity was determined at 560 nm. The assay principle was based on the photochemical inhibition of NBT reduction, with the reaction mixture (0.20 mL supernatant, 1.5 mL phosphate buffer, 0.3 mL methionine, 0.3 mL riboflavin, 0.3 mL EDTA-Na, 0.28 mL distilled water, and 0.3 mL NBT) incubated under 4000 lux illumination for 30 min before measuring absorbance at 560 nm. Peroxidase (POD; EC 1.11.1.7) activity was assayed by the guaiacol method, wherein the reaction was initiated by adding 0.3 mL of 0.6% H2O2 to a solution containing 0.1 mL of supernatant and 2.6 mL of 0.3% guaiacol, with the oxidation rate monitored at 470 nm using phosphate-buffered saline as a blank. Catalase (CAT; EC 1.11.1.6) activity was measured following Hu et al. by monitoring the decrease in absorbance at 240 nm over 2 min after adding 2.8 mL of 0.067 mM H2O2 to 0.2 mL of supernatant [44]. Ascorbate peroxidase (APX; EC 1.11.1.11) activity was determined as described by Hu et al. using a reaction system containing 0.2 mL of supernatant, 1.75 mL of phosphate buffer (0.05 M, pH 7.0), 0.3 mL of 1 mM EDTA, 0.3 mL of 5 mM ascorbic acid, and 0.3 mL of distilled water, initiated with 0.3 mL of 1 mM H2O2, with absorbance change at 290 nm recorded for 1 min.
2.17. Statistical Analysis
All statistical analyses were performed using SPSS 26.0 (IBM Corp., Armonk, NY, USA). Data are presented as means ± standard deviation (SD) of three independent biological replicates (n = 3). Differences among treatments were evaluated by one-way analysis of variance (ANOVA), followed by Duncan’s multiple range test at a significance level of p < 0.05. In the figures and tables, different lowercase letters indicate statistically significant differences among means.
3. Results
3.1. Genome-Wide Identification of SlSIZ Genes in Tomato
In our study, four tomato SlSIZ genes were identified via homology-based searches. Based on the location of the genes on different chromosomes, they were named as SlSIZ1 to SlSIZ4. As shown in Table 3, the molecular weights of SlSIZ proteins ranged from 94.50 kDa (SlSIZ1) to 99.17 kDa (SlSIZ3), where kDa (kilodalton) is a standard unit of molecular mass used to report protein molecular weight (1 kDa = 1000 Da). The average amino acid number of the tomato SlSIZ family was 874. SlSIZ2 is a basic protein (pI > 7), and the remaining SlSIZ members are acidic proteins (pI < 7). The mean value of the instability index is 46.505, and the mean value of the aliphatic index is 79.0325. The grand average of hydropathicity (GRAVY) values for the SlSIZ protein members was calculated as −0.419 (SlSIZ1), −0.293 (SlSIZ2), −0.426 (SlSIZ3), and −0.453 (SlSIZ4). As the positive and negative GRAVY values indicate hydrophobicity and hydrophilicity, respectively, all four proteins are classified as hydrophilic proteins [45]. Notably, SlSIZ2 exhibited the highest GRAVY value among them. In addition, subcellular localization analysis indicated a nuclear distribution for all SlSIZ proteins [46].
Table 3.
Genomic information on the SlSIZ gene family members in tomato.
3.2. Gene Structure and Chromosomal Localization of SlSIZ Genes in Tomato
The exon–intron structures of the four identified SlSIZ genes in tomato were characterized and presented alongside their phylogenetic relationships (Figure 1A). These genes exhibited variations in their exon count (ranging from 15 to 17) and intron count (ranging from 15 to 17). Specifically, SlSIZ1 possessed 15 exons and 16 introns, SlSIZ2 had 17 exons and 16 introns, SlSIZ3 contained 16 exons and 15 introns, and SlSIZ4 comprised 16 exons and 17 introns. Chromosomal localization analysis revealed that the four SlSIZ genes were unevenly distributed across three chromosomes (Figure 1B). Two genes, SlSIZ1 and SlSIZ2, were located on chromosome SL4.0ch06. The remaining two genes, SlSIZ3 and SlSIZ4, were located on chromosomes SL4.0ch08 and SL4.0ch11, respectively.
Figure 1.
Genomic features of the SlSIZ gene family in tomato. (A) Phylogenetic relationship and gene structure of SlSIZ genes. The phylogenetic tree (left) was inferred from the full-length SlSIZ protein sequences using the maximum likelihood method in MEGA 11 with 1000 bootstrap replicates. The corresponding gene structures (right) were visualized with TBtools, depicting untranslated regions (UTRs) as green boxes, exons as yellow boxes, and introns as black lines. (B) Chromosomal distribution of SlSIZ genes. The physical positions of the four SlSIZ genes were mapped to their respective chromosomes. Gene names are shown in black, with a scale bar provided on the left.
3.3. Predictive Analysis of the Secondary and Tertiary Structures of SlSIZ Proteins in Tomato
The predicted secondary structure composition of the four SlSIZ-encoded proteins comprised α-helix (14.00–38.71%), random coil (43.86–76.96%), and extended strand (9.04–17.43%; Table 4). In addition, the tertiary structures of SlSIZ proteins were predicted and modeled (Figure 2). The SlSIZ proteins contained a relatively high proportion of α-helical and random-coil regions, which was consistent with the secondary structure predictions. Furthermore, the tertiary structures of the four members varied considerably, reflecting differences in amino acid length, polypeptide chain arrangement, and spatial folding.
Table 4.
Secondary structures of SIZ family members in tomato.
Figure 2.
Predicted tertiary structures of SlSIZ proteins. (A) Predicted tertiary structure of SlSIZ1. (B) Predicted tertiary structure of SlSIZ2. (C) Predicted tertiary structure of SlSIZ3. (D) Predicted tertiary structure of SlSIZ4. The tertiary structure models of the proteins in the figure are all from the N-terminus (blue) to the C-terminus (red) of the protein sequence, with different colors representing the same helix or fold.
3.4. Conserved Domain Architecture of SIZ Proteins in Tomato and A. thaliana
To characterize the structural features of SIZ-type SUMO E3 ligases, conserved domain analysis was performed on the four SlSIZ proteins in tomato and AtSIZ1 in A. thaliana. The results showed that all SlSIZ proteins contained a conserved SP-RING (MIZ-type) zinc finger domain in the C-terminal region, and an N-terminal SAP domain was present in both tomato and A. thaliana proteins (Figure 3). Overall, the domain composition and arrangement patterns of SlSIZ proteins closely resembled AtSIZ1.
Figure 3.
Comparative domain organization of SIZ proteins from tomato and A. thaliana. (A) Schematic representation of conserved domains in tomato SlSIZ proteins. (B) Schematic representation of conserved domains in A. thaliana AtSIZ1.
3.5. Phylogenetic Analysis of SlSIZs in Tomato
A maximum likelihood phylogenetic tree was constructed to examine the evolutionary relationships of SlSIZ family members in tomato. The analysis was performed using SIZ protein sequences from tomato and representative plant species (n = 20; Table S1), with 1000 bootstrap replicates (Figure 4). The resulting tree separated the SIZ proteins into five major groups (A–E). In tomato, SlSIZ1, SlSIZ2, and SlSIZ4 were assigned to Group B, whereas SlSIZ3 was placed in Group E. SlSIZ1 and SlSIZ4 formed a sister clade supported by a bootstrap value of 100. Overall, the phylogenetic pattern suggests that SlSIZ3 is more divergent than the SlSIZ1/2/4 subgroup, which may reflect functional differentiation within the tomato SlSIZ family.
Figure 4.
Maximum likelihood phylogenetic tree of SIZ/PIAS-type SUMO E3 ligases from tomato and representative plant species. The tree was inferred from amino acid sequences (n = 20) with 1000 bootstrap replicates. Bootstrap values are shown at the nodes. Five major groups (A–E) are indicated. Accession IDs of all sequences included in the analysis are listed in Table S1.
3.6. Conserved Motifs of Tomato SlSIZ Proteins
By analyzing the tomato SlSIZ protein family, 10 conserved motifs were identified with lengths ranging from 15 to 50 amino acids (Figure 5A; Table 5). All members contained the core conserved motifs 1, 2, and 9. In addition, SlSIZ4 and SlSIZ1 possessed all 10 motifs, SlSIZ3 lacked motif 10, and SlSIZ2 uniquely contained two copies of motif 2.
Figure 5.
Motif composition and distribution of tomato SlSIZ proteins. (A) Colored boxes represent different conserved motifs, and a phylogenetic tree is shown on the left to illustrate the evolutionary relationships among SlSIZ proteins. (B) Motifs 1–10 are shown. Amino acid sequences of different conserved motifs, represented by stacked letters at each position. The total height of the stack represents the information content of the relative amino acid in the position of each letter in the motif in bits. The height of the individual letter in a stack was calculated by the probability of the letter at that position times the total information content of the stack. The X- and Y-axes represent the width and the bits of each letter, respectively.
Table 5.
Detailed information on the 10 conserved motifs of the tomato SIZ proteins. E-values and sites (occurrence numbers) were obtained from the MEME analysis.
3.7. Interaction Analysis of SlSIZ Proteins in Tomato
The predicted protein–protein interaction network of tomato SlSIZ proteins comprised nine proteins, including four SlSIZ members and five non-SlSIZ proteins (A0A3Q7HDM5, A0A3Q7HEK2, A0A3Q7FE42, A0A3Q7JL9, and A0A3Q7JME2; Figure 6). Within this network, SlSIZ3 interacted with six other proteins, whereas SlSIZ1 and SlSIZ2 each interacted with five proteins. In contrast, SlSIZ4 was predicted to have only two interactions. SlSIZ1, SlSIZ2, and SlSIZ3 formed a tightly interconnected cluster, suggesting a potential functional module. The five non-SlSIZ proteins also exhibited predicted interactions with SlSIZ members in the network.
Figure 6.
Interaction network of tomato SlSIZ proteins. Lines indicate protein–protein interactions; thicker lines represent higher interaction confidence.
3.8. Collinearity Analysis of SlSIZ Genes in Tomato
To investigate the evolutionary expansion of the SIZ gene family, a comparative analysis of SIZ members was conducted in tomato (S. lycopersicum), A. thaliana, and soybean (G. max). The analysis identified two homologous gene pairs between tomato and A. thaliana and eight pairs between tomato and soybean (Figure 7).
Figure 7.
Collinearity analysis of SIZ genes. Colored curves indicate collinear SIZ gene pairs between tomato and A. thaliana and between tomato and soybean, while grey lines in the background represent other collinear blocks within and between the three genomes.
3.9. Analysis of Cis-Acting Elements in Tomato SlSIZ Gene Promoters
To elucidate the regulatory mechanisms of SlSIZ genes, we analyzed cis-acting elements in their 2000 bp promoter regions. A total of 25 types of cis-acting elements were identified in the tomato SlSIZ genes (Table 6). These elements were classified into four major functional categories (Figure 8A). Within them, light-responsive elements were ubiquitous, presented in all the SlSIZ promoters. Hormone-related elements, particularly gibberellin-responsive motifs, were detected in SlSIZ1, SlSIZ3, and SlSIZ4, but were absent in SlSIZ2. Additionally, ABA-responsive elements were identified in both SlSIZ1 and SlSIZ4.
Table 6.
Each member of the tomato SIZ gene family has the original function of cis-acting elements.
Figure 8.
Analysis of cis-acting elements in the tomato SlSIZ gene family. (A) Distribution of cis-acting elements in the 2000 bp upstream promoter regions of SlSIZ genes—different cis-elements are represented by colored wedges. Promoter lengths are drawn to scale, and the scale bar indicates DNA sequence length (bp). (B) Heatmap showing the quantitative profile of cis-acting elements in SlSIZ genes, where the color and numerical value in each grid cell represent the number of a given regulatory element in each promoter.
In addition, stress-responsive elements exhibited distinct member-specific distribution patterns. Drought-responsive elements were found in SlSIZ1, SlSIZ2, and SlSIZ3, while low-temperature-responsive elements were specifically identified in SlSIZ1 and SlSIZ4. Further analysis revealed distinct cis-element distribution patterns among the genes (Figure 8B). Among them, SlSIZ2 was enriched with the TCT-motif and a cluster of CGTCA-motif, TGACG-motif, and MBS elements. In contrast, Box-4 elements were particularly abundant in SlSIZ1 and SlSIZ4, with ABRE being most prominent in SlSIZ4.
3.10. Tissue-Specific Expression of Tomato SlSIZ Genes
To investigate the roles of SlSIZ genes in different tomato tissues during various developmental stages, we analyzed the expression levels of SlSIZ genes across 14 tomato tissues using expression data from the eFP database, including unopened flower buds, fully opened flowers, leaves, roots, 1 cm fruit, 2 cm fruit, 3 cm fruit, mature green fruit, breaker fruit, breaker fruit + 10, pimpinellifolium immature green fruit, pimpinellifolium breaker fruit, pimpinellifolium breaker + 5 fruit, and pimpinellifolium leaf (Figure 9). SlSIZ4 was highly expressed in all the examined tissues. SlSIZ1 exhibited moderate expression levels in fully opened flowers, roots, 3 cm fruit, pimpinellifolium immature green fruit, and pimpinellifolium breaker + 5 fruit, while showing relatively low expression in other tissues. SlSIZ2 was expressed at uniformly low levels across all examined tissues, whereas SlSIZ3 exhibited pronounced expression in roots and pimpinellifolium immature green fruit, with diminished expression levels observed in other tissues.
Figure 9.
Heatmap of SlSIZ gene expression across diverse tomato tissues. Expression profiles in 14 tissues, including flower buds, fully opened flowers, leaves, roots, and fruits at different developmental stages, were obtained from the eFP database and visualized using TBtools. Values shown are expression values downloaded directly from the eFP database (as provided), and the color scale (0–70) indicates relative expression levels (blue to red: low to high).
3.11. Expression Analysis of SlSIZ Genes Under Different Treatments
To investigate the expression patterns of the SlSIZ gene family under various abiotic stresses and phytohormone treatments, we quantified the expression levels of four SlSIZ genes in tomato following exposure to NaCl, PEG, ABA, MeJA, and UV. Under NaCl stress, the expression of all genes was significantly upregulated, peaking at 12 h before declining, with SlSIZ1 and SlSIZ4 showing the most pronounced induction (Figure 10A). PEG treatment induced sustained upregulation of SlSIZ1, SlSIZ2, and SlSIZ4, whereas SlSIZ3 expression was transiently suppressed at 6 h (Figure 10B). Under ABA treatment, the transcripts of SlSIZ1 and SlSIZ4 peaked at 24 h, while SlSIZ2 and SlSIZ3 were highly expressed at 6 h (Figure 10C). MeJA treatment resulted in generally low expression levels of SlSIZ genes, with all genes being downregulated at 6 h and 12 h; however, the transcriptional levels of SlSIZ1 and SlSIZ2 were upregulated after 24 h of MeJA treatment (Figure 10D). Following UV exposure, the transcripts of SlSIZ1, SlSIZ3, and SlSIZ4 were significantly suppressed at 6 h. SlSIZ1 and SlSIZ3 gradually recovered thereafter, whereas the expression of SlSIZ4 remained suppressed throughout the UV treatment time course (Figure 10E). Based on these findings, SlSIZ1 and SlSIZ4 exhibited the most pronounced transcriptional activation under salt stress and were, therefore, selected for subsequent investigation of salt stress response mechanisms.
Figure 10.
Expression levels of the SlSIZ gene family in response to stress and hormonal treatments: (A) NaCl, (B) PEG, (C) ABA, (D) MeJA, and (E) UV radiation. The asterisk indicates the corresponding gene that was significantly up- or down-regulated compared with the 0 h status (** p < 0.01, *** p < 0.001, and **** p < 0.0001, one-way ANOVA followed by Duncan’s multiple range test). The samples in the 0 h treatment were used as controls.
3.12. Verification of SlSIZ1 and SlSIZ4 Silencing Efficiency
Quantitative real-time PCR (qRT-PCR) was used to verify the silencing efficiency of VIGS in SlSIZ1 and SlSIZ4 knockdown lines (Figure 11). In non-silenced plants, the relative transcript levels of SlSIZ1 and SlSIZ4 did not differ significantly between WT and TRV:00 plants, indicating that the empty vector itself had no obvious effect on gene expression. By contrast, expression of SlSIZ1 and SlSIZ4 was dramatically reduced in the TRV: SlSIZ1 and TRV: SlSIZ4 lines (third and fourth bars), where transcript levels were only about 10–20% of those in TRV:00 controls. These results demonstrate that the VIGS constructs efficiently suppressed SlSIZ1 and SlSIZ4 expression, providing reliable SlSIZ1/SlSIZ4-deficient materials for subsequent analyses of salt stress responses.
Figure 11.
Expression analysis of SlSIZ1 and SlSIZ4 after VIGS treatment. Relative expression levels of SlSIZ1 and SlSIZ4 in WT, TRV:00, TRV: SlSIZ1, and TRV: SlSIZ4 plants were determined by qRT-PCR. Data are presented as means ± SD (n = 3). Asterisks indicate significant differences compared with WT (* p < 0.05; **** p < 0.0001).
3.13. Growth and Physiological Indicators Analysis
To investigate the roles of SlSIZ1 and SlSIZ4 in salt tolerance, we generated corresponding gene-silencing tomato lines using VIGS. SlSIZ1- and SlSIZ4-silenced lines showed no visible differences from wild-type (WT) and empty vector (TRV:00) controls under normal conditions, whereas salt stress severely impaired their growth when compared with WT and TRV:00 lines. In detail, the TRV: SlSIZ1 and TRV: SlSIZ4 plants exhibited leaf yellowing and root-stunted phenotypes (Figure 12A–C). Specifically, TRV: SlSIZ1 and TRV: SlSIZ4 lines displayed decreases in plant height (22.65%; 29.25%) and stem diameter (46.24%; 48.94%) compared with the control, respectively (Figure 12D,E). Reductions in fresh weight (28.98%; 37.50%) and dry weight (30.53%; 39.47%) were also observed in the TRV: SlSIZ1 and TRV: SlSIZ4 plants under salt stress compared to their respective controls without stress (Figure 12F,G), alongside pronounced declines in leaf area (63.98%; 60.39%) and root length (55.84%; 58.39%; Figure 12H,I). In addition, the chlorophyll content analysis revealed that salt stress triggered significant reductions in the silenced lines (Figure 12J–L). In TRV: SlSIZ1 plants, chlorophyll a, b, and total chlorophyll dropped by 36.75%, 24.32%, and 32.41% compared with the control, respectively. Similarly, the different chlorophyll contents of TRV: SlSIZ4 plants showed decreases of 44.49%, 37.88%, and 42.19% in comparison with the control, respectively.
Figure 12.
Effects of SlSIZ1 and SlSIZ4 silencing on growth traits and chlorophyll content of tomato seedlings under salt stress. (A) Phenotypic comparison between wild-type and transiently silenced plants. (B) Leaf phenotype comparison between wild-type and transiently silenced plants. (C) Root phenotype comparison between wild-type and transiently silenced plants. (D) Plant height, (E) stem diameter, (F) fresh weight, (G) dry weight, (H) leaf area, (I) root length, (J) chlorophyll a, (K) chlorophyll b, and (L) total chlorophyll content. Values are means ± SD (n = 3). Different lowercase letters indicate significant differences (p < 0.05, Duncan’s test).
To assess the physiological impact of SlSIZ gene silencing on salt stress tolerance, we measured malondialdehyde (MDA) and proline contents and ion leakage (Figure 13). No genotypic differences were observed under control conditions. Under salt stress, however, the TRV: SlSIZ1 and TRV: SlSIZ4 lines accumulated significantly higher levels of MDA (increases of 23.15% and 21.41%, respectively) and exhibited increased ion leakage (rises of 19.69% and 24.68%, respectively) compared to WT and TRV:00 controls (Figure 13A,C), indicating heightened oxidative damage and membrane instability. Consistent with these signs of cellular damage, proline analysis revealed a compromised stress response in the silenced lines. Although salt stress induced proline accumulation across all genotypes, this response was significantly attenuated in TRV: SlSIZ1 and TRV: SlSIZ4 plants, which were 20.37% and 15.97% lower than those of the controls, respectively (Figure 13B).
Figure 13.
Analysis of osmotic regulation in transiently silenced SlSIZ1 and SlSIZ4 lines. (A) MDA content, (B) proline content, and (C) ion leakage rate. Values are means ± SD (n = 3). Different lowercase letters indicate significant differences (p < 0.05) according to Duncan’s multiple range test.
3.14. Effects of SlSIZ1 and SlSIZ4 Silencing on ROS Accumulation and Antioxidant Enzyme Activity Under Salt Stress
To elucidate the physiological mechanisms of oxidative stress in TRV: SlSIZ1 and TRV: SlSIZ4 lines under salt stress, we first employed histochemical staining. DAB staining revealed light brown deposits in WT leaves, whereas both silenced lines exhibited intense, widespread coloration, indicating substantial H2O2 accumulation (Figure 14A). This pattern was corroborated by NBT staining, which showed faint blue in WT leaves but dense blue formazan deposits in the silenced lines, signifying O2− overaccumulation (Figure 14B). The corresponding quantitative assays further confirmed these observations (Figure 14C,D). Under salt stress, TRV: SlSIZ1 accumulated 28.62% more H2O2 and 25.88% more superoxide anion than WT, while TRV: SlSIZ4 showed even greater increases of 58.60% and 63.25% compared with WT, respectively. To determine the cause of this ROS burst, we profiled key antioxidant enzyme activities (Figure 14E–H). Under salt stress, both silenced lines exhibited significantly reduced activities of SOD, POD, CAT, and APX. Specifically, these enzyme activities showed decreases of 27.24%, 44.88%, 24.80%, and 40.50% in the TRV: SlSIZ1 line, while reductions of 23.14%, 51.95%, 28.60%, and 44.33% in TRV: SlSIZ4 plants, respectively.
Figure 14.
Oxidative stress and antioxidant defense in SlSIZ1- and SlSIZ4-silenced plants under salt stress. (A) DAB staining, (B) NBT staining, (C) H2O2 content, (D) O2− content, (E) SOD activity, (F) POD activity, (G) CAT activity, and (H) APX activity. Data are presented as means ± SD (n = 3). Different lowercase letters indicate significant differences (p < 0.05, Duncan’s test).
To investigate the roles of SlSIZ1 and SlSIZ4 in response to salt stress, the expression levels of antioxidant-enzyme-related genes, including SlSOD, SlPOD, SlCAT, and SlAPX, were analyzed under different treatments (Figure 15). Under control conditions, no significant differences in gene expression were detected among WT, TRV:00, TRV: SlSIZ1, and TRV: SlSIZ4 plants. After salt treatment, all four genes showed a marked increase in expression. The highest transcript levels were observed in WT and TRV:00 plants, while SlSOD, SlPOD, SlCAT, and SlAPX expression was significantly reduced in SlSIZ1- and SISIZ4-silenced plants (p < 0.05).
Figure 15.
Expression analysis of antioxidant enzyme genes: (A) SlSOD, (B) SlPOD, (C) SlCAT, and (D) SlAPX. Data are presented as means ± SD (n = 3). Different lowercase letters indicate significant differences (p < 0.05, Duncan’s test).
4. Discussion
4.1. Identification and Evolutionary Analysis of the SlSIZ Gene Family
In the present study, four SIZ-type SUMO E3 ligase genes were identified in the tomato genome (Figure 1A). In comparison, previous studies have reported one SIZ gene in A. thaliana, three in maize, and two in rice; additionally, the SIZ1 homolog MdSIZ1 has been functionally characterized in apple [13,47]. Such marked variation in SIZ gene copy number among species is generally attributed to differences in genome size, the frequency of whole-genome duplication (WGD) events, and the subsequent retention or loss of duplicated genes [48]. These lineage-specific differences are associated with the functional diversification and regulatory complexity that enable plants to adapt to heterogeneous environmental conditions by preserving duplicated genes with adaptive value.
The phylogenetic tree constructed in this study (Figure 4) provides an integrated view of the evolutionary relationships among SIZ proteins from tomato and representative monocot and dicot species (Table S1). The proteins clustered into five major groups (A–E), with tomato SlSIZ members grouping together with homologs from monocot and dicot species. This pattern suggests that the SIZ gene family likely originated prior to the divergence of these major plant lineages and has remained relatively conserved throughout subsequent evolutionary history. The similar clade structures have been described for AtSIZ1 in A. thaliana and OsSIZ1 in rice, further supporting the view that SIZ proteins share a stable evolutionary framework across angiosperms [4,8].
Chromosomal localization (Figure 1B) revealed that the SlSIZ family members are unevenly distributed across the genome. SlSIZ1 and SlSIZ2 are positioned adjacently on chromosome 6, whereas SlSIZ3 and SlSIZ4 occur individually on chromosomes 8 and 11. In numerous plant genomes, gene family members arranged consecutively on the same chromosome are indicative of tandem duplication events, which contribute substantially to family expansion [48,49]. Tandemly duplicated clusters are often dynamic regions of plant genomes, contributing to phenotypic plasticity and environmental adaptability through the retention or divergence of duplicated genes [48,49]. Thus, the adjacency of SlSIZ1 and SlSIZ2 suggests a potential tandem duplication origin within them, which requires more detailed analysis of genomic spacing and duplication history. By contrast, the isolated positioning of SlSIZ3 and SlSIZ4 across different chromosomes, together with their syntenic relationships, suggests that these genes likely arose through segmental duplication rather than tandem duplication (Figure 7). Segmental duplication is often associated with large-scale genome rearrangements and polyploidization, which enables duplicated genes to disperse across the genome, reduces the risk of redundant gene clusters, and provides a broader evolutionary context for functional divergence [48,49]. This pattern parallels that observed in A. thaliana and rice, indicating that segmental duplication may have played a predominant role in shaping the expansion of the SlSIZ family.
Within the phylogenetic topology, AtSIZ1 was placed in Group A, whereas SlSIZ1/SlSIZ2/SlSIZ4 clustered in Group B (Figure 4), highlighting a conserved relationship between tomato and A. thaliana. AtSIZ1 encodes a SUMO E3 ligase known to regulate diverse biological processes, including flowering time, leaf senescence, and freezing tolerance, through SUMOylation of downstream transcription factors [4,9,50]. The strongly supported sister relationship between SlSIZ1 and SlSIZ4 (bootstrap = 100), therefore, implies that SlSIZ1 and SlSIZ4 may perform similar regulatory roles in tomato. In contrast, SlSIZ3 was placed in Group E and was clearly separated from the SlSIZ1/2/4 cluster (Group B), indicating a more divergent evolutionary trajectory [3,4]. In addition, protein domain analysis demonstrated that all SlSIZ proteins possess the conserved MIZ/SP-RING catalytic domain, which is characteristic of SUMO E3 ligases, while auxiliary domains such as SAP, PINIT, and SXS vary among members (Figure 3). The high conservation of the core catalytic region combined with divergence in auxiliary domains suggests that the essential enzymatic activity of the family has been strictly maintained, whereas regulatory or functional specialization may have occurred among members [4,6,7]. Domain arrangements similar to those in SlSIZ proteins have been documented in other species. The PINIT region of AtSIZ1 mediates substrate recognition, while functional analyses in rice indicate that differences in auxiliary domains do not abolish ligase activity or stress-related functions [8,51]. Although automated prediction tools (Pfam, SMART, and CDD) detect only SAP and MIZ/SP-RING domains in AtSIZ1, failing to identify PINIT or SXS, likely due to low conservation and short lengths, biochemical studies unequivocally confirm their presence [6,7]. These findings emphasize the limitations of relying solely on sequence-based prediction and highlight the need to integrate structural and biochemical evidence when examining SlSIZ protein function.
In addition, motif analysis (Figure 5) showed that all SlSIZ proteins share several conserved motifs, with the SP-RING-associated motif being critical for SUMO E3 activity [4,6]. Additional member-specific motifs likely contribute to differences in substrate recognition, protein interactions, or intracellular targeting, providing further evidence of fine-scale functional divergence. Synteny analysis revealed conserved genomic blocks containing SIZ genes among tomato, A. thaliana, and soybean (Figure 7), reflecting historical genome duplication and rearrangement events [48,49]. Although these species have undergone substantial genomic divergence, the preservation of certain syntenic relationships suggests an evolutionarily stable backbone shared by SIZ genes, as reported for other gene families [48,49]. Secondary and tertiary structure predictions revealed high proportions of α-helices and random coils (Table 4; Figure 2), features associated with structural flexibility required for protein–protein interactions. Moreover, predicted protein–protein interaction networks indicate that SlSIZ1 and SlSIZ4 may interact with core SUMOylation pathway components, consistent with observations in pepper where CaSIZ1 participates in stress signaling by mediating SUMOylation of transcription factors [11,12].
Recent crop studies further suggest that diversification of SUMO E3 ligases can have tangible consequences for both stress adaptation and agronomic performance. In rice, OsSPT38 was identified as a previously uncharacterized SUMO E3 ligase, and a rare gain-of-function allele enhances abiotic stress resilience while increasing grain yield, highlighting breeding potential by tuning SUMO E3 ligase activity. This progress in cereals underscores the importance of systematically characterizing SIZ-type ligases in tomato and evaluating their potential roles in both stress tolerance and productivity [52,53].
Taken together, phylogenetic relationships, chromosomal distribution patterns, domain structures, motif compositions, and physicochemical properties collectively indicate that the SlSIZ gene family is structurally well conserved. At the same time, divergence in auxiliary domains and motif patterns suggests that functional specialization has occurred within the family, providing a genomic and structural basis for the diverse regulatory roles of SlSIZ genes in tomato.
4.2. Expression Patterns and Regulatory Responses of SlSIZ Genes Under Abiotic Stress
Recent evidence positions SUMOylation as a highly dynamic post-translational regulatory mechanism that integrates multiple environmental stresses with hormonal and transcriptional networks across plant species. Accordingly, tissue-specific expression profiles showed substantial variation among the four SlSIZ genes, indicating functional divergence among family members (Figure 9) [53].
Tissue-specific expression profiles showed substantial variation among the four SlSIZ genes, indicating functional divergence among family members (Figure 9). SlSIZ4 displayed consistently high expression across the most examined tissues, suggesting that it functions as a broadly expressed member of the family. SlSIZ1 was expressed in key tissues, such as roots, leaves, flowers, and fruits, whereas SlSIZ2 showed low expression in these tissues. In addition, SlSIZ3 accumulated predominantly in roots and immature fruits. Specifically, these expression features of SIZ ligases were also reported in other plants. In A. thaliana, AtSIZ1 transcripts were detected in almost all organs, and atsiz1 mutants showed defects in growth, cell proliferation, and drought responses [4,50]. In rice (O. sativa), OsSIZ1 was constitutively expressed during vegetative and reproductive development with strong promoter activity in vascular bundles, and ossiz1 mutants exhibited altered root architecture and reduced fertility [8,51,54]. Thus, the above examples and our results indicate that SIZ genes are widely expressed and distributed in plant tissues, providing evidence that SlSIZs may be important regulators for tomato plant growth. In pepper (C.annuum), CaSIZ1 is induced by ABA and NaCl, localizes to the nucleus, interacts with CaABI5, and CaSIZ1 knockdown reduces ABA-induced SUMO conjugate accumulation and attenuates salt tolerance, supporting a conserved ABA–SIZ–SUMOylation module within Solanaceae crops [54]. However, how tomato SlSIZ proteins mediate plant growth through judging SUMOylated modification requires further study.
Subsequently, the promoter cis-acting regulatory element analysis revealed that the SlSIZ genes contain ABRE-, DRE-, and MYB-binding sites associated with stress and hormone signaling (Figure 8) [11]. ABRE- and DRE-type cis-elements are also present in the promoters of SIZ1 homologs in A. thaliana and O. sativa, consistent with their roles in ABA- and stress-related signaling [55,56,57]. Generally, ABRE and DRE elements represent two major classes of cis-acting elements, mediating ABA-dependent and ABA-independent transcriptional responses to drought and salinity, as shown for AtDREB2A and other stress-inducible gene promoters in A. thaliana [55,56,57]. Likewise, OsSIZ1 in O. sativa was strongly induced by salt and drought stress [8]. When OsSIZ1 was overexpressed in crop species, plants showed improved tolerance to drought, heat, and salinity [8,14]. Similarly, our study showed that the expression of SlSIZ1 and SlSIZ4 was strongly and persistently induced under salt and ABA treatments. This interpretation is further strengthened by the functional evidence from pepper, indicating that SIZ-type ligases can mediate ABA-associated SUMOylation and thereby influence stress tolerance in Solanaceae species [54]. In addition, light-responsive elements were found in all SlSIZ promoters (Figure 8). Previous studies showed that the promoters of other SUMO E3 ligase genes, such as AtSIZ1 and OsSIZ1, were enriched in light-responsive elements. In addition, their transcriptional levels were changed by photoperiod, circadian, or light-induced oxidative stress [58]. These findings imply possible interactions between light signaling and the SIZ proteins during circadian regulation or photooxidative stress responses, which remains to be elucidated.
4.3. Functional Validation of SlSIZ1 and SlSIZ4 Under Salt Stress
Salt stress inhibits normal plant growth and development through multiple mechanisms, including osmotic stress, ion toxicity, and oxidative damage [1,2,17,18]. In tomato seedlings, typical symptoms of salt injury include leaf chlorosis and curling, reduced photosynthetic efficiency, and, ultimately, decreased yield and fruit quality [1,2]. Given the tissue-specific expression patterns of SlSIZ1 and SlSIZ4 and their potential association with salt-induced physiological damage, we employed virus-induced gene-silencing (VIGS) methods to clarify their roles in salt tolerance. Only the plants that exhibited 60–80% VIGS efficiency were selected for the subsequent salt treatments, which was a strategy that was commonly adopted in tomato VIGS studies to improve reproducibility (Figure 11) [37]. Overall, our experimental analyses indicate that SlSIZ1 and SlSIZ4 contribute to maintaining growth and photosynthetic capacity in tomato seedlings under salt stress. In addition, the loss of either gene weakened the ability of tomato seedlings to withstand salt-induced damage (Figure 11). This salt-sensitive phenotype is consistent with reports on homologous genes in A. thaliana and rice. In A. thaliana, AtSIZ1 modulated the activity and stability of multiple SUMOylated target proteins, thereby supporting the function of photosynthetic tissues under salt and drought stress [4,50]. In rice, OsSIZ1 was essential for vegetative and reproductive development, and mutants of OsSIZ1 exhibited dwarfism, reduced tillering, and decreased pollen fertility, together with increased sensitivity to abiotic stresses, including salinity [8,51]. These examples indicate that SIZ1-like SUMO E3 ligases may play conserved roles in coordinating growth and stress tolerance across plant species.
Salt stress leads to excessive accumulation of reactive oxygen species (ROS), such as superoxide anion (O2−) and hydrogen peroxide (H2O2), which are highly toxic to cells and can cause membrane lipid peroxidation, protein oxidation, and DNA damage [17,18,59]. Under salt stress, changes in the levels of proline (Pro), malondialdehyde (MDA), and electrolyte leakage (EL) serve as key physiological and biochemical indicators of stress damage and tolerance [2,39,41,43,60]. Pro is generally regarded as a positive protective factor, and an increase in Pro usually reflects enhanced osmotic adjustment [60]. In contrast, elevated MDA and EL indicate aggravated membrane lipid peroxidation and membrane damage and are considered negative indicators of stress tolerance [2,41,44]. Consistent with this, salt-tolerant cultivars of wheat usually maintained lower MDA and less EL but accumulated more Pro when compared with sensitive genotypes under saline conditions [61]. These physiological parameters are also closely associated with ROS overaccumulation and membrane lipid peroxidation under abiotic stresses [17,18,41]. Therefore, to mitigate salt-induced damage, plants activate a series of defense mechanisms, including the antioxidant system. Moreover, plants alleviate oxidative damage by increasing the activities of antioxidant enzymes to scavenge excess ROS [17,18]. In A. thaliana, siz1 mutants similarly show salt-induced ROS overaccumulation together with reduced activities of antioxidant enzymes, such as SOD, POD, CAT, and APX [4,50]. Mechanistically, recent work in A. thaliana directly links SIZ1-dependent SUMOylation with ROS homeostasis and chloroplast-associated redox regulation. Specifically, SIZ1 contributes to ROS-triggered increases in SUMO conjugates, whereas siz1 mutants display elevated sensitivity to oxidative stress accompanied by altered hydrogen peroxide and superoxide accumulation across development. These findings support the notion that SIZ1-type ligases participate in redox control, which is consistent with the enhanced ROS accumulation and compromised antioxidant enzyme activities observed in SlSIZ1- and SlSIZ4-silenced tomato seedlings under salinity. In this study, SlSIZ1- and SlSIZ4-silenced plants accumulated much higher levels of H2O2 and O2−, consistent with the increase of MDA and EL under salt treatment when compared with WT and TRV:00 control plants (Figure 12 and Figure 13). These changes indicate more severe membrane lipid peroxidation and structural damage. By contrast, Pro content was markedly reduced in the silenced lines, implying impaired osmotic adjustment capacity. Enzyme activity assays further showed that the activities of SOD, POD, CAT, and APX were all clearly reduced in the silenced plants, similar to the patterns observed in A. thaliana siz1 mutants (Figure 14E–H). Taken together, these results suggest that the silencing of SIZ genes may disrupt ROS homeostasis and membrane stability, thereby weakening the ability of plants to cope with salt stress. Mechanistically, SIZ-type SUMO E3 ligases may regulate ROS-scavenging capacity mainly through SUMOylation of transcriptional regulators rather than by directly modifying antioxidant enzymes. In A. thaliana, SIZ1-mediated SUMOylation of the R2R3-MYB transcription factor MYB30 is salt responsive and promotes salt tolerance by reinforcing the MYB30–AOX1a module, thereby improving cellular redox homeostasis via alternative respiration. This provides a concrete example that SIZ-dependent SUMOylation of transcription factors can reshape downstream redox networks. Accordingly, the elevated ROS levels together with reduced SOD, POD, CAT, and APX activities in SlSIZ1- and SlSIZ4-silenced tomato seedlings may reflect impaired SUMOylation-dependent regulation of stress/redox-related transcriptional programs under salinity. ABA signaling is tightly coupled to ROS production and detoxification during salt stress, and SUMOylation adds an additional regulatory layer that modulates the magnitude and duration of ABA outputs. Notably, SIZ1-dependent SUMOylation of the bZIP transcription factor ABI5 attenuates ABA signaling in A. thaliana, demonstrating that SIZ proteins can tune ABA-responsive gene expression through post-translational modification of a central ABA regulator. In Solanaceae, pepper CaSIZ1 interacts with CaABI5, and ABA promotes SUMO-conjugate accumulation, whereas CaSIZ1 knockdown reduces ABA-induced SUMOylation and compromises salt tolerance. Together with ABRE enrichment in SlSIZ promoters and the ABA inducibility of SlSIZ1/SlSIZ4 in our study, these findings support a working model in which SlSIZ1/SlSIZ4 coordinate ABA-responsive transcriptional networks and antioxidant defenses via SUMOylation of ABA/stress-related transcription factors, ultimately constraining ROS overaccumulation and membrane damage under salinity. At the same time, SIZ1-like SUMO E3 ligases may help to alleviate ROS damage in coordinating salt stress tolerance across plant species. Given that SlSIZ1/SlSIZ4 are predicted to be embedded in a SUMOylation-centered interaction module (STRING; Figure 6), it is plausible that some key substrates under salinity are nuclear regulatory proteins rather than ROS-scavenging enzymes per se. In A. thaliana, the SIZ1-type SUMO E3 ligase regulates diverse stress and developmental processes through SUMOylation of downstream transcription factors [4,9,50], and AtSIZ1 has been shown to SUMOylate MYB30 to modulate ABA responses [10]. Moreover, AtSIZ1-mediated SUMOylation of ABI5 fine-tunes ABA signaling and stress-responsive gene expression [62]. In Solanaceae crops, pepper CaSIZ1/CaDSIZ1 also participates in ABA-related stress signaling and drought tolerance by affecting SUMOylation and transcription factor stability [11,12]. By analogy, SlSIZ1/SlSIZ4 may target tomato ortholog(s) of ABI5-like bZIPs and MYB30-like R2R3-MYBs, thereby indirectly controlling antioxidant gene expression and ROS homeostasis during salt stress. Future identification of SlSIZ1/SlSIZ4-interacting proteins and SUMOylated substrates under salinity will be essential to validate these candidate targets. Another report found that AtSIZ1 mediated the SUMOylated modification of ABI5 to fine-tune ABA-dependent expression of stress-responsive genes [62]. In our study, the tomato SlSIZ promoters consisted of ABA-responsive cis-elements (Figure 8). In addition, the transcriptional abundances of SlSIZ1 and SlSIZ4 could be mediated by ABA (Figure 10C). Thus, there may exist a relationship between SlSIZs and ABA in plant responses to salt stress, which needs to be detected in the future.
Beyond salinity, recent studies in other species emphasize that SUMO E3 ligases can protect yield-related processes under environmental stress. In A. thaliana, SIZ1-mediated SUMOylation stabilizes WRINKLED1 (WRI1) to safeguard seed filling and fatty acid biosynthesis under prolonged high-temperature stress, illustrating how SIZ1 can buffer stress-induced protein instability to sustain productivity. In rice, a newly characterized SUMO E3 ligase OsSPT38 carries a rare gain-of-function mutation that enhances abiotic stress resilience while increasing grain yield, highlighting breeding potential by tuning SUMO E3 ligase activity. Together with our tomato data, these cross-species advances support the broader relevance of SlSIZ1/SlSIZ4 as candidate regulatory nodes for improving stress tolerance and potentially productivity, depending on downstream targets and trade-offs [52,53,54,55,56,57,58,59,60,61,62,63,64] (WRI1–heat/seed filling) (OsSPT38-stress + yield).
Taken together, these findings indicate that SlSIZ1 and SlSIZ4 play important roles in tomato responses to salt stress. However, this study still has several limitations. Firstly, it remains unclear whether SlSIZ1 and SlSIZ4 are functionally redundant or mainly regulate distinct sets of targets. In A. thaliana, analysis of AtSIZ1 and MMS21/HPY2 double mutants has revealed overlapping yet distinct functional networks in development and stress responses [4]. Therefore, generating SlSIZ1- and SlSIZ4-related double-silenced lines in tomato will be essential for dissecting their functional relationship. Accordingly, the conclusions drawn here primarily reflect seedling-stage salt responses, and direct validation during flowering and fruit set will be required to determine yield-relevant roles. Secondly, this study primarily examined salt responses at the seedling stage, and the roles of SlSIZ1 and SlSIZ4 in salt tolerance during reproductive development, such as flowering and fruit set, remain unclear. Previous studies have shown that loss of OsSIZ1 function in rice leads to reduced pollen fertility and abnormal panicle architecture, suggesting that SlSIZ1 and SlSIZ4 may also influence reproductive development in tomato [51,54]. Thus, a detailed investigation of how SlSIZ1 and SlSIZ4 affect fruit development and quality formation under salt stress may be of considerable agronomic importance. Finally, the identification of the direct SUMOylation substrates of SlSIZ1 and SlSIZ4 is crucial for fully elucidating their molecular mechanisms, which may also provide potential molecular targets and a theoretical basis for improving stress resistance in tomato crops [3,4]. A schematic summary of the proposed SlSIZ-mediated salt tolerance pathway is presented in Figure 16.
Figure 16.
A simplified model of SlSIZ1- and SlSIZ4-mediated salt tolerance in tomato seedlings. Salt stress (NaCl) induces the expression of SlSIZ1 and SlSIZ4, which act as positive regulators of salt tolerance. These SUMO E3 ligases enhance the activities of antioxidant enzymes (SOD, POD, CAT, and APX) and promote proline accumulation for osmotic adjustment. Simultaneously, they inhibit the overaccumulation of reactive oxygen species (ROS, such as H2O2 and O2•−) and mitigate membrane damage, as indicated by reduced malondialdehyde (MDA) content and electrolyte leakage (EL). These coordinated physiological responses maintain growth and photosynthetic capacity under salinity, ultimately enhancing seedling salt tolerance. Solid lines indicate regulatory pathways supported by experimental data in this study, while dashed lines represent proposed or uncertain mechanisms. Arrows and T-bars represent promotion and inhibition, respectively.
5. Conclusions
In summary, we identified four SIZ-type SUMO E3 ligase genes in tomato and showed that they are structurally conserved but functionally differentiated in development and stress responses. Promoter and phylogenetic analyses indicated that the tomato SlSIZ genes form evolutionarily conserved evolutionary relationships with SIZ homologs from representative monocot and dicot species (e.g., A. thaliana and O. sativa; Table S1). In addition, SIZ members may be tightly connected to ABA-, drought-, light-, and defense-related signaling networks. Expression analysis showed that SlSIZ genes exhibited distinct expression patterns across different tissues and stress treatments: SlSIZ1 and SlSIZ4 were highly expressed in several tissues and were markedly upregulated by salt and ABA, whereas SlSIZ2 and SlSIZ3 showed relatively low expression levels. Functional assays using virus-induced gene silencing (VIGS) further demonstrated that SlSIZ1 and SlSIZ4 act as positive regulators of salt stress tolerance, since their silencing under salt stress resulted in inhibited plant growth, reduced chlorophyll accumulation, disruption of redox and osmotic homeostasis, and downregulation of antioxidant- and ABA-related genes. This work provides a concise framework for the SlSIZ gene family and offers candidate genes for improving salt stress tolerance in tomato through molecular breeding or genetic engineering. Importantly, the family-wide SlSIZ reference generated here goes beyond prior single-gene studies and facilitates future mechanistic and stage-specific investigations of SUMOylation-mediated regulation in tomato.
Supplementary Materials
The following supporting information can be downloaded at: https://www.mdpi.com/article/10.3390/agronomy16040422/s1, Table S1: Gene/locus IDs and protein sequence identifiers of SIZ/PIAS-type SUMO E3 ligases from tomato and representative plant species used for phylogenetic analysis.
Author Contributions
All authors contributed to the conception and design of the study. Conceptualization, C.W.; funding acquisition, Q.W. and C.W.; original draft—writing, C.W. and Q.W.; review and editing, Q.W., Z.L. and C.W.; visualization, Q.W. and C.W. All authors have read and agreed to the published version of the manuscript.
Funding
This work was supported by the Supporting Funds for Youth Mentor of Gansu Agricultural University (GAU-QDFC-2024-15), the National Natural Science Foundation of China (No. 32460753 and No. 32102370), the Fuxi Young Talents Fund of Gansu Agricultural University (Gaufx-03Y07), and the Natural Science Foundation of Gansu Province, China (23JRRA1406).
Institutional Review Board Statement
The experiments involving tomato plants were conducted in accordance with institutional and national guidelines for the use of plants in scientific research. The cultivated tomato cultivar ‘Micro-Tom’ used in this study did not involve any endangered or protected species and, therefore, did not require specific permits.
Data Availability Statement
The data presented in this study are available in this article. For further information, please contact the corresponding author.
Conflicts of Interest
The authors declare no conflicts of interest.
References
- Acosta-Motos, J.R.; Ortuño, M.F.; Bernal-Vicente, A.; Diaz-Vivancos, P.; Sanchez-Blanco, M.J.; Hernandez, J.A. Plant responses to salt stress: Adaptive mechanisms. Agronomy 2017, 7, 18. [Google Scholar] [CrossRef] [Scilit]
- Bajji, M.; Kinet, J.-M.; Lutts, S. The use of the electrolyte leakage method for assessing cell membrane stability as a water stress tolerance test in durum wheat. Plant Growth Regul. 2002, 36, 61–70. [Google Scholar] [CrossRef] [Scilit]
- Chaffai, R.; Cherif, A.; Ganesan, M. Plant Adaptations and Molecular Responses to Salt Stress. In Plant Adaptation to Abiotic Stress: From Signaling Pathways and Microbiomes to Molecular Mechanisms; Springer: Berlin/Heidelberg, Germany, 2024; pp. 137–176. [Google Scholar] [CrossRef] [Scilit]
- Fang, S.; Hou, X.; Liang, X. SIZ1-mediated SUMOylation responds to multiple abiotic stresses in plants. Environ. Exp. Bot. 2022, 201, 104977. [Google Scholar] [CrossRef] [Scilit]
- Hendriks, I.A.; Lyon, D.; Su, D.; Skotte, N.H.; Daniel, J.A.; Jensen, L.J.; Nielsen, M.L. Site-specific characterization of endogenous SUMOylation across species and organs. Nat. Commun. 2018, 9, 2456. [Google Scholar] [CrossRef] [Scilit]
- Yunus, A.A.; Lima, C.D. Structure of the Siz/PIAS SUMO E3 ligase Siz1 and determinants required for SUMO modification of PCNA. Mol. Cell 2009, 35, 669–682. [Google Scholar] [CrossRef] [Scilit]
- Cheong, M.S.; Park, H.C.; Hong, M.J.; Lee, J.; Choi, W.; Yoo, J.H.; Park, C.Y.; Kim, J.C.; Lim, C.O.; Bohnert, H.J.; et al. Specific domain structures control abscisic acid-, salicylic acid-, and stress-mediated SIZ1 phenotypes. Plant Physiol. 2009, 151, 1930–1942. [Google Scholar] [CrossRef] [Scilit]
- Park, H.C.; Kim, H.; Koo, S.C.; Park, H.J.; Cheong, M.S.; Hong, H.; Baek, D.; Chung, W.S.; Kim, D.H.; Bressan, R.A.; et al. Functional characterization of the SIZ/PIAS-type SUMO E3 ligases, OsSIZ1 and OsSIZ2 in rice. Plant Cell Environ. 2010, 33, 1923–1934. [Google Scholar] [CrossRef] [Scilit]
- Jin, J.B.; Jin, Y.H.; Lee, J.; Miura, K.; Yoo, C.Y.; Kim, W.-Y.; Van Oosten, M.; Hyun, Y.; Somers, D.E.; Lee, I.; et al. The SUMO E3 ligase, AtSIZ1, regulates flowering by controlling a salicylic acid-mediated floral promotion pathway and through effects on FLC chromatin structure. Plant J. 2008, 53, 530–540. [Google Scholar] [CrossRef] [Scilit]
- Zheng, Y.; Schumaker, K.S.; Guo, Y. Sumoylation of transcription factor MYB30 by the small ubiquitin-like modifier E3 ligase SIZ1 mediates abscisic acid response in Arabidopsis thaliana. Proc. Natl. Acad. Sci. USA 2012, 109, 12822–12827. [Google Scholar] [CrossRef] [Scilit]
- Lei, S.; Wang, Q.; Chen, Y.; Song, Y.; Zheng, M.; Hsu, Y.-F. Capsicum SIZ1 contributes to ABA-induced SUMOylation in pepper. Plant Sci. 2022, 314, 111099. [Google Scholar] [CrossRef] [Scilit]
- Joo, H.; Kim, M.G.; Park, C.Y.; Song, S.I.; Park, J.B.; Kim, S.H.; Park, H.C. Pepper SUMO E3 ligase CaDSIZ1 enhances drought tolerance by stabilizing the transcription factor CaDRHB1. New Phytol. 2022, 235, 2313–2330. [Google Scholar] [CrossRef] [Scilit] [PubMed]
- Lai, R.; Jiang, J.; Wang, J.; Du, J.; Lai, J. Functional characterization of three maize SIZ/PIAS-type SUMO E3 ligases. J. Plant Physiol. 2021, 268, 153588. [Google Scholar] [CrossRef] [Scilit] [PubMed]
- Mishra, N.; Sun, L.; Zhu, X.; Smith, J.; Prakash Srivastava, A.; Yang, X.; Pehlivan, N.; Esmaeili, N.; Luo, H.; Shen, G.; et al. Overexpression of the rice SUMO E3 ligase gene OsSIZ1 in cotton enhances drought and heat tolerance, and substantially improves fiber yields in the field under reduced irrigation and rainfed conditions. Plant Cell Physiol. 2017, 58, 735–746. [Google Scholar] [CrossRef] [Scilit] [PubMed]
- Zhang, S.; Zhuang, K.; Wang, S.; Lv, J.; Ma, N.; Meng, Q. A novel tomato SUMO E3 ligase, SlSIZ1, confers drought tolerance in transgenic tobacco. J. Integr. Plant Biol. 2017, 59, 102–117. [Google Scholar] [CrossRef] [Scilit]
- Zhang, S.; Wang, S.; Lv, J.; Liu, Z.; Wang, S.; Chen, Y.; Meng, Q. SUMO E3 ligase SlSIZ1 facilitates heat tolerance in tomato. Plant Cell Physiol. 2018, 59, 58–71. [Google Scholar] [CrossRef] [Scilit]
- Mittler, R. Oxidative stress, antioxidants and stress tolerance. Trends Plant Sci. 2002, 7, 405–410. [Google Scholar] [CrossRef] [Scilit]
- Miller, G.; Suzuki, N.; Ciftci-Yilmaz, S.; Mittler, R. Reactive oxygen species homeostasis and signalling during drought and salinity stresses. Plant Cell Environ. 2010, 33, 453–467. [Google Scholar] [CrossRef] [Scilit]
- Goodstein, D.M.; Shu, S.; Howson, R.; Neupane, R.; Hayes, R.D.; Fazo, J.; Mitros, T.; Dirks, W.; Hellsten, U.; Putnam, N.; et al. Phytozome: A comparative platform for green plant genomics. Nucleic Acids Res. 2012, 40, D1178–D1186. [Google Scholar] [CrossRef] [Scilit]
- Hosmani, P.S.; Shippy, T.; Miller, S.; Benoit, J.B.; Munoz-Torres, M.; Flores-Gonzalez, M.; Mueller, L.A.; Wiersma-Koch, H.; D’eLia, T.; Brown, S.J.; et al. A quick guide for student-driven community genome annotation. PLoS Comput. Biol. 2019, 15, e1006682. [Google Scholar] [CrossRef] [Scilit]
- Chen, C.; Chen, H.; Zhang, Y.; Thomas, H.R.; Frank, M.H.; He, Y.; Xia, R. TBtools: An Integrative Toolkit Developed for Interactive Analyses of Big Biological Data. Mol. Plant 2020, 13, 1194–1202. [Google Scholar] [CrossRef] [Scilit]
- Camacho, C.; Coulouris, G.; Avagyan, V.; Ma, N.; Papadopoulos, J.; Bealer, K.; Madden, T.L. BLAST+: Architecture and applications. BMC Bioinform. 2009, 10, 421. [Google Scholar] [CrossRef] [Scilit] [PubMed]
- Letunic, I.; Bork, P. SMART: Recent updates, new developments and status in 2020. Nucleic Acids Res. 2021, 49, D458–D460. [Google Scholar] [CrossRef] [Scilit] [PubMed]
- Combet, C.; Blanchet, C.; Geourjon, C.; Deléage, G. NPS@: Network protein sequence analysis. Trends Biochem. Sci. 2000, 25, 147–150. [Google Scholar] [CrossRef] [Scilit] [PubMed]
- Waterhouse, A.; Bertoni, M.; Bienert, S.; Studer, G.; Tauriello, G.; Gumienny, R.; Heer, F.T.; De Beer, T.A.P.; Rempfer, C.; Bordoli, L.; et al. SWISS-MODEL: Homology modelling of protein structures and complexes. Nucleic Acids Res. 2018, 46, W296–W303. [Google Scholar] [CrossRef] [Scilit]
- Lu, S.; Wang, J.; Chitsaz, F.; Derbyshire, M.K.; Geer, R.C.; Gonzales, N.R.; Gwadz, M.; I Hurwitz, D.; Marchler, G.H.; Song, J.S.; et al. CDD/SPARCLE: The conserved domain database in 2020. Nucleic Acids Res. 2020, 48, D296–D300. [Google Scholar] [CrossRef] [Scilit]
- Sonnhammer, E.L.; Eddy, S.R.; Durbin, R. Pfam: A comprehensive database of protein domain families based on seed alignments. Nucleic Acids Res. 1998, 26, 320–322. [Google Scholar] [CrossRef] [Scilit]
- Tamura, K.; Stecher, G.; Kumar, S. MEGA11: Molecular evolutionary genetics analysis version 11. Mol. Biol. Evol. 2021, 38, 3022–3027. [Google Scholar] [CrossRef] [Scilit]
- Subramanian, B.; Gao, S.; Lercher, M.J.; Hu, S.; Chen, W.-H. Evolview v3: A webserver for visualization, annotation, and management of phylogenetic trees. Nucleic Acids Res. 2019, 47, W270–W275. [Google Scholar] [CrossRef] [Scilit]
- Bailey, T.L.; Boden, M.; Buske, F.A.; Frith, M.; Grant, C.E.; Clementi, L.; Ren, J.; Li, W.W.; Noble, W.S. MEME SUITE: Tools for motif discovery and searching. Nucleic Acids Res. 2009, 37, W202–W208. [Google Scholar] [CrossRef] [Scilit]
- Lescot, M.; Déhais, P.; Thijs, G.; Marchal, K.; Moreau, Y.; Van de Peer, Y.; Rouzé, P.; Rombauts, S. PlantCARE, a database of plant cis-acting regulatory elements and a portal to tools for in silico analysis of promoter sequences. Nucleic Acids Res. 2002, 30, 325–327. [Google Scholar] [CrossRef] [Scilit]
- Winter, D.; Vinegar, B.; Nahal, H.; Ammar, R.; Wilson, G.V.; Provart, N.J. An “Electronic Fluorescent Pictograph” browser for exploring and analyzing large-scale biological data sets. PLoS ONE 2007, 2, e718. [Google Scholar] [CrossRef] [Scilit]
- Pan, X.; Wang, C.; Liu, Z.; Gao, R.; Feng, L.; Li, A.; Yao, K.; Liao, W. Identification of ABF/AREB gene family in tomato (Solanum lycopersicum L.) and functional analysis of ABF/AREB in response to ABA and abiotic stresses. PeerJ 2023, 11, e15310. [Google Scholar] [CrossRef] [Scilit] [PubMed]
- Liu, Z.; Pan, X.; Wang, C.; Yun, F.; Huang, D.; Yao, Y.; Gao, R.; Ye, F.; Liu, X.; Liao, W. Genome-wide identification and expression analysis of serine hydroxymethyltransferase (SHMT) gene family in tomato (Solanum lycopersicum). PeerJ 2022, 10, e12943. [Google Scholar] [CrossRef] [Scilit] [PubMed]
- Exposito-Rodriguez, M.; Borges, A.A.; Borges-Pérez, A.; Pérez, J.A. Selection of internal control genes for quantitative real-time RT-PCR studies during tomato development process. BMC Plant Biol. 2008, 8, 131. [Google Scholar] [CrossRef] [Scilit] [PubMed]
- Livak, K.J.; Schmittgen, T.D. Analysis of relative gene expression data using real-time quantitative PCR and the 2−ΔΔCT method. Methods 2001, 25, 402–408. [Google Scholar] [CrossRef] [Scilit]
- Liu, Y.; Schiff, M.; Dinesh-Kumar, S.P. Virus-induced gene silencing in tomato. Plant J. 2002, 31, 777–786. [Google Scholar] [CrossRef] [Scilit]
- Regent Instruments Inc. WinRHIZOTM (Version 5.0) User Manual/Technical Documentation; Regent Instruments Inc.: Québec, QC, Canada, 2024. [Google Scholar]
- Dionisio-Sese, M.L.; Tobita, S. Antioxidant responses of rice seedlings to salinity stress. Plant Sci. 1998, 135, 1–9. [Google Scholar] [CrossRef] [Scilit]
- Ahammed, G.J.; Li, C.-X.; Li, X.; Liu, A.; Chen, S.; Zhou, J. Overexpression of Tomato RING E3 Ubiquitin Ligase Gene SlRING1 Confers Cadmium Tolerance by Attenuating Cadmium Accumulation and Oxidative Stress. Physiol. Plant. 2021, 173, 449–459. [Google Scholar] [CrossRef] [Scilit]
- Heath, R.L.; Packer, L. Photoperoxidation in isolated chloroplasts: I. Kinetics and stoichiometry of fatty acid peroxidation. Arch. Biochem. Biophys. 1968, 125, 189–198. [Google Scholar] [CrossRef] [Scilit]
- Sena, F.; Monza, J.; Signorelli, S.; Corpas, F.J.; Palma, J.M. Determination of Free Proline in Plants. In ROS Signaling in Plants: Methods and Protocols; Springer: Berlin/Heidelberg, Germany, 2024; pp. 183–194. [Google Scholar] [CrossRef] [Scilit]
- Senthilkumar, M.; Amaresan, N.; Sankaranarayanan, A. Measurement of Electrolyte Leakage. In Plant-Microbe Interactions; Springer: Berlin/Heidelberg, Germany, 2021; pp. 155–156. [Google Scholar] [CrossRef] [Scilit]
- Hu, Y.; Yue, J.; Nie, J.; Luo, D.; Cao, S.; Wang, C.; Pan, J.; Chen, C.; Zhang, H.; Wu, Q.; et al. Salicylic acid alleviates the salt toxicity in kenaf by activating antioxidant system and regulating crucial pathways and genes. Ind. Crops Prod. 2023, 199, 116691. [Google Scholar] [CrossRef] [Scilit]
- Gasteiger, E.; Gattiker, A.; Hoogland, C.; Ivanyi, I.; Appel, R.D.; Bairoch, A. Protein identification and analysis tools on the ExPASy server. In The Proteomics Protocols Handbook; Walker, J.M., Ed.; Humana Press: Totowa, NJ, USA, 2005; pp. 571–607. [Google Scholar]
- Horton, P.; Park, K.-J.; Obayashi, T.; Fujita, N.; Harada, H.; Adams-Collier, C.J.; Nakai, K. WoLF PSORT: Protein localization predictor. Nucleic Acids Res. 2007, 35, W585–W587. [Google Scholar] [CrossRef] [Scilit]
- Zhang, R.F.; Zhou, L.J.; Li, Y.Y.; You, C.X.; Sha, G.L.; Hao, Y.J. Apple SUMO E3 ligase MdSIZ1 is involved in the response to phosphate deficiency. J. Plant Physiol. 2019, 232, 216–225. [Google Scholar] [CrossRef] [Scilit]
- Panchy, N.; Lehti-Shiu, M.; Shiu, S.-H. Evolution of gene duplication in plants. Plant Physiol. 2016, 171, 2294–2308. [Google Scholar] [CrossRef] [Scilit]
- Zhao, T.; Holmer, R.; de Bruijn, S.; Angenent, G.C.; van den Burg, H.A.; Schranz, M.E. Phylogenomic synteny network analysis of MADS-box transcription factor genes reveals lineage-specific transpositions, ancient tandem duplications, and deep positional conservation. Plant Cell 2017, 29, 1278–1292. [Google Scholar] [CrossRef] [Scilit] [PubMed]
- Catala, R.; Ouyang, J.; Abreu, I.A.; Hu, Y.; Seo, H.; Zhang, X.; Chua, N.-H. The Arabidopsis E3 SUMO ligase SIZ1 regulates plant growth and drought responses. Plant Cell 2007, 19, 2952–2966. [Google Scholar] [CrossRef] [Scilit] [PubMed]
- Thangasamy, S.; Guo, C.L.; Chuang, M.H.; Lai, M.; Chen, J.; Jauh, G. Rice SIZ1, a SUMO E3 ligase, controls spikelet fertility through regulation of anther dehiscence. New Phytol. 2011, 189, 869–882. [Google Scholar] [CrossRef] [Scilit] [PubMed]
- Zhang, Z.S.; Zhang, Z.Y.; Xia, J.Q.; Chen, S.Y.; Sun, L.Q.; Wu, J.; He, D.Y.; Wang, J.X.; Liang, Q.Y.; Wang, L.; et al. OsSPT38 encodes a novel SUMO E3 ligase that improves rice stress resilience and grain yield. Mol. Plant 2025, 18, 1742–1758. [Google Scholar] [CrossRef] [Scilit]
- Han, D.; Jiang, J.; Yu, Z.; Wang, C.; Zhang, C.; Lai, J.; Yang, C. SUMOylation in plants: A versatile post-translational mechanism responding to environmental stresses. J. Integr. Plant Biol. 2026. early view. [Google Scholar] [CrossRef] [Scilit]
- Wang, H.; Makeen, K.; Yan, Y.; Cao, Y.; Sun, S.; Xu, G. OsSIZ1 regulates the vegetative growth and reproductive development in rice. Plant Mol. Biol. Report. 2011, 29, 411–417. [Google Scholar] [CrossRef] [Scilit]
- Yamaguchi-Shinozaki, K.; Shinozaki, K. Organization of cis-acting regulatory elements in osmotic- and cold-stress-responsive promoters. Trends Plant Sci. 2005, 10, 88–94. [Google Scholar] [CrossRef] [Scilit]
- Kim, J.-S.; Mizoi, J.; Yoshida, T.; Fujita, Y.; Nakajima, J.; Ohori, T.; Todaka, D.; Nakashima, K.; Hirayama, T.; Shinozaki, K.; et al. An ABRE Promoter Sequence is Involved in Osmotic Stress-Responsive Expression of the DREB2A Gene, Which Encodes a Transcription Factor Regulating Drought-Inducible Genes in Arabidopsis. Plant Cell Physiol. 2011, 52, 2136–2146. [Google Scholar] [CrossRef] [Scilit] [PubMed]
- Sakuma, Y.; Maruyama, K.; Osakabe, Y.; Qin, F.; Seki, M.; Shinozaki, K.; Yamaguchi-Shinozaki, K. Functional Analysis of an Arabidopsis Transcription Factor, DREB2A, Involved in Drought-Responsive Gene Expression. Plant Cell 2006, 18, 1292–1309. [Google Scholar] [CrossRef] [Scilit] [PubMed]
- Lin, X.-L.; Niu, D.; Hu, Z.-L.; Kim, D.H.; Jin, Y.H.; Cai, B.; Liu, P.; Miura, K.; Yun, D.-J.; Kim, W.-Y.; et al. An Arabidopsis SUMO E3 Ligase, SIZ1, Negatively Regulates Photomorphogenesis by Promoting COP1 Activity. PLoS Genet. 2016, 12, e1006016. [Google Scholar] [CrossRef] [Scilit] [PubMed]
- Apel, K.; Hirt, H. Reactive oxygen species: Metabolism, oxidative stress, and signal transduction. Annu. Rev. Plant Biol. 2004, 55, 373–399. [Google Scholar] [CrossRef] [Scilit]
- Szabados, L.; Savouré, A. Proline: A multifunctional amino acid. Trends Plant Sci. 2010, 15, 89–97. [Google Scholar] [CrossRef] [Scilit]
- Dou, X.T.; Wang, Y.J.; Wang, H.Z.; Yue, J.Y. Physiological response and tolerance difference of two wheat varieties to NaCl stress. Acta Ecol. Sin. 2021, 41, 4976–4992. [Google Scholar] [CrossRef] [Scilit]
- Miura, K.; Lee, J.; Jin, J.B.; Yoo, C.Y.; Miura, T.; Hasegawa, P.M. Sumoylation of ABI5 by the Arabidopsis SUMO E3 ligase SIZ1 negatively regulates abscisic acid signaling. Proc. Natl. Acad. Sci. USA 2009, 106, 5418–5423. [Google Scholar] [CrossRef] [Scilit]
- Castro, P.H.; Couto, D.; Santos, M.Â.; Freitas, S.; Lourenço, T.; Dias, E.; Huguet, S.; da Silva, J.M.; Tavares, R.M.; Bejarano, E.R.; et al. SUMO E3 ligase SIZ1 connects sumoylation and reactive oxygen species homeostasis processes in Arabidopsis. Plant Physiol. 2022, 189, 934–954. [Google Scholar] [CrossRef] [Scilit]
- Huang, R.; Wen, M.; Feng, B.; Wu, P.; Zhong, X.; Yang, Y.; Liu, M.; Li, H.; Yang, C.; Peng, C.; et al. SIZ1 SUMOylates and stabilizes WRI1 to safeguard seed filling and fatty acid biosynthesis under high-temperature stress. Plant Cell 2025, 37, koaf085. [Google Scholar] [CrossRef] [Scilit]
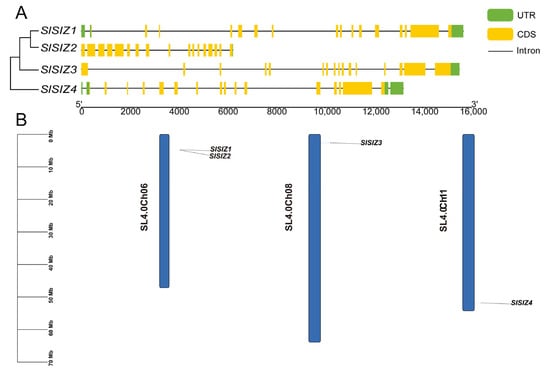
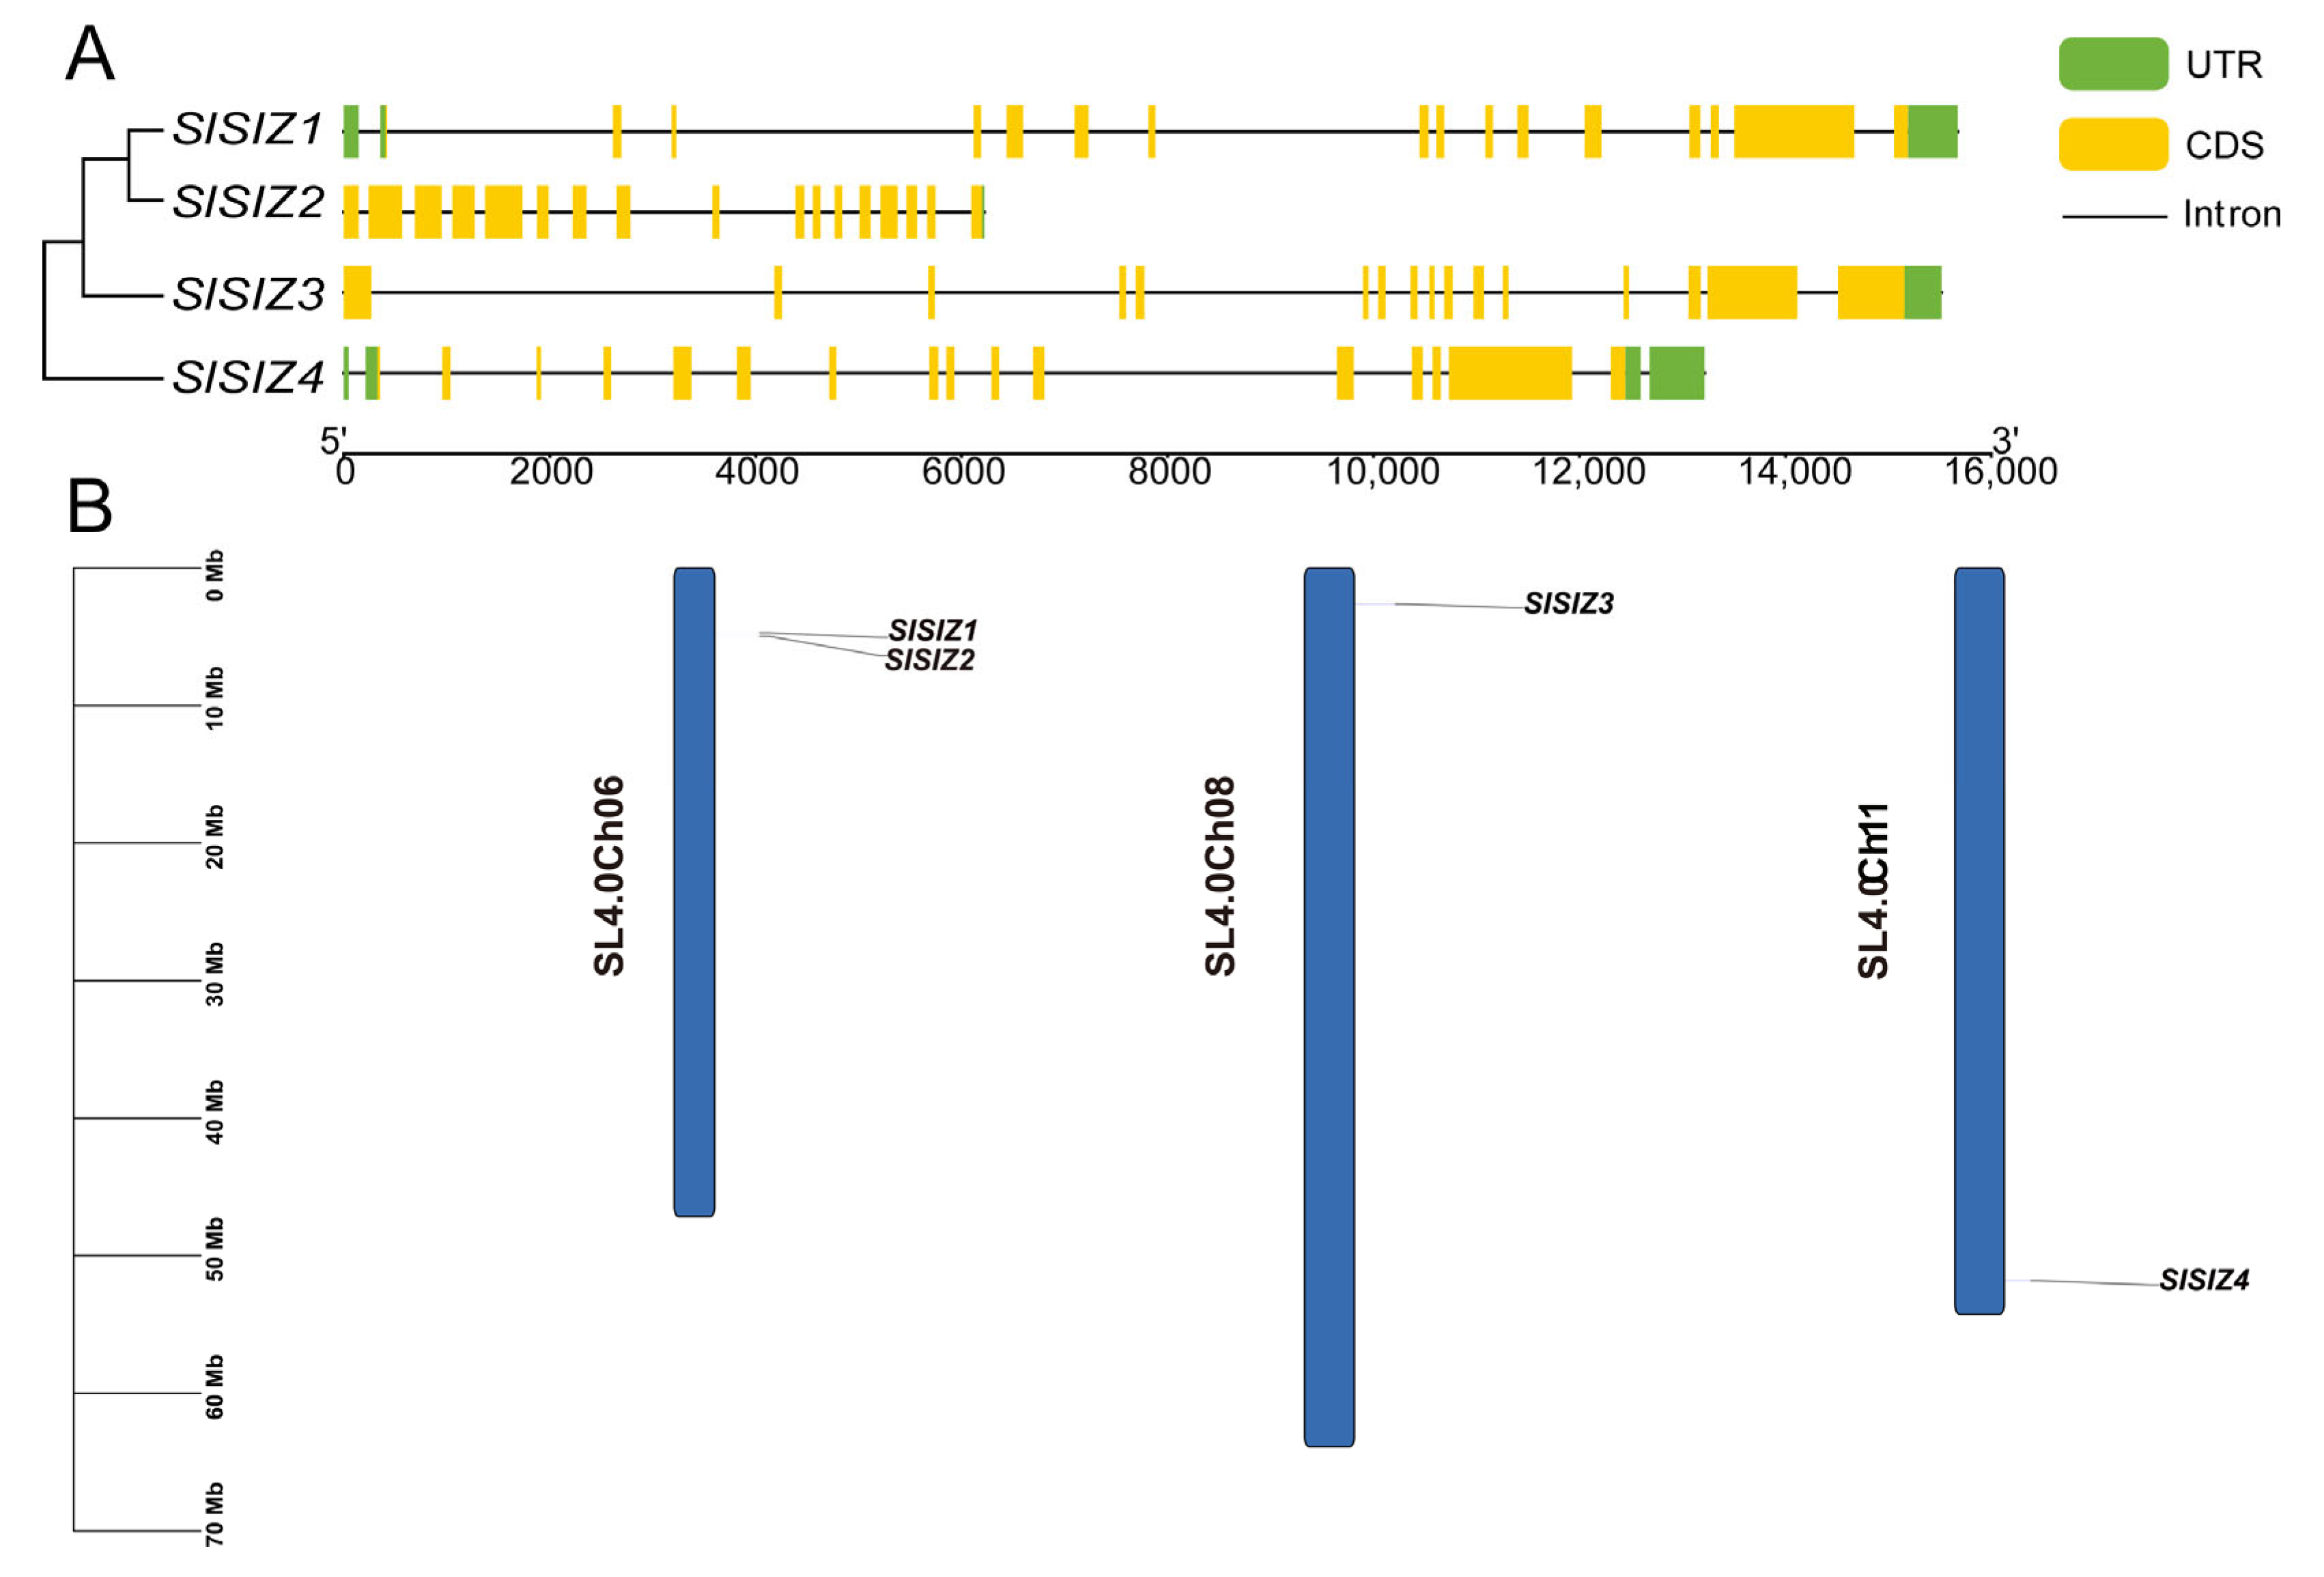
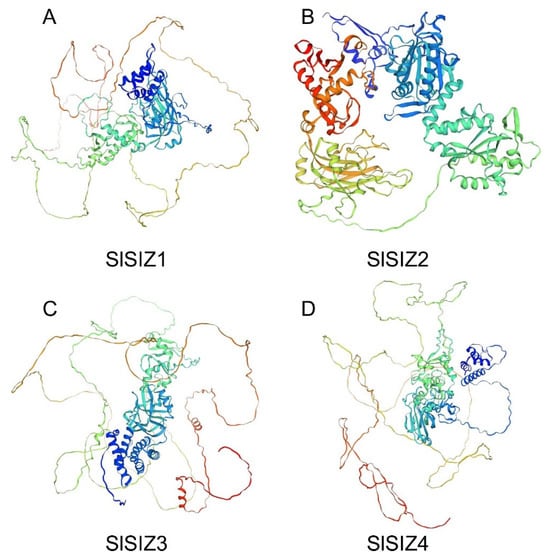
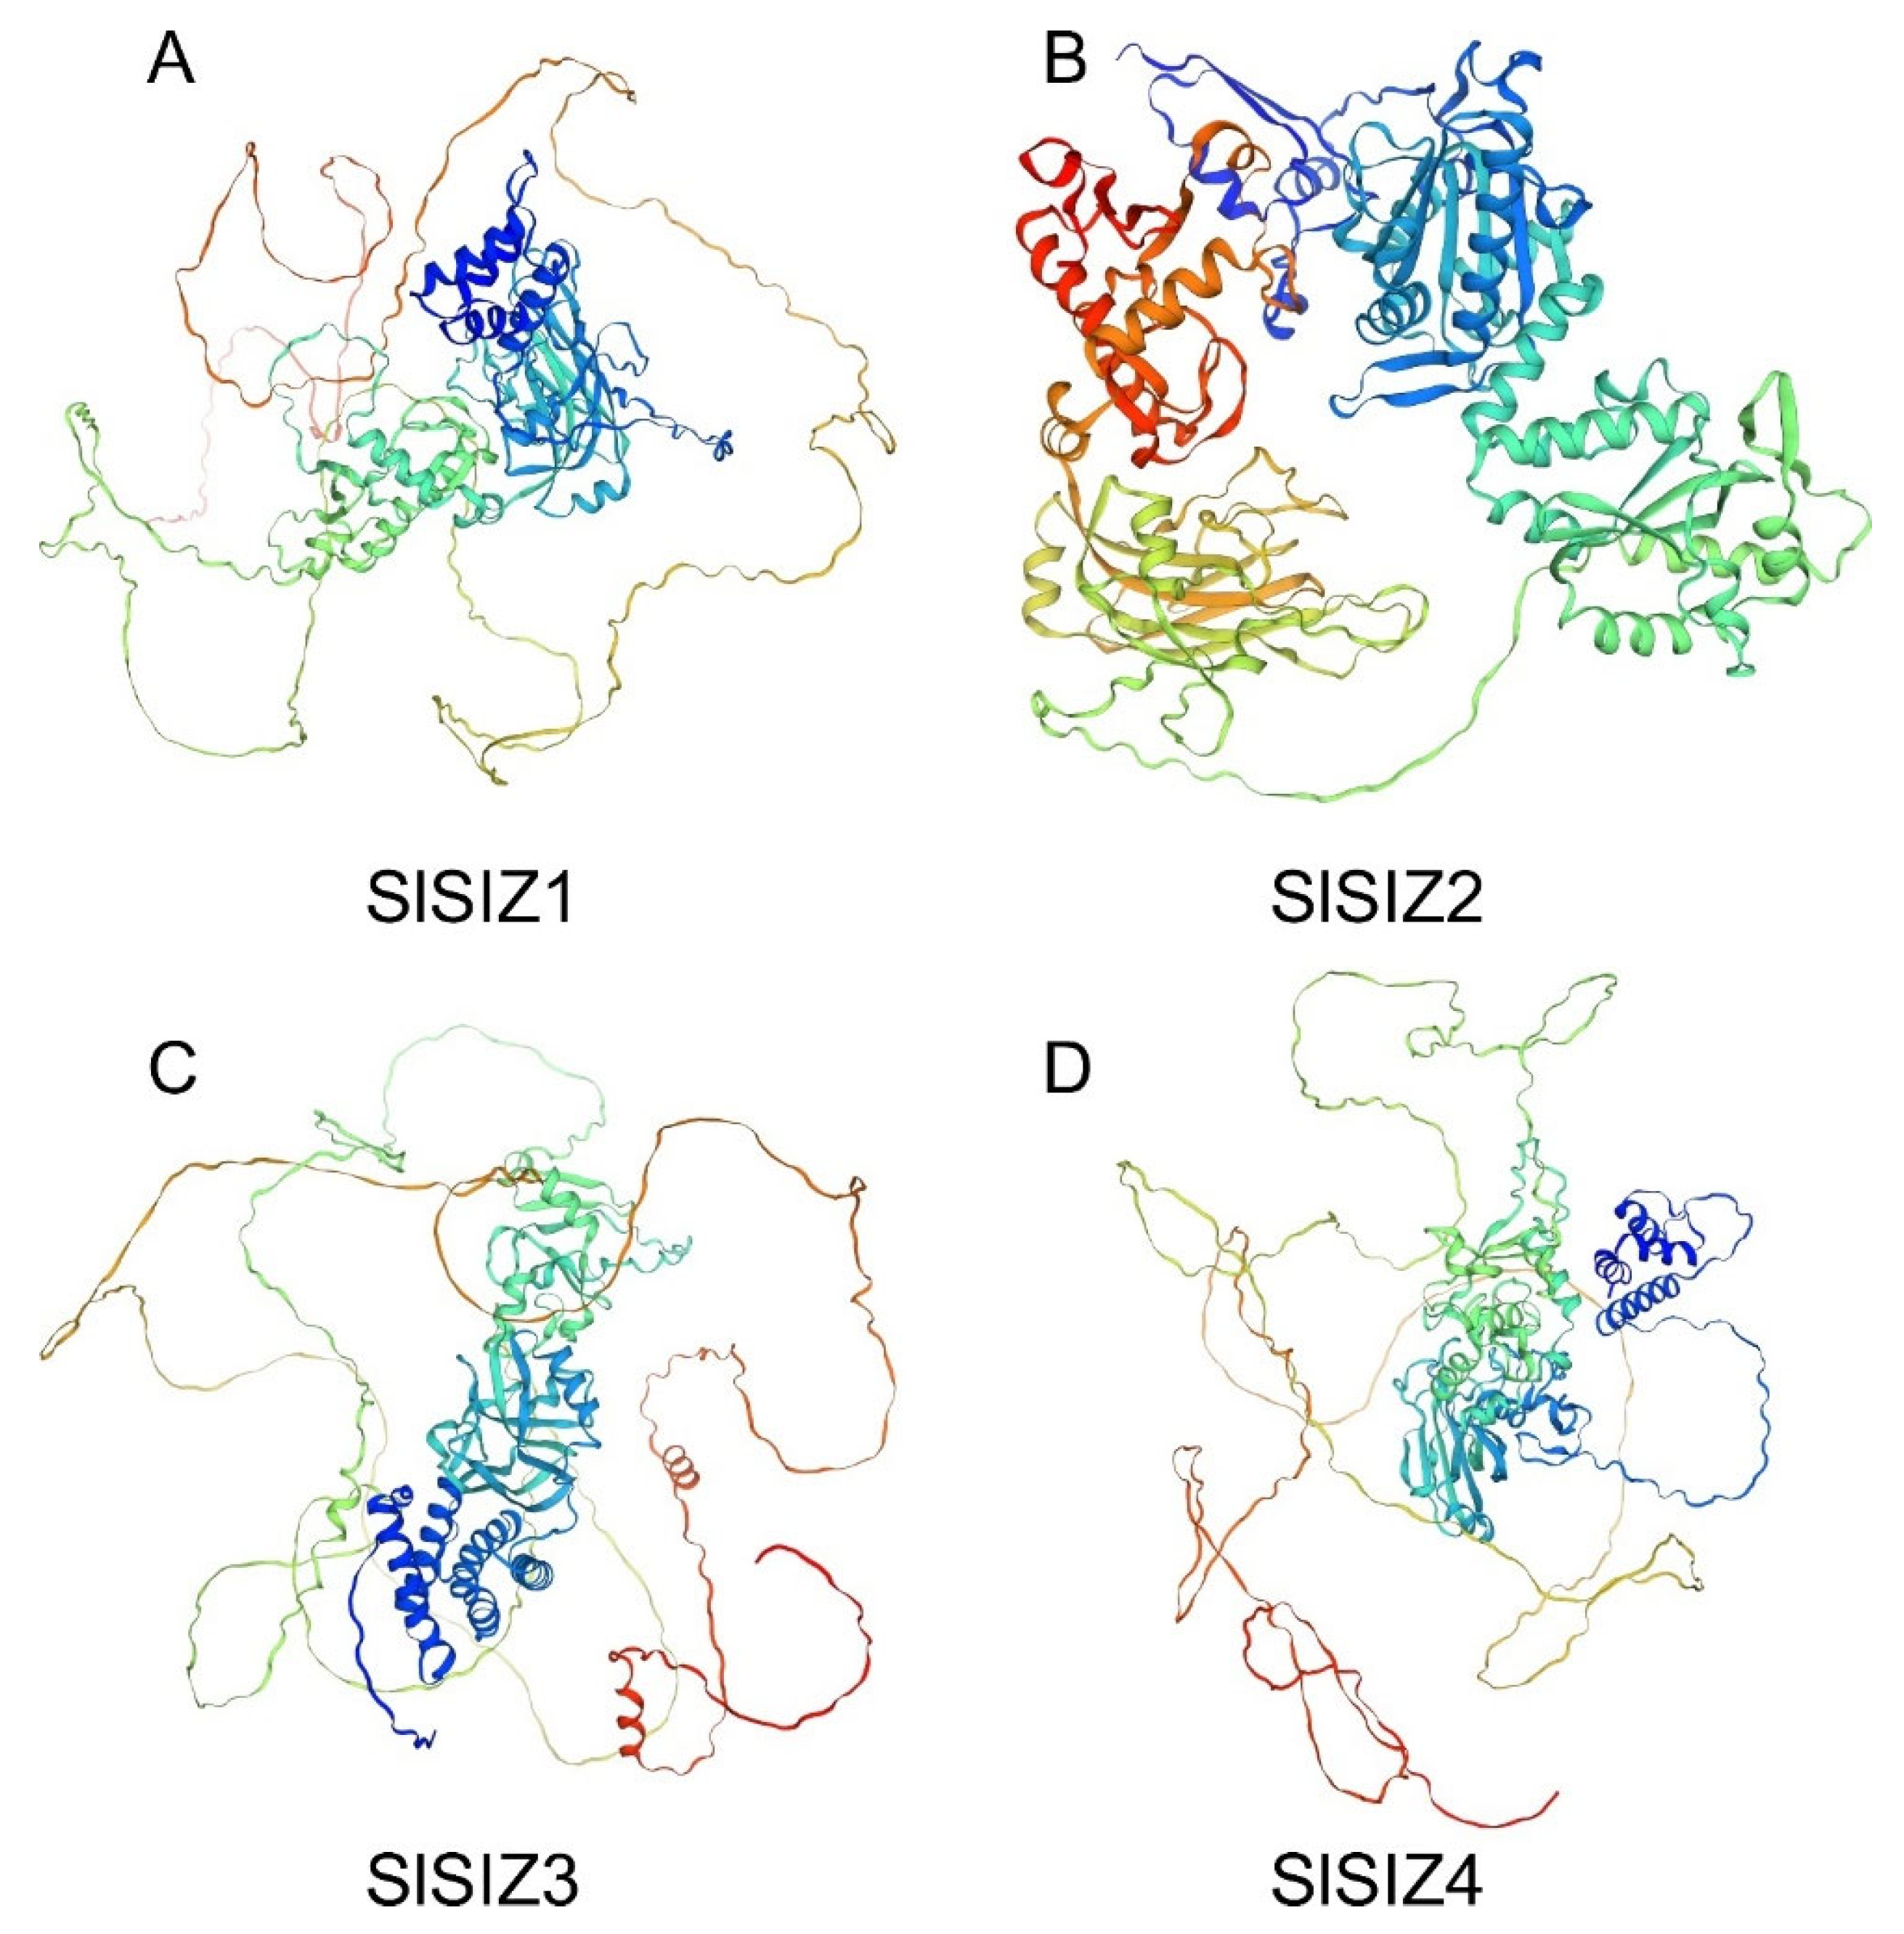
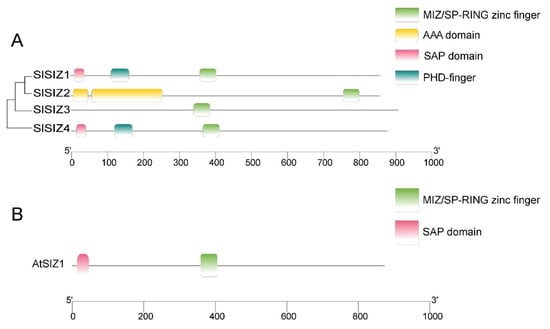
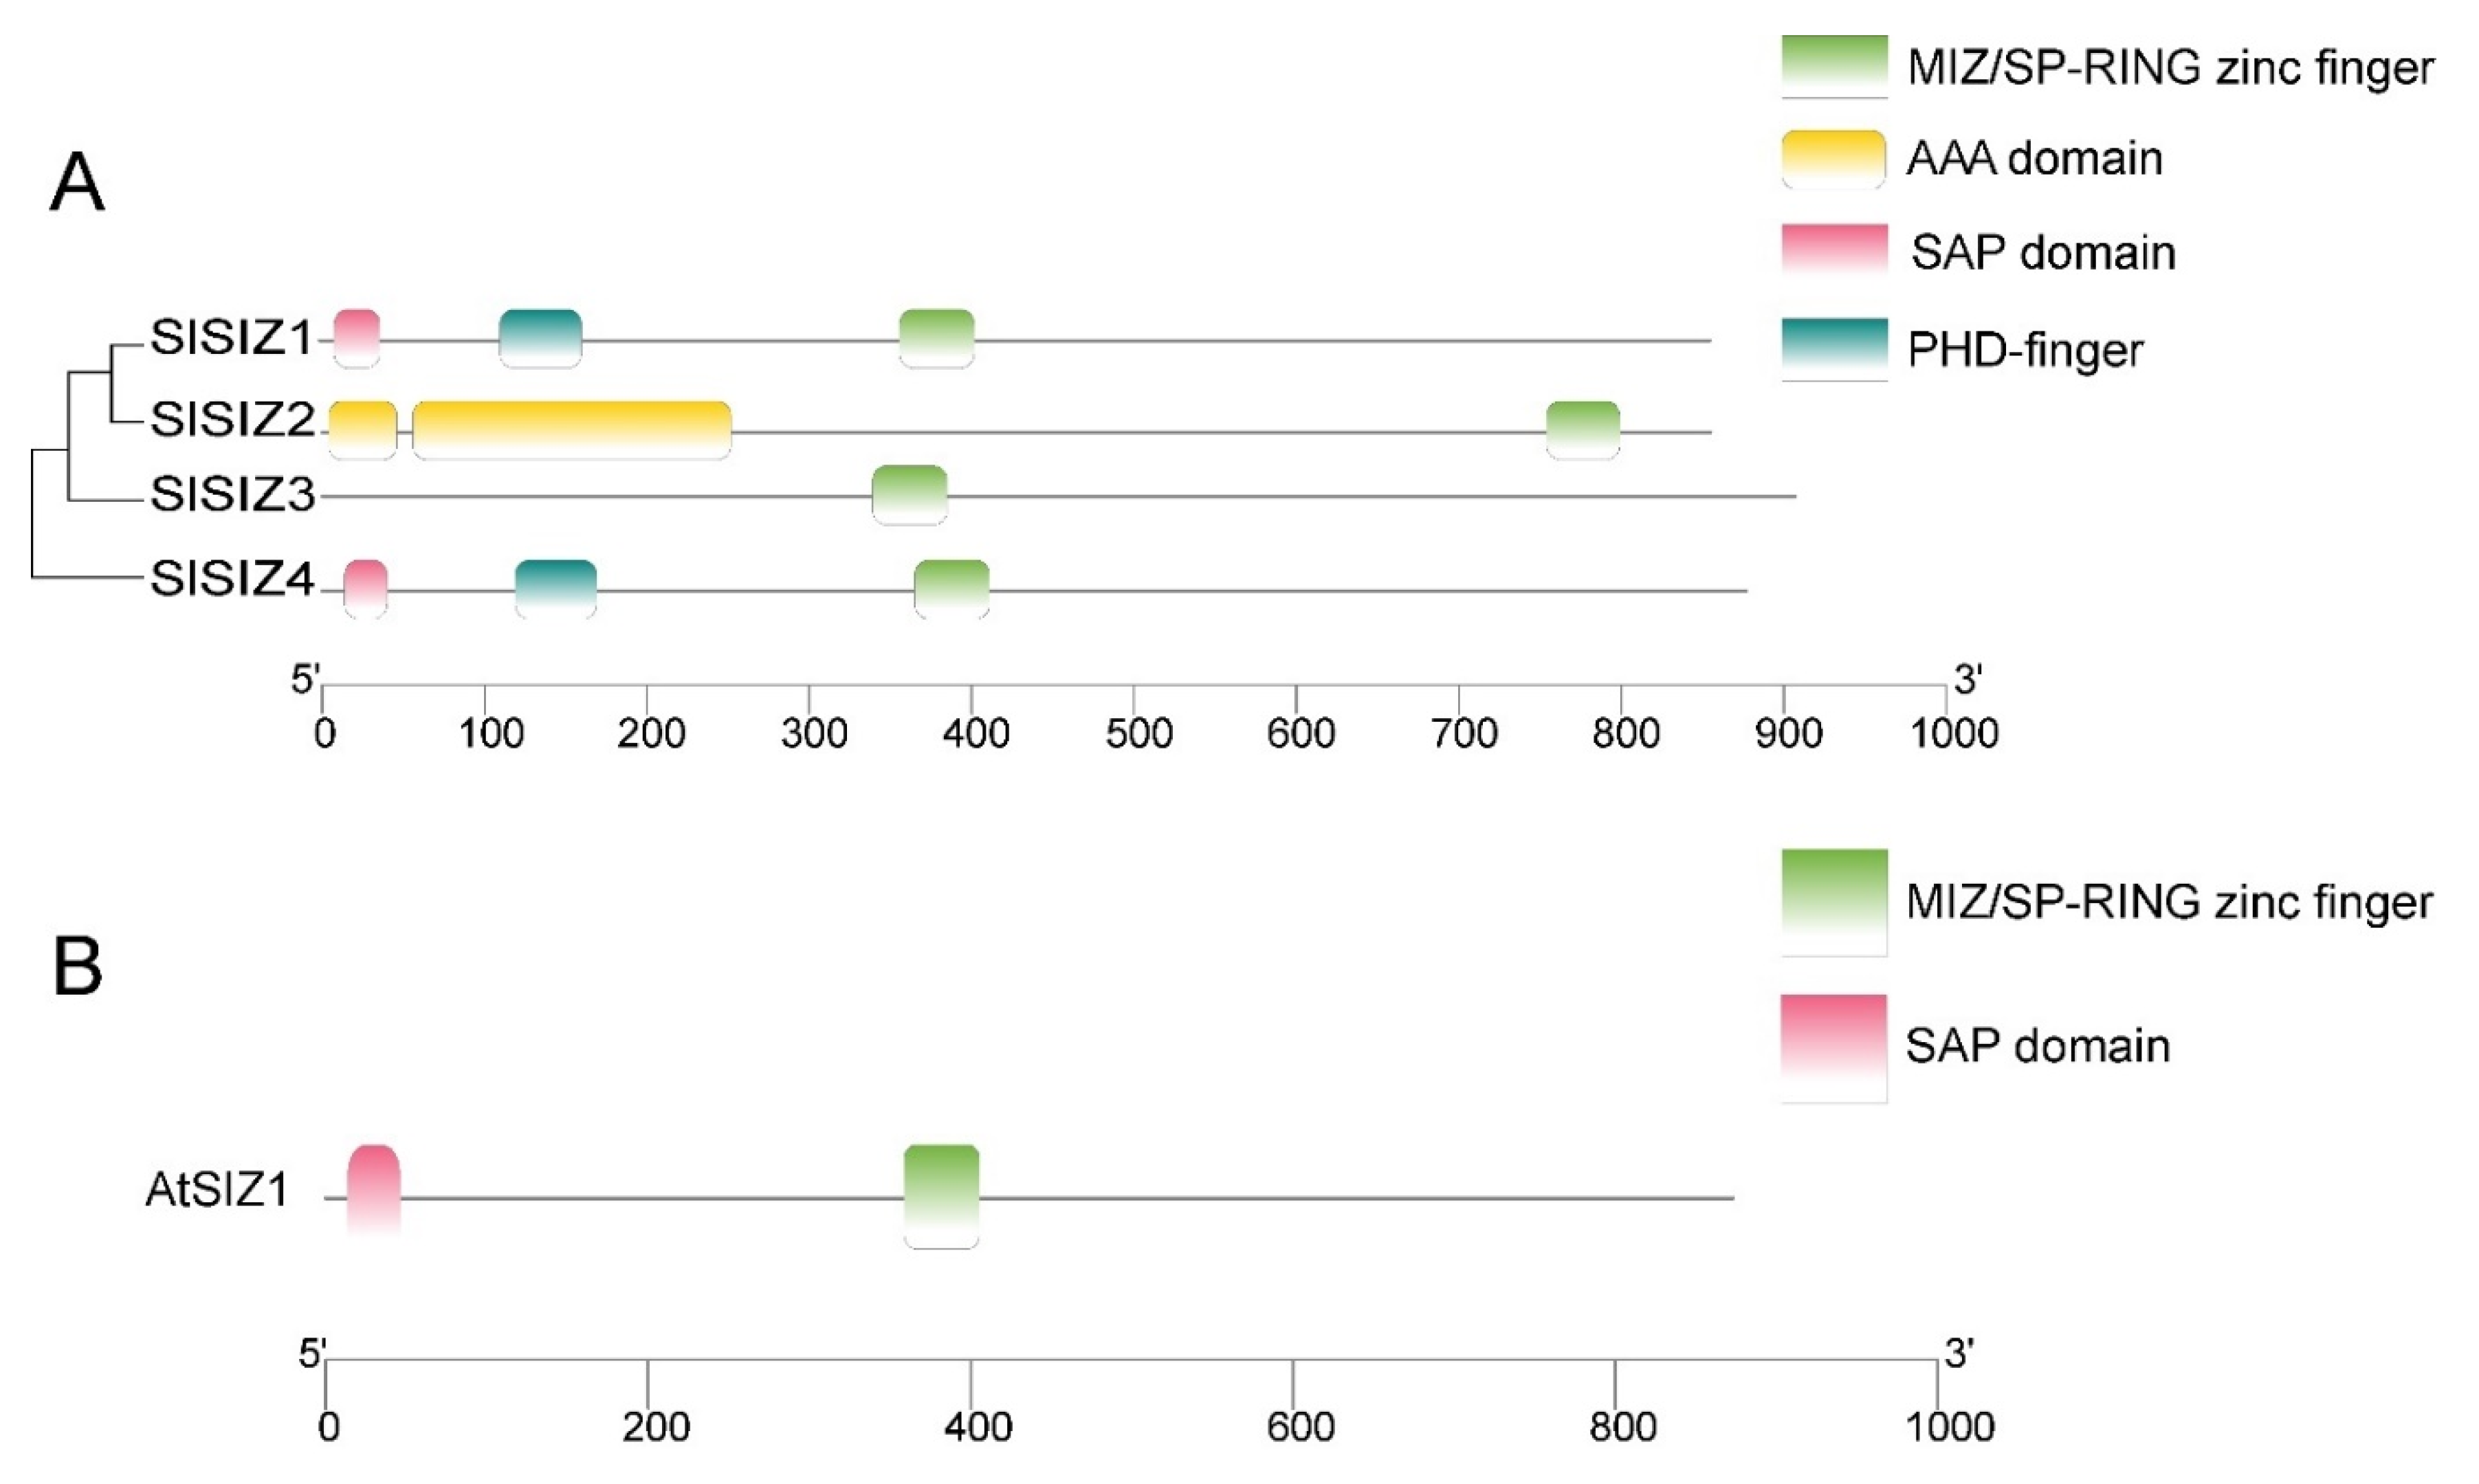
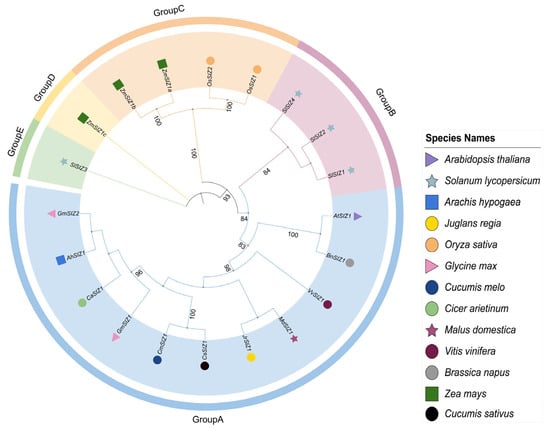
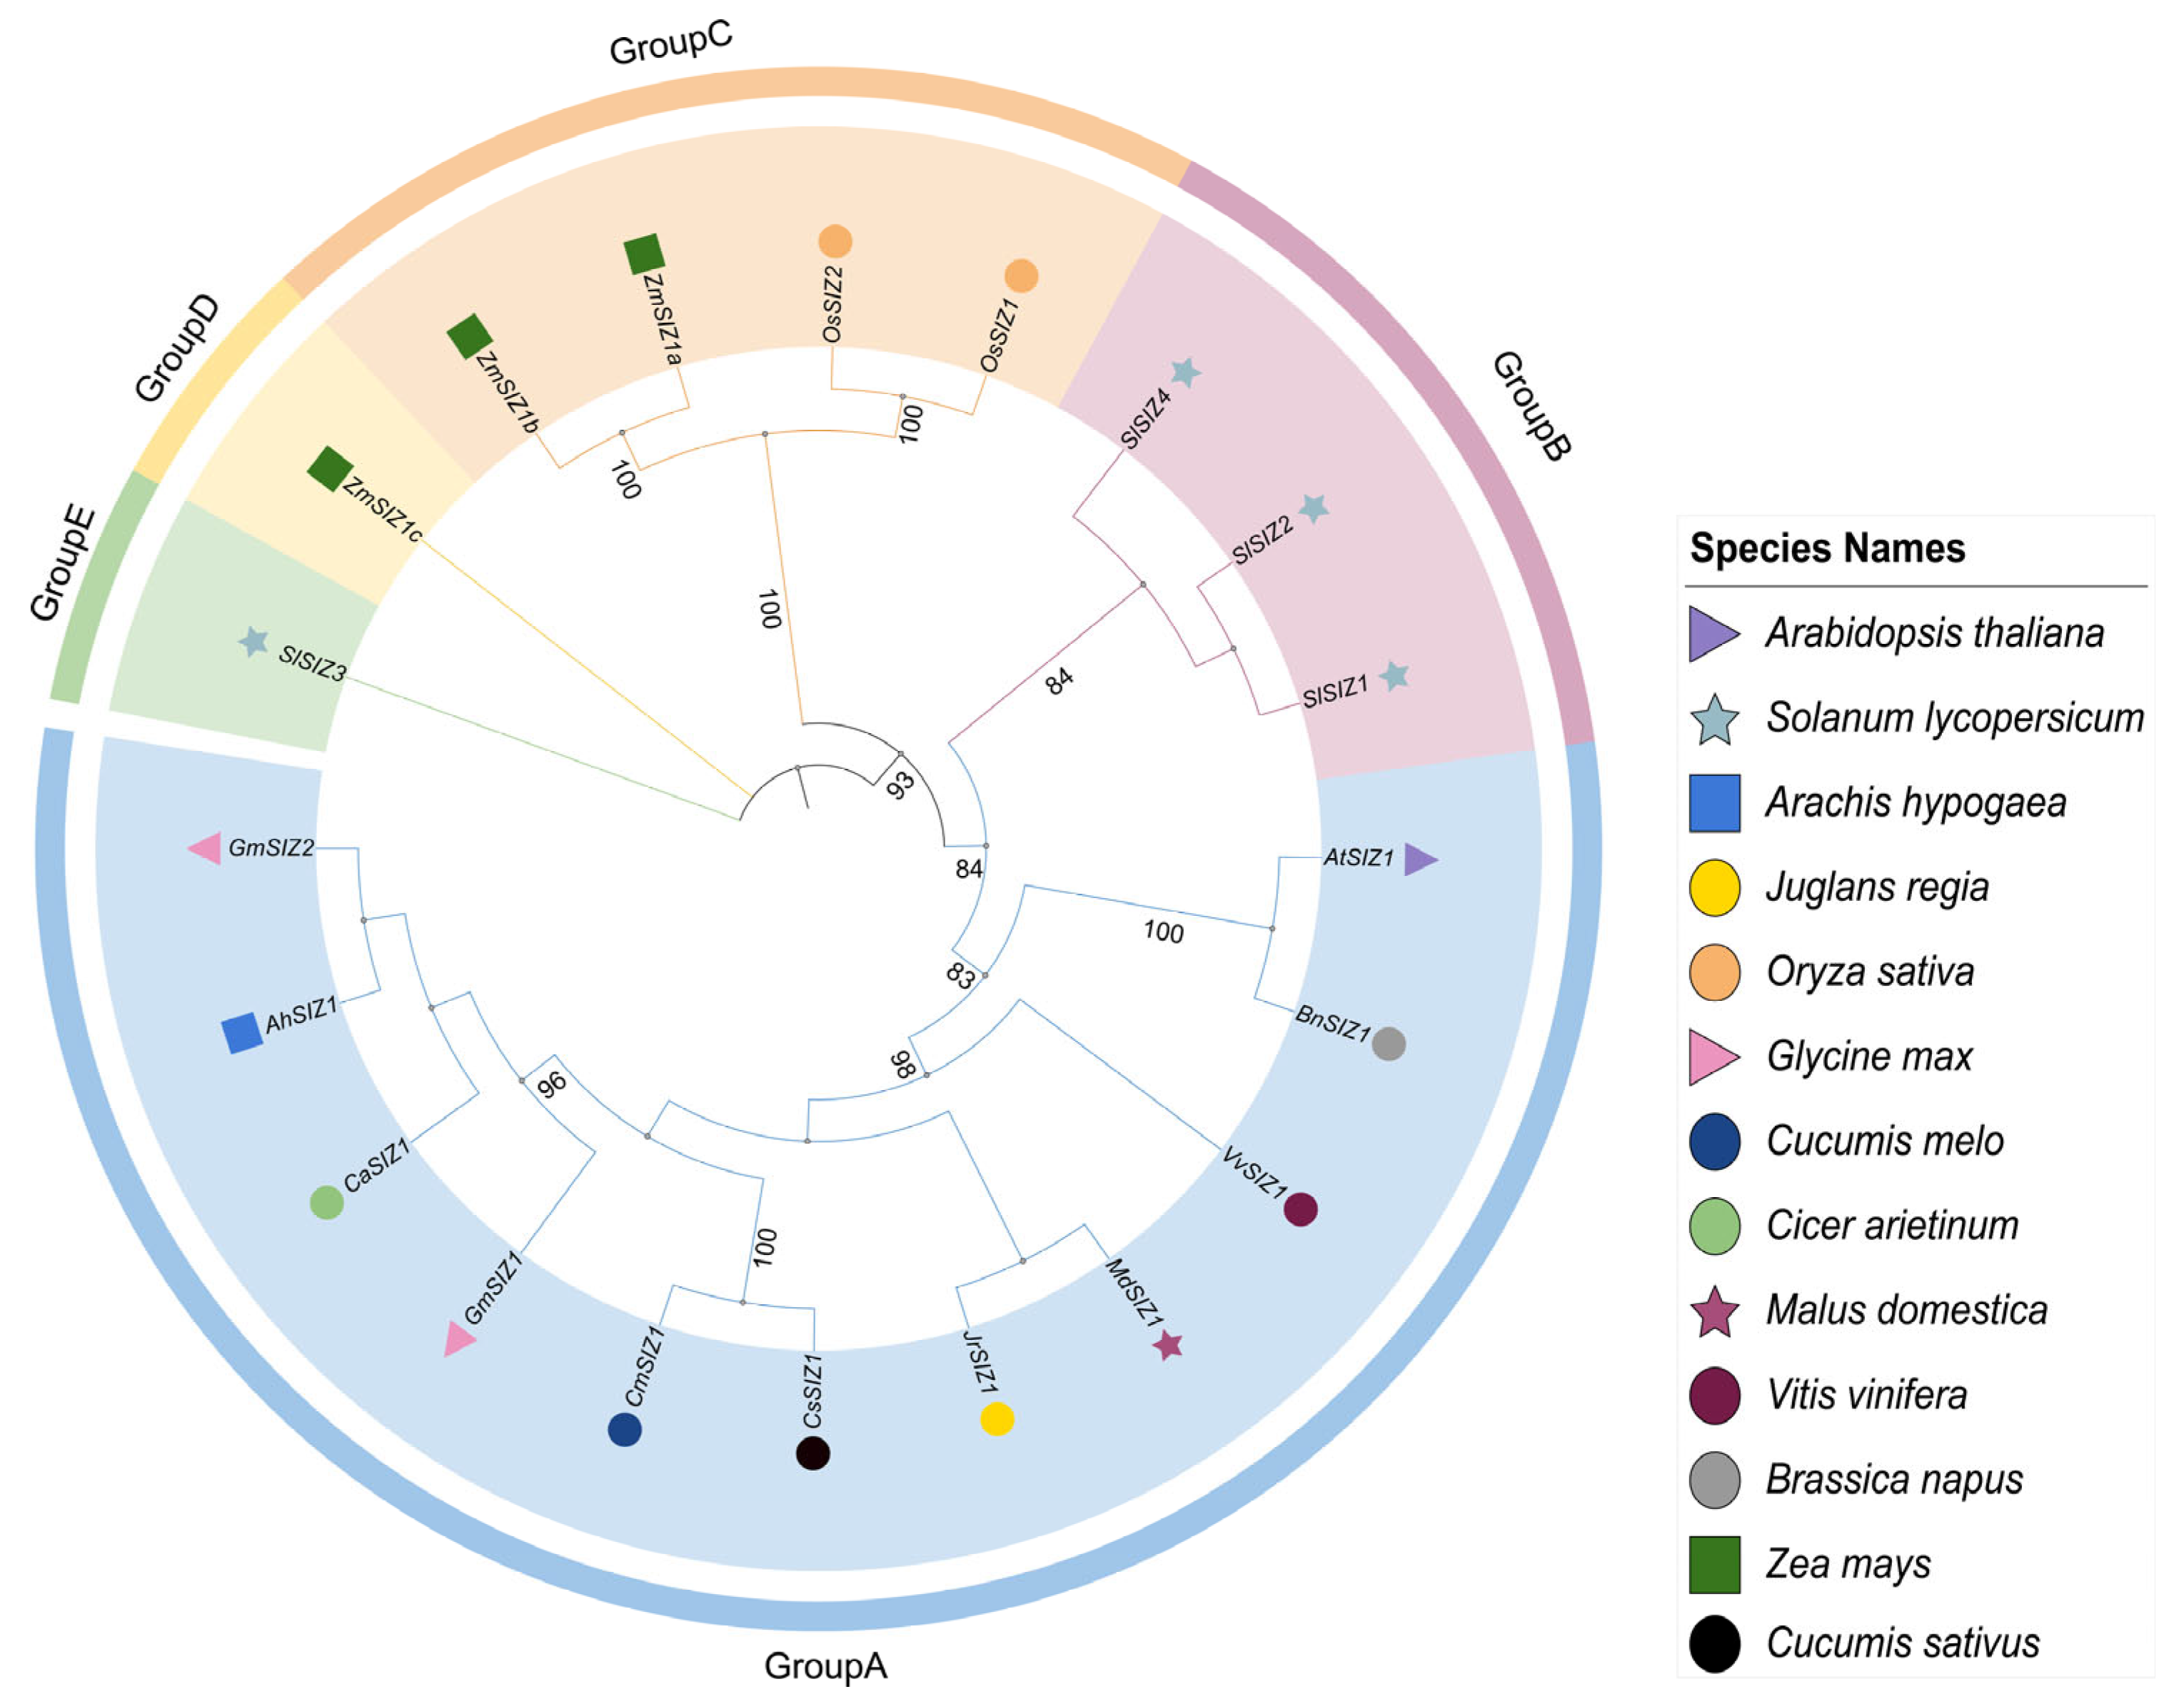
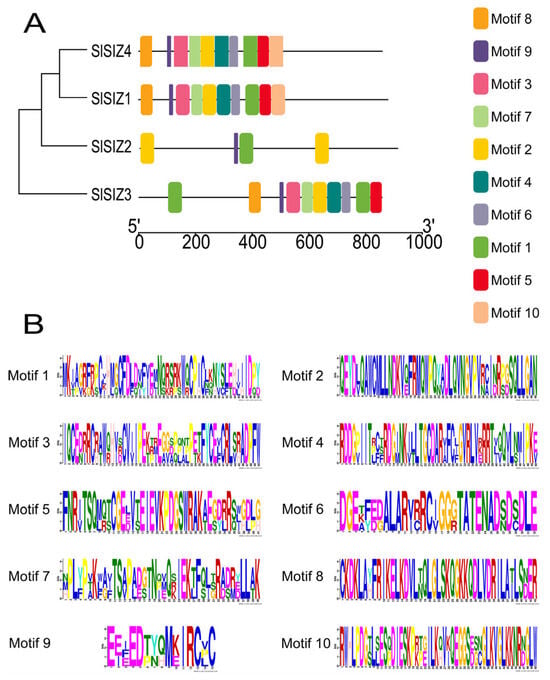
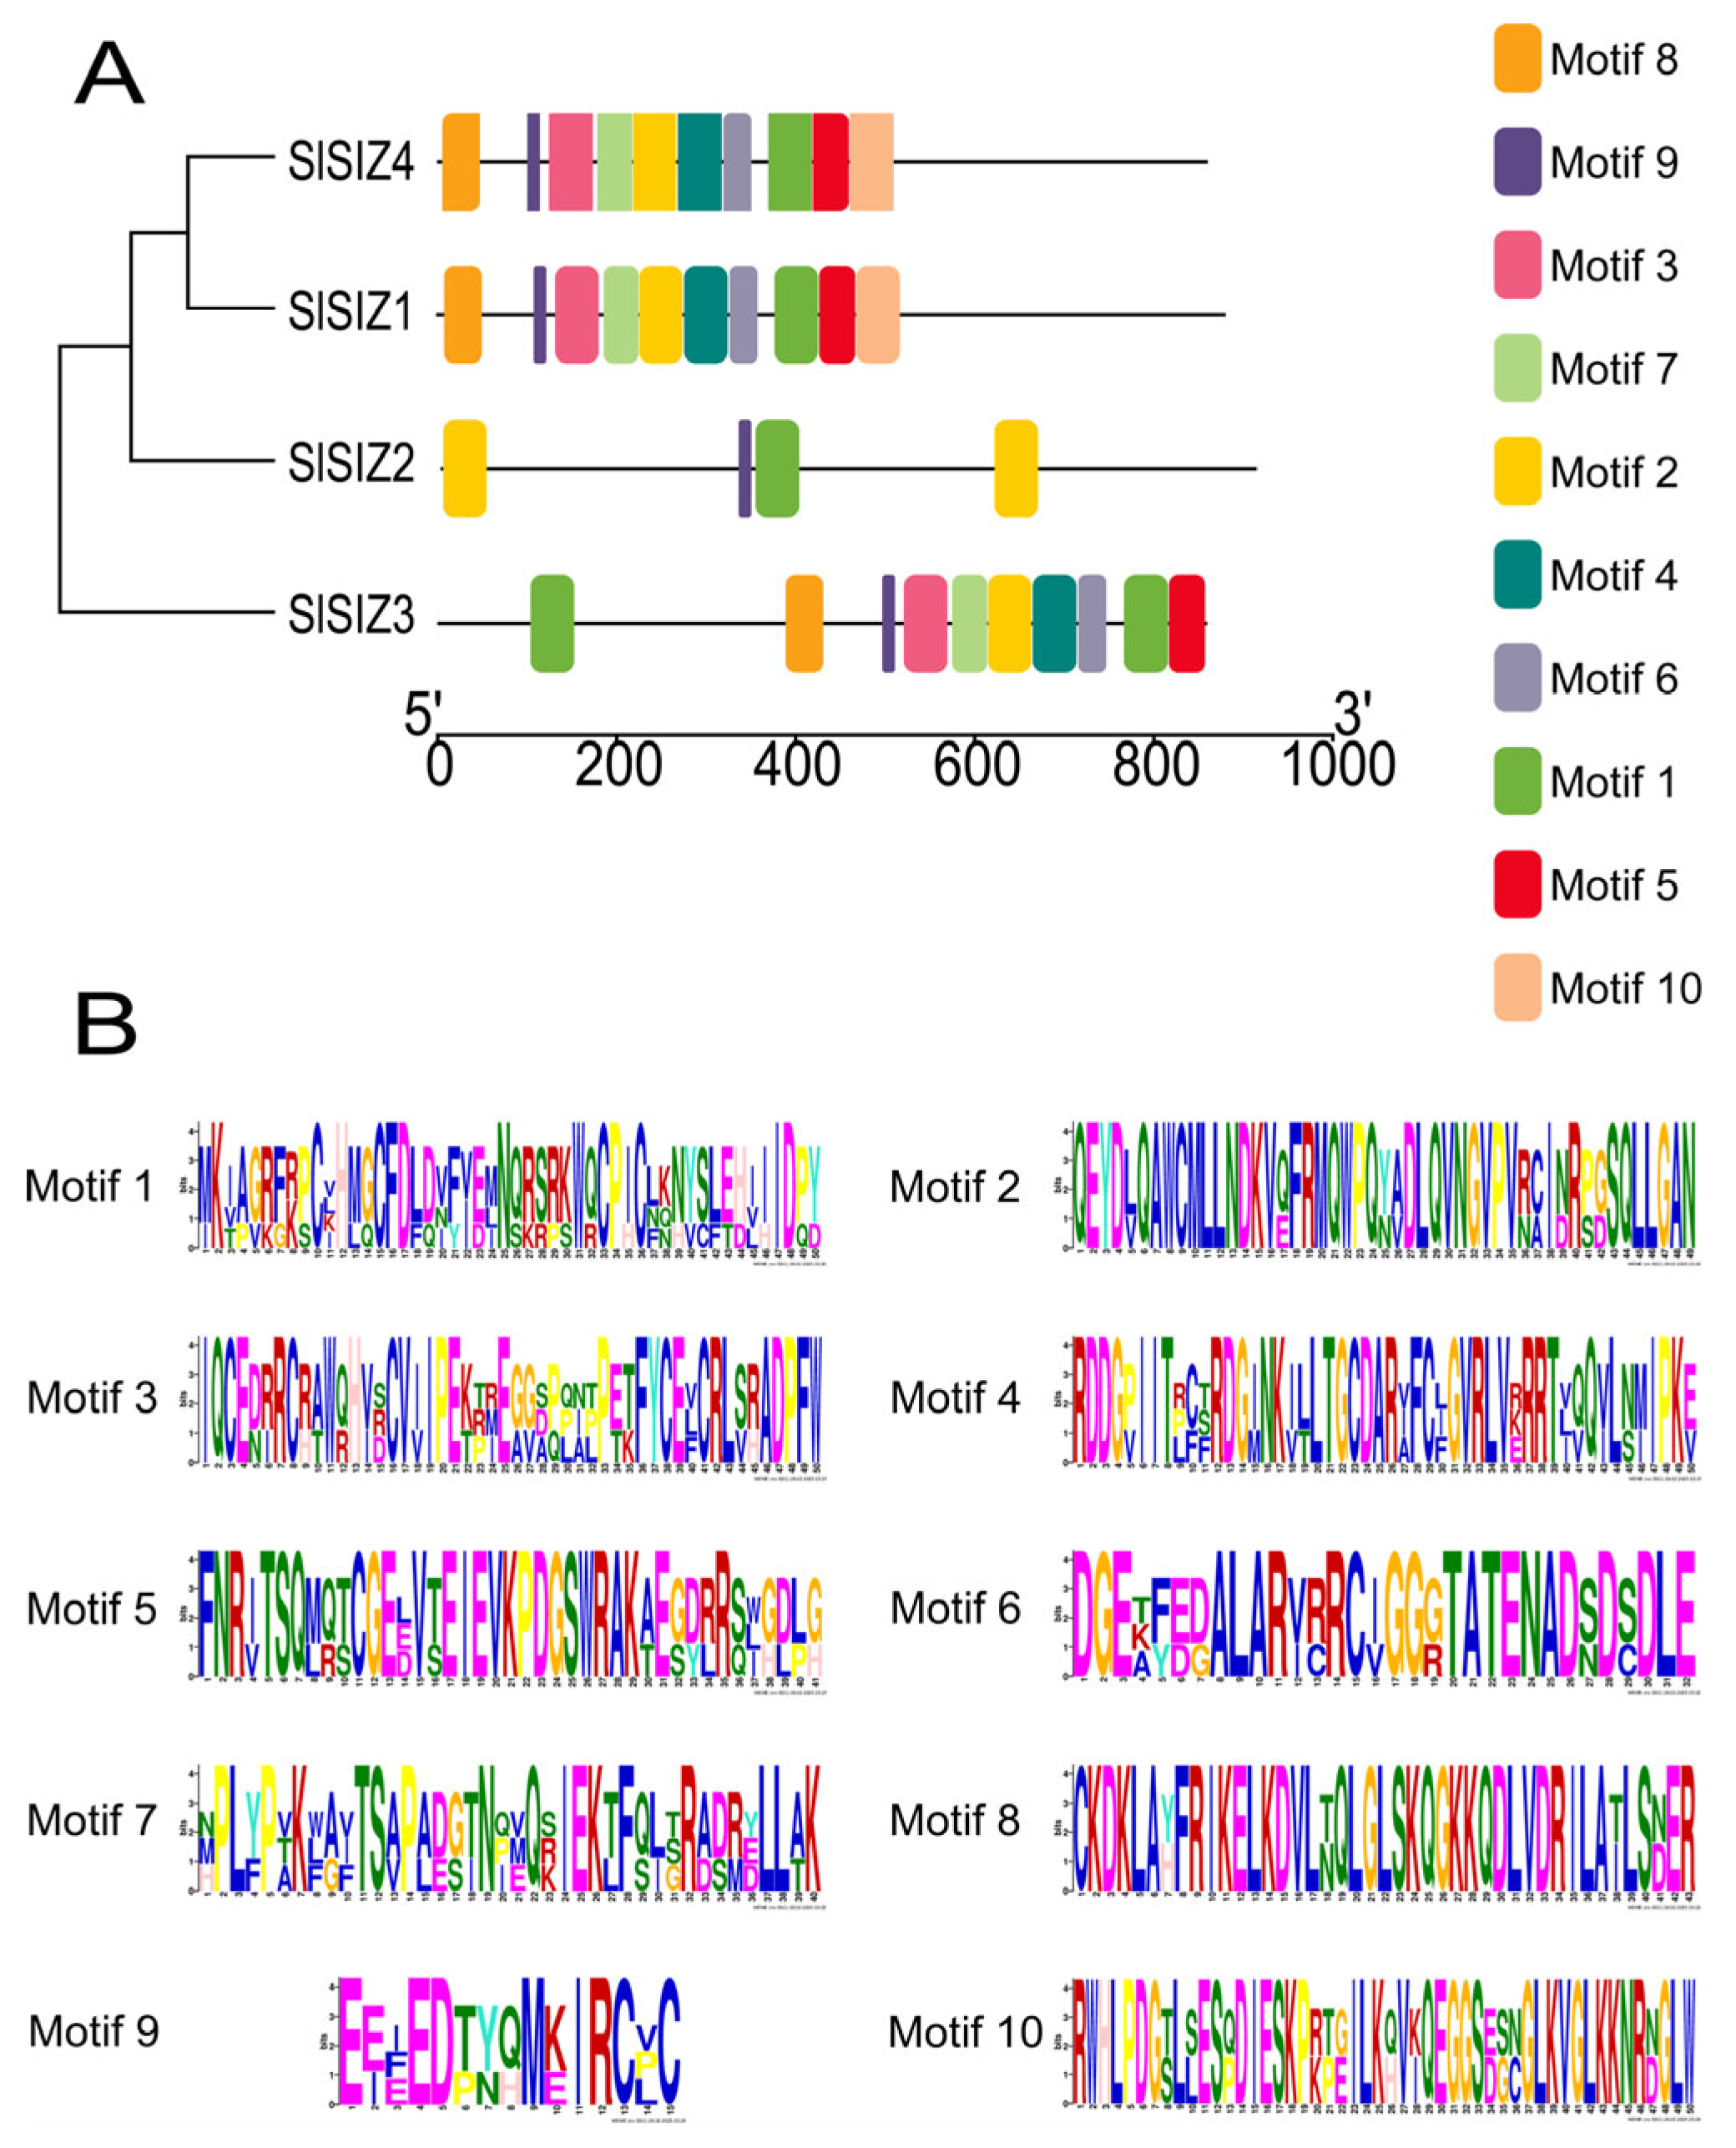
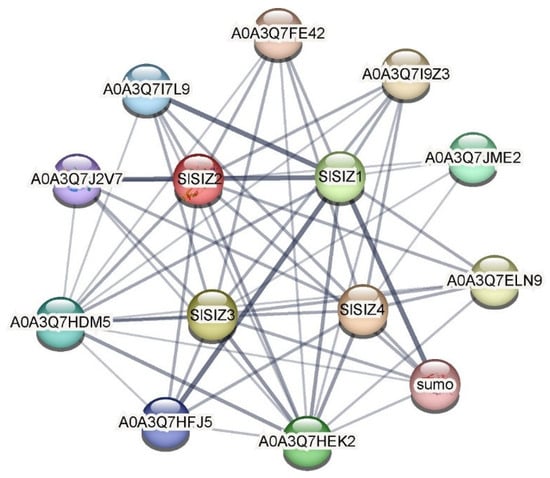
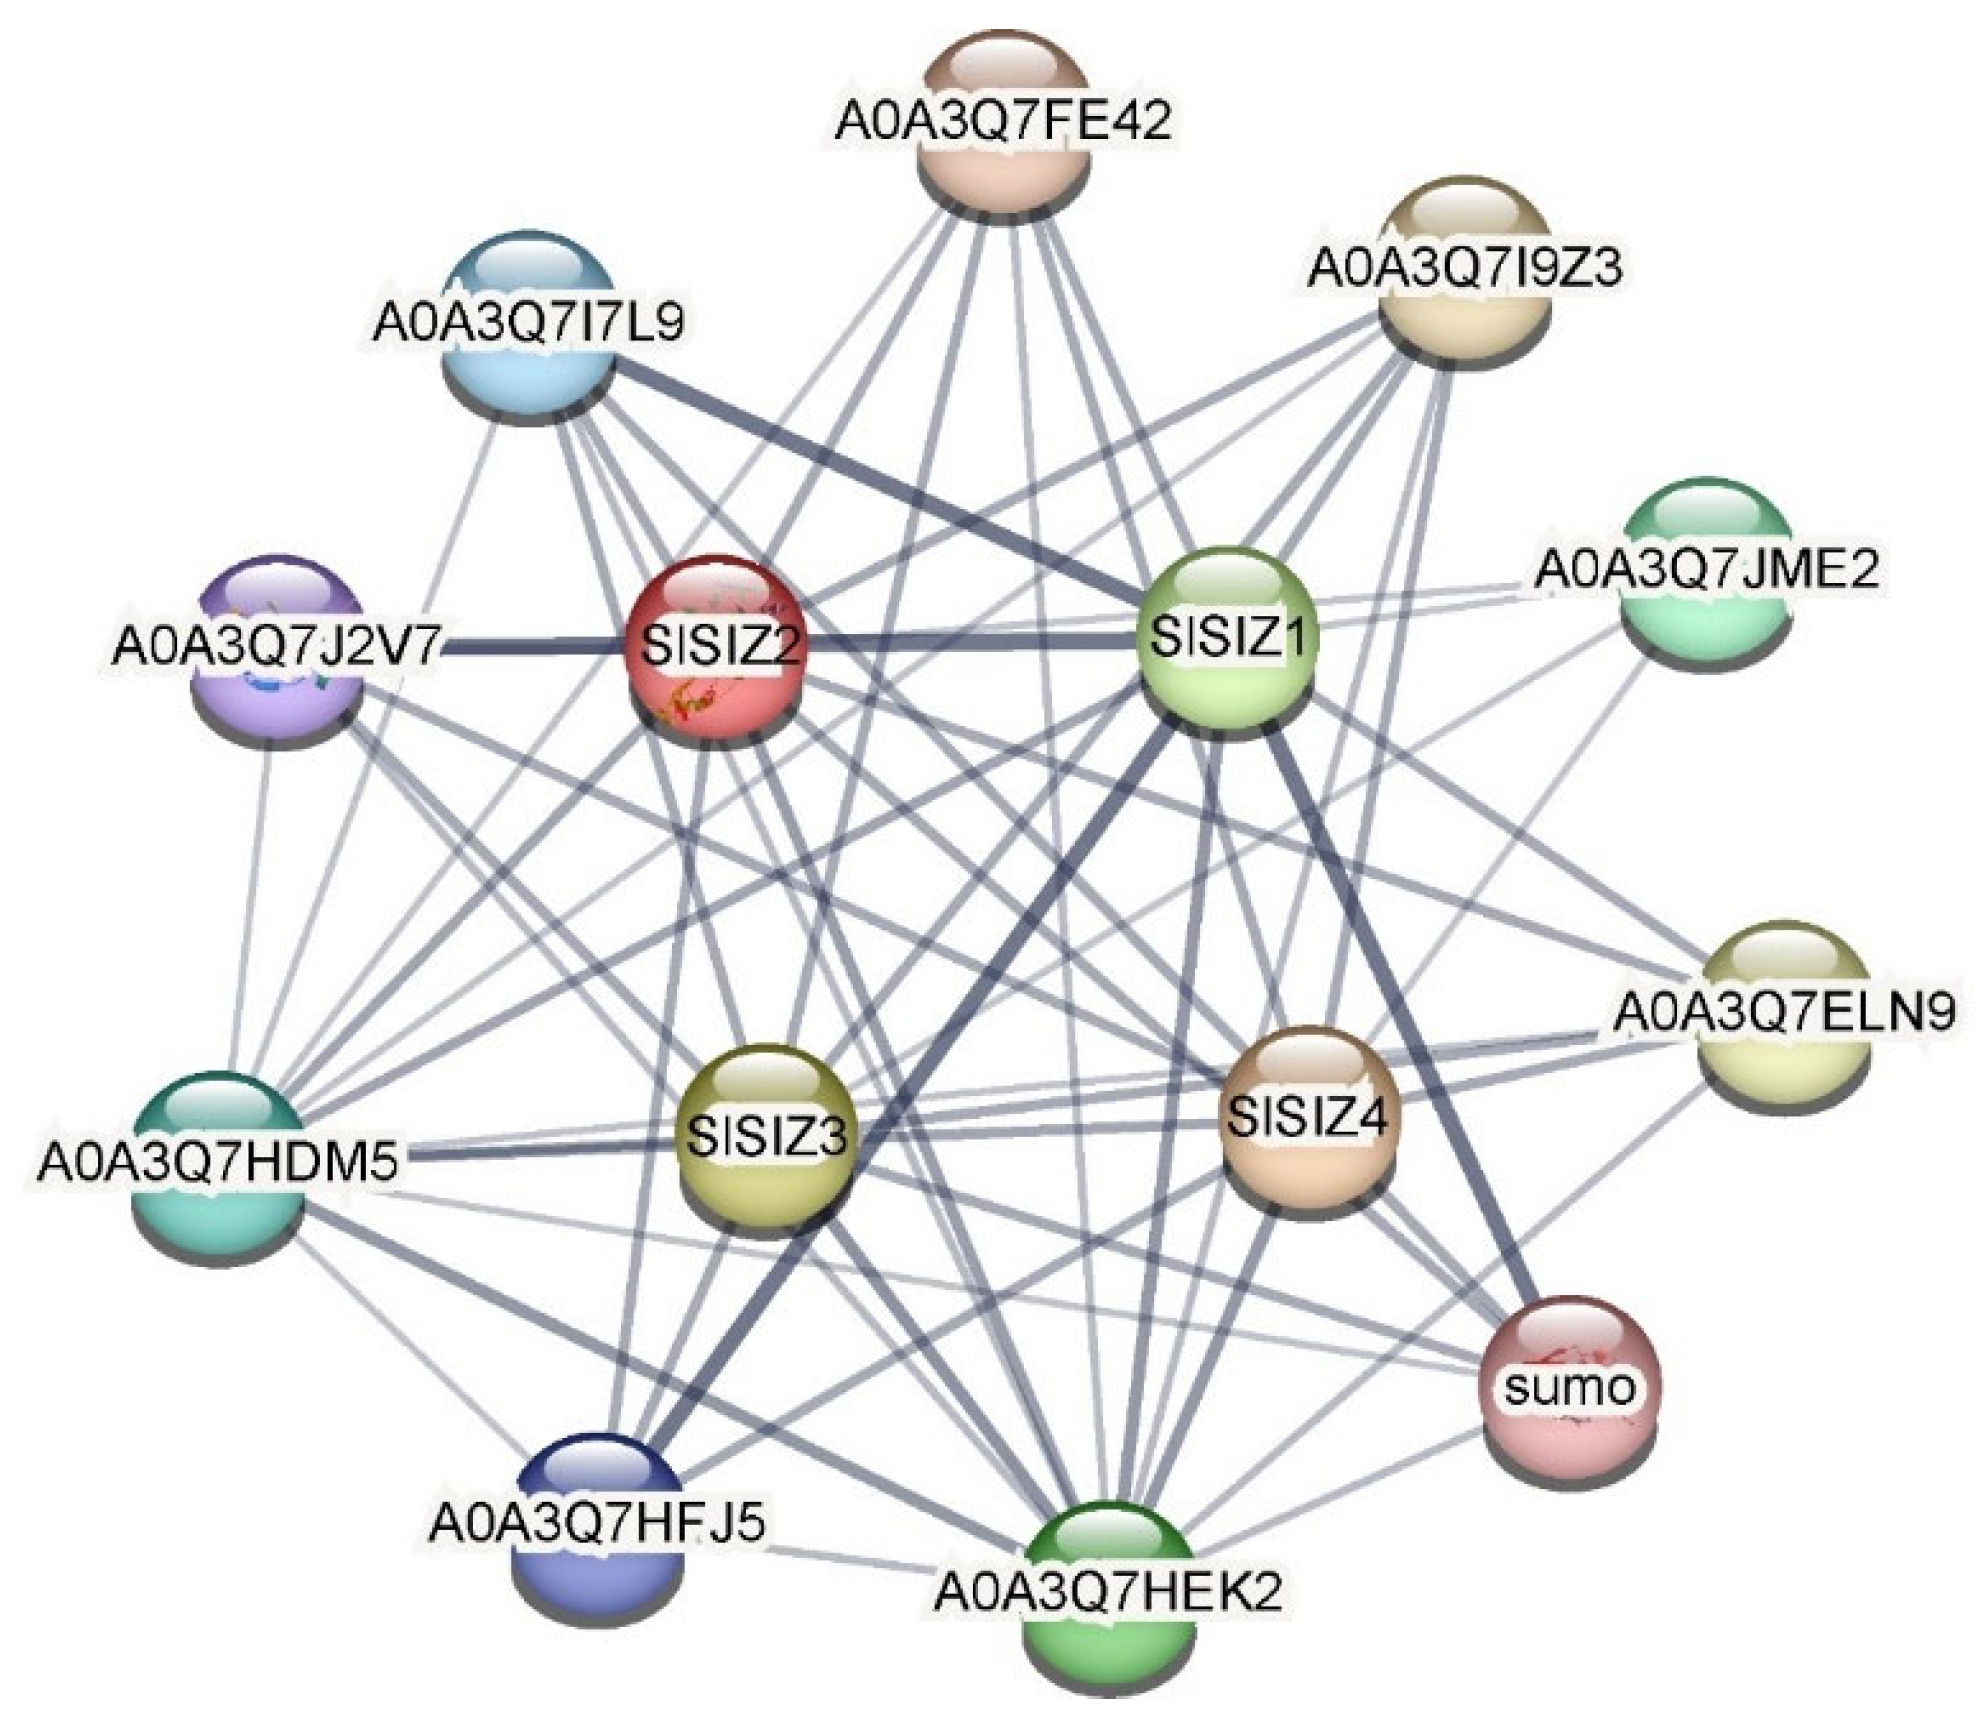
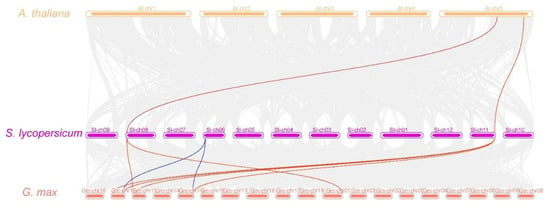
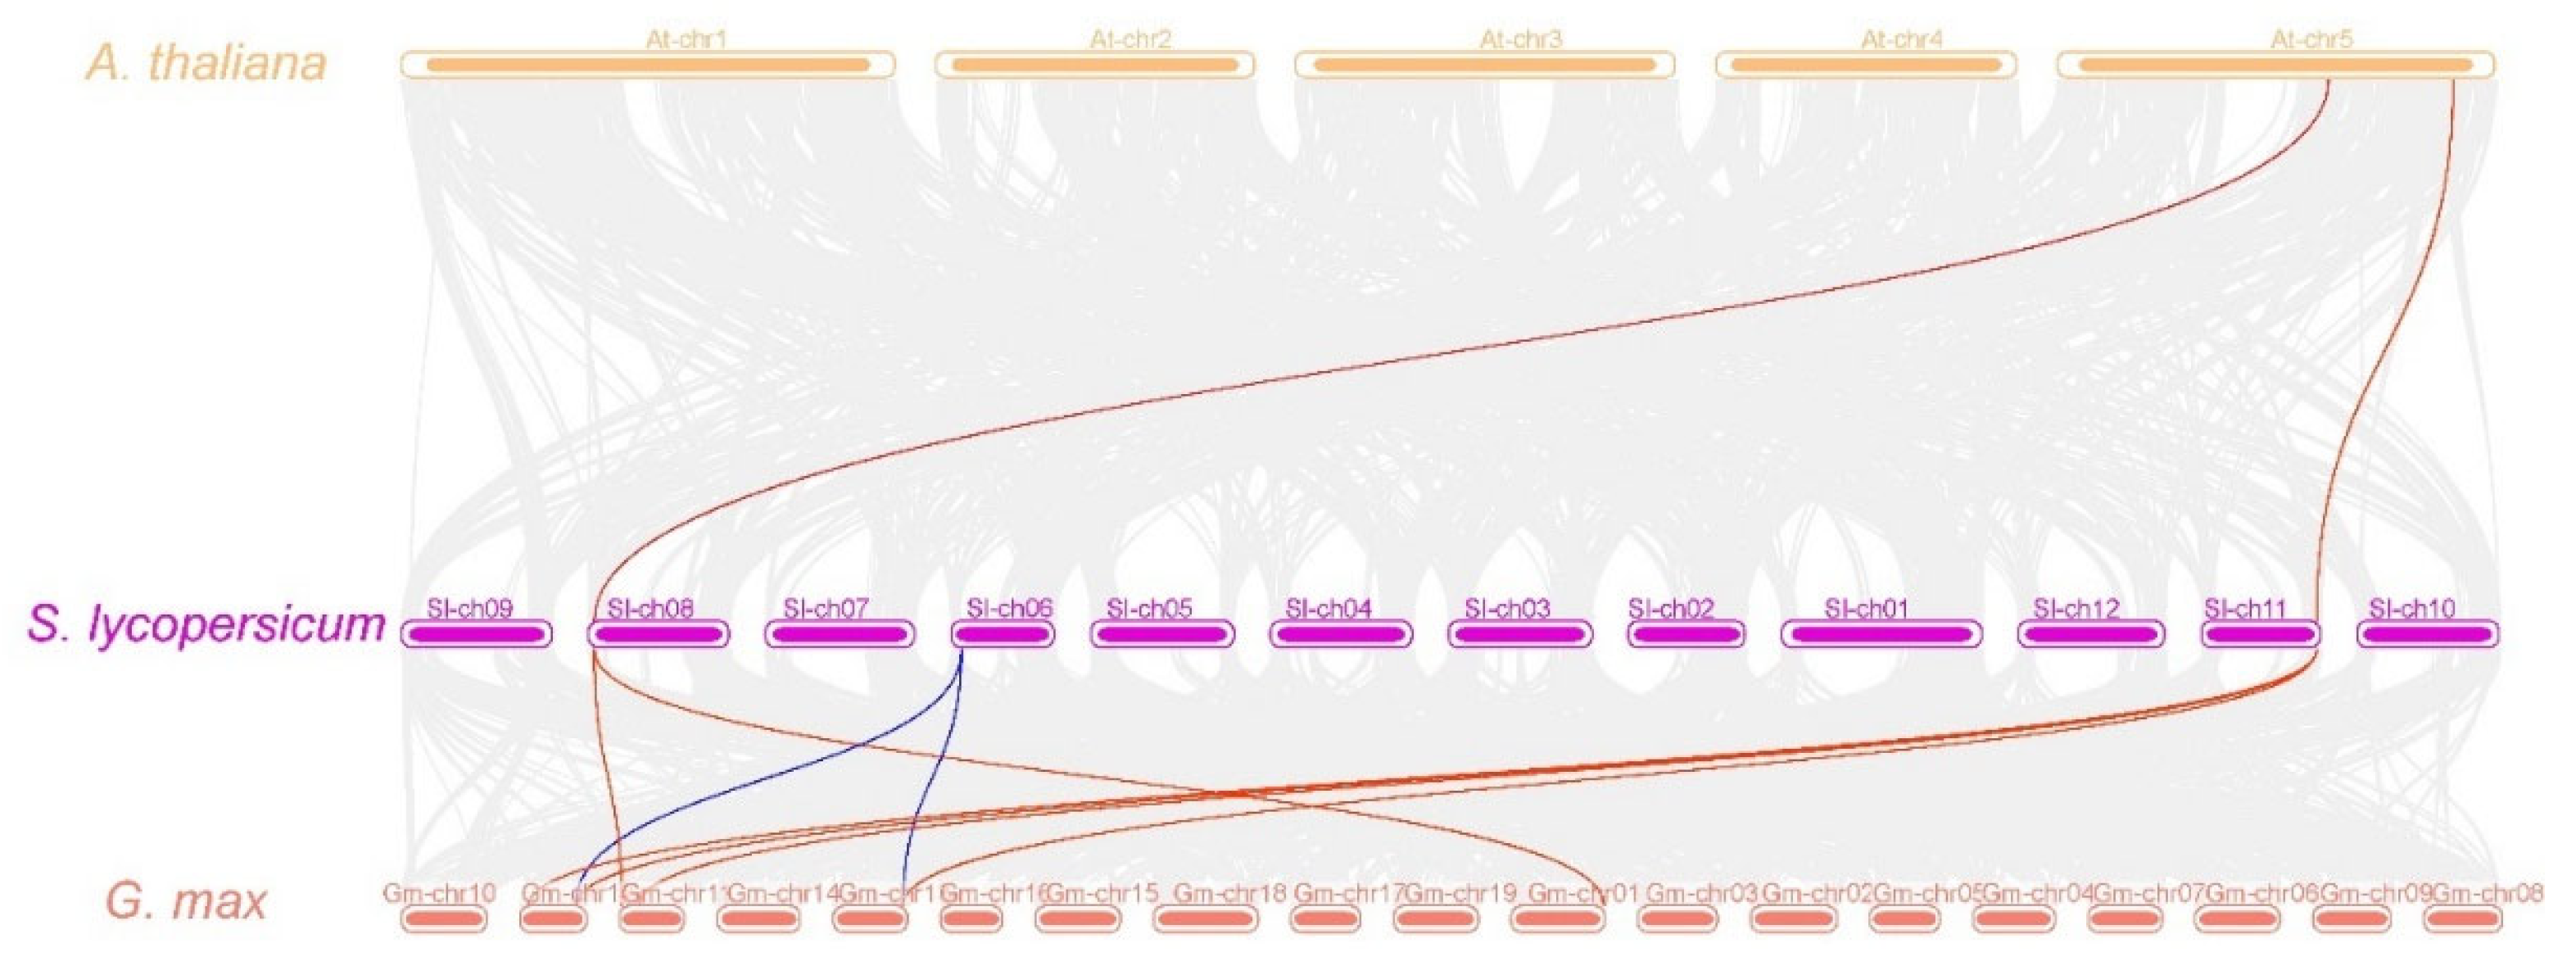
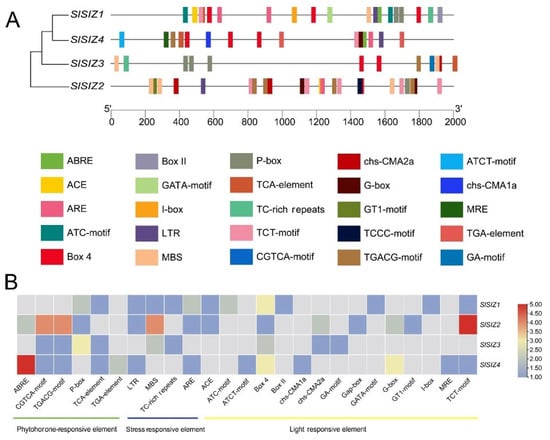
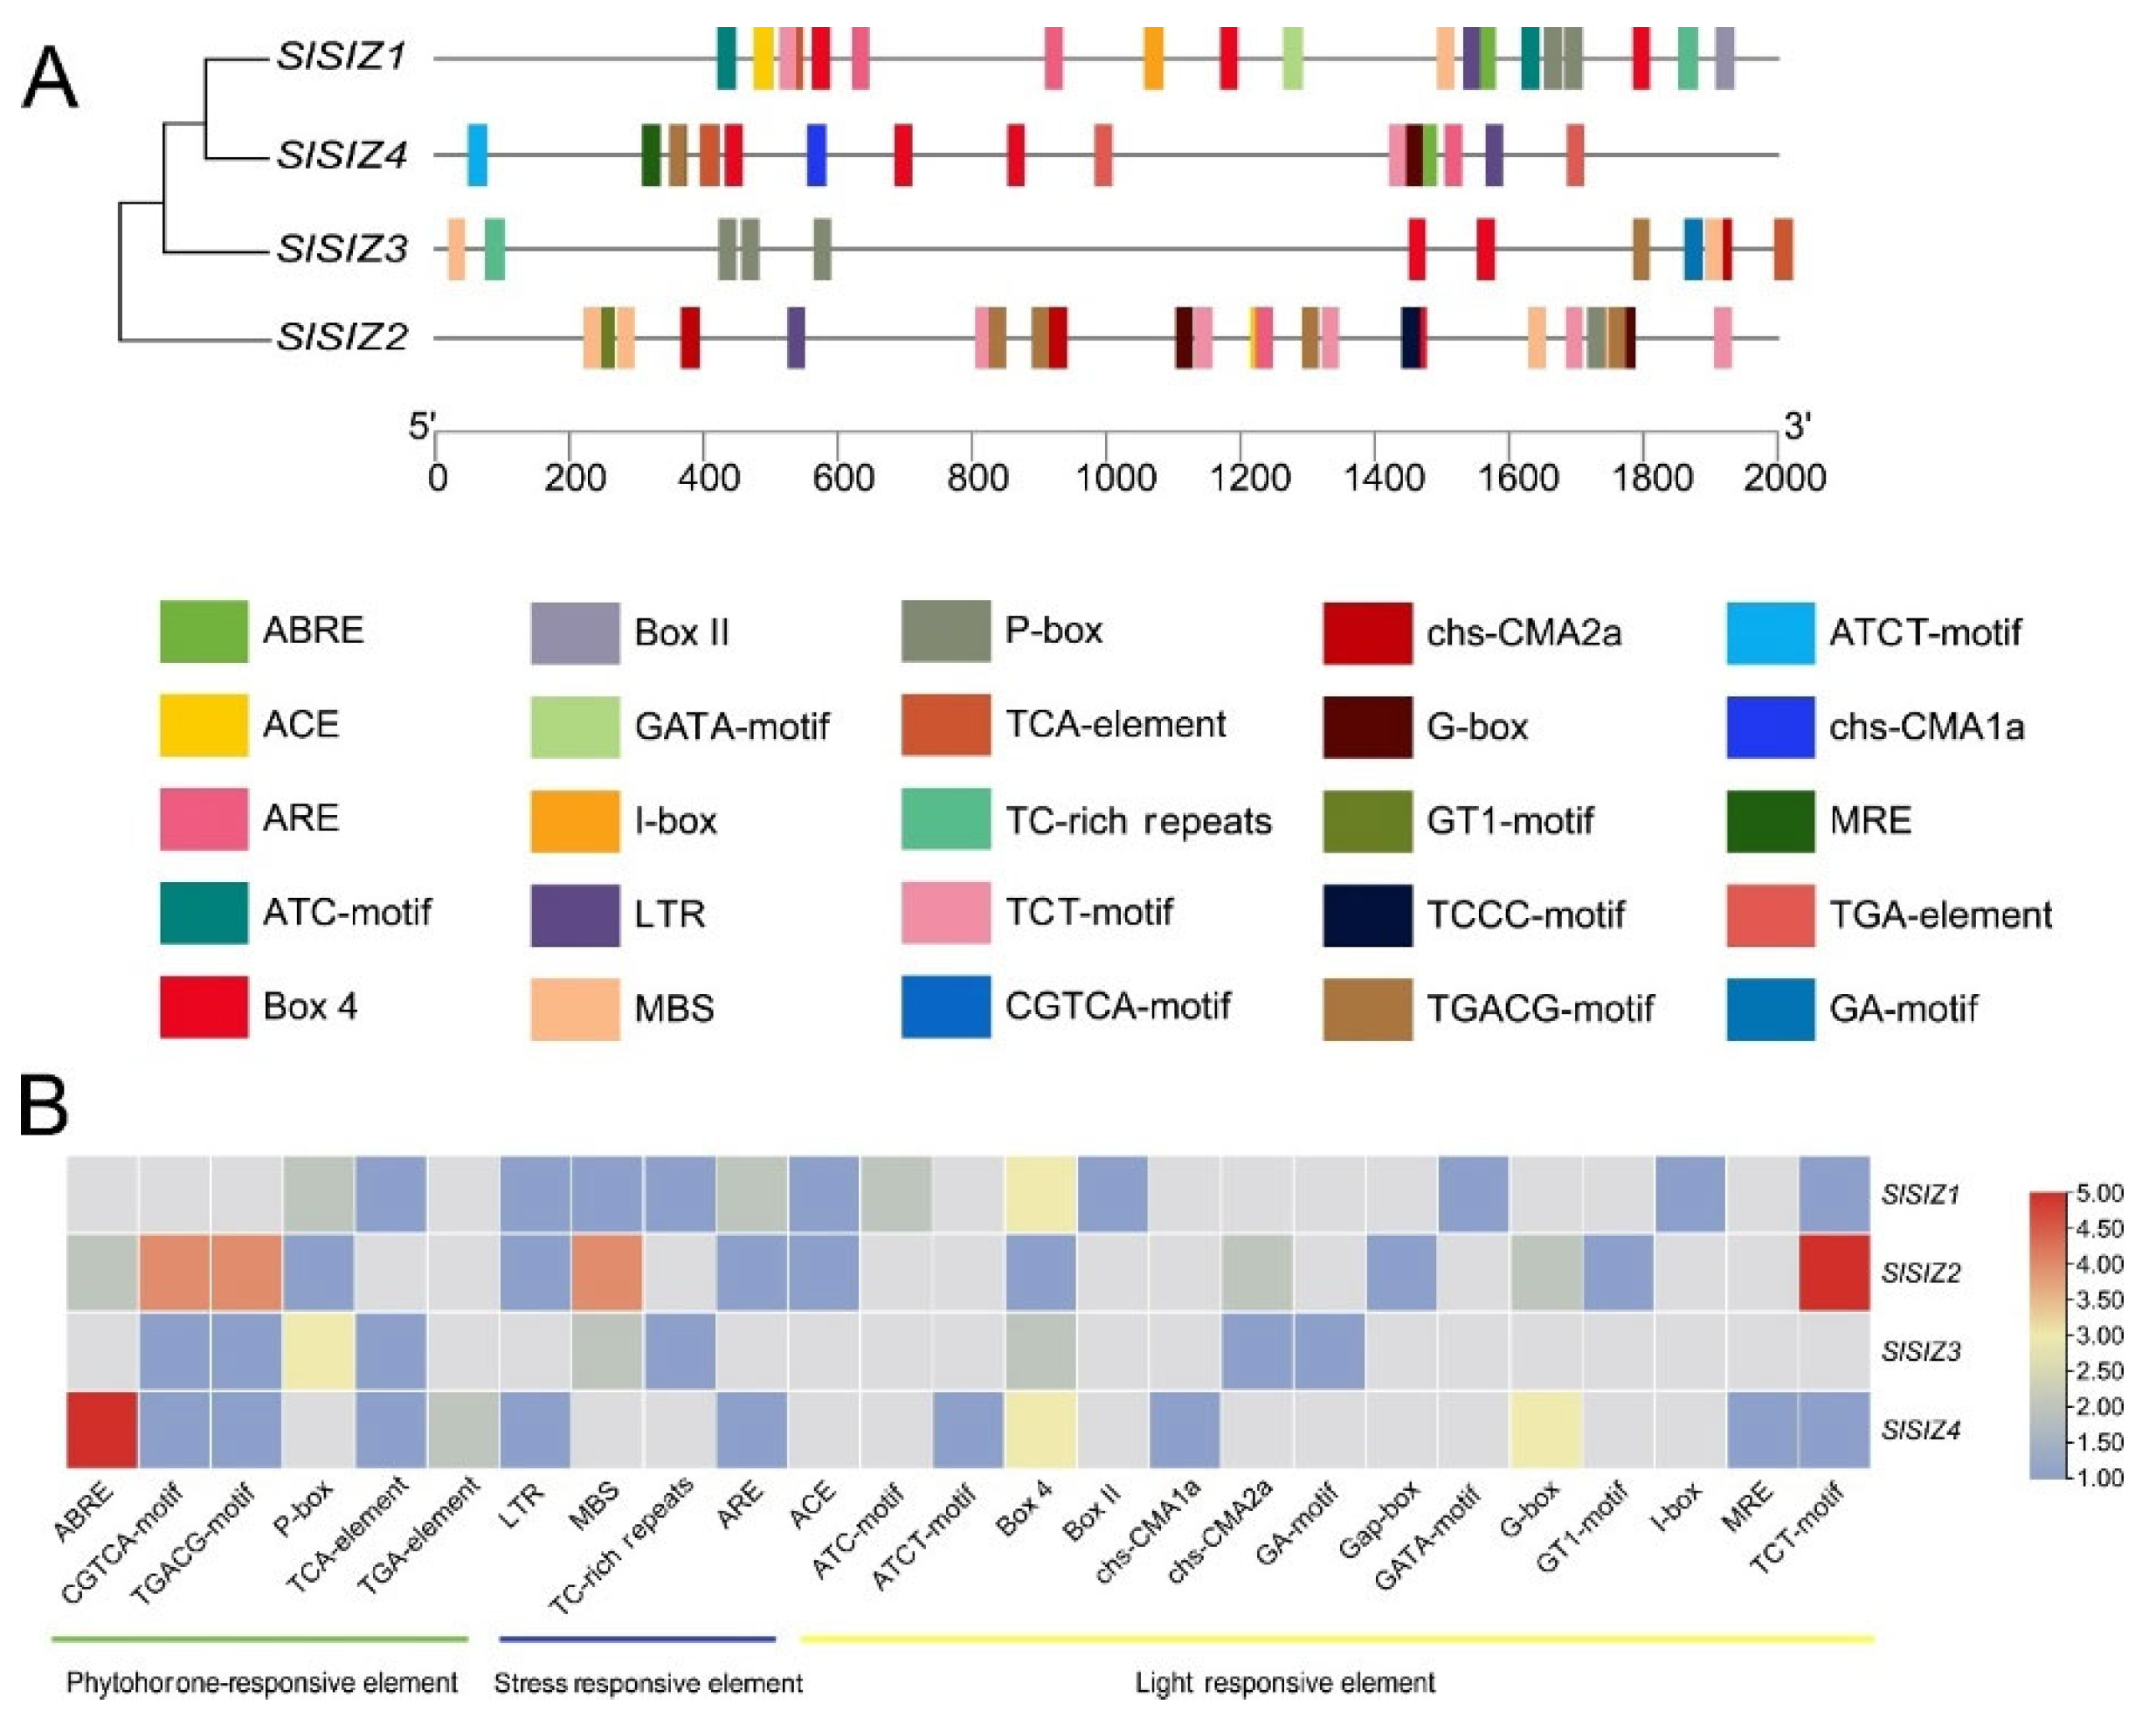
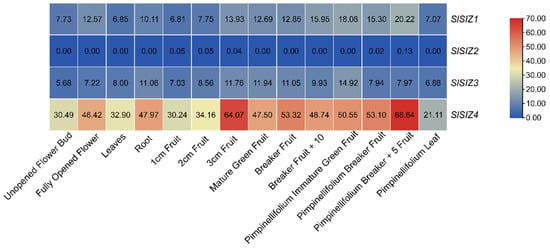
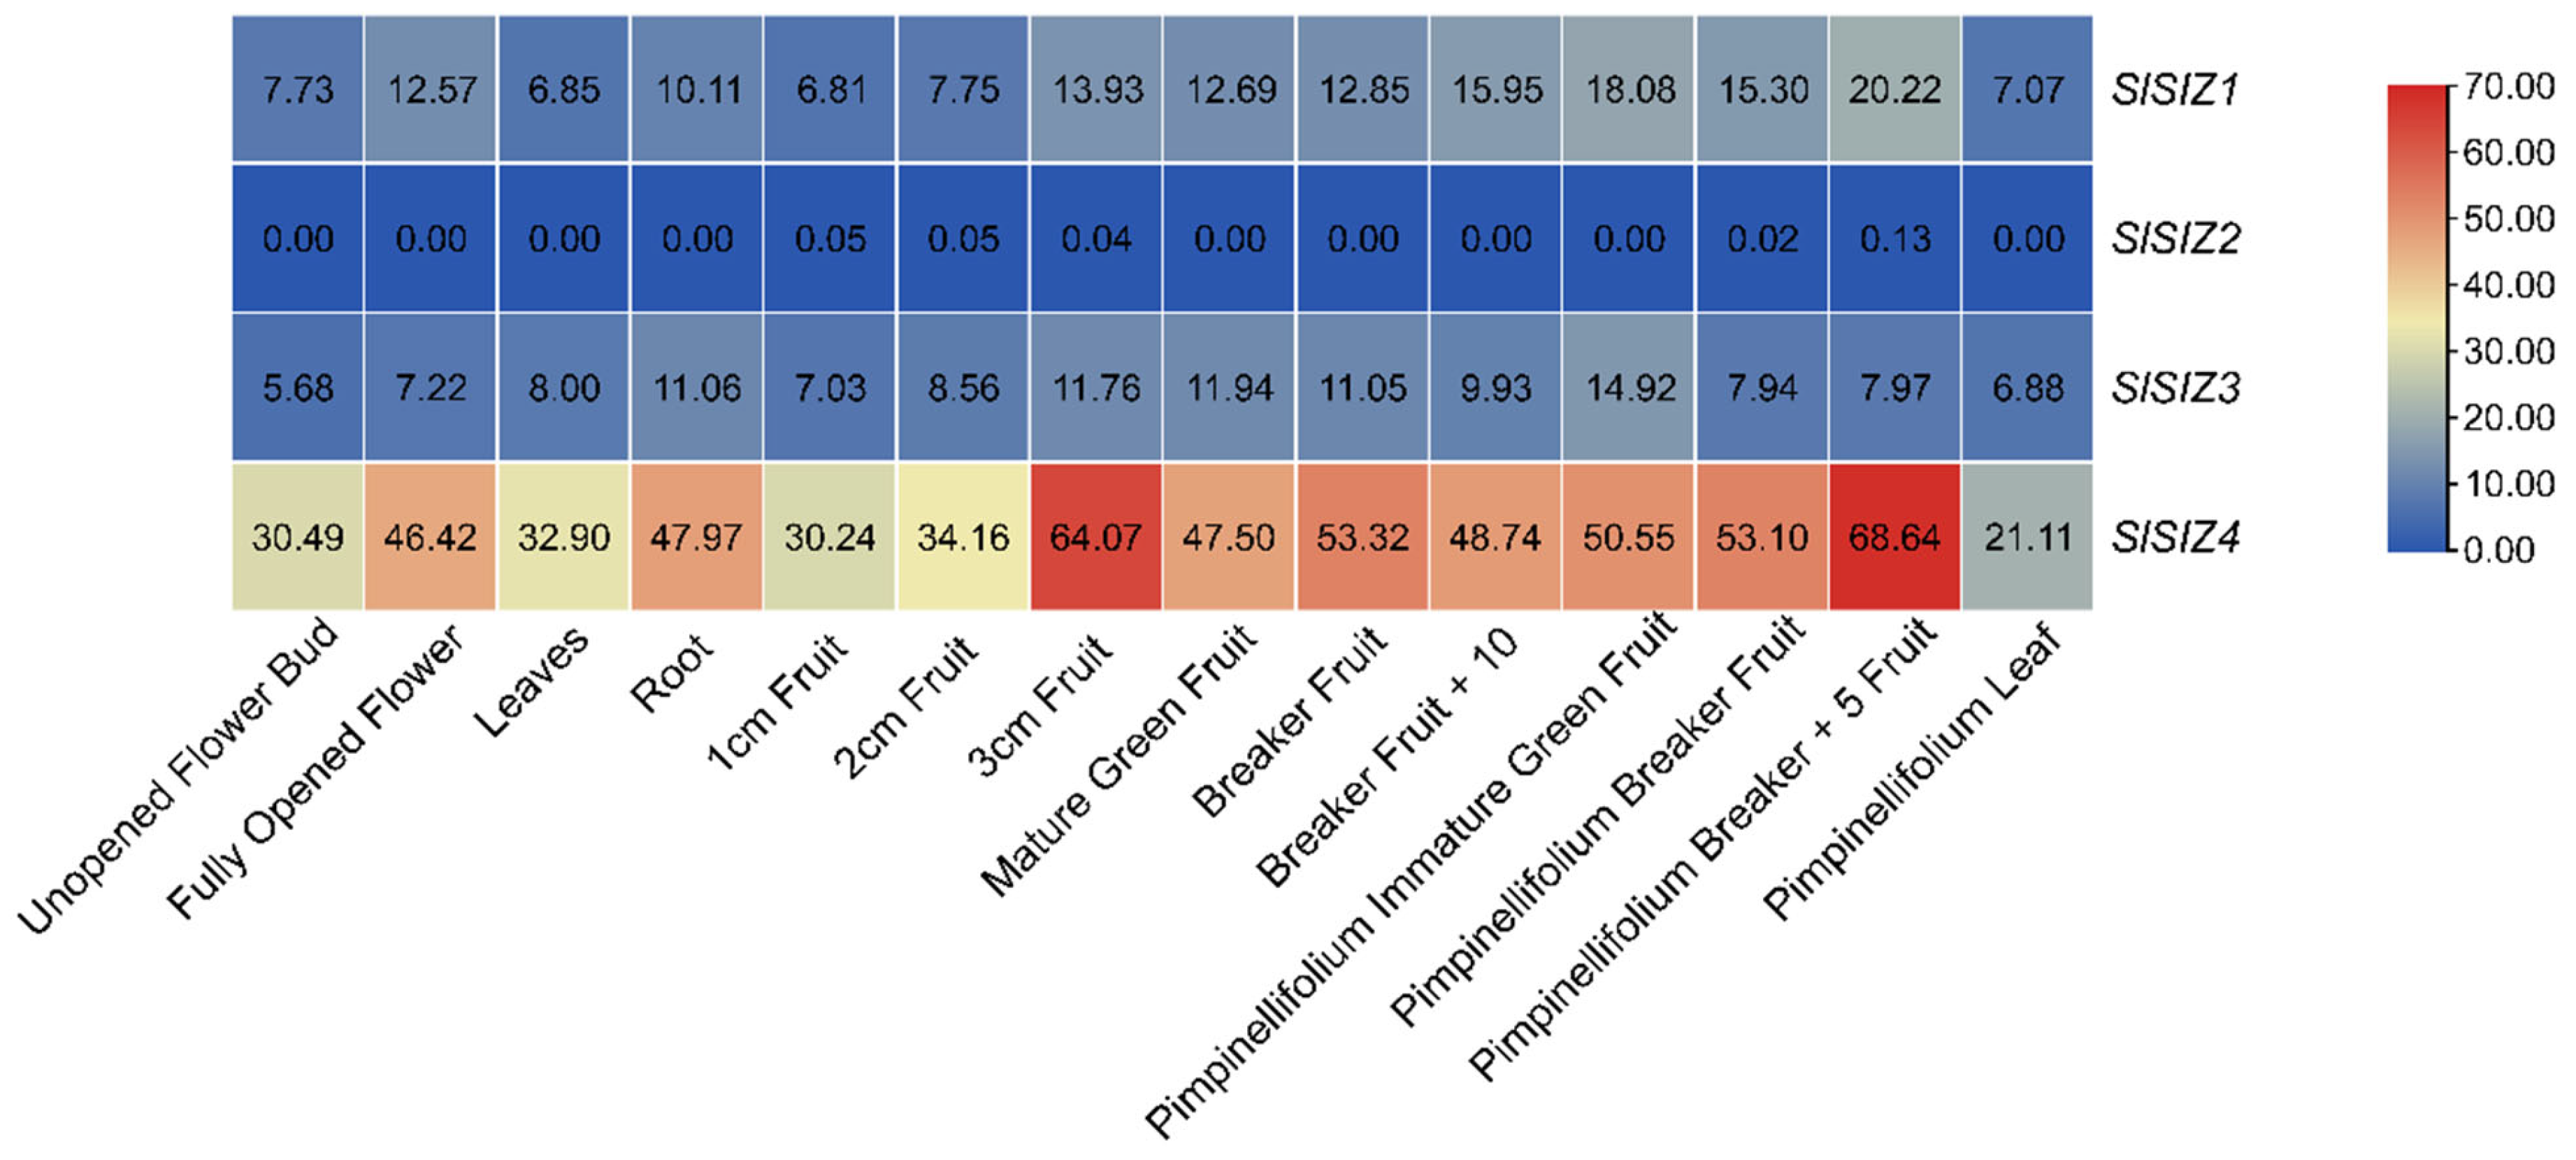
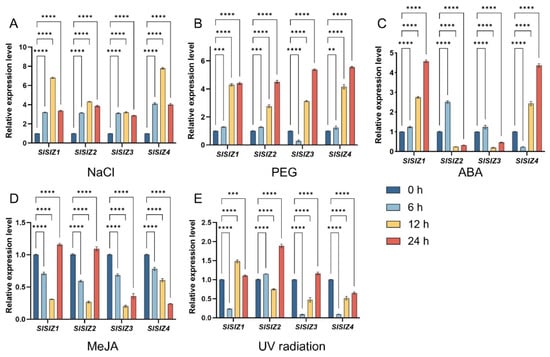
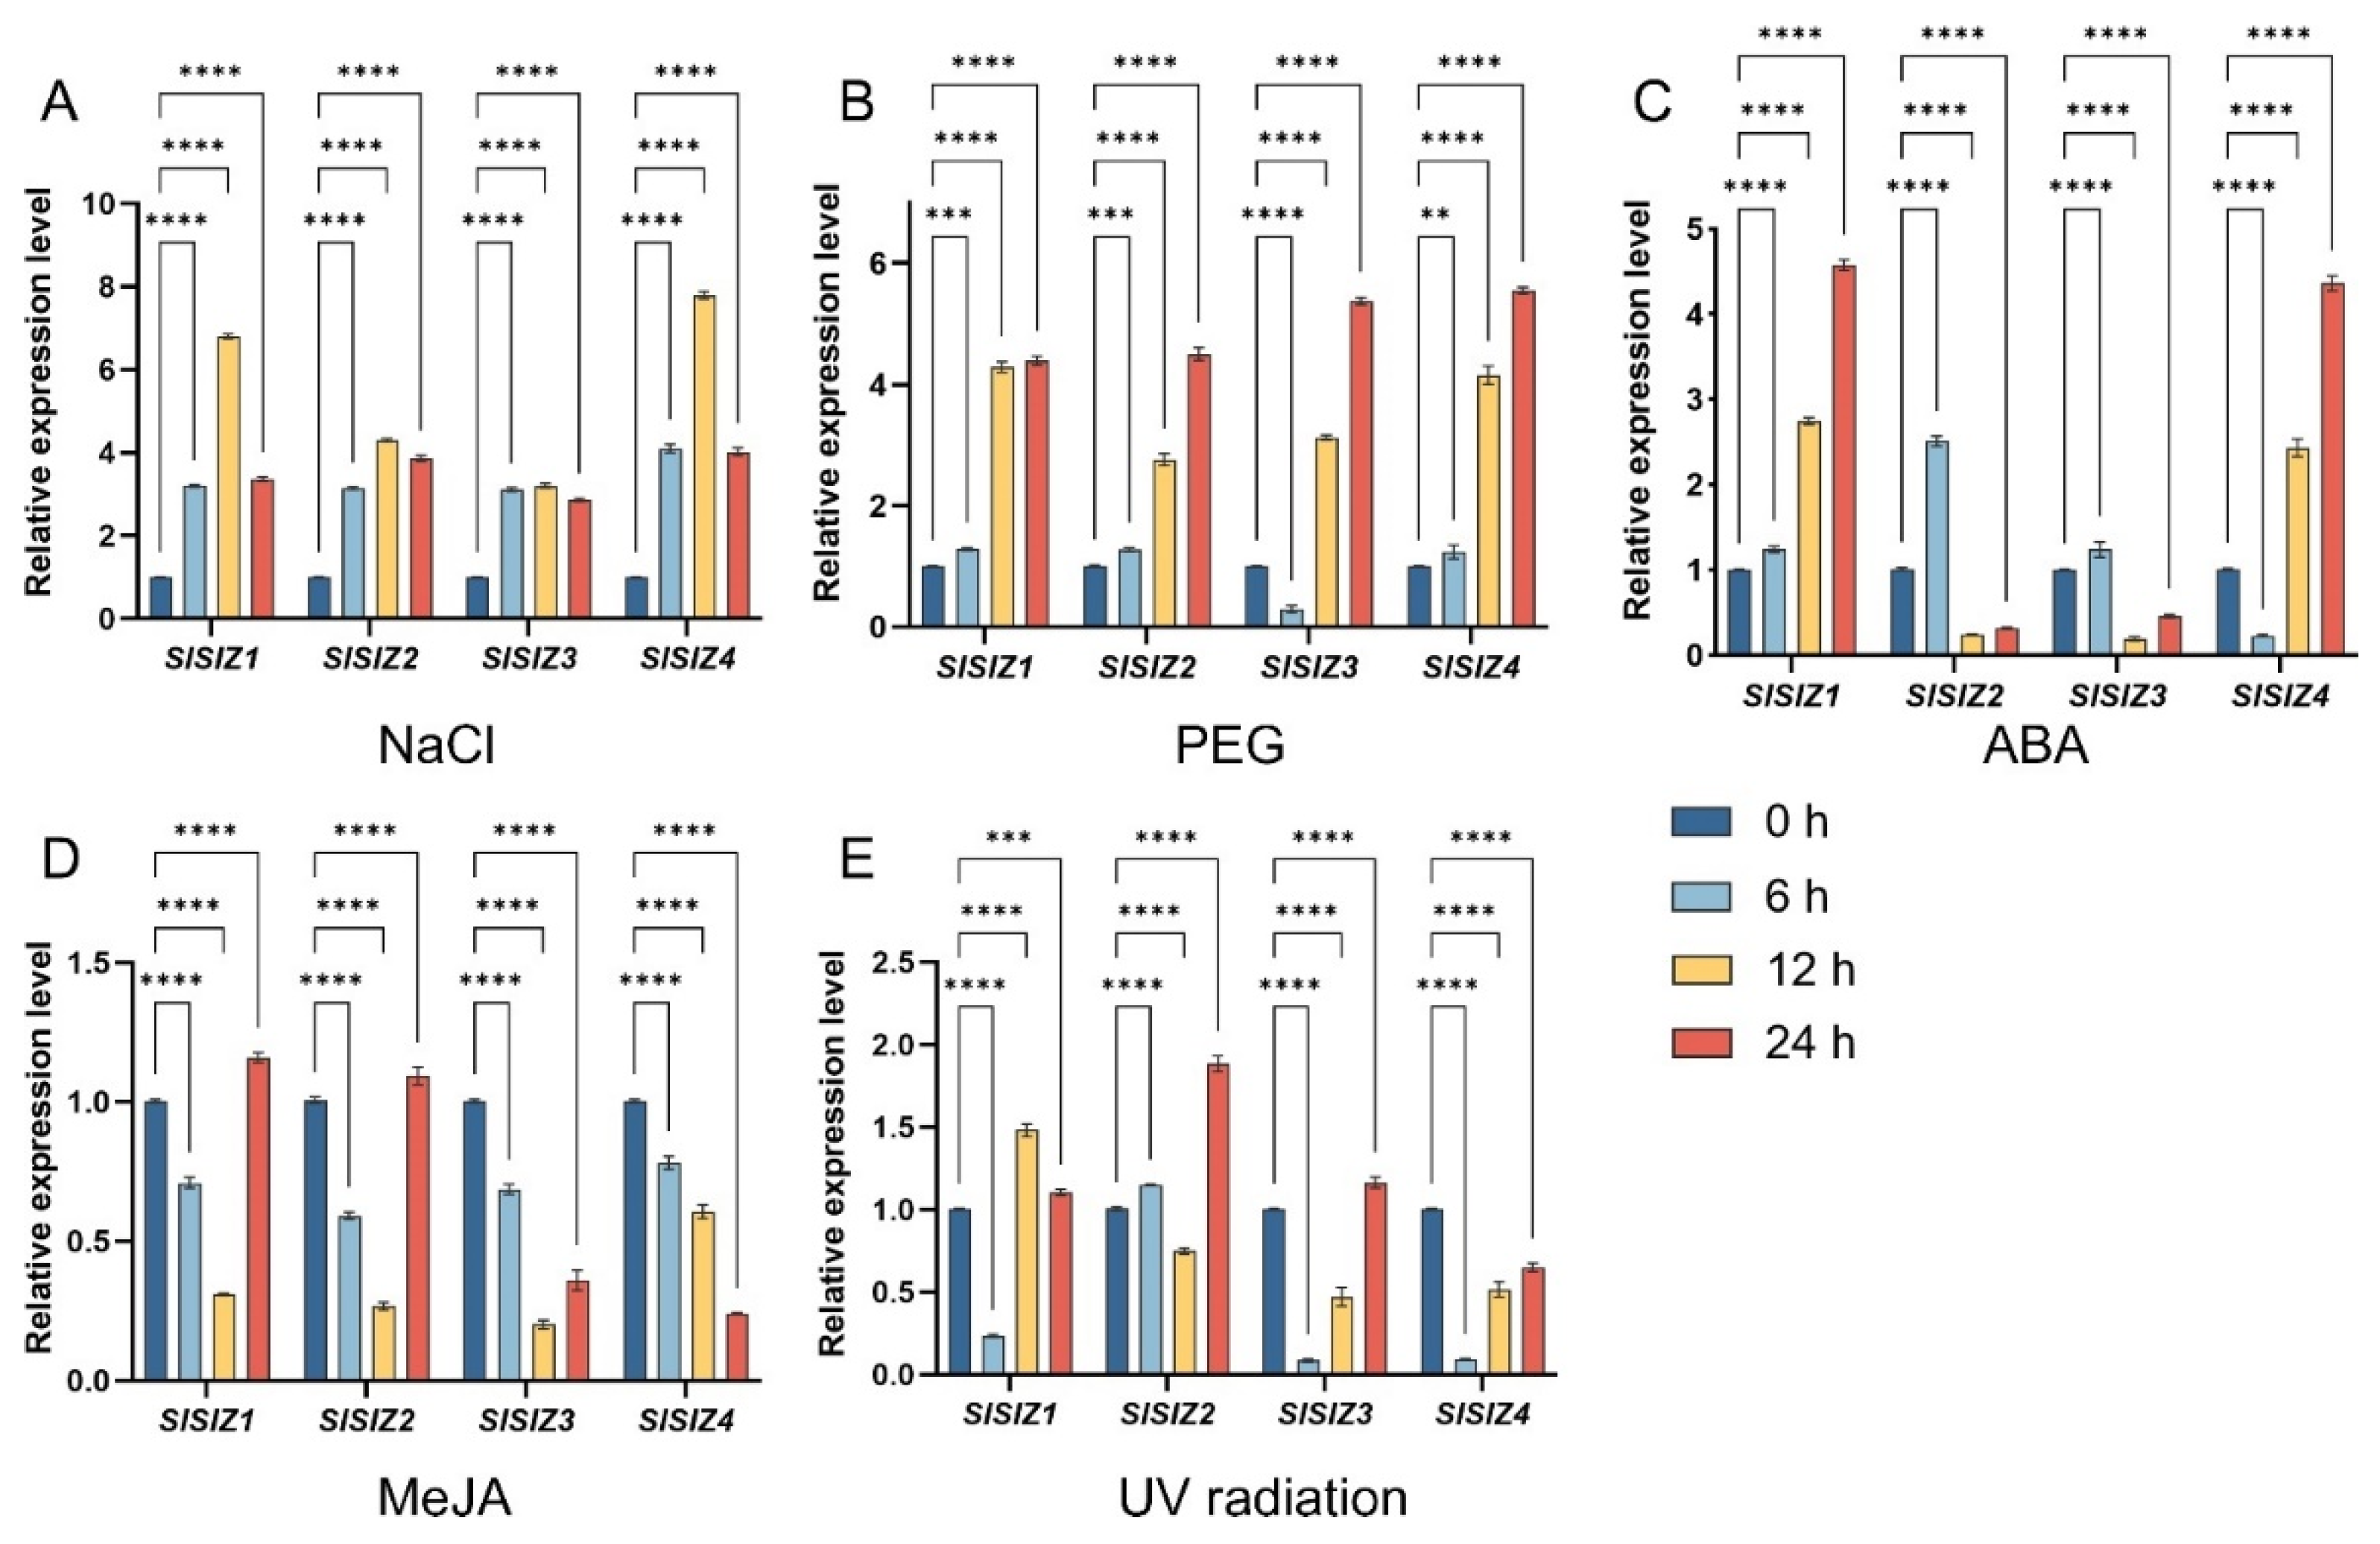
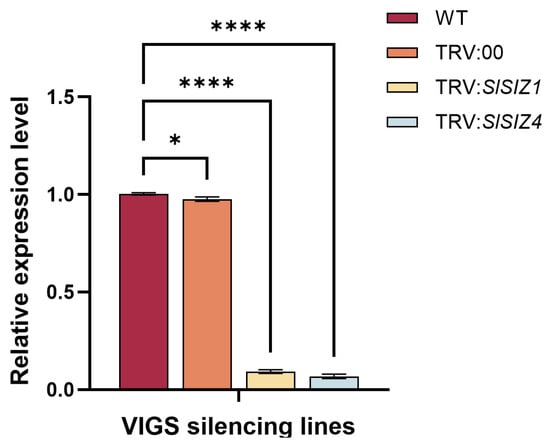
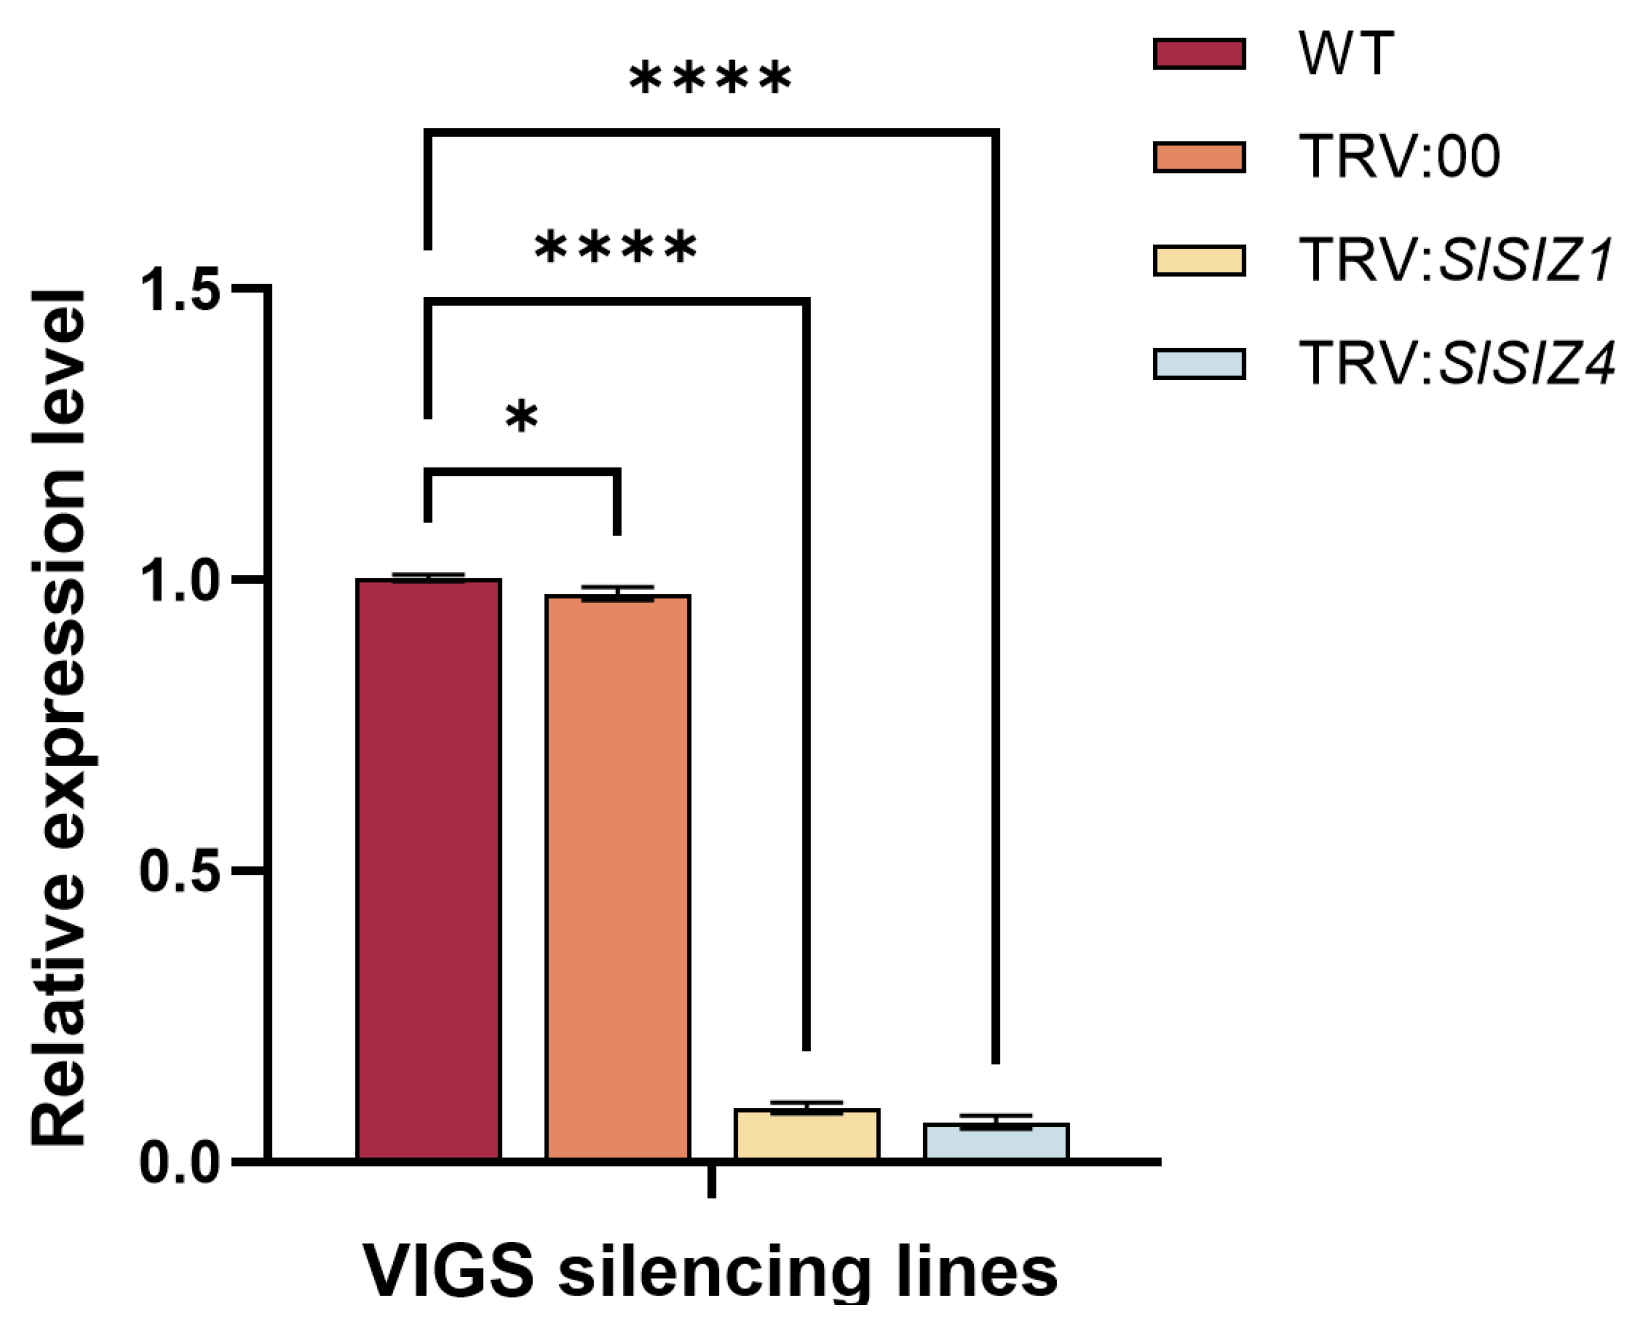
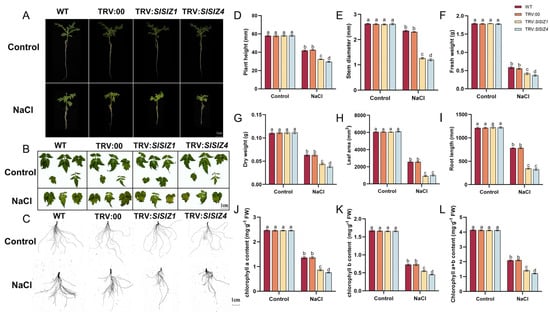
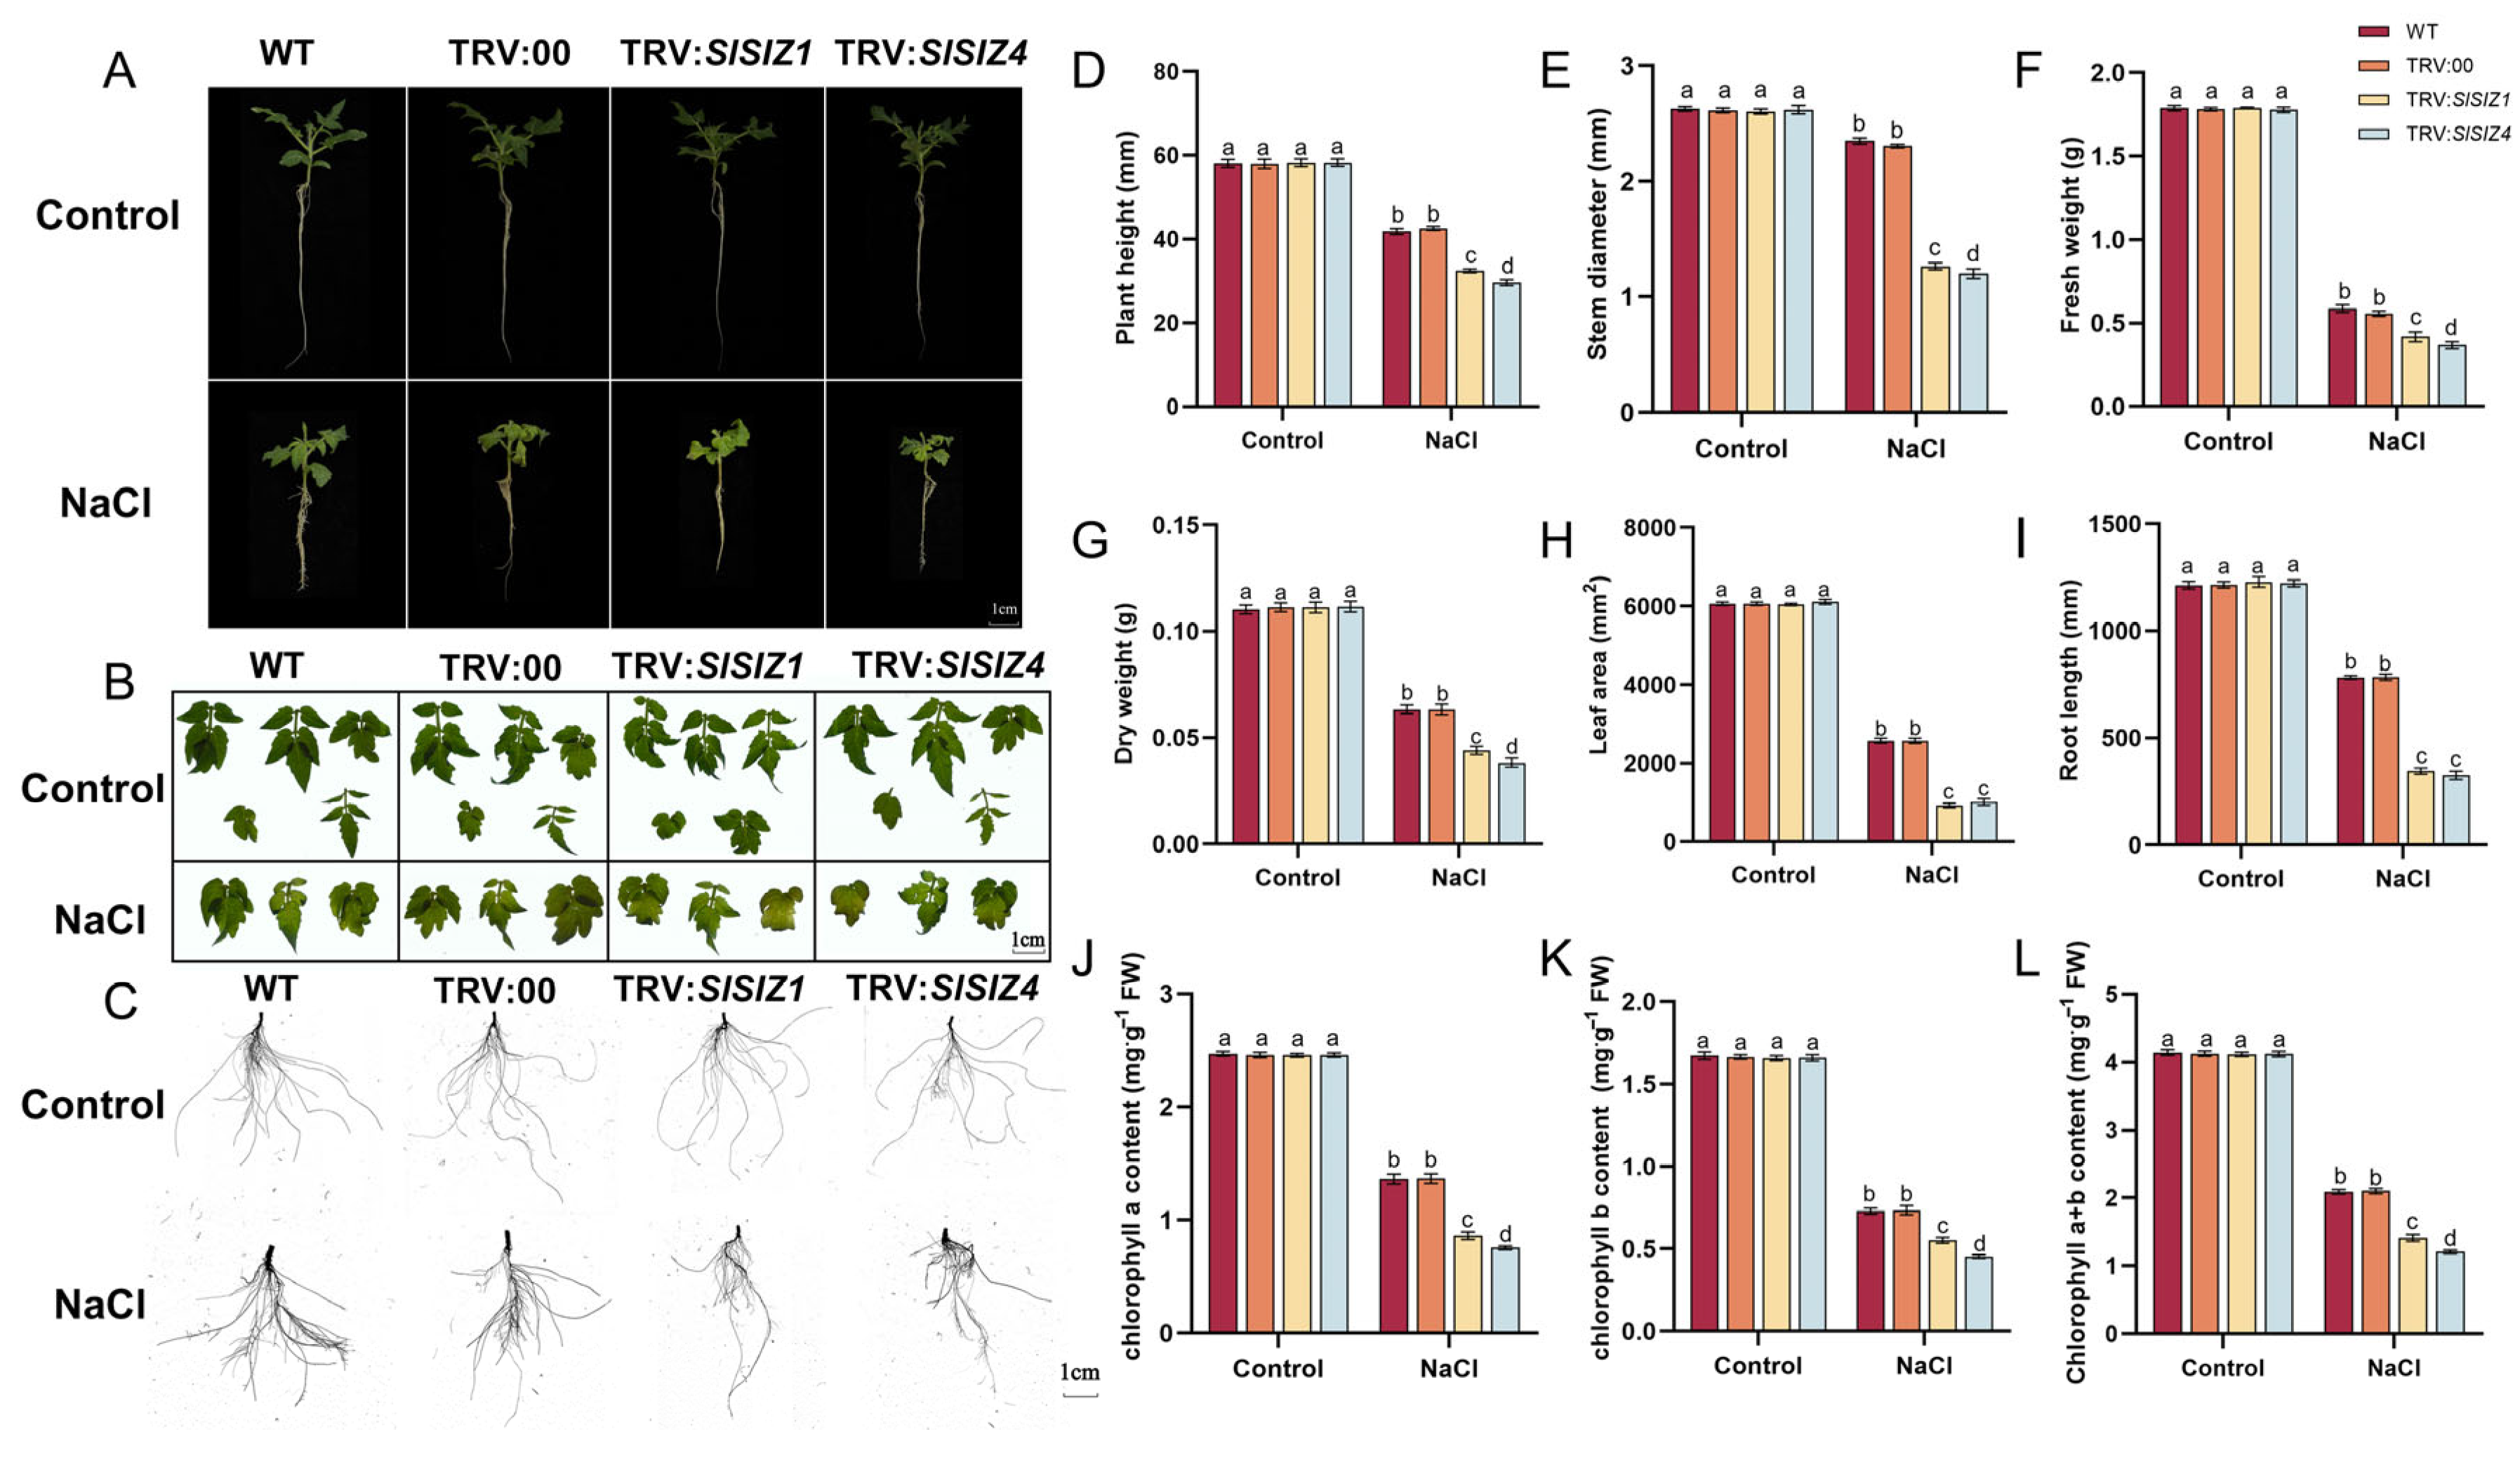
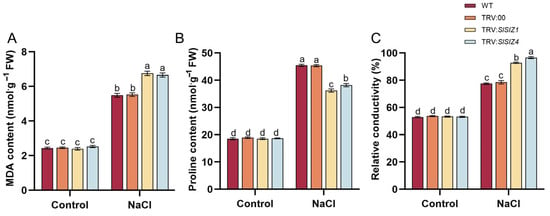
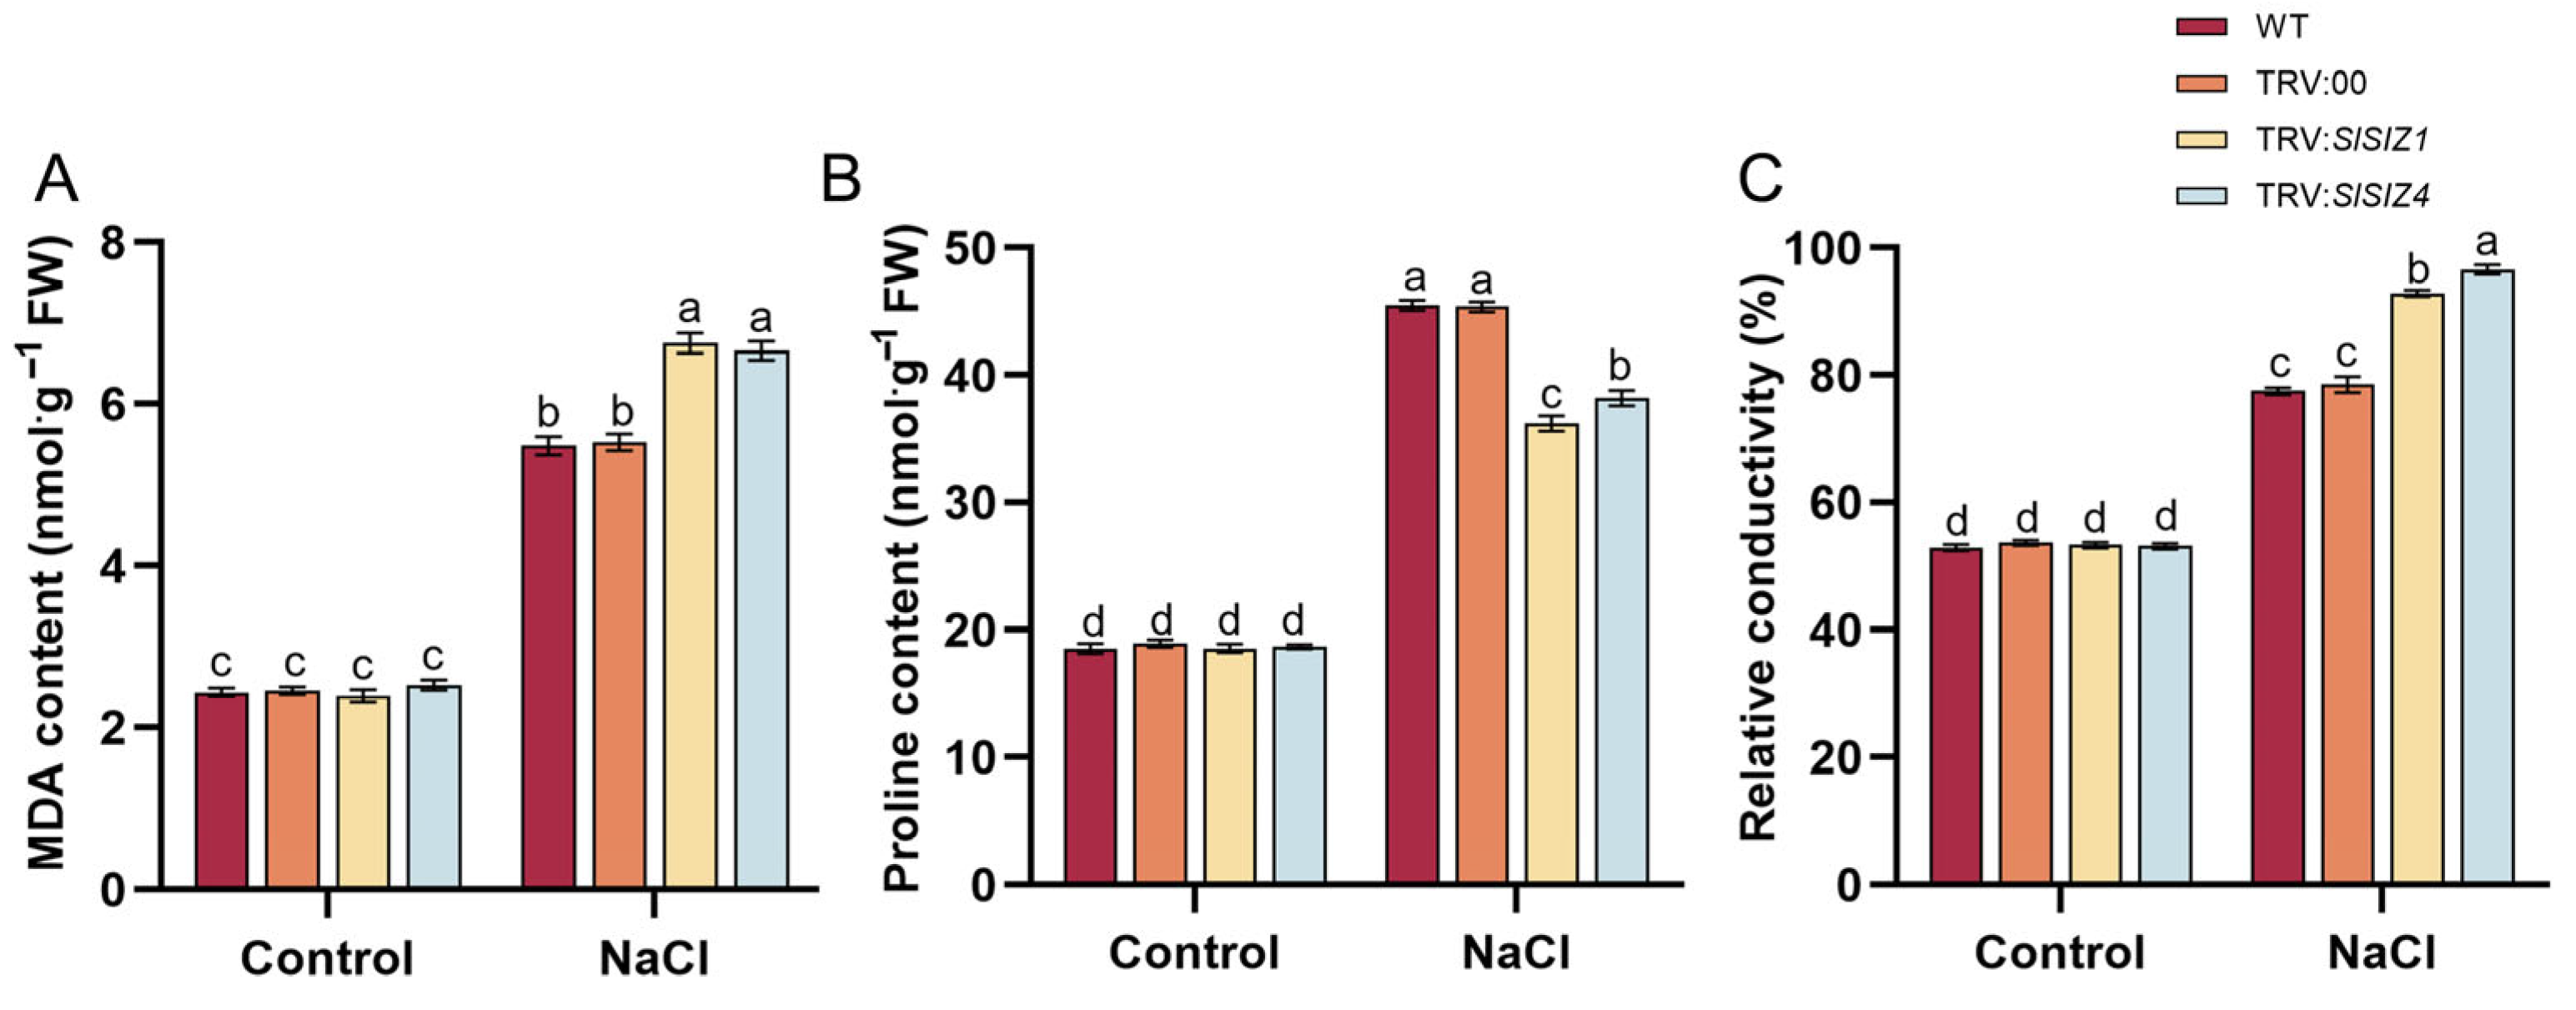
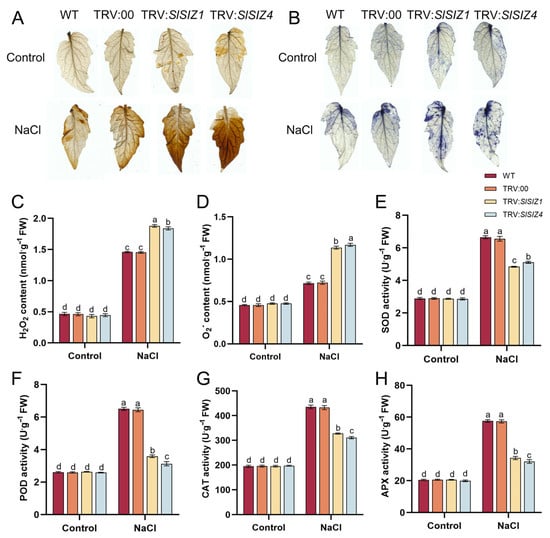
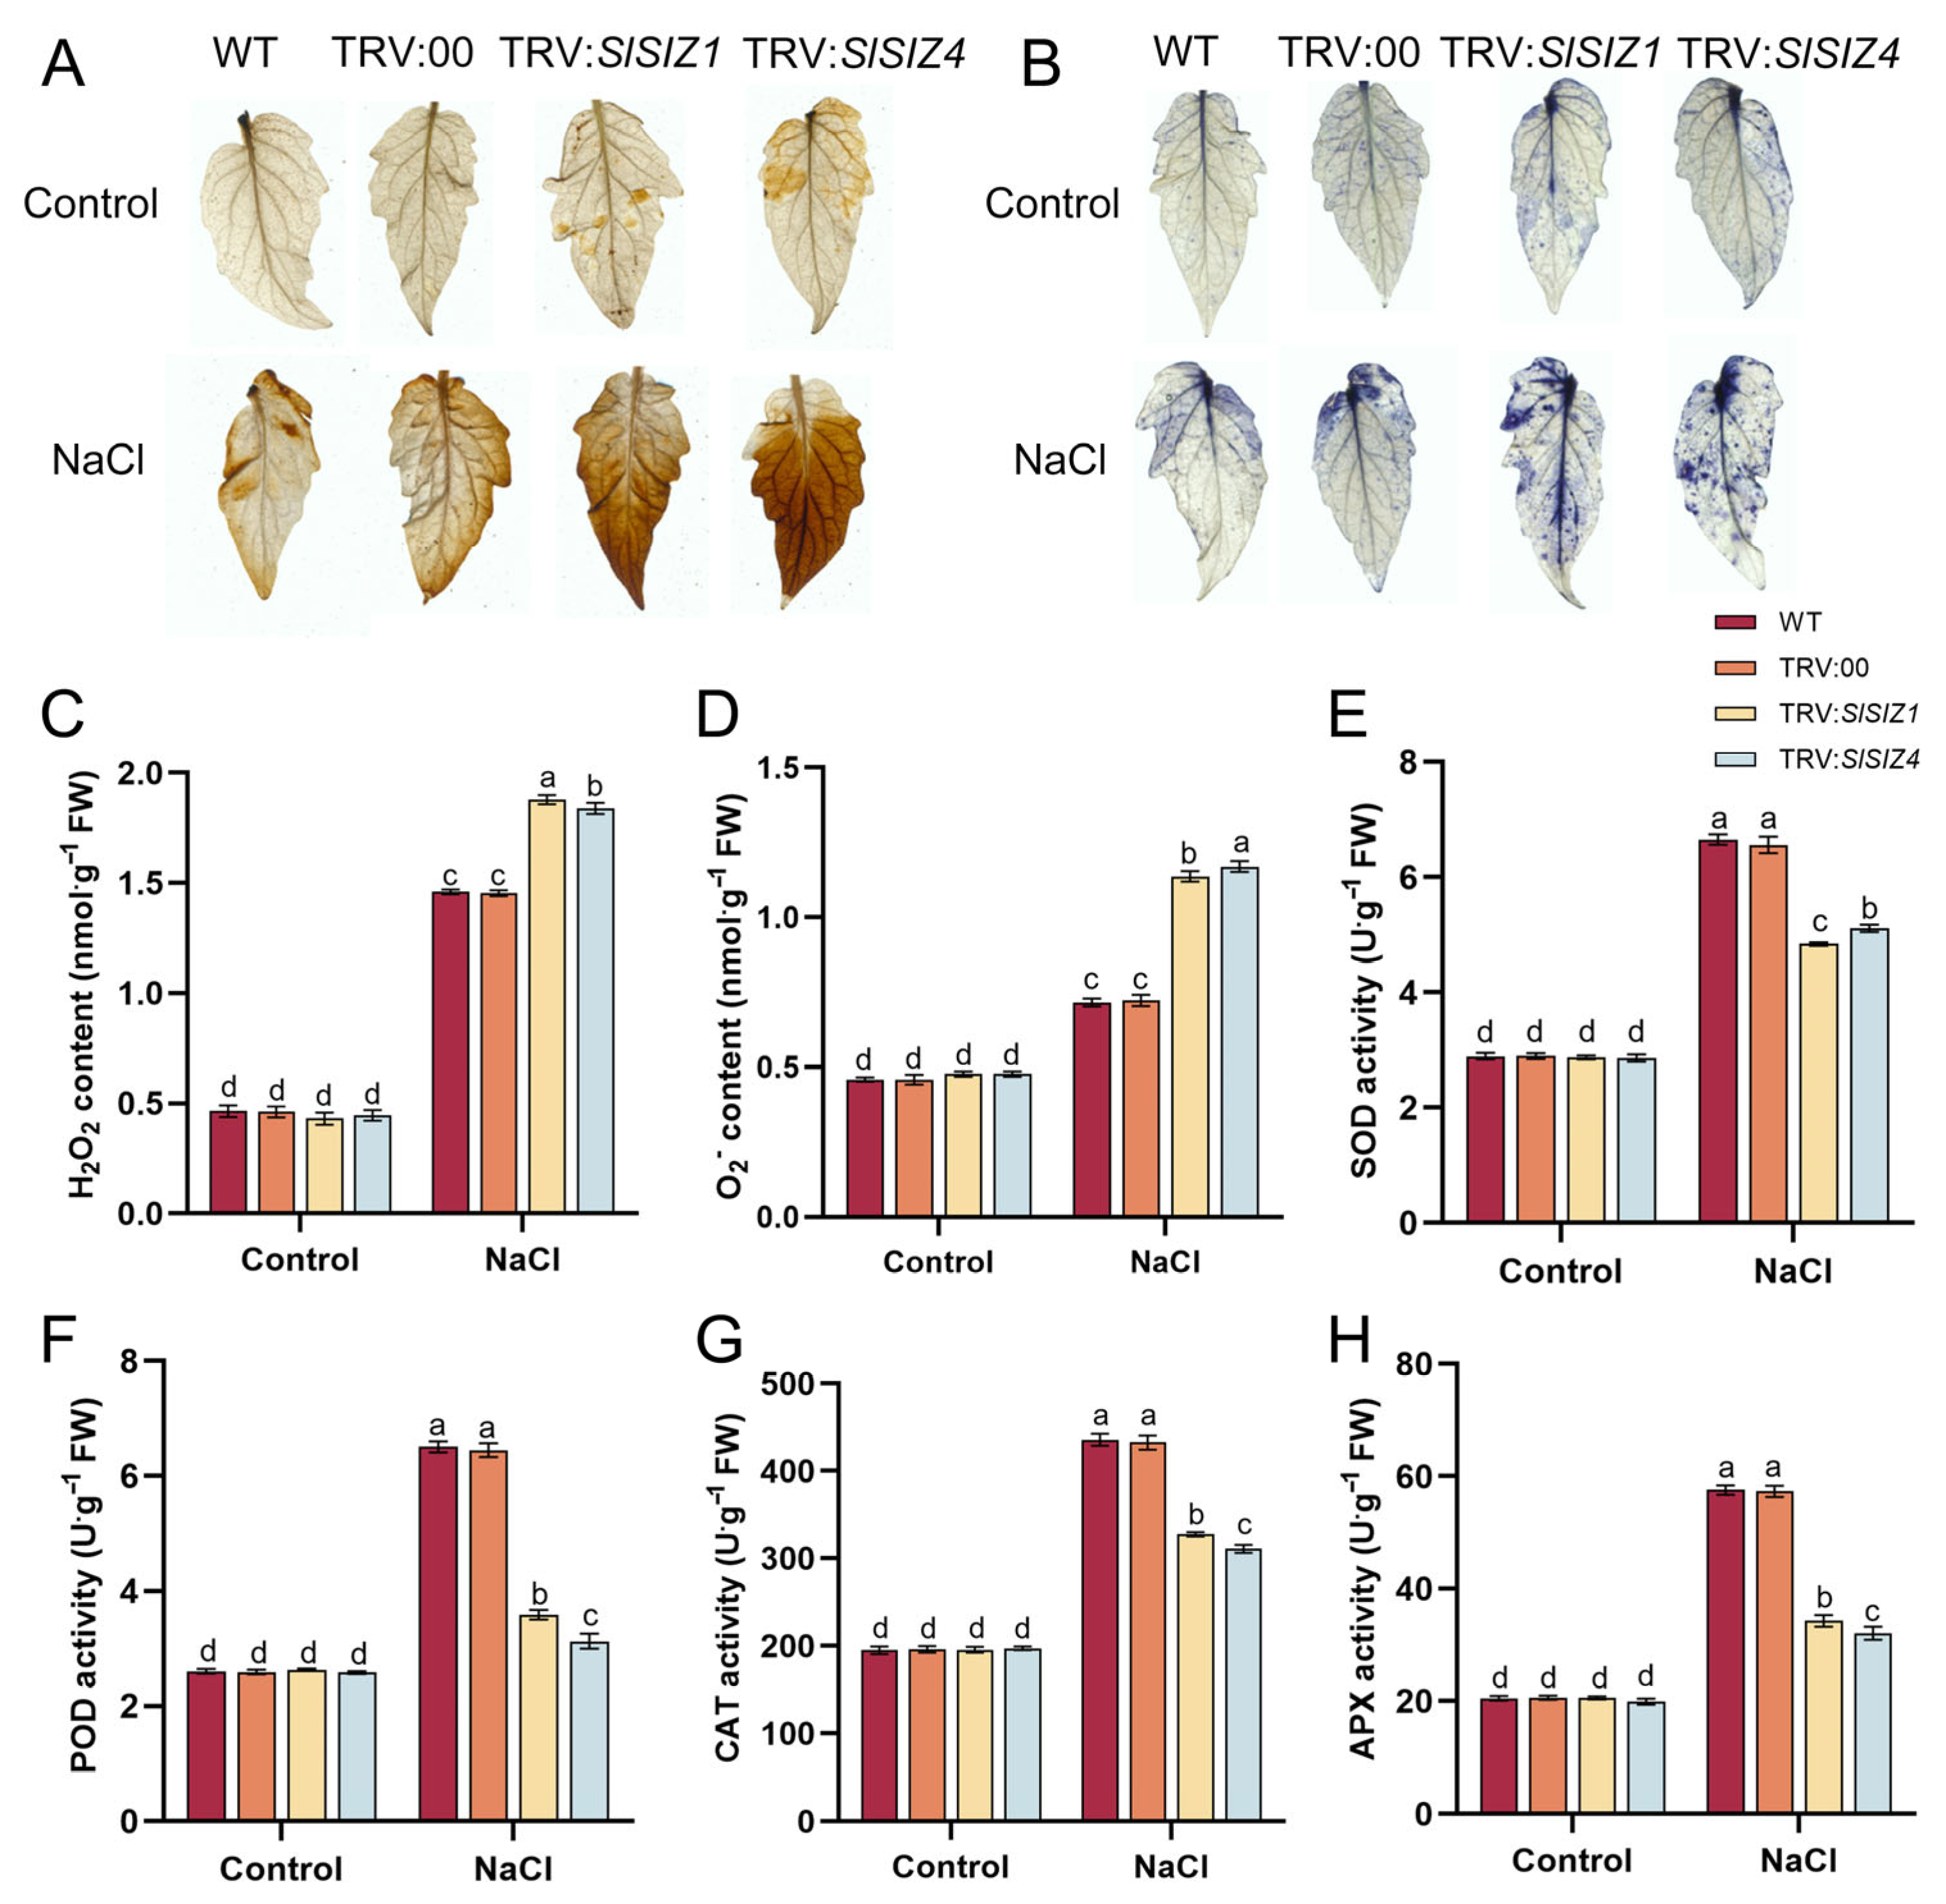
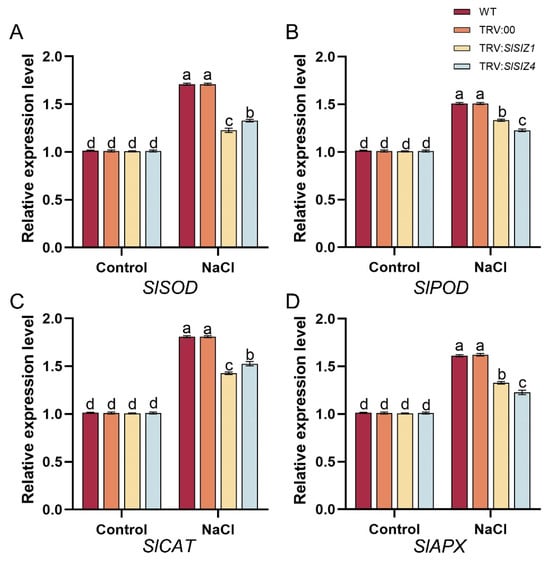
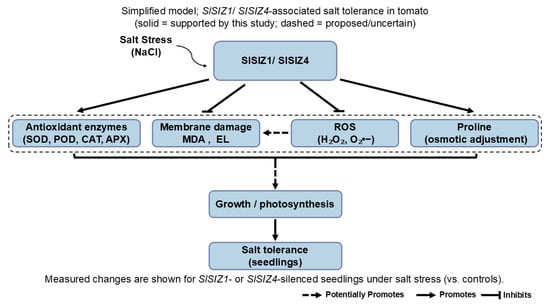





Disclaimer/Publisher’s Note: The statements, opinions and data contained in all publications are solely those of the individual author(s) and contributor(s) and not of MDPI and/or the editor(s). MDPI and/or the editor(s) disclaim responsibility for any injury to people or property resulting from any ideas, methods, instructions or products referred to in the content. |
© 2026 by the authors. Licensee MDPI, Basel, Switzerland. This article is an open access article distributed under the terms and conditions of the Creative Commons Attribution (CC BY) license.