


Abstract
Rapid and accurate acquisition of crop growth status information is fundamental to crop condition diagnosis, water and nutrient management, and variable-rate field operations. With its operational flexibility at low altitudes, high spatial resolution, and capacity for rapid, non-destructive data acquisition, unmanned aerial vehicle (UAV)-based spectral monitoring has become a key tool for assessing the crop growth status. By characterizing within-field variability in crop growth and nitrogen status, UAV-based monitoring can support the generation of fertilizer prescriptions and variable-rate fertilizer application by agricultural machinery. Nevertheless, illumination variability, changes in platform attitude during flight, and interference from canopy backgrounds reduce the robustness of monitoring, while processing delays and difficulties in integration with variable-rate field operations remain major limitations. The spectral responses and scale effects, imaging and non-imaging spectral sensing, multi-sensor synergistic sensing, spectral data processing, and the retrieval of crop growth parameters are reviewed herein; the authors also summarize commonly used UAV platforms and representative commercial sensors. UAV-mounted imaging spectral sensors provide detailed spatial information but generate large datasets and require complex workflows that typically rely on offline processing, limiting the timely use of monitoring results in variable-rate field operations. UAV-mounted non-imaging spectral sensors enable faster processing but provide footprint-averaged measurements with limited spatial detail; they remain susceptible to environmental interference. Multi-sensor synergistic sensing provides complementary information pertaining to the canopy structure and physiological status but requires more complex payload integration and data co-registration. The present review further outlines future directions, including integrated onboard sensing, computing, and storage; multi-sensor data fusion; and multimodal retrieval and spatial mapping. These developments aim to reduce processing latency and interference during field observations, align monitoring outputs with variable-rate application units, and enable the development of lightweight monitoring equipment and the generation of prescription maps.
1. Introduction
Crop status broadly describes the overall condition of a crop. In this review, crop growth status specifically refers to crop stand structure, physiological and biochemical status, and their spatiotemporal variation. Timely acquisition of the leaf area index (LAI), biomass, chlorophyll content, nitrogen status, and water status is essential for crop condition diagnosis, yield prediction, and precision management of water and nutrients [1,2]. The reflectance, absorption, and scattering characteristics of crops across different spectral bands are closely associated with the canopy pigment content, physiological status, and structural changes, providing a physical basis for monitoring the crop growth status using spectral information [3,4]. Compared with conventional surveys and physico-chemical measurements, which have limited sampling coverage, are labor intensive, and require destructive sampling for some parameters, spectral techniques can rapidly estimate multiple crop growth parameters over large areas without damaging plants, thereby improving the efficiency of crop production management [1,2]. The Web of Science Core Collection was searched for publications from 1 January 2012 to 28 October 2026 using combinations of “UAV”, “multispectral”, “hyperspectral”, “non-imaging”, and “crop”. Representative studies were selected for their relevance to UAV-based spectral monitoring of crop growth and coverage of sensing, data processing, parameter retrieval, and variable-rate fertilization. Countries were ranked by publication counts based on author addresses in the retrieved records; the highest-output organization in each of the ten leading countries was then identified from the affiliation data.
Spaceborne and airborne remote sensing provides broad spatial coverage, spatially continuous observations, repeatable data acquisition, and multiscale characterization, thereby extending ground-based point spectral measurements to regional-scale monitoring of crop canopies [3,5]. Current studies of spaceborne and airborne remote sensing for crop growth status primarily focus on canopy spectral responses, the retrieval of crop growth parameters, and operational applications [5,6]. However, optical satellite remote sensing is constrained by cloud cover and fixed revisit intervals, which can lead to missing observations during critical growth stages and compromise the timeliness of the acquisition of information pertaining to crop growth status [5,7].
An unmanned aerial vehicle (UAV) provides flexible, on-demand observations for field-scale crop growth monitoring [1,8]. Existing studies of UAV-based spectral monitoring of crops primarily addressed spectral data-acquisition methods, crop growth parameter retrieval models, and UAV applications in agricultural remote sensing [9,10,11,12]. Figure 1 maps the selected organizations and illustrates their representative research topics. Low-altitude UAV observations are jointly affected by cultivar, phenological stage, plant size and canopy cover, the presence of other crops in intercropping systems, soil background, dynamic illumination, and observation conditions [13,14,15,16], giving rise to the phenomena of “same object, different spectra”, “different objects, same spectrum”, and mixed pixels. To enhance crop feature representation, existing studies primarily exploit spectral, spatial, and structural information from imagery acquired by UAV-mounted sensors [17,18] and mitigate these effects through soil background correction and spectral unmixing [14,19]. However, these studies largely focused on data-processing methods and validation of the retrieval accuracy, whereas equipment cost, processing efficiency, and integration with variable-rate field operations continue to constrain wider adoption [20,21,22,23].
Figure 1.
Selected research organizations and their representative research topics. Abbreviations: AAFC, Agriculture and Agri-Food Canada; CAAS, Chinese Academy of Agricultural Sciences; CNR, Consiglio Nazionale delle Ricerche; CSIC, Consejo Superior de Investigaciones Científicas; Embrapa, Empresa Brasileira de Pesquisa Agropecuária; IIT System, Indian Institute of Technology System (a Web of Science affiliation grouping); TUM, Technical University of Munich; UQ, The University of Queensland; USDA, United States Department of Agriculture; UAV, unmanned aerial vehicle.
Building on existing reviews of UAV-based crop phenotyping, spectral sensing, and data processing [1,2,3,4], this review examines imaging and non-imaging spectral monitoring with a focus on processing efficiency and integration with variable-rate fertilization. It covers sensing systems, spectral-response variability, observation scale, data processing, and crop growth parameter retrieval, and provides recommendations for monitoring methods and system configurations. Figure 2 presents the review framework.
Figure 2.
Technical framework for UAV-based spectral monitoring of crop growth status. UAV, unmanned aerial vehicle; RGB, red–green–blue; LiDAR, light detection and ranging; GNSS, global navigation satellite system; IMU, inertial measurement unit.
2. UAV-Based Spectral Monitoring Techniques for Crop Growth Status
Crop spectral responses are jointly affected by biochemical constituents, canopy structure, and observation conditions, often resulting in “different objects, same spectrum” and “same object, different spectra”, which complicate the identification of crop growth status and comparisons across acquisition dates and flight campaigns [24,25]. Hu et al. developed an attention network integrating spectral, spatial, and scale information, which alleviated spectral similarity between classes, spectral variability within classes, and spatial heterogeneity [24]. Yang et al. fused spectral and spatial features using kernel tensor-slice sparse coding, thereby improving the discrimination of spectrally similar crops [17]. Lu et al. used extended attribute profiles to extract scale, shape, and texture features, further enhancing the joint representation of crop spectral and spatial information [18].
To address the “same object, different spectra” phenomenon, existing studies primarily adopt multi-temporal modeling to characterize phenological changes and apply radiometric and geometric corrections to reduce spectral differences arising from observation conditions. Prey et al. and Camenzind et al. found that sensitive spectral features vary across phenological stages and that combining multi-temporal reflectance data with vegetation indices can improve the stability of wheat grain yield estimates [26,27]. To mitigate observation-related disturbances, Jafarbiglu and Pourreza elucidated the significant effects of solar and sensor geometry on canopy reflectance [25]; Wang et al. used a downwelling light sensor and multiple reference panels for correction to reduce the influence of dynamic illumination [28]. To improve spectral consistency in UAV imagery and the stability of chlorophyll monitoring in winter wheat, Jiang et al. performed relative radiometric correction across flight campaigns using contemporaneous satellite imagery [29,30].
Pixel scale, as a key determinant of the spatial information represented by UAV-based imaging spectral data, is jointly influenced by flight altitude, sensor pixel size, focal length, and other factors [15,31]. Changes in pixel scales affect canopy spatial details, target boundaries, and the results of UAV-based crop spectral monitoring [15,32]. Deng et al. investigated the effects of different spatial resolutions on the radiometric and geometric performance of UAV hyperspectral imagery [31]. Zhang et al. monitored the growth status of oilseed rape using UAV multispectral imagery acquired with varying ground sampling distance (GSD), finding that insufficient spatial resolution degrades monitoring performance, whereas excessively high resolution increases the burden of data acquisition and processing [15]. Hassani et al. further compared the effects of UAV imagery at different spatial scales on the nitrogen concentration estimation in sorghum and maize, indicating that crop monitoring is sensitive to the scale of spatial sampling [32].
The size of the plant canopy relative to the pixel size or observation footprint affects the separation of the target crop from its background [15,33]. When other crops in intercropping systems, exposed soil, and shadows fall within the observation area, changes in their proportions can alter the measured spectra and vegetation indices; these changes should therefore not automatically be interpreted as changes in the growth status of the target crop [14,16,19]. In UAV-based multispectral monitoring of maize LAI, Liu et al. found that the presence of a high proportion of soil background pixels at early growth stages is an important factor influencing the LAI estimation accuracy; correcting for soil background contributions improved the LAI estimation accuracy across growth stages [14]. Tian et al. investigated mixed pixels in UAV multispectral imagery of cotton acquired at different flight altitudes and showed that background components, such as soil and shadows, affect the extraction of canopy spectral information and the retrieval of soil–plant analysis development values; this issue is more significant in imagery at lower spatial resolutions [19].
UAV-based spectral monitoring of crop growth status has evolved from single-source spectral analysis to the integrated use of spectral, spatial, scale, and temporal information, thereby enhancing crop-canopy feature representation and improving the consistency of monitoring results across acquisition dates and flights [24,27,30].
3. UAV-Based Spectral Sensing Techniques for Crop Growth Status
UAV-based spectral monitoring of crops is a dynamic, low-altitude observation process in which UAV platforms, sensor payloads, positioning and attitude determination, and data acquisition operate in coordination to acquire data. Platform motion and sensor configuration jointly affect the spatial sampling and radiometric consistency of canopy spectral information [9,34]. Variations in flight altitude, speed, and attitude can alter ground sampling scale, image overlap, and sensor footprint, whereas payload capacity and endurance constrain the selection of sensor types and the extent of continuous monitoring [13,21,35]. In addition, crop-canopy spectra are affected by soil backgrounds, shadows, canopy gaps, and observation geometry. As a result, multi-sensor data fusion has increasingly become an important technical approach for enhancing the characterization of crop growth status [25,36]. Common sensors used for UAV-based crop growth status monitoring include multispectral, hyperspectral, thermal infrared, and LiDAR sensors; their principal characteristics are summarized in Table 1.
Table 1.
Comparison of common sensors for UAV-based crop growth status monitoring.
3.1. Sensing Modes of Imaging Spectral Sensors
Imaging spectral sensors retain two-dimensional spatial information while acquiring crop-canopy reflectance spectra, enabling the characterization of spatial heterogeneity in the crop growth status; they primarily include multispectral and hyperspectral imaging sensors [3,4].
Multispectral imaging sensors typically capture a limited number of discrete bands, including red-edge and near-infrared bands, and are characterized by smaller data volumes, higher processing efficiency, and relatively easy platform integration [39,40]. Representative commercial products include the MicaSense RedEdge-P sensor and the integrated DJI Mavic 3M system, both of which acquire visible, red-edge, and near-infrared imagery [41,42]. In UAV multispectral imaging applications, Geipel et al. developed a programmable, lightweight multispectral camera system for monitoring aboveground biomass and the nitrogen content in winter wheat [39]; Yao et al. estimated wheat LAI using narrowband multispectral imagery, demonstrating the capacity of red-edge and near-infrared bands to characterize changes in the canopy structure [43]; Cen et al. used a dual-camera snapshot system to dynamically monitor rice biomass under varying nitrogen-application conditions [44]. However, a limited number of spectral bands cannot fully characterize continuous spectral variations, and monitoring performance remains constrained by band selection, cultivar, phenological stage, and observation conditions [4].
Hyperspectral imaging sensors acquire canopy spectral information in contiguous narrow bands, enabling the identification of subtle spectral differences that are difficult to resolve when using multispectral sensing. This provides advantages for detailed monitoring of pigments, nitrogen status, biomass, and other physiological and biochemical parameters, but also increases the data volume and processing complexity [9,34]. Depending on their imaging mode, UAV hyperspectral systems are primarily classified as push-broom and snapshot systems: push-broom systems rely on platform motion to acquire imagery line-by-line and therefore impose exacting requirements on the flight speed, attitude stability, and positioning and attitude determination accuracy; snapshot systems acquire spatial and spectral information in a single exposure, weakening the motion-related effects associated with line-by-line acquisition [9,45]. Early studies primarily focused on the development of lightweight sensors, spectral imaging, and geometric and radiometric processing pipelines [34]. Subsequent work resulted in the joint acquisition of snapshot spectral and three-dimensional spatial information [9], subsequently applied to estimating aboveground biomass in winter wheat [10]. More recently, research has extended to the retrieval of crop nitrogen status and biophysical parameters across multiple phenological stages, showing that UAV hyperspectral applications are progressing from technology validation toward quantitative and detailed monitoring [46,47].
Imaging-based spectral monitoring has advanced from acquiring canopy imagery to detailed retrieval of crop growth parameters and spatially continuous field mapping [4]. However, higher spatial and spectral resolutions also increase the computational burden of radiometric and geometric corrections, image mosaicking, and feature extraction, making rapid data processing difficult and limiting the timely integration of monitoring results with online variable-rate operations [3,45].
3.2. Sensing Modes of Non-Imaging Spectral Sensors
Non-imaging spectral sensors measure the mean spectral radiance of the canopy within the field of view (FOV) without producing continuous two-dimensional imagery. Based on the source of illumination, they are categorized as passive or active sensors. Passive sensors use solar radiation to capture canopy reflectance information and are susceptible to fluctuations in solar elevation, cloud cover, and shadowing. Active sensors illuminate the canopy with an artificial light source, reducing interference from variations in natural illumination but increasing system power consumption and integration complexity [48,49].
Conventional passive non-imaging instruments include the ASD FieldSpec 4 spectroradiometer and the CROPSCAN MSR87 multispectral radiometer, which acquire reflectance information in continuous spectra and multiple discrete bands, respectively [50,51]. To meet the requirements of UAV deployment, Burkart et al. developed an airborne non-imaging spectral system based on a miniature spectrometer, covering 350–800 nm with a mass of approximately 216 g. Concurrent ground-based spectral measurements provided incoming irradiance data [48]. Ni et al. developed a dual-band UAV system for crop growth monitoring. Its upward- and downward-facing probes simultaneously measured solar irradiance and canopy-reflected signals; wireless transmission enabled online output of indices such as the normalized difference vegetation index (NDVI) and ratio vegetation index (RVI) [11]. Yuan et al. integrated a dual-band sensor into a fixed-wing UAV and implemented an attitude-adjustment mechanism to maintain near-vertical observations, thereby expanding the coverage of continuous non-imaging spectral monitoring [52].
Active non-imaging sensors primarily measure canopy reflectance in characteristic bands, such as red, red-edge, and near-infrared wavelengths. Krienke et al. mounted an active canopy sensor on a UAV to monitor nitrogen variability in maize and found that the effect of measurement height depends on the sensor type and canopy characteristics [53]. Li et al. mounted a RapidSCAN CS-45 on a multirotor UAV and verified its feasibility for monitoring rice LAI, leaf dry matter, and nitrogen accumulation [54]. Jiang et al. subsequently employed the system to monitor crop growth and the nitrogen status in winter wheat, extending the use of active sensors from handheld measurements to continuous UAV-based data acquisition [55]. Although active systems are less affected by variations in solar irradiance, their measurements remain affected by the sensor-to-canopy distance, viewing angle, and return-signal strength. Their effective sensing range, light-source power consumption, and compatibility with UAV payload constraints also remain limiting factors [53].
Non-imaging spectral monitoring has evolved from single-point ground measurements to continuous observation using UAV-mounted sensors. It can directly output vegetation-related indices without image mosaicking and associated processing steps, resulting in smaller data volumes and faster processing. This approach can support rapid crop nitrogen diagnosis and variable-rate fertilization decisions [11,54]. However, it provides only the average spectrum within the observation footprint and is therefore unable to readily capture internal canopy structure or local variations in the crop growth status [33]. For online variable-rate fertilization, the scale relationships among the observation footprint, fertilizer application width, and prescription units must also be elucidated, and the stability of real-time conversion from monitoring results to fertilizer application commands must be evaluated [56,57].
3.3. Multi-Sensor Synergistic Sensing
Red–green–blue (RGB) imagery offers information on color, texture, canopy cover, and morphological structure, whereas multispectral imagery characterizes canopy pigment and nutritional status. Integrating the two can capture both the spectral responses and spatial features associated with the crop growth status [44,58]. Cen et al. integrated RGB and multispectral features obtained using a dual-camera system, improving the estimation accuracy of aboveground biomass and panicle biomass in rice under different nitrogen-application conditions [44]. Xu et al. fused RGB and multispectral imagery and used raw band values, vegetation indices, and texture features to estimate the leaf nitrogen content in rice [58].
Thermal infrared imaging provides canopy temperature information that complements RGB and reflectance data, helping identify crop water stress and physiological stress [59]. Maimaitijiang et al. integrated RGB, multispectral, and thermal infrared data with structural and textural features, improving the accuracy of soybean yield prediction [60]. Wang et al. combined multispectral vegetation indices with thermal infrared indices, improving the water-stress diagnosis accuracy in winter wheat and the stability of the model across several years [61]. Sahoo et al. used time-series hyperspectral, thermal infrared, and RGB imagery to identify combined nitrogen and water deficiencies in sesame; however, accurately distinguishing among different combined-stress categories remains challenging [62].
LiDAR point clouds and crop surface models generated using structure from motion (SfM) offer complementary structural information, including canopy height and vertical distribution [63,64,65]. Bendig et al. combined SfM-derived canopy height with visible and near-infrared vegetation indices, improving barley biomass estimation accuracy [64]. Shendryk et al. monitored sugarcane biomass and the leaf nitrogen content by integrating LiDAR and multispectral imagery. They found that the benefits of data fusion varied with growth stage and did not consistently exceed those of single-source data [63]. Gu et al. mapped LiDAR point clouds and multispectral imagery into a common canopy space, enabling the three-dimensional characterization of photosynthetic traits in wheat [65].
Multi-sensor monitoring fuses canopy spectral, textural, thermal, and three-dimensional structural information, which improves the monitoring of crop parameters such as biomass, nitrogen status, and water stress [60,61,65]. However, the usefulness of data from different sensors varies across crops, phenological stages, and monitoring objectives: data fusion does not always outperform the use of a single data source [63]. Additional sensor payloads also increase system mass, cost, and data-processing complexity while introducing more stringent requirements on sensor synchronization, data co-registration, and scale matching [23,63].
3.4. UAV Platforms and Control Techniques for Onboard Sensors
UAV platforms offer low-altitude flight, flexible deployment, and controllable timing of observations for spectral monitoring of crop growth status [8,13]. The endurance, payload capacity, and maneuverability of different platforms can determine sensor integration options and monitoring coverage. Common configurations for low-altitude crop monitoring include multirotor, fixed-wing, and vertical take-off and landing (VTOL) fixed-wing platforms, which are suited to fine-scale observation of small areas, rapid monitoring across large areas, and operations in areas with limited take-off and landing space, respectively [1,66,67]. The main characteristics and possible applications of these platforms are summarized in Table 2.
Table 2.
UAV Platform Types and Their Characteristics for Crop Spectral Monitoring.
Flight altitude, speed, trajectory, and image overlap can jointly determine the spatial sampling and acquisition quality of UAV spectral data. Roth et al. integrated GSD, image sharpness, observation geometry, and waypoint planning into the PhenoFly tool, providing a systematic flight-planning approach for optical remote-sensing tasks in agricultural fields [68]. Tu et al. further examined the combined effects of the flight altitude, speed, direction, image overlap, and solar elevation angle on fruit-tree imagery and three-dimensional reconstruction quality [69]. Jiang et al. found that flight altitude, time of day, and solar zenith angle affected UAV-derived NDVI values in paddy rice, underscoring the need to consider canopy conditions and illumination when planning flights [70]. Increasing flight altitude increases GSD and coverage, but may also intensify canopy-background mixing, influencing vegetation indices and the retrieval of crop parameters [71]. Flight speed should be matched to exposure time, sensor sampling frequency, and imaging mode, whereas flight-line spacing and image overlap can affect continuous coverage, spatial matching, and three-dimensional reconstruction quality [69,72]. Waypoint-based autonomous flight, distance-based image triggering, and terrain-following flight can improve the consistency of flight paths, image overlap, and height above ground [68,72].
Different spectral sampling modes impose different requirements on flight control. Push-broom hyperspectral sensors acquire imagery line-by-line as the platform moves; therefore, the flight speed must be matched to the frame rate and exposure time. Otherwise, along-track pixels may be stretched, compressed, or missing, compromising the geometric consistency of the data cube [73,74]. For non-imaging spectral sensors, flight altitude and FOV can determine the instantaneous observation footprint, while flight speed and integration time jointly affect the along-track sampling extent. Errors in platform position and attitude can, in turn, generate deviations in both the location and shape of the footprint [33,35].
Platform-attitude and payload-boresight stability can directly affect observation geometry and spatial positioning. Roll, pitch, and yaw alter the sensor boresight and viewing angle; push-broom hyperspectral sensors are particularly sensitive to these changes because they acquire imagery line by line [73,75]. A stabilized gimbal can reduce the effects of platform-attitude variations and mechanical vibration on the sensor boresight. Position and attitude data from a global navigation satellite system (GNSS) and an inertial measurement unit (IMU) support direct georeferencing, geometric correction, and reconstruction of sensor viewing geometry, particularly for push-broom hyperspectral imagery [73,75]. Lever-arm offsets between the sensor and GNSS/IMU, boresight mounting angles, and time-synchronization errors still affect image geolocation and observation footprints; these parameters therefore warrant calibration during payload integration [75].
External wind disturbances can increase flight-path deviations and attitude fluctuations, while rotor downwash generated by multirotor platforms operating at low altitudes can cause leaf deflection and changes in the canopy structure. Feng et al. quantified the effects of the wind field around a multirotor UAV on the acquisition of rice-canopy spectral information [76]. Yao et al. further optimized the mounting position of a non-imaging spectral sensor based on the downwash distribution, positioning its field of observation away from the main disturbance zone and thereby improving the spectral measurement stability [12]. Therefore, flight parameters for UAV-based spectral monitoring should be set according to platform configuration, sensor sampling mode, and canopy conditions. Flight altitude, speed, trajectory, meteorological conditions, attitude accuracy, and payload calibration information must be recorded systematically to improve data comparability and repeatability across platforms and flight campaigns.
4. UAV-Based Spectral Data Processing Techniques for Crop Growth Status
UAV spectral data processing aims to weaken the effects of differences in sensor response, variations in illumination, low-altitude atmospheric transmission, platform motion, and background mixing, thereby producing radiometrically and spatially comparable canopy spectral data [4,77]. Atmospheric effects may influence the retrieval of quantitative reflectance even at a flight altitude of 50 m [77,78]. Imaging and non-imaging spectral data differ in structure and spatial organization, so their processing priorities also differ. Imaging data require radiometric and geometric correction, band registration, image mosaicking, and canopy extraction [4,45]. Non-imaging data require spectral measurements collected along the flight path to be matched with observation footprints and position information; footprint extent and geolocation are affected by flight altitude, field of view, integration time, speed, and attitude [33,35]. Accordingly, in this section the authors review data-processing methods for imaging and non-imaging spectral data separately.
4.1. Processing Techniques for Imaging Spectral Data
UAV imaging spectral data processing transforms raw multispectral imagery or hyperspectral data cubes into radiometrically comparable and spatially consistent canopy reflectance imagery. The main steps include sensor calibration, radiometric calibration and reflectance conversion, band registration, geometric correction, image mosaicking, spectral quality control, and canopy extraction [3,4]. The workflow for processing imaging spectral monitoring data is illustrated in Figure 3.
Figure 3.
Workflow for imaging spectral data processing.
Sensor calibration and radiometric processing first address systematic errors, including dark current, non-uniform response, vignetting, and lens distortion. Laboratory calibration, the empirical line method, or measurements of incident irradiance are then used to convert raw digital numbers into radiance and reflectance [79,80,81]. Jiang et al. developed a six-band multispectral image-processing workflow that encompassed noise and vignetting correction, lens-distortion correction, band registration, and radiometric correction, and validated the effectiveness of ground-control-point-based registration and the empirical line method [82]. Suomalainen et al. used an onboard irradiance sensor for reflectance conversion, improving the stability of reflectance retrieval under various illumination conditions [77]. At greater flight altitudes or when atmospheric conditions differ substantially, path scattering and absorption also require compensation to improve reflectance comparability across flights [77,78]. Hyperspectral data also require the removal of bad bands and spectral denoising to reduce the effects of low signal-to-noise ratios and random noise [3,81].
Spatial processing varies with imaging modes. Frame-based multispectral and hyperspectral imagery is typically processed using band registration, feature matching, SfM reconstruction, and orthorectification to generate mosaics. For data acquired with asynchronous exposure across bands, band misalignment caused by platform motion must also be corrected [4,83]. Push-broom hyperspectral data require GNSS/IMU information to recover position and attitude line-by-line and to correct strip deformation caused by variations in the flight speed and platform attitude. Song et al. used synchronously acquired multispectral imagery as a geometric reference to register push-broom hyperspectral data and mosaic flight strips, reducing image deformation and drift caused by positioning and attitude errors [74]. After orthomosaicking, vegetation and plot segmentation enable the generation of canopy masks and remove background components such as soil, shadows, and weeds, providing a basis for canopy spectral extraction and plot-scale analysis [84]. Liu et al. further corrected for soil contributions in mixed pixels, reducing the influence of the soil background on maize LAI retrieval [14].
Imaging spectral data processing can generate spatially continuous canopy imagery with a consistent reflectance scale, enabling the identification and mapping of within-field variations in crop growth status [4,74,82]. However, errors in radiometric calibration, band registration, image mosaicking, and canopy segmentation propagate through the processing chain and affect the retrieval results. Push-broom hyperspectral data are particularly sensitive to errors in position and attitude measurements and flight-strip registration. These data also impose high storage and computational demands, which may reduce processing efficiency and hinder comparisons across flights [3,45,74].
4.2. Processing Techniques for Non-Imaging Spectral Data
UAV-based non-imaging spectral sensors record footprint-averaged canopy spectra at discrete locations or sequentially along the flight path without producing two-dimensional imagery. Their processing focuses on radiometric correction, signal quality control, time synchronization, and observation-footprint geolocation to ensure that each spectral record is accurately matched to the corresponding canopy area [11,33,75]. The workflow for processing non-imaging spectral monitoring data is shown in Figure 4.
Figure 4.
Workflow for non-imaging spectral data processing. NDVI, normalized difference vegetation index; NDRE, normalized difference red-edge index. ρ and ρref denote crop and reference-panel reflectance, respectively; Scrop, Sref and Sdark denote crop, reference-panel and dark signals, respectively. Subscripts NIR, Red and RE indicate near-infrared, red and red-edge bands, respectively.
Passive non-imaging sensors use solar radiation as the source of illumination and typically convert canopy radiance signals into reflectance by synchronously measuring incident irradiance or the spectrum of a reference panel. Garzonio et al. measured dark current and performed laboratory spectral and radiometric calibration of a UAV-based non-imaging hyperspectral instrument. They also projected spectral measurements onto a three-dimensional surface model, improving the reliability of reflectance measurements and spatial localization [85]. Ni et al. synchronously acquired incident and reflected signals using upward- and downward-facing sensors, achieving the online calculation of reflectance and vegetation indices [11]. To address irradiance measurement errors caused by platform tilt, Köppl et al. used sensor-attitude data to correct the angle of incidence of an upward-facing probe, improving the consistency of hyperspectral reflectance measurements under intermittent cloud cover [86].
Active non-imaging sensors use modulated illumination to reduce ambient-light effects and generally do not require simultaneous solar-irradiance measurements. Holland et al. systematically elucidated the radiometric measurement principles of active optical sensors for agriculture, providing a basis for obtaining band reflectance and vegetation indices [49]. Li et al. compared measurements from a RapidSCAN CS-45 at heights of 1.5 m and 2 m above the rice canopy. Data acquired at 1.5 m yielded better estimation performance, although the authors found that flying too low could disturb the canopy and increase fluctuations in the flight altitude [54].
The key spatial-processing task required for non-imaging spectral data is to reconstruct the actual observation footprint rather than assign spectral values directly to UAV GPS points. Gautam et al. first developed a footprint-positioning error model, finding that flight altitude and attitude accuracy primarily affect footprint geolocation error, whereas field of view, integration time, and flight speed primarily determine footprint extent [35]. They subsequently improved the direct georeferencing accuracy by calibrating the sensor FOV and correcting the lever-arm offset and boresight mounting angles between the sensor and GNSS/IMU [75]. By further incorporating position, attitude, and terrain information, the location, shape, and extent of the observation footprint were reconstructed [33]. For plot-scale processing, Li et al. and Jiang et al. assigned spectral records to the corresponding plots based on GPS data, excluded boundary observations, and calculated mean reflectance to determine plot-scale spectral indices [54,55].
After reflectance correction and footprint geolocation, UAV non-imaging spectral data provide canopy spectra and vegetation indices along flight paths or at the plot scale. By eliminating processing steps such as image mosaicking, this approach facilitates the rapid derivation of crop growth information, including nitrogen status [11,54,85]. However, passive systems are prone to fluctuations under varying illumination or platform tilt, whereas active systems remain constrained by flight altitude and observation footprint. Geolocation errors may assign measurements to the wrong plots, while footprint averaging limits the spatial detail of crop growth estimates [33,53,75,86].
5. UAV-Based Spectral Retrieval Modeling Techniques for Crop Growth Status
UAV spectral data are used to estimate crop structural, physiological, and biochemical parameters, including LAI, chlorophyll content, nitrogen status, aboveground biomass, and water status [1,13]. Model inputs include band reflectance, vegetation indices, and red-edge parameters, increasingly supplemented by canopy texture and structural features such as plant height [36]. Models link these features to crop growth parameters using ground measurements for training and validation [2]. Ground reference measurements should match the target crop, observation timing, and spatial footprint of the spectral data. In intercropping systems, differences in plant size, canopy cover, and crop composition should also be considered to avoid attributing scale or background effects to target-crop growth [14,16,32]. Figure 5 illustrates the retrieval workflow. This section focuses on empirical and data-driven retrieval methods: statistical regression, machine learning, and deep learning. Radiative-transfer and hybrid methods are mentioned where relevant but are outside the scope of this section.
Figure 5.
Workflow for retrieving crop growth parameters from UAV spectral data. UAV, unmanned aerial vehicle; NDVI, normalized difference vegetation index; LAI, leaf area index; MLR, multiple linear regression; PLSR, partial least squares regression; RF, random forest; SVR, support vector regression; XGBoost, extreme gradient boosting; DNN, deep neural network; CNN, convolutional neural network; LSTM, long short-term memory; R2, coefficient of determination; RMSE, root mean square error; MAE, mean absolute error.
5.1. Statistical Retrieval Model Development
Statistical retrieval models quantify crop growth parameters by fitting empirical relationships between spectral features and measured parameters. Common approaches include univariate linear or nonlinear regression, multiple linear regression, and partial least squares regression (PLSR). Univariate and multiple regressions are suitable for vegetation indices or a small number of features, whereas PLSR extracts latent variables from high-dimensional spectral data with strong collinearity. These models are generally simple and interpretable [2,23]. Li et al. established models based on individual vegetation indices and stepwise multiple linear regressions using the red, red-edge, and near-infrared bands of a RapidSCAN sensor, and evaluated their ability to estimate rice leaf dry matter, LAI, and leaf nitrogen accumulation from UAV observations [54]. Han et al. used multiple UAV-derived multispectral vegetation indices to develop multiple linear regression models for estimating the LAI, soil–plant analysis development values, and yield in winter wheat under different water treatment regimens [87]. Kanning et al. estimated the LAI and chlorophyll content in winter wheat from UAV hyperspectral imagery using PLSR [88]. Yue et al. further integrated hyperspectral features with plant height, improving the accuracy of PLSR-based aboveground biomass estimation in winter wheat [10].
Statistical models have relatively few parameters and directly describe the relationships between spectral features and crop growth parameters. They remain useful when sample sizes are limited and these relationships are relatively stable; however, they rely on empirical relationships established from the training samples. When cultivars, phenological stages, or observation conditions vary, the model coefficients often require recalibration, and complex nonlinear interactions among multiple features are difficult to represent [2,23].
5.2. Machine-Learning Retrieval Model Development
Machine-learning models can capture nonlinear relationships between multidimensional spectral features and crop growth parameters. Common methods include support vector regression (SVR), random forest (RF), extreme gradient boosting (XGBoost), and shallow artificial neural networks. These models are suitable for retrieval tasks involving numerous features and complex relationships [2,23]. Yuan et al. compared RF, a shallow artificial neural network, SVR, and PLSR for soybean LAI estimation. RF performed well throughout the growing season, whereas the shallow neural network performed better within a single growth stage, indicating that model performance depends on the composition of the training samples and the phenological stage [89]. Lee et al. found that RF and SVR both outperformed linear regression in estimating maize canopy nitrogen status, with RF performing best [90]. For high-dimensional spectral data, Zhang et al. leveraged competitive adaptive reweighted sampling and the successive projections algorithm to select characteristic bands. Their XGBoost model achieved high accuracy in estimating winter wheat LAI while reducing spectral redundancy [91]. Zhang et al. integrated UAV-derived multispectral vegetation and texture indices to improve LAI estimation in maize, with SVR performing best among those models tested [92]. Chen et al. used UAV hyperspectral imagery to estimate the plant nitrogen concentration in winter wheat and found that RF and SVR generally outperformed parametric regression, stepwise multiple linear regressions, and PLSR, although the best-performing model varied with phenological stage [46].
Model performance is sensitive to the composition of the training data and hyperparameter settings. When the crop, phenological stage, or experimental conditions change, the model often needs to be retrained or retuned [2,23,46,89].
5.3. Deep-Learning Retrieval Model Development
Deep-learning models use multilayer neural networks to learn spectral, spatial, and temporal features from UAV data. Common architectures include deep neural network (DNN) models, convolutional neural networks, long short-term memory networks, and hybrid networks. These models can represent complex nonlinear relationships [2,23]. Maimaitijiang et al. integrated UAV-derived RGB, multispectral, and thermal infrared data using a DNN, improving the accuracy of yield prediction in soybean crops [60]. Liu et al. used the same types of multimodal data to estimate maize LAI. The DNN provided the best estimates for a single growth stage, whereas PLSR performed best throughout the growing season, indicating that the advantages of deep learning depend on the composition of the training samples and the phenological stages represented therein [93]. For the extraction of spatial features, Qiao et al. used a 50-layer residual network to extract deep features from multispectral vegetation-index maps and then combined them with PLSR to estimate maize LAI. This approach outperformed models based on raw vegetation indices and texture features, indicating that deep features can also be integrated with conventional retrieval models [94]. Yu et al. developed a deep convolutional neural network using RGB and multispectral imagery together with canopy surface models to estimate the aboveground biomass in maize crops. However, the advantage of the deep learning model diminished when a sufficiently comprehensive set of manually extracted agronomic features was available [95].
To reduce the dependence of deep learning on large training datasets, Bhadra et al. pretrained a dual-stream neural network using PROSAIL-simulated spectra and then applied transfer learning with a limited amount of UAV hyperspectral data to estimate the leaf chlorophyll content and average leaf angle [47]. Li et al. further integrated a CNN, long short-term memory, and a self-attention mechanism jointly to extract spatial and temporal features from UAV multispectral imagery, improving rice LAI estimation throughout the growing season [96].
Their performance depends on the availability of sufficient, representative labeled samples; with limited samples or changes in phenological stage, they may not outperform traditional models. They therefore generally require revalidation when transferred across years, regions, or sensors. Their “black-box” nature also limits the interpretation of learned relationships between spectral features and crop growth parameters. Although training can be performed offline, inference with complex networks may still require substantial computational resources, memory, and power, limiting their direct deployment on lightweight onboard systems. Computationally demanding models are thus better suited to offline imaging workflows, whereas real-time onboard retrieval requires streamlined models whose computational and power demands match the platform’s available resources [2,23,93,95].
The R2 and RMSE values in Table 3 should not be used to rank models directly, as target variables, sampling units, and validation designs differ. Randomly splitting repeated observations from the same plots can create dependence between training and test sets, yielding optimistic error estimates. Most results reflect within-experiment validation; the independent-field yield study [97] assesses spatial transfer but does not establish transferability across seasons or cultivars. Feature selection and hyperparameter tuning should use only training data, with internal cross-validation for model selection and a separate test set for final evaluation.
Table 3.
Comparison of representative UAV-based crop monitoring studies.
6. Challenges and Future Perspectives
Variable-rate fertilization based on within-field variability can improve fertilizer use and operational efficiency. UAV-based spectral monitoring provides field information for this purpose, but its practical value depends on translating crop growth and nitrogen status into spatial units and application rates compatible with fertilization equipment [20,99,100]. Evaluation should therefore consider retrieval accuracy, the ability to generate executable prescriptions before scheduled fertilization, and alignment between monitoring and application scales. Imaging spectroscopy provides continuous spatial information at centimeter-level resolution, but high-resolution, multiband data increase storage and computational demands; radiometric correction, mosaicking, and information extraction still rely substantially on offline processing [3,4]. Sousa et al. generated hyperspectral orthomosaics with a spatial resolution of 20 mm and 50 bands over test areas of 1.0–1.2 ha, producing files of 8.5–11.5 GB. Based on the reported preprocessing and per-band mosaicking times, preprocessing and sequential mosaicking of all 50 bands would take approximately 12–15 h on the workstation used, excluding parameter retrieval and fertilizer prescription generation. This case illustrates how offline processing in high-resolution hyperspectral workflows can delay the use of monitoring results for variable-rate fertilization [45].
Non-imaging spectral sensors record measurements within each observation footprint without producing continuous two-dimensional imagery, reducing data volumes and avoiding image mosaicking. Existing systems can transmit spectral data during acquisition and calculate reflectance, vegetation indices, or selected crop growth parameters online [11,12,52]. The sensor developed by Yao et al. has a 27° FOV, giving an estimated footprint area of 0.18–0.41 m2 at sensor-to-canopy distances of 1.0–1.5 m [12]. In the system developed by Chang et al., the footprint radius is approximately 11.9 m at the minimum flight altitude of 10 m, corresponding to an area of approximately 445 m2 [101]. The resulting estimates average conditions within each footprint and occur at discrete locations along the flight path [12,33,101]. Suitability for variable-rate fertilization therefore depends on whether the footprint, sampling density, and positioning accuracy meet prescription-mapping requirements [33,57]. Online monitoring refers to transmitting or processing measurements during acquisition; it does not indicate how long an executable prescription takes to produce. A processing-time comparison for the same field coverage and prescription requirements must include acquisition, calibration, geolocation, spatial mapping, and prescription generation, for which the cited studies provide no comparable end-to-end times. Real-time application control requires a sensing-to-actuation delay compatible with travel speed, sensor–applicator spacing, and actuator response, whereas map-based fertilization uses prescriptions prepared before application.
Argento et al. used soil mineral N to adjust the first nitrogen application and NDRE relative to the field mean to adjust subsequent applications: areas with higher NDRE received less N. They downsampled UAV-derived information to match the tractor terminal’s minimum prescription-cell size of 7 m × 7 m and noted that 10 m × 10 m imagery could also support prescription generation [102]. Across their field cases, variable-rate application reduced N input by 5–40% without a significant difference in grain yield. Marginal returns tended to improve, but the differences were not statistically significant [102]. Tsitouras et al. used the 95th percentile of NDVI values in a representative virtual reference strip to indicate N-sufficient crop conditions. A recommendation algorithm used NDVI relative to this reference to calculate N rates for a 9 m × 9 m prescription map [57]. Compared with uniform application, N input decreased by 18.4–49.6%; grain yield did not differ significantly in Field A but declined significantly by 17.4% in Field B [57]. The authors reported an economic gain of EUR 163.8 ha−1 (7.2%) in one field, but no considerable gain in the other [57]. In a bio-economic simulation of Swiss wheat, Späti et al. compared spatial resolutions including 2 m × 2 m and 10 m × 10 m. Finer information was more valuable in heterogeneous fields, but its additional net returns were small and could be outweighed by monitoring costs [56].
The reported fertilizer, yield, and economic outcomes were obtained from imaging-based prescriptions and should not be assumed for Chang et al.’s non-imaging system. The prescription-cell sizes reflect the equipment and fields studied and are not universally optimal. Chang et al.’s approximately 445 m2 footprint is 4.5–9.1 times the area of the 49–100 m2 prescription cells used in the other studies [57,101,102]. Assigning a footprint average to smaller cells cannot recover variation within that footprint. Denser, overlapping observations may improve spatial estimation, but sampling and flight-line spacing must account for footprint size and field variability. Resolving cell-scale variation requires a narrower footprint or spatial estimates independently validated at that scale. Positioning error and uncertainty in cell estimates should also be considered in N-rate recommendations. Footprint averages may nevertheless support fertilization decisions when validated at the intended application scale. Monitoring scale should therefore balance agronomic needs, applicator capabilities, uncertainty, and cost [33,56,102].
6.1. Integrated Onboard Sensing, Computing, and Storage
Previous studies explored prototypes for airborne hyperspectral data acquisition and onboard processing, but their capabilities for real-time retrieval and quality control in complex agricultural field conditions warrant further validation [103]. In the reviewed non-imaging systems, processing functions remain distributed between onboard and ground systems. In these systems, real-time quality control, spatiotemporal association, deployment of retrieval models, and structured storage of results have not yet been integrated into a unified onboard workflow [11,12,52].
Future work should address the dispersion of onboard processing functions and the continued reliance on offline ground-based processing by developing lightweight systems that integrate spectral sensing, edge computing, and local storage. These systems should enable data acquisition, quality control, parameter retrieval, and result storage to be performed continuously during monitoring. Spectral sensors, a GNSS/IMU, an embedded computing unit, and a storage module should be integrated into a single payload, with particular attention to synchronizing records of acquisition time, attitude, and spectral data. Retrieval models should then be streamlined to match onboard computing capacity, enabling radiometric normalization, rejection of outliers, and index calculation during flight. Across different flight altitudes, illumination conditions, and phenological stages, onboard outputs should be compared with results from offline ground-based processing to ascertain whether faster processing comes at the expense of accuracy or flight endurance. Only after this comparison demonstrates consistent performance should georeferenced, quality-flagged outputs be connected to variable-rate fertilization systems to assess whether they meet the timeliness requirements for prescription generation.
6.2. Multi-Sensor Data Fusion
Current UAV spectral systems rely primarily on intensity spectra, downwelling irradiance, and reference-panel information for radiometric correction. Empirical line calibration, downwelling irradiance correction, and radiometric block adjustment can reduce the effects of changes in illumination and radiometric differences among images [4,28,77]. However, intensity measurements alone may not adequately characterize factors such as atmospheric path radiance, specular reflection from canopy surfaces, and diffuse reflection within plant tissues. Therefore, sensing approaches that provide complementary information on reflectance properties and observation geometry can be introduced to improve monitoring robustness under complex field conditions.
Polarization information sensitive to leaf surface structure, roughness, and observation geometry can provide additional reflectance features for intensity-based spectral monitoring [104,105]. Larsen et al. mounted a polarization imaging system on a UAV to assess peanut leaf-spot severity. Their results showed that prediction errors were lower when the degree of linear polarization was combined with RGB information than when RGB information was used alone, indicating that polarization can provide complementary features for conventional image-based monitoring [106]. According to publicly available manufacturer information, the Brimrose hyperspectral–polarimetric instrument HySPI is commercially available, although the cited material does not report field validation for agricultural UAV applications [107]. In agricultural UAV research, Xu et al. fitted a circular polarizing filter to a UAV hyperspectral system and acquired conventional and polarized hyperspectral data separately at multiple viewing angles to estimate rice canopy nitrogen content [108]. This study demonstrates a UAV field application of spectral–polarimetric sensing using an adapted hyperspectral system, but does not establish the commercial availability of an integrated UAV payload capable of simultaneous spectral and polarimetric acquisition.
The stability and generalizability of polarization information across dynamic UAV flight conditions, complex canopy structures, and different crops require further validation. Further development could focus on lightweight sensing units that combine intensity spectra and polarization within a common field of view and use synchronized triggering. These units could be integrated with downwelling irradiance, positioning and attitude, and ranging modules to establish a unified framework for temporal synchronization, spatial co-registration, and radiometric calibration. On this basis, spectral reflectance, polarization features, incident irradiance, observation geometry, and flight altitude could be integrated to develop quality-control and joint-correction methods that address illumination fluctuations, changes in viewing angle, and differences in canopy reflectance.
6.3. Multimodal Retrieval and Spatial Mapping
Future work should advance multimodal retrieval and spatial mapping from discrete non-imaging observations.
First, multimodal data fusion should be used for crop growth parameter retrieval. Leaf-scale studies revealed that polarization measurements respond to the chlorophyll content, but their applicability and stability at the field-canopy scale remain to be validated [109]. Future models can integrate polarization and intensity spectra with structural features, such as texture, canopy cover, and plant height, derived from RGB, multispectral, and LiDAR data. This would enable complementary characterization of physiological and biochemical status and canopy structure [36,60,95]. Furthermore, issues related to multi-sensor time synchronization, spatial co-registration, scale matching, and feature standardization need to be addressed. Models should combine radiative-transfer constraints with data-driven approaches, and incorporate transfer learning to improve generalizability across different cultivars, phenological stages, and environmental conditions [47].
Second, spatial mapping methods should be developed for non-imaging retrieval outputs. Positioning and attitude information, flight altitude, sensor field of view, and terrain data should be used to identify the location, extent, and shape of each observation footprint, rather than treating the footprint-averaged value as a point observation [33]. Synchronized RGB or multispectral imagery and other auxiliary spatial data can then be incorporated to plot continuous field-scale maps through spectral–image data fusion or spatial prediction [110]. The output grid size should be selected to characterize the observation footprint and sampling density and to align with variable-rate operation units. Prediction accuracy and uncertainty should be evaluated using spatial cross-validation or independent samples.
7. Conclusions
UAV-based spectral monitoring enables non-destructive assessment of crop growth status, but its reliability is constrained by observation scale, illumination conditions, spectral mixing with other vegetation and soil backgrounds, and the applicability of retrieval models. Imaging spectral sensors capture spatial detail within fields, but large datasets and processing workflows limit the timeliness of result generation. Non-imaging spectral sensors generate smaller datasets and require shorter processing chains, facilitating real-time transmission and onboard computation; however, footprint-averaged measurements and discrete sampling limit their representation of spatial variability. The benefits of multi-sensor fusion and complex retrieval models depend on application conditions and should be evaluated in relation to sample requirements, interpretability, and computational resources. For variable-rate fertilization, technology selection should balance retrieval accuracy, processing timeliness, monitoring costs, and the spatial scale of machinery operations, enabling crop growth monitoring outputs to provide a reliable basis for prescription generation and variable-rate application.
Author Contributions
Conceptualization, J.S. and J.N.; methodology, J.S. and J.N.; validation, S.W., Z.D., Y.F., H.Z. and Z.Z.; formal analysis, J.S., Y.F. and H.Z.; investigation, J.S., S.W. and Z.D.; resources, Z.Z.; data curation, J.S., S.W., Z.D., Y.F. and H.Z.; writing—original draft preparation, J.S.; writing—review and editing, J.S., S.W., Z.D., Z.Z. and J.N.; visualization, J.S., Y.F. and H.Z.; supervision, J.N.; project administration, J.N.; funding acquisition, J.N. All authors have read and agreed to the published version of the manuscript.
Funding
This work was supported by the Research Start-up Fund for High-level Talents (Grant No. 0231-A3-0100-26-RC10005); the National Natural Science Foundation of China [Grant No. 52572414]; the Natural Science Foundation of Shanghai [Grant No. 25ZR1401146].
Data Availability Statement
No new data were created or analyzed in this study. Data sharing is not applicable to this article.
Conflicts of Interest
The authors declare no conflict of interest.
Abbreviations
The following abbreviations are used in this manuscript:
| UAV | unmanned aerial vehicle |
| LAI | leaf area index |
| LiDAR | light detection and ranging |
| GSD | ground sampling distance |
| FOV | field of view |
| NDVI | normalized difference vegetation index |
| RVI | ratio vegetation index |
| RGB | red–green–blue |
| SfM | structure from motion |
| GNSS | global navigation satellite system |
| IMU | inertial measurement unit |
| PLSR | partial least squares regression |
| SVR | support vector regression |
| RF | random forest |
| XGBoost | extreme gradient boosting |
| DNN | deep neural network |
| CNN | convolutional neural network |
| VTOL | vertical take-off and landing |
| ELM | extreme learning machine |
| LSTM | long short-term memory |
| NDRE | normalized difference red-edge index |
| RMSE | root mean square error |
| MAE | mean absolute error |
References
- Yang, G.; Liu, J.; Zhao, C.; Li, Z.; Huang, Y.; Yu, H.; Xu, B.; Yang, X.; Zhu, D.; Zhang, X.; et al. Unmanned Aerial Vehicle Remote Sensing for Field-Based Crop Phenotyping: Current Status and Perspectives. Front. Plant Sci. 2017, 8, 1111. [Google Scholar] [CrossRef] [Scilit] [PubMed]
- Gano, B.; Bhadra, S.; Vilbig, J.M.; Ahmed, N.; Sagan, V.; Shakoor, N. Drone-based imaging sensors, techniques, and applications in plant phenotyping for crop breeding: A comprehensive review. Plant Phenome J. 2024, 7, e20100. [Google Scholar] [CrossRef] [Scilit]
- Adão, T.; Hruška, J.; Pádua, L.; Bessa, J.; Peres, E.; Morais, R.; Sousa, J. Hyperspectral Imaging: A Review on UAV-Based Sensors, Data Processing and Applications for Agriculture and Forestry. Remote Sens. 2017, 9, 1110. [Google Scholar] [CrossRef] [Scilit]
- Aasen, H.; Honkavaara, E.; Lucieer, A.; Zarco-Tejada, P.J. Quantitative Remote Sensing at Ultra-High Resolution with UAV Spectroscopy: A Review of Sensor Technology, Measurement Procedures, and Data Correction Workflows. Remote Sens. 2018, 10, 1091. [Google Scholar] [CrossRef] [Scilit]
- Weiss, M.; Jacob, F.; Duveiller, G. Remote sensing for agricultural applications: A meta-review. Remote Sens. Environ. 2020, 236, 111402. [Google Scholar] [CrossRef] [Scilit]
- Bossung, C.; Schlerf, M.; Machwitz, M. Estimation of canopy nitrogen content in winter wheat from Sentinel-2 images for operational agricultural monitoring. Precis. Agric. 2022, 23, 2229–2252. [Google Scholar] [CrossRef] [Scilit]
- Prudente, V.H.R.; Martins, V.S.; Vieira, D.C.; Silva, N.R.F.; Adami, M.; Sanches, I.D. Limitations of cloud cover for optical remote sensing of agricultural areas across South America. Remote Sens. Appl. Soc. Environ. 2020, 20, 100414. [Google Scholar] [CrossRef] [Scilit]
- Zhang, C.; Kovacs, J.M. The application of small unmanned aerial systems for precision agriculture: A review. Precis. Agric. 2012, 13, 693–712. [Google Scholar] [CrossRef] [Scilit]
- Aasen, H.; Burkart, A.; Bolten, A.; Bareth, G. Generating 3D hyperspectral information with lightweight UAV snapshot cameras for vegetation monitoring: From camera calibration to quality assurance. ISPRS J. Photogramm. Remote Sens. 2015, 108, 245–259. [Google Scholar] [CrossRef] [Scilit]
- Yue, J.; Yang, G.; Li, C.; Li, Z.; Wang, Y.; Feng, H.; Xu, B. Estimation of Winter Wheat Above-Ground Biomass Using Unmanned Aerial Vehicle-Based Snapshot Hyperspectral Sensor and Crop Height Improved Models. Remote Sens. 2017, 9, 708. [Google Scholar] [CrossRef] [Scilit]
- Ni, J.; Yao, L.; Zhang, J.; Cao, W.; Zhu, Y.; Tai, X. Development of an Unmanned Aerial Vehicle-Borne Crop-Growth Monitoring System. Sensors 2017, 17, 502. [Google Scholar] [CrossRef] [Scilit] [PubMed]
- Yao, L.; Wang, Q.; Yang, J.; Zhang, Y.; Zhu, Y.; Cao, W.; Ni, J. UAV-Borne Dual-Band Sensor Method for Monitoring Physiological Crop Status. Sensors 2019, 19, 816. [Google Scholar] [CrossRef] [Scilit] [PubMed]
- Maes, W.H.; Steppe, K. Perspectives for Remote Sensing with Unmanned Aerial Vehicles in Precision Agriculture. Trends Plant Sci. 2019, 24, 152–164. [Google Scholar] [CrossRef] [Scilit] [PubMed]
- Liu, S.; Jin, X.; Bai, Y.; Wu, W.; Cui, N.; Cheng, M.; Liu, Y.; Meng, L.; Jia, X.; Nie, C.; et al. UAV multispectral images for accurate estimation of the maize LAI considering the effect of soil background. Int. J. Appl. Earth Obs. Geoinf. 2023, 121, 103383. [Google Scholar] [CrossRef] [Scilit]
- Zhang, J.; Wang, C.; Yang, C.; Xie, T.; Jiang, Z.; Hu, T.; Luo, Z.; Zhou, G.; Xie, J. Assessing the Effect of Real Spatial Resolution of In Situ UAV Multispectral Images on Seedling Rapeseed Growth Monitoring. Remote Sens. 2020, 12, 1207. [Google Scholar] [CrossRef] [Scilit]
- Wang, L.; Jia, S.; Zhao, J.; Liang, C.; Zhang, W. Estimation of Canopy Traits and Yield in Maize–Soybean Intercropping Systems Using UAV Multispectral Imagery and Machine Learning. Agriculture 2026, 16, 487. [Google Scholar] [CrossRef] [Scilit]
- Yang, L.; Chen, J.; Zhang, R.; Yang, S.; Zhang, X.; Jiao, L. Precise crop classification of UAV hyperspectral imagery using kernel tensor slice sparse coding based classifier. Neurocomputing 2023, 551, 126487. [Google Scholar] [CrossRef] [Scilit]
- Lu, Q.; Xie, Y.; Wei, L.; Wei, Z.; Tian, S.; Liu, H.; Cao, L. Extended Attribute Profiles for Precise Crop Classification in UAV-Borne Hyperspectral Imagery. IEEE Geosci. Remote Sens. Lett. 2024, 21, 1–5. [Google Scholar] [CrossRef] [Scilit]
- Tian, B.; Yu, H.; Zhang, S.; Wang, X.; Yang, L.; Li, J.; Cui, W.; Wang, Z.; Lu, L.; Lan, Y.; et al. Inversion of Cotton Soil and Plant Analytical Development Based on Unmanned Aerial Vehicle Multispectral Imagery and Mixed Pixel Decomposition. Agriculture 2024, 14, 1452. [Google Scholar] [CrossRef] [Scilit]
- Hunt, E.R.; Daughtry, C.S.T. What good are unmanned aircraft systems for agricultural remote sensing and precision agriculture? Int. J. Remote Sens. 2018, 39, 5345–5376. [Google Scholar] [CrossRef] [Scilit]
- Tsouros, D.C.; Bibi, S.; Sarigiannidis, P.G. A Review on UAV-Based Applications for Precision Agriculture. Information 2019, 10, 349. [Google Scholar] [CrossRef] [Scilit]
- Olson, D.; Anderson, J. Review on unmanned aerial vehicles, remote sensors, imagery processing, and their applications in agriculture. Agron. J. 2021, 113, 971–992. [Google Scholar] [CrossRef] [Scilit]
- Matese, A.; Prince Czarnecki, J.M.; Samiappan, S.; Moorhead, R. Are unmanned aerial vehicle-based hyperspectral imaging and machine learning advancing crop science? Trends Plant Sci. 2024, 29, 196–209. [Google Scholar] [CrossRef] [Scilit] [PubMed]
- Hu, X.; Wang, X.; Zhong, Y.; Zhang, L. S3ANet: Spectral-spatial-scale attention network for end-to-end precise crop classification based on UAV-borne H2 imagery. ISPRS J. Photogramm. Remote Sens. 2022, 183, 147–163. [Google Scholar] [CrossRef] [Scilit]
- Jafarbiglu, H.; Pourreza, A. Impact of sun-view geometry on canopy spectral reflectance variability. ISPRS J. Photogramm. Remote Sens. 2023, 196, 270–286. [Google Scholar] [CrossRef] [Scilit]
- Prey, L.; Hanemann, A.; Ramgraber, L.; Seidl-Schulz, J.; Noack, P.O. UAV-Based Estimation of Grain Yield for Plant Breeding: Applied Strategies for Optimizing the Use of Sensors, Vegetation Indices, Growth Stages, and Machine Learning Algorithms. Remote Sens. 2022, 14, 6345. [Google Scholar] [CrossRef] [Scilit]
- Camenzind, M.P.; Yu, K. Multi temporal multispectral UAV remote sensing allows for yield assessment across European wheat varieties already before flowering. Front. Plant Sci. 2024, 14, 1214931. [Google Scholar] [CrossRef] [Scilit] [PubMed]
- Wang, Y.; Yang, Z.; Khan, H.A.; Kootstra, G. Improving Radiometric Block Adjustment for UAV Multispectral Imagery under Variable Illumination Conditions. Remote Sens. 2024, 16, 3019. [Google Scholar] [CrossRef] [Scilit]
- Jiang, J.; Zhang, Q.; Wang, W.; Wu, Y.; Zheng, H.; Yao, X.; Zhu, Y.; Cao, W.; Cheng, T. MACA: A Relative Radiometric Correction Method for Multiflight Unmanned Aerial Vehicle Images Based on Concurrent Satellite Imagery. IEEE Trans. Geosci. Remote Sens. 2022, 60, 1–14. [Google Scholar] [CrossRef] [Scilit]
- Jiang, J.; Zhang, Q.; Gao, S. Enhancing Multi-Flight Unmanned-Aerial-Vehicle-Based Detection of Wheat Canopy Chlorophyll Content Using Relative Radiometric Correction. Remote Sens. 2025, 17, 1557. [Google Scholar] [CrossRef] [Scilit]
- Deng, L.; Yan, Y.; Gong, H.; Duan, F.; Zhong, R. The effect of spatial resolution on radiometric and geometric performances of a UAV-mounted hyperspectral 2D imager. ISPRS J. Photogramm. Remote Sens. 2018, 144, 298–314. [Google Scholar] [CrossRef] [Scilit]
- Hassani, K.; Gholizadeh, H.; Taghvaeian, S.; Natalie, V.; Carpenter, J.; Jacob, J. Assessing the impact of spatial resolution of UAS-based remote sensing and spectral resolution of proximal sensing on crop nitrogen retrieval accuracy. Int. J. Remote Sens. 2023, 44, 4441–4464. [Google Scholar] [CrossRef] [Scilit]
- Gautam, D.; Lucieer, A.; Bendig, J.; Malenovský, Z. Footprint Determination of a Spectroradiometer Mounted on an Unmanned Aircraft System. IEEE Trans. Geosci. Remote Sens. 2020, 58, 3085–3096. [Google Scholar] [CrossRef] [Scilit]
- Honkavaara, E.; Saari, H.; Kaivosoja, J.; Pölönen, I.; Hakala, T.; Litkey, P.; Mäkynen, J.; Pesonen, L. Processing and Assessment of Spectrometric, Stereoscopic Imagery Collected Using a Lightweight UAV Spectral Camera for Precision Agriculture. Remote Sens. 2013, 5, 5006–5039. [Google Scholar] [CrossRef] [Scilit]
- Gautam, D.; Watson, C.; Lucieer, A.; Malenovský, Z. Error Budget for Geolocation of Spectroradiometer Point Observations from an Unmanned Aircraft System. Sensors 2018, 18, 3465. [Google Scholar] [CrossRef] [Scilit] [PubMed]
- Zou, M.; Liu, Y.; Fu, M.; Li, C.; Zhou, Z.; Meng, H.; Xing, E.; Ren, Y. Combining spectral and texture feature of UAV image with plant height to improve LAI estimation of winter wheat at jointing stage. Front. Plant Sci. 2024, 14, 1272049. [Google Scholar] [CrossRef] [Scilit] [PubMed]
- von Bueren, S.K.; Burkart, A.; Hueni, A.; Rascher, U.; Tuohy, M.P.; Yule, I.J. Deploying four optical UAV-based sensors over grassland: Challenges and limitations. Biogeosciences 2015, 12, 163–175. [Google Scholar] [CrossRef] [Scilit]
- American Society for Photogrammetry and Remote Sensing. LAS Specification, Version 1.4, Revision 15; American Society for Photogrammetry and Remote Sensing: Bethesda, MD, USA, 2019. [Google Scholar]
- Geipel, J.; Link, J.; Wirwahn, J.A.; Claupein, W. A Programmable Aerial Multispectral Camera System for In-Season Crop Biomass and Nitrogen Content Estimation. Agriculture 2016, 6, 4. [Google Scholar] [CrossRef] [Scilit]
- Zheng, H.; Cheng, T.; Li, D.; Yao, X.; Tian, Y.; Cao, W.; Zhu, Y. Combining Unmanned Aerial Vehicle (UAV)-Based Multispectral Imagery and Ground-Based Hyperspectral Data for Plant Nitrogen Concentration Estimation in Rice. Front. Plant Sci. 2018, 9, 936. [Google Scholar] [CrossRef] [Scilit] [PubMed]
- Li, S.; Lin, Y.; Zhu, P.; Jin, L.; Bian, C.; Liu, J. Combining UAV Multispectral Imaging and PROSAIL Model to Estimate LAI of Potato at Plot Scale. Agriculture 2024, 14, 2159. [Google Scholar] [CrossRef] [Scilit]
- Fonseka, C.L.I.S.; Halloluwa, T.; Hewagamage, K.P.; Rathnayake, U.; Bandara, R.M.U.S. A dataset of unmanned aerial vehicle multispectral images acquired over a field to identify nitrogen requirements. Data Brief 2024, 54, 110479. [Google Scholar] [CrossRef] [Scilit] [PubMed]
- Yao, X.; Wang, N.; Liu, Y.; Cheng, T.; Tian, Y.; Chen, Q.; Zhu, Y. Estimation of Wheat LAI at Middle to High Levels Using Unmanned Aerial Vehicle Narrowband Multispectral Imagery. Remote Sens. 2017, 9, 1304. [Google Scholar] [CrossRef] [Scilit]
- Cen, H.; Wan, L.; Zhu, J.; Li, Y.; Li, X.; Zhu, Y.; Weng, H.; Wu, W.; Yin, W.; Xu, C.; et al. Dynamic monitoring of biomass of rice under different nitrogen treatments using a lightweight UAV with dual image-frame snapshot cameras. Plant Methods 2019, 15, 32. [Google Scholar] [CrossRef] [Scilit] [PubMed]
- Sousa, J.J.; Toscano, P.; Matese, A.; Di Gennaro, S.F.; Berton, A.; Gatti, M.; Poni, S.; Pádua, L.; Hruška, J.; Morais, R.; et al. UAV-Based Hyperspectral Monitoring Using Push-Broom and Snapshot Sensors: A Multisite Assessment for Precision Viticulture Applications. Sensors 2022, 22, 6574. [Google Scholar] [CrossRef] [Scilit] [PubMed]
- Chen, X.; Li, F.; Shi, B.; Chang, Q. Estimation of Winter Wheat Plant Nitrogen Concentration from UAV Hyperspectral Remote Sensing Combined with Machine Learning Methods. Remote Sens. 2023, 15, 2831. [Google Scholar] [CrossRef] [Scilit]
- Bhadra, S.; Sagan, V.; Sarkar, S.; Braud, M.; Mockler, T.C.; Eveland, A.L. PROSAIL-Net: A transfer learning-based dual stream neural network to estimate leaf chlorophyll and leaf angle of crops from UAV hyperspectral images. ISPRS J. Photogramm. Remote Sens. 2024, 210, 1–24. [Google Scholar] [CrossRef] [Scilit]
- Burkart, A.; Cogliati, S.; Schickling, A.; Rascher, U. A Novel UAV-Based Ultra-Light Weight Spectrometer for Field Spectroscopy. IEEE Sens. J. 2014, 14, 62–67. [Google Scholar] [CrossRef] [Scilit]
- Holland, K.H.; Lamb, D.W.; Schepers, J.S. Radiometry of Proximal Active Optical Sensors (AOS) for Agricultural Sensing. IEEE J. Sel. Top. Appl. Earth Obs. Remote Sens. 2012, 5, 1793–1802. [Google Scholar] [CrossRef] [Scilit]
- Jiang, Y.; Cheng, Z.; Yang, G.; Zhao, D.; Zhang, C.; Xu, B.; Feng, H.; Feng, Z.; Ren, L.; Zhang, Y.; et al. Fine-Scale Quantification of the Effect of Maize Tassel on Canopy Reflectance with 3D Radiative Transfer Modeling. Remote Sens. 2024, 16, 2721. [Google Scholar] [CrossRef] [Scilit]
- Liu, N.; Zhang, W.; Liu, F.; Zhang, M.; Du, C.; Sun, C.; Cao, J.; Ji, S.; Sun, H. Development of a Crop Spectral Reflectance Sensor. Agronomy 2022, 12, 2139. [Google Scholar] [CrossRef] [Scilit]
- Yuan, H.; Yang, J.; Jiang, X.; Zhu, Y.; Cao, W.; Ni, J. Design and testing of a crop growth sensor aboard a fixed-wing unmanned aerial vehicle. Comput. Electron. Agric. 2022, 194, 106762. [Google Scholar] [CrossRef] [Scilit]
- Krienke, B.; Ferguson, R.B.; Schlemmer, M.; Holland, K.; Marx, D.B.; Eskridge, K.M. Using an unmanned aerial vehicle to evaluate nitrogen variability and height effect with an active crop canopy sensor. Precis. Agric. 2017, 18, 900–915. [Google Scholar] [CrossRef] [Scilit]
- Li, S.; Ding, X.; Kuang, Q.; Ata-Ul-Karim, S.T.; Cheng, T.; Liu, X.; Tian, Y.; Zhu, Y.; Cao, W.; Cao, Q. Potential of UAV-Based Active Sensing for Monitoring Rice Leaf Nitrogen Status. Front. Plant Sci. 2018, 9, 1834. [Google Scholar] [CrossRef] [Scilit] [PubMed]
- Jiang, J.; Zhang, Z.; Cao, Q.; Liang, Y.; Krienke, B.; Tian, Y.; Zhu, Y.; Cao, W.; Liu, X. Use of an Active Canopy Sensor Mounted on an Unmanned Aerial Vehicle to Monitor the Growth and Nitrogen Status of Winter Wheat. Remote Sens. 2020, 12, 3684. [Google Scholar] [CrossRef] [Scilit]
- Späti, K.; Huber, R.; Finger, R. Benefits of Increasing Information Accuracy in Variable Rate Technologies. Ecol. Econ. 2021, 185, 107047. [Google Scholar] [CrossRef] [Scilit]
- Tsitouras, A.; Noulas, C.; Liakos, V.; Stamatiadis, S.; Tziouvalekas, M.; Qin, R.; Evangelou, E. Variable-Rate Nitrogen Application in Wheat Based on UAV-Derived Fertilizer Maps and Precision Agriculture Technologies. Agronomy 2025, 15, 1714. [Google Scholar] [CrossRef] [Scilit]
- Xu, S.; Xu, X.; Blacker, C.; Gaulton, R.; Zhu, Q.; Yang, M.; Yang, G.; Zhang, J.; Yang, Y.; Yang, M.; et al. Estimation of Leaf Nitrogen Content in Rice Using Vegetation Indices and Feature Variable Optimization with Information Fusion of Multiple-Sensor Images from UAV. Remote Sens. 2023, 15, 854. [Google Scholar] [CrossRef] [Scilit]
- Dong, H.; Dong, J.; Sun, S.; Bai, T.; Zhao, D.; Yin, Y.; Shen, X.; Wang, Y.; Zhang, Z.; Wang, Y. Crop water stress detection based on UAV remote sensing systems. Agric. Water Manag. 2024, 303, 109059. [Google Scholar] [CrossRef] [Scilit]
- Maimaitijiang, M.; Sagan, V.; Sidike, P.; Hartling, S.; Esposito, F.; Fritschi, F.B. Soybean yield prediction from UAV using multimodal data fusion and deep learning. Remote Sens. Environ. 2020, 237, 111599. [Google Scholar] [CrossRef] [Scilit]
- Wang, J.; Lou, Y.; Wang, W.; Liu, S.; Zhang, H.; Hui, X.; Wang, Y.; Yan, H.; Maes, W.H. A robust model for diagnosing water stress of winter wheat by combining UAV multispectral and thermal remote sensing. Agric. Water Manag. 2024, 291, 108616. [Google Scholar] [CrossRef] [Scilit]
- Sahoo, M.M.; Tarshish, R.; Tubul, Y.; Sabag, I.; Gadri, Y.; Morota, G.; Peleg, Z.; Alchanatis, V.; Herrmann, I. Multimodal ensemble of UAV-borne hyperspectral, thermal, and RGB imagery to identify combined nitrogen and water deficiencies in field-grown sesame. ISPRS J. Photogramm. Remote Sens. 2025, 222, 33–53. [Google Scholar] [CrossRef] [Scilit]
- Shendryk, Y.; Sofonia, J.; Garrard, R.; Rist, Y.; Skocaj, D.; Thorburn, P. Fine-scale prediction of biomass and leaf nitrogen content in sugarcane using UAV LiDAR and multispectral imaging. Int. J. Appl. Earth Obs. Geoinf. 2020, 92, 102177. [Google Scholar] [CrossRef] [Scilit]
- Bendig, J.; Yu, K.; Aasen, H.; Bolten, A.; Bennertz, S.; Broscheit, J.; Gnyp, M.L.; Bareth, G. Combining UAV-based plant height from crop surface models, visible, and near infrared vegetation indices for biomass monitoring in barley. Int. J. Appl. Earth Obs. Geoinf. 2015, 39, 79–87. [Google Scholar] [CrossRef] [Scilit]
- Gu, Y.; Wang, Y.; Wu, Y.; Warner, T.A.; Guo, T.; Ai, H.; Zheng, H.; Cheng, T.; Zhu, Y.; Cao, W.; et al. Novel 3D photosynthetic traits derived from the fusion of UAV LiDAR point cloud and multispectral imagery in wheat. Remote Sens. Environ. 2024, 311, 114244. [Google Scholar] [CrossRef] [Scilit]
- Watts, A.C.; Ambrosia, V.G.; Hinkley, E.A. Unmanned Aircraft Systems in Remote Sensing and Scientific Research: Classification and Considerations of Use. Remote Sens. 2012, 4, 1671–1692. [Google Scholar] [CrossRef] [Scilit]
- Ziliani, M.G.; Parkes, S.D.; Hoteit, I.; McCabe, M.F. Intra-Season Crop Height Variability at Commercial Farm Scales Using a Fixed-Wing UAV. Remote Sens. 2018, 10, 2007. [Google Scholar] [CrossRef] [Scilit]
- Roth, L.; Hund, A.; Aasen, H. PhenoFly Planning Tool: Flight planning for high-resolution optical remote sensing with unmanned areal systems. Plant Methods 2018, 14, 116. [Google Scholar] [CrossRef] [Scilit] [PubMed]
- Tu, Y.-H.; Phinn, S.; Johansen, K.; Robson, A.; Wu, D. Optimising drone flight planning for measuring horticultural tree crop structure. ISPRS J. Photogramm. Remote Sens. 2020, 160, 83–96. [Google Scholar] [CrossRef] [Scilit]
- Jiang, R.; Wang, P.; Xu, Y.; Zhou, Z.; Luo, X.; Lan, Y.; Zhao, G.; Sanchez-Azofeifa, A.; Laakso, K. Assessing the Operation Parameters of a Low-altitude UAV for the Collection of NDVI Values Over a Paddy Rice Field. Remote Sens. 2020, 12, 1850. [Google Scholar] [CrossRef] [Scilit]
- Luo, S.; Li, Q.; Du, L.; Wu, Z. Time-space-angle scale effects and incorporation patterns in estimating rice LAI and leaf chlorophyll content by UAV multispectral remote sensing. Comput. Electron. Agric. 2025, 237, 110792. [Google Scholar] [CrossRef] [Scilit]
- Maes, W.H. Practical Guidelines for Performing UAV Mapping Flights with Snapshot Sensors. Remote Sens. 2025, 17, 606. [Google Scholar] [CrossRef] [Scilit]
- Jaud, M.; Le Dantec, N.; Ammann, J.; Grandjean, P.; Constantin, D.; Akhtman, Y.; Barbieux, K.; Allemand, P.; Delacourt, C.; Merminod, B. Direct Georeferencing of a Pushbroom, Lightweight Hyperspectral System for Mini-UAV Applications. Remote Sens. 2018, 10, 204. [Google Scholar] [CrossRef] [Scilit]
- Song, L.; Li, H.; Chen, T.; Chen, J.; Liu, S.; Fan, J.; Wang, Q. An Integrated Solution of UAV Push-Broom Hyperspectral System Based on Geometric Correction with MSI and Radiation Correction Considering Outdoor Illumination Variation. Remote Sens. 2022, 14, 6267. [Google Scholar] [CrossRef] [Scilit]
- Gautam, D.; Lucieer, A.; Watson, C.; McCoull, C. Lever-arm and boresight correction, and field of view determination of a spectroradiometer mounted on an unmanned aircraft system. ISPRS J. Photogramm. Remote Sens. 2019, 155, 25–36. [Google Scholar] [CrossRef] [Scilit]
- Feng, L.; Wu, W.; Wang, J.; Zhang, C.; Zhao, Y.; Zhu, S.; He, Y. Wind Field Distribution of Multi-rotor UAV and Its Influence on Spectral Information Acquisition of Rice Canopies. Remote Sens. 2019, 11, 602. [Google Scholar] [CrossRef] [Scilit]
- Suomalainen, J.; Oliveira, R.A.; Hakala, T.; Koivumäki, N.; Markelin, L.; Näsi, R.; Honkavaara, E. Direct reflectance transformation methodology for drone-based hyperspectral imaging. Remote Sens. Environ. 2021, 266, 112691. [Google Scholar] [CrossRef] [Scilit]
- Schläpfer, D.; Popp, C.; Richter, R. Drone data atmospheric correction concept for multi- and hyperspectral imagery—The droacor model. Int. Arch. Photogramm. Remote Sens. Spat. Inf. Sci. 2020, XLIII-B3-2020, 473–478. [Google Scholar] [CrossRef] [Scilit]
- Kelcey, J.; Lucieer, A. Sensor Correction of a 6-Band Multispectral Imaging Sensor for UAV Remote Sensing. Remote Sens. 2012, 4, 1462–1493. [Google Scholar] [CrossRef] [Scilit]
- Hruska, R.; Mitchell, J.; Anderson, M.; Glenn, N.F. Radiometric and Geometric Analysis of Hyperspectral Imagery Acquired from an Unmanned Aerial Vehicle. Remote Sens. 2012, 4, 2736–2752. [Google Scholar] [CrossRef] [Scilit]
- Jakob, S.; Zimmermann, R.; Gloaguen, R. The Need for Accurate Geometric and Radiometric Corrections of Drone-Borne Hyperspectral Data for Mineral Exploration: MEPHySTo—A Toolbox for Pre-Processing Drone-Borne Hyperspectral Data. Remote Sens. 2017, 9, 88. [Google Scholar] [CrossRef] [Scilit]
- Jiang, J.; Zheng, H.; Ji, X.; Cheng, T.; Tian, Y.; Zhu, Y.; Cao, W.; Ehsani, R.; Yao, X. Analysis and Evaluation of the Image Preprocessing Process of a Six-Band Multispectral Camera Mounted on an Unmanned Aerial Vehicle for Winter Wheat Monitoring. Sensors 2019, 19, 747. [Google Scholar] [CrossRef] [Scilit] [PubMed]
- Honkavaara, E.; Rosnell, T.; Oliveira, R.; Tommaselli, A. Band registration of tuneable frame format hyperspectral UAV imagers in complex scenes. ISPRS J. Photogramm. Remote Sens. 2017, 134, 96–109. [Google Scholar] [CrossRef] [Scilit]
- Mardanisamani, S.; Eramian, M. Segmentation of vegetation and microplots in aerial agriculture images: A survey. Plant Phenome J. 2022, 5, e20042. [Google Scholar] [CrossRef] [Scilit]
- Garzonio, R.; Di Mauro, B.; Colombo, R.; Cogliati, S. Surface Reflectance and Sun-Induced Fluorescence Spectroscopy Measurements Using a Small Hyperspectral UAS. Remote Sens. 2017, 9, 472. [Google Scholar] [CrossRef] [Scilit]
- Köppl, C.J.; Malureanu, R.; Dam-Hansen, C.; Wang, S.; Jin, H.; Barchiesi, S.; Serrano Sandí, J.M.; Muñoz-Carpena, R.; Johnson, M.; Durán-Quesada, A.M.; et al. Hyperspectral reflectance measurements from UAS under intermittent clouds: Correcting irradiance measurements for sensor tilt. Remote Sens. Environ. 2021, 267, 112719. [Google Scholar] [CrossRef] [Scilit]
- Han, X.; Wei, Z.; Chen, H.; Zhang, B.; Li, Y.; Du, T. Inversion of Winter Wheat Growth Parameters and Yield Under Different Water Treatments Based on UAV Multispectral Remote Sensing. Front. Plant Sci. 2021, 12, 609876. [Google Scholar] [CrossRef] [Scilit] [PubMed]
- Kanning, M.; Kühling, I.; Trautz, D.; Jarmer, T. High-Resolution UAV-Based Hyperspectral Imagery for LAI and Chlorophyll Estimations from Wheat for Yield Prediction. Remote Sens. 2018, 10, 2000. [Google Scholar] [CrossRef] [Scilit]
- Yuan, H.; Yang, G.; Li, C.; Wang, Y.; Liu, J.; Yu, H.; Feng, H.; Xu, B.; Zhao, X.; Yang, X. Retrieving Soybean Leaf Area Index from Unmanned Aerial Vehicle Hyperspectral Remote Sensing: Analysis of RF, ANN, and SVM Regression Models. Remote Sens. 2017, 9, 309. [Google Scholar] [CrossRef] [Scilit]
- Lee, H.; Wang, J.; Leblon, B. Using Linear Regression, Random Forests, and Support Vector Machine with Unmanned Aerial Vehicle Multispectral Images to Predict Canopy Nitrogen Weight in Corn. Remote Sens. 2020, 12, 2071. [Google Scholar] [CrossRef] [Scilit]
- Zhang, J.; Cheng, T.; Guo, W.; Xu, X.; Qiao, H.; Xie, Y.; Ma, X. Leaf area index estimation model for UAV image hyperspectral data based on wavelength variable selection and machine learning methods. Plant Methods 2021, 17, 49. [Google Scholar] [CrossRef] [Scilit] [PubMed]
- Zhang, X.; Zhang, K.; Sun, Y.; Zhao, Y.; Zhuang, H.; Ban, W.; Chen, Y.; Fu, E.; Chen, S.; Liu, J.; et al. Combining Spectral and Texture Features of UAS-Based Multispectral Images for Maize Leaf Area Index Estimation. Remote Sens. 2022, 14, 331. [Google Scholar] [CrossRef] [Scilit]
- Liu, S.; Jin, X.; Nie, C.; Wang, S.; Yu, X.; Cheng, M.; Shao, M.; Wang, Z.; Tuohuti, N.; Bai, Y.; et al. Estimating leaf area index using unmanned aerial vehicle data: Shallow vs. deep machine learning algorithms. Plant Physiol. 2021, 187, 1551–1576. [Google Scholar] [CrossRef] [Scilit] [PubMed]
- Qiao, L.; Zhao, R.; Tang, W.; An, L.; Sun, H.; Li, M.; Wang, N.; Liu, Y.; Liu, G. Estimating maize LAI by exploring deep features of vegetation index map from UAV multispectral images. Field Crop. Res. 2022, 289, 108739. [Google Scholar] [CrossRef] [Scilit]
- Yu, D.; Zha, Y.; Sun, Z.; Li, J.; Jin, X.; Zhu, W.; Bian, J.; Ma, L.; Zeng, Y.; Su, Z. Deep convolutional neural networks for estimating maize above-ground biomass using multi-source UAV images: A comparison with traditional machine learning algorithms. Precis. Agric. 2023, 24, 92–113. [Google Scholar] [CrossRef] [Scilit]
- Li, H.; Yue, L.; Luo, S. Estimating the full-period rice leaf area index using CNN-LSTM-Attention and multispectral images from unmanned aerial vehicles. Front. Plant Sci. 2025, 16, 1636967. [Google Scholar] [CrossRef] [Scilit] [PubMed]
- Habibi, L.N.; Matsui, T.; Tanaka, T.S.T. Critical evaluation of the effects of a cross-validation strategy and machine learning optimization on the prediction accuracy and transferability of a soybean yield prediction model using UAV-based remote sensing. J. Agric. Food Res. 2024, 16, 101096. [Google Scholar] [CrossRef] [Scilit]
- Han, L.; Yang, G.; Dai, H.; Xu, B.; Yang, H.; Feng, H.; Li, Z.; Yang, X. Modeling maize above-ground biomass based on machine learning approaches using UAV remote-sensing data. Plant Methods 2019, 15, 10. [Google Scholar] [CrossRef] [Scilit] [PubMed]
- Mulla, D.J. Twenty five years of remote sensing in precision agriculture: Key advances and remaining knowledge gaps. Biosyst. Eng. 2013, 114, 358–371. [Google Scholar] [CrossRef] [Scilit]
- Arsenoaia, V.N.; Topa, D.C.; Ratu, R.N.; Tenu, I. From Sensing to Intervention: A Critical Review of Agricultural Drones for Precision Agriculture, Data-Driven Decision Making, and Sustainable Intensification. Agronomy 2026, 16, 564. [Google Scholar] [CrossRef] [Scilit]
- Chang, C.Y.; Zhou, R.; Kira, O.; Marri, S.; Skovira, J.; Gu, L.; Sun, Y. An Unmanned Aerial System (UAS) for concurrent measurements of solar-induced chlorophyll fluorescence and hyperspectral reflectance toward improving crop monitoring. Agric. For. Meteorol. 2020, 294, 108145, Corrigendum in Agric. For. Meteorol. 2021, 300, 108352. [Google Scholar] [CrossRef] [Scilit]
- Argento, F.; Anken, T.; Abt, F.; Vogelsanger, E.; Walter, A.; Liebisch, F. Site-specific nitrogen management in winter wheat supported by low-altitude remote sensing and soil data. Precis. Agric. 2021, 22, 364–386. [Google Scholar] [CrossRef] [Scilit]
- Horstrand, P.; Guerra, R.; Rodriguez, A.; Diaz, M.; Lopez, S.; Lopez, J.F. A UAV Platform Based on a Hyperspectral Sensor for Image Capturing and On-Board Processing. IEEE Access 2019, 7, 66919–66938. [Google Scholar] [CrossRef] [Scilit]
- Grant, L.; Daughtry, C.S.T.; Vanderbilt, V.C. Polarized and specular reflectance variation with leaf surface features. Physiol. Plant. 1993, 88, 1–9. [Google Scholar] [CrossRef] [Scilit]
- Krafft, D.; Scarboro, C.G.; Hsieh, W.; Doherty, C.; Balint-Kurti, P.; Kudenov, M. Mitigating Illumination-, Leaf-, and View-Angle Dependencies in Hyperspectral Imaging Using Polarimetry. Plant Phenomics 2024, 6, 0157. [Google Scholar] [CrossRef] [Scilit] [PubMed]
- Larsen, J.; Dunne, J.; Austin, R.; Newman, C.; Kudenov, M. Drone-based polarization imaging system for leaf spot severity determination in peanut plants. Plant Phenome J. 2025, 8, e270018. [Google Scholar] [CrossRef] [Scilit]
- Brimrose Corporation. Breakthrough Dual Purpose Brimrose Instrument Now Commercially Available. Available online: https://www.brimrose.com/press-center/2025/09/26/dual-purpose-brimrose-phsi-commercially (accessed on 27 October 2026).
- Xu, C.; Xiang, S.; Wang, N.; Yu, F.; Guo, Z. Remote Sensing of Rice Canopy Nitrogen Content Based on Unmanned Aerial Vehicle Multi-Angle Polarized Hyperspectral Data. Remote Sens. 2026, 18, 876. [Google Scholar] [CrossRef] [Scilit]
- Yao, C.; Lu, S.; Sun, Z. Estimation of leaf chlorophyll content with polarization measurements: Degree of linear polarization. J. Quant. Spectrosc. Radiat. Transf. 2020, 242, 106787. [Google Scholar] [CrossRef] [Scilit]
- Zeng, C.; King, D.J.; Richardson, M.; Shan, B. Fusion of Multispectral Imagery and Spectrometer Data in UAV Remote Sensing. Remote Sens. 2017, 9, 696. [Google Scholar] [CrossRef] [Scilit]
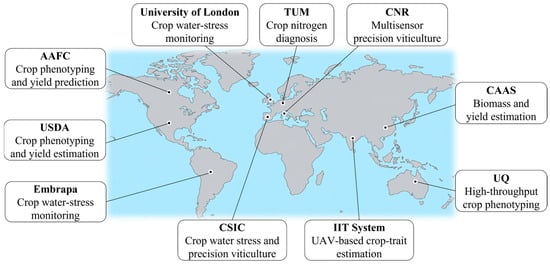
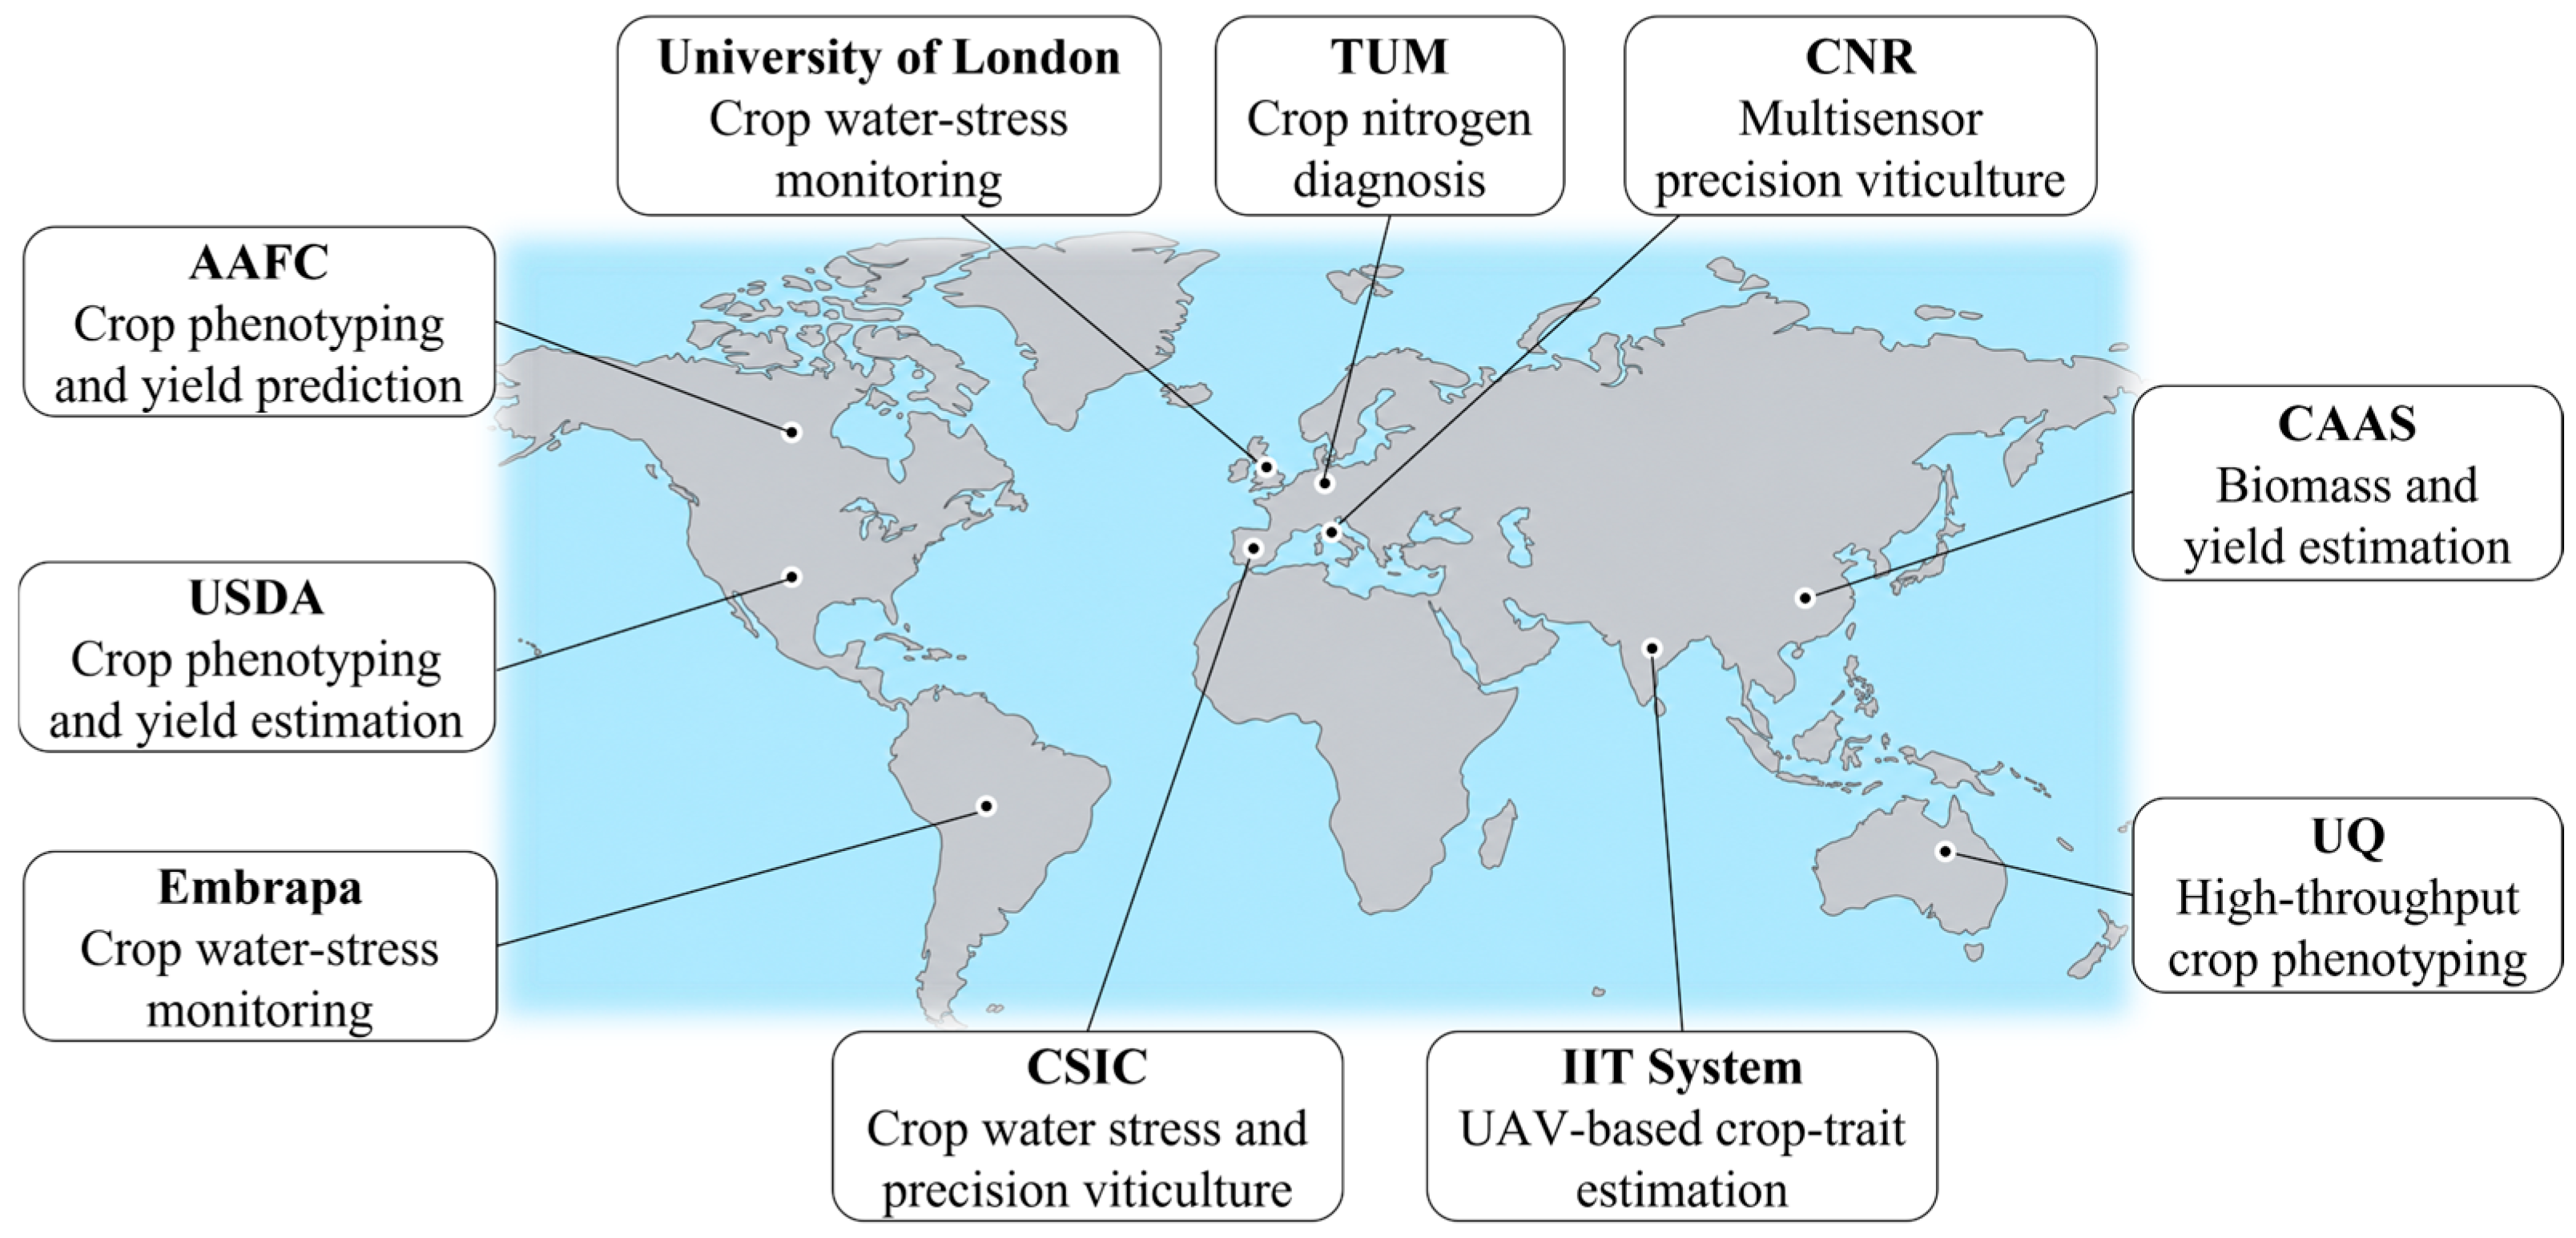
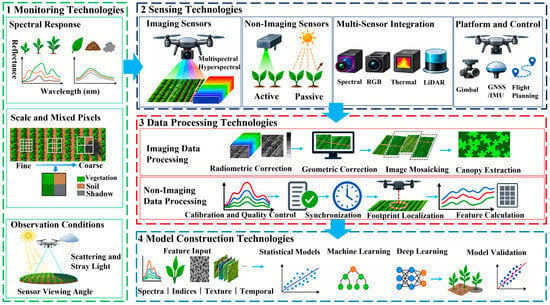
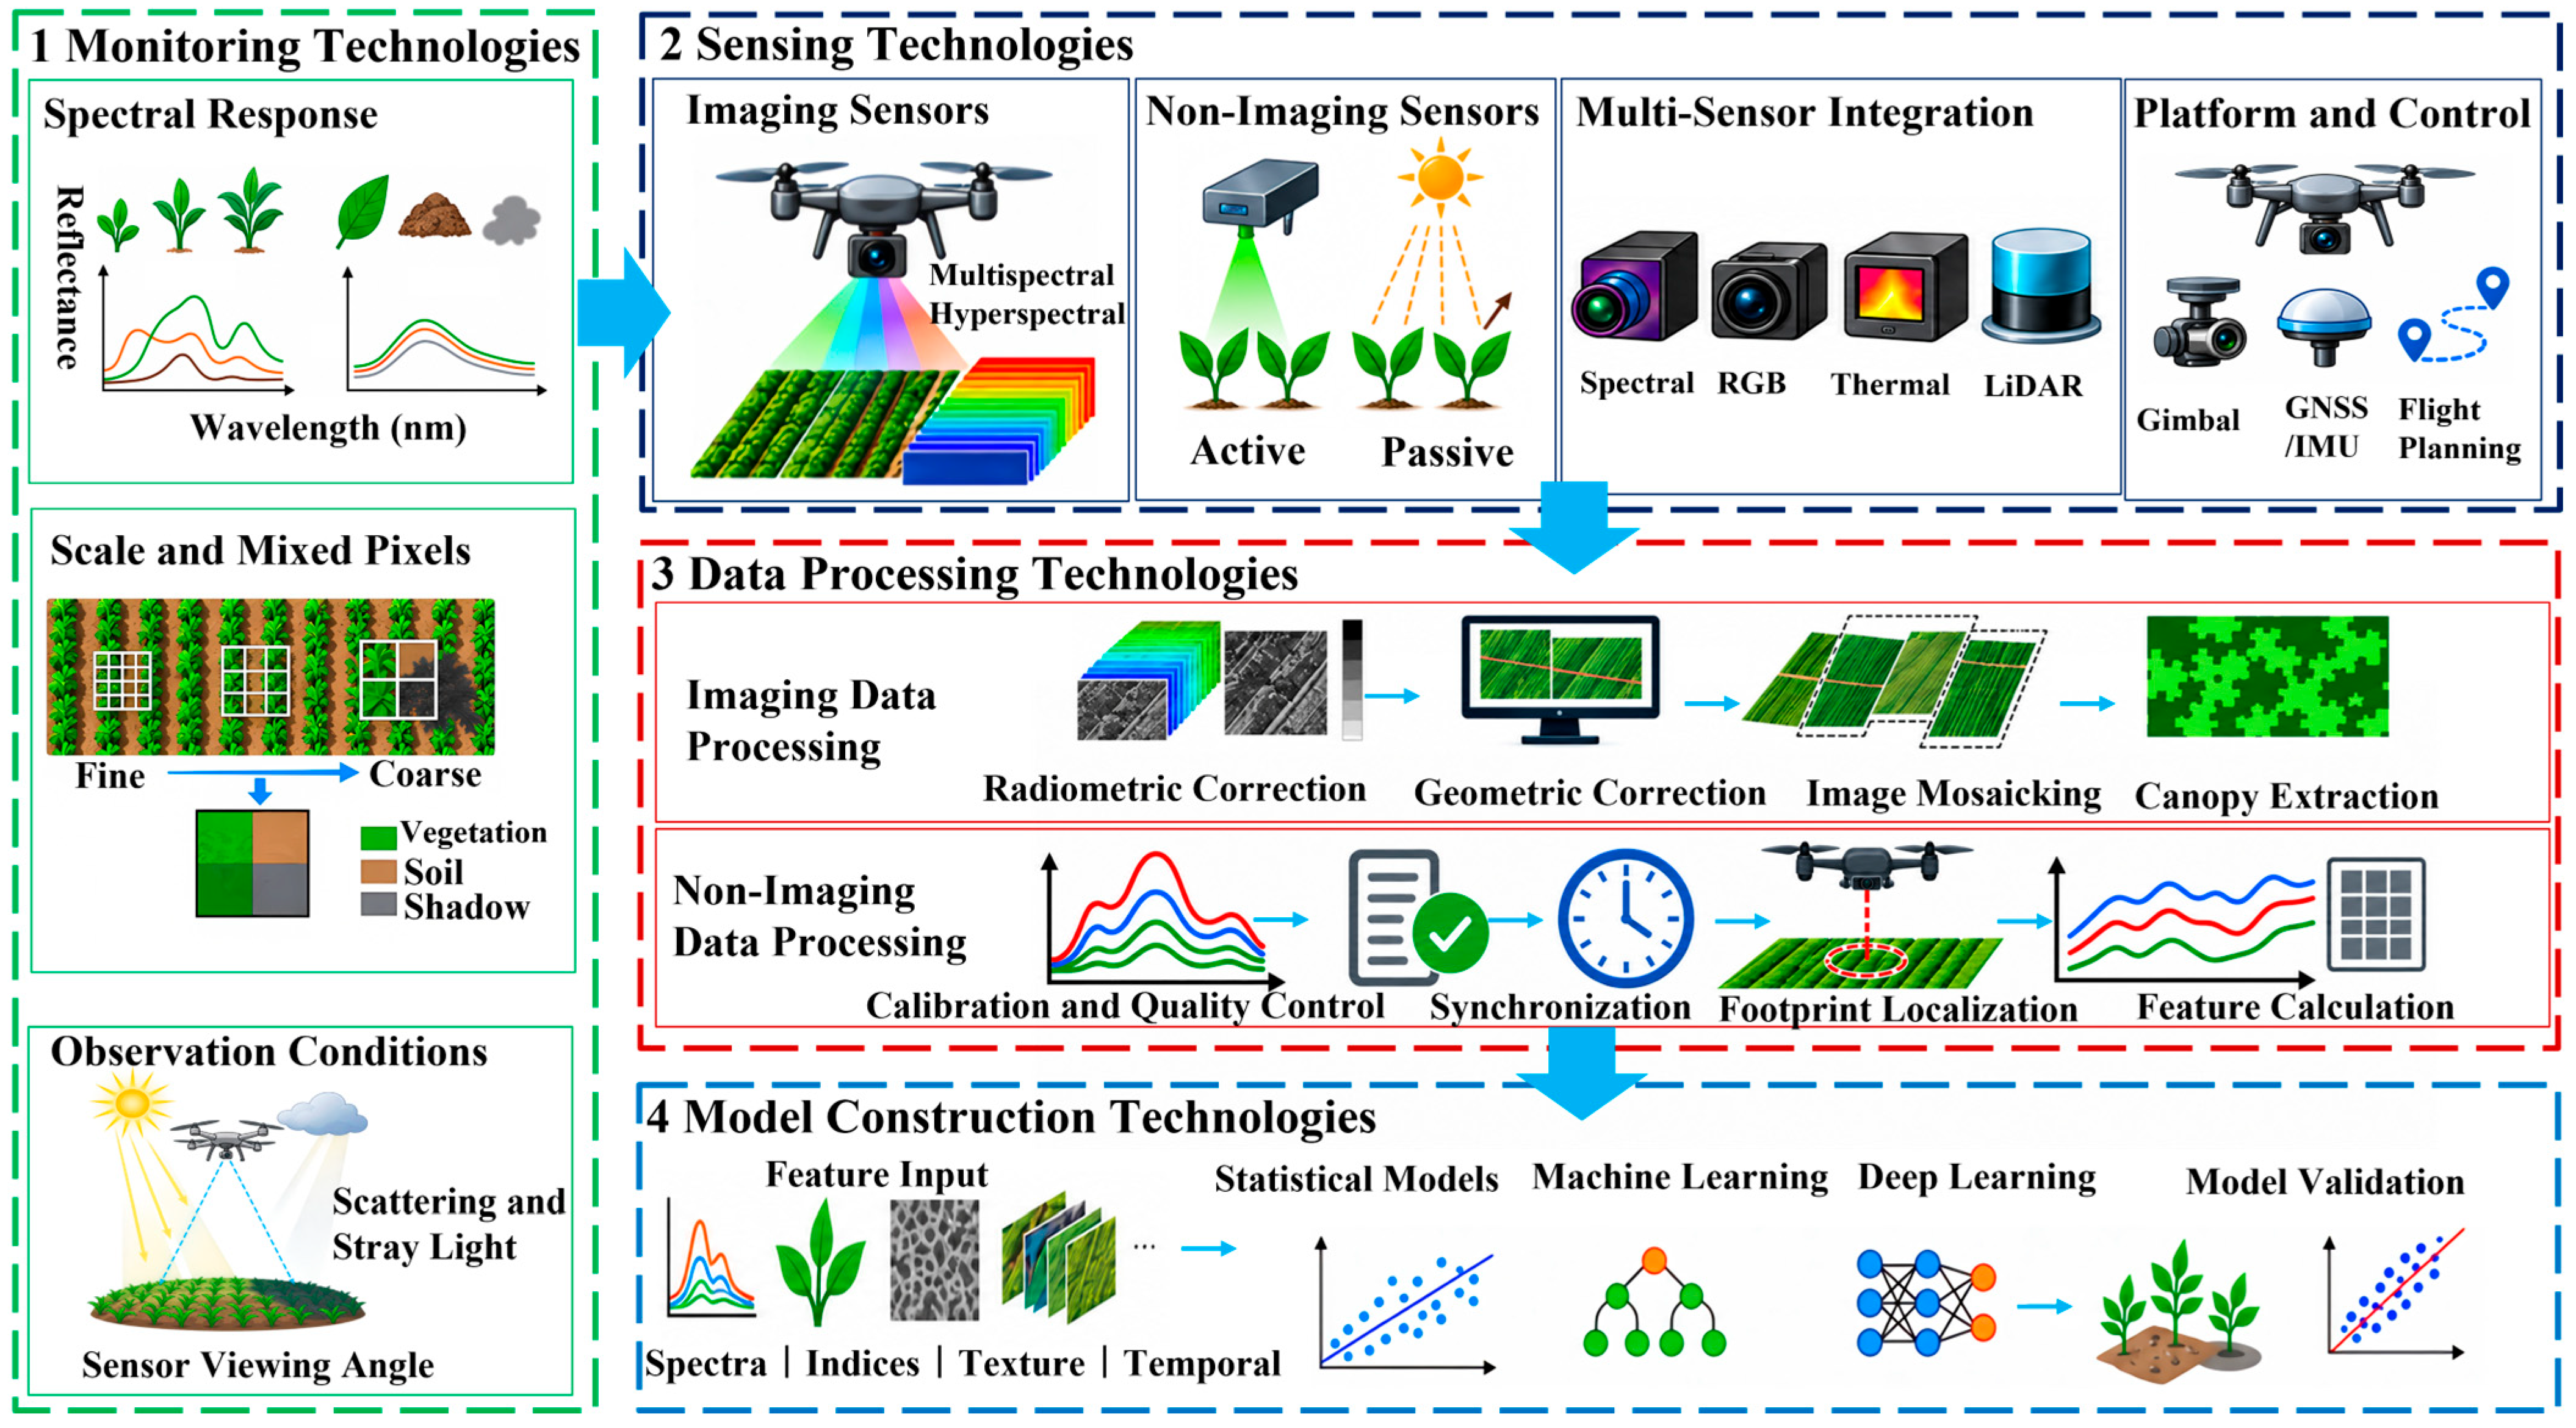
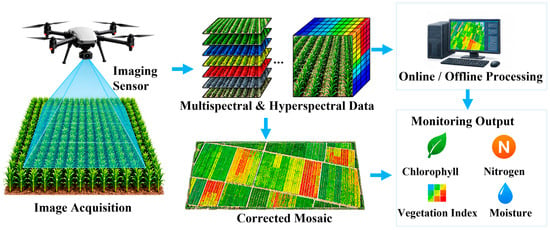
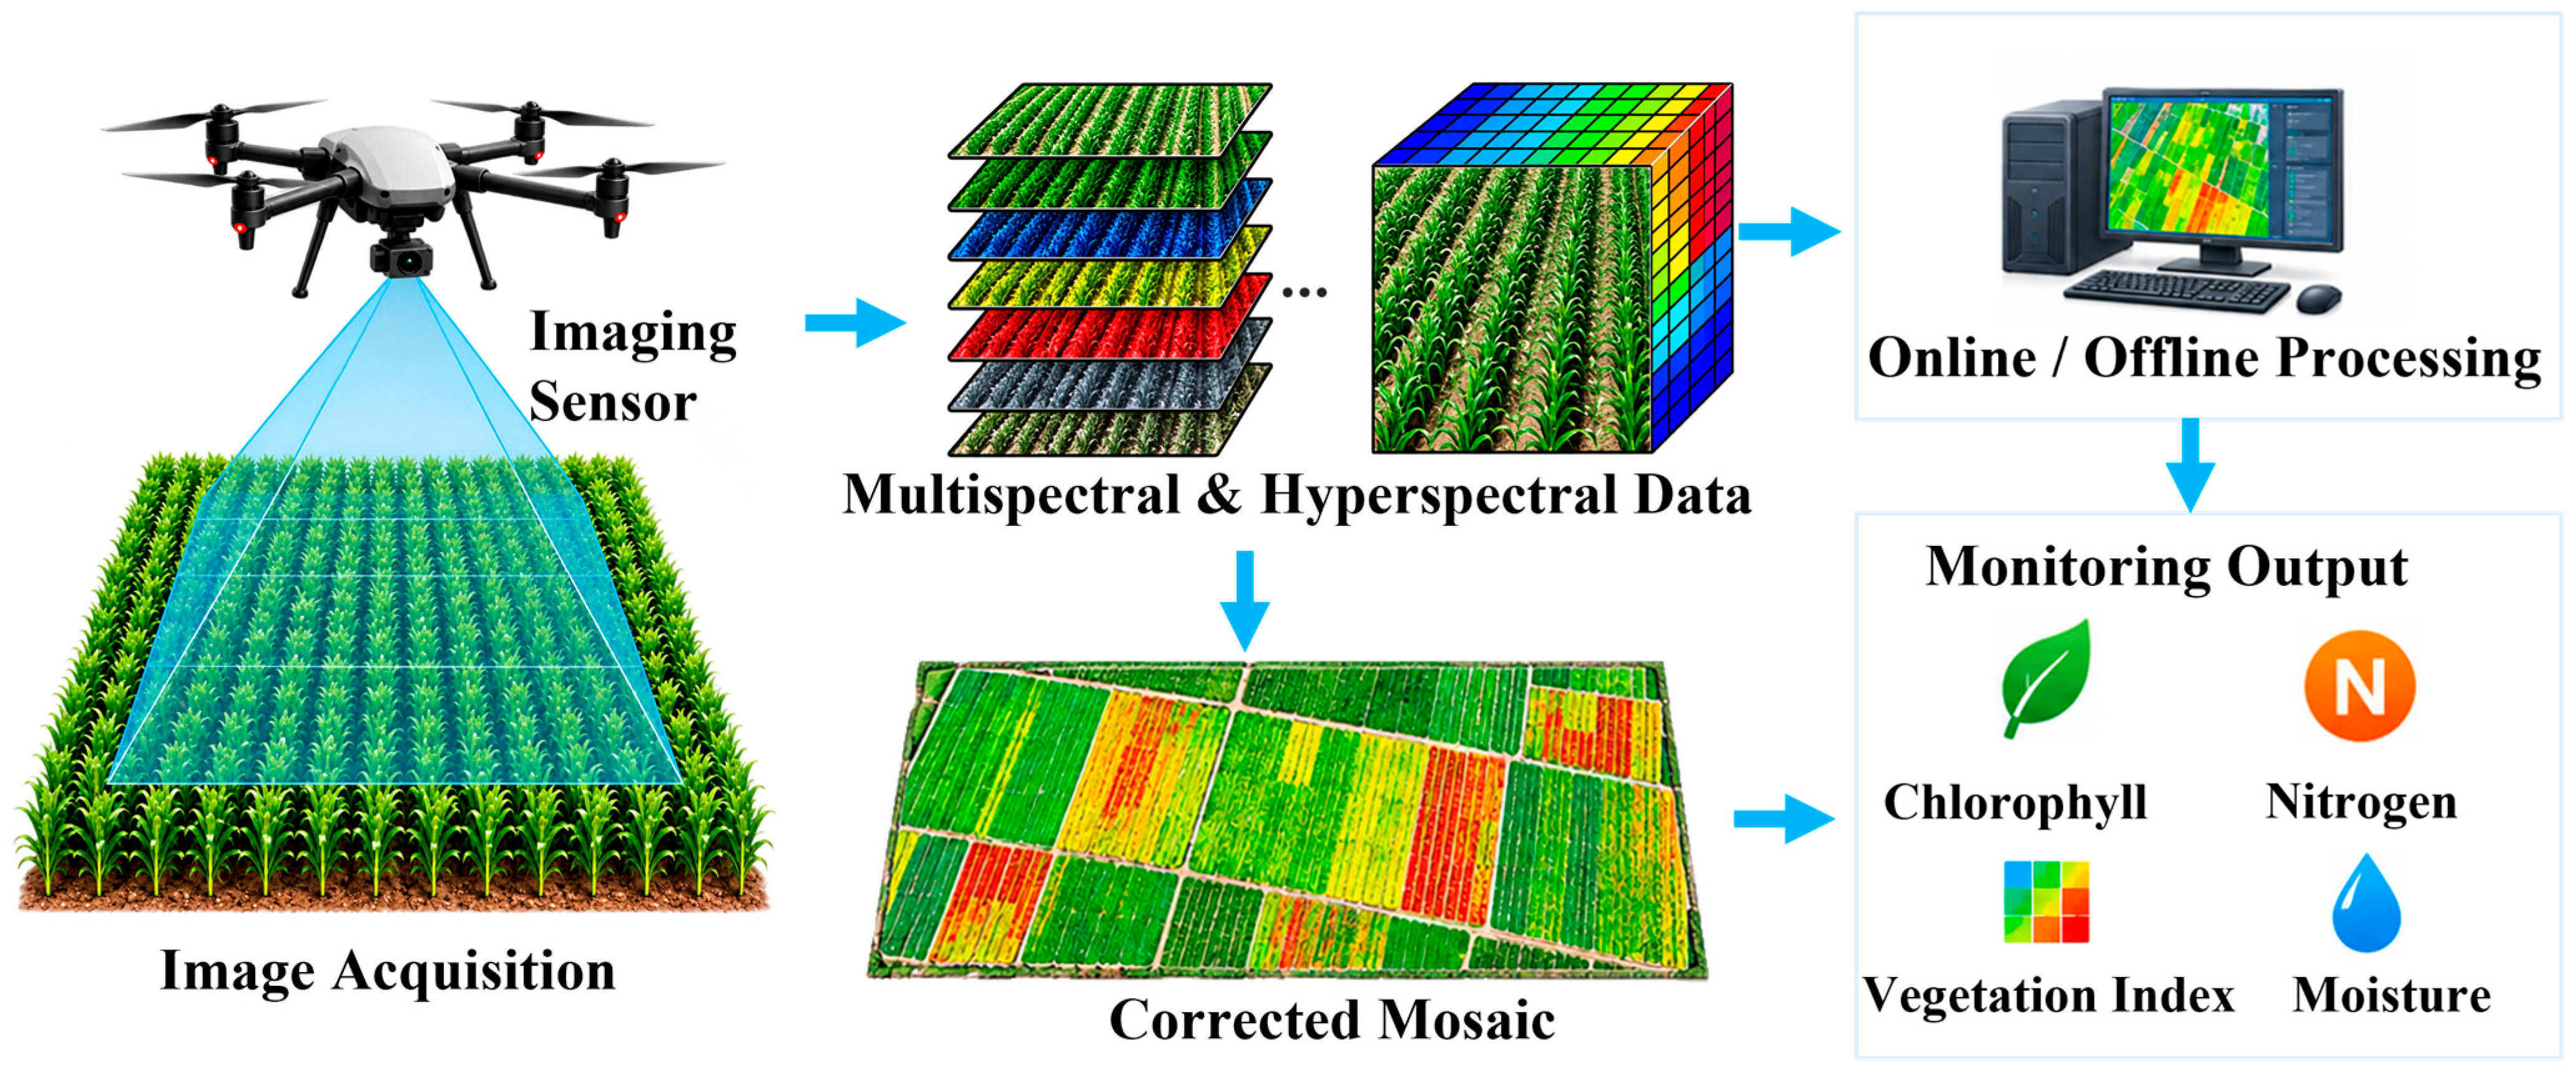
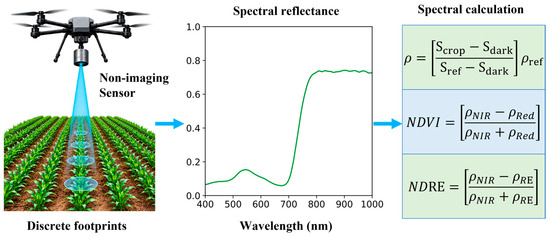
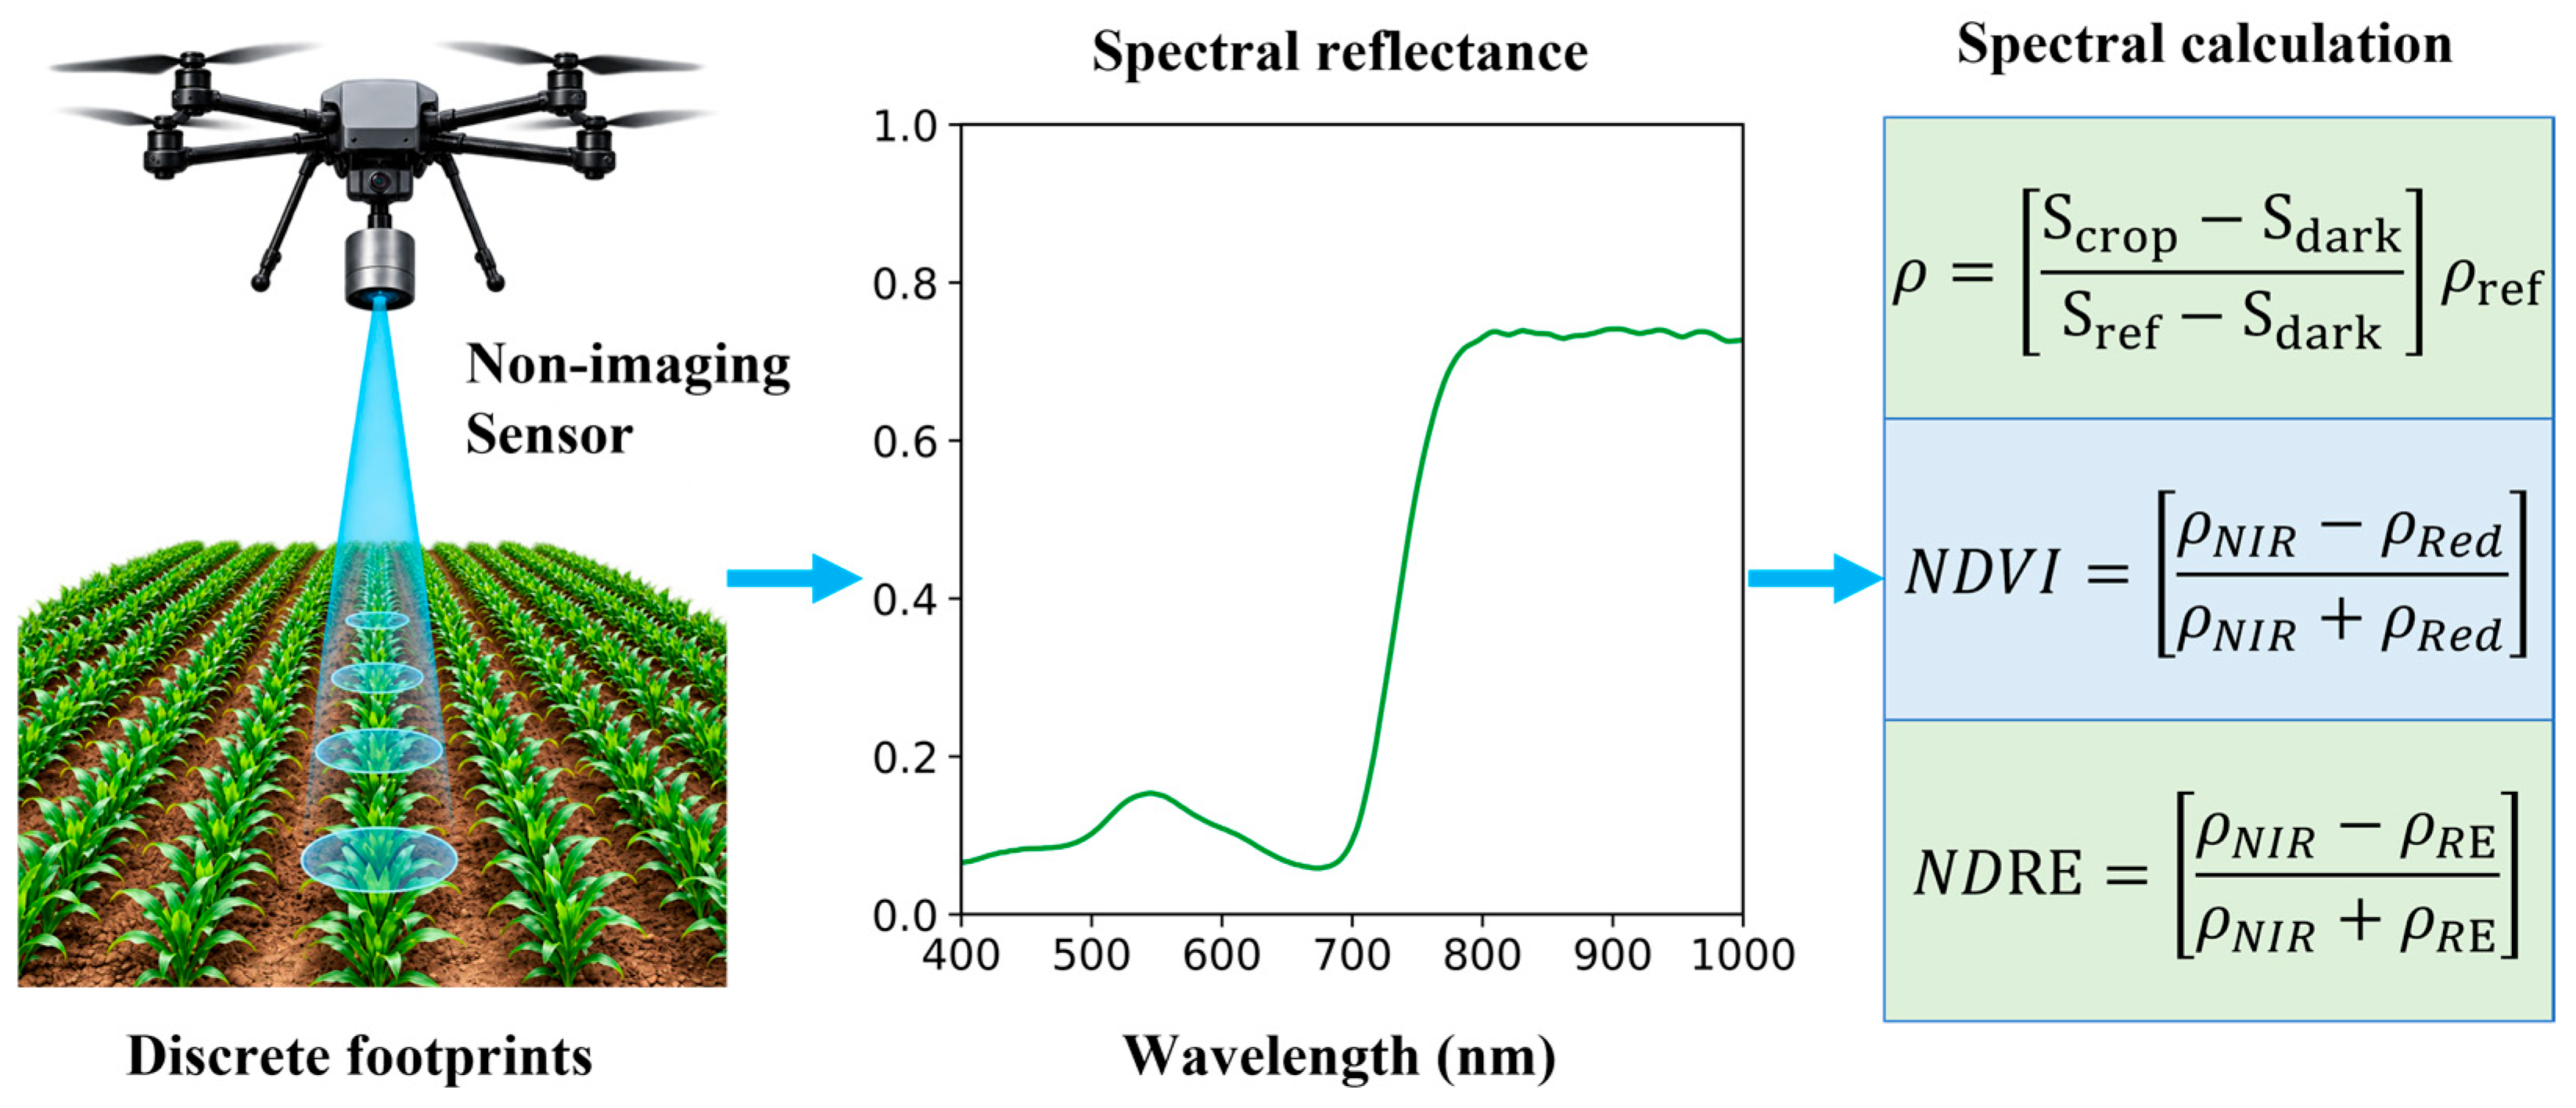
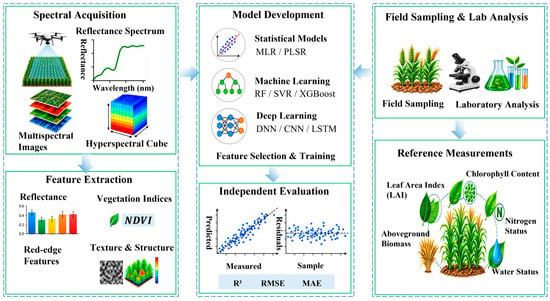
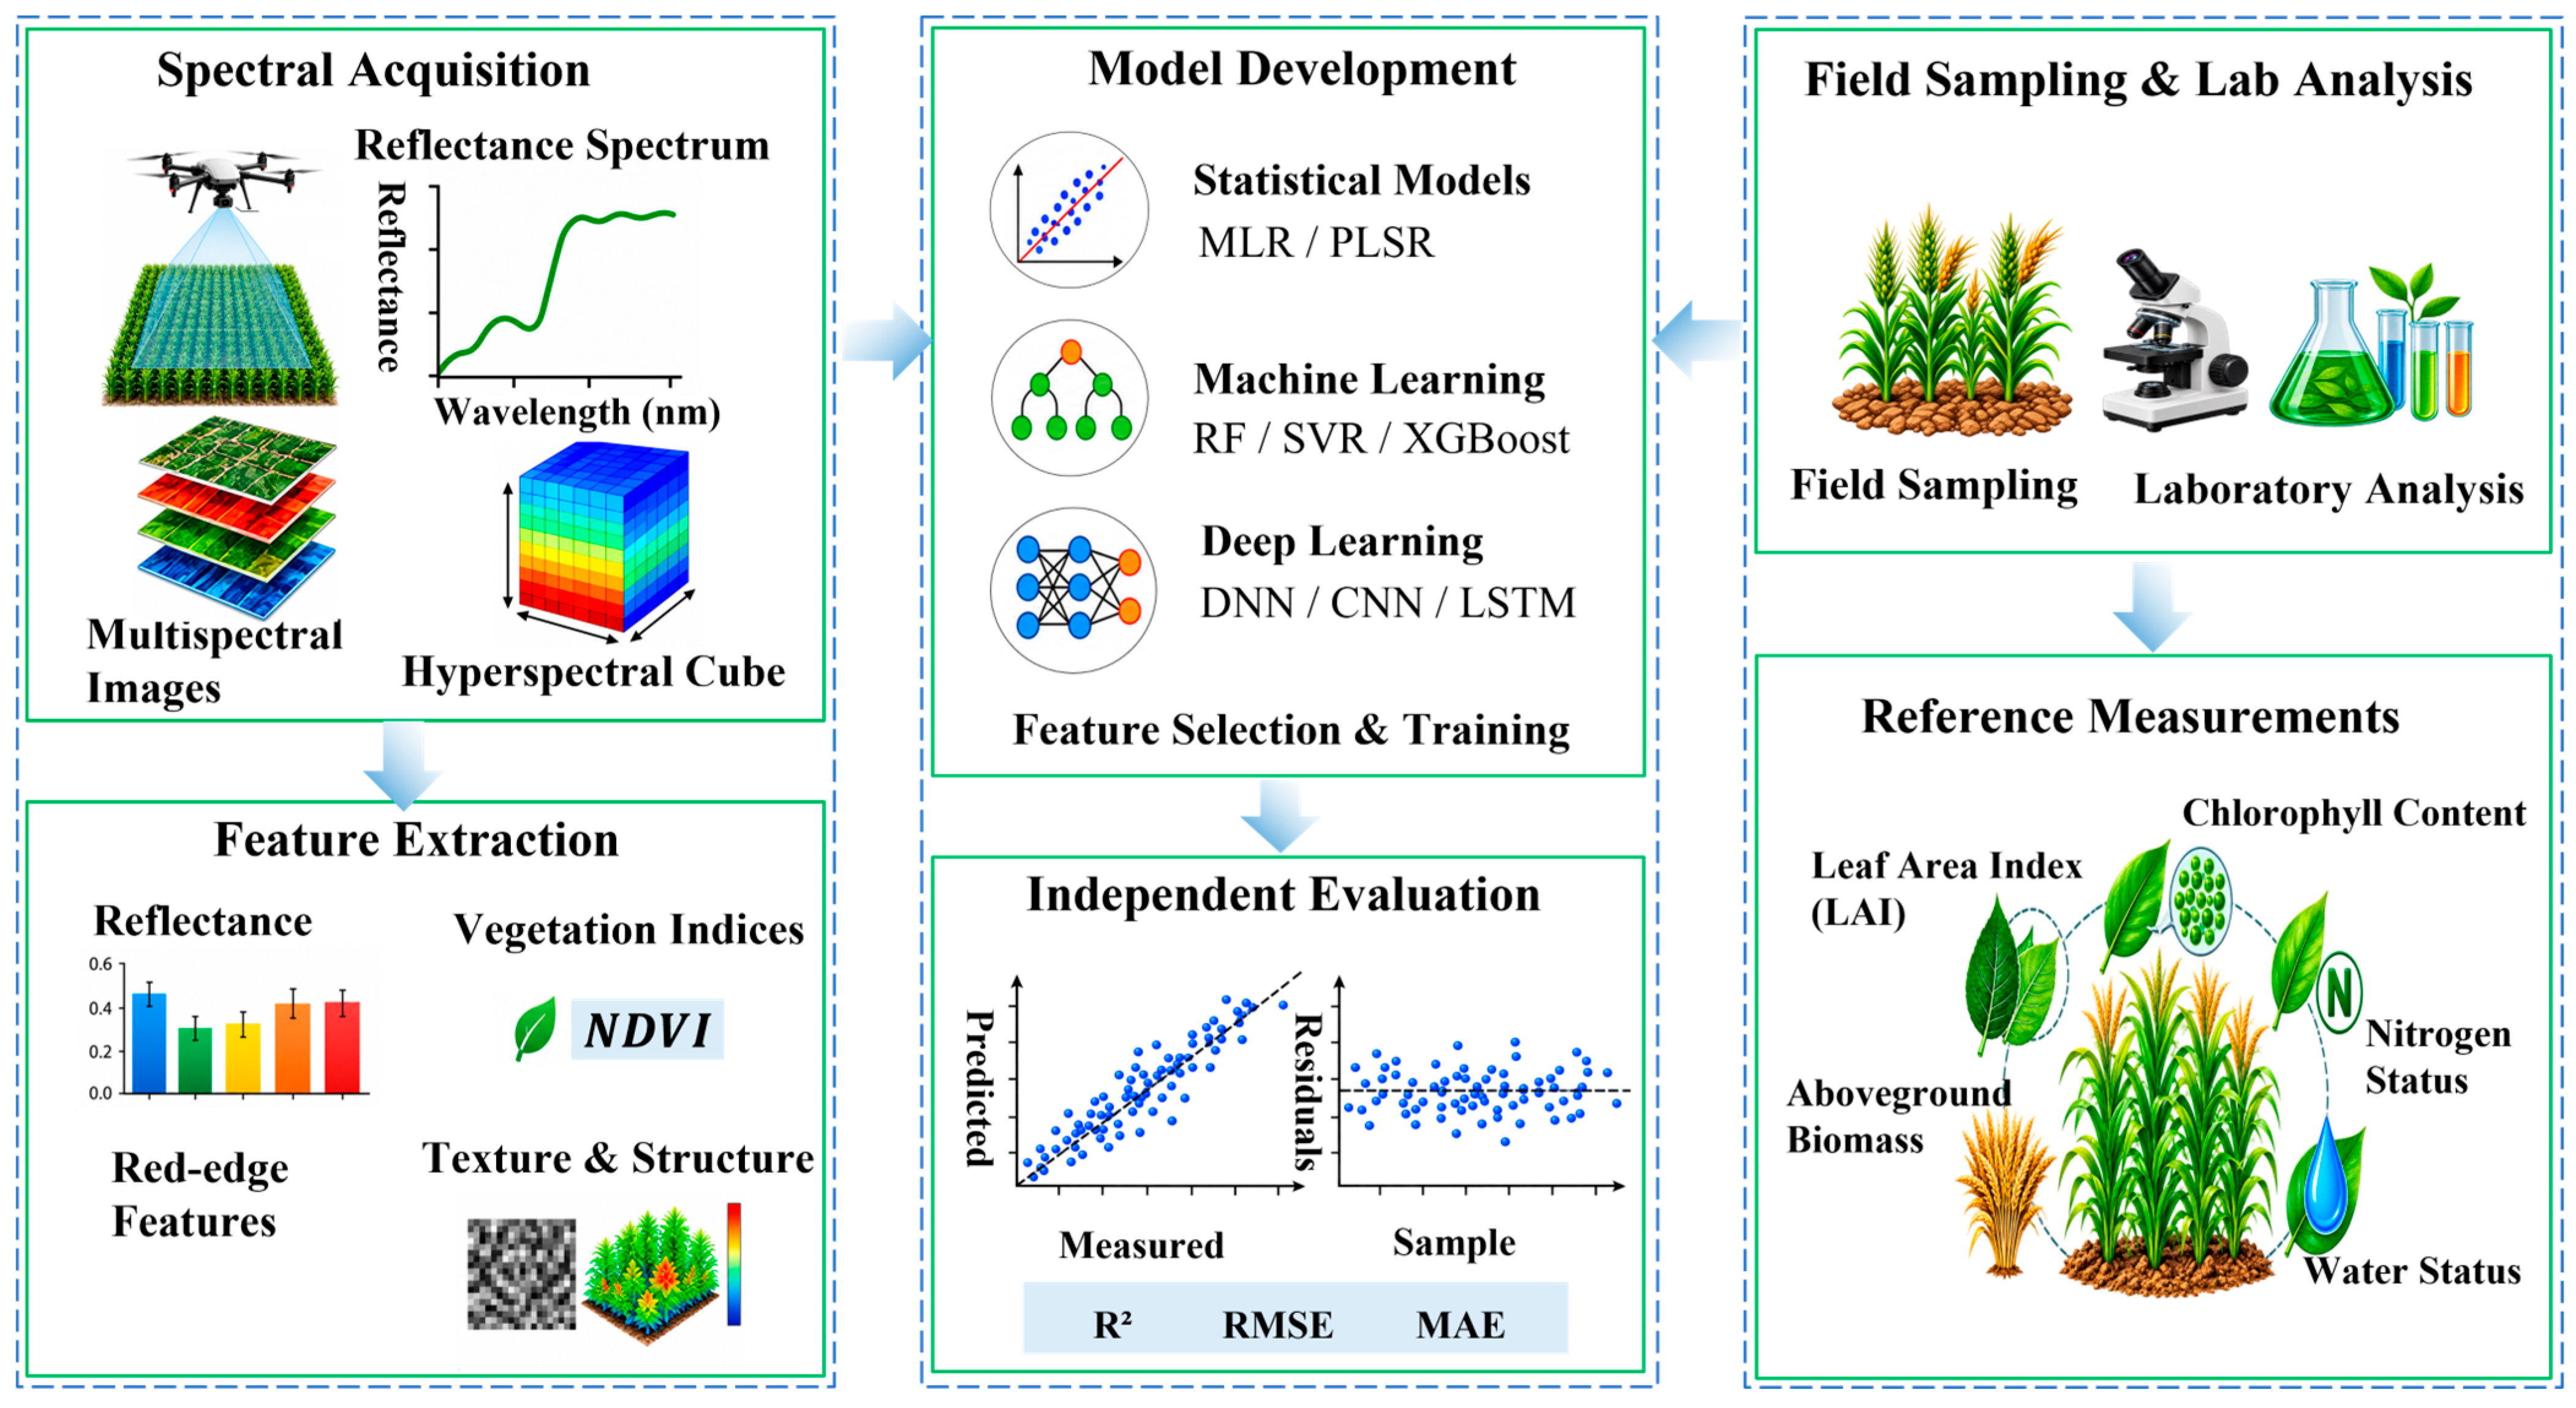




Disclaimer/Publisher’s Note: The statements, opinions and data contained in all publications are solely those of the individual author(s) and contributor(s) and not of MDPI and/or the editor(s). MDPI and/or the editor(s) disclaim responsibility for any injury to people or property resulting from any ideas, methods, instructions or products referred to in the content. |
© 2026 by the authors. Licensee MDPI, Basel, Switzerland. This article is an open access article distributed under the terms and conditions of the Creative Commons Attribution (CC BY) license.