


Abstract
Heavy metal pollution in farmland soils threatens food security and human health, particularly in industrially developed regions. This study investigates the sources and health risks of heavy metals in farmland soils of Liaoning Province by integrating receptor models and machine learning. We collected 168 surface soil and measured Cd, Pb, Zn, Cu, Ni, As, Cr, and Co. Source apportionment used APCS-MLR and EF-PMF models. A random forest (RF) model with eight environmental covariates (road network, annual precipitation, soil clay content, LUCC, DEM, vegetation cover, GDP, and population) predicted spatial distribution. Health risks were assessed using the US EPA model and Monte Carlo simulation. The results showed that Cd and Pb were significantly enriched, with enrichment factors of 2.51 and 4.50 indicating substantial anthropogenic input. Spatially, higher concentrations occurred in western and southern areas near coal mines and industrial activities. EF-PMF identified industrial activities (66.3%), atmospheric deposition (17.3%), agricultural activities (13.5%), and traffic emissions (2.9%). RF showed the highest R2 for Cr, Pb, and As (R2 = 0.535, 0.484, and 0.474) and revealed that industrial and mining activities were the dominant drivers of spatial heterogeneity. Health risk assessment indicated that children faced higher risks than adults, and Cr and Ni were identified as the elements posing the greatest health risks. Monte Carlo simulation confirmed that Cr and Ni are priority pollutants requiring control. The EF-PMF–APCS-MLR, RF, and Monte Carlo framework improves source apportionment and spatial characterization, supporting targeted heavy metal control in industrial agricultural regions.
1. Introduction
In China, pollution problems caused by urbanization and industrialization have become increasingly serious [1,2,3]. In particular, heavy metal contamination is a critical global concern due to the elements’ persistence, ubiquity, and toxicity [4,5,6,7,8]. As the foundation of agricultural security, soil quality is directly linked to ecosystem stability and public health [9,10,11,12,13]. In particular, heavy metals in soil seriously threaten soil quality and ecosystem health and accumulate further through the food chain, thereby threatening human health [4,12,14,15,16]. In addition, soil heavy metal ions enter the bodies of humans and animals through inhalation, skin absorption, or ingestion, posing serious threats to both animal and human health [17,18,19,20]. Soil heavy metals pose different health risks to children and adults, with children suffering greater adverse effects [13,21,22,23]. These effects include Cd-induced renal tubular dysfunction and osteomalacia, Pb-associated neurodevelopmental deficits and IQ loss in children, arsenic-induced skin lesions and skin/lung/bladder cancer, and Cr(VI)/Ni-related respiratory carcinogenesis; children are at higher risk from Pb and As because of greater soil ingestion and the sensitivity of the developing nervous system. To quantify these threats, the US EPA (1997) developed a framework for assessing non-carcinogenic and carcinogenic risks across exposure pathways [24]. Therefore, assessing the extent of heavy metal pollution in soil and its source contributions is an important issue for maintaining soil safety.
Heavy metals in farmland soil generally originate from human activities and lithogenic sources [25,26]. The anthropogenic input is attributed to industrial production, urban domestic sewage, transportation, agricultural production, coal combustion, and atmospheric deposition [16,27,28,29,30]. Surface soil heavy metal concentrations exhibit pronounced spatial variability, largely dictated by the complex interplay of localized anthropogenic disturbances [31,32]. In particular, the farmland environment around cities is affected by various factors such as agriculture, industry, and transportation, making the soil sources of farmland around more complex cities [33]. To disentangle these complex sources, researchers employ geostatistics, multivariate statistics (e.g., PCA, cluster analysis), isotopic tracing, and receptor models [33,34,35,36,37]. Among the most widely used receptor models, positive matrix factorization models (PMF) [35], UNMIX models, and absolute principal component fractional multiple linear regression (APCS-MLR) [36] have great potential to produce consistent results in source assignment.
As an important part of the northeast grain base, Liaoning Province’s long history of industrial and agricultural development has led to soil heavy metal pollution. Up to now, research on soil heavy metals in Liaoning Province has mainly been concentrated in areas with severe pollution such as industrial zones [37]. For example, Li et al. found that the average values of Pb, Cu, Cd, and As were as high as 5–13 times the background values [38]. Yang et al. found children faced higher health risks than adults in the Xihe River Basin in Shenyang [39]. To sum up, Liaoning studies focused on local hotspots— mining, industrial, cities, river basins, and river basin areas—dominated by one or few nearby sources. These findings cannot be extrapolated to farmland, which receives metals via regional pathways (atmospheric deposition, irrigation, fertilizers, and pesticides) superimposing industrial, agricultural, and traffic inputs.
However, three critical gaps remain. First, province-wide, field-scale source contributions are unknown because most existing studies are limited to local hotspots and cannot represent regional farmland pathways. Second, industrial versus agricultural inputs have not been quantitatively separated. Third, health risks are rarely expressed as probabilistic food chain risks, especially for children. In addition, most source-apportionment studies rely on a single receptor model, which limits cross-validation and may introduce model-specific uncertainty.
To address these gaps, this study (1) determines the concentration and spatial distribution of eight heavy metals (Cd, Pb, Zn, Cu, Ni, As, Cr, and Co) in farmland soil across Liaoning Province; (2) identifies and quantifies the sources of these metals and their contributions using EF-PMF and APCS-MLR in parallel for cross-validation; (3) predicts the spatial distribution of eight heavy metals using a random forest model with environmental covariates, thereby extending the assessment beyond the sampled locations; and (4) analyzes the health risks of children and adult men and women under different exposure pathways in farmland soil using the US EPA model and Monte Carlo simulation. The methodological contribution of this study lies in integrating EF-PMF and APCS-MLR for robust source apportionment and in linking the results to RF spatial prediction and probabilistic health risk assessment. This integrated framework enhances the interpretability of pollution dynamics.
2. Materials and Methods
2.1. Study Area
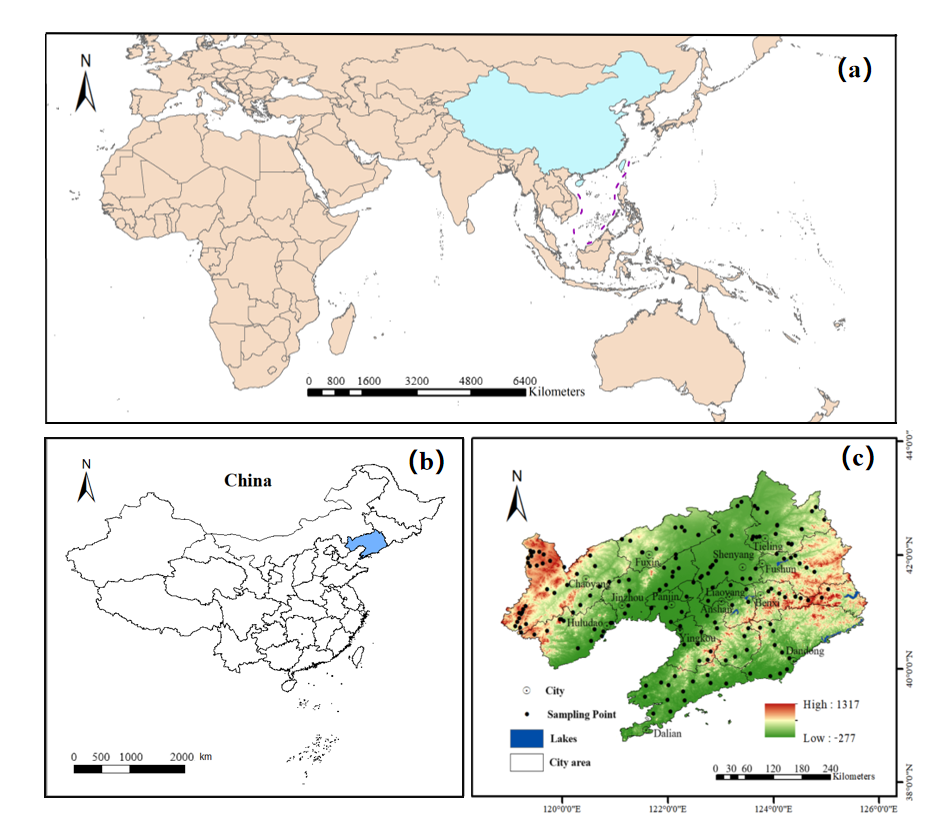
Liaoning Province is situated in Northeast China (38°43′33″–43°29′27″ N, 119°11′34″–125°46′30″). It borders North Korea to the east and is flanked by the Yellow Sea and the Bohai Sea to the south (Figure 1). Liaoning Province has a temperate, humid continental climate with four distinct seasons. The annual average temperature is 5 to 11 °C, while annual precipitation decreases from southeast to northwest, varying between 440 mm and 1100 mm. The eastern part consists of the eastern Liaoning hills, the west features the western Liaoning low mountains, and the central region is occupied by the Liaohe Plain. The soil types are brown soil, meadow soil, fluvoid soil, etc., and the main crops are corn, spring wheat, soybeans, and fruits, etc. Liaoning Province has a solid industrial foundation and rich industrial categories. It relies on equipment manufacturing, petrochemicals, and metallurgy as its traditional pillar industries. Strategic emerging sectors such as aerospace and new energy have also seen significant development.
Figure 1.
Study area and sampling point locations. (a) Location of China within Asia; (b) Location of the study area (Liaoning Province) within China; (c) Detailed map of the study area.
2.2. Sample Collection and Chemical Determination
In August 2022–2024, 168 soil samples were collected from farmland in 14 cities of Liaoning Province. Sampling sites were selected using a stratified design based on prefecture-level cities, dominant land use (farmland), and soil type. A 40 km × 40 km grid was stratified, approximately 1.2 samples per 1000 km2, which is comparable to province-wide farmland surveys in China [39]. Furthermore, the sampling density was densified to a 20 km × 20 km grid in areas with known mining/smelting activities and wastewater irrigation to capture local hotspots. At each site, we composited five topsoil subsamples (0–20 cm) into one representative sample [39]. Soil samples were digested with HCl-HNO3-HF, and the contents of Cd, Pb, Zn, Cu, Ni, As, Cr, Co were measured using American inductively coupled plasma emission spectrometry (ICP-AES, Leeman Labs, Profile DV) [40].
2.3. Method for Soil Source Analysis of Heavy Metals
2.3.1. Enrichment Factor
Al was used as the reference element, with Liaoning background values serving as the baseline for evaluating anthropogenic accumulation. The soil’s enrichment factor (EF) calculation formula [41] is as follows:
EF = (X/Al)s/(X/Al)b
In the formula, (X/Al)s and (X/Al)b are the heavy metal content of the sample and the ratio of X to Al content in the background value, respectively. EF > 1 is used as the criterion for distinguishing man-made pollution.
2.3.2. Positive Matrix Factorization
PMF decomposes measured concentrations into source profiles and contributions without requiring prior source information [42]. Source profiles and contributions were resolved with US EPA PMF 5.0 [43]. The initial matrix is as follows:
In the formula, Xij is the content of heavy metal j; p represents the number of pollution sources; the terms gik and fik represent the contribution of the k-th source to sample i and the concentration of metal j in source k [44]; eij represents the residual matrix, and the above parameters are dimensionless. To achieve the optimal solution, the model minimizes the objective function Q. The Q value is defined as follows:
In the formula, Eij is the residual for sample i and heavy metal j, and uij is the corresponding uncertainty. The uncertainty is calculated using the following formulas for species whose detected content is lower than or higher than the species detection limit [45], respectively:
Unc = 5/6 × MDL (c≤MDL)
In the formula, F represents the relative uncertainty; C represents the measured content of heavy metals; and MDL represents the method detection limit [35].
A new receptor model, EF-PMF, is based on the combination of the EF enrichment coefficient method and receptor PMF. Use the EF value in the PMF model to determine the distribution of heavy metal sources in the study area.
The EF-PMF model combines enrichment factor (EF) pre-processing with the standard PMF receptor model. First, EF values were calculated for each heavy metal at each sampling site using Equation (1). These EF values were then used as input data for the PMF model, replacing the original concentration data, to identify source profiles and contributions. This approach reduces the influence of natural background variations and enhances the model’s sensitivity to anthropogenic sources.
2.3.3. US EPA Human Exposure Health Risk Assessment Method
The US EPA human exposure health risk assessment method is widely used. Exposure to heavy metals occurs through three pathways: hand–oral ingestion (ADIing), inhalation (ADIinh), and skin contact (ADIdermal) [46]. The corresponding average daily intake (ADI) and risk quotient (HQ) values were calculated as [47]
In the formula, C denotes the concentration of soil heavy metals, Ring is the hand-or-mouth intake frequency, Rinh is the respiratory frequency, Ef and ED represent the exposure and duration, BW is the body weight; AT is the average exposure time for heavy metals, SA is the exposed skin area, SAF is the skin adhesion, ABS is the skin absorption factor, HQ is the non-carcinogenic risk index, and RFD is the non-carcinogenic risk reference dose for heavy metals [46].
Carcinogenic risk (CR) estimates the probability of developing cancer over a lifetime due to metal exposure [48]; SF is the carcinogenic slope factor. For regulatory purposes, the range of acceptable or tolerable carcinogenic risks is 10−6–10−4:
CRi = ADIi × SF
2.3.4. Kriging and Random Forest Prediction
Ordinary kriging was used to map the spatial distribution of the eight target metals as a geostatistical benchmark for RF prediction [49]. For each metal, the experimental semivariogram was calculated and fitted with spherical, exponential, and Gaussian models; the model with the lowest cross-validation RMSE was retained, and the fitted nugget, sill, and range were used for ordinary kriging interpolation on a 1 km × 1 km grid in ArcGIS 10.8 [39].
Random forest (RF), an ensemble learning method that averages many regression trees, was then used to predict the concentrations of the eight target metals from eight environmental covariates: road network density, annual precipitation, soil clay content, land use/land cover (LUCC), DEM, vegetation cover, GDP, and population. RF modeling was performed in R 4.3.1 with the random forest package. A purely random 7:3 split was used in this study, following common practice in machine learning-based soil mapping [50].
2.4. Statistical Analysis
Statistical analysis was carried out using IMB SPSS 22. Multivariate statistical analysis was performed on heavy metals using Origin 9.0. Source assignments of heavy metals and corresponding uncertainty analyses were calculated using PMF model 5.0. This paper employs Crystal Ball (11.1.2.2) (Oracle, USA) software to conduct Monte Carlo simulation, considering 1000 iterations and setting the confidence interval from 5% to 95% to obtain stable health risk simulation outputs.
3. Results
3.1. Heavy Metal Concentrations in Liaoning Province
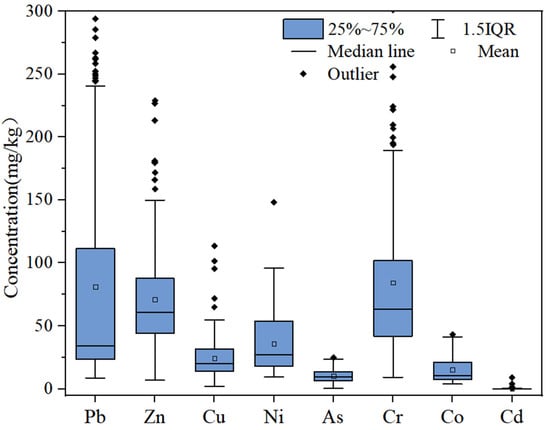
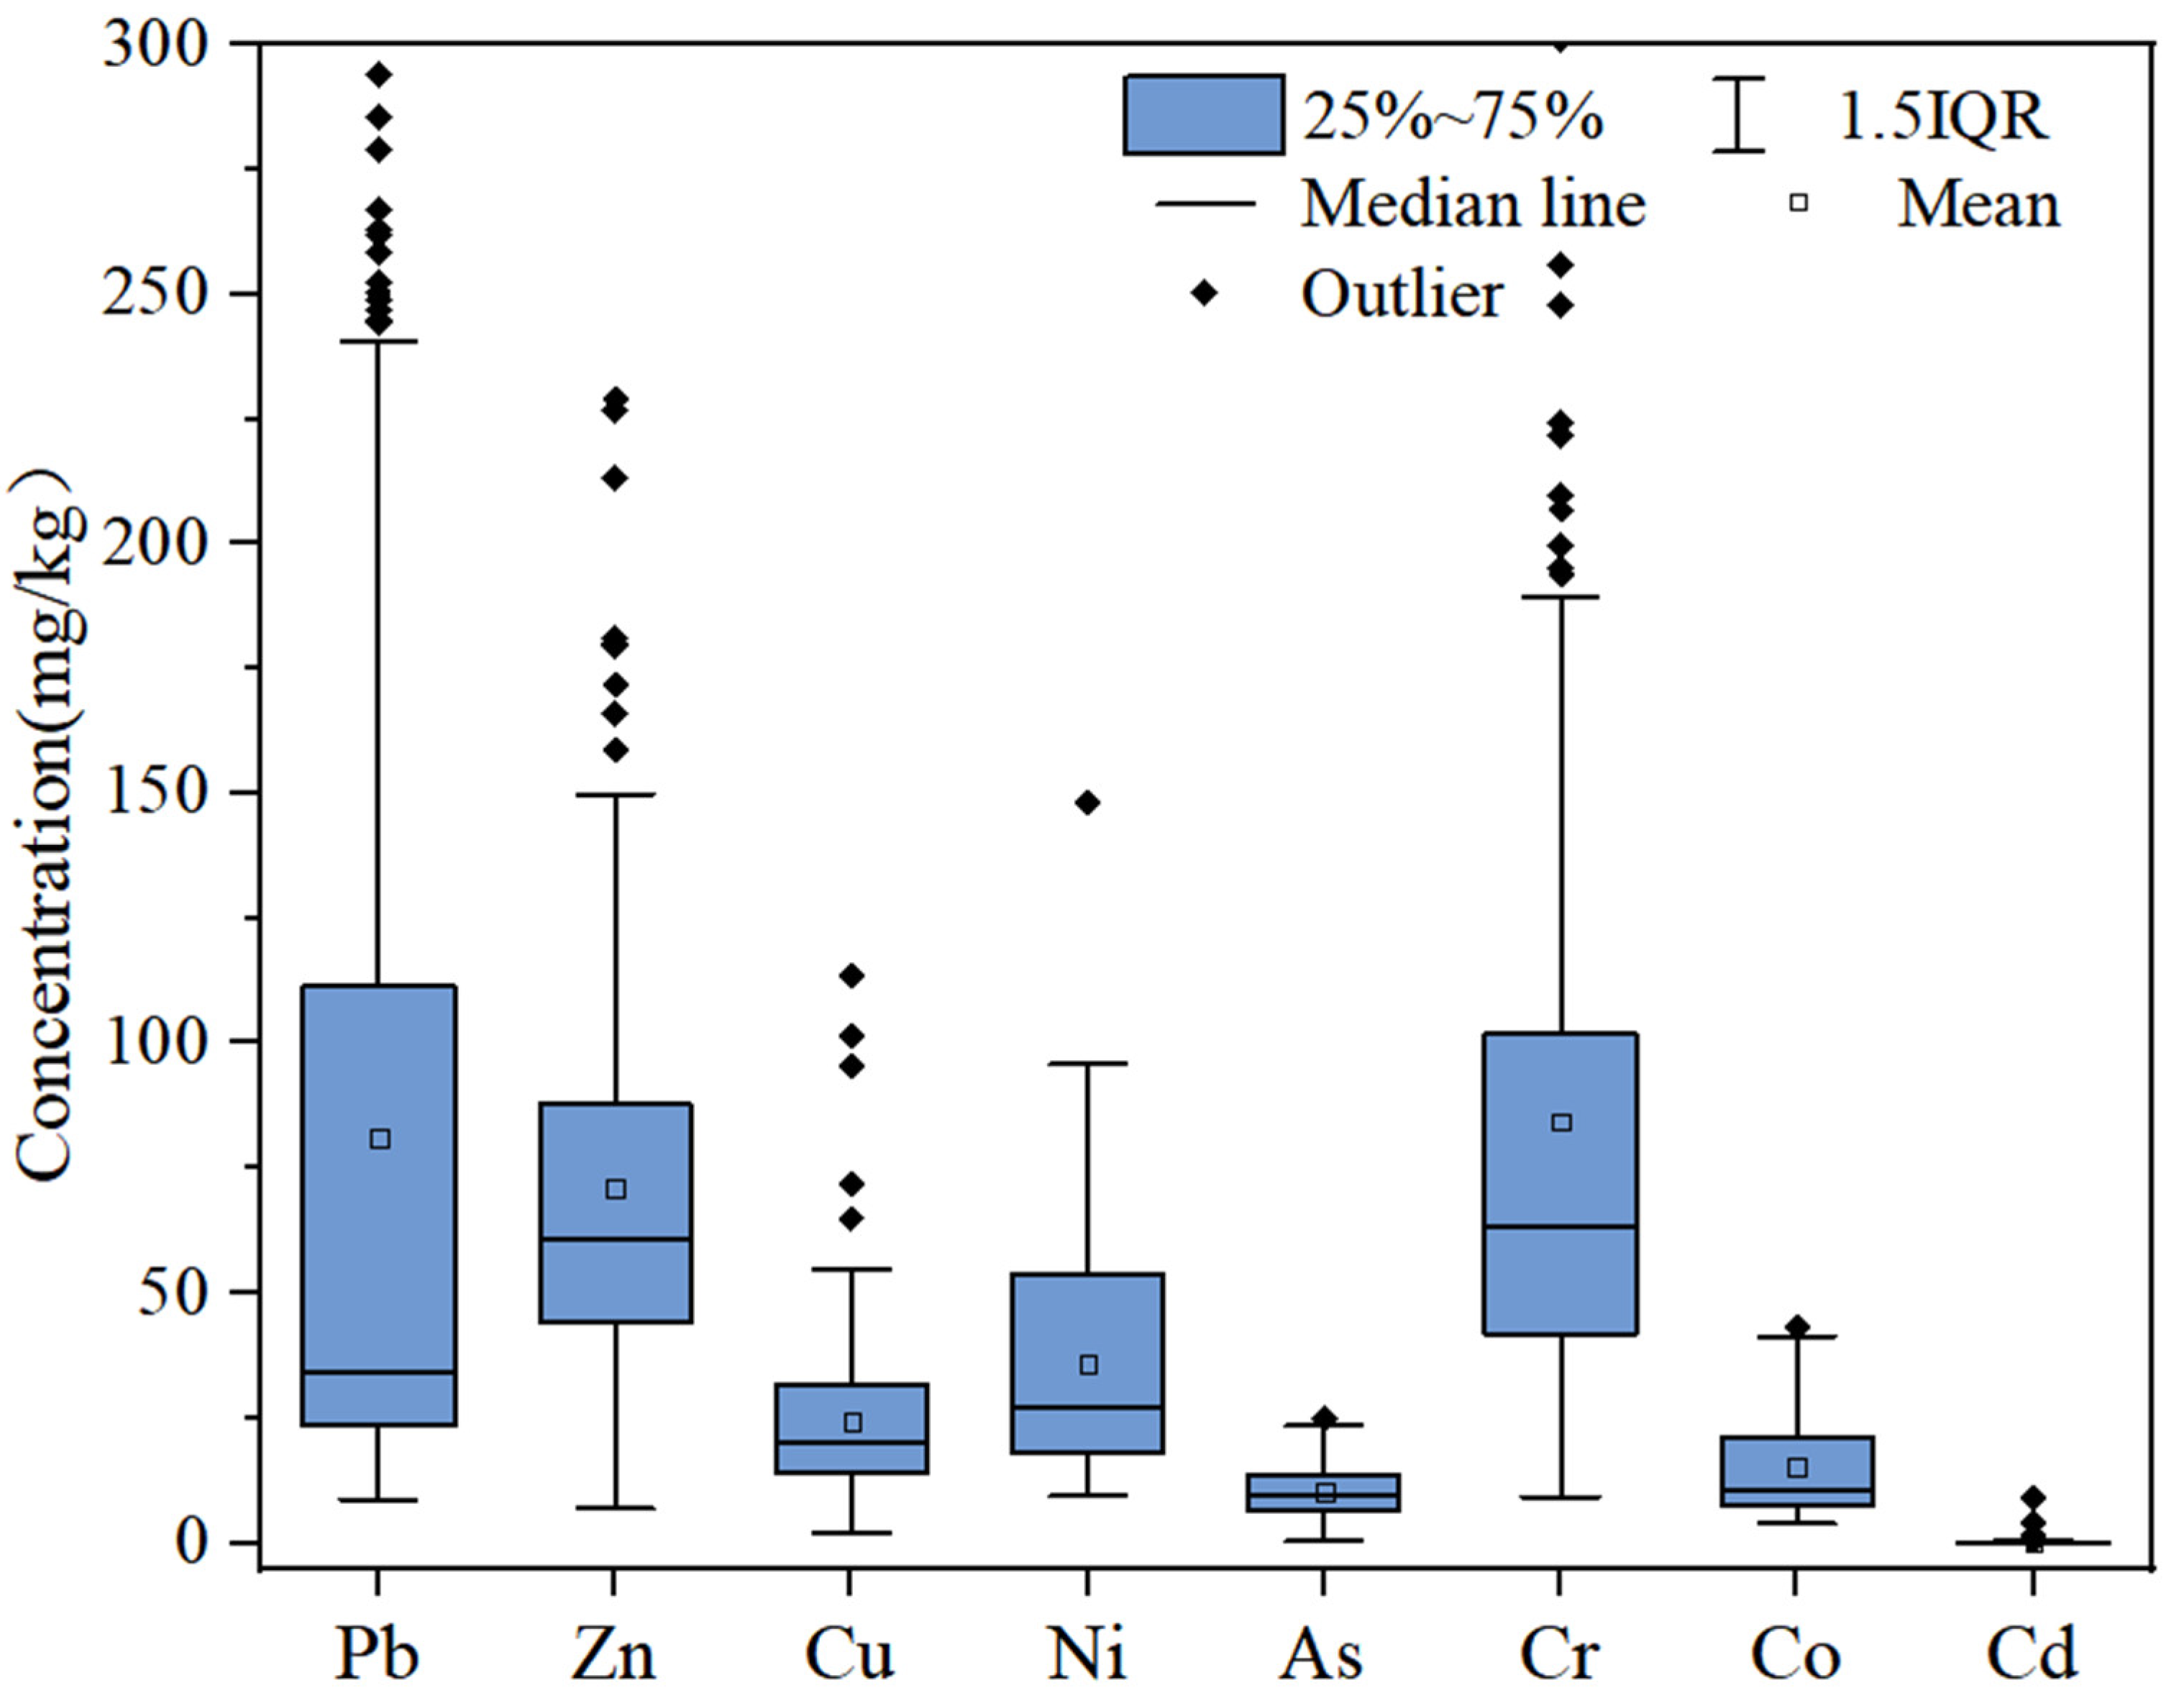
The overall statistical data of eight heavy metals in 168 farmland soil samples in the Liaoning Province study area are shown in Table 1 and Figure 2, including mean, minimum and maximum concentrations, coefficient of variation (CV%), and standard deviation (SD). The average contents of Cd, Pb, Zn, Cu, Ni, As, Cr, and Co are 0.29, 55.30, 62.11, 22.75, 38.63, 12.73, 88.33, and 13.45 mg·kg−1. Cd, Pb, and As contents were higher than the soil background values in Liaoning Province, indicating potential accumulation of these elements in agricultural soils. Among them, the maximum values of Cd, Pb, Cu, Ni, and Cr contents were 1.73, 195.10, 113.49, 148.23, and 472.78 mg·kg−1, respectively, which were 16.0 times, 9.1 times, 5.7 times, 5.8 times, and 8.2 times the background value of soil in Liaoning Province. The exceedance rates of Cd, Pb, Ni, and Cr points higher than the background value in Liaoning Province were 90.91%, 58.18%, 52.73%, and 32.73%, suggesting that Cd and Pb contamination was relatively widespread, whereas Ni and Cr showed more localized enrichment. The coefficients of variation further supported this interpretation. Cd exhibited the highest variability (CV = 1.62), followed by Pb (0.97) and Cr (0.83). This shows that Cd not only has a high exceedance rate at points, that is, an extensive range of spatial contamination but also a high degree of contamination [51]. High CV values typically indicate strong spatial heterogeneity and possible influence of anthropogenic inputs, whereas elements with lower CV values are more likely controlled by natural soil-forming processes [44,45].
Table 1.
Statistical characteristics of heavy metal concentrations (mg·kg−1).
Figure 2.
Heavy metal concentration in farmland in Liaoning Province.
Risk screening values for soil contamination of agricultural land (GB 15618-2018, China).
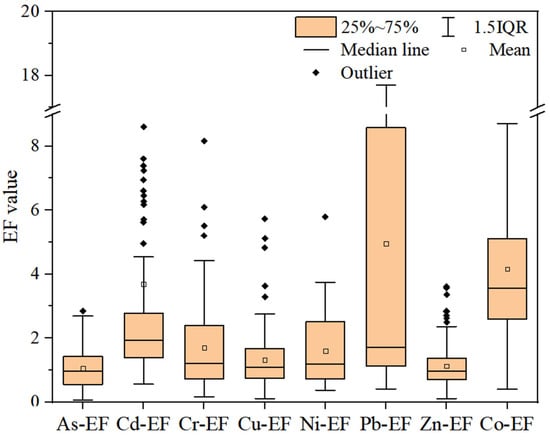
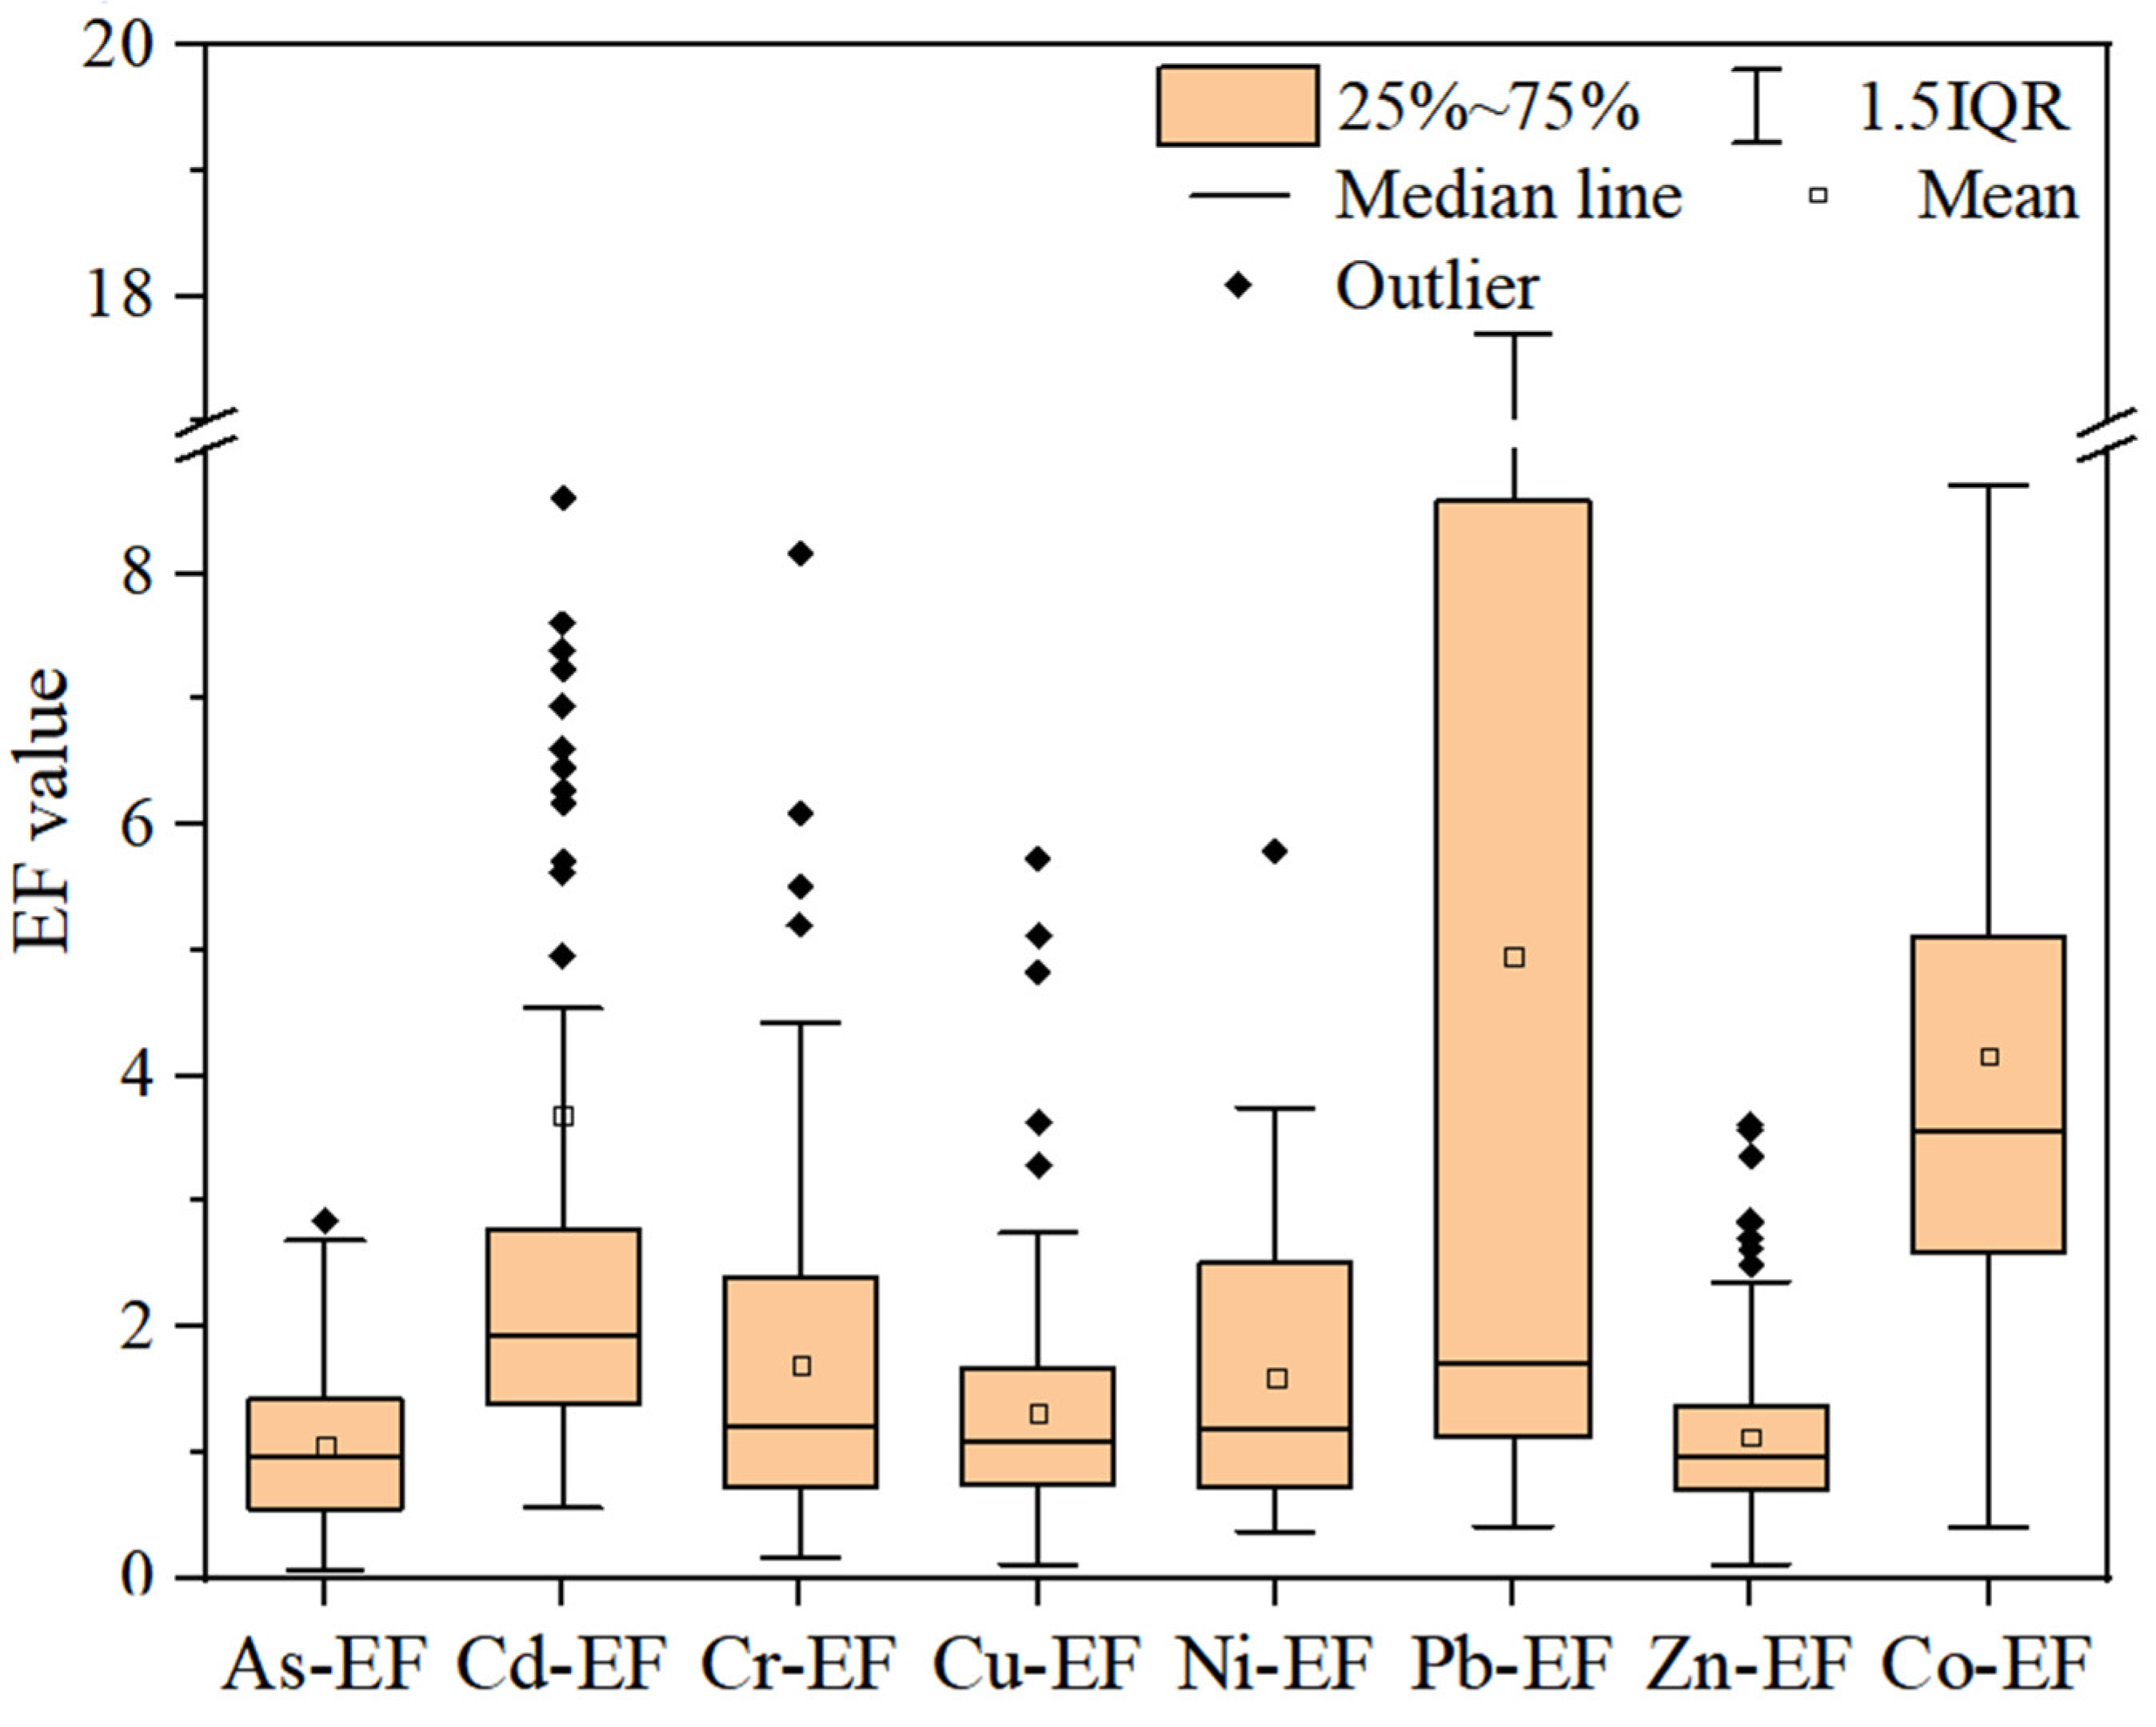
The enrichment coefficient can indicate the accumulation in farmland soil and the impact of human activities [52] using Liaoning soil background values as the reference and Al as the reference element, EF > 1 indicates man-made pollution, while heavy metals with EF < 1 are mainly natural sources [53]. The calculated average EFs followed a descending order of Pb > Cd > Cr > Ni > Zn > Cu > As > Co, with specific values of 4.50, 2.51, 1.48, 1.42, 1.13, 1.23, 1.11, and 0.96, respectively (Figure 3). The enrichment coefficients of Cd, Pb, Cr, and Ni > 1, respectively, further suggesting that these metals were enriched by human activities. The average enrichment coefficients of Zn, Cu, As, and Co are close to 1, which may belong to natural sources or mixed natural–anthropogenic contributions. The degree is relatively high, with the maximum enrichment coefficients of Cd and Pb being 16.40 and 17.70, respectively. Individual points may be more strongly affected by external inputs, possibly related to industrial emissions, mining activities, traffic sources, or agricultural practices. These patterns are consistent with previous studies reporting elevated Cd and Pb in farmland soils influenced by industrial and mining regions [40,41].
Figure 3.
Heavy metal enrichment coefficient.
3.2. Spatial Distributions of Heavy Metal Concentrations
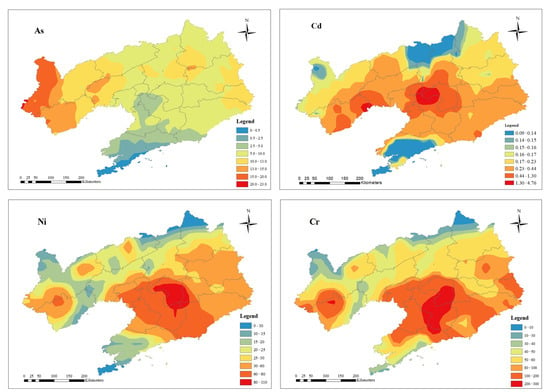
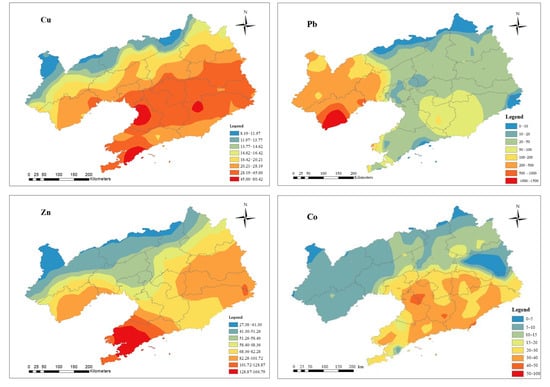
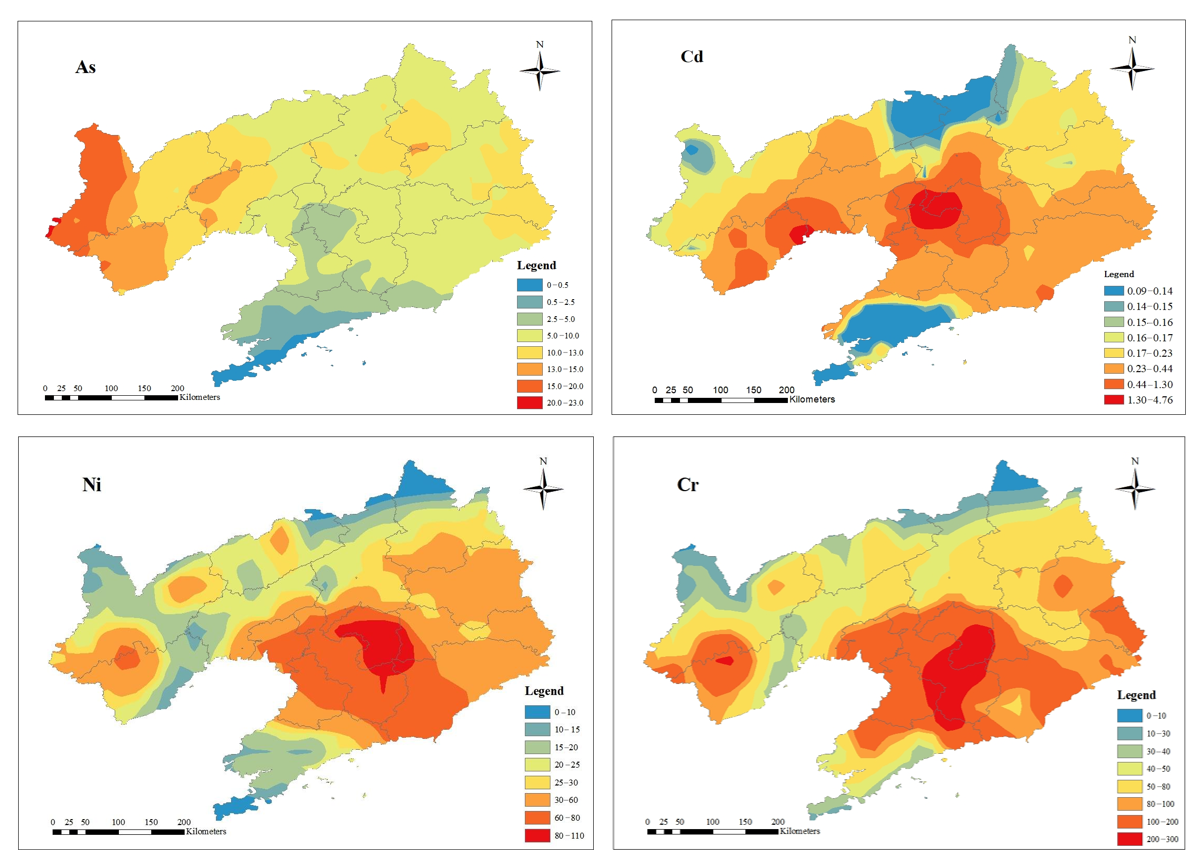
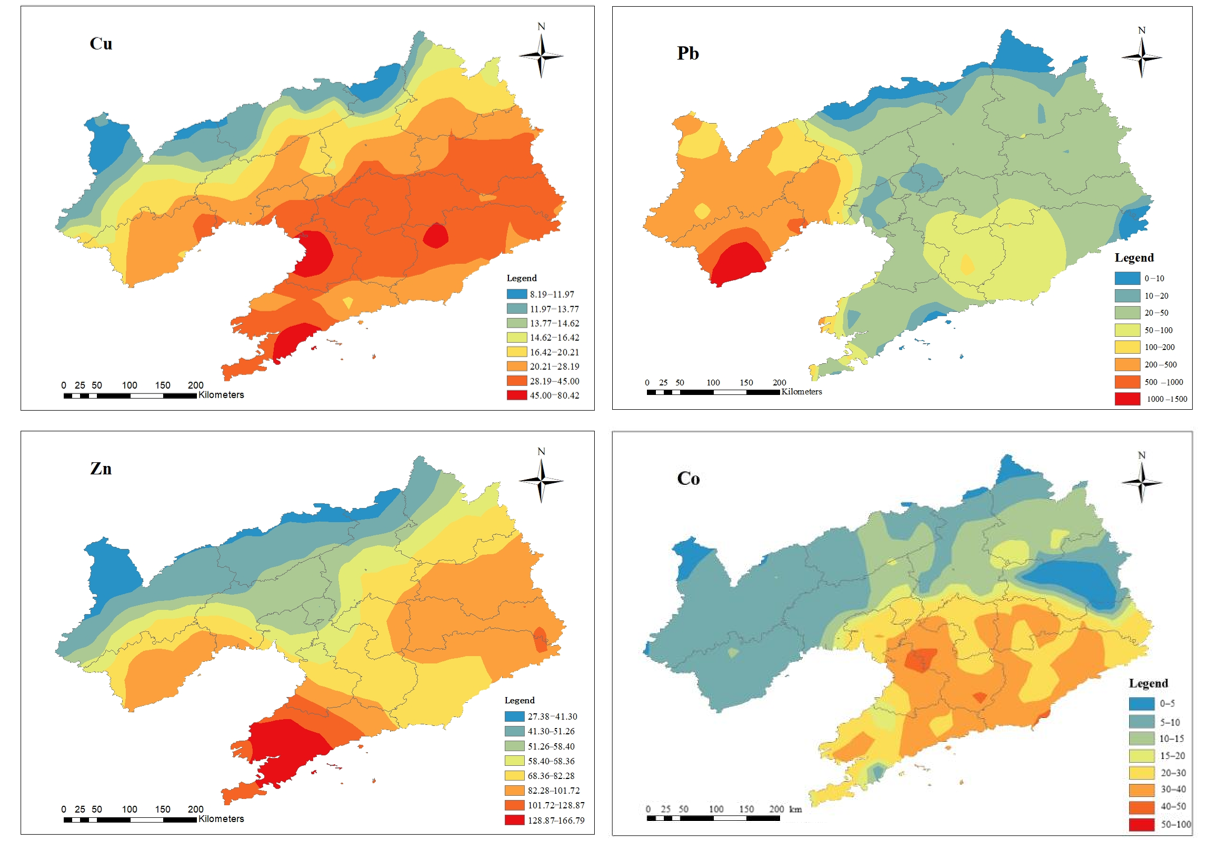
Heavy metal concentrations in farmland soils are jointly influenced by the surrounding environment and soil-forming parent materials [54], with pronounced spatial heterogeneity across the study area (Figure 4). Kriging interpolation revealed that Cd, Cu, Ni, and Cr exhibited similar distribution patterns, predominantly concentrated near Liaoyang and Anshan cities—areas rich in mineral resources—and closely linked to industrial activities and transportation [55]. Higher levels of Cd, Ni, and Cr were also observed in Huludao, potentially attributable to shipbuilding, electroplating, and smelting operations. In contrast, Co and Zn displayed congruent distributions, suggesting a natural source, such as parent material inheritance. Overall, elevated heavy metal concentrations were primarily located in zones with intensive anthropogenic activities, including urban centres and coal-mining districts. This pattern is consistent with previous reports that industrial and mining activities, traffic emissions, and agricultural inputs can significantly affect the spatial distribution of soil heavy metals [40,41].
Figure 4.
Heavy metal contents in farmland in Liaoning Province.
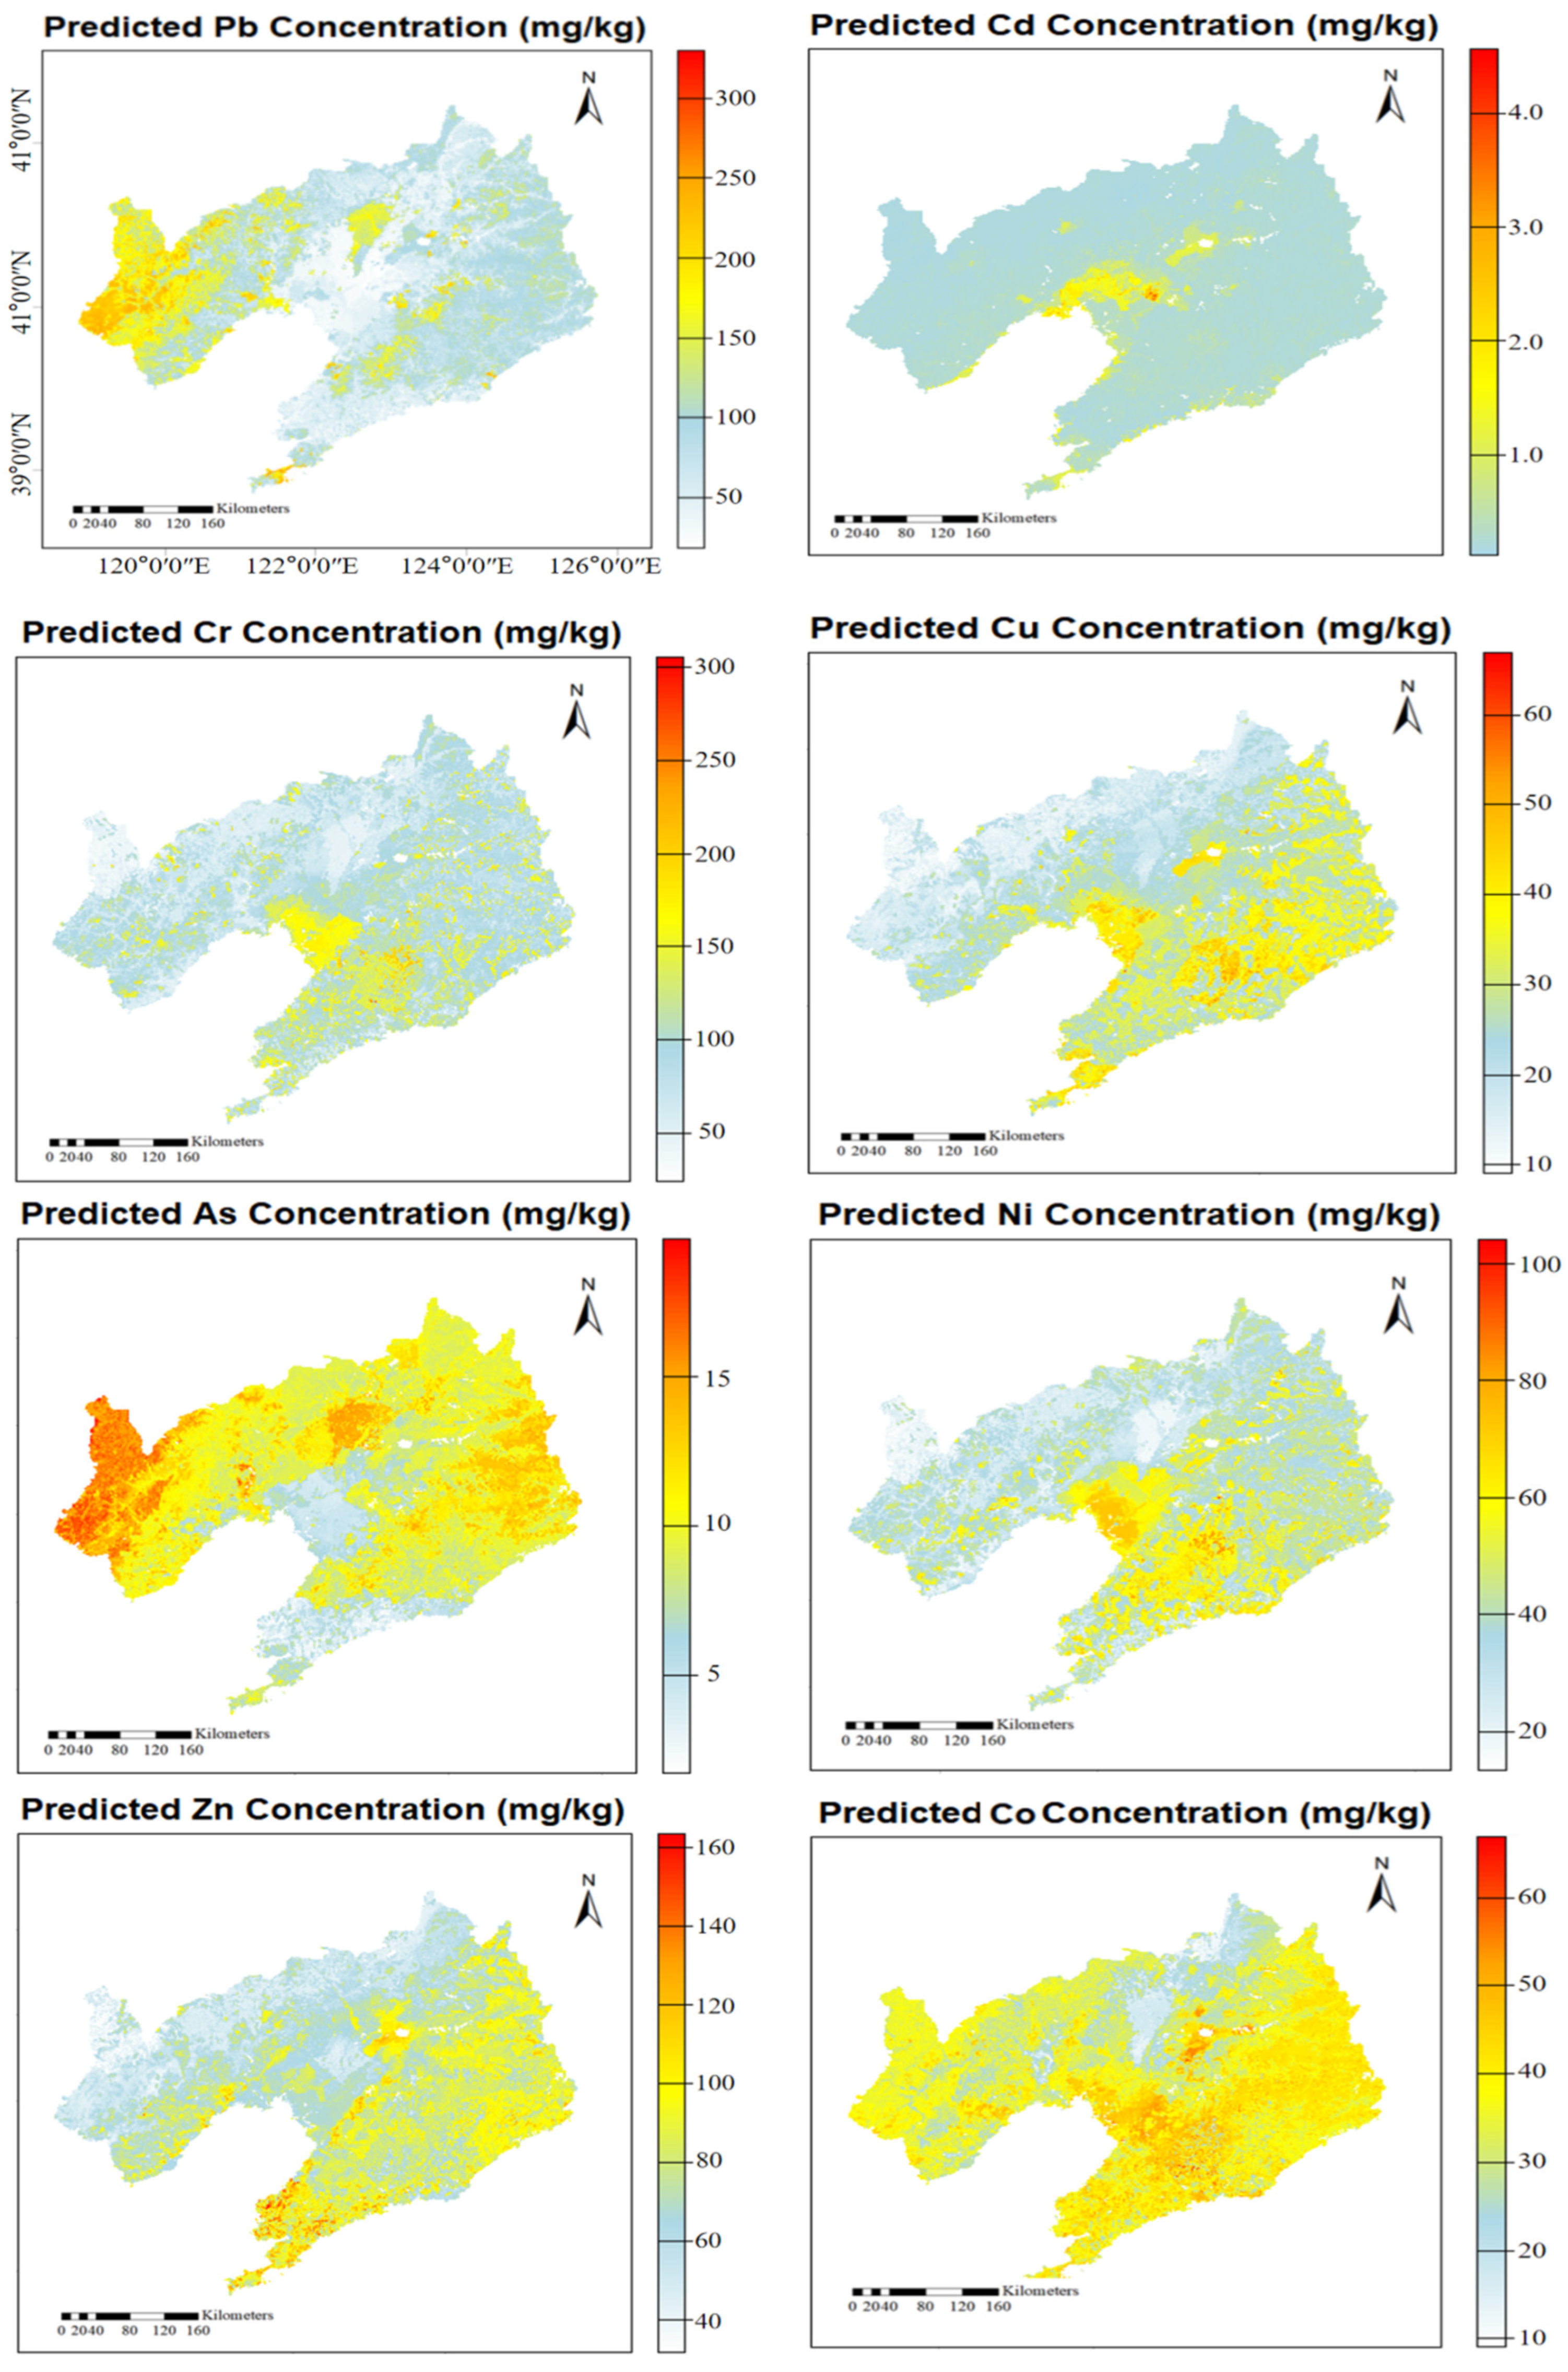
However, conventional geostatistical methods rely solely on spatial autocorrelation of sampling points and fail to account for the influence of environmental covariates [56]. To address this limitation, the present study incorporated eight environmental factors—road network distribution, annual precipitation, soil clay content, LUCC, DEM, vegetation cover, GDP, and population—all resampled to a 1 km × 1 km grid with a unified coordinate system. The random forest (RF) model was employed to predict the concentrations of eight heavy metals in farmland soils across Liaoning Province, with the dataset randomly split into training and testing subsets at a 7:3 ratio [57]. Three statistical metrics—the mean absolute error (MAE), root mean square error (RMSE), and coefficient of determination (R2)—were used to evaluate model performance [57]. Random splitting may overestimate performance when spatial autocorrelation makes training and testing samples spatially proximate, so RF results are interpreted as relative spatial patterns rather than absolute accuracy, and R2 is used for inter-metal comparison rather than independent validation of spatial transferability.
The RF model yielded MAE values ranging from 0.20 to 46.46 mg·kg−1 and RMSE values from 0.31 to 74.45 mg·kg−1. The R2 values for Cd, Pb, Cu, Ni, As, Cr, Co, and Zn were 0.012, 0.484, 0.333, 0.149, 0.474, 0.535, 0.313 and 0.170, respectively, indicating superior predictive performance for Cr, Pb, and As (R2 = 0.535, 0.484, and 0.474) (Figure 5). The RF-based mapping further delineated the high-value areas: Cd, Cr, Cu, Ni, and Zn were concentrated in the southeastern cities of Yingkou, Panjin, and Anshan, coinciding with mineral resource abundance and heavy industrial agglomeration; high concentrations of Pb and As occurred in the western cities of Chaoyang and Huludao, associated with historical lead–zinc mining, while lower levels were found in the southern coastal regions. These results not only corroborate the spatial patterns identified by kriging interpolation but also elucidate the underlying driving factors through environmental covariates, thereby providing a more robust scientific basis for source identification and pollution control of heavy metals in farmland soils of Liaoning Province.
Figure 5.
Predicting heavy metal levels in Liaoning cropland soils via machine learning.
The sampling density of 168 samples over approximately 145,000 km2 (about 1.2 samples per 1000 km2) is relatively low for a province-wide survey. This limitation should be considered when interpreting local-scale patterns. However, the stratified design across all prefecture-level cities and major soil types, together with the RF prediction using environmental covariates, partly compensates for the limited spatial coverage and supports the regional-scale source apportionment and risk screening presented here.
3.3. Source Apportionment of Heavy Metals
3.3.1. Pearson Correlation Matrix (Pcm)
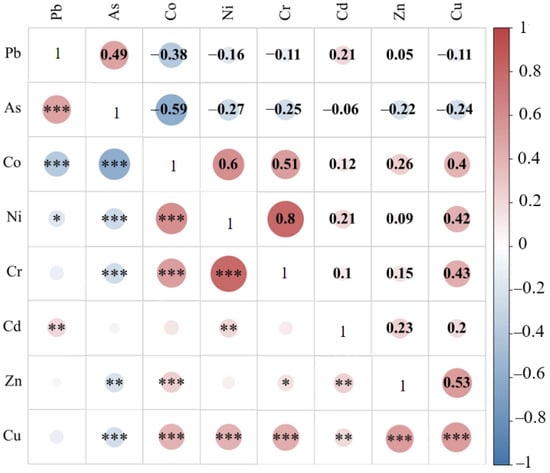
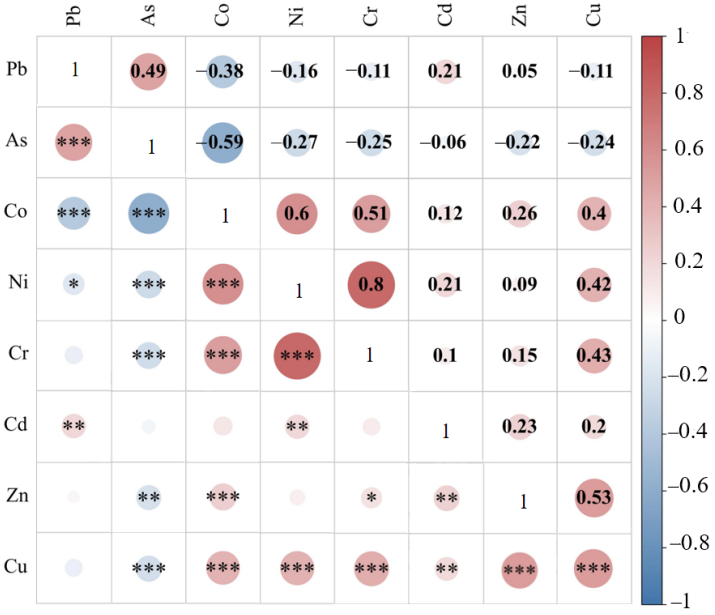
The correlations among the eight heavy metals in Liaoning Province were analyzed. Generally, a strong positive correlation implies a shared origin [37]. Research shows that when the correlation coefficient between elements is >0.8, it is a significant correlation; 0.5~0.8 is an obvious correlation, and 0.2~0.5 is a weak correlation [58]. As illustrated in Figure 6, inter-element correlations were evident across the study area. Cr has a significant positive correlation with Ni (r = 0.8, p < 0.001); Co has an obvious positive correlation with Ni, Cr and As; Cu has an obvious positive correlation with Zn, (r = 0.53, p < 0.001). In summary, the strong correlation between Zn and Cu suggests an agricultural origin, whereas the obvious correlations of Co with Cr, Ni, and As point to a mixed contribution from industrial activities and natural sources (e.g., parent material). The observed Cr–Ni–Co and Cu–Zn associations align with previous studies linking them to geogenic/industrial and agricultural sources, respectively [50,51,52,53,56,57,58]. This confirms that heavy metals originate from mixed natural and anthropogenic sources rather than a single dominant source.
Figure 6.
Correlation analysis of 8 heavy metals. * indicates p < 0.05, ** indicates p < 0.01 and *** indicates p < 0.001. No asterisk indicates p ≥ 0.05 (not significant).
3.3.2. Result of APCS-MLR, PMF and EF-PMF
Use the APCS-MLR, PMF, and EF-PMF models to analyze the source proportion distribution of heavy metals. Taking the heavy metal content, EF values of heavy metals, and corresponding uncertainties as original data, then the source of heavy metals in Liaoning Province were analyzed using EPA PMF5.0. After testing factor counts from three to seven over 20 runs and optimizing the Q value. After outlier removal and Q-value evaluation, four factors were determined as optimal.
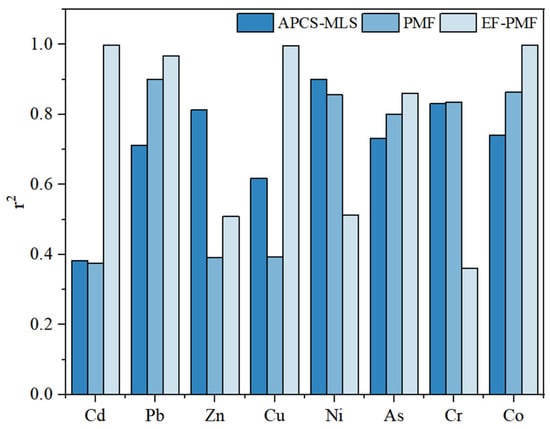
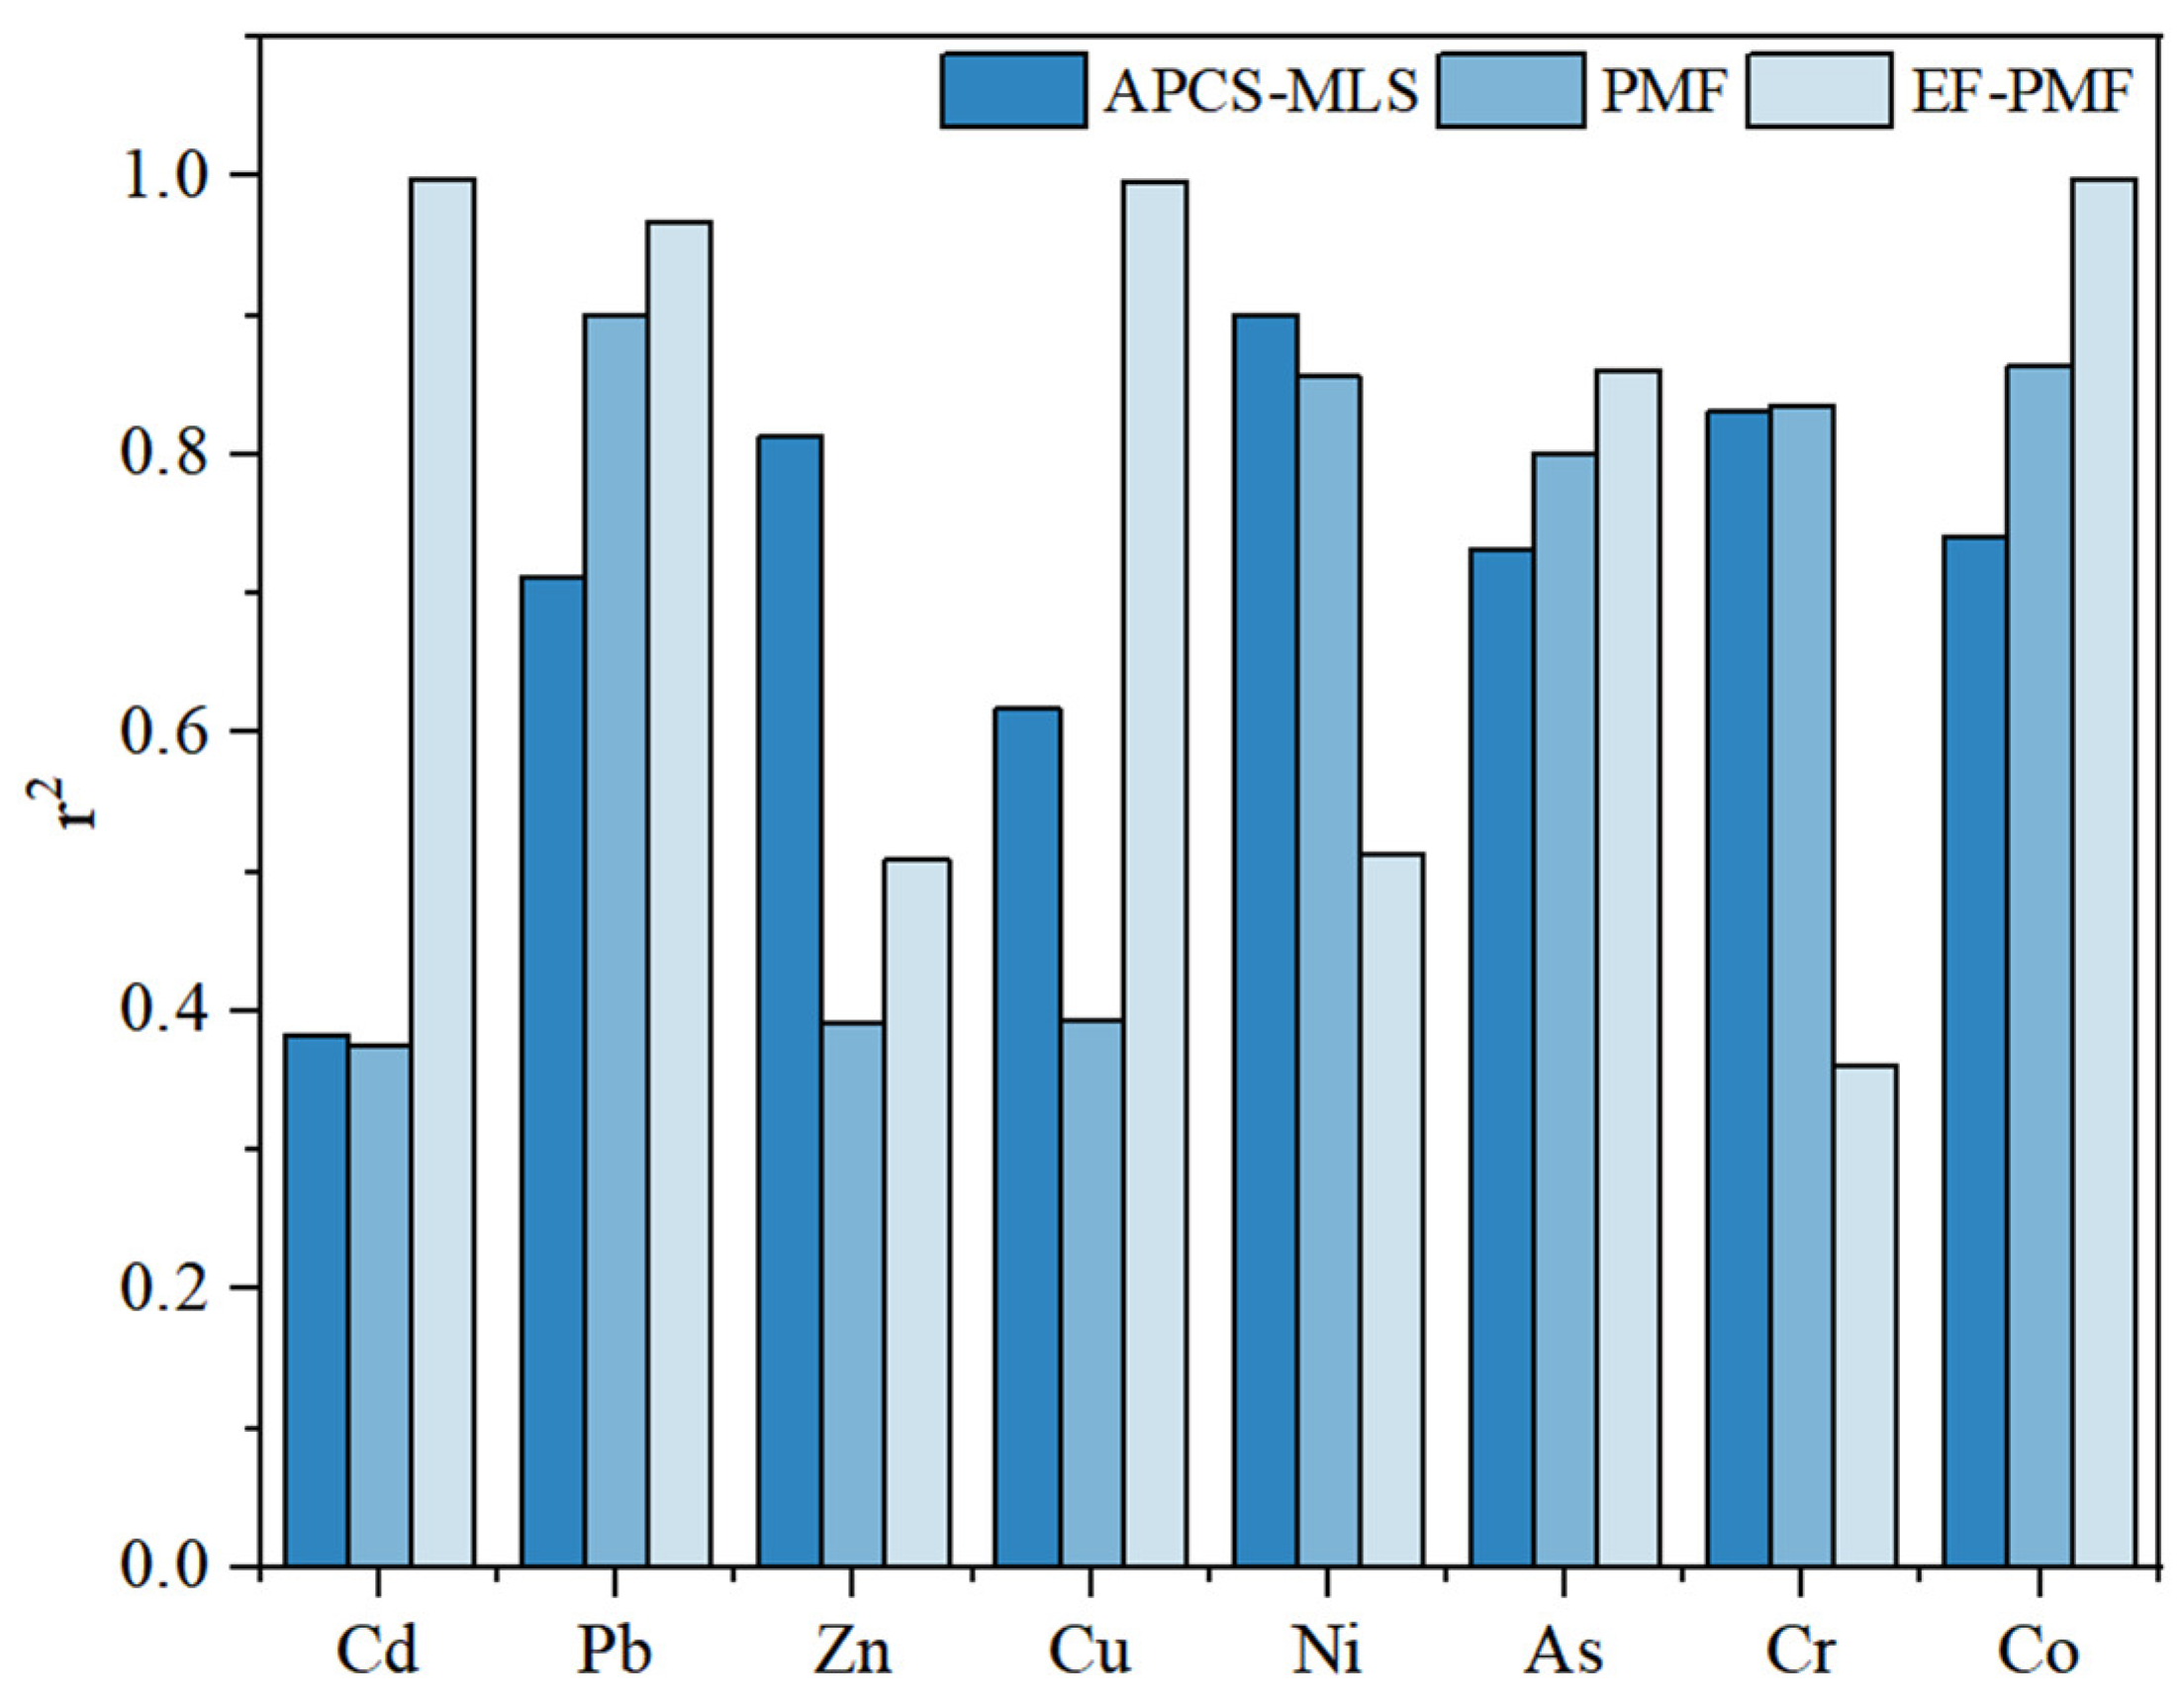
The APCS-MLR, PMF, EF-PMF model identified four factors. APCS-MLR is mainly loaded with Cr, Ni, and Co elements at source 1, source 2 mainly loads on Cu and Zn, the main load in source 3 is Pb, and source 4 mainly loads on Cd, Zn, and As. PMF is mainly loaded with Co elements at source 1, source 2 mainly loads on Cd, Pb and As, the main load in source 3 is Ni, Cr, and source 4 mainly loads on Zn and Cu. The four sources identified by EF-PMF are the same as those of the APCS-MLR. It can be seen from this that EF has corrected the identification of heavy metal sources by PMF. In Figure 7, the r2 of Zn and Ni in the APCS-MLR model is 0.81 and 0.90, indicating that these elements have a higher fitting degree in the model. In the PMF model, the r2 of Cr is 0.84, and the fitting degree is high. The EF-PMF model has a high fitting degree for Cd, Pb, Cu, As and Co. The fitting degree of EF-PMF is higher than the APCS-MLR and PMF model. The fitting degree of EF-PMF is good for the main pollution elements Cd, Pb, Cu and As with higher pollution degrees. This cross-model agreement supports the robustness of the four-source solution and demonstrates the added value of integrating EF-PMF with APCS-MLR for reducing model-dependent uncertainty.
Figure 7.
r2 values of APCS-MLR, PMF, and EF-PMF models.
3.3.3. Source Apportionment of Heavy Metals in Soil
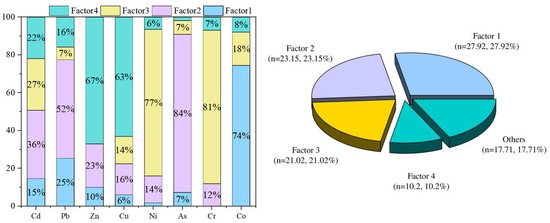
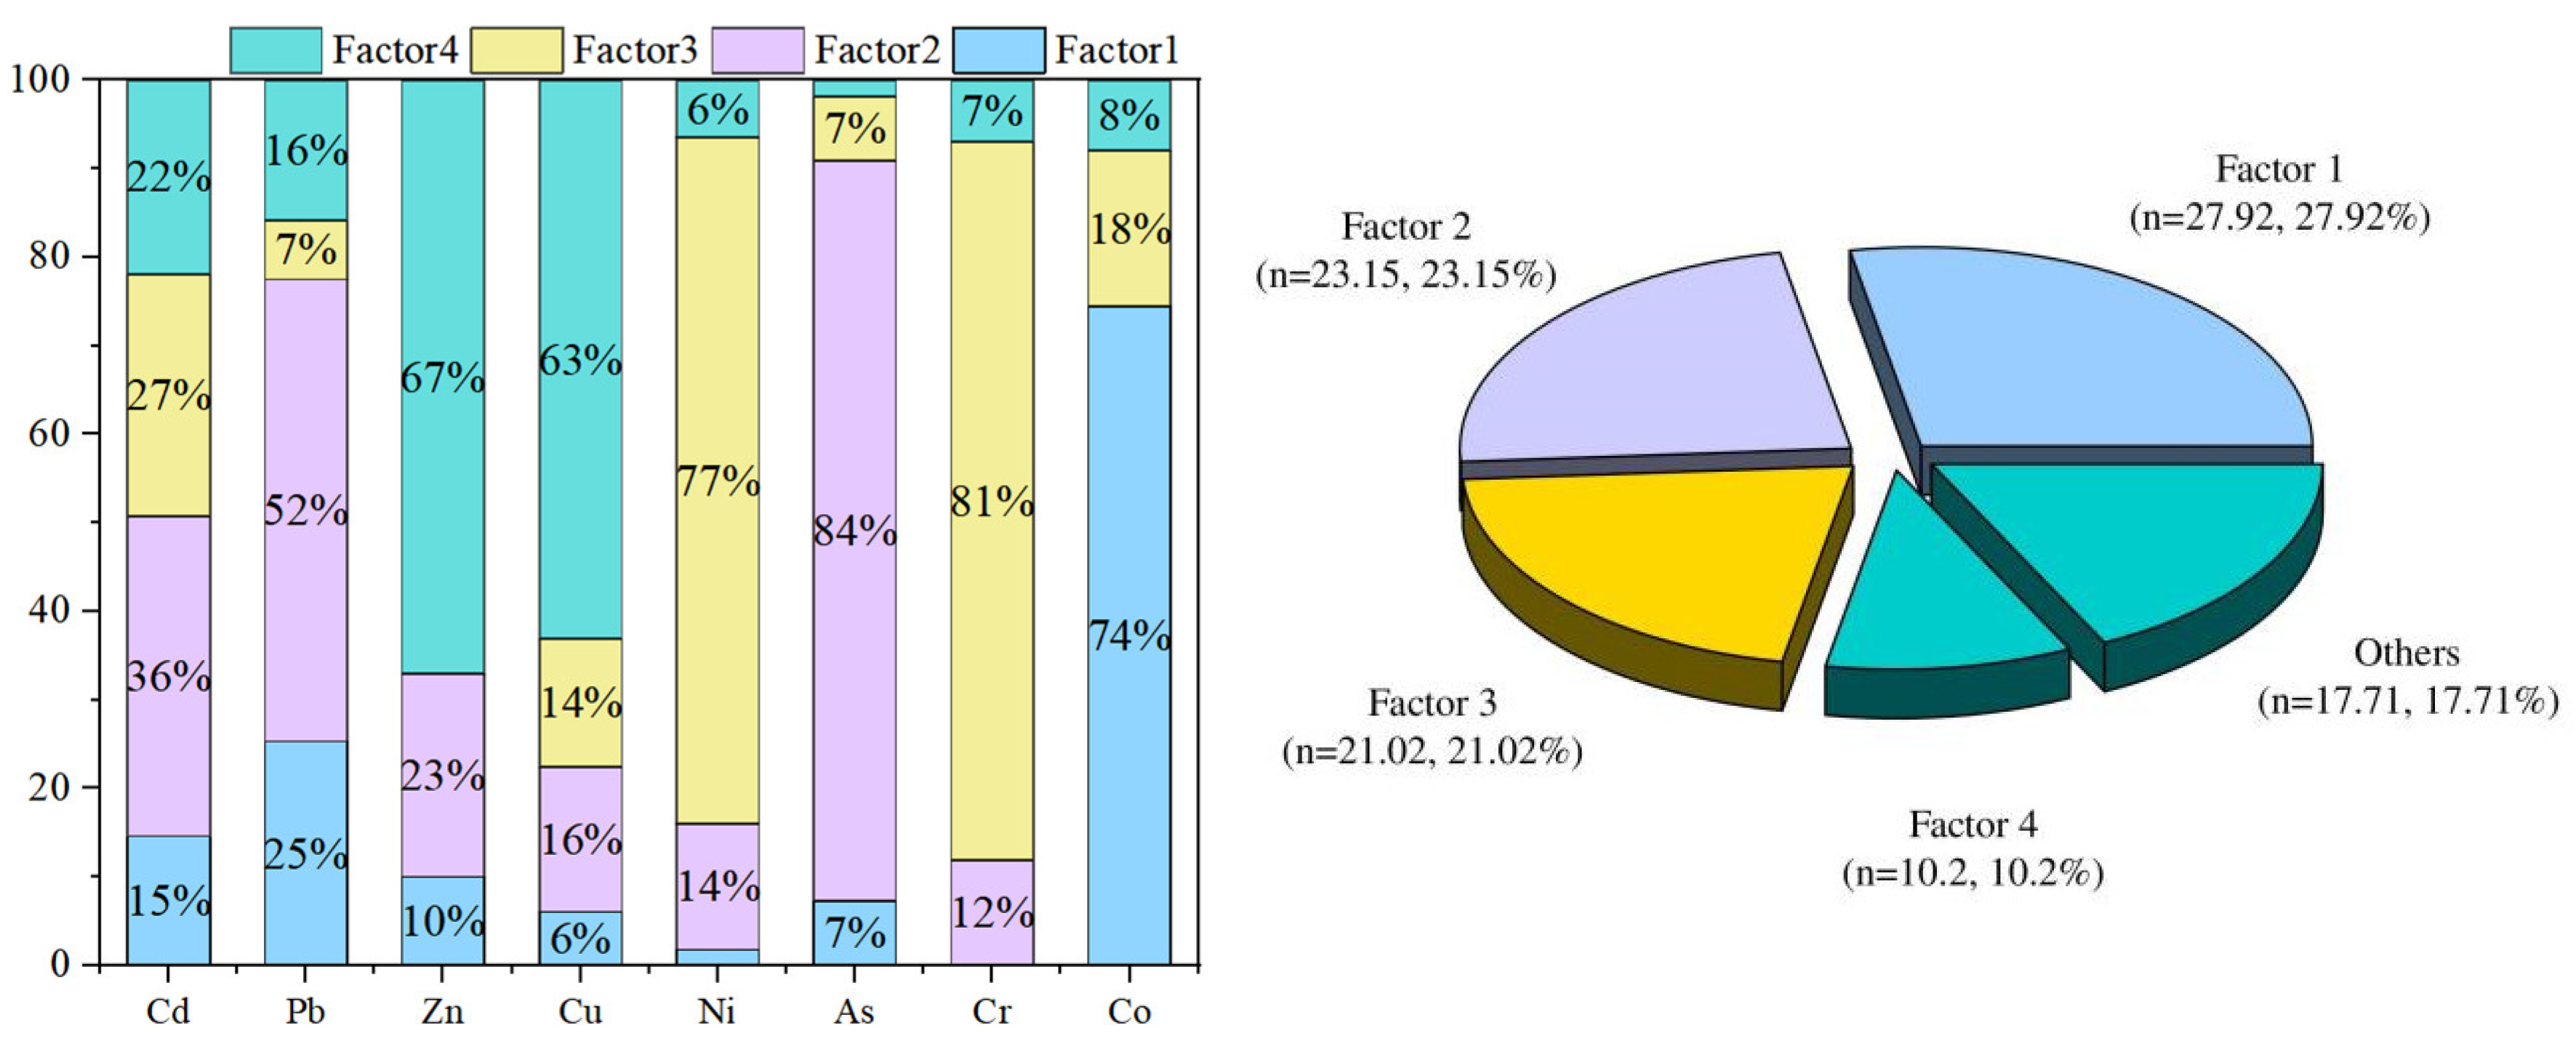
The APCS-MLR model quantified heavy metal source contributions in Liaoning farmland soils. The proportions of the four sources are 27.92%, 23.15%, 21.02%, and 10.20%, totaling 82.29% (Figure 8). APCS-MLR in factor 1 mainly load on Cd (40.15%), Zn (35.59%), and As (51.47%). Studies have shown that steel mills and coal mining generate a large amount of dust and wastewater rich in heavy metals such As, Zn, and Cd [59]; therefore, factor 1 is a representative industrial source. Factor 2 is mainly loaded with Pb (51.29%). The main sources of lead are historical traffic emissions and the wear of car brake pads, so factor 2 is a source of traffic emissions [60]. Factor 3 is mainly loaded with Cr (76.43%), Ni (80.38%), and Co (30.90%). Studies have shown that atmospheric deposition is the main way to cause pollution from Cr and Ni in soil, Cr and Ni are typical heavy metals in the electroplating industry. In addition, the distribution of Cr, Ni and Co is related to the parent material of soil formation or the soil formation process [61,62], so factor 3 belongs to atmospheric deposition and natural sources. Factor 4 is mainly loaded on Cu (48.56%) and Zn (56.27%). These elements are frequently introduced to farmland through agrochemical applications (fertilizers, pesticides) and sewage irrigation [63] (Hossain Bhuiyan et al., 2021), so factor 4 is a representative source of agricultural activities.
Figure 8.
Source factor contribution of APCS-MLR of soil heavy metals in Liaoning Province.
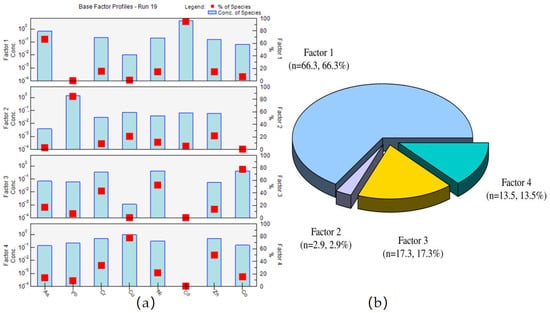
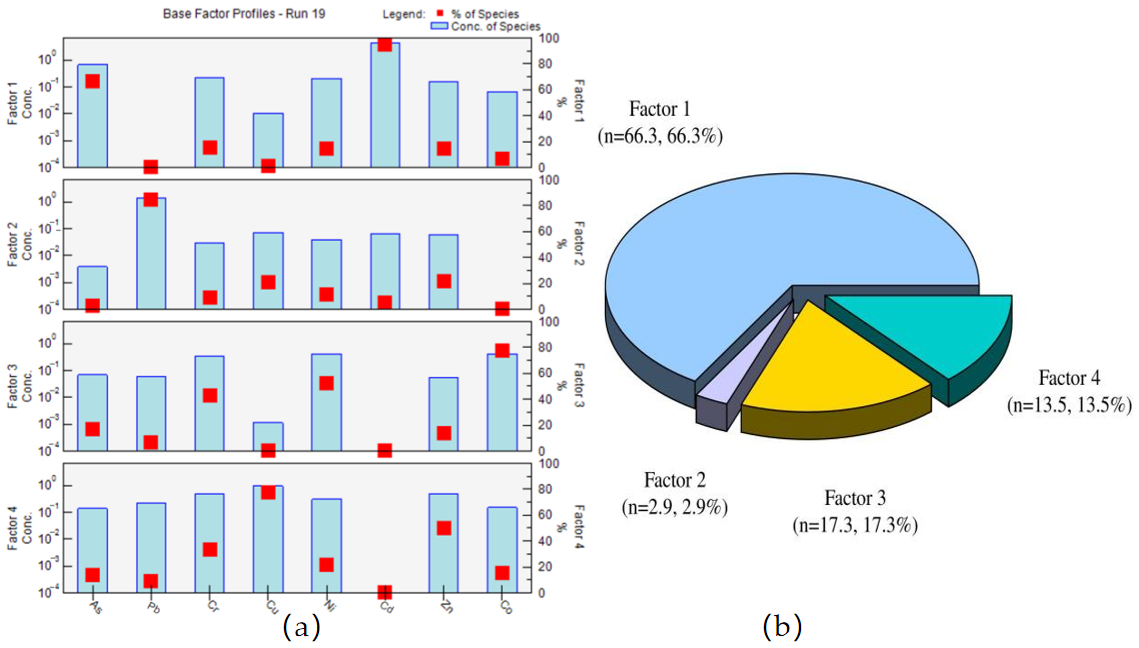
Compared with PMF and APCS-MLR, EF-PMF has a higher r2, a higher degree of fit, and the identified sources are the same as those of APCS-MLR. The proportion of different sources is more reasonable, and the credibility of source classification is higher. The proportions of the four sources are 66.3%, 2.9%, 17.3%, and 13.5% (Figure 9).
Figure 9.
Contributions of different sources of heavy metals (a) and the contributions of the four sources (b).
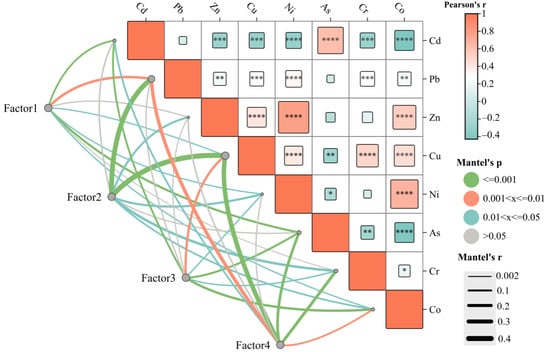
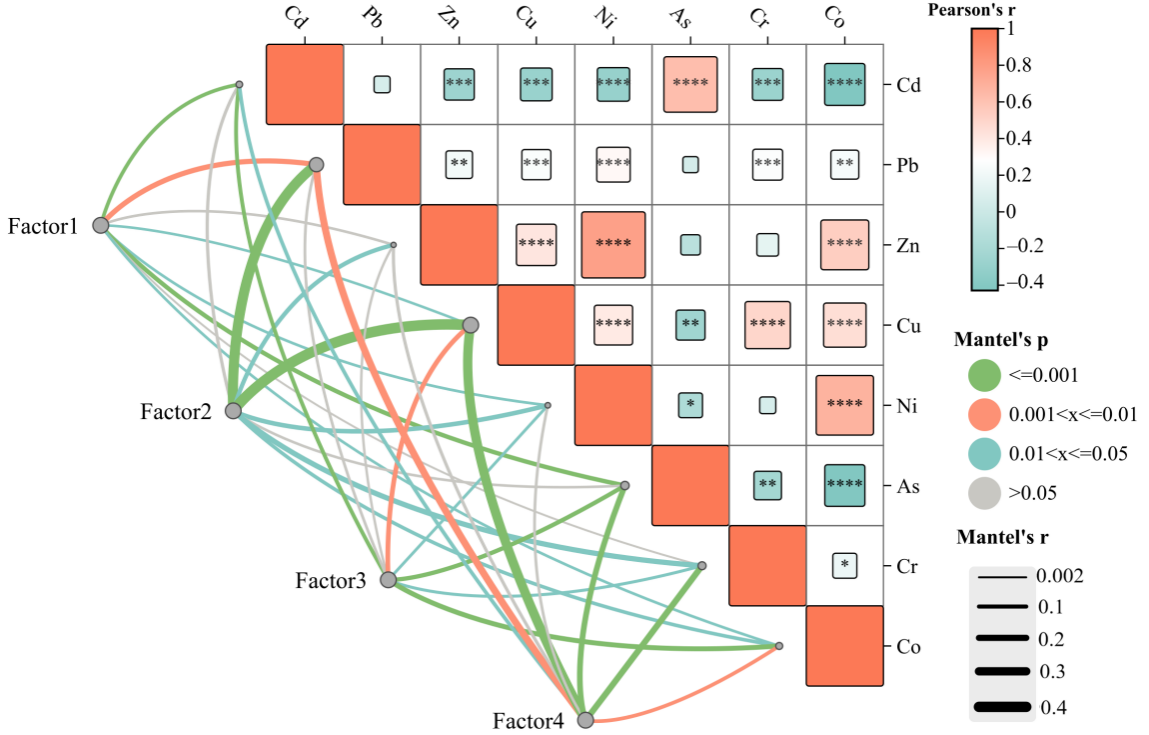
In factor 1 (Figure 9 and Figure 10), the loadings of Cd (94.93%) and As (66.31%) are significantly higher than those of other elements. Mining activities, metal smelting, and fossil fuel combustion represent the primary sources of heavy metals in the atmosphere [39], with coal combustion being the most significant contributor to arsenic pollution in Liaoning Province and northern China. As a major industrial and energy base, Liaoning has historically consumed substantial amounts of coal, leading to arsenic entering farmland soil through atmospheric deposition, industrial dust, and effluents. Additionally, arsenic is extensively used in industrial production, such as in foundries, pesticides, and insecticide manufacturing. Pollutants discharged from these industries accumulate in nearby farmland through atmospheric deposition and rainwater infiltration. Consequently, factor 1 can be attributed to coal combustion and industrial production activities.
Figure 10.
Correlation between sources and heavy metals. * indicates p < 0.05, ** indicates p < 0.01, *** indicates p < 0.001 and **** indicates p < 0.0001. The values inside the squares are Pearson’s r coefficients, and the colors represent the direction of correlation (red for positive, cyan for negative). A blank square (no asterisk) indicates p > 0.05 (not significant).
Factor 2 independently identified lead (Pb, 84.92%), which is usually associated with the exhaust emissions of historical vehicles. Especially in areas with high traffic volume and high vehicle exhaust emissions, such as Shenyang, the lead content is relatively higher [6]. Additionally, the mining and smelting of lead ores produce dust and wastewater containing Pb. There are numerous lead mines distributed in western Liaoning’s Huludao and eastern Anshan-Benxi regions, which is consistent with the highest lead content in these areas (Figure 4 and Figure 5). Therefore, it can be inferred that factor 1 is related to historical traffic emissions and atmospheric deposition caused by lead ore mining.
Factor 3 mainly loads Cr (42.70%), Co (77.46%), and Ni (52.54%) (Figure 9 and Figure 10). Cr and Ni are heavy metals that form fingerprints in the electroplating industry and enter farmland soil through atmospheric deposition. Additionally, the distribution of Cr, Ni, and Co is related to soil parent materials and pedogenic processes [63,64]. Therefore, factor 3 belongs to atmospheric deposition and natural sources.
Factor 4 mainly loads Zn (49.84%) and Cu (77.88%). These elements are more widely invested in agricultural production processes [65,66]. For example, Zn is important in chemical fertilizers and food crop fungicides [67,68]. Furthermore, the application of animal manure and livestock feed supplements (frequently enriched with Cu and Zn for growth promotion and disease control) introduces significant amounts of these metals into farmland ecosystems [69]. Therefore, factor 4 is man-made pollution caused by agricultural activities.
The pollution sources identified by the APCS-MLR and EF-PMF models are similar (Figure 8 and Figure 9), but the difference lies in the load proportion of each pollution element. Among them, the contribution of Cd elements from natural sources (agriculture and atmospheric deposition) changed from 65% and 14% in the PMF model to 69% and 22% in the EF-PMF model. The proportion of atmospheric deposition increased significantly. This increase in the atmospheric deposition proportion aligns with findings from Northeast China, where atmospheric input is a dominant pathway for soil heavy metals [70]. Therefore, the EF-PMF model is more accurate in identifying the main pollution element (Cd and Pb) sources.
These source-apportionment results broadly agree with previous studies in industrial and agricultural regions of China. The dominance of industrial activities (66.3%) and the independent Pb factor (84.92%) are consistent with coal combustion, smelting, historical traffic emissions, and Pb ore mining reported for Liaoning hotspot and mining/smelting areas [39,40,41,45,49]. The Cr–Ni–Co association reflects mixed geogenic and atmospheric/electroplating inputs [50,51,52,53], while the Zn–Cu factor is supported by agricultural inputs such as fertilizers, manure, and sewage irrigation [54,55,56,57,58]. The better EF-PMF fit for Cd and Pb supports EF pre-processing for anthropogenic source identification [46,51]; overall source types and industrial-versus-agricultural importance are comparable with previous PMF/APCS-MLR studies [33,51].
3.4. Risks to Human Health from Soil Heavy Metal Exposure
Table 2 lists the exposure doses of eight heavy metals to heavy metals in children and adults through three exposure routes: soil hand-or-mouth ingestion, respiratory ingestion, and skin contact ingestion. The ranking of cumulative exposure doses follows Cr > Zn > Pb > Ni > Cu > Co > As > Cd. For all evaluated metals, the hierarchy of non-carcinogenic risk follows the sequence: ingestion > dermal contact > inhalation. In addition, children exhibit markedly higher exposure doses than adults across all pathways and both carcinogenic and non-carcinogenic endpoints, which is consistent with previous research The average HQ of eight heavy metals in the farmland soil of Liaoning Province fall below the US EPA threshold of one (US EPA, 2001), suggesting that non-carcinogenic risks to local residents are generally low. Nevertheless, Cr and As are the most potent pollutant, with children’s HQ being 0.14 and 0.12, identifying them as the primary non-carcinogenic concern. Other heavy metals have a low impact on human health risks.
Table 2.
Estimated exposure dose (mg/kg/day) of the eight target metals.
According to existing research, there are no reliable quantitative carcinogenic risk slope factors for Zn, Cu and Co yet [71]. Thus, carcinogenic risks were estimated only for Pb, As, Cd, Cr, and Ni. The resulting risk hierarchy is Ni > Cr >As > Cd > Pb. The estimated cancer risk for children is 5.15 × 10⁻⁵, and the cancer risk for adult 5 is 1.67 × 10⁻⁵, both lying within the US EPA’s acceptable range of 10−6–10−4. It should be noted, however, that these figures reflect average concentrations; hotspots exceeding regulatory thresholds would entail proportionally higher risks.
The Monte Carlo simulation results demonstrate that risks are lower compared to those derived from traditional deterministic risk assessment methods [56]. This discrepancy arises primarily because conventional approaches often overlook individual variability, uncertainty in exposure parameters, and spatial variation in heavy metal concentrations, thereby compromising the reliability of risk estimates [72]. In contrast, Monte Carlo simulation incorporates parameter uncertainties by assigning appropriate probability distributions, reduces estimation bias, and enables risk evaluation in probabilistic terms, thus significantly enhancing the robustness and credibility of the assessment.
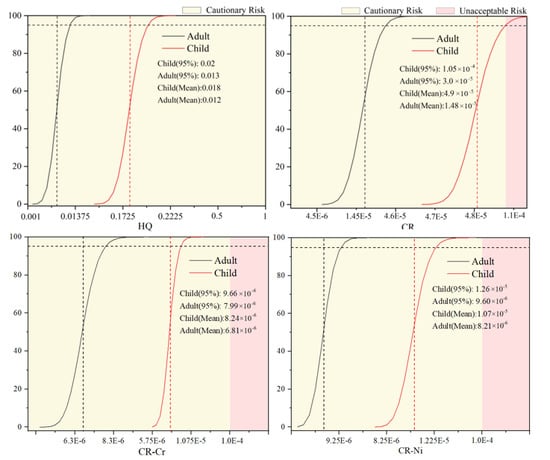
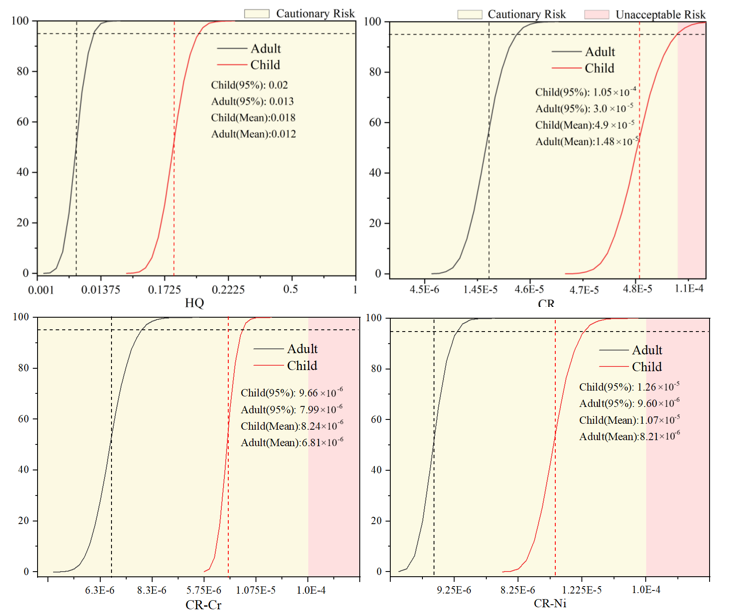
Monte Carlo simulations were performed to assess the risks of heavy metals, with a focus on Ni and Cr. The results show (Figure 11) that the HQ for both adults and children was found to be below the threshold value of 1, suggesting negligible non-carcinogenic risks [73]. Notably, children exhibited a higher susceptibility, with a mean HQ of 0.018—approximately 1.5 times that of adults (0.012). For total carcinogenic risk, both adult and child populations fell within the acceptable range of 1.0 × 10⁻⁶–10−4 at the 95% confidence level. However, for certain individuals among children, the risk exceeded 1.0 × 10⁻⁴ beyond the 95%. Among them, Ni and Cr have relatively high carcinogenic risks for children, approaching the upper limit of 1.0 × 10⁻⁴. These findings align with previous studies identifying Ni and Cr as priority-controlled heavy metals in Chinese soils [74].
Figure 11.
Monte simulation results of non-carcinogenic risk (HQ) and carcinogenic risk (CR) of heavy metals in Monte Carlo, Liaoning Province.
Consistent with prior studies, children face higher health risks than adults, with HQ < 1 and CR within the acceptable 10−6–10−4 range [13,21,22,23,57,60,61]. The identification of Cr and Ni as priority pollutants matches Chen et al.’s [61], and lower Monte Carlo risks validate Peng et al.’s [60] findings on deterministic overestimation. Despite variations in absolute values across studies, the agreement in risk hierarchy, priority pollutants, and model comparisons strongly supports the robustness and reliability of the current health risk assessment.
4. Discussion
4.1. Source Contributions in Province-Wide Farmland Versus Hotspot Studies
Through the EF-PMF model, industrial emissions were identified as the dominant contributor (66.3%), followed by atmospheric deposition (17.3%), agricultural practices (13.5%), and traffic-related sources (2.9%). This ranking differs from Liaoning hotspot studies, where one nearby source usually dominates. Province-wide industrial dominance fits the long history of coal combustion, metallurgy, and equipment manufacturing across the province. The agricultural share is not negligible, and the independent Pb factor (84.92%) shows that farmland receives metals through several regional pathways rather than a single-point source. The pattern supports the expectation that industrial and mining activities dominate Cd and Pb enrichment, while agricultural inputs still matter at the provincial scale.
4.2. Spatial Drivers and the Role of RF Prediction
RF performed best for Cr, Pb, and As (R2 = 0.535, 0.484, and 0.474), while overall performance remained limited (R2 = 0.012–0.535). Cd, Ni, and Zn were poorly predicted, probably because parent-material heterogeneity, irrigation, and fertilizer application operate at scales finer than the 1 km covariates. Cd also had the highest CV (1.62), and Ni and Cr were enriched only locally. The RF maps are therefore better read as relative spatial patterns than as absolute predictions. The agreement between EF-PMF and APCS-MLR in Section 3.3, where both identified four sources and EF-PMF fitted Cd and Pb better, indicates that EF pre-processing improved source identification for the main anthropogenic metals.
4.3. Health Risk Implications and Priority Pollutants
Risks were acceptable for both children and adults but higher for children. Cr and As contributed most to the risk, and Cr and Ni emerged as priority pollutants. Children are more exposed because they ingest more soil and have a lower body weight. Monte Carlo simulation reduced the overestimation typical of deterministic assessment, yet the 95th-percentile carcinogenic risk for children still approached 1.0 × 10⁻⁴ for Ni and Cr. Risk management should therefore prioritize Cr and Ni, while Cd and Pb need source control because of their strong enrichment.
4.4. Methodological Strengths, Limitations, and Future Work
The parallel use of EF-PMF and APCS-MLR, RF-based spatial extension, and Monte Carlo risk estimation are the main methodological strengths. Limitations remain. Sampling density was low (168 samples over ~145,000 km2, about 1.2 per 1000 km2), although stratification and RF covariates partly compensate. The 168 sites (~1.2 per 1000 km2; ~29 km spacing) were designed for regional-scale source apportionment and risk screening. Finer-scale mapping, particularly in heterogeneous or hotspot areas, would benefit from denser networks.
5. Conclusions
This study integrates EF-PMF and APCS-MLR models to systematically apportion sources, assess spatial distribution, and analyze the health risks of heavy metals in Liaoning farmland soils, Northeast China. Key findings include the following:
- (1)
- Cd, Pb, Cr, Ni, Zn, and Cu are enriched among the eight target metals in farmland soils of Liaoning Province, with Cd and Pb showing the highest enrichment (EF: 2.51 and 4.50, respectively). Spatially, high concentrations are mainly distributed in mining areas of the southern Liaoning (Liaoyang, Anshan) and western (Huludao, Chaoyang) regions.
- (2)
- Source apportionment using EF-PMF identified four sources: industrial activities (66.3%), atmospheric deposition (17.3%), agricultural activities (13.5%), and traffic emissions (2.9%). The EF-PMF model outperformed APCS-MLR in fitting key pollutants (Cd, Pb) and produced more plausible source-contribution estimates. This integration reduced single-model uncertainty in source identification and, combined with RF prediction, improved the spatial characterization of heavy metal pollution.
- (3)
- Health risk assessment indicates acceptable non-carcinogenic and carcinogenic risks for both children and adults. However, children face higher risks than adults, with Cr and As being the most significant contributors. Monte Carlo simulation confirmed that Cr and Ni are priority pollutants requiring control.
This study has limitations: single-season, single-depth sampling overlooks seasonal dynamics and vertical migration, and moderate density restricts fine-scale mapping. Future work should adopt multi-depth/season monitoring and denser hotspot sampling. Operationally, we recommend prioritizing Cr/Ni emission controls in southern and western industrial clusters, enforcing stricter fertilizer and wastewater standards to mitigate Cd/Pb inputs, and implementing child-focused risk prevention to reduce soil ingestion.
In summary, priority should be given to controlling Cr and Ni due to their health risks, while Cd and Pb require targeted source control owing to their significant enrichment. The integrated application of multiple source apportionment models is recommended to improve accuracy. Enhanced risk prevention measures should be implemented for vulnerable groups, especially children.
Author Contributions
Y.C.: investigation, validation, formal analysis, writing—original draft, writing—review and editing. J.X.: supervision, project administration, funding acquisition. Y.L.: writing—review and editing. L.S.: supervision. X.W.: writing—review and editing. E.B.: supervision. All authors have read and agreed to the published version of the manuscript.
Funding
This project was supported by the National Natural Science Foundation of China (No. 42576148;42461013), the Strategic Priority Research Program of the Chinese Academy of Sciences (No. XDA28020102), the Scientific Research Foundation of Hainan Tropical Ocean University (No. RHDRC202333), the Project of Changchun City Technology Bureau (No. 16SS06) and the Strategic Research and Consulting Project of Chinese Academy of Engineering (No. JL2024-18). The authors thank the editor for his efforts regarding this paper.
Data Availability Statement
Data will be made available on request.
Conflicts of Interest
The authors declare no conflicts of interest.
References
- Chaudhary, V.; Kumar, M.; Chauhan, C.; Sirohi, U.; Srivastav, A.L.; Rani, L. Strategies for Mitigation of Pesticides from the Environment through Alternative Approaches: A Review of Recent Developments and Future Prospects. J. Environ. Manag. 2024, 354, 120326. [Google Scholar] [CrossRef] [Scilit] [PubMed]
- Kumar, M.; Seth, A.; Singh, A.K.; Rajput, M.S.; Sikandar, M. Remediation Strategies for Heavy Metals Contaminated Ecosystem: A Review. Environ. Sustain. Indic. 2021, 12, 100155. [Google Scholar] [CrossRef] [Scilit]
- Rezapour, S.; Siavash Moghaddam, S.; Nouri, A.; Khosravi Aqdam, K. Urbanization Influences the Distribution, Enrichment, and Ecological Health Risk of Heavy Metals in Croplands. Sci. Rep. 2022, 12, 3868. [Google Scholar] [CrossRef] [Scilit] [PubMed]
- Adnan, M.; Xiao, B.; Ali, M.U.; Xiao, P.; Zhao, P.; Wang, H.; Bibi, S. Heavy Metals Pollution from Smelting Activities: A Threat to Soil and Groundwater. Ecotoxicol. Environ. Saf. 2024, 274, 116189. [Google Scholar] [CrossRef] [Scilit] [PubMed]
- Piñón-Balderrama, M.; Hernández-Rodríguez, A.; Noperi-Mosqueda, L.; Vargas-Beltrán, M.; Piñón-Balderrama, C.; Ojeda-Barrios, D.; Piña-Ramírez, F.; Estrada-Beltrán, A. Integrated Fertilization Improves Tomato Productivity, Fruit Quality, and Soil Properties. Agronomy 2026, 16, 1866. [Google Scholar] [CrossRef] [Scilit]
- Shi, T.; Ma, J.; Wu, F.; Ju, T.; Gong, Y.; Zhang, Y.; Wu, X.; Hou, H.; Zhao, L.; Shi, H. Mass Balance-Based Inventory of Heavy Metals Inputs to and Outputs from Agricultural Soils in Zhejiang Province, China. Sci. Total Environ. 2019, 649, 1269–1280. [Google Scholar] [CrossRef] [Scilit] [PubMed]
- Song, W. Temporal Emergence and Slope Dependence of RUSLE-Based Erosion Reduction Associated with Cropland Abandonment in Northeast China’s Black Soil Region. Agronomy 2026, 16, 1881. [Google Scholar] [CrossRef] [Scilit]
- Wang, L.; Liu, R.; Liu, J.; Qi, Y.; Zeng, W.; Cui, B. A Novel Regional-Scale Human Health Risk Assessment Model for Soil Heavy Metal(Loid) Pollution Based on Empirical Bayesian Kriging. Ecotoxicol. Environ. Saf. 2023, 258, 114953. [Google Scholar] [CrossRef] [Scilit] [PubMed]
- Adimalla, N.; Qian, H.; Nandan, M.J.; Hursthouse, A.S. Potentially Toxic Elements (PTEs) Pollution in Surface Soils in a Typical Urban Region of South India: An Application of Health Risk Assessment and Distribution Pattern. Ecotoxicol. Environ. Saf. 2020, 203, 111055. [Google Scholar] [CrossRef] [Scilit] [PubMed]
- Ding, W.Q.; Sawut, R.; Rixit, G.; Xu, M. Combining Random Forest and XGBoost Models for Source Apportionment and Health Risk Assessments of Heavy Metals in Suburban Farmland Soils. Ecotoxicol. Environ. Saf. 2025, 306, 119357. [Google Scholar] [CrossRef] [Scilit] [PubMed]
- Golui, D.; Raza, M.B.; Roy, A.; Mandal, J.; Sahu, A.K.; Ray, P.; Datta, S.P.; Rahman, M.M.; Bezbaruah, A. Arsenic in the Soil-Plant-Human Continuum in Regions of Asia: Exposure and Risk Assessment. Curr. Pollut. Rep. 2023, 9, 760–783. [Google Scholar] [CrossRef] [Scilit]
- He, Z.; Kang, B.; Feng, L.; Yin, Y.; Yang, J.; Liu, G.; Zha, F. Evaluation of Nutrient Spatial Distribution and Heavy Metal Pollution Improvement in Small-Scale Farmland under the Action of Biochar and Microbial Organic Fertilizer. Soil Tillage Res. 2025, 248, 106386. [Google Scholar] [CrossRef] [Scilit]
- Wang, Y.; Guo, G.; Zhang, D.; Lei, M. An Integrated Method for Source Apportionment of Heavy Metal(Loid)s in Agricultural Soils and Model Uncertainty Analysis. Environ. Pollut. 2021, 276, 116666. [Google Scholar] [CrossRef] [Scilit] [PubMed]
- Chen, Y.; Ding, Z.; Yu, T.; Cao, L.; Duan, Y.; Zu, Y.; Li, Z. Accumulation Characteristics of Heavy Metals in Three Wild Rice Species and Adaptation of Root Morphology and Anatomical Structure to Native Soil Heavy Metals in Yunnan. Ecol. Indic. 2024, 167, 112601. [Google Scholar] [CrossRef] [Scilit]
- Feng, J.; Sun, J.; Xu, J.; Wang, H. Degradation of Acetochlor in Soil by Adding Organic Fertilizers with Different Conditioners. Soil Tillage Res. 2023, 228, 105651. [Google Scholar] [CrossRef] [Scilit]
- Gadzała, E.; Łuc, J.; Miszczak, R.; Sychta, K.; Urbanová, L.; Farkasová, S.; Pilarska, M.; Sobolewska-Zielińska, J.; Kruczek, M.; Żabicka, J.; et al. Short-Term Cadmium and Lead Exposure in Common Buckwheat: Metal Accumulation, Physiological Responses, and Compositional Changes. Agronomy 2026, 16, 1781. [Google Scholar] [CrossRef] [Scilit]
- Dange, S.; Arumugam, K.; Saraswathi Vijayaraghavalu, S. Geochemical Insights into Heavy Metal Contamination and Health Hazards in Palar River Basin: A Pathway to Sustainable Solutions. Ecol. Indic. 2024, 166, 112568. [Google Scholar] [CrossRef] [Scilit]
- Gong, C.; Wang, S.; Wang, D.; Lu, H.; Dong, H.; Liu, J.; Yan, B.; Wang, L. Ecological and Human Health Risk Assessment of Heavy Metal(Loid)s in Agricultural Soil in Hotbed Chives Hometown of Tangchang, Southwest China. Sci. Rep. 2022, 12, 8563. [Google Scholar] [CrossRef] [Scilit] [PubMed]
- Shil, S.; Singh, U.K. Health Risk Assessment and Spatial Variations of Dissolved Heavy Metals and Metalloids in a Tropical River Basin System. Ecol. Indic. 2019, 106, 105455. [Google Scholar] [CrossRef] [Scilit]
- Zamora-Ledezma, C.; Negrete-Bolagay, D.; Figueroa, F.; Zamora-Ledezma, E.; Ni, M.; Alexis, F.; Guerrero, V.H. Heavy Metal Water Pollution: A Fresh Look about Hazards, Novel and Conventional Remediation Methods. Environ. Technol. Innov. 2021, 22, 101504. [Google Scholar] [CrossRef] [Scilit]
- Abeer, N.; Khan, S.A.; Muhammad, S.; Rasool, A.; Ahmad, I. Health Risk Assessment and Provenance of Arsenic and Heavy Metal in Drinking Water in Islamabad, Pakistan. Environ. Technol. Innov. 2020, 20, 101171. [Google Scholar] [CrossRef] [Scilit]
- Liu, F.; Wang, X.; Dai, S.; Zhou, J.; Liu, D.; Hu, Q.; Wang, W.; Xie, M.; Lu, Y.; Tian, M.; et al. Spatial Variations, Health Risk Assessment, and Source Apportionment of Soil Heavy Metals in the Middle Yellow River Basin of Northern China. J. Geochem. Explor. 2023, 252, 107275. [Google Scholar] [CrossRef] [Scilit]
- Sattar, S.; Jehan, S.; Siddiqui, S. Potentially Toxic Metals in the Petroleum Waste Contaminated Soils Lead to Human and Ecological Risks in Potwar and Kohat Plateau, Pakistan: Application of Multistatistical Approaches. Environ. Technol. Innov. 2021, 22, 101395. [Google Scholar] [CrossRef] [Scilit]
- Fei, X.; Lou, Z.; Xiao, R.; Lv, X.; Christakos, G. Contamination and Health Risk Assessment of Heavy Metal Pollution in Soils Developed from Different Soil Parent Materials. Expo. Health 2023, 15, 395–408. [Google Scholar] [CrossRef] [Scilit]
- Azizi, K.; Ayoubi, S.; Nabiollahi, K.; Garosi, Y.; Gislum, R. Predicting Heavy Metal Contents by Applying Machine Learning Approaches and Environmental Covariates in West of Iran. J. Geochem. Explor. 2022, 233, 106921. [Google Scholar] [CrossRef] [Scilit]
- Liu, J.; Liang, J.; Yuan, X.; Zeng, G.; Yuan, Y.; Wu, H.; Huang, X.; Liu, J.; Hua, S.; Li, F.; et al. An Integrated Model for Assessing Heavy Metal Exposure Risk to Migratory Birds in Wetland Ecosystem: A Case Study in Dongting Lake Wetland, China. Chemosphere 2015, 135, 14–19. [Google Scholar] [CrossRef] [Scilit] [PubMed]
- Chen, S.; Shan, B.; Zheng, F.; Li, Y.; Chen, X.; Lu, Q. Physiological Response States Distinguish Contrasting Zinc-Mediated Cadmium Redistribution Across 44 Rice Cultivars. Agronomy 2026, 16, 1899. [Google Scholar] [CrossRef] [Scilit]
- Huang, Y.; Li, T.; Wu, C.; He, Z.; Japenga, J.; Deng, M.; Yang, X. An Integrated Approach to Assess Heavy Metal Source Apportionment in Peri-Urban Agricultural Soils. J. Hazard. Mater. 2015, 299, 540–549. [Google Scholar] [CrossRef] [Scilit] [PubMed]
- Liu, Y.; Xu, F.; Liu, W.; Liu, X.; Wang, D. Characteristics, Sources, Exposure, and Health Effects of Heavy Metals in Atmospheric Particulate Matter. Curr. Pollut. Rep. 2025, 11, 16. [Google Scholar] [CrossRef] [Scilit]
- Oluwatuyi, O.E.; Ajibade, F.O.; Ajibade, T.F.; Adelodun, B.; Olowoselu, A.S.; Adewumi, J.R.; Akinbile, C.O. Total Concentration, Contamination Status and Distribution of Elements in a Nigerian State Dumpsites Soil. Environ. Sustain. Indic. 2020, 5, 100021. [Google Scholar] [CrossRef] [Scilit]
- Wang, Q.; Xie, Z.; Li, F. Using Ensemble Models to Identify and Apportion Heavy Metal Pollution Sources in Agricultural Soils on a Local Scale. Environ. Pollut. 2015, 206, 227–235. [Google Scholar] [CrossRef] [Scilit] [PubMed]
- Zhao, G.; Ma, Y.; Liu, Y.; Cheng, J.; Wang, X. Source Analysis and Ecological Risk Assessment of Heavy Metals in Farmland Soils around Heavy Metal Industry in Anxin County. Sci. Rep. 2022, 12, 10562. [Google Scholar] [CrossRef] [Scilit] [PubMed]
- Wang, H.; Xu, J.; Liu, Y.; Sheng, L. Preparation of Ceramsite from Municipal Sludge and Its Application in Water Treatment: A Review. J. Environ. Manag. 2021, 287, 112374. [Google Scholar] [CrossRef] [Scilit] [PubMed]
- Barjoee, S.S.; Azizi, M.; Yazdani, M.; Alikhani, E.; Khaledi, A. Emission Source Apportionment of the Road Dust-Bound Trace and Major Elements in Najafabad to the West of Isfahan Megacity (Iran) Based on Multivariate Receptor-Oriented Source Models of PMF, PCFA and UNMIX. Environ. Dev. Sustain. 2023, 26, 10333–10366. [Google Scholar] [CrossRef] [Scilit]
- Kazapoe, R.W.; Kwayisi, D.; Alidu, S.; Sagoe, S.D.; Umaru, A.O.; Amuah, E.E.Y.; Addai, M.O.; Fynn, O.F. Advanced Analysis of Soil Pollution in Southwestern Ghana Using Variational Autoencoders (VAE) and Positive Matrix Factorization (PMF). Environ. Sustain. Indic. 2025, 26, 100627. [Google Scholar] [CrossRef] [Scilit]
- In Kim, K.; Khan, A.; Ali, A. APCS–MLR-Based Source and Ecological Risk Assessment of Potentially Toxic Elements in Farmland Soils of Republic of Korea. Appl. Soil Ecol. 2026, 217, 106635. [Google Scholar] [CrossRef] [Scilit]
- Li, Z.; Gong, C.; Ai, X.; Liu, X.; Zhao, X.; Liu, J. Distribution Characteristics and Pollution Assessment of Heavy Metals in Typical Black Soil Profiles of Haicheng City, Liaoning Province, China. PLoS ONE 2025, 20, e0314105. [Google Scholar] [CrossRef] [Scilit] [PubMed]
- Li, X.; Liu, L.; Wang, Y.; Luo, G.; Chen, X.; Yang, X.; Hall, M.H.P.; Guo, R.; Wang, H.; Cui, J.; et al. Heavy Metal Contamination of Urban Soil in an Old Industrial City (Shenyang) in Northeast China. Geoderma 2013, 192, 50–58. [Google Scholar] [CrossRef] [Scilit]
- Sun, P.; Chen, Y.; Wang, X.; Zhou, Z.; Zhu, X.; Sun, S.; Xu, J. Quantification of an Integrated Approach to Heavy Metal Source Apportionment and Probabilistic Health Risk Assessment in the Black Soil Region of Central Jilin Province, China. Ecotoxicol. Environ. Saf. 2025, 299, 118358. [Google Scholar] [CrossRef] [Scilit] [PubMed]
- Yang, S.; Qu, Y.; Ma, J.; Liu, L.; Wu, H.; Liu, Q.; Gong, Y.; Chen, Y.; Wu, Y. Comparison of the Concentrations, Sources, and Distributions of Heavy Metal(Loid)s in Agricultural Soils of Two Provinces in the Yangtze River Delta, China. Environ. Pollut. 2020, 264, 114688. [Google Scholar] [CrossRef] [Scilit] [PubMed]
- Zoller, W.H.; Gladney, E.S.; Duce, R.A. Atmospheric Concentrations and Sources of Trace Metals at the South Pole. Science 1974, 183, 198–200. [Google Scholar] [CrossRef] [Scilit] [PubMed]
- Paatero, P.; Tapper, U. Positive Matrix Factorization: A Non-negative Factor Model with Optimal Utilization of Error Estimates of Data Values. Environmetrics 1994, 5, 111–126. [Google Scholar] [CrossRef] [Scilit]
- Chai, L.; Wang, Y.; Wang, X.; Ma, L. Quantitative Source Apportionment of Heavy Metals in Cultivated Soil and Associated Model Uncertainty. Ecotoxicol. Environ. Saf. 2021, 215, 112150. [Google Scholar] [CrossRef] [Scilit]
- Yu, D.; Deng, J.; Jiang, Q.; Liu, H.; Yu, C.; Ma, H.; Pu, S. Evaluation of Groundwater Quality with Multi-Source Pollution Based on Source Identification and Health Risks. Sci. Total Environ. 2024, 949, 175064. [Google Scholar] [CrossRef] [Scilit] [PubMed]
- Jain, S.; Sharma, S.K.; Mandal, T.K.; Saxena, M. Source Apportionment of PM10 in Delhi, India Using PCA/APCS, UNMIX and PMF. Particuology 2018, 37, 107–118. [Google Scholar] [CrossRef] [Scilit]
- Che, T.; Deng, B.; Hu, N.; Wu, M.; Yu, H.; Yue, J.; Wang, Q. Spatiotemporal Evolution and Ecological Risk Assessment of Heavy Metals in Agricultural Black Soils of Northeast China. Environ. Res. 2026, 301, 124567. [Google Scholar] [CrossRef] [Scilit] [PubMed]
- Zhang, T.; Wang, P.; Wang, M.; Liu, J.; Gong, L.; Xia, S. Spatial Distribution, Source Identification, and Risk Assessment of Heavy Metals in Riparian Soils of the Tibetan Plateau. Environ. Res. 2023, 237, 116977. [Google Scholar] [CrossRef] [Scilit] [PubMed]
- Doabi, S.A.; Karami, M.; Afyuni, M.; Yeganeh, M. Pollution and Health Risk Assessment of Heavy Metals in Agricultural Soil, Atmospheric Dust and Major Food Crops in Kermanshah Province, Iran. Ecotoxicol. Environ. Saf. 2018, 163, 153–164. [Google Scholar] [CrossRef] [Scilit] [PubMed]
- Chen, J.; Zhang, W.; Peng, Y.; Wang, J.; Wu, M. Machine Learning Prediction of the Heavy Metal Concentration in Soil. J. Soils Sediments 2025, 25, 3369–3380. [Google Scholar] [CrossRef] [Scilit]
- Sermlao, P.; Pannucharoewong, N.; Rattanadecho, P.; Boontatao, P. Effects of Waveform Design on Heat Transfer, Thermal Confinement, and Tissue Damage in Laser Interstitial Thermal Therapy (LITT) for Breast Tumors. Results Eng. 2026, 30, 110952. [Google Scholar] [CrossRef] [Scilit]
- Qing, X.; Yutong, Z.; Shenggao, L. Assessment of Heavy Metal Pollution and Human Health Risk in Urban Soils of Steel Industrial City (Anshan), Liaoning, Northeast China. Ecotoxicol. Environ. Saf. 2015, 120, 377–385. [Google Scholar] [CrossRef] [Scilit] [PubMed]
- Ma, J.; Chen, L.; Chen, H.; Wu, D.; Ye, Z. Spatial distribution, sources, and risk assessment of potentially toxic elements in cultivated soils using isotopic tracing techniques and Monte Carlo simulation. Ecotoxicol. Environ. saf. 2023, 259, 115044. [Google Scholar] [CrossRef] [Scilit]
- Ergin, M.; Saydam, C.; Baştürk, Ö.; Erdem, E.; Yörük, R. Heavy Metal Concentrations in Surface Sediments from the Two Coastal Inlets (Golden Horn Estuary and İzmit Bay) of the Northeastern Sea of Marmara. Chem. Geol. 1991, 91, 269–285. [Google Scholar] [CrossRef] [Scilit]
- Bi, Z.; Sun, J.; Xie, Y.; Gu, Y.; Zhang, H.; Zheng, B.; Ou, R.; Liu, G.; Li, L.; Peng, X.; et al. Machine Learning-Driven Source Identification and Ecological Risk Prediction of Heavy Metal Pollution in Cultivated Soils. J. Hazard. Mater. 2024, 476, 135109. [Google Scholar] [CrossRef] [Scilit] [PubMed]
- Yalcin, M.G.; Battaloglu, R.; Ilhan, S. Heavy Metal Sources in Sultan Marsh and Its Neighborhood, Kayseri, Turkey. Environ. Geol. 2007, 53, 399–415. [Google Scholar] [CrossRef] [Scilit]
- An, J.; Huo, A.; Tian, Y.; Liu, Q.; Zha, X. Source-Oriented Probabilistic Health Risk Assessment of Surface Water Potentially Toxic Elements and Essential Trace Elements in the Tethyan-Himalayan Tectonic Domain. Water Res. 2026, 289, 124802. [Google Scholar] [CrossRef] [Scilit] [PubMed]
- Xiao, L.; Feng, P.; Liang, Y.; Xia, B.; Ye, Y.; Liu, H.; Zhao, W.; Li, Z.; Cheng, K.; Chen, J. A Machine Learning Framework Bridging Heavy Metal Contamination and Human Health Risks in Agricultural Soils of the Yangtze River Delta (2001–2030). J. Hazard. Mater. 2026, 505, 141527. [Google Scholar] [CrossRef] [Scilit] [PubMed]
- Nematollahi, M.J.; Dehdaran, S.; Moore, F. Correction to: Potentially Toxic Elements and Polycyclic Aromatic Hydrocarbons in Street Dust of Yazd, a Central Capital City in Iran: Contamination Level, Source Identification, and Ecological–Health Risk Assessment. Environ. Geochem. Health 2021, 43, 2203. [Google Scholar] [CrossRef] [Scilit] [PubMed]
- Yun, S.-W.; Baveye, P.C.; Kim, K.-B.; Kang, D.-H.; Lee, S.-Y.; Son, J.; Kim, D.-H.; Yoon, Y.-C.; Yu, C. Effect of Postmining Land Use on the Spatial Distribution of Metal(Loid)s and Their Transport in Agricultural Soils: Analysis of a Case Study of Chungyang, South Korea. J. Geochem. Explor. 2016, 170, 157–166. [Google Scholar] [CrossRef] [Scilit]
- Sun, L.; Guo, D.; Liu, K.; Meng, H.; Zheng, Y.; Yuan, F.; Zhu, G. Levels, Sources, and Spatial Distribution of Heavy Metals in Soils from a Typical Coal Industrial City of Tangshan, China. Catena 2019, 175, 101–109. [Google Scholar] [CrossRef] [Scilit]
- Hossain Bhuiyan, M.A.; Chandra Karmaker, S.; Bodrud-Doza, M.; Rakib, M.A.; Saha, B.B. Enrichment, Sources and Ecological Risk Mapping of Heavy Metals in Agricultural Soils of Dhaka District Employing SOM, PMF and GIS Methods. Chemosphere 2021, 263, 128339. [Google Scholar] [CrossRef] [Scilit] [PubMed]
- Diakite, M.L.; Hu, Y.; Cheng, H. Source Apportionment Based on the Comparative Approach of Two Receptor Models in a Large-Scale Region in China. Environ. Sci. Pollut. Res. 2021, 28, 56696–56710. [Google Scholar] [CrossRef] [Scilit] [PubMed]
- Luo, L.; Ma, Y.; Zhang, S.; Wei, D.; Zhu, Y.-G. An Inventory of Trace Element Inputs to Agricultural Soils in China. J. Environ. Manag. 2009, 90, 2524–2530. [Google Scholar] [CrossRef] [Scilit] [PubMed]
- Wen, Y.; Wang, Y.; Ji, W.; Wu, S.; Gong, Y.; Meng, X. Pollution Levels and Associated Health Risks of Heavy Metals in Agricultural Soils in Zhenjiang and Yangzhou, China. Agriculture. 2024, 14, 2552. [Google Scholar] [CrossRef] [Scilit]
- Abbas, S.T.; Sarfraz, M.; Mehdi, S.M.; Hassan, G. Obaid-Ur-Rehman Trace Elements Accumulation in Soil and Rice Plants Irrigated with the Contaminated Water. Soil Tillage Res. 2007, 94, 503–509. [Google Scholar] [CrossRef] [Scilit]
- Guangbin, Z.; Kaifu, S.; Xi, M.; Qiong, H.; Jing, M.; Hua, G.; Yao, Z.; Keith, P.; Xiaoyuan, Y.; Hua, X. Nitrous Oxide Emissions, Ammonia Volatilization, and Grain-Heavy Metal Levels during the Wheat Season: Effect of Partial Organic Substitution for Chemical Fertilizer. Agric. Ecosyst. Environ. 2021, 311, 107340. [Google Scholar] [CrossRef] [Scilit]
- Xu, X.; Zhao, Y.; Zhao, X.; Wang, Y.; Deng, W. Sources of Heavy Metal Pollution in Agricultural Soils of a Rapidly Industrializing Area in the Yangtze Delta of China. Ecotoxicol. Environ. Saf. 2014, 108, 161–167. [Google Scholar] [CrossRef] [Scilit] [PubMed]
- Guo, G.; Zhang, D.; Wang, Y. Probabilistic Human Health Risk Assessment of Heavy Metal Intake via Vegetable Consumption around Pb/Zn Smelters in Southwest China. Int. J. Environ. Res. Public Health 2019, 16, 3267. [Google Scholar] [CrossRef] [Scilit] [PubMed]
- Amjad, M.; Khan, Z.I.; Nadeem, M.; Ahmad, K.; Shah, A.A.; Gatasheh, M.K.; Shaffique, S.; Abbas, T. Accumulation and Translocation of Lead in Vegetables through Intensive Use of Organic Manure and Mineral Fertilizers with Wastewater. Sci. Rep. 2024, 14, 12641. [Google Scholar] [CrossRef] [Scilit] [PubMed]
- Xia, X.; Yang, Z.; Cui, Y.; Li, Y.; Hou, Q.; Yu, T. Soil Heavy Metal Concentrations and Their Typical Input and Output Fluxes on the Southern Song-Nen Plain, Heilongjiang Province, China. J. Geochem. Explor. 2014, 139, 85–96. [Google Scholar] [CrossRef] [Scilit]
- Liang, Y.; Yi, X.; Dang, Z.; Wang, Q.; Luo, H.; Tang, J. Heavy Metal Contamination and Health Risk Assessment in the Vicinity of a Tailing Pond in Guangdong, China. Int. J. Environ. Res. Public Health 2017, 14, 1557. [Google Scholar] [CrossRef] [Scilit] [PubMed]
- Peng, C.; Cai, Y.; Wang, T.; Xiao, R.; Chen, W. Regional Probabilistic Risk Assessment of Heavy Metals in Different Environmental Media and Land Uses: An Urbanization-Affected Drinking Water Supply Area. Sci. Rep. 2016, 6, 37084. [Google Scholar] [CrossRef] [Scilit] [PubMed]
- Zhao, X.; Hou, K.; Zhu, Y.; Li, X.; Liu, Z.; Zhu, X.; Mei, R.; Zhang, L.; Li, X. A Novel LEC Framework Incorporating Source Resolution: Spatiotemporal Evolution and Multi-Scenario Prediction of Soil Heavy Metal Risks. J. Environ. Chem. Eng. 2026, 14, 124825. [Google Scholar] [CrossRef] [Scilit]
- Chen, H.; Teng, Y.; Lu, S.; Wang, Y.; Wang, J. Contamination Features and Health Risk of Soil Heavy Metals in China. Sci. Total Environ. 2015, 512–513, 143–153. [Google Scholar] [CrossRef] [Scilit] [PubMed]

Disclaimer/Publisher’s Note: The statements, opinions and data contained in all publications are solely those of the individual author(s) and contributor(s) and not of MDPI and/or the editor(s). MDPI and/or the editor(s) disclaim responsibility for any injury to people or property resulting from any ideas, methods, instructions or products referred to in the content. |
© 2026 by the authors. Licensee MDPI, Basel, Switzerland. This article is an open access article distributed under the terms and conditions of the Creative Commons Attribution (CC BY) license.