


Abstract
Cold stress limits alfalfa (Medicago sativa L.) production, yet the physiological and transcriptional differences associated with contrasting cultivar tolerance remain incompletely understood. Here, a cold-sensitive cultivar (CS) and a cold-tolerant cultivar (CT) were compared using physiological, biochemical, and transcriptomic analyses. Following cold acclimation, CT exhibited a significantly higher freezing survival rate than CS (91.67% vs. 4.17%, p < 0.05) and significantly lower electrolyte leakage (p < 0.05). After 7 d at 4 °C, CT had significantly lower malondialdehyde content and higher proline content, antioxidant enzyme activities, chlorophyll content, and PSII photochemical efficiency than CS (p < 0.05), together with weaker ROS-associated staining. RNA-seq identified 711 and 8763 differentially expressed genes in CS after 2 and 26 h of cold treatment, respectively, compared with 663 and 12,009 in CT. These genes were associated with photosynthesis, carbohydrate and energy metabolism, antioxidant processes, membrane lipid metabolism, hormone signaling, and transcriptional regulation. Cultivar-by-time interaction analysis identified 188 and 226 genes whose expression changes differed significantly between cultivars at 2 and 26 h, respectively (adjusted p < 0.05). These findings reveal cultivar-dependent transcriptional trajectories during cold exposure alongside contrasting physiological responses and provide candidate genes for investigating cold tolerance in alfalfa.
1. Introduction
Alfalfa (Medicago sativa L.) is one of the most important perennial forage legumes worldwide and is cultivated in more than 80 countries on approximately 30–35 million hectares, making it a key high-protein forage crop for livestock production [1]. Its high biomass yield, excellent forage quality, broad adaptability, and nitrogen-fixing capacity make it valuable for animal husbandry and sustainable agricultural systems [2]. However, alfalfa growth, overwintering ability, and stand persistence are frequently constrained by cold stress, particularly in temperate and high-latitude regions [3]. Cold stress can reduce seedling establishment, weaken winter survival, decrease forage yield, and shorten stand longevity [4]. Therefore, improving cold tolerance remains an important goal in alfalfa breeding.
Cold stress is a major abiotic factor that limits plant growth, geographical distribution, and agricultural productivity [5,6]. It can disrupt membrane integrity, induce lipid peroxidation and reactive oxygen species (ROS) accumulation, impair photosynthetic performance, and disturb carbohydrate metabolism, lipid homeostasis, and hormone balance [7,8,9,10,11]. Temperate plants can acquire enhanced freezing tolerance through cold acclimation, a process involving coordinated physiological, biochemical, and transcriptional reprogramming [5,6,12].
Cold tolerance is a complex quantitative trait controlled by multiple genes and regulatory networks. At the molecular level, cold stress is generally perceived through changes in membrane properties and rapidly triggers early signaling events, including calcium signaling, protein phosphorylation, mitogen-activated protein kinase (MAPK) cascades, ROS signaling, and lipid-derived signaling. These signals are transmitted to downstream transcriptional regulators that modulate cold-responsive gene expression [6]. The C-repeat binding factor/dehydration-responsive element-binding protein (CBF/DREB) pathway is one of the best-characterized regulatory modules in cold acclimation [6]. Other transcription factor families, including NAM, ATAF, and CUC (NAC), WRKY, basic leucine zipper (bZIP), basic helix–loop–helix (bHLH), myeloblastosis (MYB), and heat shock factor (HSF), also participate in plant cold stress responses [13].
At the physiological and metabolic levels, plants respond to cold stress by regulating antioxidant defense systems, carbohydrate and energy metabolism, protective metabolite accumulation, and membrane lipid composition [7]. Sugars, glutathione, proline, and polyamines contribute to osmotic adjustment, redox regulation, and cellular protection, whereas membrane lipid remodeling helps maintain membrane fluidity and stability under low-temperature conditions [7,14,15,16,17]. Plant hormones, including abscisic acid (ABA), ethylene, jasmonic acid (JA), gibberellin (GA), brassinosteroid (BR), cytokinin (CK), and auxin/indole-3-acetic acid (IAA), further coordinate the balance between stress defense and growth regulation [18,19,20].
Recent studies in alfalfa have identified several loci, pathways, and functional genes associated with cold tolerance. Quantitative trait locus (QTL) mapping has revealed genomic regions linked to freezing tolerance, while transcriptomic analyses have identified cold-responsive pathways involving calcium signaling, CBF/DREB regulation, antioxidant defense, carbohydrate metabolism, photosynthesis, lipid metabolism, and hormone signaling [21,22,23]. Functional studies further showed that MsCML10 and MsCML50 link Ca2+ signaling with ROS scavenging and carbohydrate metabolism, while MsLHY and MsCBF4 participate in the regulation of the ICE-CBF-COR pathway [24,25,26,27]. Nevertheless, many cold-responsive genes and regulatory modules associated with alfalfa cold tolerance remain unexplored. In particular, the physiological and transcriptomic differences underlying the contrasting cold responses of tolerant and sensitive alfalfa cultivars are not fully understood. In the present study, a cold-sensitive alfalfa cultivar (CS) and a cold-tolerant cultivar (CT) were used to compare cold stress responses at physiological, biochemical, and transcriptomic levels. Freezing tolerance was evaluated following cold acclimation at 4 °C for 7 d and subsequent exposure to subzero temperatures. Electrolyte leakage was measured at 0, −2, −4, −6, and −8 °C to assess freezing-induced membrane damage in cold-acclimated and non-acclimated plants. Physiological and biochemical analyses were conducted using leaf samples collected at 0, 3, and 7 d of cold treatment to evaluate changes in membrane integrity, osmotic adjustment, antioxidant defense, and photosynthetic performance during cold acclimation. RNA-seq analysis was performed using leaf samples collected at 0, 2, and 26 h of cold treatment at 4 °C to identify cold-responsive differentially expressed genes (DEGs) and regulatory pathways in the two cultivars. Together, these analyses aimed to elucidate the physiological and molecular differences underlying the contrasting cold tolerance of the two alfalfa cultivars.
2. Materials and Methods
2.1. Plant Materials, Growth Conditions and Cold Treatments
The cold-tolerant alfalfa cultivar ‘Spyder’ (CT) and the cold-sensitive cultivar ‘Sardi 10’ (CS) were used in this study. Seeds of both cultivars were purchased from Clover Company. Seeds were germinated on moistened qualitative filter paper and then transplanted into 20 cm-diameter pots containing a peat:vermiculite:perlite mixture (3:2:1, v/v/v). This substrate was prepared to provide a balance of water retention, nutrient-holding capacity, aeration, and drainage, with peat and vermiculite contributing mainly to moisture retention and perlite improving substrate porosity and aeration. Plants were grown in a greenhouse at approximately 25 °C under natural light conditions, with a 16 h light/8 h dark photoperiod and a relative humidity of approximately 65%. At seven weeks of age, the plants were transferred to a temperature-controlled incubator for a week before cold and freezing treatments. The incubator was maintained at 4 °C for cold-acclimated (CA) or 24 °C for non-acclimated (NA) treatments, with a light intensity of 700 μmol photons m−2 s−1, a 16 h light/8 h dark photoperiod, and a relative humidity of 65%.
2.2. Evaluation of Freezing Tolerance
Freezing tolerance was evaluated using electrolyte leakage and survival assays. For electrolyte leakage measurements, eight-week-old plants with CA and NA treatments above were used. Whole leaves were collected from these plants and placed in pre-chilled glass tubes. For each cultivar, acclimation treatment (NA or CA), and freezing temperature (0, −2, −4, −6, or −8 °C), six replicate tubes were prepared, each containing three intact leaves. The tubes were then incubated on ice for 1 h. Each tube was considered one replicate for electrolyte leakage measurements (n = 6). After ice was added on the top of leaf discs, the tubes were subjected to programmed freezing in a programmable freezer (Polystat cc1 & k6; Huber Unit, Offenburg, Germany) and were allowed to equilibrate for an additional hour at 0 °C. The temperature was decreased at a rate of 2 °C h−1 to the designated freezing temperatures (−2, −4, −6, and −8 °C), with a 1 h stabilization period at each target temperature. Tubes were removed at 0, −2, −4, −6, and −8 °C after stabilization and then kept at 4 °C overnight, followed by the addition of 15 mL deionized water in each tube. After shaking for 1 h, the initial electrical conductivity (C1) of the solution was measured using a conductivity meter (DDS-307A; INESA, Shanghai, China). The tubes were then placed in boiling water for 30 min to release the remaining electrolytes. After cooling to room temperature, the final electrical conductivity (C2) was measured. Relative electrolyte conductivity (REC) was calculated as follows: REC (%) = (C1/C2) × 100 [26,27]. For each treatment, and each cultivar, six tubes were prepared, each containing three independently collected leaves. The entire experiment was independently repeated three times under the same experimental conditions. For measurement of survival rate, Eight-week-old plants in the pot with CA treatments were placed in the incubator with temperatures decreasing from 24 °C to −8 °C linearly within 6 h and maintained for about 6 h. After freezing treatment, plants were recovered at 4 °C in darkness for 10 h and then transferred to greenhouse conditions. The surviving seedlings were counted to calculate survival rate after 7 d of recovery [26,27,28]. The experiment consisted of three replicate groups, each containing 20 plants.
2.3. Determination of Physiological and Biochemical Parameters
Eight-week-old plants were exposed to 4 °C in an incubator for cold treatment. Fresh mature leaf tissues were collected at 0, 3, and 7 d after the start of treatment for physiological and biochemical analyses. Samples collected at 0 d served as controls. Three biological replicates were established for each cultivar at each sampling time point (0, 3, and 7 d). Each biological replicate consisted of pooled leaf tissues collected from three individual plants. MDA content was measured using the thiobarbituric acid (TBA) method as described by Geng et al. [28]. Fresh leaves (0.5 g) were ground in a mortar with a pestle in 5 mL of 5% (w/v) trichloroacetic acid (TCA). After centrifugation at 10,000× g for 10 min, the supernatant was collected. A 2 mL aliquot of the supernatant was mixed with 2 mL of 0.6% (w/v) TBA, and the mixture was incubated in a boiling water bath for 15 min. Subsequently, the mixture was cooled to room temperature and centrifuged at 10,000× g for 10 min. The absorbance was measured at 535 and 600 nm using a UV-1800 spectrophotometer (Shimadzu Instrument (Suzhou) Co., Ltd., Suzhou, China), and the MDA concentration was calculated using an extinction coefficient of 156 mM−1 cm−1. Free proline content was determined using the acid ninhydrin colorimetric method. Fresh leaves (0.5 g) were ground in 5 mL of 3% (w/v) sulfosalicylic acid, and the homogenate was centrifuged at 15,000 rpm for 10 min at 4 °C. An aliquot (250 μL) of the supernatant was mixed with 750 μL of 3% (w/v) sulfosalicylic acid, 1 mL of 2.5% (w/v) ninhydrin solution, and 1 mL of glacial acetic acid. The reaction mixture was incubated in boiling water for 15 min and then cooled to room temperature. Absorbance was measured at 520 nm using the UV-1800 spectrophotometer, and proline content was calculated using an L-proline standard curve. ROS accumulation was visualized by histochemical staining. Detached leaves were incubated in 1 mg mL−1 diaminobenzidine (DAB) solution for 1 h to detect H2O2 accumulation or in 1 mg mL−1 nitroblue tetrazolium (NBT) solution for 12 h to detect O2− accumulation. All staining procedures were performed in darkness. After staining, chlorophyll was removed using 95% ethanol, and the leaves were photographed. For antioxidant enzyme activity assays, fresh leaves (0.2 g) were ground into a fine powder in liquid nitrogen and homogenized in 1 mL of 50 mM phosphate buffer (pH 7.8). The homogenate was centrifuged at 15,000× g for 10 min at 4 °C, and the supernatant was collected for enzyme activity assays. SOD activity was determined based on the inhibition of the photochemical reduction in nitroblue tetrazolium chloride (NBT), and one unit of SOD activity was defined as the amount of enzyme required to inhibit NBT reduction by 50%. APX activity was determined by measuring the decrease in absorbance at 290 nm due to ascorbate oxidation, and one unit of APX activity was defined as the amount of enzyme required to oxidize 1 μmol ascorbate per min using an extinction coefficient of 2.8 mM−1 cm−1 [28]. GR activity was measured by monitoring the decrease in absorbance at 340 nm due to NADPH oxidation in the presence of oxidized glutathione. One unit of GR activity was defined as the amount of enzyme required to oxidize 1 μmol NADPH per min. Photosynthetic pigment contents were determined using the acetone extraction method. Absorbance was measured at 445.5, 640, and 662 nm using the same spectrophotometer above. The maximum photochemical efficiency of photosystem II (Fv/Fm) was determined after 7 d of cold treatment using a chlorophyll fluorescence imaging system (FluorCam 800MF; Photon Systems Instruments, Brno, Czech Republic).
2.4. RNA-Seq Sampling, Illumina Sequencing, and Transcriptome Analysis
Four-week-old plants of CT and CS were subjected to 4 °C. Fresh leaf tissues were collected for RNA-seq at 0 h (before cold treatment) and after 2 and 26 h of cold treatment at 4 °C. Specifically, the 0 h sample was collected at 10:00 a.m. on the day preceding cold treatment. Cold treatment was initiated at 8:00 a.m. the following day, with samples collected at 10:00 a.m. after 2 h of treatment and again at 10:00 a.m. the next day after 26 h of treatment. Thus, all samples were collected at the same time of day to minimize potential effects of circadian rhythms on gene expression. The 0 h Samples served as untreated controls. Three biological replicates were collected for each cultivar and treatment. Total RNA was extracted using TRIzol reagent (Invitrogen/Thermo Fisher Scientific, Carlsbad, CA, USA) following the manufacturer’s protocol. RNA integrity was verified by 1.5% agarose gel electrophoresis and quantified using a NanoDrop spectrophotometer (Thermo Fisher Scientific, Carlsbad, CA, USA). Strand-specific cDNA libraries were constructed using the NEBNext Ultra II RNA Library Prep Kit (NEB) after poly-A mRNA enrichment. Library quality was assessed using an Agilent 2100 Bioanalyzer, and quantification was performed by qPCR (Kapa Biosystems (Roche, Wilmington, MA, USA)). Sequencing was carried out on a DNBSEQ-T7 platform by BGI Genomics to generate 150 bp paired-end reads. Raw reads were filtered using Trimmomatic v0.39 to remove adapters and low-quality reads. The resulting clean reads were aligned to the reference genome of Medicago sativa cv. ‘XinJiangDaYe” using HISAT2 v2.2.1 [29]. Transcript assembly and abundance estimation were performed using StringTie v2.2.1. Gene expression levels were calculated as fragments per kilobase of transcript per million mapped reads (FPKM). Functional annotation of expressed genes was performed against the NCBI non-redundant (Nr), Swiss-Prot, Kyoto Encyclopedia of Genes and Genomes (KEGG), and Gene Ontology (GO) databases using BLASTX (E-value ≤ 1 × 10⁻⁵). Differentially expressed genes (DEGs) were identified using DESeq2 based on read count data, with thresholds of |log2(Fold Change)| ≥ 2 and false discovery rate (FDR) ≤ 0.05, and GO and KEGG enrichment analyses were performed using clusterProfiler, with p < 0.05 as statistically significant. Transcription factor families were identified based on annotation information from Plant Transcription Factor Database (PlantTFDB) and classified according to their conserved domains and family characteristics. Owing to the autotetraploid nature of alfalfa, multiple homologous copies were identified for some functional genes. All homologous copies were included in differential expression and functional enrichment analyses. For visualization in heatmaps, representative homologs were selected to reduce redundancy and improve readability. Homologs were first filtered based on significant differential expression. When multiple homologs of the same gene met this criterion, the homolog with the highest average expression level across the compared samples was selected. If homologs showed similar expression abundance, the homolog with the larger absolute log2(Fold Change) and an expression pattern consistent with the major trend among homologous copies was chosen. Thus, heatmaps were used to visualize representative expression patterns, whereas all homologous copies were retained for DEG statistics and enrichment analyses. For cultivar-by-time interaction analysis, Raw counts were analyzed using DESeq2 version 1.42.0. Genes with counts ≥10 in at least three samples were retained. Time was treated as a categorical variable, with CS and 0 h as reference levels. The full model (~cultivar + time + cultivar:time) was compared with the reduced model (~cultivar + time) using a likelihood ratio test to assess overall interactions. Wald tests assessed whether expression changes relative to 0 h differed between cultivars at 2 h and 26 h. Default Cook’s distance filtering and independent filtering were retained. Benjamini–Hochberg-adjusted p < 0.05 was considered significant, with adjustment performed separately for each test. Exploratory sensitivity analyses evaluated robustness to expression filtering and replicate consistency. Genes with significant time-specific interactions that remained significant under both sensitivity filters and showed no comparison-relevant replicate-consistency flags were selected for visualization. Heatmaps show DESeq2-estimated within-cultivar log2fold changes relative to 0 h.
2.5. qRT-PCR Validation
Selected DEGs were validated by Reverse transcription-quantitative PCR (qRT-PCR) to assess the consistency of their expression patterns with the RNA-seq results. For qRT-PCR analysis, an independent set of biological samples was collected from both alfalfa cultivars under the same cold treatment conditions (0, 2, and 26 h) as those used for RNA-seq analysis. qRT-PCR was performed using a Thermal Cycler Dice Real Time System II (Takara Bio Inc., Shiga, Japan) with three independent biological replicates. Gene-specific forward and reverse primers for qRT-PCR analysis were designed using Primer Premier 5.0 based on the corresponding gene sequences obtained from the alfalfa reference genome. Each 20 μL reaction mixture contained 10 μL SYBR qPCR Master Mix, 0.4 μM each forward and reverse primer, and 200 ng cDNA template. MsACT7 (MS.gene31004), a member of the actin gene family, was used as the internal reference gene for qRT-PCR analysis. The expression stability of MsACT7 and other candidate reference genes selected with reference to Fan et al. (2025) [30] was evaluated using RNA-seq FPKM values. Expression data from 18 samples representing two cultivars and three cold treatment time points (0, 2, and 26 h) were analyzed using NormFinder. The relatively low NormFinder stability value of MsACT7 supported its suitability as a reference gene under the experimental conditions examined (Table S12). The primer sequences are listed in Table S13. Relative gene expression levels were calculated using the 2−ΔΔCt method, with the untreated cold-sensitive cultivar (CS-0) as the calibrator. For comparison with qRT-PCR results, RNA-seq expression levels were calculated from read counts and expressed as fold changes relative to the mean expression level of CS-0 for each gene. Graphs were generated using SigmaPlot 14.0 software.
2.6. Statistical Analysis
Statistical analyses were performed using SPSS software, version 32.0 (SPSS Inc., Chicago, IL, USA). For the freezing survival assay, differences between the cold-sensitive (CS) and cold-tolerant (CT) cultivars under cold-acclimated (CA) conditions were evaluated using an independent-samples t-test. Relative electrolyte conductivity (REC) data were analyzed using three-way analysis of variance (ANOVA), with cultivar (CS and CT), cold acclimation (NA and CA), and freezing temperature (0, −2, −4, −6, and −8 °C) as fixed factors to evaluate their main effects and all two-way and three-way interactions. Tukey’s honestly significant difference (HSD) test was used for multiple comparisons among all 20 cultivar × acclimation × freezing temperature combinations. For physiological and biochemical parameters, two-way ANOVA was performed with cultivar (CS and CT) and cold treatment duration (0, 3, and 7 d) as fixed factors to assess their main effects and interaction. For Fv/Fm, the analysis included measurements at 0 and 7 d. Tukey’s HSD test was subsequently used for multiple comparisons among all cultivar × treatment combinations within each parameter. Data are presented as means ± standard errors (SE) of independent biological replicates. Different lowercase letters indicate significant differences among treatment combinations within each parameter, with groups sharing at least one letter considered not significantly different. Statistical significance was determined at p < 0.05.
3. Results
3.1. Physiological and Biochemical Responses of Cold-Sensitive and Cold-Tolerant Alfalfa Cultivars to Cold Stress
To characterize physiological differences associated with tolerance, survival rate, REC, MDA content, proline content, ROS accumulation, antioxidant enzyme activities, photosynthetic pigment content, and PSII efficiency were analyzed in CS and CT under cold and freezing stress. Freezing tolerance was first evaluated based on survival rate after freezing treatments. Under cold-acclimated (CA) conditions, CS showed a survival rate of only 4.17%, whereas CT maintained a survival rate of 91.67%, indicating significantly higher freezing tolerance in CT (Figure 1A,B). REC increased progressively with decreasing freezing temperature from 0 to −8 °C in both cultivars under CA and non-acclimated (NA) conditions (Figure 1C). Three-way ANOVA revealed significant main effects of cultivar, cold acclimation, and freezing temperature, as well as significant two-way interactions among these factors (all p < 0.001; Tables S1 and S2). Cold acclimation significantly reduced REC in both cultivars at several freezing temperatures. Under CA conditions, CT exhibited significantly lower REC than CS at −2, −4, −6, and −8 °C (Tukey’s HSD test, p < 0.05; Tables S1 and S2). Notably, at −8 °C, REC was 15.25% in CT compared with 50.63% in CS under CA conditions. These results suggest that cold acclimation alleviated freezing-induced membrane damage, with CT exhibiting better maintenance of membrane integrity than CS.
Figure 1.
Comparison of freezing tolerance between the cold-sensitive (CS) and the cold-tolerant (CT) alfalfa cultivars. (A) Representative phenotypes of CS and CT plants after freezing stress under cold-acclimated (CA) conditions. (B) Survival rates of CS and CT plants after freezing stress under CA conditions. In (B), different lowercase letters indicate significant differencesdetermined by Student’s t-test (p < 0.05). (C) Relative electrolyte conductivity (REC) in leaves of CS and CT plants exposed to different freezing temperatures under CA and non-acclimated (NA) conditions. Data are presented as means ± SE (n = 3 independent biological replicates for survival rates and n = 3–6 for REC). In (C), different lowercase letters indicate significant differences among the 20 cultivar × acclimation × freezing temperature combinations, as determined by Tukey’s honestly significant difference (HSD) test (p < 0.05). Treatment combinations sharing at least one letter are not significantly different. In (B,C), blue represented CS, whereas orange represented CT.
Cold treatment at 4 °C induced significant physiological and biochemical changes in both cultivars (Figure 2). MDA content increased progressively during cold treatment, with a significant genotype × treatment interaction (p < 0.001; Tables S1 and S3). After 7 d, CT exhibited significantly lower MDA content than CS, by 21.2% (Figure 2A). Proline content also increased in both cultivars, with significantly higher levels in CT than in CS after 3 and 7 d of cold treatment (p < 0.05; Figure 2B; Tables S1 and S3). DAB and NBT staining revealed increased ROS-associated staining intensities after 7 d of cold treatment, with stronger signals in CS than in CT (Figure 2C; Figure S1A,B). Antioxidant enzyme activities showed distinct responses: SOD and APX activities decreased, whereas GR activity generally increased during cold treatment. Significant genotype × treatment interactions were detected for SOD, APX, and GR activities (all p < 0.01; Tables S1 and S3). CT maintained significantly higher SOD activity at 3 and 7 d and higher APX and GR activities at 7 d than CS (Figure 2D–F).
Figure 2.
Physiological and photosynthetic responses of cold-sensitive (CS) and cold-tolerant (CT) alfalfa cultivars under cold stress. (A) Malondialdehyde (MDA) content. (B) Proline content. (C) DAB staining for H2O2 and NBT staining for O2− accumulation. (D–F) Activities of superoxide dismutase (SOD), ascorbate peroxidase (APX), and glutathione reductase (GR). (G,H) Contents of chlorophyll a and chlorophyll b. (I) Maximum photochemical efficiency of photosystem II (Fv/Fm). Plants were maintained under control conditions (24 °C) or exposed to 4 °C for 3 or 7 d for physiological and biochemical measurements. ROS staining and Fv/Fm measurements were performed at 0 and 7 d. Data are presented as means ± SE of independent biological replicates (n = 3). Different lowercase letters indicate significant differences among genotype × treatment combinations within each quantitative parameter, as determined by Tukey’s honestly significant difference (HSD) test (p < 0.05). Scale bar = 1 cm (C). Blue represents CS, whereas orange represents CT.
Cold treatment also affected photosynthetic pigment contents and PSII photochemical efficiency. Chlorophyll a and chlorophyll b contents decreased in both cultivars, with significant genotype × treatment interactions (p < 0.05; Tables S1 and S3). After 7 d, CT maintained significantly higher chlorophyll a content than CS, whereas the difference in chlorophyll b content was not significant (Figure 2G,H; Tables S1 and S3). Carotenoid content increased during cold treatment, with no significant genotype × treatment interaction (p = 0.362; Figure S1C; Tables S1 and S3). Similarly, Fv/Fm decreased after 7 d of cold treatment, but the reduction was smaller in CT than in CS (5.6% versus 13.7%; Figure 2I; Figure S1D). Collectively, these results indicate that CT exhibited lower membrane damage, greater proline accumulation, higher antioxidant enzyme activities, and better maintenance of chlorophyll a content and PSII photochemical efficiency during cold treatment, consistent with its greater freezing tolerance.
3.2. Transcriptome Sequencing and Identification of Cold-Responsive DEGs
To investigate the transcriptional responses of CS and CT to cold stress, RNA-seq analysis was performed using leaf samples collected at 0, 2, and 26 h of cold treatment. On average, 45,848,806 raw reads and 45,764,228 clean reads were generated for each sample, with an average clean read rate of 99.81% (Table S4). The Q30 values of all samples exceeded 93%, and the GC content was approximately 43%, indicating high sequencing quality. Approximately 95% of clean reads were mapped to the reference genome, with 82.56% of reads aligned to exon regions (Table S4). Reference-guided transcript annotation and expression quantification were subsequently performed using all 18 RNA-seq samples. In total, 171,187 genes were obtained, including 6555 previously unannotated transcripts (Table S5). Among these genes, 114,352 genes (66.80%) were expressed across all samples, and 69,197–77,261 genes (40.42–45.13%) were detected in individual samples (Table S5). These results indicate that the sequencing data were of high quality and suitable for subsequent transcriptomic analyses.
DEGs were identified by comparing cold-treated samples with their corresponding controls at 0 h. In CS, 711 DEGs, including 488 up-regulated and 223 down-regulated genes, were identified after 2 h of cold treatment, whereas 8763 DEGs, including 5309 up-regulated and 3454 down-regulated genes, were detected after 26 h (Figure S2A). In CT, 663 DEGs, including 392 up-regulated and 271 down-regulated genes, were identified at 2 h, while 12,009 DEGs, including 6544 up-regulated and 5465 down-regulated genes, were detected at 26 h (Figure S2A). These results indicate that cold stress induced substantial transcriptomic changes across multiple pathways in both cultivars, particularly after prolonged exposure. At 26 h, CT exhibited a larger number of cold-responsive DEGs than CS. To further compare cold-responsive transcriptional patterns between CS and CT, Venn diagrams were generated based on the comparisons CS2 vs. CS0, CS26 vs. CS0, CT2 vs. CT0, and CT26 vs. CT0. A total of 260 and 6045 common DEGs were shared between CS and CT at 2 h and 26 h of cold treatment, respectively, representing conserved cold-responsive genes in alfalfa (Figure S2E,F). In addition, numerous genotype-specific DEGs were identified in both cultivars at the two time points, suggesting that genotype-dependent transcriptional regulation may be associated with the contrasting cold responses of CS and CT.
3.3. Differences in Transcriptional Responses Between CT and CS During Cold Exposure
Interaction analysis identified 127 genes with significant overall genotype-by-time interactions. Time-specific tests identified 188 and 226 genes whose expression changes from 0 h differed significantly between CT and CS at 2 h and 26 h, respectively (Benjamini–Hochberg-adjusted p < 0.05; Supplementary Table S6). Among these, 32 and 52 nonredundant candidate genes met the replicate-consistency criteria and remained significant under both sensitivity filters at 2 h and 26 h, respectively. Their within-cultivar expression changes are presented as heatmaps (Figure S3; Supplementary Table S7). Together, these results demonstrate that CT and CS exhibit distinct transcriptional responses during cold exposure, involving differences in the direction and/or magnitude of expression changes.
3.4. GO Enrichment Analysis Indicates Shared and Genotype-Specific Cold-Responsive Processes in CS and CT
To characterize the functional responses associated with cold stress, GO enrichment analysis was performed for DEGs identified in CS and CT at 2 h and 26 h of cold treatment. In the cellular component category, DEGs from both cultivars were significantly enriched in chloroplast- and photosynthesis-related terms, including thylakoid, photosynthetic membrane, photosystem II, and chloroplast components (Tables S8 and S9). Membrane- and cell wall-related terms were also enriched, suggesting that cold stress affected photosynthetic structures and cellular components in both cultivars. At 26 h, additional membrane- and plastid-associated terms were enriched in both CS and CT. Notably, light-harvesting complex, peroxisome, and preribosome were specifically enriched in CT, suggesting genotype-specific enrichment of processes related to light harvesting, ROS-associated organelles, and ribosome-related functions under prolonged cold stress (Table S9).
In the biological process category, both cultivars exhibited enrichment of stress- and metabolism-related processes at 2 h, including responses to abiotic stimulus, osmotic stress, light response, hormone response, carbohydrate metabolism, cell communication, and signal transduction (Table S8). At 26 h, multiple stress-related biological processes, including temperature response, water deprivation response, hormone-mediated signaling, pigment and chlorophyll metabolism, flavonoid metabolism, starch metabolism, lipid metabolism, photosynthetic electron transport, MAPK cascade regulation, and protein phosphorylation, were enriched in both cultivars (Table S9). These results indicate markedly cold-responsive regulation of stress signaling, photosynthesis, metabolism, and cellular protection in alfalfa. Compared with CS, CT exhibited several genotype-specific enriched processes at the early stage of cold stress (2 h), including temperature response, red light response, chlorophyll metabolism, ROS-related processes, flavonoid metabolism, light harvesting, photosynthesis, oxidative stress response, cytokinin metabolism, and protein phosphorylation (Table S8). Together, these results indicate that CS and CT share common cold-responsive processes, while CT shows genotype-dependent DEG-level enrichment of photosynthesis-, ROS-, metabolism-, and signaling-related processes.
3.5. KEGG Enrichment Analysis Indicates Dynamic Pathway Regulation During Cold Stress
To identify pathways associated with cold responses, KEGG enrichment analysis was performed for DEGs detected in CS and CT at 2 h and 26 h of cold treatment. At 2 h, several pathways were commonly enriched in both cultivars, including Photosynthesis, Circadian rhythm-plant, Metabolic pathways, Starch and sucrose metabolism, and Carotenoid biosynthesis (Table S10). These results indicate that cold stress rapidly affected photosynthesis-related processes and carbohydrate metabolism in both cultivars. Notably, Photosynthesis-antenna proteins was specifically enriched in CT (Table S10), suggesting early transcriptional adjustment of light-harvesting-related genes in the cold-tolerant cultivar.
At 26 h, 31 KEGG pathways were significantly enriched in CS and/or CT (Table S11). These pathways were mainly associated with energy metabolism, carbohydrate metabolism, amino acid metabolism, lipid metabolism, secondary metabolite biosynthesis, and signal transduction. Most pathways were shared by both cultivars. Notably, CT generally contained more DEGs in most enriched pathways, whereas Circadian rhythm–plant and Flavonoid biosynthesis showed comparable numbers of DEGs between CS and CT (Table S11). Together, these results indicate that cold stress induced substantial transcriptomic changes in multiple pathways in both cultivars, especially after prolonged exposure. The greater number of DEGs associated with photosynthesis, carbohydrate and energy metabolism, amino acid metabolism, and lipid metabolism in CT may be related to the contrasting cold responses between CS and CT.
3.6. Cold Stress Induces Differential Regulation of Photosynthesis-Related Genes in Alfalfa
To investigate transcriptional changes associated with photosynthetic regulation under cold stress, photosynthesis-related DEGs were analyzed in CS and CT at 2 h and 26 h of cold treatment. At 2 h, 18 and 17 DEGs were enriched in the Photosynthesis pathway in CS and CT, respectively. At 26 h, 47 and 77 DEGs were enriched in the Photosynthesis pathway in CS and CT, respectively (Tables S10 and S11). Cold stress affected multiple photosynthesis-related components. Genes encoding core components of photosystem II (PSII), including psbA, psbB, psbC, PsbO, and PsbQ; photosystem I (PSI), including psaB, PsaD, and PsaE; the cytochrome b6/f complex, including petA, petB, and PetF; and ATP synthase, including beta, were dynamically regulated after cold treatment in both cultivars (Figure 3A,C,D). Notably, many genes encoding LHC proteins, including LHCA and LHCB family members, were down-regulated at 26 h, with a greater number of down-regulated LHC genes detected in CT than in CS (Figure 3B–D). These results suggest that CT showed a greater number of DEGs associated with photosynthesis-related components during cold exposure, particularly genes encoding light-harvesting complex proteins.
Figure 3.
Expression patterns of DEGs involved in photosynthesis and photosynthesis-antenna protein pathways under cold stress. (A) Expression patterns of DEGs involved in photosynthesis and photosynthesis-antenna protein pathways in CS and CT at 2 h of cold treatment. (B) Differential expression significance of genes encoding chlorophyll a/b-binding light-harvesting complex (LHC) proteins in the comparisons CS0 vs. CS26 and CT0 vs. CT26. The color scale represents −log10(p value). (C,D) Expression patterns of DEGs involved in photosynthesis and photosynthesis-antenna protein pathways in CS (C) and CT (D) at 26 h of cold treatment. Red indicates up-regulation and green indicates down-regulation.
3.7. Starch and Sucrose Metabolism-Related Genes Are Remodeled Under Cold Stress
The Starch and sucrose metabolism pathway was affected by cold stress in both cultivars. At 2 h, 14 DEGs were enriched in this pathway in both CS and CT, whereas 82 and 109 DEGs were identified at 26 h in CS and CT, respectively (Tables S10 and S11). Cold stress induced significant changes in genes associated with soluble sugar metabolism. Genes involved in trehalose biosynthesis, including trehalose-phosphate synthase/phosphatase genes (TPS/TPP), were up-regulated at both 2 h and 26 h in CS and CT (Figure 4A,B). Similarly, sucrose synthesis-related genes, including sucrose-phosphate synthase 3 (SPS3) and sucrose synthase 2 (SUS2), showed increased expression under cold stress. In contrast, genes related to sucrose degradation, including alpha-glucosidase (MalZ) and cell wall/vacuolar invertases (CWINV1, CWINV3, and VCINV), were down-regulated at 26 h (Figure 4A,B). Cold stress also affected genes associated with carbohydrate interconversion and cell wall-derived carbon metabolism. Genes encoding β-glucosidases (BGLU11, BGLU12, BGLU18, BGLU44, BGLU46, and BGLU47), glucan endo-1,3-β-glucosidases (GN4 and GN5/6), and endoglucanase (CEL6) exhibited dynamic expression changes under cold treatment (Figure 4A,C). In addition, UTP-glucose-1-phosphate uridylyltransferase 2 (UGP2), which is involved in UDP-glucose formation and carbohydrate interconversion, was induced at 26 h in both CS and CT (Figure 4A,C).
Figure 4.
Expression patterns of DEGs involved in starch and sucrose metabolism under cold stress. (A) Schematic overview of the starch and sucrose metabolism pathway. Node colors indicate transcriptional responses to cold stress: green, down-regulation; red, up-regulation; blue, mixed regulation. (B–D) Heatmaps showing the expression patterns of DEGs involved in sucrose, glucose, and trehalose metabolism (B), cellulose and glucose metabolism (C), and starch metabolism (D) in the comparisons CS0 vs. CS26 and CT0 vs. CT26. The color scale represents log2(Fold Change) values, with blue indicating decreased expression levels and red indicating increased expression levels.
Cold stress also induced transcriptional changes in starch metabolism. The transcript level of starch synthase 3 (SS3) decreased, whereas starch degradation-associated genes, including isoamylase 3 (ISA3), alpha-amylase 3 (AMY3), and beta-amylase genes (BMY1, BAM1, and BAM3), showed increased expression at 26 h in both cultivars (Figure 4A,D). Moreover, genes encoding alpha-glucan phosphorylases (STP-1 and PHS2), which participate in the phosphorolytic degradation of starch and related polysaccharides, were up-regulated at 26 h in both CS and CT (Figure 4A,D). Together, these results indicate that cold stress was associated with substantial transcriptomic changes in starch and sucrose metabolism in alfalfa, including genes related to trehalose and sucrose metabolism, carbohydrate interconversion, and starch degradation. The greater number of carbohydrate metabolism-related DEGs in CT, particularly at 26 h, suggests genotype-dependent transcriptional adjustment of carbohydrate metabolism in the cold-tolerant cultivar, which may contribute to osmotic adjustment and metabolic homeostasis during cold exposure.
3.8. Cold Stress Transcriptionally Remodels Glycolysis, the TCA Cycle, and Amino Acid Metabolism
At 26 h of cold treatment, 77 and 105 DEGs were enriched in the Glycolysis/Gluconeogenesis pathway in CS and CT, respectively, whereas 12 and 29 DEGs were enriched in the Citrate cycle (TCA cycle) pathway, respectively (Table S11). Cold stress induced substantial changes in glycolysis-related genes. Several genes encoding key glycolytic enzymes, including 6-phosphofructokinase 3 (PFK3), fructose-bisphosphate aldolase 5 (FBA5), glyceraldehyde-3-phosphate dehydrogenase C (GAPC), 2,3-bisphosphoglycerate-independent phosphoglycerate mutase 1 (PGM1), 2,3-bisphosphoglycerate 3-phosphatase (MIPP1), enolase (PGH1), and pyruvate kinase (PK), were up-regulated, whereas the gluconeogenesis-related gene fructose-1,6-bisphosphatase (FBP) was down-regulated (Figure 5A,E). Genes associated with phosphoenolpyruvate and pyruvate metabolism also showed differential expression. Phosphoenolpyruvate carboxylase (PEPC) was up-regulated, whereas phosphoenolpyruvate carboxykinase 1 (PEPCK1) was down-regulated, suggesting altered phosphoenolpyruvate conversion under cold stress (Figure 5B,F).
Figure 5.
Expression patterns of DEGs involved in glycolysis/gluconeogenesis, the TCA cycle, glutathione, proline, and polyamine metabolism under cold stress. (A–D) Schematic overview of glycolysis/gluconeogenesis (A), the TCA cycle (B), glutathione metabolism (C), and arginine, proline, and polyamine metabolism (D). Node colors indicate transcriptional responses to cold stress: green, down-regulation; red, up-regulation; blue, mixed regulation. (E–H) Heatmaps showing the expression patterns of DEGs involved in the TCA cycle (E), glycolysis/gluconeogenesis (F), glutathione metabolism (G), and arginine, proline, and polyamine metabolism (H) in the comparisons CS0 vs. CS26 and CT0 vs. CT26. The color scale represents log2(Fold Change) values, with blue indicating decreased expression levels and red indicating increased expression levels.
Cold stress also affected genes associated with mitochondrial carbon metabolism and the TCA cycle. Genes encoding pyruvate dehydrogenase subunits (PDHA and PDHB) and ATP citrate lyase (ACLY), which are associated with acetyl-CoA and citrate metabolism, were down-regulated (Figure 5B,F). In contrast, several TCA cycle-related genes, including malate dehydrogenase 2 (MDH2), isocitrate dehydrogenase 1 (IDH1), and aconitate hydratase (ACO), were up-regulated (Figure 5B,F). Moreover, genes related to amino acid metabolism, including glutamate dehydrogenase 3 (GDH3) and alanine aminotransferase 2 (AlaAT2), were induced (Figure 5B,F). These results suggest coordinated transcriptional regulation of glycolysis, the TCA cycle, and amino acid metabolism under cold stress. In particular, the induction of GDH3 and AlaAT2 may link TCA cycle intermediates and glycolysis-derived pyruvate with glutamate- and alanine-related metabolic adjustment, potentially providing precursors for stress-associated metabolites such as glutathione and proline. Together, these results indicate that cold stress induced transcriptional changes in glycolysis, the TCA cycle, and amino acid metabolism, with more DEGs detected in CT than in CS.
3.9. Cold Stress Transcriptionally Regulates Glutathione, Proline, and Polyamine Metabolism
At 26 h of cold treatment, 67 and 97 DEGs were enriched in Glutathione metabolism in CS and CT, respectively, whereas 38 and 55 DEGs were enriched in Arginine and proline metabolism, respectively (Table S11). In the Glutathione metabolism pathway, genes encoding glutamate-cysteine ligase (GSH1) and glutathione synthetase (GSH2), which catalyze the first and second steps of glutathione biosynthesis, were up-regulated under cold stress (Figure 5C,G). Genes encoding key enzymes involved in glutathione-dependent redox regulation, including glutathione peroxidase (GPX), dehydroascorbate reductase 2 (DHAR2), and glutathione reductase (GR), also showed increased expression. Multiple glutathione S-transferase family genes, including glutathione S-transferase 3 (GST3), tau class glutathione S-transferase GSTU18, phi class glutathione S-transferase GSTF9, and lambda class glutathione S-transferase GSTL3, together with glutathione recycling-related genes encoding gamma-glutamyl transpeptidases (GGTs), were also differentially expressed under cold stress (Figure 5C,G).
Genes involved in arginine and proline metabolism were also extensively regulated. Proline biosynthesis-related genes encoding pyrroline-5-carboxylate synthase (P5CS) and pyrroline-5-carboxylate reductase (PROC/P5CR) showed increased expression after cold treatment (Figure 5D,H). Meanwhile, polyamine metabolism-related genes were differentially expressed, including biosynthesis-related genes encoding arginine decarboxylase 1 (ADC1) and spermidine synthase 1 (SPDS1), as well as catabolism-related genes encoding polyamine oxidases (PAO1, PAO3, and PAO4) (Figure 5D,H). Together, these results indicate that cold stress induced transcriptional changes in glutathione metabolism, proline biosynthesis, and polyamine metabolism.
3.10. Cold Stress Induces Transcriptional Changes in Lipid Metabolism-Related Genes
Glycerolipid metabolism and glycerophospholipid metabolism were extensively regulated in both CS and CT at 26 h of cold treatment. A total of 54 and 72 DEGs were enriched in Glycerolipid metabolism in CS and CT, respectively, while 83 and 100 DEGs were enriched in Glycerophospholipid metabolism, respectively (Table S11). Genes associated with phosphatidic acid (PA) and diacylglycerol (DAG) formation and interconversion were differentially regulated under cold stress. These included lysophosphatidic acid acyltransferase 3 (LPAAT3), phospholipase C (PLC), phospholipase D (PLD), diacylglycerol kinase 2 (DGK2), and phosphatidate phosphatase genes (PAP1 and PAP2) (Figure 6A,C). In addition, phosphatidylglycerophosphate synthase 1 (PGS1), which is involved in phosphatidylglycerol biosynthesis, was up-regulated after cold treatment. These genes were associated with PA/DAG metabolism and phospholipid biosynthesis. In the Glycerophospholipid metabolism pathway, genes involved in phospholipid biosynthesis and turnover also showed marked transcriptional changes. Several genes associated with phosphatidylcholine and phosphatidylethanolamine metabolism were up-regulated under cold stress, including choline/ethanolamine kinase (CHK), choline-phosphate cytidylyltransferase (PCYT1), ethanolamine-phosphate cytidylyltransferase (PCYT2), and lysophosphatidylcholine acyltransferase 1 (LPCAT1) (Figure 6A,D). In contrast, phospholipid hydrolysis- and recycling-related genes, including phospholipase A1 (LCAT3) and glycerophosphoryl diester phosphodiesterase 5 (GDPD5), were down-regulated under cold stress.
Figure 6.
Expression patterns of DEGs involved in lipid metabolism under cold stress. (A,B) Schematic overview of glycerolipid and glycerophospholipid metabolism (A) and chloroplast membrane lipid metabolism (B). Node colors indicate transcriptional responses to cold stress: green, down-regulation; red, up-regulation; blue, mixed regulation. (C–E) Heatmaps showing the expression patterns of DEGs involved in glycerolipid metabolism (C), glycerophospholipid metabolism (D), and chloroplast membrane lipid metabolism (E) in the comparisons CS0 vs. CS26 and CT0 vs. CT26. The color scale represents log2(Fold Change) values, with blue indicating decreased expression levels and red indicating increased expression levels.
Cold stress also affected genes related to chloroplast membrane lipid metabolism. Genes associated with galactolipid and sulfolipid biosynthesis, including monogalactosyldiacylglycerol synthase 2 (MGD2), digalactosyldiacylglycerol synthase 2 (DGD2), sensitive to freezing 2 (SFR2), and sulfoquinovosyl transferase 2 (SQD2), were induced after cold treatment in both CS and CT (Figure 6B,E). Notably, DGD2 and SFR2 showed higher expression levels in CT than in CS (Figure 6E). Together, these results indicate that cold stress induced transcriptional changes in lipid metabolism-related genes, including genes associated with PA/DAG metabolism, phospholipid biosynthesis and turnover, and chloroplast membrane lipid metabolism.
3.11. Cold Stress Modulates Hormone Biosynthesis- and Signaling-Related Genes
Plant hormone signal transduction was enriched in both CS and CT at 26 h of cold treatment, with 127 and 159 DEGs detected in CS and CT, respectively (Table S11). To investigate hormone-related transcriptional regulation under cold stress, DEGs involved in hormone biosynthesis, catabolism, transport, and signal transduction were analyzed at 26 h of cold treatment in CS and CT. In the ABA pathway, several ABA biosynthesis-related genes, including beta-carotene 3-hydroxylase (BCH), zeaxanthin epoxidase (ZEP), violaxanthin de-epoxidase 1 (VDE1), xanthoxin dehydrogenase/short-chain dehydrogenase reductase (ABA2), and abscisic-aldehyde oxidase 3 (AAO3), were down-regulated in both CS and CT. In contrast, 9-cis-epoxycarotenoid dioxygenase 1 (NCED1), a key rate-limiting gene in ABA biosynthesis, was up-regulated (Figure 7A). Genes associated with ABA inactivation and catabolism, including abscisic acid beta-glucosyltransferase (AOG) and abscisic acid 8′-hydroxylase (CYP707A2), were also induced (Figure 7A). In the ABA signaling pathway, genes encoding protein phosphatase 2C members (PP2CA, PP2C06, and PP2C51), SNF1-related protein kinase 2 members (SNPK2), and ABA-responsive element-binding factors (ABF2 and ABF4) were up-regulated, whereas PYR/PYL/RCAR ABA receptor genes (PYL1 and PYL4) showed divergent expression patterns (Figure 7A).
Figure 7.
Expression patterns of DEGs involved in plant hormone biosynthesis and signaling pathways under cold stress. Heatmaps showing the expression patterns of DEGs involved in abscisic acid (ABA) (A), ethylene (B), cytokinin (CK) (C), brassinosteroid (BR) (D), gibberellin (GA) (E), auxin/indole-3-acetic acid (IAA) (F), and jasmonic acid (JA) (G) biosynthesis and signaling pathways in the comparisons CS0 vs. CS26 and CT0 vs. CT26. The color scale represents log2(Fold Change) values, with blue indicating decreased expression levels and red indicating increased expression levels.
Ethylene biosynthesis- and signaling-related genes were also responsive to cold stress. Genes encoding S-adenosylmethionine synthetase (SAMS), 1-aminocyclopropane-1-carboxylate synthase 1 (ACS1), and 1-aminocyclopropane-1-carboxylate oxidase 1 (ACO1) were up-regulated in both cultivars, suggesting enhanced transcriptional regulation of ethylene biosynthesis-related genes under cold stress (Figure 7B). In addition, genes encoding ethylene receptor 1/ethylene response sensor (ETR1/ERS) and ethylene-insensitive 3 (EIN3) were up-regulated, whereas EIN3-binding F-box protein 2 (EBF2) exhibited both up- and down-regulated expression patterns (Figure 7B).
CK, BR, and GA pathway-related genes were generally down-regulated or showed patterns associated with hormone inactivation under cold stress. CK degradation- or inactivation-related genes, including cytokinin dehydrogenase/oxidase genes (CKX1, CKX3, and CKX5) and UDP-glucosyltransferase genes (UGT73C1 and UGT73C5), were up-regulated, whereas cytokinin signaling components, including Arabidopsis histidine kinase 2/4 (AHK2/4), histidine-containing phosphotransfer protein (AHP), and two-component response regulators (type-A ARR and type-B ARR), were down-regulated (Figure 7C). In the BR pathway, genes involved in BR biosynthesis, including constitutive photomorphogenesis and dwarfism/cytochrome P450 90A1 (CPD/CYP90A1) and brassinosteroid 6-oxidase 1/cytochrome P450 85A1 (BR6OX1/CYP85A1), as well as BR signaling genes encoding brassinosteroid insensitive 1 (BRI1), BRI1-associated receptor kinase 1 (BAK1), brassinosteroid-insensitive 2 (BIN2), and brassinazole resistant 2 (BZR2), were down-regulated (Figure 7D). In the GA pathway, biosynthesis-related genes, including ent-kaurene synthase (KS), ent-kaurenoic acid oxidase (KAO), gibberellin 20-oxidase 1 (GA20ox1), and gibberellin 3-oxidase 1 (GA3ox1), were down-regulated, whereas gibberellin 2-oxidase (GA2ox), which is involved in GA deactivation, was up-regulated (Figure 7E). The GA receptor gene gibberellin insensitive dwarf 1 (GID1) was induced, while DELLA protein/gibberellic acid insensitive 1 (DELLA/GAI1) and phytochrome-interacting factor 4 (PIF4) were down-regulated (Figure 7E).
Auxin-related genes showed complex transcriptional regulation. Auxin biosynthesis genes encoding YUCCA flavin-containing monooxygenases (YUC6 and YUC8) and auxin conjugation genes encoding Gretchen Hagen 3 auxin amido synthetases (GH3.1 and GH3.10) were up-regulated in both cultivars (Figure 7F). In contrast, auxin influx carrier genes encoding LIKE AUXIN RESISTANT proteins (LAX1, LAX2, and LAX4) and the auxin receptor gene transport inhibitor response 1 (TIR1) were down-regulated. Auxin-responsive genes, including small auxin up RNA 15 (SAUR15) and Aux/IAA family members, including IAA9, IAA16, AUX22B, and AUX22E, exhibited both up- and down-regulated expression patterns (Figure 7F).
In the JA pathway, genes encoding phospholipase A1 (PLA1) and lipoxygenase 2.1 (LOX2.1) were down-regulated, whereas genes encoding allene oxide synthase (AOS1 and AOS2), 12-oxo-phytodienoic acid reductase 3 (OPR3), acyl-CoA oxidase (ACX1 and ACX4), and acetyl-CoA acyltransferase 1 (PED1) were up-regulated (Figure 7G). However, JA modification- and JA-Ile formation-related genes, including jasmonate O-methyltransferase (JMT) and jasmonic acid-amino synthetase genes (JAR4 and JAR6), were down-regulated. Jasmonate ZIM-domain protein genes (JAZ/TIFY10A and JAZ/TIFY10B) were up-regulated, suggesting transcriptional feedback regulation of JA signaling-related genes (Figure 7G). Overall, cold stress induced transcriptional changes in hormone biosynthesis-, metabolism-, transport-, and signaling-related genes in alfalfa. ABA-, ethylene-, CK-, BR-, GA-, auxin-, and JA-related genes showed distinct expression patterns under cold stress.
3.12. Cold Stress Induces Early Signaling and Transcriptional Regulatory Responses
The MAPK signaling pathway-plant was enriched in both CS and CT at 26 h of cold treatment, with 99 and 110 DEGs detected in CS and CT, respectively (Table S11). Several genes related to calcium signaling and phosphorylation-mediated signaling were significantly regulated after cold treatment. These included genes encoding cyclic nucleotide-gated channels (CNGCs), calmodulin/calmodulin-like proteins (CaM/CMLs), calcineurin B-like proteins (CBLs), CBL-interacting protein kinases (CIPKs), and calcium-dependent protein kinases (CDPKs/CPKs) (Figure 8A). In addition, genes encoding receptor-like kinases (RLKs), mitogen-activated protein kinase kinase kinases (MAPKKKs), mitogen-activated protein kinase kinases (MKKs), and mitogen-activated protein kinases (MPKs) were differentially expressed under cold stress (Figure 8B).
Figure 8.
Expression patterns of DEGs involved in calcium and phosphorylation-mediated signaling under cold stress. (A,B) Heatmaps showing the expression patterns of DEGs involved in calcium signaling (A) and phosphorylation-mediated signaling (B) in the comparisons CS0 vs. CS26 and CT0 vs. CT26. The color scale represents log2(Fold Change) values, with blue indicating decreased expression levels and red indicating higher expression levels.
Transcription factors (TFs) were also analyzed. A total of 62 and 69 cold-responsive TFs were identified in CS and CT at 2 h after cold stress, whereas 233 and 330 cold-responsive TFs were detected at 26 h, respectively (Table 1). These cold-responsive TFs mainly belonged to the APETALA2/ethylene-responsive element-binding protein (AP2/EREBP), NAC, homeodomain-leucine zipper (HD-ZIP), MYB, bHLH, bZIP, HSF, Trihelix, GRAS, Aux/IAA, and WRKY families. The AP2/EREBP family represented the largest group of cold-responsive TFs in alfalfa. Among its subfamilies, the dehydration-responsive element-binding protein (DREB) subfamily showed the most pronounced difference between CS and CT, with more AP2/EREBP-DREB TFs being up-regulated in CT under cold stress, whereas no obvious differences were observed in the other AP2/EREBP subfamilies (Table 1). In addition, more cold-responsive TFs from the NAC, bHLH, MYB, HSF, bZIP, GRAS, C2H2 zinc finger (C2H2), and BRI1-EMS-suppressor 1 (BES1) families were also detected in CT than in CS (Table 1). Together, these results indicate that cold stress induced transcriptional changes in genes associated with calcium signaling, MAPK cascades, phosphorylation-mediated signaling, and multiple TF families in alfalfa. More cold-responsive TFs were detected in CT than in CS, especially AP2/EREBP-DREB members and other TF families potentially involved in cold stress responses.
Table 1.
Distribution of differentially expressed transcription factors in CS and CT at 2 h and 26 h of cold treatment.
3.13. Validation of RNA-Seq Data by qRT-PCR
To further evaluate the reliability of the RNA-seq data, representative DEGs from major cold-responsive pathways, including LHCA1, LHCB5, LHCB7, AlaAT2, GSH2, GST3, DGD2, MGD2, and SQD2, were selected for qRT-PCR validation. The qRT-PCR results showed expression trends generally consistent with the RNA-seq data (Figure S4). These results support the reliability of the transcriptome data and confirm the expression patterns of selected cold-responsive genes under cold stress.
4. Discussion
Alfalfa cultivars exhibit considerable variation in cold tolerance, and comparative physiological, biochemical, and transcriptomic analyses can help identify processes associated with these differences. In this study, the cold-tolerant cultivar (CT) maintained better membrane stability, lower oxidative damage, greater proline accumulation, stronger antioxidant capacity, and more stable photosynthetic performance than the cold-sensitive cultivar (CS) under cold stress. Cultivar-by-time interaction analysis provided direct statistical evidence that expression changes differed between CT and CS during cold exposure. Within-cultivar transcriptomic comparisons identified cold-responsive genes associated with photosynthesis, carbohydrate and energy metabolism, amino acid metabolism, redox and osmotic regulation, lipid metabolism, hormone signaling, Ca2+/MAPK signaling, and transcriptional regulation. Although more DEGs were detected in CT at 26 h, this difference in DEG numbers alone does not establish a stronger transcriptional response. Together, these findings suggest that contrasting cold tolerance is associated with multiple physiological protective processes and distinct transcriptional responses, although the causal contributions of individual pathways and genes remain to be established.
4.1. Antioxidant Capacity and Osmotic Adjustment Are Associated with Reduced Cold-Induced Membrane Damage in CT
Membrane injury is one of the most direct effects of cold stress. REC reflects membrane permeability and cellular injury, whereas MDA is commonly used as an indicator of membrane lipid peroxidation [21]. Cold stress can disrupt redox homeostasis and promote ROS accumulation, leading to oxidative damage to membrane lipids, proteins, and photosynthetic structures [31]. Antioxidant enzymes play important roles in ROS detoxification, while proline functions as a compatible solute associated with osmotic balance, membrane stabilization, and cellular protection [32]. In this study, the physiological differences between CS and CT suggest that stronger antioxidant capacity and proline-associated osmotic adjustment may contribute to reduced membrane damage in the cold-tolerant cultivar. Consistently, MfERF1 from Medicago falcata was reported to enhance cold tolerance in association with proline accumulation, antioxidant protection, and polyamine turnover [33], supporting a possible link among proline accumulation, redox regulation, and polyamine metabolism in Medicago cold responses.
The transcriptomic data further supported these physiological observations. At 26 h of cold treatment, several antioxidant enzyme-related genes, including genes encoding SOD and APX, showed differential expression (Figure S5). Genes involved in glutathione biosynthesis and redox regulation, including GSH1, GSH2, GPX, DHAR2, GR, and GSTs, showed cold-responsive expression patterns, suggesting that glutathione-dependent redox processes may participate in cellular protection. Meanwhile, the regulation of proline biosynthesis- and polyamine metabolism-related genes, such as P5CS, P5CR, ADC1, and SPDS1, suggests a potential transcriptional connection between osmotic adjustment and polyamine metabolism. These within-cultivar expression changes identify redox- and osmotic-regulation-related genes that respond during cold exposure. However, they do not by themselves establish stronger transcriptional responses in CT or demonstrate that these genes account for its physiological advantages. Together, the physiological measurements support an association of antioxidant protection and proline accumulation with reduced membrane injury in CT, while the transcriptomic results identify potentially relevant cold-responsive genes. The contributions of individual genes to the contrasting cold tolerance of the two cultivars require functional validation.
4.2. Photosynthetic Performance and Transcriptional Responses of Photosynthesis-Related Genes During Cold Exposure
Photosynthesis is highly sensitive to low temperature. Cold stress can reduce chlorophyll accumulation, disturb photosynthetic electron transport, and inhibit PSII activity, thereby leading to photoinhibition and oxidative damage [34,35]. In this study, CT maintained higher chlorophyll a and chlorophyll b contents and showed a smaller decrease in Fv/Fm than CS under cold stress, suggesting that the cold-tolerant cultivar experienced less photosynthetic impairment and maintained relatively better PSII photochemical efficiency. RNA-seq analysis showed differential expression of genes encoding PSII and PSI components, cytochrome b6/f complex proteins, F-type ATPase subunits, photosynthetic electron transport proteins, and light-harvesting chlorophyll a/b-binding proteins. More photosynthesis-related genes met the DEG criteria in CT than in CS, but this difference in DEG numbers does not establish significantly different responses between cultivars. Similar regulation of photosystem components genes has been reported in cold-stressed alfalfa, indicating that transcriptional adjustment of the photosynthetic apparatus is a common response to low temperature [22,23].
Among the photosynthesis-related genes, more LHC-associated entries were classified as down-regulated in CT than in CS during prolonged cold exposure. Under low-temperature conditions, restricted carbon fixation can create an imbalance between light absorption and energy utilization, increasing excitation pressure and the risk of photoinhibition. The observed expression patterns may therefore be consistent with adjustments in light-harvesting processes. Similar down-regulation of photosynthesis-antenna protein genes has been reported in cold-stressed alfalfa [23], and functional studies in tomato support roles for individual LHC genes in photosynthetic protection and cold tolerance [36]. However, the examined LHCA/LHCB genes showed no significant cultivar-by-time interactions at 26 h. Thus, the present data do not establish different response magnitudes between cultivars for these genes or demonstrate that their down-regulation explains the better photosynthetic performance of CT. The physiological measurements indicate better maintenance of photosynthetic function in CT, whereas the functional significance of the accompanying transcriptional changes remains to be determined.
4.3. Transcriptional Responses of Carbohydrate and Energy Metabolism-Related Genes Under Cold Stress
Carbohydrate metabolism and energy homeostasis are closely associated with plant cold tolerance [7,37]. In this study, cold stress induced extensive transcriptional regulation of carbohydrate and energy metabolism-related pathways, including starch and sucrose metabolism, trehalose metabolism, glycolysis/gluconeogenesis, and the TCA cycle. More genes in these pathways met the DEG criteria in CT, particularly at 26 h. Soluble sugars can function as compatible solutes and help stabilize cellular structures under cold stress [7]. In this study, genes involved in sucrose and trehalose metabolism, including TPS/TPP, SPS3, SUS2, and UGP2, as well as starch degradation-related genes such as AMY3 and BAM1, were regulated under cold stress. These transcriptional changes suggest that carbohydrate metabolism-related transcriptional responses may be involved in the cold response of alfalfa. Similar cold-induced changes in sugar metabolism have been reported in Arabidopsis and alfalfa, supporting the importance of carbohydrate metabolism in freezing tolerance [3,7]. However, whether these expression changes lead to alterations in carbohydrate concentrations or osmotic adjustment remains to be determined.
In addition to osmotic regulation, carbohydrate metabolism provides substrates for energy production and stress-related metabolite biosynthesis. Cold stress also altered the expression of genes associated with glycolysis/gluconeogenesis and the TCA cycle, including glycolysis-related genes such as PFK3, FBA5, GAPC, PGH1, and PK, as well as TCA cycle-related genes such as MDH2, IDH1, and ACO. These metabolic pathways are interconnected through intermediates such as pyruvate, oxaloacetate, α-ketoglutarate, and malate. Furthermore, the differential expression of GDH3 and AlaAT2 suggests that genes involved in the connections between central carbon and amino acid metabolism also respond to cold treatment. Glutamate is a common precursor for glutathione and proline biosynthesis, whereas arginine-derived polyamines are associated with osmotic adjustment and ROS homeostasis [29]. Therefore, the observed transcriptional changes in carbohydrate, energy, and amino acid metabolism-related genes may reflect potentially interconnected responses to cold stress. Although CT exhibited more DEGs in several of these pathways, this does not necessarily indicate greater metabolic activity or energy production. Further analyses of metabolite concentrations and metabolic fluxes are required to determine whether these transcriptional differences contribute to the contrasting cold tolerance phenotypes of CT and CS.
4.4. Transcriptional Responses of Lipid Metabolism-Related Genes Under Cold Stress
Membrane lipid composition is closely associated with plant cold tolerance because low temperature reduces membrane fluidity and can impair membrane integrity and function. Plants can remodel membrane lipids to maintain membrane stability under cold conditions [10,17]. In this study, within-cultivar comparisons identified cold-responsive genes associated with glycerolipid and glycerophospholipid metabolism. These results indicate transcriptional responses involving lipid-related processes, but do not establish more extensive lipid remodeling in CT. The lower REC and MDA levels in CT provide physiological evidence of reduced membrane injury, while the contribution of lipid composition to this difference remains unresolved.
Cold stress affected the expression of genes associated with phospholipid metabolism and lipid-derived signaling. Genes related to phosphatidic acid (PA)/diacylglycerol (DAG) metabolism and phosphatidylglycerol biosynthesis, including LPAAT3, PLC, PLD, DGK2, PAP1/PAP2, and PGS1, were differentially regulated under cold stress. PA is an important lipid signaling molecule, and PLD-mediated PA production has been reported to participate in plant responses to abiotic stresses [38,39]. Therefore, the differential expression of PA/DAG-associated genes suggests that lipid metabolism- and signaling-related transcriptional processes may be involved in the cold response of alfalfa, although whether these transcriptional changes lead to alterations in PA accumulation or lipid signaling activity requires further investigation.
Genes involved in phospholipid biosynthesis and turnover, including CHK, PCYT1, PCYT2, LPCAT1, LCAT3, and GDPD5, also exhibited differential expression under cold stress. Previous studies in Arabidopsis have demonstrated that changes in membrane phospholipid composition during cold acclimation are associated with membrane cryostability and freezing tolerance [10,40]. In the present study, these transcriptional changes may be relevant to membrane-associated cold responses, particularly given the differences in REC and MDA levels between CT and CS. Nevertheless, whether the expression changes result in altered phospholipid composition or turnover remains to be determined.
Cold exposure also affected the expression of genes associated with chloroplast membrane lipid metabolism, including MGD2, DGD2, SFR2, and SQD2. Galactolipids and sulfolipids are major components of chloroplast and thylakoid membranes, and their remodeling is important for maintaining photosynthetic membrane function under stress [41,42]. These genes therefore represent biologically relevant candidates for investigating membrane-associated cold responses. However, none of the examined genes annotated as MGD2, DGD2, SFR2, or SQD2 showed significant cultivar-by-time interactions at 26 h. Their expression patterns consequently do not establish differential induction between CT and CS at this time point. Overall, the transcriptomic results indicate responses involving phospholipid, galactolipid, and sulfolipid metabolism, but lipid composition and metabolic fluxes were not measured. Lipidomic and functional analyses are required to determine whether these processes contribute to cultivar differences in membrane integrity and photosynthetic performance.
4.5. Transcriptional Responses of Hormone-Related Genes Under Cold Stress
Plant hormones are central regulators that integrate environmental stress responses with growth and developmental processes [11,18,20]. In this study, cold stress markedly affected the expression of genes associated with ABA, ethylene, IAA, GA, CK, JA, and BR biosynthesis, metabolism, and signaling pathways, suggesting that hormone-related transcriptional processes may participate in cold adaptation in alfalfa. ABA- and ethylene-related genes showed expression patterns consistent with their previously established roles in abiotic stress responses. ABA signaling generally regulates stress-responsive gene expression through the ABA receptor–PP2C–SnRK2 module and downstream transcription factors such as ABFs [43]. In this study, NCED1 and several ABA signaling-related genes were up-regulated, together with genes associated with ethylene biosynthesis and signaling. These findings indicate that ABA- and ethylene-related transcriptional responses occur during cold treatment, although changes in hormone levels or signaling activities cannot be inferred directly from transcript abundance.
Genes associated with GA, CK, and BR pathways also exhibited altered expression under cold stress. The down-regulation of GA biosynthesis-related genes and the induction of GA2ox genes, which are associated with GA deactivation, suggest transcriptional changes potentially related to GA metabolism. Similarly, several genes involved in CK signaling and BR biosynthesis or signaling were down-regulated. Given the established roles of these hormones in plant growth and development [18,44], this transcriptional repression may reflect changes in growth-associated transcriptional processes during cold exposure. However, whether these transcriptional changes result in hormone concentrations, signaling activities, or growth responses remains to be determined.
Auxin and JA-related genes displayed more complex transcriptional patterns. Several genes associated with auxin biosynthesis and conjugation were up-regulated, whereas genes involved in auxin transport and perception were down-regulated. These results suggest that different components of auxin-related pathways respond differently to cold stress, consistent with previous studies reporting the involvement of auxin-associated processes in plant responses to cold stress [45]. Similarly, the induction of several JA biosynthesis-related genes, together with differential expression of JA modification and JAZ/TIFY-related genes, suggests transcriptional changes in multiple components of JA-associated pathways. These findings are consistent with the complex roles of jasmonate-related processes in plant stress responses [46], although their effects on JA metabolism and signaling activity remain unclear. Overall, the expression patterns indicate responses involving multiple hormone-related pathways during cold exposure. However, transcript abundance alone does not establish changes in hormone concentrations or signaling activities, and the contribution of these pathways to cultivar differences in cold tolerance requires hormone quantification and functional validation.
4.6. Transcriptional Responses of Signaling- and Transcriptional Factor-Related Genes Under Cold Stress
Cold stress responses are initiated by signal perception and transduction events that activate downstream transcriptional regulation and physiological adjustment. Calcium signaling is considered one of the earliest events in cold perception, during which changes in membrane properties trigger Ca2+ influx and activate calcium sensors, including CaM/CMLs, CBLs, and CDPKs/CPKs [6,12]. MAPK cascades and phosphorylation-mediated signaling pathways also function as important modules for transmitting cold signals and regulating downstream gene expression [6,47]. In this study, genes associated with Ca2+ signaling, MAPK cascades, and protein phosphorylation were differentially regulated under cold stress, indicating that components of these signaling pathways are transcriptionally responsive to cold in alfalfa, although their signaling activities were not directly assessed.
Transcription factors translate environmental signals into changes in gene expression. More TF-associated entries met the within-cultivar DEG criteria in CT than in CS, particularly at 26 h, with AP2/EREBP members representing the largest group. The CBF/DREB pathway is a well-characterized regulator of cold responses and freezing tolerance [5,48]. Nevertheless, the examined DREB/CBF genes showed no significant cultivar-by-time interactions at 26 h. Differences in the numbers of responsive entries therefore do not establish stronger DREB-mediated transcriptional responses in CT. Cold-responsive genes associated with NAC, bHLH, MYB, and HSF families were also identified. Their known roles in redox regulation, osmotic adjustment, hormone signaling, and metabolism [45] provide biological context for the observed expression patterns, but their contributions to cultivar differences require direct statistical and functional evidence.
The autotetraploid genome of cultivated alfalfa also warrants caution when interpreting DEG counts, because multiple annotated entries may represent related gene copies. However, homology cannot be established from similar annotations or identical count profiles alone. Differences in DEG numbers should therefore not be equated with differences in the number of activated pathways or the strength of transcriptional regulation. Significant cultivar-by-time interactions provide the direct statistical evidence for differential expression changes between CT and CS. Because time-matched non-cold controls were unavailable, these interactions are interpreted as cultivar differences in expression trajectories during cold exposure. The principal physiological observations and associated transcriptional responses are summarized in Figure 9.
Figure 9.
Schematic summary of the major physiological and transcriptomic differences between the cold-sensitive cultivar (CS) and the cold-tolerant cultivar (CT) under cold stress. Compared with CS, CT exhibited higher freezing survival, lower membrane damage and ROS accumulation, higher proline accumulation and antioxidant enzyme activities, and better maintenance of chlorophyll content and PSII photochemical efficiency. Cultivar-by-time interaction analysis identified a subset of genes with significantly different expression changes between CT and CS. Within-cultivar comparisons identified cold-responsive genes associated with photosynthesis, carbohydrate and energy metabolism, antioxidant-related processes, glutathione-, proline-, and polyamine-related redox and osmotic regulation, membrane lipid metabolism, phytohormone-related pathways, Ca2+/MAPK signaling, and transcription factor families. The schematic summarizes the main cultivar-dependent differences observed in this study.
5. Conclusions
This study identified physiological and transcriptomic differences between cold-sensitive and cold-tolerant alfalfa cultivars during cold exposure. The cold-tolerant cultivar exhibited lower membrane injury and oxidative damage, greater proline accumulation, higher antioxidant enzyme activities, and better maintenance of photosynthetic performance. Transcriptomic analyses revealed cold-responsive genes associated with metabolism, redox regulation, membrane lipids, photosynthesis, hormone signaling, and transcriptional regulation. Cultivar-by-time interaction analysis further demonstrated significant differences in expression changes between the two cultivars. These findings identify cold-responsive genes and genes with cultivar-dependent expression changes as candidates for functional studies, providing a basis for understanding cold tolerance and exploring potential targets for alfalfa improvement.
Supplementary Materials
The following supporting information can be downloaded at: https://www.mdpi.com/article/10.3390/agronomy16212210/s1, Figure S1: Quantitative analysis of ROS accumulation and representative false-color image of PSII efficiency under cold stress; Figure S2: Comparative analysis of differentially expressed genes (DEGs) between cold-sensitive (CS) and cold-tolerant (CT) alfalfa cultivars under cold stress; Figure S3: Expression changes in selected genes with significant cultivar-by-time interactions during cold exposure; Figure S4: Validation of RNA-seq results by qRT-PCR; Figure S5: Expression patterns of SOD1, SOD2, and APX1 under cold stress; Table S1: Interaction analysis; Table S2: Three-way ANOVA of REC; Table S3: Two-way ANOVA of physiological and biochemical traits; Table S4: Summary of the RNA-seq data collected from cold-tolerant and cold-sensitive alfalfa; Table S5: Transcriptome assembly based RNA-seq data collected from cold-tolerant and cold-sensitive alfalfa; Table S6: Complete interaction-test results and sensitivity analyses. Table S7: Expression counts, statistics, and annotations of the genes displayed in Figure S3. Table S8: Gene Ontology (GO) enrichment analysis of differentially expressed genes (DEGs) in cold-tolerant and cold-sensitive alfalfa at 2 h of cold treatment; Table S9: Gene Ontology (GO) enrichment analysis of differentially expressed genes (DEGs) in cold-tolerant and cold-sensitive alfalfa at 26 h of cold treatment; Table S10: Enriched KEGG pathways of DEGs in cold-tolerant and cold-sensitive alfalfa at 2 h after cold stress; Table S11: Enriched KEGG pathways of DEGs in cold-tolerant and cold-sensitive alfalfa at 26 h after cold stress; Table S12: Expression stability of five candidate reference genes evaluated using NormFinder based on RNA-seq FPKM values; Table S13: The primers used in this paper.
Author Contributions
Conceptualization, Z.G. and N.Z.; methodology and investigation, L.C., Y.W., X.W. and Y.Y.; data curation, N.Z.; visualization, N.Z.; writing, N.Z. and B.G.; supervision, Z.G.; funding acquisition, N.Z. and Z.G. All authors have read and agreed to the published version of the manuscript.
Funding
This research was funded by the Natural Science Foundation of China (Grant Nos. 31901381, U23A20217 and 32030074).
Data Availability Statement
The original data presented in the study are openly available in the Genome Sequence Archive (GSA) of the National Genomics Data Center, China National Center for Bioinformation/Beijing Institute of Genomics, Chinese Academy of Sciences, under accession number CRA048612.
Conflicts of Interest
The authors declare no conflicts of interest.
References
- Zhang, Y.; Wang, L. Advances in basic biology of alfalfa (Medicago sativa L.): A comprehensive overview. Hortic. Res. 2025, 12, uhaf081. [Google Scholar] [CrossRef] [Scilit] [PubMed]
- He, F.; Chen, S.; Zhang, Y.; Chai, K.; Zhang, Q.; Kong, W.; Qu, S.; Chen, L.; Zhang, F.; Li, M.; et al. Pan-genomic analysis highlights genes associated with agronomic traits and enhances genomics-assisted breeding in alfalfa. Nat. Genet. 2025, 57, 1262–1273. [Google Scholar] [CrossRef] [Scilit] [PubMed]
- Castonguay, Y.; Laberge, S.; Brummer, E.C.; Volenec, J.J. Alfalfa winter hardiness: A research retrospective and integrated perspective. Adv. Agron. 2006, 90, 203–265. [Google Scholar] [CrossRef] [Scilit]
- Poudel, K.; Sheaffer, C.; Jungers, J.M.; Weihs, B.J.; Lamb, J.F.S.; Bauder, S.; Picasso, V.; Heuschele, J.; Xu, Z. Quantifying winter survival of alfalfa [Medicago sativa (L.)]. Agron. J. 2024, 116, 170–179. [Google Scholar] [CrossRef] [Scilit]
- Chinnusamy, V.; Zhu, J.; Zhu, J.K. Cold stress regulation of gene expression in plants. Trends Plant Sci. 2007, 12, 444–451. [Google Scholar] [CrossRef] [Scilit] [PubMed]
- Shi, Y.; Ding, Y.; Yang, S. Molecular regulation of CBF signaling in cold acclimation. Trends Plant Sci. 2018, 23, 623–637. [Google Scholar] [CrossRef] [Scilit] [PubMed]
- Kaplan, F.; Kopka, J.; Haskell, D.W.; Zhao, W.; Schiller, K.C.; Gatzke, N.; Sung, D.Y.; Guy, C.L. Exploring the temperature-stress metabolome of Arabidopsis. Plant Physiol. 2004, 136, 4159–4168. [Google Scholar] [CrossRef] [Scilit] [PubMed]
- Li, Q.; Zheng, Q.; Shen, W.; Cram, D.; Fowler, D.B.; Wei, Y.; Zou, J. Understanding the biochemical basis of temperature-induced lipid pathway adjustments in plants. Plant Cell 2015, 27, 86–103. [Google Scholar] [CrossRef] [Scilit] [PubMed]
- Gan, P.; Liu, F.; Li, R.; Wang, S.; Luo, J. Chloroplasts-Beyond Energy Capture and Carbon Fixation: Tuning of Photosynthesis in Response to Chilling Stress. Int. J. Mol. Sci. 2019, 20, 5046. [Google Scholar] [CrossRef] [Scilit] [PubMed]
- Uemura, M.; Joseph, R.A.; Steponkus, P.L. Cold acclimation of Arabidopsis thaliana: Effect on plasma membrane lipid composition and freeze-induced lesions. Plant Physiol. 1995, 109, 15–30. [Google Scholar] [CrossRef] [Scilit] [PubMed]
- Verma, V.; Ravindran, P.; Kumar, P.P. Plant hormone-mediated regulation of stress responses. BMC Plant Biol. 2016, 16, 86. [Google Scholar] [CrossRef] [Scilit] [PubMed]
- Knight, M.R.; Knight, H. Low-temperature perception leading to gene expression and cold tolerance in higher plants. New Phytol. 2012, 195, 737–751. [Google Scholar] [CrossRef] [Scilit] [PubMed]
- Abdullah, S.N.A.; Azzeme, A.M.; Yousefi, K. Fine-tuning cold stress response through regulated cellular abundance and mechanistic actions of transcription factors. Front. Plant Sci. 2022, 13, 850216. [Google Scholar] [CrossRef] [Scilit] [PubMed]
- Foyer, C.H.; Noctor, G. Redox homeostasis and antioxidant signaling: A metabolic interface between stress perception and physiological responses. Plant Cell 2005, 17, 1866–1875. [Google Scholar] [CrossRef] [Scilit] [PubMed]
- Guo, Z.; Tan, J.; Zhuo, C.; Wang, C.; Xiang, B.; Wang, Z. Abscisic acid, H2O2 and nitric oxide interactions mediated cold-induced S-adenosylmethionine synthetase in Medicago sativa subsp. falcata that confers cold tolerance through up-regulating polyamine oxidation. Plant Biotechnol. J. 2014, 12, 601–612. [Google Scholar] [CrossRef] [Scilit] [PubMed]
- Hoermiller, I.I.; Funck, D.; Schönewolf, L.; May, H.; Heyer, A.G. Cytosolic proline is required for basal freezing tolerance in Arabidopsis. Plant Cell Environ. 2022, 45, 147–155. [Google Scholar] [CrossRef] [Scilit] [PubMed]
- Uemura, M.; Steponkus, P.L. Cold acclimation in plants: Relationship between the lipid composition and the cryostability of the plasma membrane. J. Plant Res. 1999, 112, 245–254. [Google Scholar] [CrossRef] [Scilit]
- Huot, B.; Yao, J.; Montgomery, B.L.; He, S.Y. Growth-defense tradeoffs in plants: A balancing act to optimize fitness. Mol. Plant 2014, 7, 1267–1287. [Google Scholar] [CrossRef] [Scilit] [PubMed]
- Shomo, Z.D.; Li, F.; Smith, C.N.; Edmonds, S.R.; Roston, R.L. From sensing to acclimation: The role of membrane lipid remodeling in plant responses to low temperatures. Plant Physiol. 2024, 196, 1737–1757. [Google Scholar] [CrossRef] [Scilit] [PubMed]
- Waadt, R.; Seller, C.A.; Hsu, P.K.; Takahashi, Y.; Munemasa, S.; Schroeder, J.I. Plant hormone regulation of abiotic stress responses. Nat. Rev. Mol. Cell Biol. 2022, 23, 680–694. [Google Scholar] [CrossRef] [Scilit] [PubMed]
- Adhikari, L.; Makaju, S.O.; Lindstrom, O.M.; Missaoui, A.M. Mapping freezing tolerance QTL in alfalfa: Based on indoor phenotyping. BMC Plant Biol. 2021, 21, 403. [Google Scholar] [CrossRef] [Scilit] [PubMed]
- Zhou, Q.; Luo, D.; Chai, X.; Wu, Y.; Wang, Y.; Nan, Z.; Yang, Q.; Liu, W.; Liu, Z. Multiple regulatory networks are activated during cold stress in Medicago sativa L. Int. J. Mol. Sci. 2018, 19, 3169. [Google Scholar] [CrossRef] [Scilit] [PubMed]
- Pu, X.; Fu, Y.; Xu, C.; Li, X.; Wang, W.; De, K.; Wei, X.; Yao, X. Transcriptomic analyses provide molecular insight into the cold stress response of cold-tolerant alfalfa. BMC Plant Biol. 2024, 24, 741. [Google Scholar] [CrossRef] [Scilit] [PubMed]
- Li, J.; Chai, L.; Yang, M.; Zhang, H.; Shang, C.; Liu, Y.; Qian, K.; Sun, J.; Han, W.; Zhang, P. MsLHY is an active regulator of cold resistance in alfalfa (Medicago sativa L.). Front. Plant Sci. 2025, 16, 1559988. [Google Scholar] [CrossRef] [Scilit] [PubMed]
- Ren, N.P.; Zang, H.; Xuan, Y.F.; Liu, J.L.; Liu, X.P.; Li, G.L. The alfalfa AP2/ERF transcription factor MsCBF4 enhances frost tolerance in Arabidopsis thaliana. BMC Plant Biol. 2025, 25, 1763. [Google Scholar] [CrossRef] [Scilit] [PubMed]
- Yang, L.; Sun, H.; Xu, B.; Liu, Y.; Zhu, H.; Guo, Z. A calmodulin-like protein (MsCML50) confers cold tolerance through interacting with MsTPP8 to moderate sugars accumulation and ROS scavenging in alfalfa. Environ. Exp. Bot. 2025, 239, 106255. [Google Scholar] [CrossRef] [Scilit]
- Yu, S.; Wu, J.; Sun, Y.; Zhu, H.; Sun, Q.; Zhao, P.; Huang, R.; Guo, Z. A calmodulin-like protein (CML10) interacts with cytosolic enzymes GSTU8 and FBA6 to regulate cold tolerance. Plant Physiol. 2022, 190, 1321–1333. [Google Scholar] [CrossRef] [Scilit] [PubMed]
- Geng, B.; Wang, Q.; Huang, R.; Liu, Y.; Guo, Z.; Lu, S. A novel LRR-RLK (CTLK) confers cold tolerance through regulation on the C-repeat-binding factor pathway, antioxidants, and proline accumulation. Plant J. 2021, 108, 1679–1689. [Google Scholar] [CrossRef] [Scilit] [PubMed]
- Chen, H.; Zeng, Y.; Yang, Y.; Huang, L.; Tang, B.; Zhang, H.; Hao, F.; Liu, W.; Li, Y.; Liu, Y.; et al. Allele-aware chromosome-level genome assembly and efficient transgene-free genome editing for the autotetraploid cultivated alfalfa. Nat. Commun. 2020, 11, 2494. [Google Scholar] [CrossRef] [Scilit] [PubMed]
- Fan, W.; Shi, Y.; Shi, P.; Yang, Y.; Zhang, M. Selection and validation of reference genes in alfalfa based on transcriptome sequence data. Sci. Rep. 2025, 15, 6324. [Google Scholar] [CrossRef] [Scilit] [PubMed]
- Gill, S.S.; Tuteja, N. Reactive oxygen species and antioxidant machinery in abiotic stress tolerance in crop plants. Plant Physiol. Biochem. 2010, 48, 909–930. [Google Scholar] [CrossRef] [Scilit] [PubMed]
- Szabados, L.; Savouré, A. Proline: A multifunctional amino acid. Trends Plant Sci. 2010, 15, 89–97. [Google Scholar] [CrossRef] [Scilit] [PubMed]
- Zhuo, C.; Liang, L.; Zhao, Y.; Guo, Z.; Lu, S. A cold responsive ethylene responsive factor from Medicago falcata confers cold tolerance by up-regulation of polyamine turnover, antioxidant protection, and proline accumulation. Plant Cell Environ. 2018, 41, 2021–2032. [Google Scholar] [CrossRef] [Scilit] [PubMed]
- Ensminger, I.; Busch, F.; Huner, N.P.A. Photostasis and cold acclimation: Sensing low temperature through photosynthesis. Physiol. Plant. 2006, 126, 28–44. [Google Scholar] [CrossRef] [Scilit]
- Liu, B.; Zhao, F.; Zhou, H.; Xia, Y.; Wang, X. Photoprotection conferring plant tolerance to freezing stress through rescuing photosystem in evergreen Rhododendron. Plant Cell Environ. 2022, 45, 2093–2108. [Google Scholar] [CrossRef] [Scilit] [PubMed]
- Meng, F.; Ma, M.; Li, S.; Liang, P.; Liang, Y.; Shi, H.; Huang, S.; Su, H.; Deng, Y.; Akram, M.A.; et al. Genome-wide identification of light-harvesting chlorophyll a/b-binding (LHC) gene family in tomato and functional analysis of SlLhcb1.11 and SlELIP1 under cold stress. Genomics 2025, 117, 111022. [Google Scholar] [CrossRef] [Scilit] [PubMed]
- Krasensky, J.; Jonak, C. Drought, salt, and temperature stress-induced metabolic rearrangements and regulatory networks. J. Exp. Bot. 2012, 63, 1593–1608. [Google Scholar] [CrossRef] [Scilit] [PubMed]
- Testerink, C.; Munnik, T. Molecular, cellular, and physiological responses to phosphatidic acid formation in plants. J. Exp. Bot. 2011, 62, 2349–2361. [Google Scholar] [CrossRef] [Scilit] [PubMed]
- Arisz, S.A.; van Wijk, R.; Roels, W.; Zhu, J.K.; Haring, M.A.; Munnik, T. Rapid phosphatidic acid accumulation in response to low temperature stress in Arabidopsis is generated through diacylglycerol kinase. Front. Plant Sci. 2013, 4, 1. [Google Scholar] [CrossRef] [Scilit] [PubMed]
- Degenkolbe, T.; Giavalisco, P.; Zuther, E.; Seiwert, B.; Hincha, D.K.; Willmitzer, L. Differential remodeling of the lipidome during cold acclimation in natural accessions of Arabidopsis thaliana. Plant J. 2012, 72, 972–982. [Google Scholar] [CrossRef] [Scilit] [PubMed]
- Moellering, E.R.; Benning, C. Galactoglycerolipid metabolism under stress: A time for remodeling. Trends Plant Sci. 2011, 16, 98–107. [Google Scholar] [CrossRef] [Scilit] [PubMed]
- Boudière, L.; Michaud, M.; Petroutsos, D.; Rébeillé, F.; Falconet, D.; Bastien, O.; Roy, S.; Finazzi, G.; Rolland, N.; Jouhet, J.; et al. Glycerolipids in photosynthesis: Composition, synthesis and trafficking. Biochim. Biophys. Acta Bioenerg. 2014, 1837, 470–480. [Google Scholar] [CrossRef] [Scilit] [PubMed]
- Cutler, S.R.; Rodriguez, P.L.; Finkelstein, R.R.; Abrams, S.R. Abscisic acid: Emergence of a core signaling network. Annu. Rev. Plant Biol. 2010, 61, 651–679. [Google Scholar] [CrossRef] [Scilit] [PubMed]
- Achard, P.; Cheng, H.; De Grauwe, L.; Decat, J.; Schoutteten, H.; Moritz, T.; Van Der Straeten, D.; Peng, J.; Harberd, N.P. Integration of plant responses to environmentally activated phytohormonal signals. Science 2006, 311, 91–94. [Google Scholar] [CrossRef] [Scilit] [PubMed]
- Shibasaki, K.; Uemura, M.; Tsurumi, S.; Rahman, A. Auxin response in Arabidopsis under cold stress: Underlying molecular mechanisms. Plant Cell 2009, 21, 3823–3838. [Google Scholar] [CrossRef] [Scilit] [PubMed]
- Wasternack, C.; Song, S. Jasmonates: Biosynthesis, metabolism, and signaling by proteins activating and repressing transcription. J. Exp. Bot. 2017, 68, 1303–1321. [Google Scholar] [CrossRef] [Scilit] [PubMed]
- Jan, S.; Rustgi, S.; Barmukh, R.; Shikari, A.B.; Leske, B.; Bekuma, A.; Sharma, D.; Ma, W.; Kumar, U.; Kumar, U.; et al. Advances and opportunities in unraveling cold-tolerance mechanisms in the world’s primary staple food crops. Plant Genome 2024, 17, e20402. [Google Scholar] [CrossRef] [Scilit] [PubMed]
- Stockinger, E.J.; Gilmour, S.J.; Thomashow, M.F. Arabidopsis thaliana CBF1 encodes an AP2 domain-containing transcriptional activator that binds to the C-repeat/DRE, a cis-acting DNA regulatory element that stimulates transcription in response to low temperature and water deficit. Proc. Natl. Acad. Sci. USA 1997, 94, 1035–1040. [Google Scholar] [CrossRef] [Scilit] [PubMed]
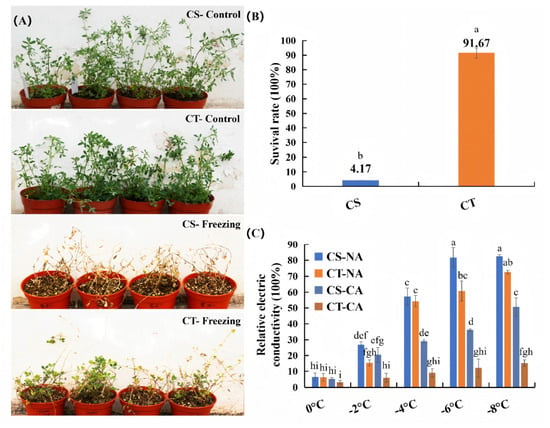
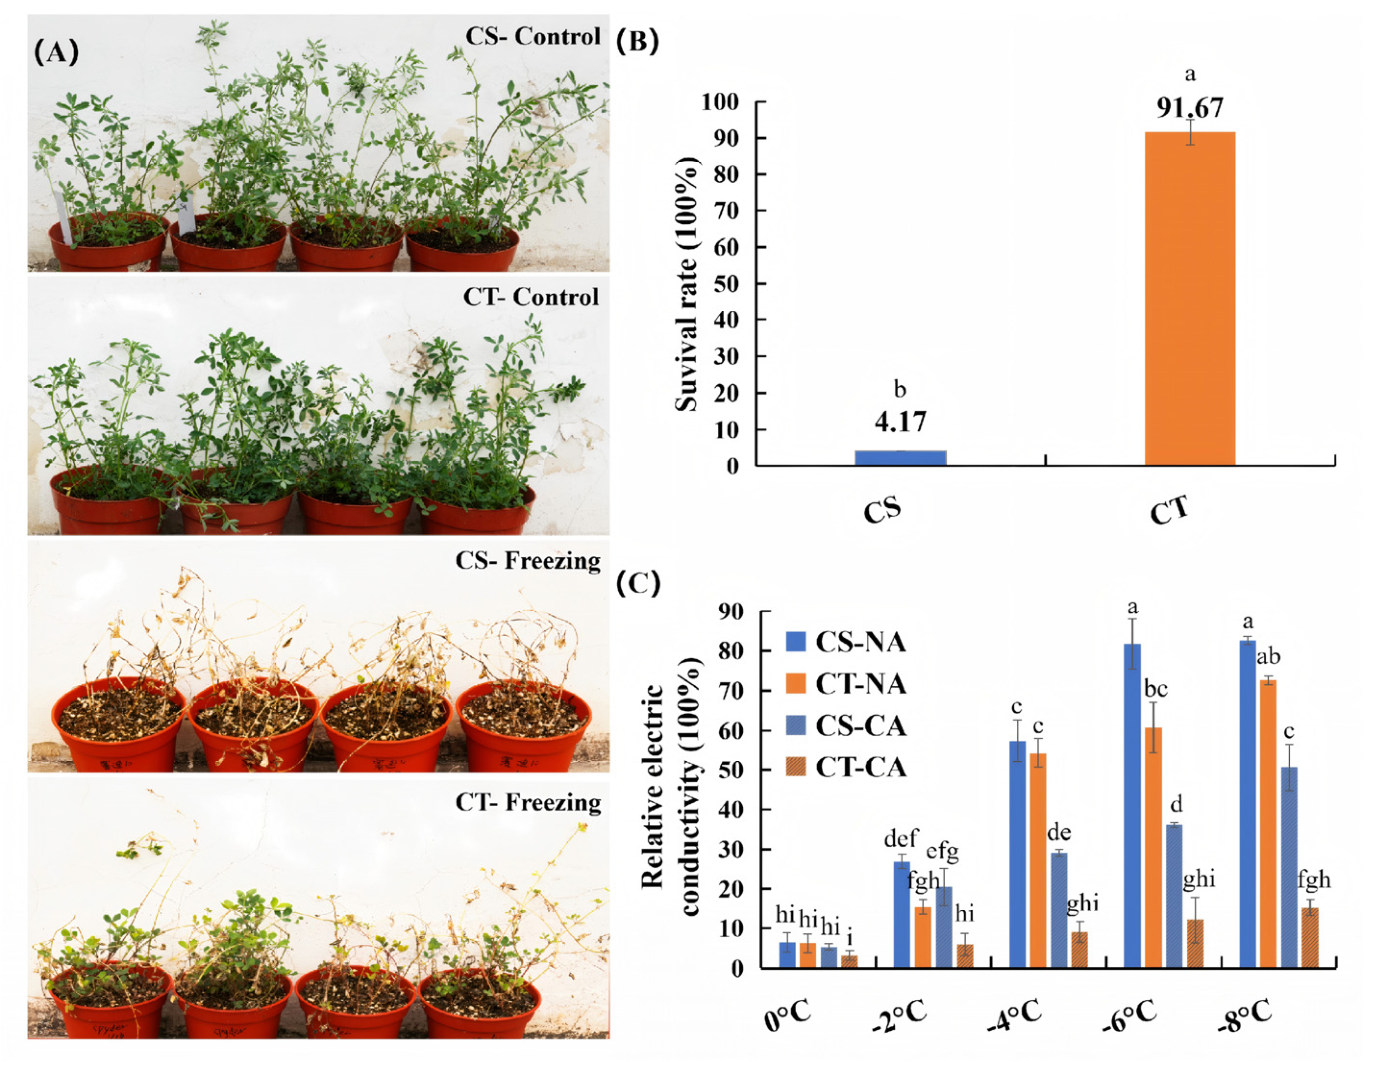
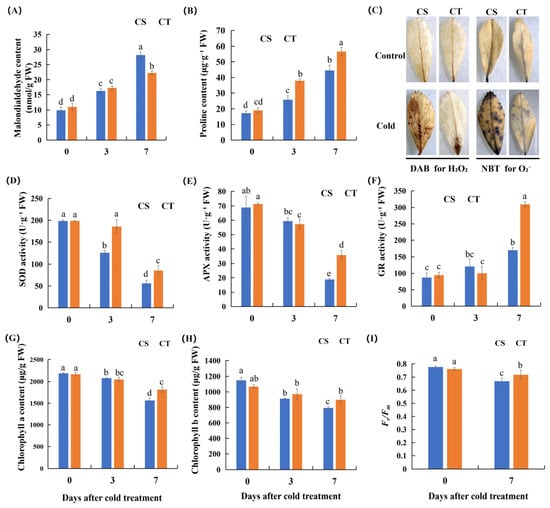
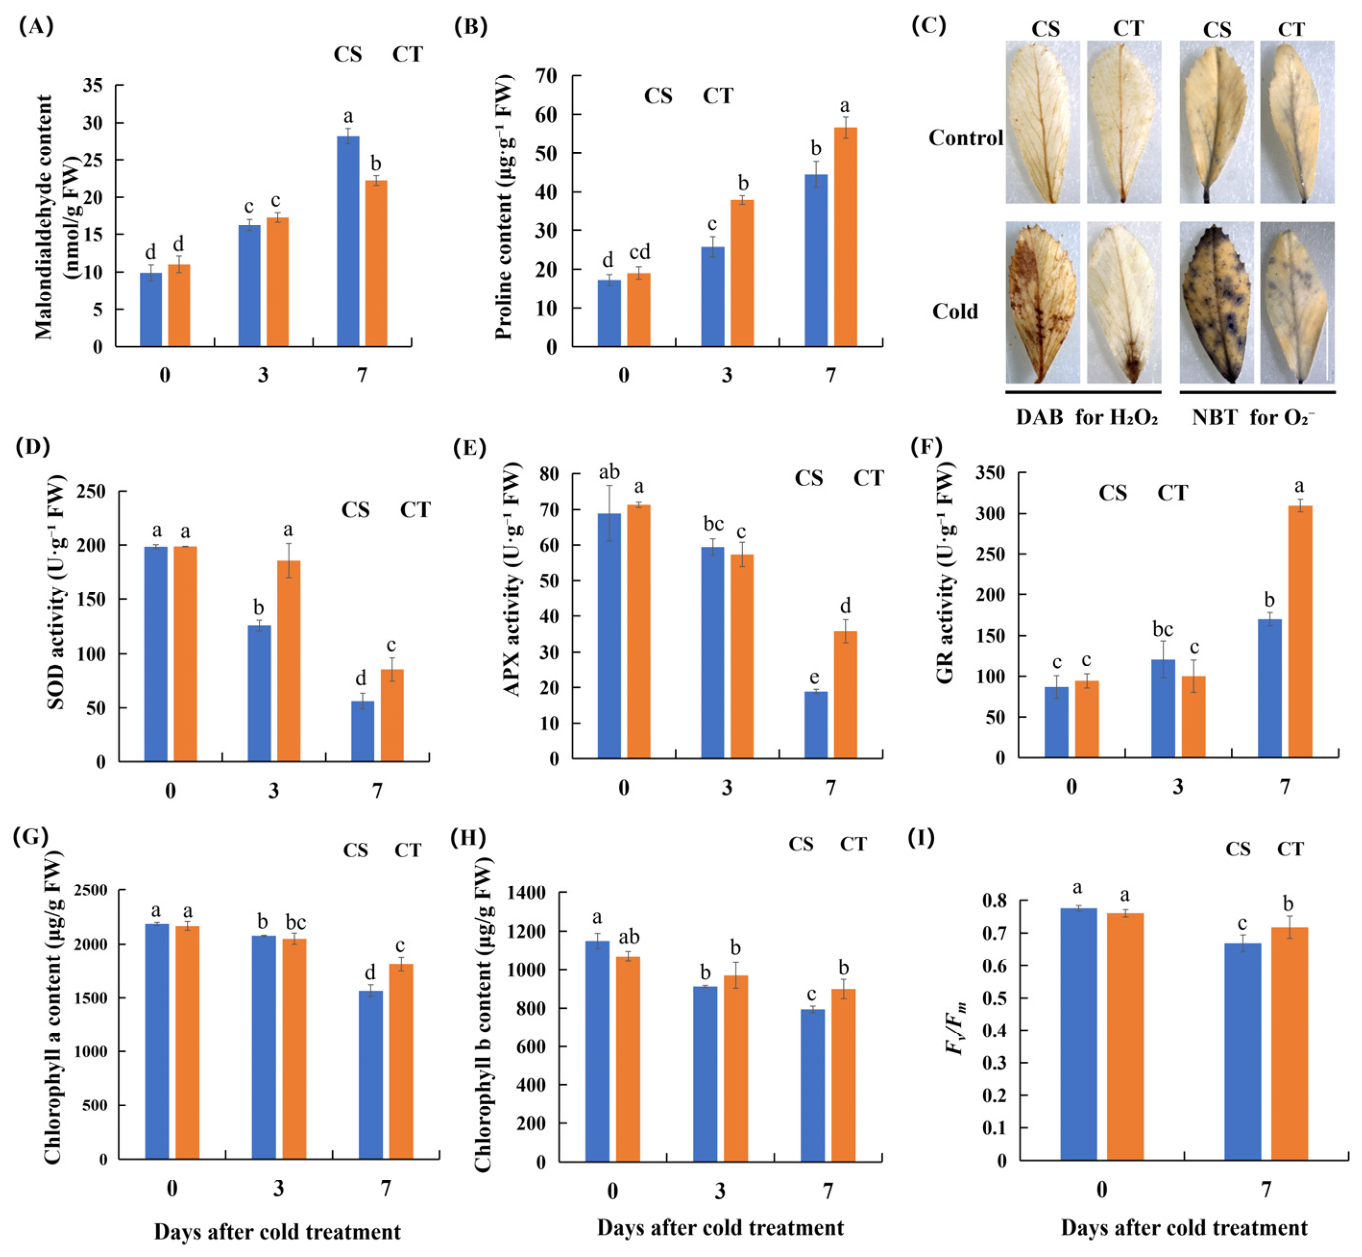
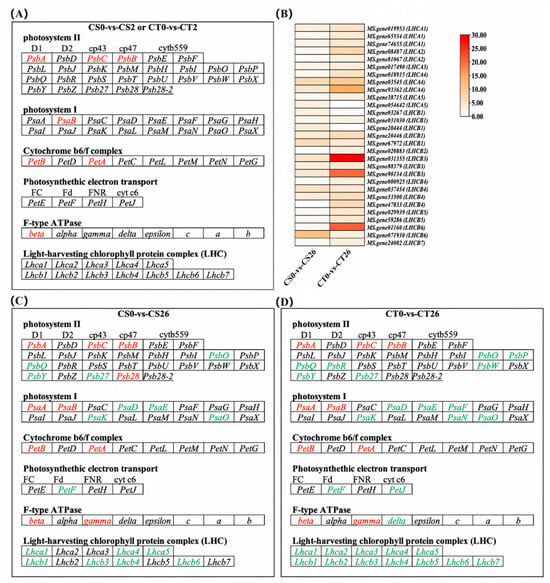
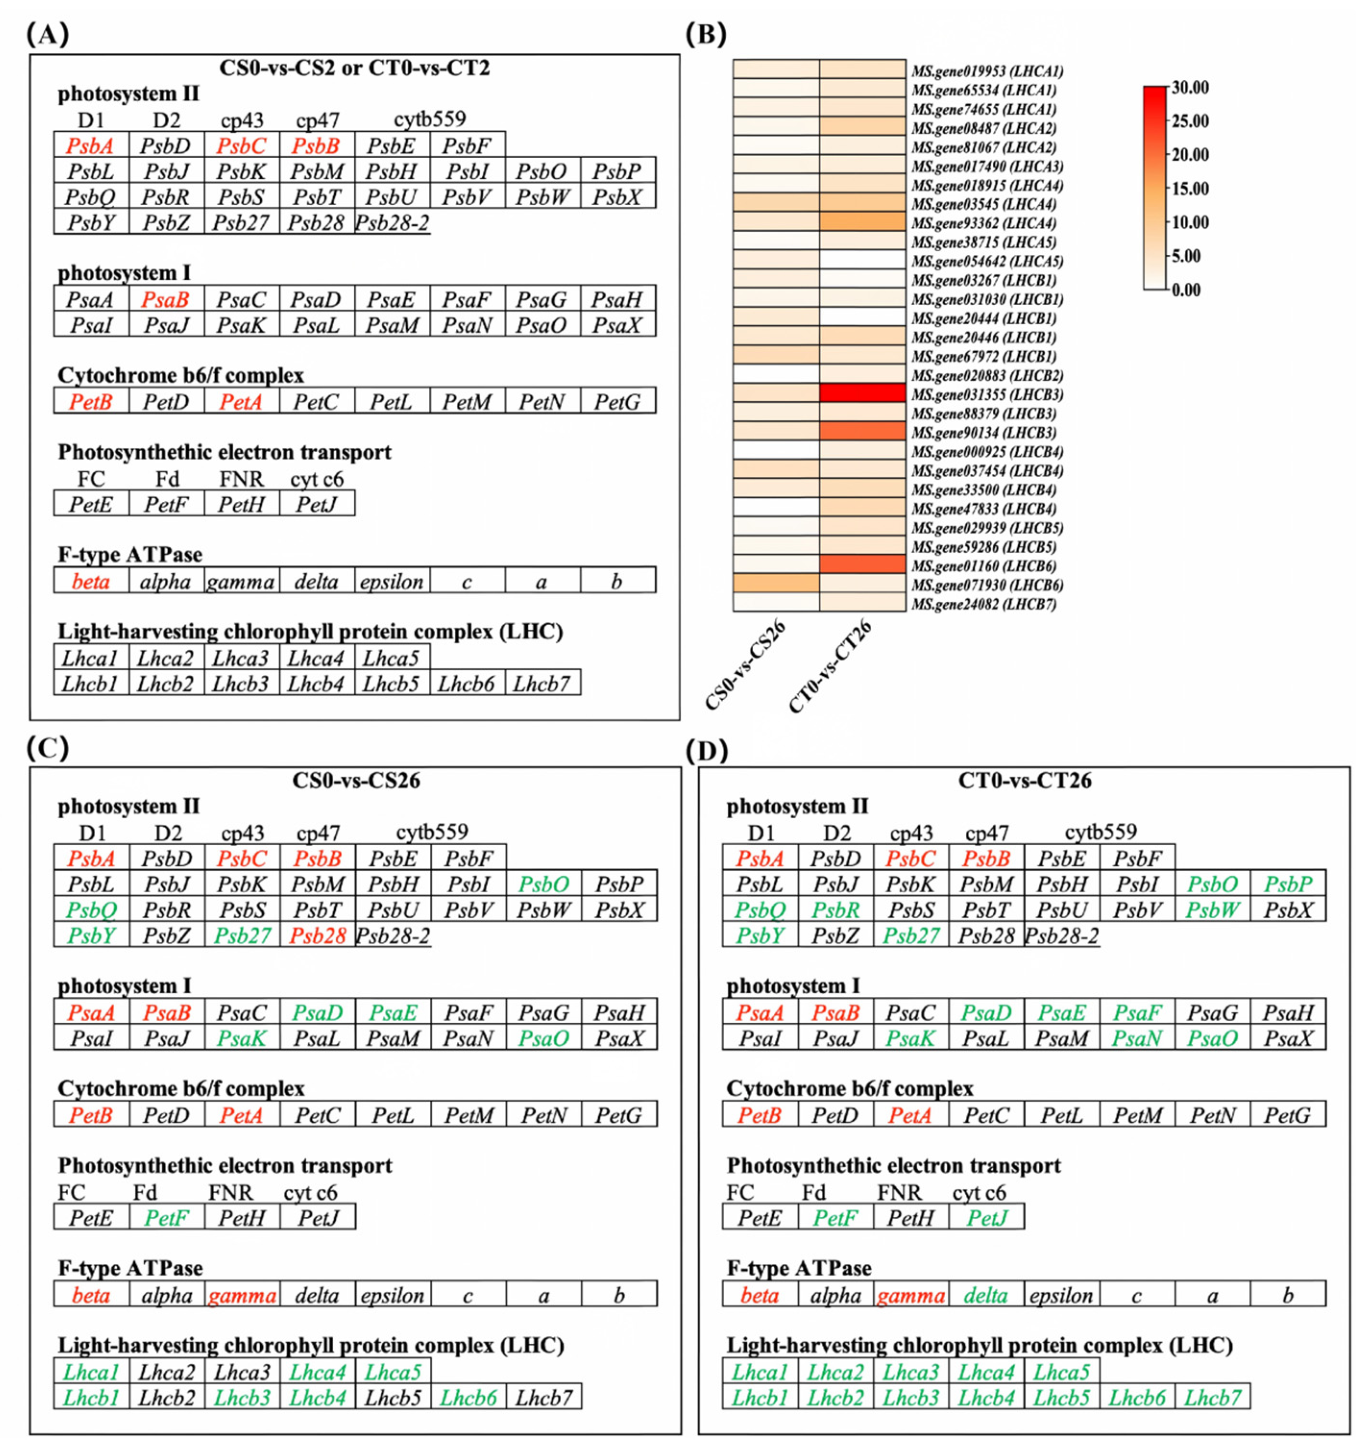
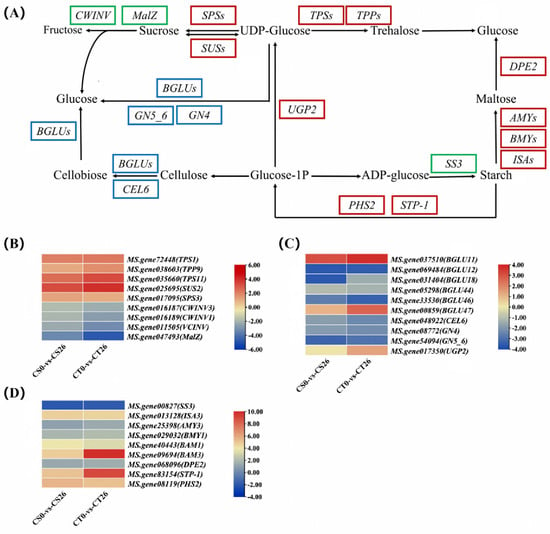
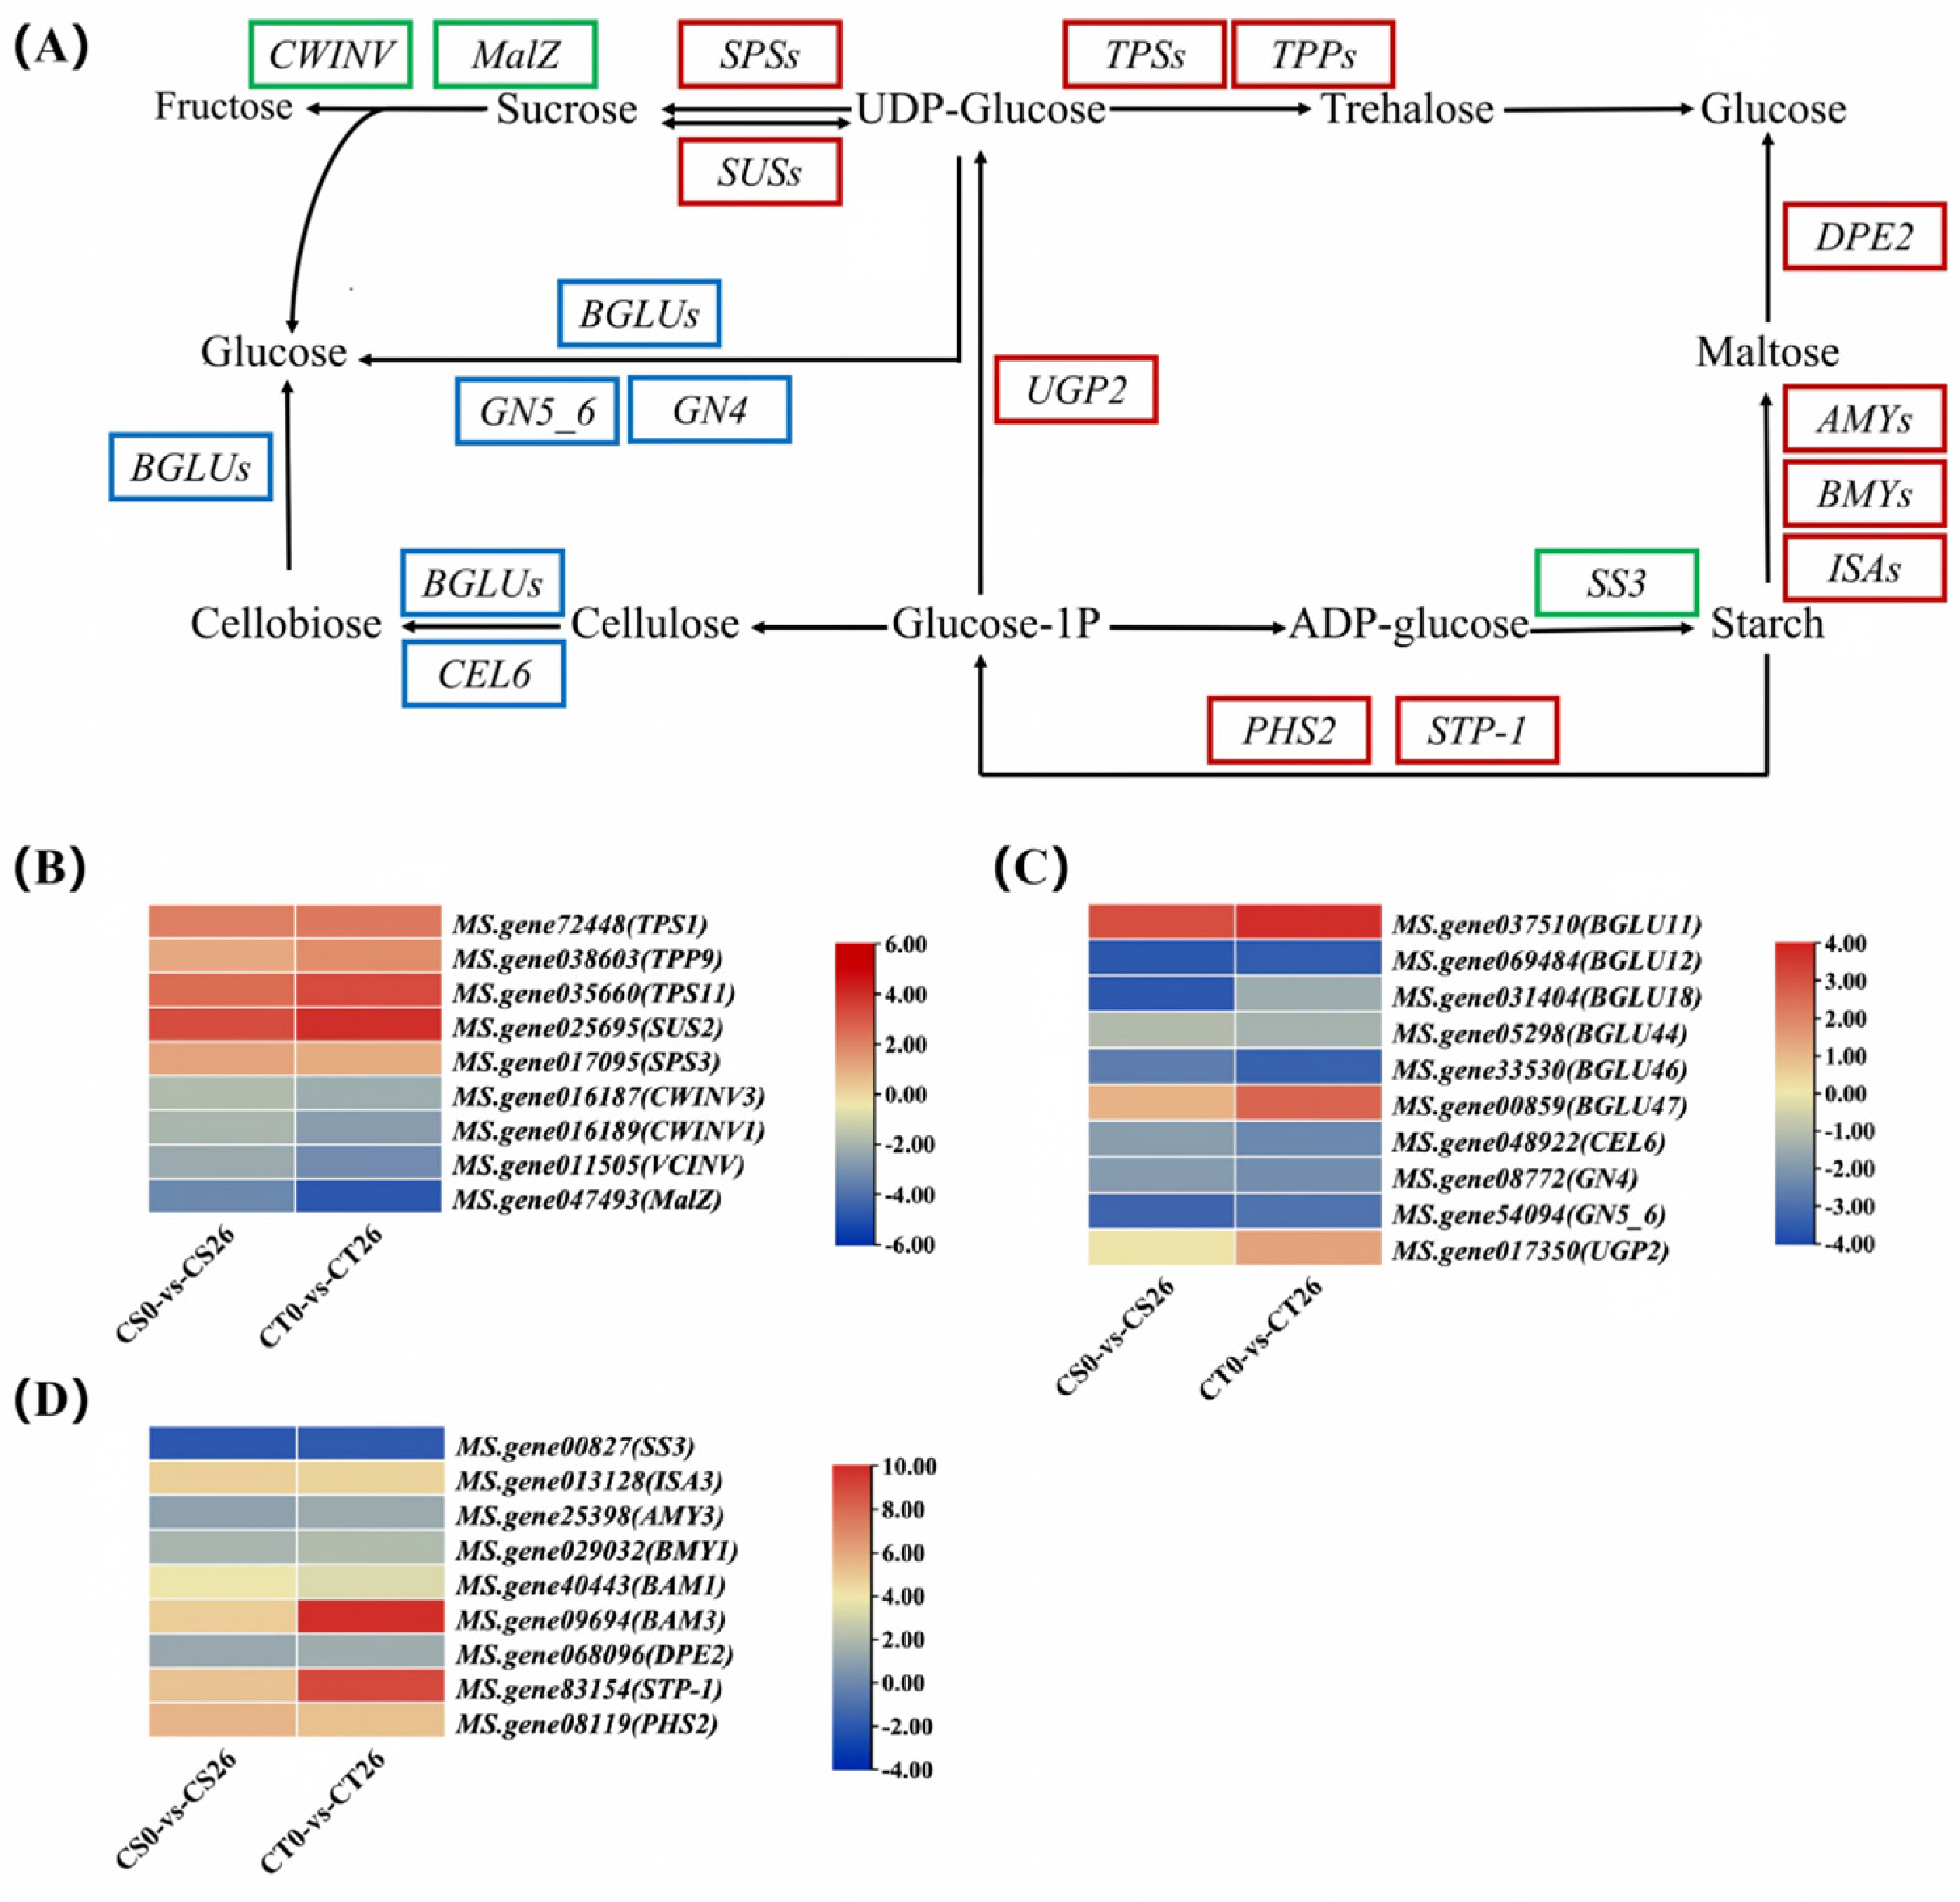
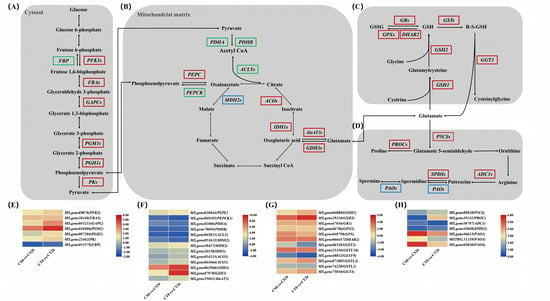
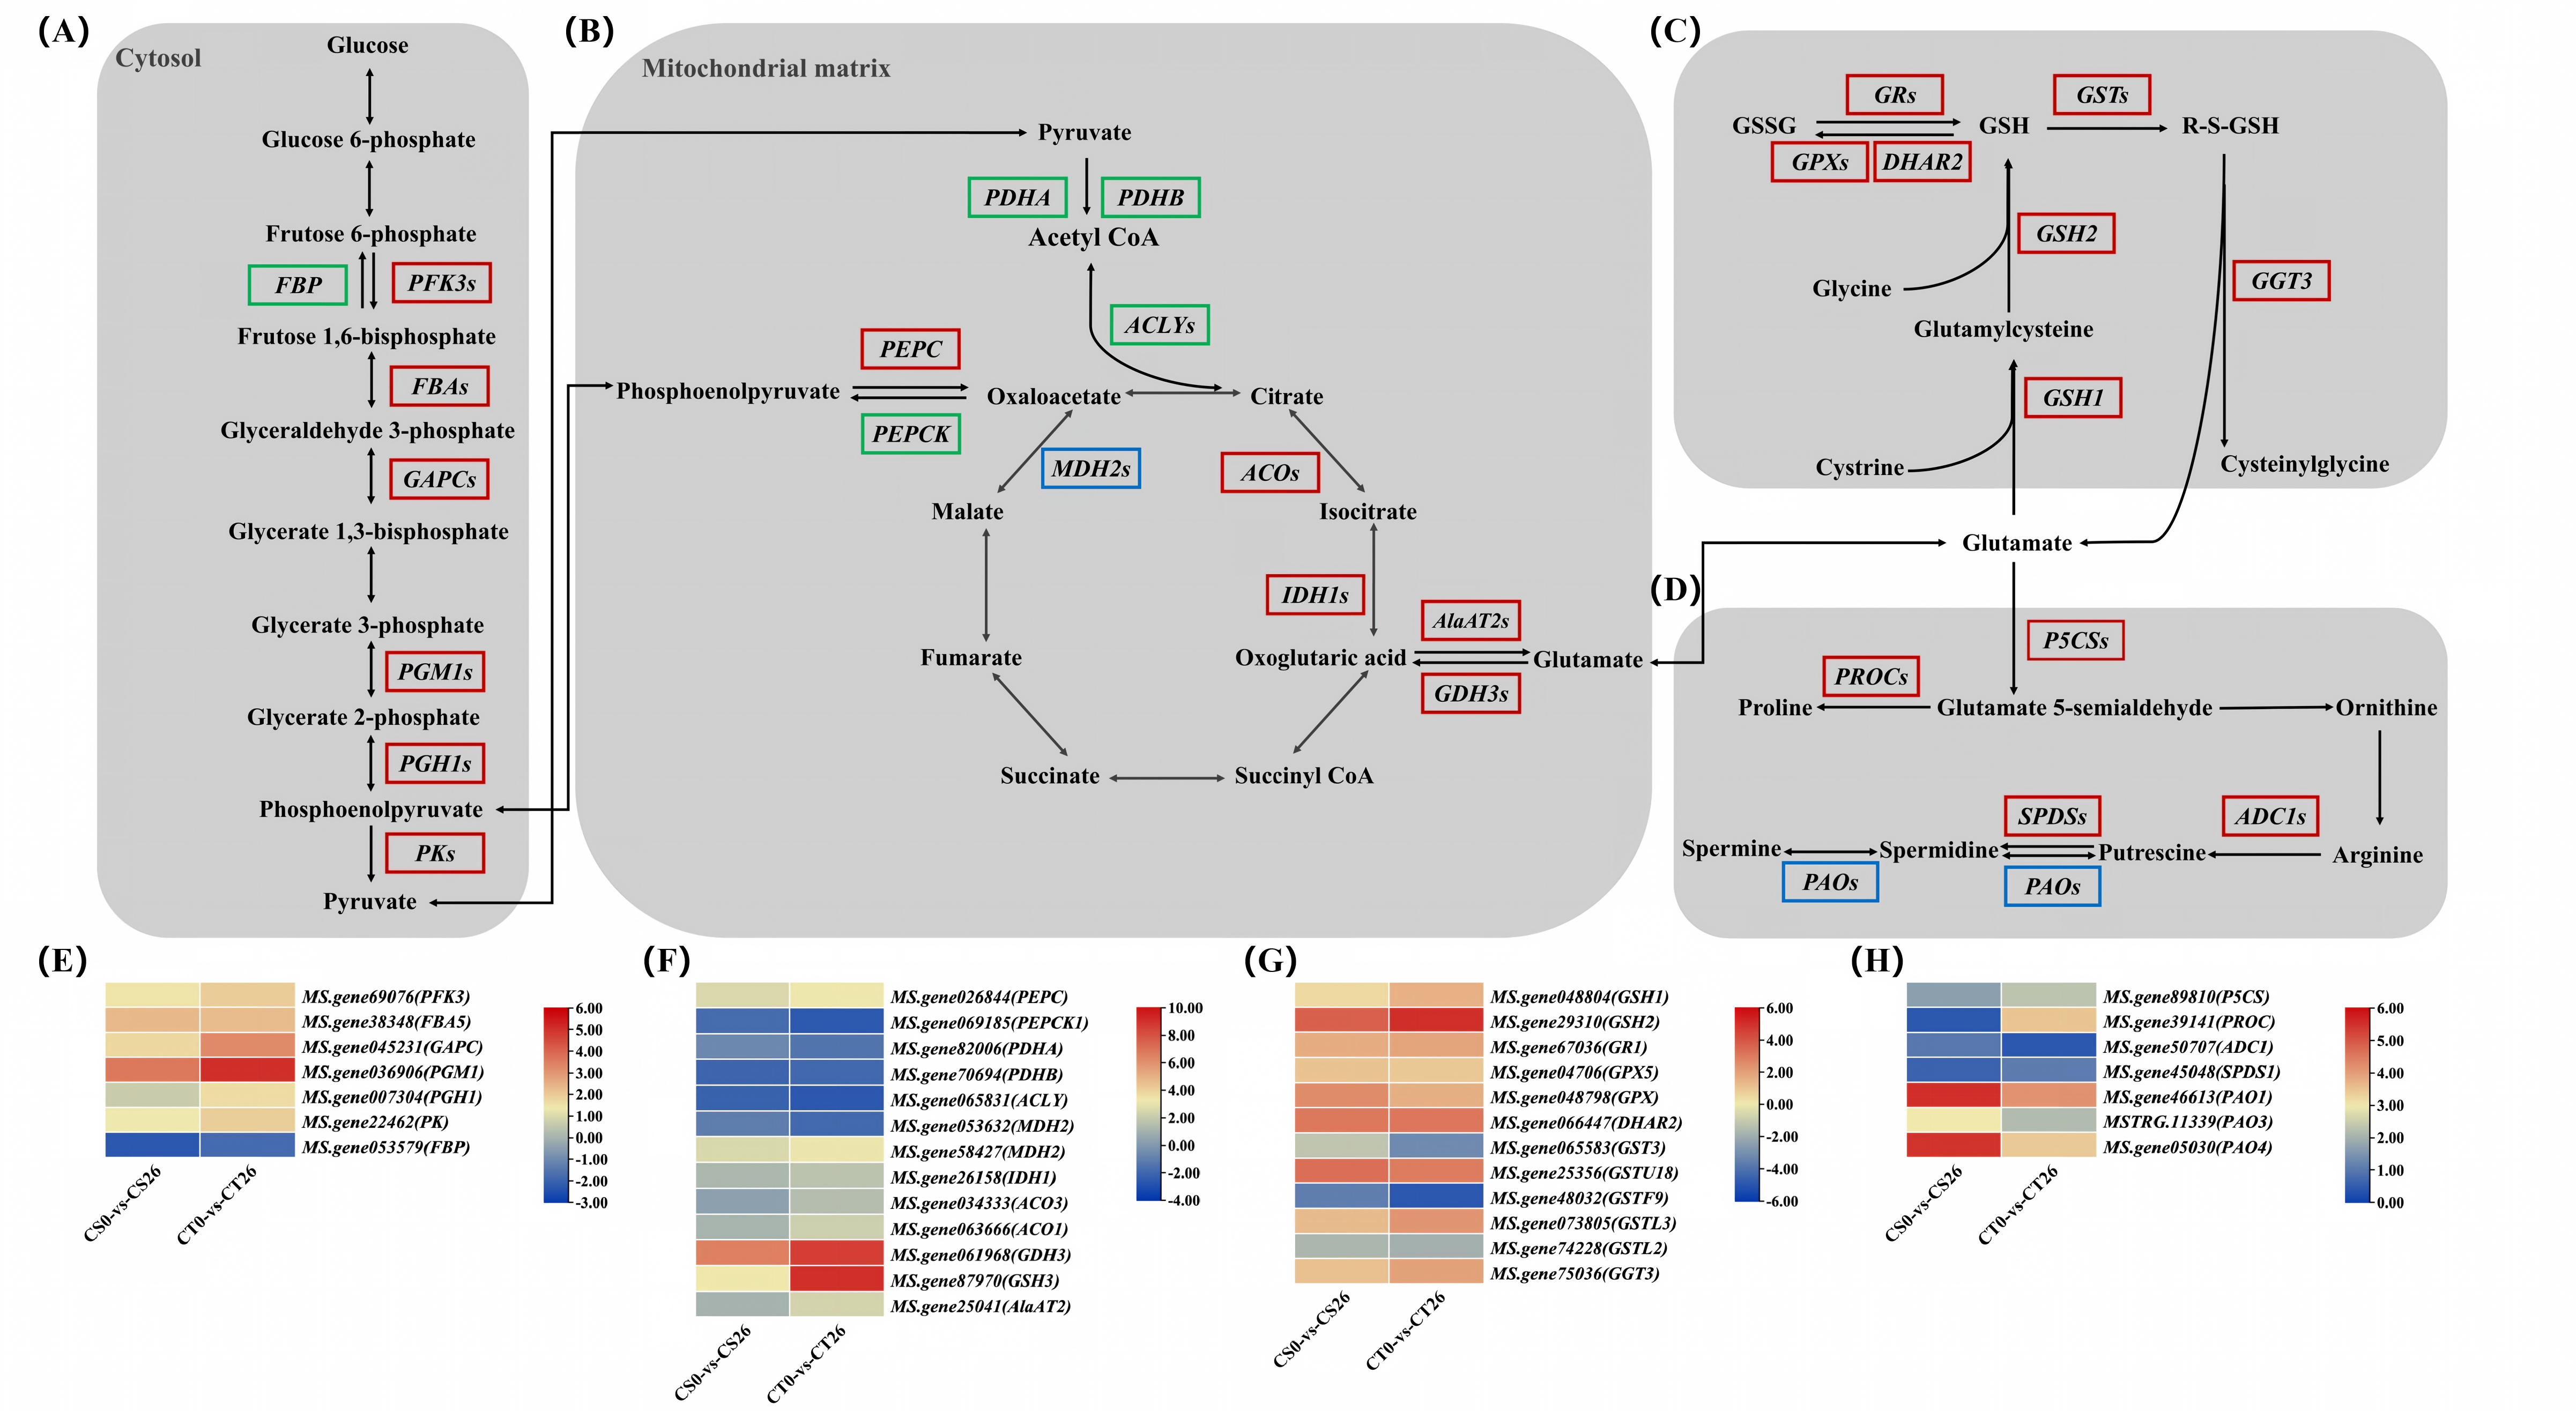
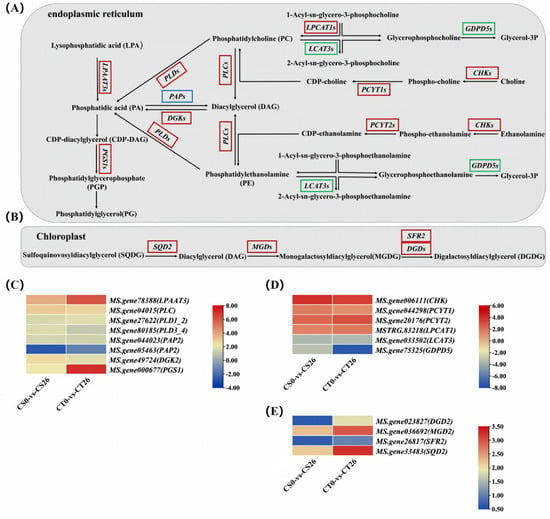
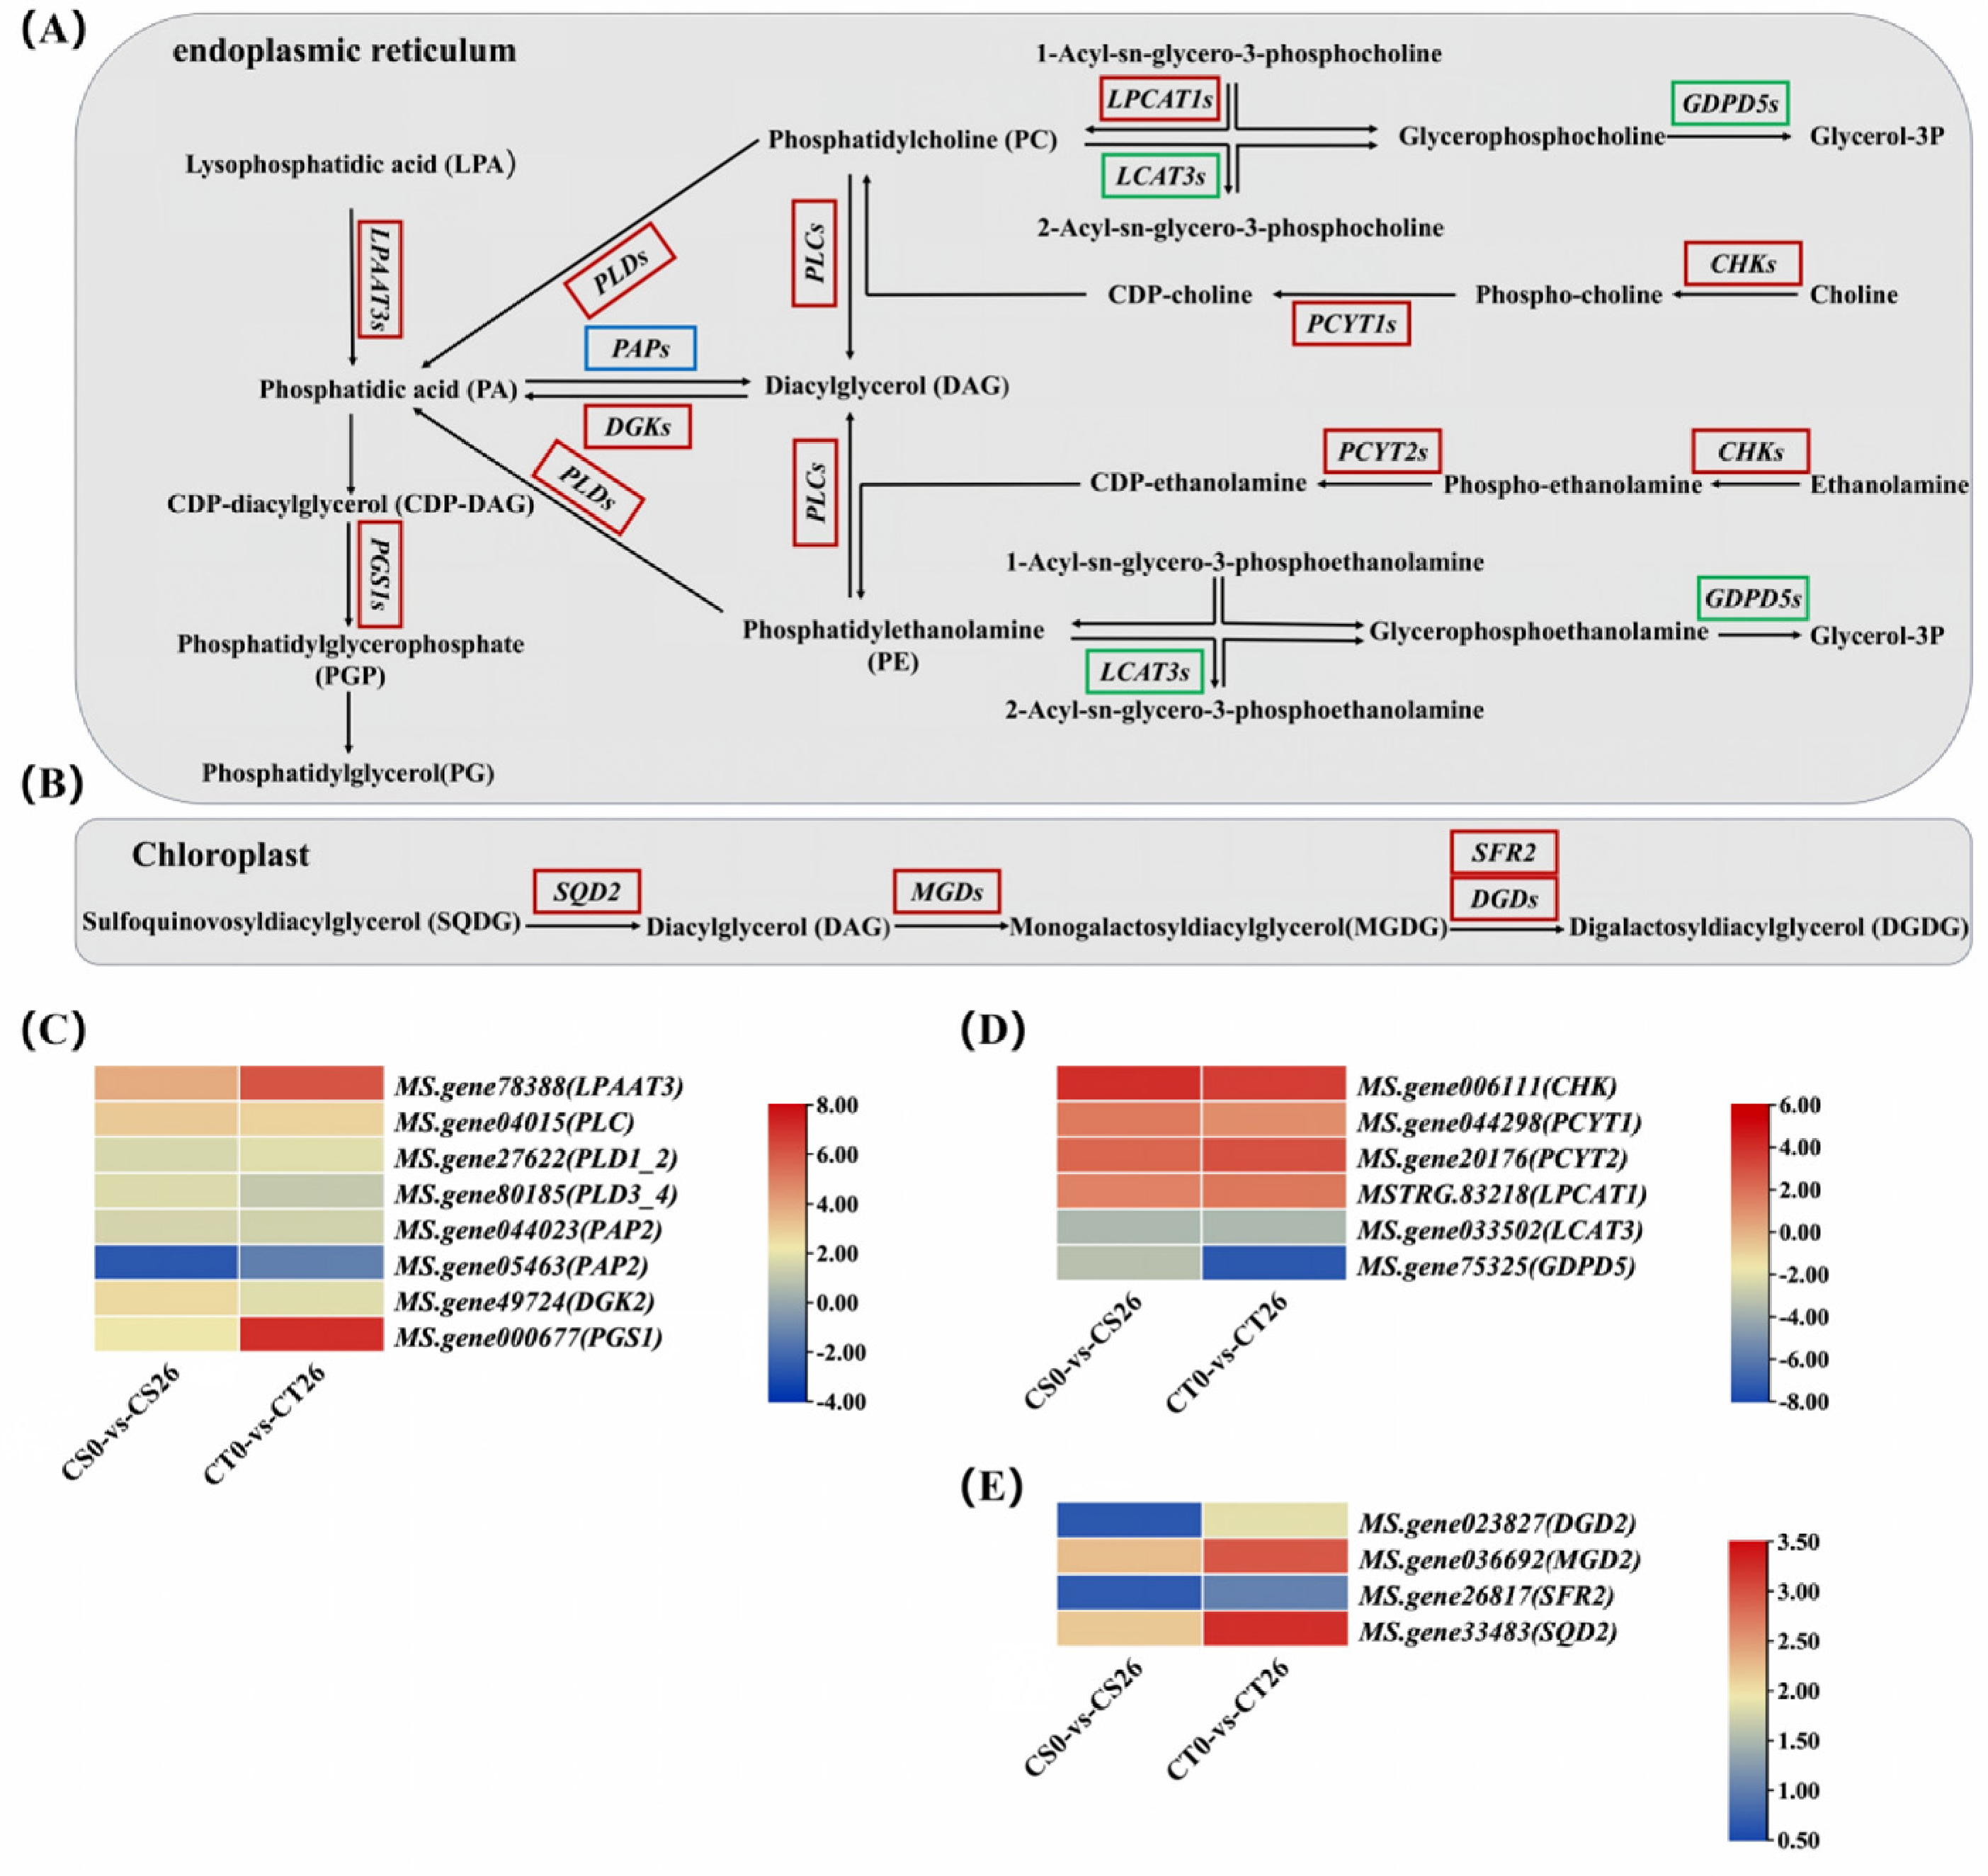
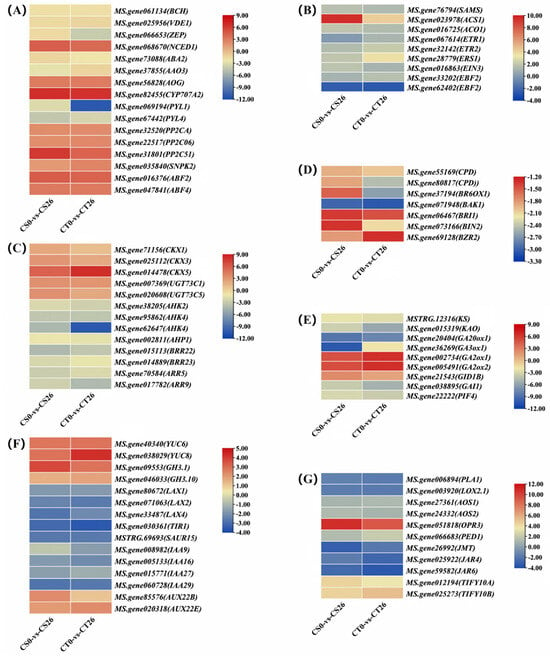
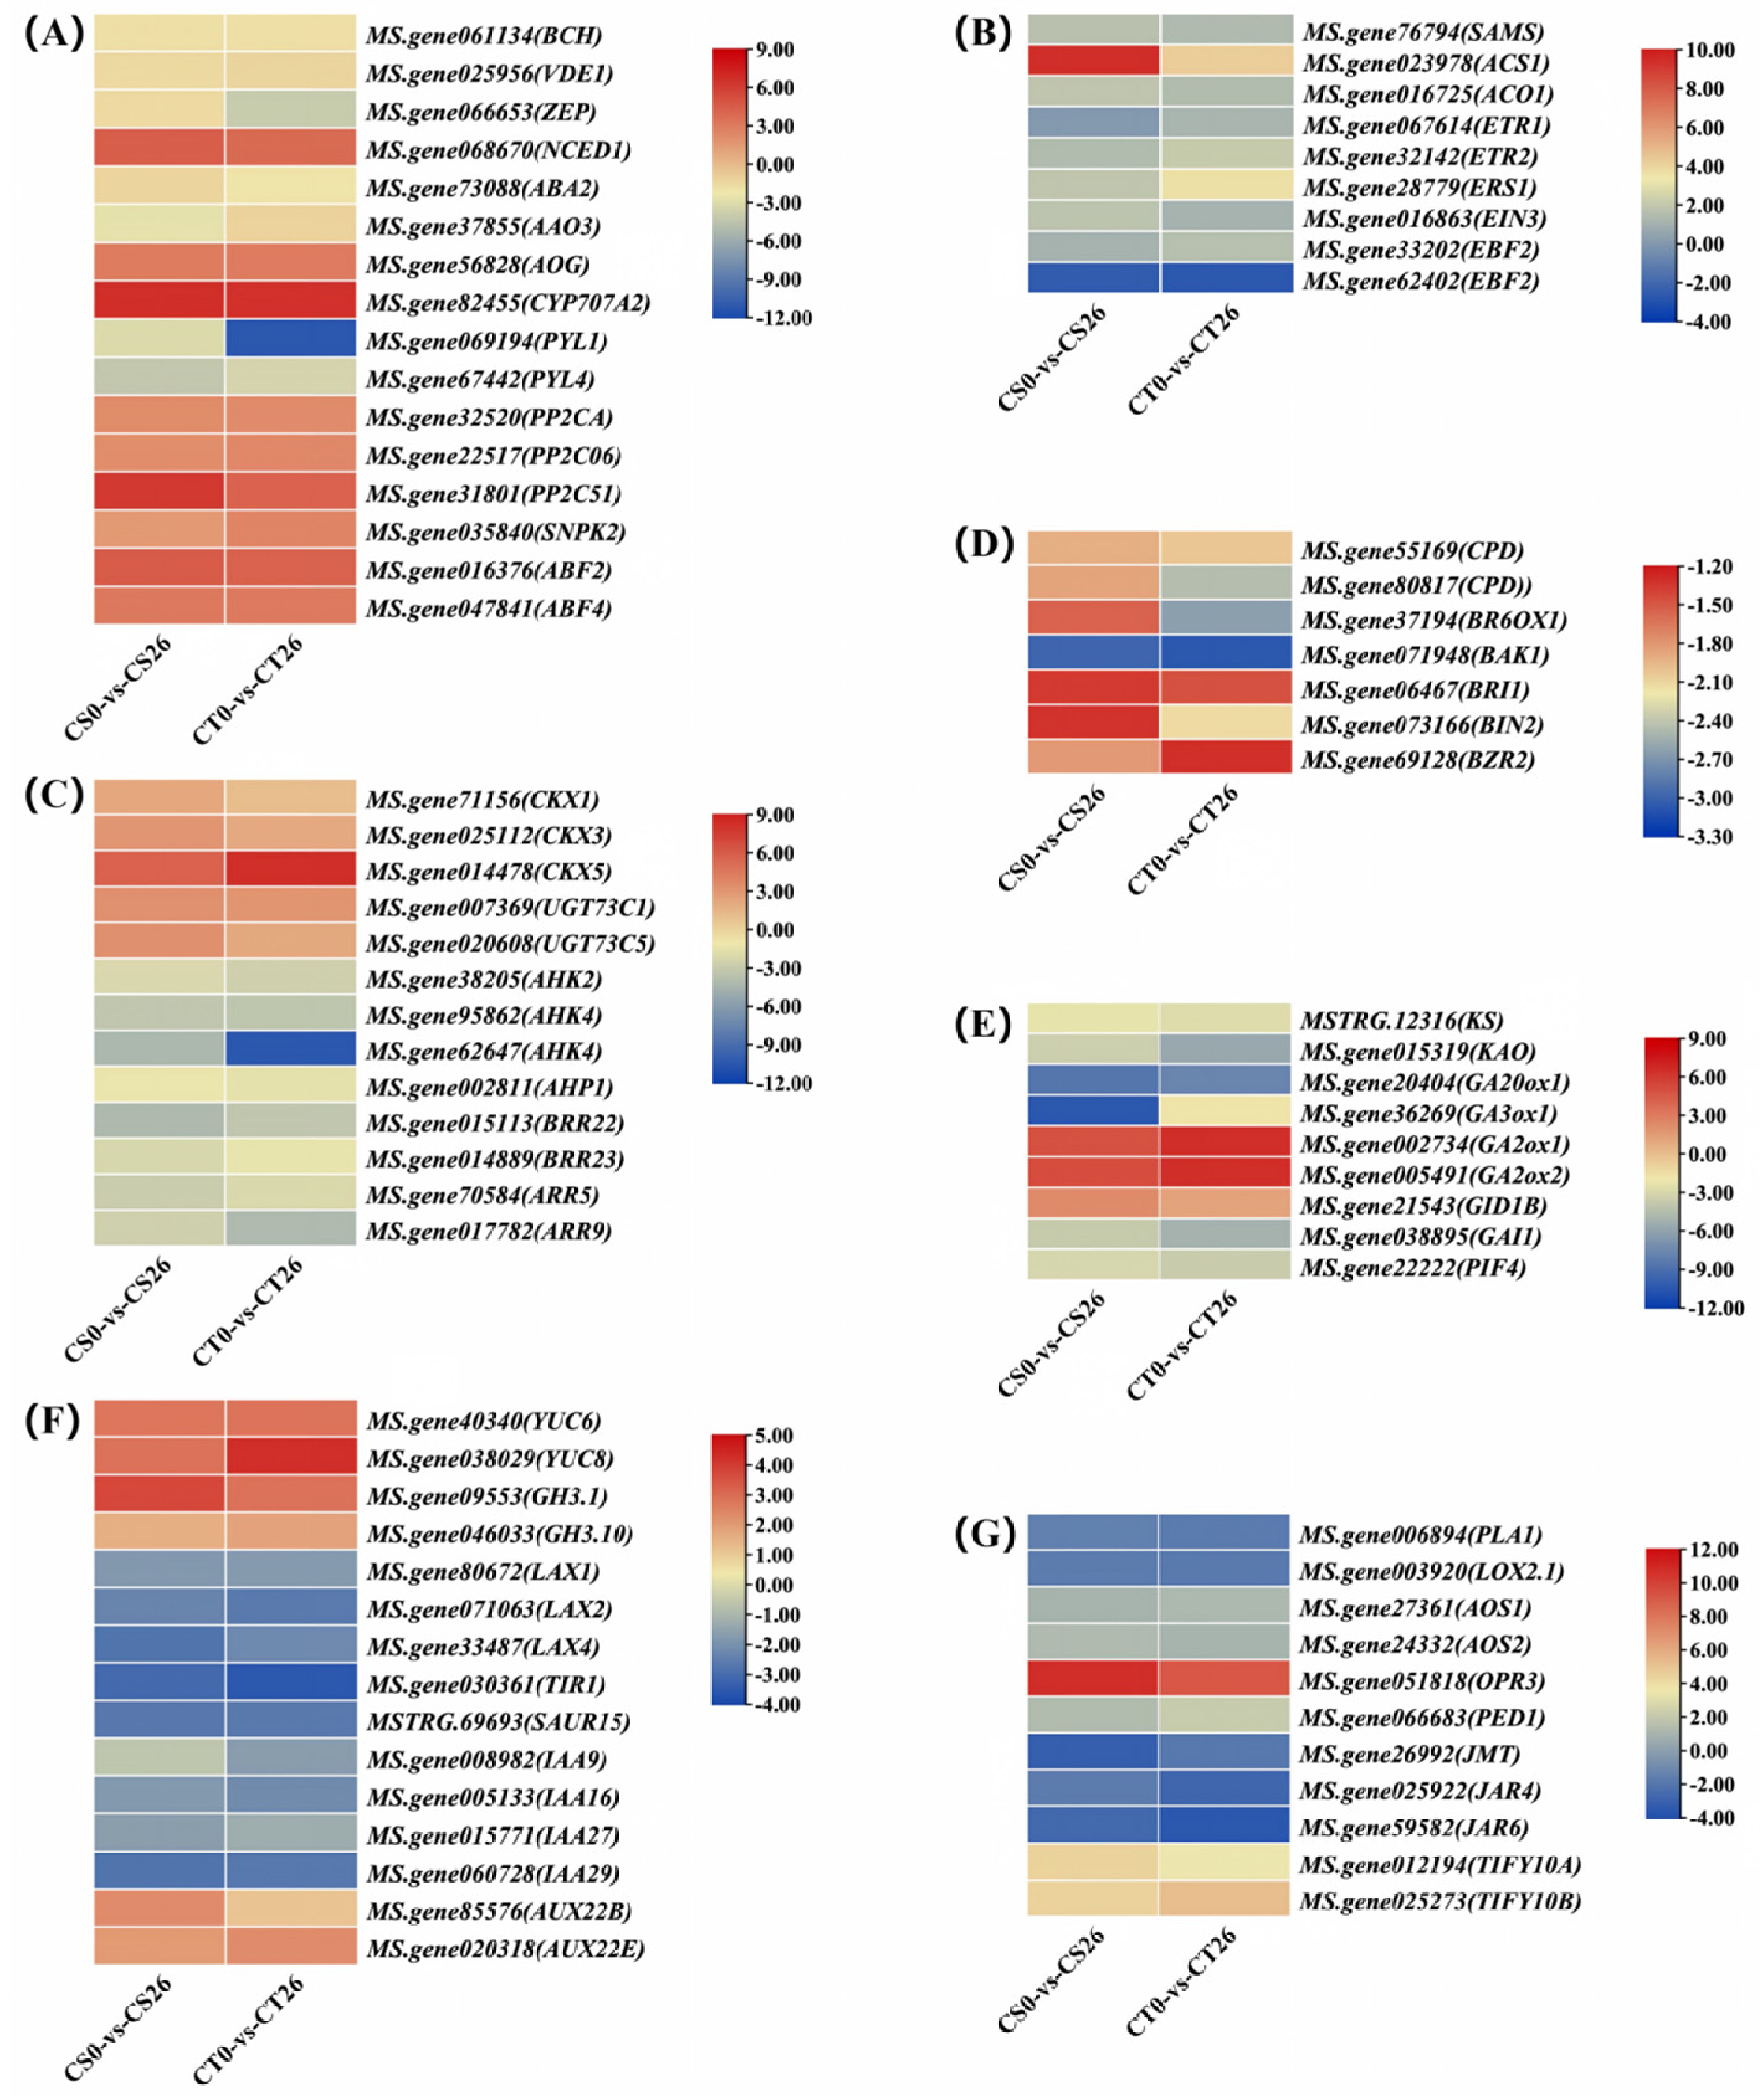
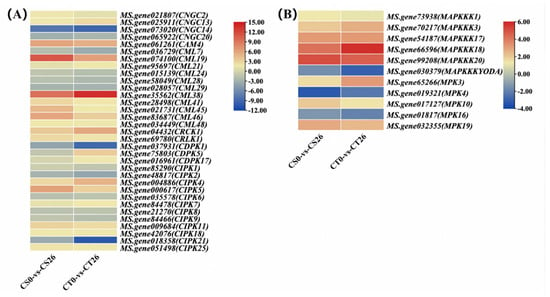
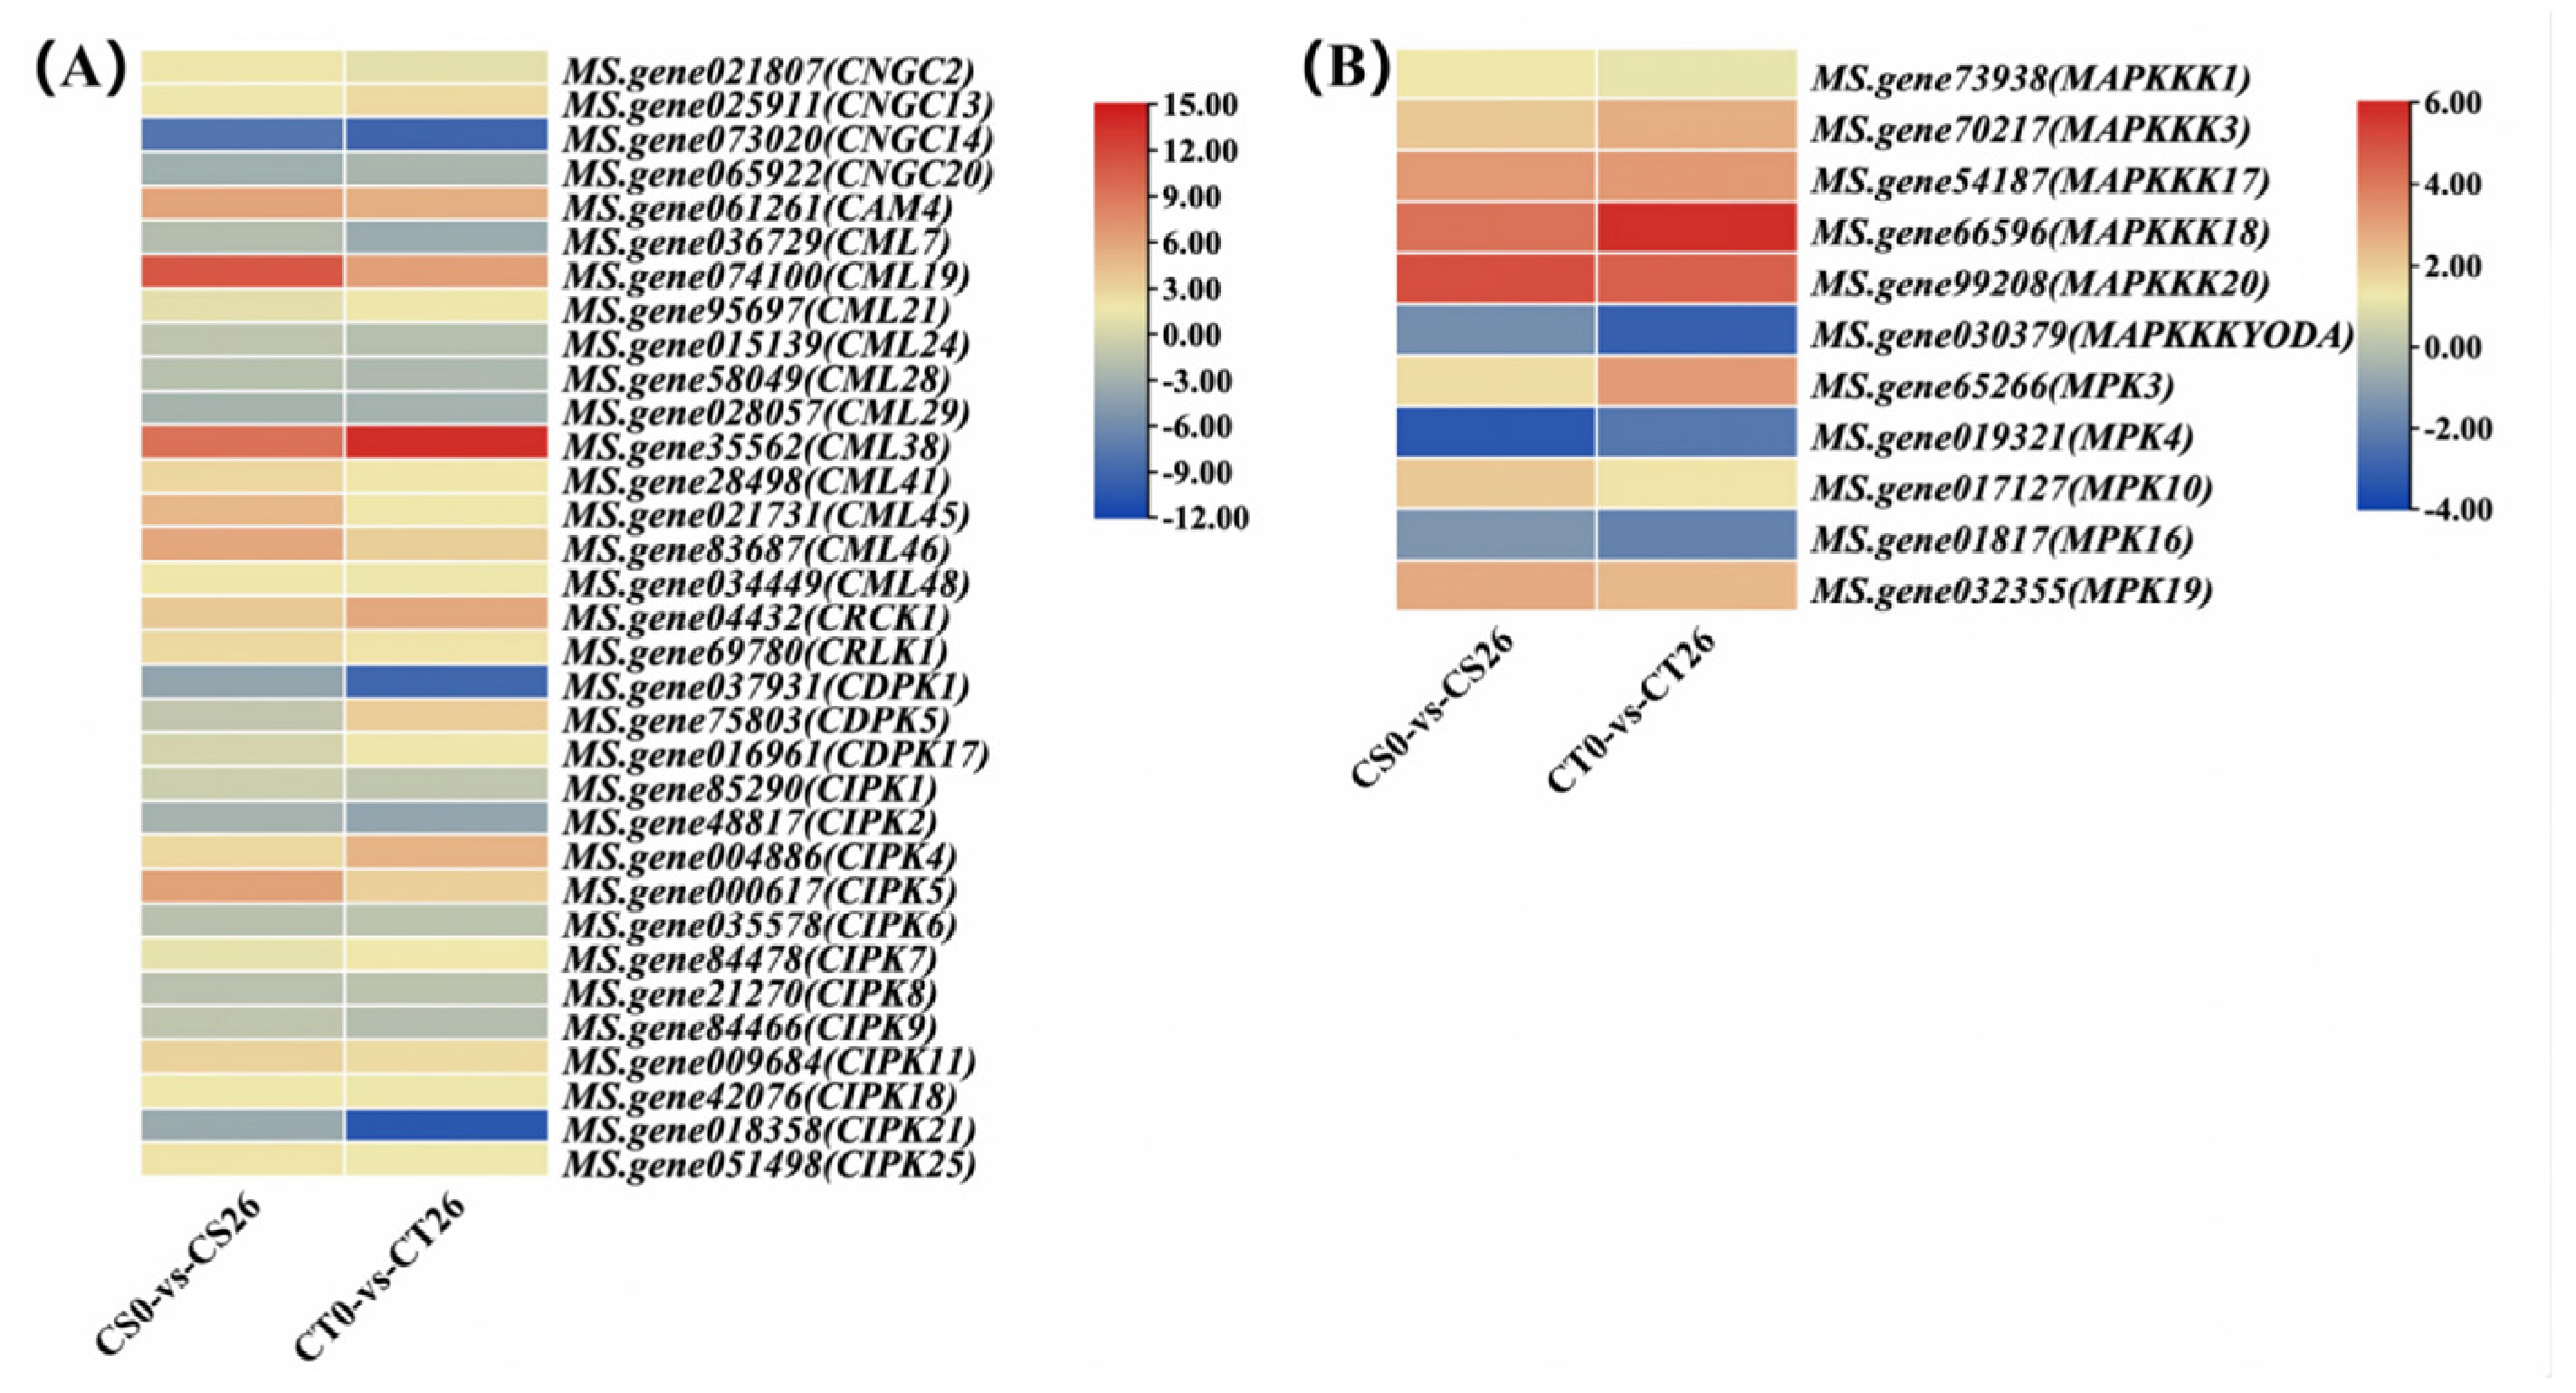
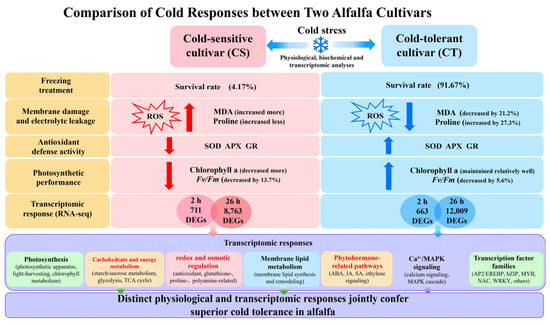
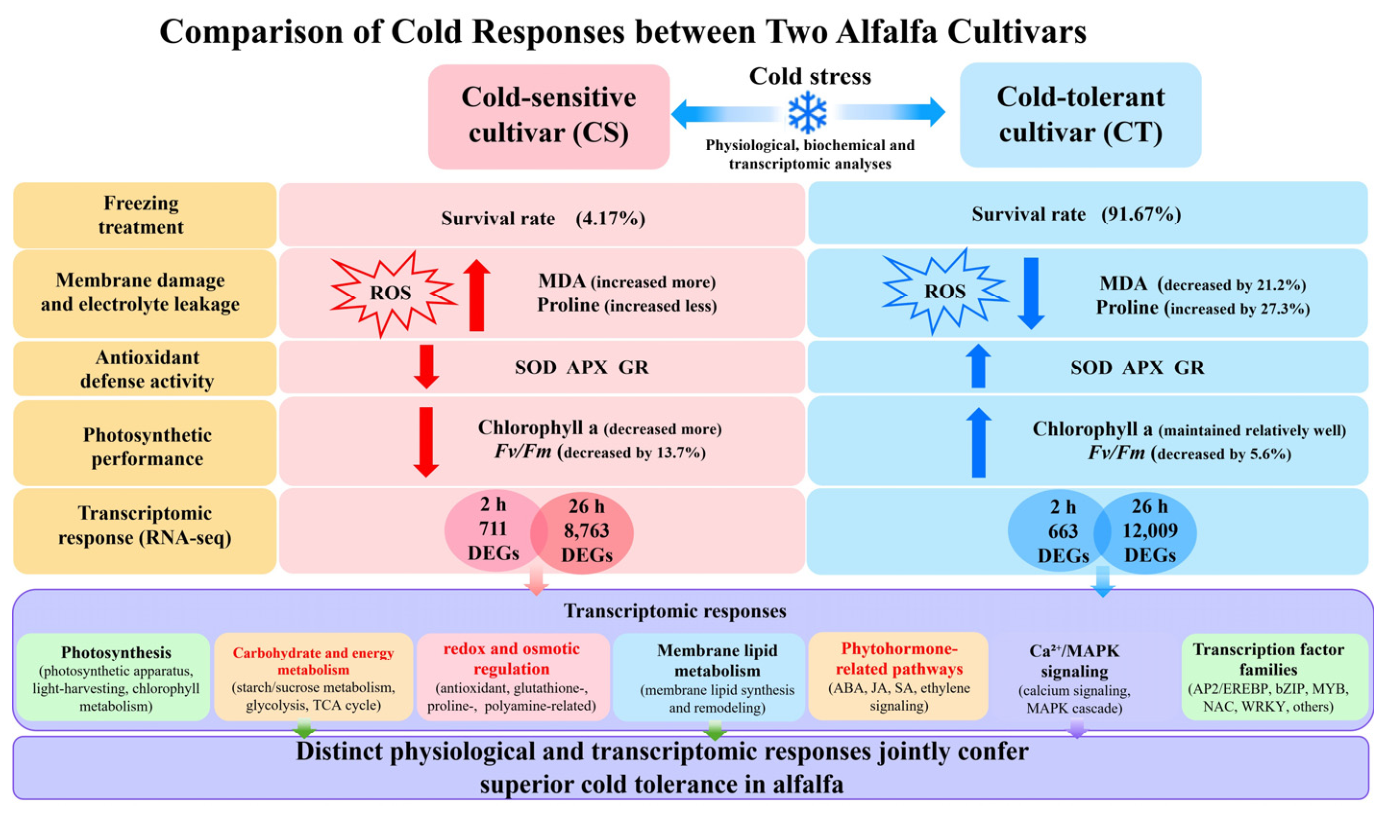

Disclaimer/Publisher’s Note: The statements, opinions and data contained in all publications are solely those of the individual author(s) and contributor(s) and not of MDPI and/or the editor(s). MDPI and/or the editor(s) disclaim responsibility for any injury to people or property resulting from any ideas, methods, instructions or products referred to in the content. |
© 2026 by the authors. Licensee MDPI, Basel, Switzerland. This article is an open access article distributed under the terms and conditions of the Creative Commons Attribution (CC BY) license.