


Abstract
Ensuring the agricultural use of chemically treated manure is not detrimental to pasture productivity or soil health is key to integrating coagulation–flocculation into dairy effluent management systems. This study evaluated the agronomic performance of manure solids treated with polyferric sulphate (PFS) or a tannin-based coagulant/flocculant (Tanfloc SG®) in south-eastern Australia. In two independent experiments using PFS (2022) and Tanfloc (2023), fifteen perennial ryegrass plots (1.5 × 2.5 m) were assigned to treatments: Control (no fertilizer), untreated liquid manure (96 t ha−1), treated solids (96 t ha−1), or urea (100 kg N ha−1). Over nine months, pasture dry matter (DM) yield, soil properties, plant chemical composition, and nutrient uptake were measured. Short-term measurements of CO2, CH4, N2O, and NH3 concentrations were also undertaken. In both experiments, treated solids, urea, and untreated liquid manure achieved a higher pasture DM yield than control, with no statistical difference among treatments. PFS increased plant S and soil Fe, while Tanfloc increased plant Cl and soil P; relative to untreated liquid manure. Treated-solids application reduced N2O and NH3 concentrations at sampling times; however, further research is required to quantify gas fluxes. Our findings demonstrate PFS- and Tanfloc-treated solids are not detrimental to pasture growth and nutritive value or soil properties.
1. Introduction
Exploring manure treatment technologies that minimize nutrient losses and replace synthetic fertilizer application will contribute to improving pasture production and farm productivity while reducing the environmental impact of dairy farming. Solid–liquid separation of dairy effluent is a promising approach to improve nutrient management, using both physical and chemical (coagulation–flocculation) methods, with the latter often used to enhance the separation efficiency of the former. While physical methods are effective for dewatering effluent [1], chemical methods improve nutrient recovery in manure solids and the clarity and quality of the remaining liquid fraction [2]. Metal-based salt coagulants neutralize charged suspended particles, destabilizing colloids, and causing them to coalesce into small aggregates or microflocs [3]. Polymer-based coagulant/flocculants adsorb to the surface of colloids by mechanisms of charge neutralization, electrostatic patch, depletion flocculation, and bridging [4,5]. Prior studies showed that coagulants and coagulant/flocculants have different mechanisms that may reduce C or N volatilization, such as acidification [6,7], stabilization [8], microbial inhibition, or protein bioavailability reduction [9].
Polyferric sulphate (PFS) has been tested as a coagulant for farm dairy effluent in pasture-based systems [2,10,11,12,13,14,15], with the agronomic and environmental effects of applying PFS-treated solids from farm dairy effluent well documented. A study found that, compared to untreated farm dairy effluent, PFS-treated solids did not affect pH, total C, total N, Cation Exchange Capacity (CEC), exchangeable cations, or Olsen-P in the top 20 cm of the soil [13]. In addition, PFS-treated solids did not affect pasture dry matter (DM) yield, plant chemical composition, or nutrient uptake of macronutrients and trace elements, except for concentrations of S and Fe [2]. Lysimeter studies further demonstrated environmental benefits of this treatment, which reduced Escherichia coli, total P, and dissolved reactive P compared to untreated farm dairy effluent [15]. Iron leaching losses [14], as well as N leaching and greenhouse gas (GHG) emissions [14,15], were not significantly different from untreated farm dairy effluent.
Although land application of treated solids is generally considered safe and does not pose environmental and health risks [16], there are concerns regarding the accumulation of coagulant components. For example, the accumulation of Fe may have toxic effects on plants [17,18], and polyacrylamides, which break down into acrylamides, can have carcinogenic effects on humans [19]. To address these issues, natural and biodegradable alternatives, such as tannin-based coagulant/flocculants, have emerged as an alternative to metal-based salt coagulants and synthetic polymers. Tanfloc SG® (TANAC, Montenegro, Brazil) is produced from tannins extracted from the bark of Acacia mearnsii and polymerized using Mannich base reactions [20]. One of Tanfloc’s main features is its biodegradability, as indicated by a high ratio (~two-thirds) of biological oxygen demand (BOD) to chemical oxygen demand (COD) [21]. Biochemical oxygen demand indicates the amount of dissolved oxygen consumed by microorganisms to oxidize organic matter in five days, whereas COD is a measure of the amount of oxygen required to oxidize organic matter in the presence of a strong oxidizing agent [22]. Although solids produced with tannin-based coagulant/flocculants have not yet been evaluated in land application trials, laboratory studies suggested potential agronomic and environmental benefits. For example, tannin-treated solids derived from dairy processor wastewater did not contain hazardous levels of toxic heavy metals or organic pollutants [23]. When applied to soil columns, the tannin-treated sludge did not increase leaching of phenols, chloride (Cl), or NO3 compared with a control [24].
There is no general agreement on the effect of tannins on GHG emissions following land application. Gao and Wang [25] indicated that, compared to untreated manure solids, tannic acid-treated solids increased CO2 and CH4, but maintained N2O emissions. In contrast, Min, et al. [26] indicated that condensed and hydrolysable tannins reduced CH4 and N2O emissions. Ingold, et al. [27] also observed that CO2 and N2O emissions were reduced on the first three days post-application to soil; however, these gases eventually matched the production levels of manure without tannins. Overall, the evidence suggests tannins do not consistently mitigate GHG emissions, highlighting the need for field trials of tannin-treated manures.
Given the potential to use coagulants and flocculants to pre-treat dairy effluent and to integrate coagulation–flocculation technologies into dairy effluent management systems, this study aimed to evaluate the effect of surface applications of PFS-treated solids and Tanfloc-treated solids on pasture DM yield, plant chemical composition, nutrient uptake, soil properties, and short-term gas concentrations. While previous studies with PFS-treated solids demonstrated they have a comparable agronomic performance to that of untreated liquid manure, less information is available for Tanfloc-treated solids under temperate Australian conditions, where effluent is typically applied over summer to encourage pasture growth during autumn before winter commences and growth rates slow [28]. We hypothesize that when treated solids are land-applied at a volume rate similar to that of untreated liquid manure, and at an available N rate similar to that of urea, treated solids will achieve a comparable agronomic performance, as assessed by pasture DM yield, plant chemical composition, nutrient uptake, soil properties, and short-term gas concentrations.
2. Materials and Methods
2.1. Experimental Site
This study was conducted as two experiments, one in 2022 (28 March 2022 to 2 December 2023; PFS) and the other in 2023 (4 May 2023 to 6 December 2023; Tanfloc), at the Ellinbank SmartFarm (−38.23989, 145.93788), located in Gippsland, VIC, Australia. The experimental area was divided into three blocks of ten plots (1.5 × 2.5 m) each, with each block running north-south and perpendicular to the <5° slope at the site [29]. Each plot was separated from the others by a 50 cm border. Inside each plot, a 0.07 m2 metal ring with a 14 cm radius was inserted into the soil, leaving 1.0 cm exposed for attachment to a gas chamber (14 cm radius, 22 cm height) for analysis. A 3 m distance separated each block, along with a 3 m perimeter separating the blocks from the rest of the paddock.
The plots consisted of perennial ryegrass (Lolium perenne L.) pasture and were fenced to restrict access by grazing cattle. The soil type, classified as a Ferrosol [30], showed no constraints to pasture growth in samples collected prior to experiments commencing (Table 1). Before the PFS 2022 experiment, plots received three urea applications at 100 kg ha−1 (~46 kg N ha−1) from September to November 2021, with pasture cut to 5 cm height and removed 16 days before the trial. Before the Tanfloc 2023 experiment, plots were fertilized with urea (100 kg ha−1) in May 2022 and March 2023, and the pasture was cut six days before the trial commenced.
The site is in a temperate climatic zone with an average winter–spring dominant rainfall of 1000 mm [31]. In 2022, the mean temperature was 19.1 °C and the annual rainfall was 1193 mm. In 2023, the mean temperature was 19.4 °C and the annual rainfall was 963 mm.
Table 1.
Initial soil chemical properties (mean ± SD) at 0–10 cm of the plot area before each experiment (n = 30).
2.2. Preparation of Organic Amendments
Fresh manure was scraped from the dairy shed of the Ellinbank SmartFarm in each experimental year. Each manure batch collected in 2022 and 2023 was diluted with tap water to 3.0% total solids (TS) and placed in two 100 L HDPE tanks. Diluted manure was used instead of farm dairy effluent (~0.5% TS) to produce sufficient solids for land application for each experiment. The dilution method simulated the real on-farm practice of flushing manure in yards and the dairy parlor with freshwater. In the 2022 experiment, the liquid manure in one of the tanks was treated with 125 mg PFS g TS−1 (equivalent to 1206 mg Fe L−1; PFS at 50% w:v; Henan Yuanbo Environmental Technology, ZhengZhou, China), and the other remained untreated (control). The process was repeated in the 2023 experiment, but in that case, using 109 mg g TS−1 of Tanfloc SG® (Tanfloc at 25% w:v, TANAC, Montenegro, Brrazil). Doses were selected based on previous jar testing, which determined the optimal dose for turbidity removal. After coagulant addition, the diluted manure was stirred using a flat mixing paddle (130 × 50 mm) connected by a shaft to a rotor at 170 rpm for 2 min, and then at 70 rpm for 4 min to allow floc development. The mixture was left to settle for 48 h, after which the liquid fraction was aspirated using a pump. The remaining solid-rich fraction was collected for land application. Liquid fractions were analyzed for turbidity using a turbidimeter (Hach 2100Q, Loveland, CO, USA), resulting in 23 NTU for the PFS treatment and 14 NTU for the Tanfloc treatment.
2.3. Experimental Design
A randomized complete block design consisting of four treatments and 15 experimental units (plots) in three blocks was used for each of the PFS 2022 and Tanfloc 2023 experiments. The treatments consisted of: (1) control (no mineral or organic fertilizer applied), (2) untreated liquid manure (manure diluted to 3.0% TS), (3) treated solids (either PFS-treated solids or Tanfloc-treated solids), or (4) urea. Control plots were replicated six times, and the other treatments were replicated three times, to improve the estimation of baseline pasture variability for treatment comparison. The manure was adjusted to 3.0% TS to allow for sufficient solid recovery following coagulation–flocculation. This dilution does not reflect typical farm dairy effluent TS concentration [28].
Treatment characteristics and N application rates on a per-hectare basis are provided in Table 2. Urea was applied at the recommended rate of 46 kg N ha−1 [33]. Untreated liquid manure applications were based on industry target applications to apply no more than 80 kg N ha−1 [34]. PFS- and Tanfloc-treated solids were applied using the same volume as untreated liquid manure because nutrient analyses were not available prior to treatment application. Plant-available N was determined using Equation (1), according to Lory, et al. [35]:
where OrganicN and NH4 are concentration values obtained in this study with coefficients K1Y1 = 0.39 (untreated liquid manure) and K2NH4 = 0.5 (surface application after three days). The same K1Y1 coefficient was also used for treated solids, as mineralization coefficients for PFS- and Tanfloc-treated solids were not available in the literature.
Plant − Available N = OrganicN × K1Y1 + NH4 × K2NH4
Table 2.
Chemical properties of untreated and treated amendments and fertilizer N applied to plots.
All treatments were applied once on the same day, on 28 March 2022 and 4 May 2023 for experiments 1 and 2, respectively. Thirty-six kg of untreated liquid manure and 36 kg of PFS (2022) or Tanfloc-treated solids (2023) were surface-applied (equivalent to about 10 mm or 96 t ha−1 on a wet mass basis) onto plots using 9 L watering cans adapted with a spoon attached to the spout to ensure even spreading within the plot area. Granular urea (38 g) was spread by hand over each of its corresponding plots.
2.4. Sampling and Laboratory Analysis
Before and after each experiment, five soil cores (2.5 × 10 cm) were collected and bulked from each plot, oven-dried at 40 °C, and ground to less than 2 mm prior to analysis. Soil samples were analyzed following the methods of Rayment and Lyons [36], which included (1) pH (1:5 soil: water, method 4A1; 1:5 soil:0.01 M CaCl2, method 4B2), (2) electrical conductivity (EC, 1:5 soil: water extract, method 3A1), (3) available P (Olsen, method 9C2a; Colwell, method 9B2), (4) available K (Colwell, method 18A1), (5) Exchangeable cations (Ca, Mg, K, sodium (Na) extracted with ammonium acetate, method 15D1, (6) Al by 1 M KCl, method 15G1), (7) CEC calculated as the sum of Ca, Mg, K, Na and Al (method 15J1), (8) organic C (Walkley–Black, method 6A1), (9) organic matter estimated from organic C, (10) sulphur (KCl-40 extractable sulfate-S, method 10D1), (11) micronutrients Copper (Cu), Fe, Manganese (Mn), Zinc (Zn) (DTPA-extractable, method 12A1), (12) Cl (KCl-40 extractable Cl, method 5A2b), and (13) Mineral N (KCl-40 extractable NO3−-N and NH4+-N, method 7C2b).
Plots were harvested four times during the experimental period, when the grass was between the 2- and 3-leaf stage [37]. Pasture was subsampled, with one sample dried at 65 °C for 72 h and ground to less than 1 mm for nutrient analysis and a second sample dried at 105 °C for 24 h to determine DM concentration. Pasture samples were analyzed for nutrient and mineral concentrations according to methods published by Kalra [38] which included (1) total N by combustion (Elementar Vario MAX Cube, Langenselbold, Germany), (2) P, K, S, Ca, Mg, Na, Fe, Mn, Zn, Cu and boron (B) (ICP-OES following HNO3 + H2O2 digestion), (3) molybdenum (Mo) (ICP-MS following HNO3 + H2O2 digestion, Bryson, et al. [39]), and (4) Cl and NH4-N (1:125 water extract, flow injection analysis). The same methods to measure total N and NH4-N were applied to organic amendments. Carbon dioxide, CH4, N2O, and NH3 measurements were conducted using an insulated stainless-steel chamber fitted to the metal ring installed in each plot. Air was pumped through the chamber via an inlet, and gas concentrations were continuously analyzed with a portable FTIR gas analyzer (Gasmet DX4015, Gasmet Technologies Oy, Vantaa, Finland) for 30 min until the CO2 concentration stabilized. Gas concentrations were calculated as the 10% trimmed mean during the 30 min reading. This parameter was used because gas concentrations increased before stabilizing and fluctuating around a plateau. Ambient/background concentrations were not subtracted from chamber measurements. Each plot was sampled in a fixed order, with treated solids plots sampled first, followed by untreated liquid manure, urea, and control plots. Gas measurements were taken 7, 9, and 15 days following land application in the 2022 experiment. For the 2023 experiment, two measurements were taken on days 1 and 7 following land application. Additional sampling events were constrained by wet conditions, which limited the operability of the FTIR analyzer under high moisture conditions.
2.5. Data Analysis
Plant nutrient parameters were calculated as follows for statistical analysis. The nutrient uptake was calculated using Equation (2), according to Havlin, et al. [40].
where DM is the pasture DM yield (kg ha−1), and c is the plant nutrient concentration (%). The agronomic N use efficiency (AgNUE) was calculated on a per-harvest and cumulative basis using Equation (3), according to Belyaeva, et al. [41]:
where DMtreatment and DMcontrol are the DM yield (kg ha−1) in treatment and control plots, respectively. DMcontrol was calculated as the average per block and date. Nx is the N applied (kg ha−1). Mineral balance indicators: Grass Tetany Index (K/(Ca + Mg)) and Dietary Cation–Anion Difference (DCAD) were calculated to assess metabolic risk potential. The DCAD (mEq kg DM−1) was calculated using Equation (4), according to Ender, et al. [42]:
DCAD = (%Na × 434.98 + %K × 255.74) − (%Cl × 282.06 + %S × 623.75)
Pasture DM yield, plant chemical concentrations, plant uptake, and gas concentrations were analyzed by the method of restricted maximum likelihood (REML) with a variance–covariance structure selected to model repeated measurements over time. The selection was via a sequence of likelihood ratio tests. For all variables, a model with uniform correlation (split plot in time), with a random model consisting of block and plot as random effects and repeated measurements within plots, was considered robust. Following the selection of the variance–covariance model, the main effects of treatment, date of measurement, and interaction were assessed using Wald tests. Pairwise comparisons were made using Fisher’s Least Significant Difference (LSD) test at p = 0.050. Since the number of replications varied among treatments, several standard errors of difference and LSD values were presented and calculated from the maximum standard error of difference. The cumulative pasture yield and AgNUE were analyzed using factorial ANOVA with treatment and block as independent variables. Soil properties were contrasted between treatments using repeated measures ANOVA with treatment as a fixed effect, plot nested within block as a random effect, and sampling day as the repeated measure. Statistical analyses were conducted using GenStat (24th edition, VSN International Ltd, Hemel Hempstead, UK), and the graphs were generated using the ggplot2 package (version 4.0.0) in R (version 4.2.2).
3. Results
3.1. Pasture DM Yield
Group comparisons between control, untreated liquid manure, PFS-treated solids, and urea showed significant (p = 0.014, Table 3) differences in pasture DM yield (Table 3). The interaction between the treatment and the harvest date was not significant. Compared to control plots, the application of untreated liquid manure and PFS-treated solids increased DM yield. Pairwise comparisons between untreated liquid manure, urea, and PFS-treated solids indicate that differences were not significant despite differences in available N inputs. The same result was observed for the cumulative pasture DM yield.
Table 3.
Pasture DM yield and AgNUE (mean ± SD) observed in 2022 and 2023 experiments.
Differences in pasture DM yield between control, urea, untreated liquid manure, and Tanfloc-treated solids were significant (Table 3). The interaction between the treatment and the harvest date was not significant. Pairwise comparisons indicate that pasture DM yield of Tanfloc-treated solids and urea was greater than that of the control. Although available N rates differed among treatments, differences between liquid dairy manure, urea, and Tanfloc-treated solids were not significant. The same statistical differences between treatments were observed for the cumulative pasture DM yield.
In 2022, AgNUE differences were not significant (Table 3). The highest values were observed at the second harvest (August 2022), with positive values observed through the fourth harvest. Similarly, in 2023, there were no statistical differences between treatments. The highest values were observed in both first and second harvests. However, the positive AgNUE values did not persist after the second harvest.
3.2. Plant Chemical Composition and Uptake
In 2022, plant concentrations of N, P, K, Ca, Mg, Na, Fe, NH4, Mn, Zn, Cu, B, and Mo (Table 4), as well as the K/(Ca + Mg) ratio and DCAD (Table S1), were not statistically different between control and treatments. However, S (p = 0.030) and Cl (p = 0.049) concentrations differed significantly among treatments. Land application of untreated liquid manure, PFS-treated solids, and urea significantly increased the uptake of nutrients, except for Na and Fe, relative to the control (Table 5). A treatment effect was observed for S concentration. Plots fertilized with PFS-treated solids had a greater plant S concentration (0.28%) compared to untreated liquid manure (0.24%) and control (0.24%) but were not different from urea (0.25%). Although the uptake of S from PFS-treated solids was numerically superior to that of untreated liquid manure and urea, it was not statistically different. Fe concentration and uptake were significantly greater in PFS-fertilized plots at the first harvest (Tables S2 and S3), but not when averaged across dates.
Table 4.
Plant chemical composition across four harvest dates in 2022 and 2023 experiments (mean ± SD).
Table 5.
Nutrient uptake across four harvest dates in 2022 and 2023 experiments (mean ± SD).
In 2023, plant concentrations of N, P, K, S, Ca, Mg, Na, Fe, Mn, Zn, Cu and Mo (Table 4), as well as K/(Ca + Mg) ratios and DCAD (Table S1), were not statistically different between control and treatments. Differences were only observed for Cl (p = 0.001) and B (p = 0.001). Likewise, there were no statistical differences in plant uptake of K, S, Ca, Mg, Na, Fe, Mn, Zn, Cu, B, and Mo between control and treatments, with differences observed for N (p = 0.021), P (p = 0.005), Cl (p = 0.001), and NH4 (p = 0.020) (Table 5). Plots fertilized with Tanfloc-treated solids showed a higher plant Cl concentration (1.2%) compared to control (0.87%), untreated liquid manure (0.99%), and urea (0.84%) treated plots. Plant uptake of Cl from Tanfloc-treated solids (14.7 kg ha−1) was also higher than for control (8.2 kg ha−1), untreated liquid manure (10.0 kg ha−1), and urea (10.6 kg ha−1). The effect of Tanfloc-treated solids on plant concentration and uptake at the first harvest is reported in Tables S2 and S3.
3.3. Soil Properties
Most soil properties in the top 0–10 cm depth were not affected by the application of treated solids (Table 6). Surface application of PFS-treated solids resulted in higher (p = 0.028) Fe concentrations than for plots fertilized with untreated liquid manure but were not different from control or urea plots. Soil CEC was also affected by PFS-treated solids application and was lower (p = 0.047) than urea but not different from the control or untreated liquid manure plots. In contrast, the Ca:Mg ratio did not differ between treatments.
Table 6.
Soil properties at 0–10 cm for treatment plots at the end of each experimental period in 2022 and 2023 (mean ± SD).
Surface application of Tanfloc-treated solids increased soil Olsen-P (p = 0.043) and Colwell-P (p = 0.013) compared to untreated liquid manure but did not differ from the control and urea. Colwell-P in plots fertilized with untreated liquid manure was lower than in the control (p = 0.015) and urea (p = 0.034).
3.4. Short-Term Gas Concentrations
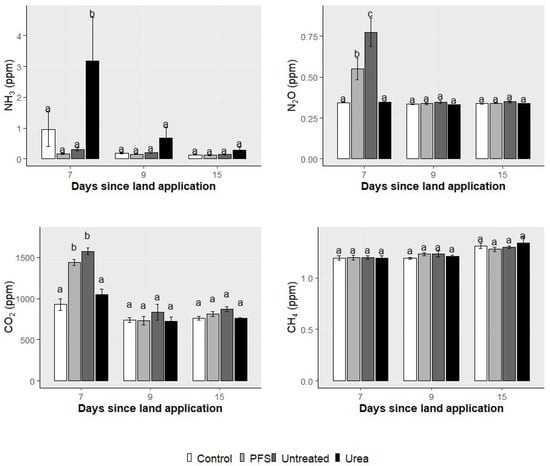
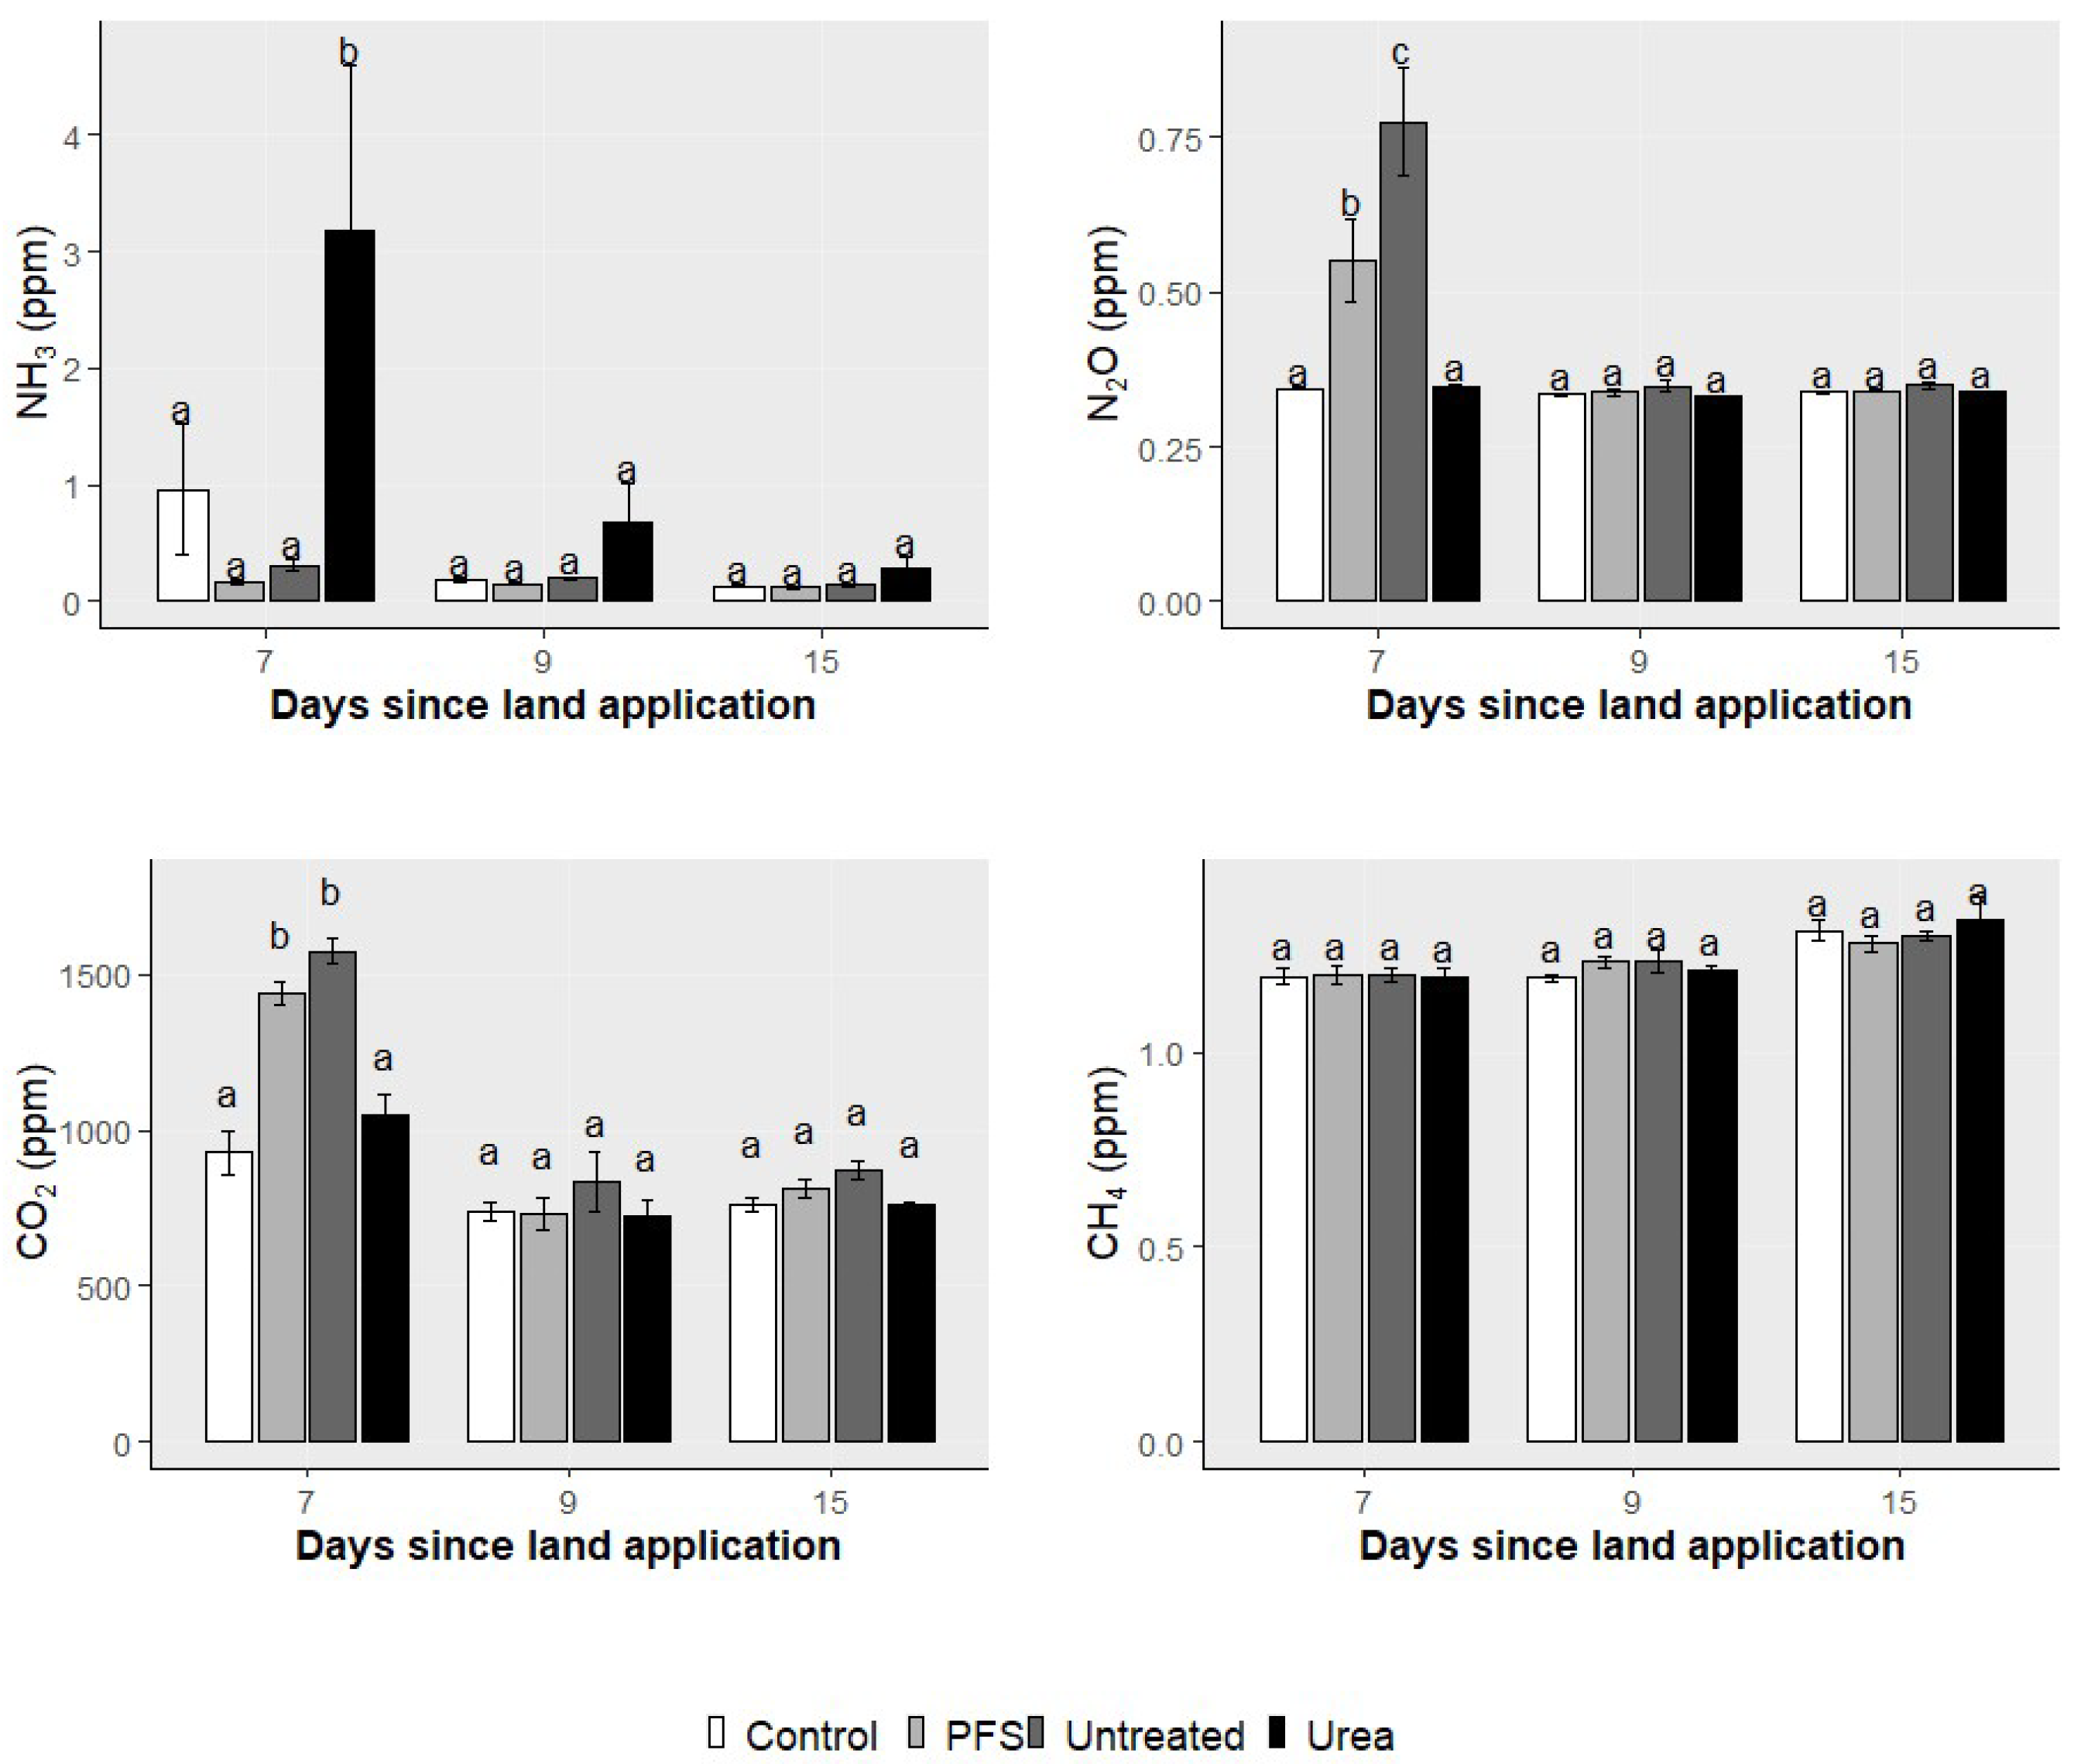
Compared to urea, application of PFS-treated solids resulted in lower NH3 (LSD = 0.79) concentrations at sampling times, but higher CO2 (LSD = 101.2) and N2O (LSD = 0.05) (Figure 1). Compared with untreated liquid manure, plots fertilized with PFS-treated solids emitted less N2O at sampling times. No difference in NH3 and CO2 concentrations were observed between untreated liquid manure and PFS-treated solids. No significant differences in CH4 concentrations between treatments were observed.
Figure 1.
Ammonia, N2O, CO2, and CH4 concentrations in gas (Mean ± SE) after land application of untreated and PFS-treated manure and urea in the 2022 experiment. Different letters within a sampling day indicate significant differences among treatments (p < 0.05).
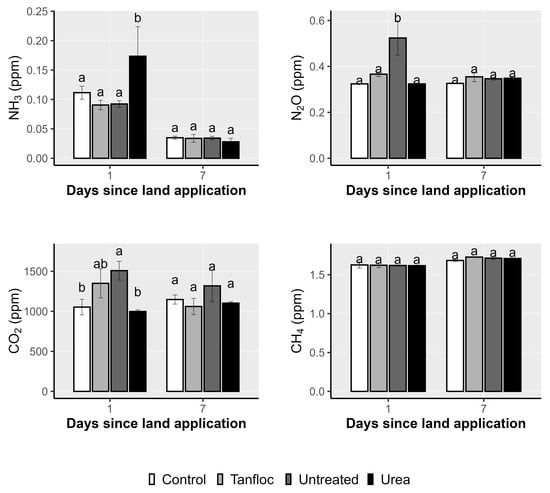
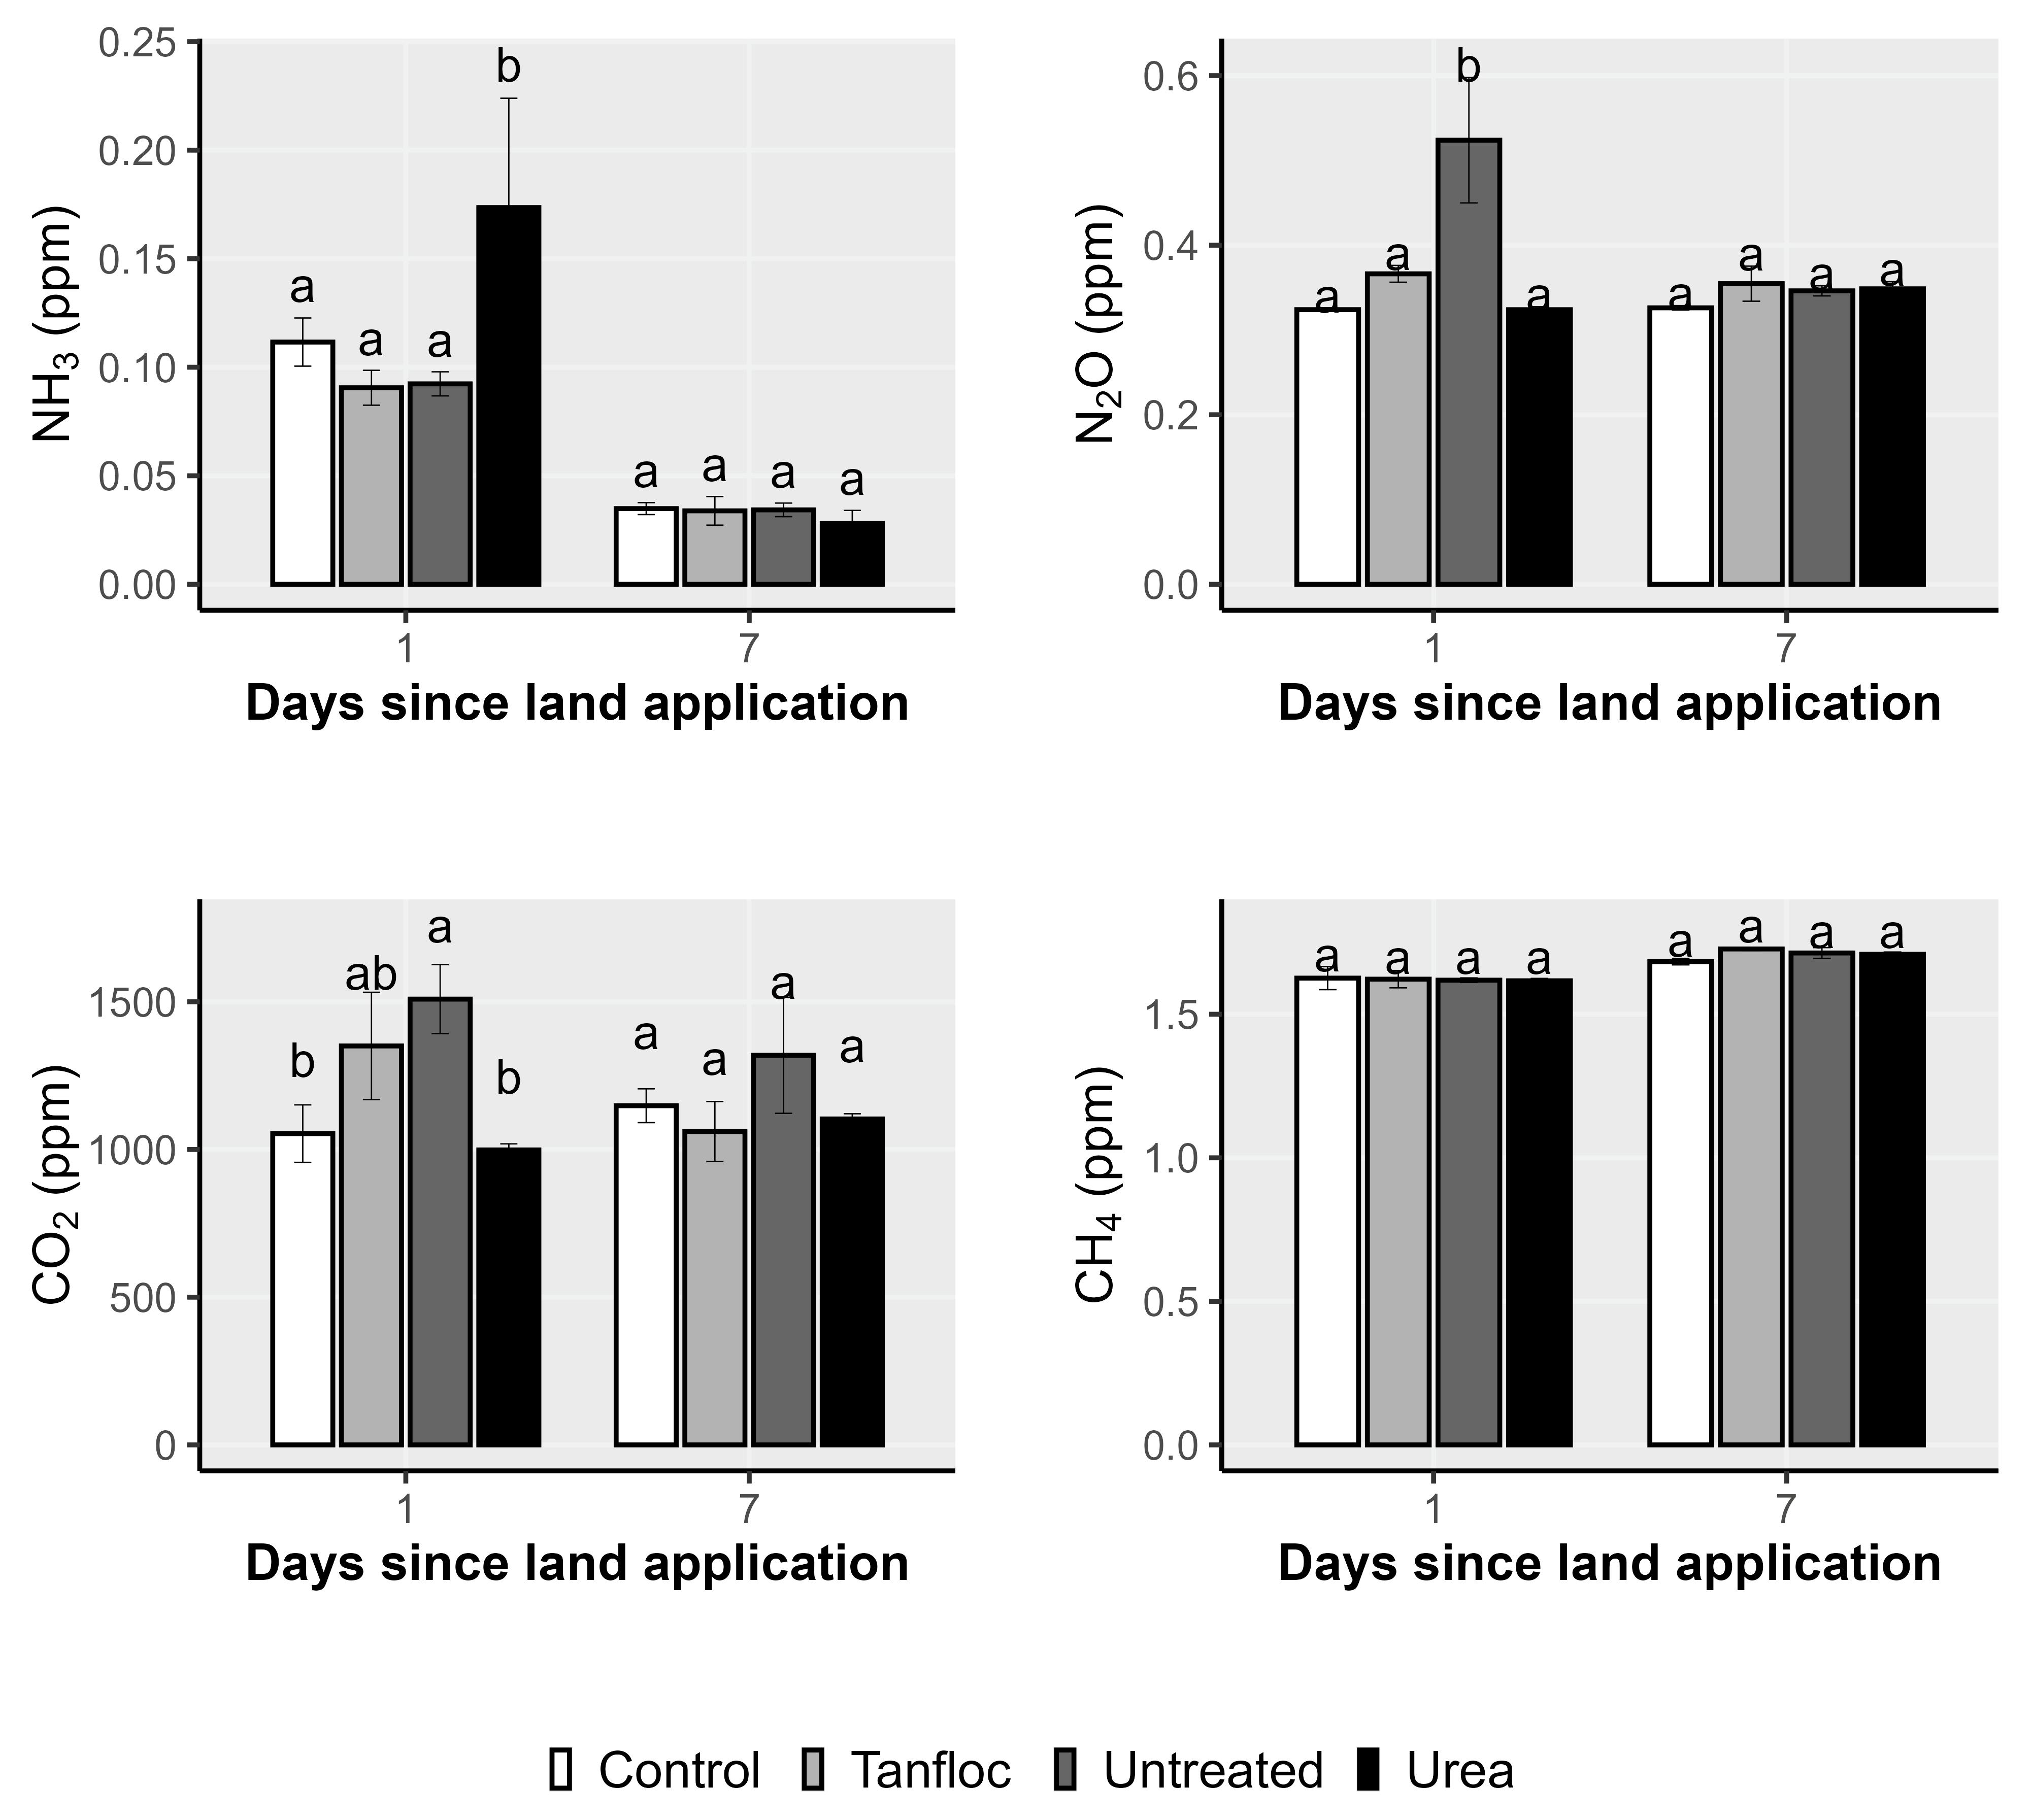
Surface application of Tanfloc-treated solids resulted, on day 7, in lower NH3 concentrations than urea (LSD = 0.05) and lower N2O than untreated liquid manure (LSD = 0.07). Carbon dioxide concentrations from Tanfloc-treated solids were not statistically different from those of untreated liquid manure. Although CO2 concentrations from Tanfloc-treated solids were numerically higher than those of urea on day 7, the difference was not statistically significant (Figure 2). No differences in CH4 concentrations between treatments were observed.
Figure 2.
Ammonia, N2O, CO2, and CH4 concentrations in gas (Mean ± SE) after land application of untreated and Tanfloc-treated manure and urea in the 2023 experiment. Different letters within a sampling day indicate significant differences among treatments (p < 0.05).
4. Discussion
4.1. Pasture Dry Matter Yield
No statistical differences were observed in pasture DM yield (kg DM ha−1) between treated solids (PFS or Tanfloc), untreated liquid manure, and urea. Despite differences in available N application rates among treatments, land application of treated solids maintained pasture DM yield. Therefore, under the conditions in which the experiment was conducted, treated solids are a potential alternative to conventional nutrient sources for pastures. Our findings confirm prior reports that PFS-treated solids did not negatively affect plant growth [2,15].
The highest AgNUE observed for urea, 9.9 kg DM kg N−1 in 2022 and 16.8 kg DM kg N−1 in 2023, agrees with values reported in the literature. In Western Victoria, Australia, Suter, et al. [43] reported agronomic N use efficiencies of 6.9 ± 1.9 kg DM kg N−1 for urea application in mid-April, while McKenzie, et al. [44] reported 9.1–21.2 kg DM kg N−1, which reduced to 1.8–2.2 kg DM kg N−1 over the next growing cycle for mid-April urea application. Furthermore, in Western Victoria, Belyaeva, Ward, Wijesinghe, Chen and Suter [41] reported 5.0–11.2 kg DM kg N−1 following N fertilization in April and harvesting in May. The N use efficiency results observed in this study from urea represent the typical DM yield response relative to N under the experimental conditions.
Year-to-year differences in pasture DM yield and AgNUE could be attributed to land application timing and environmental conditions. In 2022, treatments were applied on 28 March, and the first growth cycle lasted 42 days. The mean temperature during the first growth cycle was 20 °C. Rainfall during the 14 days preceding land application was 45 mm, but only 5.2 mm occurred in the six days prior to land application. Cumulative rainfall from land application to the first harvest was 96.4 mm. In 2023, treatments were applied on 4 May, and the growth cycle lasted 54 days. The mean temperature during the first growth cycle was 15 °C. Fourteen days prior to land application, rainfall was 7.55 mm. However, cumulative rainfall to the first harvest was 243.7 mm.
4.2. Plant Chemical Composition and Uptake
For most nutrients, land application of PFS- and Tanfloc-treated solids did not affect plant nutrient concentrations or nutrient uptake compared with untreated liquid manure or urea. Because PFS increased plant S concentration and Tanfloc increased plant Cl concentration and uptake, this result supported our hypotheses that treated solids can influence the absorption of specific nutrients supplied by the coagulant/flocculant. The higher plant S concentration from fertilization with PFS-treated solids compared to untreated liquid manure is attributed to the S concentration in PFS. A similar result was obtained by Cameron and Di [2]. Despite the higher S concentration in plants fertilized with PFS-treated solids (0.28%), the concentration remained within the range (0.12–0.60%) reported for perennial ryegrass pasture in Australia [45], indicating that the supplied S was in the lower half of this range, and the increase was not excessive. Tanfloc-treated solids had a higher Cl concentration (2.0%) than untreated liquid manure (0.7%), which explains the increased plant concentration and uptake of Cl. The higher Cl concentration in Tanfloc-treated solids is not surprising given Cl represents 13.5% of Tanfloc’s nutrient composition [21]. However, Cl in the soil was similar across treatments, suggesting that Tanfloc’s Cl did not accumulate in the soil but was either leached due to rainfall or absorbed by the plant. This result agrees with findings from Dela Justina, Alves and Skoronski [24], who observed that most of the Cl leached after applying sludge produced from Tanfloc-treated dairy processor wastewater to a soil column. Despite the increase in plant Cl concentration, Cl in pastures fertilized using Tanfloc-treated solids (1.18% DM) was within reported ranges for ryegrass in Australia: 0.15–2.85% DM [45]. Therefore, Tanfloc-treated solids did not raise Cl above normal levels and thus are unlikely to cause any toxicity in the plant. In fact, as Cl is low in pastures, common salt (NaCl) is often supplied to dairy cows to meet Cl requirements [46]. Furthermore, additional Cl in the ration at strategic times (e.g., pre-parturition) is an option to reduce hypocalcemia risk post-parturition [47]. Therefore, although small, the additional Cl supply from Tanfloc may be considered a positive input for cow nutrition.
The average K/(Ca + Mg) ratio in all treatments, including controls, was observed to be higher than 2.2, which is a level that Kemp and Hart [48] reported significantly increases the incidence of grass tetany (hypomagnesemia). Such a high K/(Ca + Mg) ratio is related to high K concentrations in pasture (>2%). However, fertilization with treated solids did not increase the risk of grass tetany in cows relative to control, untreated liquid manure, or urea application. This result is because coagulation–flocculation has minimal effect on K separation, which remains dissolved in the liquid fraction [49]. DCAD levels were higher than the average observed for perennial ryegrass in Gippsland, Victoria: 258 mEq kg DM−1, but lower than the maximum reported: 857 mEq kg DM−1 [45]. Following land application, the highest DCAD values (400–700 mEq kg DM−1) were observed in June-August (Figures S1 and S2). The high DCAD levels were due to high K concentration in plants and were not influenced by treatments. Such levels indicate a high hypocalcemia risk due to a cation–anion imbalance during cows’ late pregnancy and early lactation [50]. Although Tanfloc increased uptake, the Cl remained within normal ranges, and the increase was not large enough to significantly reduce DCAD levels. (Table 5; Figure S2).
4.3. Soil Properties
Most soil properties were not affected by the application of PFS- or Tanfloc-treated solids compared to untreated liquid manure or urea. However, PFS-treated solids influenced soil Fe and CEC, and Tanfloc-treated solids increased soil Olsen-P and Colwell-P, relative to untreated liquid manure.
The higher soil Fe in plots fertilized with PFS-treated solids compared to plots fertilized with untreated liquid manure was expected due to the addition of the coagulant. The Ferrosol soil used in this study is characterized as having more than 5% free iron oxide, and the addition of Fe in PFS was comparatively small and only affected plant concentration or uptake at the first harvest. This is in contrast to higher plant Fe reported by Cameron and Di [2], whose study was undertaken on Immature Pallic soils, which generally contain lower iron oxide concentrations. The CEC was lower in plots fertilized with PFS-treated solids, suggesting that the nutrient retention capacity of soils in these plots was less than that of the urea-fertilized plots. This result is principally attributed to differences in exchangeable Ca, which were also lower than those in urea-fertilized plots, although the difference was not statistically significant. The lower CEC could be attributed to hydroxy-Fe complexes that occupy exchange sites in the soil, thereby preventing exchangeable ions from coming into contact with exchange sites [51].
Olsen-P and Colwell-P increases in response to application of Tanfloc-treated solids could be related to its biodegradability [21]. Although López-Coronado, Aarons, Nagul, Heaven, Giri and Jacobs [49] observed that Tanfloc does not separate as much P as metal-based salt coagulants, such as PFS, our findings suggest this deficiency is compensated by a greater extractability of P from the solid-rich fraction that results in higher Olsen-P and Colwell-P concentrations in soil. Although not significant, PFS numerically decreased soil Olsen-P and Colwell-P levels, most likely due to strong sorption of P to the coagulant. However, over a four-year period with repeated applications of PFS-treated effluent, Olsen-P appeared to increase in low P-fixing Pallic soils [12]. P availability can also be influenced by environmental conditions such as temperature, soil moisture, or pH [52]. Further research should compare both coagulants under the same management and environmental conditions and investigate the effect of repeated applications of treated solids.
4.4. Short-Term Gas Concentration Responses
PFS- and Tanfloc-treated solids resulted in lower NH3 concentrations compared to urea during the sampling period. This effect could be explained by the acidic pH (4.2) of PFS-treated solids, the inhibition of mineralization by tannins [27,53], and the bacterial load in manure, which assimilated some of the NH4 to produce microbial biomass [54]. However, we cannot rule out that environmental factors in 2022 (PFS), such as higher temperature and rainfall prior to land application, could have also led to greater NH3 concentrations from urea compared to 2023. Despite the lower pH in PFS-treated solids and the inhibition mechanisms of tannins, no statistical differences in NH3 concentrations were observed compared to untreated liquid manure. However, the lower N concentration in untreated liquid manure likely contributed to similar NH3 concentrations compared to treated solids. If untreated and treated amendments were applied at the same N rate, greater differences in NH3 concentrations may have been observed.
Greenhouse gas concentrations from land-applied treated solids varied by gas. We initially expected that N2O concentrations would be similar to those of untreated liquid manure and higher than those of urea. However, results suggest that N2O concentrations were lower than those from untreated liquid manure and comparable to those from urea at sampling times. Lower N2O concentrations from urea-fertilized plots compared with plots receiving organic amendments were expected, given that urea hydrolysis primarily produces NH3/NH4. As granular urea was surface-applied, aerobic conditions may have favored nitrification, whereas anaerobic conditions were required for N2O production [54]. It is possible that PFS-treated solids, with a lower pH (4.2) compared to untreated liquid manure (6.8), suppressed nitrifying bacteria that produce N2O as a byproduct of NH3 oxidation [54]. Tanfloc application resulted in a pH of 6.6, which may have reduced N2O concentrations by affecting the microbiome and shifting predominant bacteria. The latter was observed by Min, Willis, Casey, Castleberry, Waldrip and Parker [26] under in vitro conditions, where tannins inhibited Gram-positive and Gram-negative bacteria in fresh manure and reduced N2O emissions. However, microbial communities and N transformation processes were not measured in this study and should be considered as possible explanations only.
Carbon dioxide concentrations from PFS- and Tanfloc-treated solids were not different from those of untreated liquid manure at sampling times. However, only PFS-treated solids showed statistically higher CO2 concentrations than urea-fertilized plots, which is consistent with lower concentrations from urea due to the absence of an added C source. Although Tanfloc also showed numerically greater CO2 concentrations than urea, the difference was not statistically significant. Our PFS results corroborate previous findings by Wang, Di, Cameron and Li [15] and Chisholm, Cameron, Di and Green [14], who also reported non-significant differences between treated and untreated liquid manure. Since PFS- and Tanfloc-treated solids had more DM than untreated liquid manure, our results may suggest that the additional C in treated solids did not significantly affect short-term CO2 concentrations.
Methane concentrations from treated solids were similar to those of untreated liquid manure and, contrary to our initial expectation, they were also similar to those of urea-fertilized plots during the sampling period. This outcome is likely because surface applications did not create anaerobic conditions that would have released CH4.
4.5. Implications for Farmers
PFS- and Tanfloc-treated solids showed no detrimental effects on pasture DM yield, plant nutrient uptake, soil properties, or plant chemical composition compared to untreated liquid manure or urea, supporting our hypothesis that treated solids do not adversely affect agronomic performance when land-applied to a temperate pasture-based dairy system. Although plant S and soil Fe increased following PFS-treated solids and plant Cl and soil P increased following Tanfloc-treated solids application, relative to untreated liquid manure, these changes did not affect pasture productivity.
For dairy farmers, coagulation–flocculation with PFS or Tanfloc is a suitable method to recover nutrients from manure, without affecting agronomic performance. Therefore, chemical treatment has the potential to reduce synthetic fertilizer reliance. Furthermore, chemical treatment provides other benefits, such as improved water recovery, water quality, and solid–liquid separation efficiency [49]. However, the additional costs incurred by chemical treatment may limit its adoption, which stresses the importance of balancing agronomic, environmental, and economic performance, as well as investigating strategies to reduce chemical use.
4.6. Limitations
Limitations should be considered when interpreting the results of the work presented. For example, pasture DM production was measured over nine months following land application. Treatments were applied once in autumn, and pasture was harvested until the following summer when, due to lack of moisture, herbage growth slowed. While pasture growth is minimal during summer, organic amendments can release plant-available N and P over an extended period [55]; thus, the full effect of these manures on pasture DM yield may not have been expressed within the measurement window, and they could have had an effect on pasture growth when rainfall resumed in the subsequent autumn. Therefore, experimentation over a longer time period and including repeated applications should be considered in future research.
Gas concentrations were only measured for two (Tanfloc) and three (PFS) time points, which did not allow us to estimate cumulative gas emissions. Therefore, our gas measurements should only be interpreted as short-term responses following land application rather than total gas losses. Wet conditions limited FTIR sampling because high moisture levels affected instrument operation, reducing the sampling frequency. As a result, we potentially may have missed peak gas production periods. For instance, it is expected that NH3 concentrations would have been greatest immediately after application, particularly for urea. Furthermore, as gas fluxes were not measured, cumulative emissions could not be quantified, and it is unknown whether the observed NH3 or N2O concentration reductions persist over time. Chamber measurements also assume they are representative of gas accumulation during the sampling period. However, our results warrant further research to investigate whether the differences in NH3 and N2O concentrations are associated with changes in N gas dynamics under field conditions using more intensive sampling. This environmental assessment should be complemented with leaching losses to fully account for nutrients such as N, P, Fe, and Cl, which is necessary to assess potential trade-offs with gas-emissions reduction. Prior research observed that PFS- [14,15] and Tanfloc-treated solids [24] did not increase nutrient leaching compared to untreated liquid manure.
While treatment application in this study was based on industry practice for effluent and urea application, this resulted in different plant-available N application rates. Therefore, results should be interpreted cautiously. Future research should evaluate the effect on pasture DM yield considering similar N levels across treatments. Furthermore, our plant-available N values for treated solids should be considered as approximations, as mineralization coefficients used in this study were developed for untreated manure. To generate sufficient treated solids to apply to the plots, scraped manure was diluted with tap water to around 3.0% TS, whereas farm dairy effluent typically has 0.5–1.2% TS [28]. Dilution affects effluent ionic strength, colloidal stability [4], TS, and nutrient separation [49], which may result differences in plant uptake, soil properties, and gas concentrations compared with that from actual farm dairy effluent. Therefore, our results should be interpreted within the context of the 3% TS diluted manure used and may not be representative of all dairy effluent systems.
Finally, PFS and Tanfloc experiments were conducted independently in different years, under different soil, environmental and pasture conditions. Therefore, comparison between coagulants cannot be made. Future studies can evaluate both Tanfloc- and PFS-treated solids in a common experimental design for direct statistical comparison.
5. Conclusions
This study evaluated the effects of surface applications of PFS- and Tanfloc-treated solids on pasture DM yield, plant chemical composition and uptake, soil properties, and short-term gas concentrations. Our results demonstrate that under the single autumn application and nine-month monitoring period evaluated, PFS- and Tanfloc-treated solids did not have a detrimental effect over pasture growth and chemical composition, or soil properties. These findings indicate that treated solids showed potential as recycled nutrient sources for pasture-based dairy systems under the conditions evaluated. Furthermore, chemical treatment can improve nutrient re-distribution over the farm while improving water recovery, quality, and solid–liquid separation efficiency. Our findings, however, were limited by the short-term nature of the experimental periods (9 months for agronomic effects and 2–3 time points for gas measurements), differences between experimental methods and on-farm practice, and by unequal N application rates among treatments. Further research is required to investigate N gas dynamics using more intensive sampling. Future studies should also evaluate the long-term effects of repeated applications of the liquid fraction to pasture, nutrient losses through leaching, and how storage time affects nutrient separation and availability, which has potential implications for agronomic performance. Such information is required to balance agronomic performance, environmental impact, and economic viability, before adoption by dairy systems can be supported.
Supplementary Materials
The following supporting information can be downloaded at https://www.mdpi.com/article/10.3390/agronomy16212188/s1, Figure S1: Monthly DCAD levels in 2022 experiment; Figure S2: Monthly DCAD levels in 2023 experiment; Table S1: Average K/(Ca + Mg) and DCAD across four harvest dates in 2022 and 2023 experiments (mean ± SD); Table S2: Average plant chemical composition at first harvest date (35 days post land application) in 2022 and 2023 experiments; Table S3: Average nutrient uptake at first harvest date (54 days post land application) in 2022 and 2023 experiments.
Author Contributions
Conceptualization: S.R.A.; Methodology: M.W.H. and S.R.A.; Investigation: J.A.D.L.-C. and M.W.H.; Formal analysis: J.A.D.L.-C. and S.R.A.; Visualization: J.A.D.L.-C.; Writing—original draft preparation: J.A.D.L.-C.; Writing—review and editing: S.R.A., E.N. and J.L.J.; Funding acquisition: S.R.A.; Resources: S.R.A.; Supervision: S.R.A., E.N. and J.L.J. All authors have read and agreed to the published version of the manuscript.
Funding
This research was co-funded by the Australian Government Department of Agriculture, Fisheries and Forestry and Victorian State Government Department of Energy, Environment and Climate Action, Agriculture Victoria (CMI 106353). The project ‘Pilot to Paddock (P2P)—Innovative on-farm water, energy and nutrient technologies and practices for Australian Dairy, Egg, Pork and Cropping industries’ was funded through Smart Farming Partnerships Round 2 (ID4-D59GK49).
Data Availability Statement
The original contributions presented in this study are included in the article/Supplementary Materials. Further inquiries can be directed to the corresponding author.
Acknowledgments
We acknowledge Matt Kitching and Bruce Shelley, who contributed to developing and designing the chamber methodology for measuring gas concentrations from the plots; Subhash Chandra for the experimental design; Gavin Kearney for statistical advice; and Jenny Collins for her assistance with effluent application and pasture and soil sample collection and preparation for analysis. Rachael Campbell provided information about effluent application guidelines that were used to inform farmers.
Conflicts of Interest
The authors declare no conflicts of interest.
Abbreviations
The following abbreviations are used in this manuscript:
| AgNUE | Agronomic nitrogen use efficiency |
| DCAD | Dietary cation–anion difference |
| CEC | Cation exchange capacity |
| DM | Dry matter yield |
| GHG | Greenhouse gases |
| LSD | Fisher’s least significant difference |
| PFS | Polyferric sulphate |
| REML | Restricted maximum likelihood |
| Tanfloc | Tanfloc SG® |
| TS | Total solids |
| SD | Standard deviation |
References
- Fournel, S.; Godbout, S.; Ruel, P.; Fortin, A.; Genereux, M.; Cote, C.; Landry, C.; Pellerin, D. Production of recycled manure solids for bedding in Canadian dairy farms: I. Solid-liquid separation. J. Dairy Sci. 2019, 102, 1832–1846. [Google Scholar] [CrossRef] [Scilit]
- Cameron, K.; Di, H.J. A new method to treat farm dairy effluent to produce clarified water for recycling and to reduce environmental risks from the land application of effluent. J. Soils Sediments 2019, 19, 2290–2302. [Google Scholar] [CrossRef] [Scilit]
- Chong, M.F. Direct Flocculation Process for Wastewater Treatment. In Advances in Water Treatment and Pollution Prevention; Sharma, S., Sanghi, R., Eds.; Springer: London, UK, 2012. [Google Scholar]
- Addai-Mensah, J.; Prestidge, C. Structure Formation in Dispersed System. In Coagulation and Flocculation, 2nd ed.; Dobias, B., Stechemesser, H., Eds.; CRC Press: Boca Raton, FL, USA, 2005. [Google Scholar]
- Lee, C.S.; Robinson, J.; Chong, M.F. A review on application of flocculants in wastewater treatment. Process Saf. Environ. Prot. 2014, 92, 489–508. [Google Scholar] [CrossRef] [Scilit]
- Dong, P.; Li, J.; Woldeyohans, A.M.; Parmentier, D.; Van Hulle, S.W.H. Coagulation in combination with anaerobic digestion for enhancement of resource recovery from faecal sludge. J. Environ. Manag. 2024, 358, 120902. [Google Scholar] [CrossRef] [Scilit]
- Hjorth, M.; Nielsen, A.M.; Nyord, T.; Hansen, M.N.; Nissen, P.; Sommer, S.G. Nutrient value, odour emission and energy production of manure as influenced by anaerobic digestion and separation. Agron. Sustain. Dev. (EDP Sci.) 2009, 29, 329–338. [Google Scholar] [CrossRef] [Scilit]
- Ellison, R.J.; Horwath, W.R. Reducing greenhouse gas emissions and stabilizing nutrients from dairy manure using chemical coagulation. J. Environ. Qual. 2021, 50, 375–383. [Google Scholar] [CrossRef] [Scilit]
- Luo, H.; Sun, Y.; Taylor, M.; Nguyen, C.; Strawn, M.; O’Broder, T.; Wang, Z.W. Impacts of aluminum- and iron-based coagulants on municipal sludge anaerobic digestibility, dewaterability, and odor emission. Water Environ. Res. 2022, 94, e1684. [Google Scholar] [CrossRef] [Scilit]
- Dumaine, M.L.; Di, H.J.; Cameron, K.C.; Xueying, C.; Chisholm, C. The effect of treating farm dairy effluent with varying rates of poly-ferric sulphate on reducing phosphorus leaching through simulated pipe-drain systems. N. Z. J. Agric. Res. 2025, 68, 2247–2264. [Google Scholar] [CrossRef] [Scilit]
- Cameron, K.C.; Di, H.J. Discovery of a new method to reduce methane emissions from farm dairy effluent. J. Soils Sediments 2021, 21, 3543–3555. [Google Scholar] [CrossRef] [Scilit]
- Che, X.; Di, H.J.; Cameron, K.; Dodd, R. Treating farm dairy effluent with poly-ferric sulphate dramatically reduces phosphorus and E. coli leaching through subsurface drains—A physical drainage model study. Soil Use Manag. 2022, 38, 1493–1504. [Google Scholar] [CrossRef] [Scilit]
- Che, X.; Di, H.J.; Cameron, K.C.; Dodd, R. Repeated applications of farm dairy effluent treated with poly-ferric sulphate did not adversely affect soil phosphorus availability, P fractions and pasture response—A 4-year field plot study. J. Soils Sediments 2023, 23, 2482–2493. [Google Scholar] [CrossRef] [Scilit]
- Chisholm, C.M.W.; Cameron, K.; Di, H.J.; Green, T.C. The effect of polyferric sulphate treated farm dairy effluent and clarified water on leaching losses, greenhouse gas emissions and pasture growth. N. Z. J. Agric. Res. 2021, 64, 271–285. [Google Scholar] [CrossRef] [Scilit]
- Wang, X.M.; Di, H.J.; Cameron, K.C.; Li, B. Effect of treated farm dairy effluent on E. coli, phosphorus and nitrogen leaching and greenhouse gas emissions: A field lysimeter study. J. Soils Sediments 2019, 19, 2303–2312. [Google Scholar] [CrossRef] [Scilit]
- Elliott, H.A.; Dempsey, B.A. Agronomic Effects of Land Application of Water Treatment Sludges. Am. Water Work. Assoc. 1991, 83, 126–131. [Google Scholar] [CrossRef] [Scilit]
- Oliveira de Araújo, T.; de Freitas-Silva, L.; Santana, B.V.N.; Kuki, K.N.; Pereira, E.G.; Azevedo, A.A.; da Silva, L.C. Tolerance to iron accumulation and its effects on mineral composition and growth of two grass species. Environ. Sci. Pollut. Res. 2014, 21, 2777–2784. [Google Scholar] [CrossRef] [Scilit]
- Zaid, A.; Ahmad, B.; Jaleel, H.; Wani, S.H.; Hasanuzzaman, M. A Critical Review on Iron Toxicity and Tolerance in Plants: Role of Exogenous Phytoprotectants. In Plant Micronutrients: Deficiency and Toxicity Management; Aftab, T., Hakeem, K.R., Eds.; Springer International Publishing: Cham, Switzerland, 2020; pp. 83–99. [Google Scholar]
- Tepe, Y.; Çebi, A. Acrylamide in Environmental Water: A Review on Sources, Exposure, and Public Health Risks. Expo. Health 2019, 11, 3–12. [Google Scholar] [CrossRef] [Scilit]
- Sanchez-Martin, J.; Beltran-Heredia, J.; Solera-Hernandez, C. Surface water and wastewater treatment using a new tannin-based coagulant. Pilot plant trials. J. Environ. Manag. 2010, 91, 2051. [Google Scholar] [CrossRef] [Scilit]
- Hameed, Y.T.; Idris, A.; Hussain, S.A.; Abdullah, N. A tannin-based agent for coagulation and flocculation of municipal wastewater: Chemical composition, performance assessment compared to Polyaluminum chloride, and application in a pilot plant. J. Environ. Manag. 2016, 184, 494–503. [Google Scholar] [CrossRef] [Scilit]
- Tchobanoglous, G.; Stensel, H.D.; Tsuchihashi, R.; Burton, F.L. Wastewater Engineering: Treatment and Resource Recovery, 5th ed.; McGraw-Hill Higher Education: New York, NY, USA, 2014; p. 2018. [Google Scholar]
- Dela Justina, M.; Skoronski, E. Environmental and Agronomical Aspects of Sludge Produced from Tannin-Based Coagulants in Dairy Industry Wastewater Treatment. Waste Biomass Valorization 2020, 11, 1385–1392. [Google Scholar] [CrossRef] [Scilit]
- Dela Justina, M.; Alves, M.; Skoronski, E. Applying different doses of tannin coagulated dairy sludge in soil: Influences on selected pollutants leaching and chemical agronomic attributes. Agric. Water Manag. 2018, 209, 11–19. [Google Scholar] [CrossRef] [Scilit]
- Gao, Z.; Wang, S. Mitigating Gas Emissions from the Dairy Slurry Management Chain: An Enhanced Solid–Liquid Separation Technology with Tannic Acid. Agronomy 2025, 15, 1202. [Google Scholar] [CrossRef] [Scilit]
- Min, B.R.; Willis, W.; Casey, K.; Castleberry, L.; Waldrip, H.; Parker, D. Condensed and Hydrolyzable Tannins for Reducing Methane and Nitrous Oxide Emissions in Dairy Manure—A Laboratory Incubation Study. Animals 2022, 12, 2876. [Google Scholar] [CrossRef] [Scilit]
- Ingold, M.; Wachendorf, C.; Buerkert, A. Net-mineralization of organic matter and greenhouse gas emissions from Quebracho tannin-enriched manure applied to acidic and alkaline soils. J. Plant Nutr. Soil Sci. 2021, 184, 530–542. [Google Scholar] [CrossRef] [Scilit]
- Birchall, S.; Dillon, W.; Wrigley, R. Effluent and Manure Management Database for the Australian Dairy Industry; Dairy Australia: Melbourne, Australia, 2008. [Google Scholar]
- Gourley, C.J.P.; Aarons, S.R.; Heaven, M.W. Nitrogen uptake and leaching from urine and fertilizer applications during simulated grazing rotations of a perennial grass pasture. Agric. Syst. 2025, 224, 104226. [Google Scholar] [CrossRef] [Scilit]
- Isbell, R.F. The Australian Soil Classification, 3rd ed.; CSIRO Publishing: Melbourne, Australia; Collingwood, Australia, 2021. [Google Scholar]
- Bureau of Meteorology. Climate Statistics for Australian Locations-Warragul. Available online: https://www.bom.gov.au/climate/averages/tables/cw_085093.shtml (accessed on 10 April 2026).
- Dairy Soils and Fertiliser Manual Team. Dairy Soils and Fertilizer Manual: Australian Nutrient Management Guidelines; Dairy Australia: Melbourne, Australia, 2013. [Google Scholar]
- Christie, K.M.; Smith, A.P.; Rawnsley, R.P.; Harrison, M.T.; Eckard, R.J. Simulated seasonal responses of grazed dairy pastures to nitrogen fertilizer in SE Australia: Pasture production. Agric. Syst. 2018, 166, 36–47. [Google Scholar] [CrossRef] [Scilit]
- Australia Dairy. Effluent Applications. Available online: https://www.dairyaustralia.com.au/soils-and-water/effluent-management/effluent-applications (accessed on 10 April 2026).
- Lory, J.; Davis, G.; Steen, D.; Li, B.; Fulhage, C. Calculating Plant-Available Nitrogen and Residual Nitrogen Fertilizer Value in Manure; MU Extension: Columbia, MO, USA, 2007; p. 8. [Google Scholar]
- Rayment, G.; Lyons, D. Soil Chemical Methods—Australasia; CSIRO Publishing: Melbourne, Australia, 2010; p. 516. [Google Scholar]
- Donaghy, D.; Fulkerson, B. Principles for Developing an Effective Grazing Management System for Ryegrass-based Pastures; Tasmanian Institute of Agricultural Research: Burnie, Tasmania, Australia, 1999; p. 10. [Google Scholar]
- Kalra, Y. Handbook of Reference Methods for Plant Analysis; CRC Press: Boca Raton, FL, USA, 1998; p. 291. [Google Scholar]
- Bryson, G.; Mills, H.; Sasseville, D.; Benton-Jones, J.; Barker, A. Plant Analysis Handbook III: A Guide to Sampling, Preparation, Analysis, Interpretation and Use of Results of Agronomic and Horticultural Crop Plant Tissue, 3rd ed.; Micro-Macro Publishing Incorporated: Athens, GA, USA, 2014. [Google Scholar]
- Havlin, J.L.; Tisdale, S.L.; Nelson, W.L.; Beaton, J.D. Soil Fertility and Fertilization: An Introduction to Nutrient Management, 8th ed.; Pearson Prentice Hall: Chennai, India, 2014; p. 516. [Google Scholar]
- Belyaeva, O.; Ward, G.; Wijesinghe, T.; Chen, D.; Suter, H. Pasture productivity benefits from strategic urease and nitrification inhibitor use are limited in rainfed temperate dairy pastures of southern Australia. Plant Soil 2024, 505, 317–334. [Google Scholar] [CrossRef] [Scilit]
- Ender, F.; Dishington, I.W.; Helgebostad, A. Calcium balance studies in dairy cows under experimental induction and prevention of hypocalcaemic paresis puerperalis. Z. Fur Tierphysiol. Tierernahr. Futtermittelkunde 1971, 28, 233–256. [Google Scholar] [CrossRef] [Scilit]
- Suter, H.C.; Sultana, H.; Davies, R.; Walker, C.; Chen, D. Influence of enhanced efficiency fertilisation techniques on nitrous oxide emissions and productivity response from urea in a temperate Australian ryegrass pasture. Soil Res. 2016, 54, 523–532. [Google Scholar] [CrossRef] [Scilit]
- McKenzie, F.R.; Ryan, M.J.; Jacobs, J.L.; Kearney, G. Effect of rate and time of nitrogen application from autumn to midwinter on perennial ryegrass–white clover dairy pastures in western Victoria. 1. Growth and composition. Aust. J. Agric. Res. 1999, 50, 1059–1066. [Google Scholar] [CrossRef] [Scilit]
- Rugoho, I.; Gourley, C.J.P.; Hannah, M.C. Nutritive characteristics, mineral concentrations and dietary cation–anion difference of feeds used within grazing-based dairy farms in Australia. Anim. Prod. Sci. 2017, 57, 858–876. [Google Scholar] [CrossRef] [Scilit]
- McDonald, P.; Edwards, R.; Greenhalgh, J.F.D.; Morgan, C.; Sinclair, L.; Wilkinson, R. Animal Nutrition; Pearson: Harlow, UK, 2011. [Google Scholar]
- Goff, J.P.; Ruiz, R.; Horst, R.L. Relative Acidifying Activity of Anionic Salts Commonly Used to Prevent Milk Fever. J. Dairy Sci. 2004, 87, 1245–1255. [Google Scholar] [CrossRef] [Scilit]
- Kemp, A.; Hart, M.L.T. Grass tetany in grazing milking cows. Neth. J. Agric. Sci. 1957, 5, 4–17. [Google Scholar] [CrossRef] [Scilit]
- López-Coronado, J.A.D.; Aarons, S.R.; Nagul, E.; Heaven, M.W.; Giri, K.; Jacobs, J.L. Chemical and Modelling Evaluation of Five Coagulants/Flocculants for Clarifying and Recovering Nutrients from Liquid Dairy Manure (Australia). Water Reuse 2026, 16, 275–295. [Google Scholar] [CrossRef] [Scilit]
- Wilson, G. Metabolic diseases of grazing cattle: From clinical event to production disease. N. Z. Vet. J. 2002, 50, 85–87. [Google Scholar] [CrossRef] [Scilit]
- Sparks, D.L. Environmental Soil Chemistry, 2nd ed.; Academic Press: Millbrae, CA, USA, 2003. [Google Scholar]
- Wang, Y.; Cui, Y.; Wang, K.; He, X.; Dong, Y.; Li, S.; Wang, Y.; Yang, H.; Chen, X.; Zhang, W. The agronomic and environmental assessment of soil phosphorus levels for crop production: A meta-analysis. Agron. Sustain. Dev. 2023, 43, 35. [Google Scholar] [CrossRef] [Scilit]
- Eckard, R.J.; Grainger, C.; de Klein, C.A.M. Options for the abatement of methane and nitrous oxide from ruminant production: A review. Livest. Sci. 2010, 130, 47–56. [Google Scholar] [CrossRef] [Scilit]
- Sommer, S.G.; Christensen, M.L.; Schmidt, T.; Jensen, L.S. Animal Manure: Recycling, Treatment, and Management; John Wiley & Sons, Inc.: Chichester, UK, 2013; p. 364. [Google Scholar]
- Warman, P.R.; Termeer, W.C. Evaluation of sewage sludge, septic waste and sludge compost applications to corn and forage: Yields and N, P and K content of crops and soils. Bioresour. Technol. 2005, 96, 955–961. [Google Scholar] [CrossRef] [Scilit]

Disclaimer/Publisher’s Note: The statements, opinions and data contained in all publications are solely those of the individual author(s) and contributor(s) and not of MDPI and/or the editor(s). MDPI and/or the editor(s) disclaim responsibility for any injury to people or property resulting from any ideas, methods, instructions or products referred to in the content. |
© 2026 by the authors. Licensee MDPI, Basel, Switzerland. This article is an open access article distributed under the terms and conditions of the Creative Commons Attribution (CC BY) license.