


Abstract
Root foraging efficiency under low-phosphorus (P) conditions is a critical constraint for the sustainable development of artificial grasslands. However, the mechanisms by which legume–grass mixtures with complementary deep and shallow root systems regulate soil P availability remain unclear. Based on the hypothesis that root niche differentiation drives stratified soil P utilization, a two-year pot experiment was conducted on these intercropped forages with chernozem soil from 77th Regiment, Zhaosu, Yili, Xinjiang, China. The experiment included monocultures and two mixed-sowing combinations (Medicago sativa/Bromus inermis (AB) and Trifolium pratense/Bromus inermis (CB)) with two sowing patterns (intra-row and inter-row mixed sowing). The results indicated the following: (1) Relative to the CB–intra-treatment, the AB combination increased aboveground and belowground biomass by 39.2% and 138.5%, respectively, and enhanced phosphorus accumulation by 42.2% (inter-row) and 46.7% (intra-row). The land equivalent ratio (LER) of all mixed-sowing treatments was greater than 1, exhibiting stable overyielding performance. (2) Mixed-sowing significantly regulated vertical soil P distribution and rhizosphere P enrichment. The AB combination exhibited significantly superior root phenotypes, associated with deep rhizosphere P content, suggesting a differentiated soil-layer P capture pattern relative to the CB combination. (3) Root volume was the primary factor influencing P use efficiency (PUE), and the mixed-sowing system exhibited a pronounced stratified regulation characteristic: in topsoil, PUE appeared to be synergistically regulated by roots and rhizosphere P; in subsoil, PUE relied primarily on root volume to alleviate low-P stress, achieving efficient deep P utilization. (4) This study proposed a potential topsoil rhizosphere P supplementation threshold range of 4.47–4.899 mg·kg−1. Mixed-sowing forage grasses achieved stratified P utilization in deep and shallow soil layers through root niche differentiation, offering potential quantitative references and practical guidance for efficient establishment and sustainable P management of artificial grasslands in low-P habitats.
1. Introduction
Phosphorus (P) is a key essential element for crop growth and a primary limiting nutrient for plant productivity in terrestrial ecosystems [1,2]. Notably, P exhibits low mobility in soil, and its spatial distribution directly determines the total P accessible to plants. In recent years, climate change has intensified the frequency and severity of drought in arable soils, further constraining P availability, which, in turn, reduces crop yields [3]. P deficiency alters crop physiological function and productivity [4] and impairs root P acquisition, root architecture, biomass allocation, and aboveground growth [5,6]. Therefore, adequate soil P availability is required to sustain plant growth and development, and is critical in ensuring agricultural and pastoral production [7]. Scientifically regulating available P levels in agricultural soils [8], elucidating the mechanisms of P uptake and transformation, and developing efficient management strategies are urgent research priorities in modern agriculture.
As the core organ by which plants acquire soil P, roots exhibit spatial and temporal plasticity, termed “root foraging decision” [9], enabling plants to adjust their root distribution in response to nutrient availability. Variations in root functional traits directly influence soil P availability [10,11]. The mechanism(s) underlying how plants make these “decisions” to cope with heterogeneous nutrient availability remain an active research topic. Under low-P conditions, crops enhance P uptake by increasing total root length (TRL), root surface area (RSA), and mean root diameter (RD) [12], and root traits associated with topsoil foraging are particularly critical for P acquisition due to the low mobility of P [13]. In contrast, under sufficient P conditions, crops allocate resources to taproot elongation and increased RD [14].
Intercropping species with complementary root architectures is a promising strategy for improving soil phosphorus use efficiency. By combining deep-rooted legumes with shallow-rooted grasses, mixtures can exploit soil phosphorus from distinct vertical horizons, thereby reducing interspecific competition and maximizing overall nutrient capture––an effect driven by root spatial niche differentiation [15]. In such systems, shallow roots exhibit enhanced topsoil foraging traits to acquire readily available P from the upper soil profile and further improve phosphorus use efficiency (PUE), while deep taproots penetrate into subsoil layers to access less mobile P pools and facilitate internal P remobilization [8,16]. Accordingly, we focus on phosphorus resources in topsoil and subsoil layers to verify the vertical niche differentiation effects of contrasting root functional types in perennial forage mixtures. However, previous studies on root niche complementarity have been largely confined to crop systems (e.g., wheat/maize [14], wheat/faba bean [17], maize/alfalfa [18]), with little attention to perennial forage mixtures. Moreover, the “medium-deep-rooted” functional type, represented by red clover, has been largely overlooked as a distinct root category between deep and shallow types. To bridge these gaps, we established two perennial legume–grass mixtures with contrasting rooting depths: alfalfa (Medicago sativa L., taproot 1–2 m, deep-rooted) [19] and red clover (Trifolium pratense L., taproot 60–90 cm, medium-deep-rooted) [20], each mixed with smooth bromegrass (Bromus inermis Leyss., fibrous roots 0–30 cm, shallow-rooted) [21]. This “deep–medium-deep–shallow” gradient in a perennial forage system provides the first test of whether root spatial niche differentiation drives stratified phosphorus acquisition in perennial legume–grass mixtures.
In summary, a pot experiment was conducted in Zhaosu County, northern Xinjiang, focusing on deep–shallow-rooting combinations of perennial legume–grass forages, we proposed the following core research hypotheses to be verified in this study: (1) Legume–grass mixtures with contrasting rooting depths (deep vs. medium-deep vs. shallow) exhibit differential spatial niche occupation across soil layers, resulting in distinct PUE patterns. (2) The mixed cropping system exhibits a chain-like regulatory pathway of “mixture combination → root phenotype → soil P distribution → PUE”, which can be quantitatively elucidated by structural equation modeling (SEM). (3) Shallow-rooted mixtures are better adapted to low-P topsoil conditions and exhibit high PUE under such conditions. In contrast, deep-rooted mixtures can overcome the limitation of low phosphorus in subsoil layers and maintain stable PUE across a wider phosphorus gradient.
2. Materials and Methods
2.1. Experimental Site
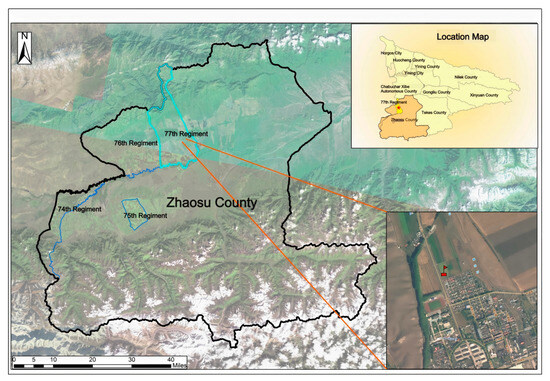
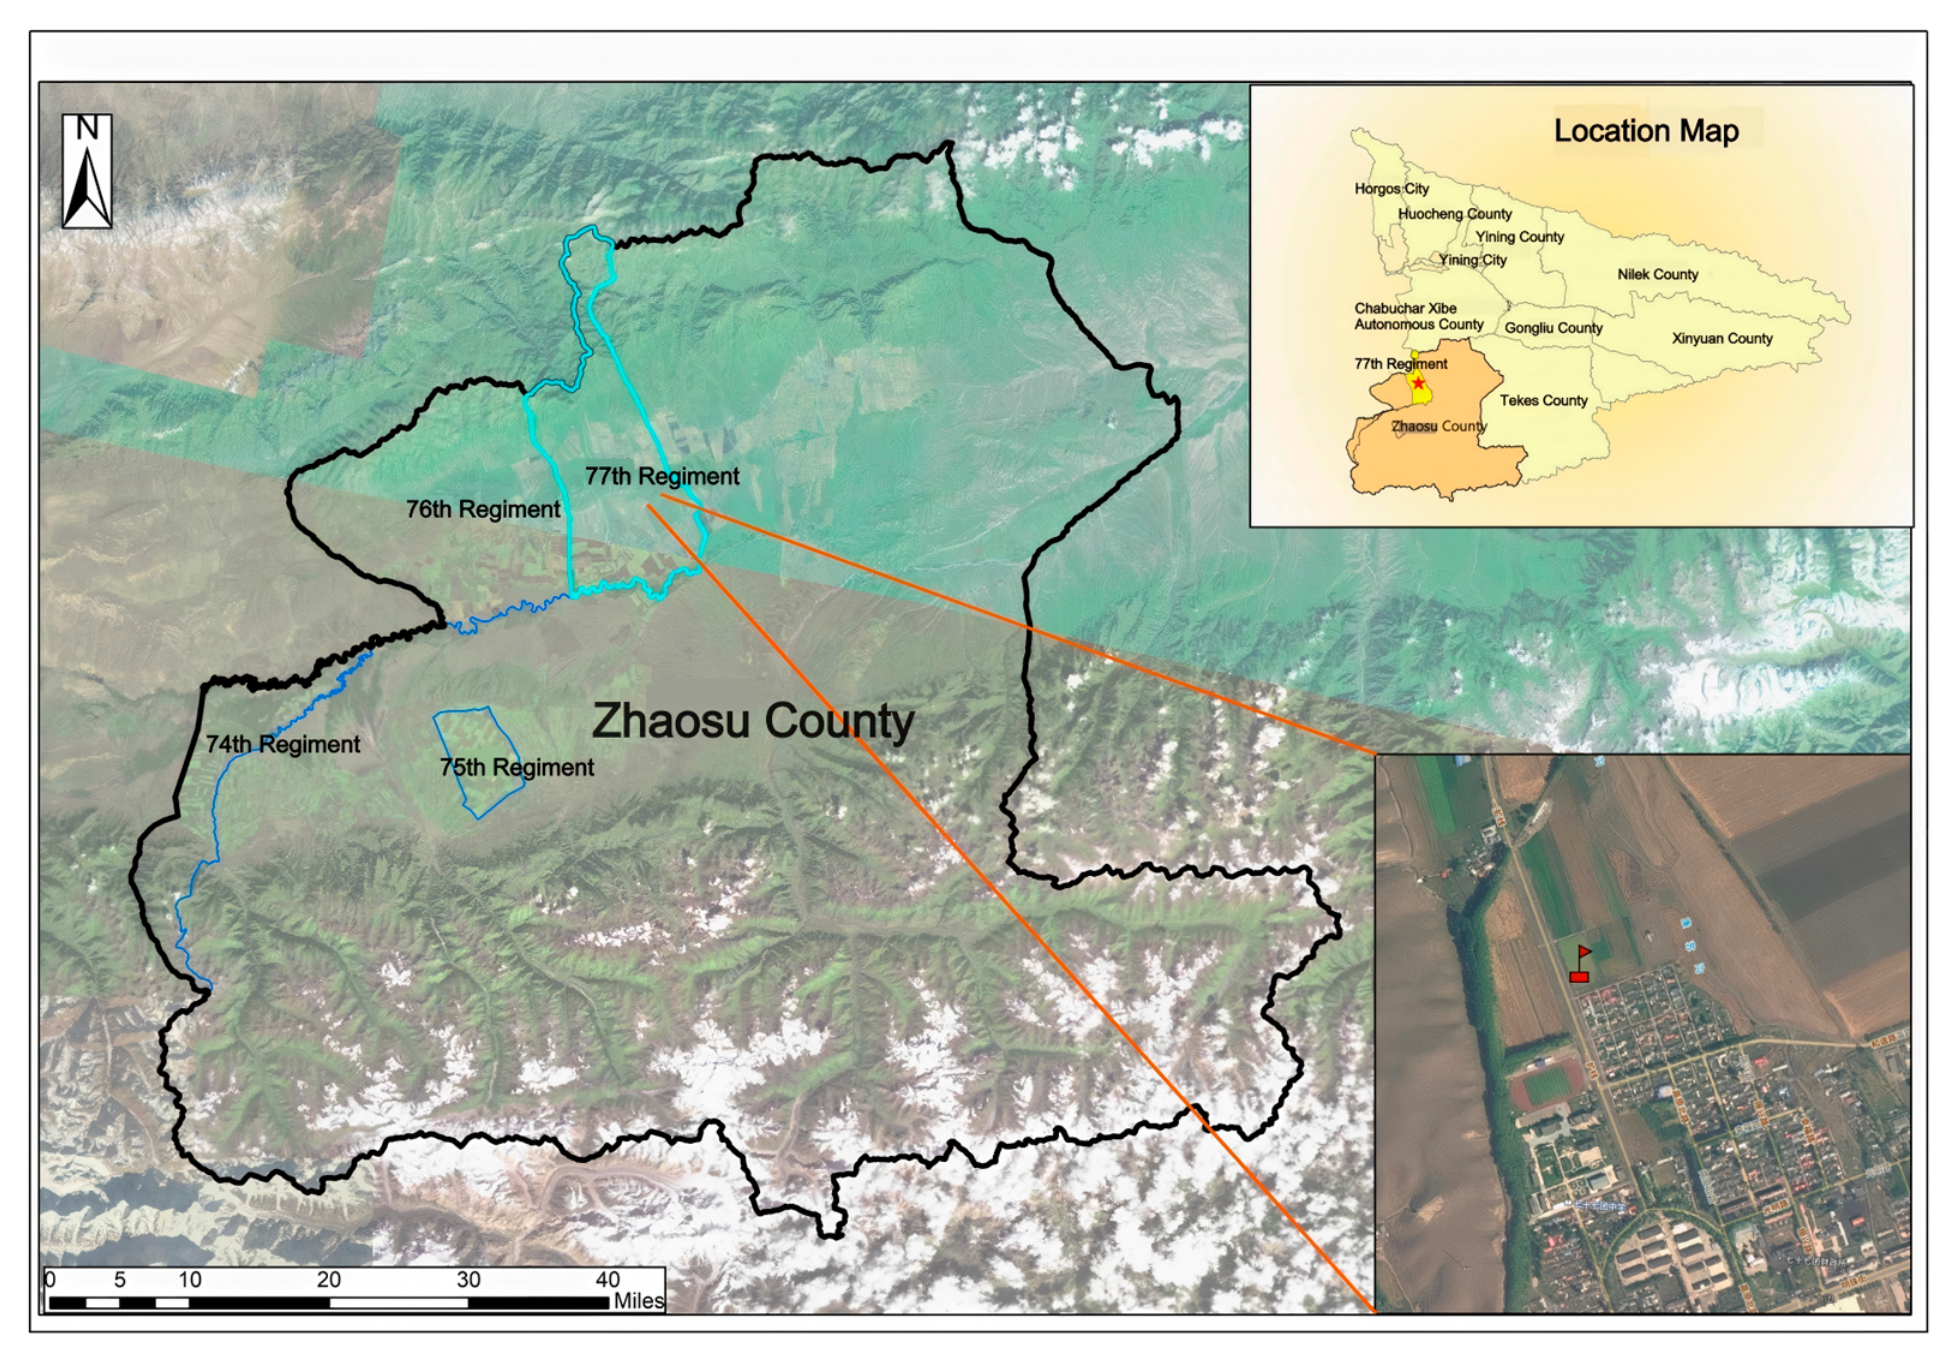
A two-year consecutive pot experiment (2023–2024) was conducted from 1 May to 1 September at the Agricultural Development Center Experimental Station of the 77th Regiment, Zhaosu County, Ili Kazakh Autonomous Prefecture, Xinjiang Uygur Autonomous Region, China, as shown in Figure 1 (42°00′36″ N, 80°57′14″ E, 1800 m above mean sea level). The site is characterized by a temperate continental semiarid climate with long winters and short summers. The mean annual temperature is 4.28 °C, with average temperatures of 16.01 °C in July (the hottest month) and −10.49 °C in January (the coldest month), and the annual precipitation is 535.24 mm. The soil type is chernozem with high organic matter content, and the basic physical and chemical properties of different soil layers are shown in Table 1.
Figure 1.
Location of the study site. The star represents the headquarters of the 77th Regiment, and the red flag indicates the experimental field.
Table 1.
Soil background: physical and chemical properties.
2.2. Experimental Design and Materials
Three perennial forage species differing in rooting depths were selected for this experiment, including deep-rooted leguminous forages Medicago sativa L. (Z) and Trifolium pratense L. (H), and shallow-rooted gramineous forage Bromus inermis Leyss (W). The classification of M. sativa and T. pratense as deep-rooted plants and B. inermis as a shallow-rooted plant is based on the known root characteristics of these species [19,20,21]. A completely randomized design was adopted to explore the hierarchical regulatory mechanism of deep–shallow-root collocation on soil P utilization. The pot size was 70 cm × 45 cm × 65 cm (length × width × height). Each pot was filled with 20 kg of 0–30 cm plow-layer chernozem (mixed after removing roots and large stones), and the soil was brought to 2 cm below the rim of each pot. A total of seven treatments were set up in the experiment, including three monoculture controls and four mixed-sowing treatments, with a legume–grass ratio of 1:1 for all mixed combinations:
1. Monoculture controls: Monoculture M. sativa (UA), monoculture T. pratense (UC), monoculture B. inermis (UB).
2. Mixed-sowing treatments
2.1 Alfalfa-smooth bromegrass mixed sowing (AB):
(1) AB-intra: Intra-row mixed sowing
(M. sativa deep-rooted/B. inermis shallow-rooted).
(2) AB-inter: Inter-row mixed sowing
(M. sativa deep-rooted/B. inermis shallow-rooted).
2.2 Red clover-smooth bromegrass mixed sowing (CB):
(1) CB-intra: Intra-row mixed sowing
(T. Pratense deep-rooted/B. inermis shallow-rooted).
(2) CB-inter: Inter-row mixed sowing
(T. Pratense deep-rooted/B. inermis shallow-rooted).
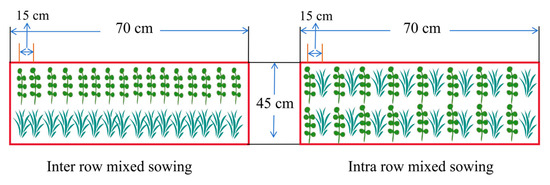
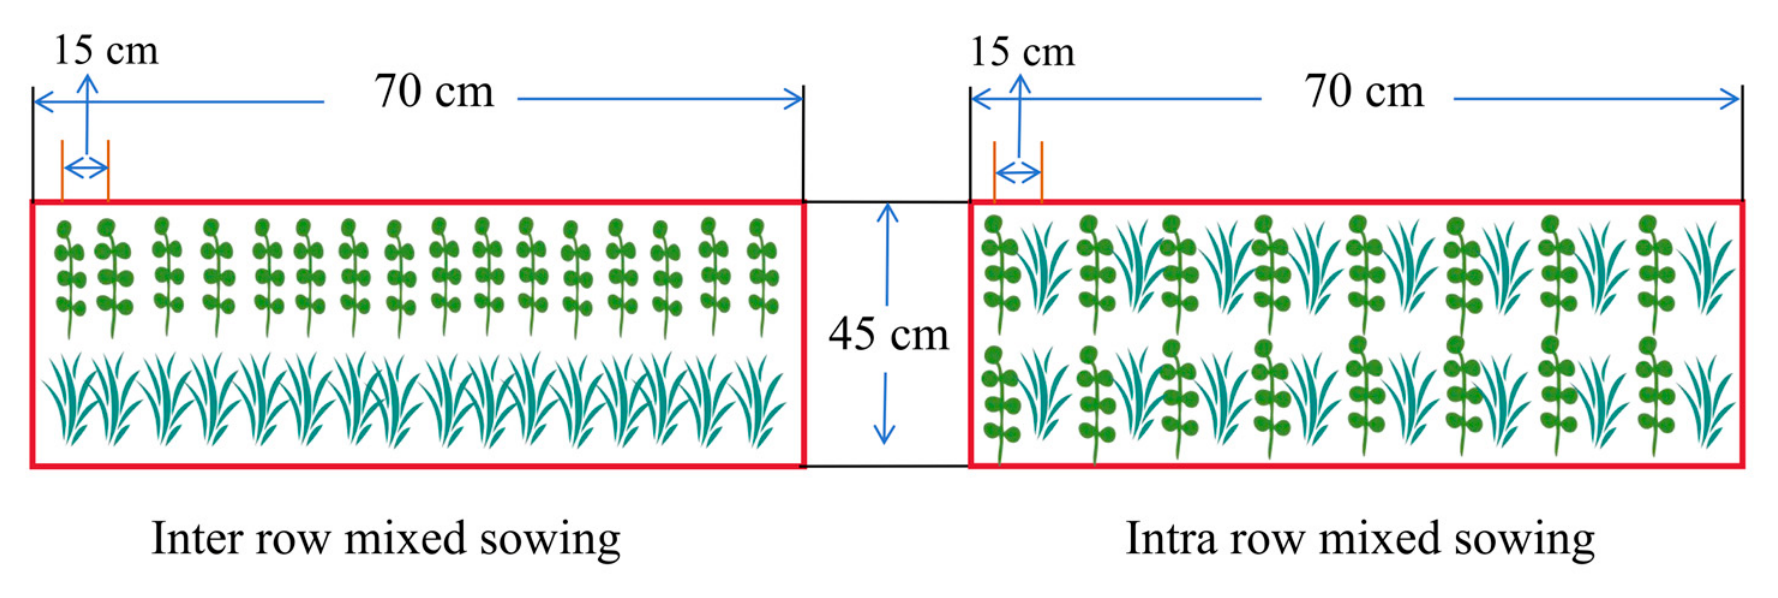
All treatments were conducted in triplicate, with a total of 21 pots. Sowing was conducted in a two-row planting pattern with a row spacing of 15 cm. The specific sowing rates are detailed in Supplementary Table S1. The pots were placed in an open, flat, unshaded outdoor environment, spaced 1 m apart, and arranged neatly in the same direction. To ensure uniform light exposure, the pots’ orientation was adjusted every 15 days. During the seedling stage, uniform management of thinning, weeding (twice), and soil loosening (once) was performed to ensure sufficient water supply and prevent disease and pest outbreaks. No fertilization was conducted throughout the experiment, and all nutrients for forage growth were derived from locally collected native chernozem. All pots were placed beside the field under open-air conditions with uniform drip irrigation supplementing natural rainfall. Soil moisture was consistently maintained at field capacity during the entire growing period, consistent with field soil moisture conditions. The seedling emergence rate was investigated in July 2023, and all treatments exceeded 85%. The forages naturally regreened on 15 April 2024, with a regreening rate exceeding 95%. The experimental data were analyzed based on the stable growth performance over two years. A schematic diagram of the experimental setup is shown in Figure 2.
Figure 2.
Schematic diagram of legume–grass mixed-sowing experimental design.
2.3. Measurement Indices and Methods
Aboveground Biomass: At the full flowering stage of forages (mid-July) in 2023 and 2024, the aboveground parts were cut at the ground level, separated by species, weighed for fresh weight, and dried to constant weight at 70 °C to determine the aboveground biomass.
Root biomass: The belowground parts (roots) were carefully excavated, collected, and sieved through a 0.5 mm mesh. After rinsing with running water, roots were sorted by species and oven-dried at 80 °C to constant weight for root biomass (RB) determination.
Root morphological parameter determination: After harvest, soil and roots were collected from each pot. Roots were placed in mesh bags (0.25 mm aperture) and rinsed with a water spray gun until all soil was thoroughly removed. Debris such as gravel and sand was then removed with forceps, and the remaining roots were sealed in self-sealing bags containing 75% ethanol and stored at 4 °C for subsequent analysis. For morphological trait analysis, one plant with the most intact and moderately sized root system was selected from each sampling point. Prior to measurement, the washed roots were gently disentangled with a fine brush to avoid overlapping, then spread flat in a transparent acrylic tray (30 × 20 × 2.5 cm) containing 1.8 cm depth of water, and excess moisture was removed with filter paper before scanning. Root length (RL), root surface area (RSA), root volume, mean root diameter (RD), root tip number (NRT), and other parameters were scanned and calculated using the Wanshen LA-S Plant Root Analysis System (Wanshen Testing Technology Co., Ltd., Hangzhou, China) [22].
Phosphorus content in forage: At the full-bloom stage, herbage in each pot was harvested by cutting at 5 cm above ground level. Fresh weight was measured and recorded, and samples were then oven-dried at 85 °C in a forced-air drying oven (DHG-9203A, Shanghai Jinghong Laboratory Instrument Co., Ltd., Shanghai, China). The dried herbage samples were ground and passed through a 40-mesh sieve. Total phosphorus (P) concentration was determined by the molybdenum–antimony resistance colorimetric method following H2SO4–H2O2 digestion, with a colorimetric wavelength of 880 nm. Phosphorus use efficiency (PUE, gg−1) was calculated as the ratio of aboveground dry matter biomass to aboveground phosphorus content, representing the dry matter mass produced per unit of phosphorus uptake [23].
where aboveground P uptake (gm−2) was calculated as aboveground biomass (gm−2) multiplied by aboveground P concentration (gg−1).
Soil sample collection and available P analysis: After herbage harvest, rhizosphere soil was collected using the root-shake method. The intact root system was destructively excavated with the crop as the center, and soil loosely adhering to the roots was gently shaken off. Soil still attached to the root surface was defined as rhizosphere soil and carefully brushed off with a soft brush, while the shaken-off soil was designated as non-rhizosphere soil (NR). All sampled soils were passed through a <2 mm sieve to remove visible roots; rhizosphere soil was operationally defined as soil closely adhering to the root surface (≤2 mm). Non-rhizosphere soil (bulk soil) was collected 5–10 cm away from the roots within the same pot to avoid root contamination. All soil samples were collected from two depth increments (0–20 cm and 20–40 cm), air-dried, and sieved through a 2 mm mesh for subsequent analyses [24]. Soil-available P was extracted by the Olsen method (0.5 mol/L NaHCO3, pH 8.5), and the absorbance of the extract was measured by the molybdenum–antimony anticolorimetric method on a UV–Vis spectrophotometer (755B, Shanghai Jinghua Technology Instrument Co., Ltd., Shanghai, China) at 880 nm to calculate the available P content [25]. The soil-available phosphorus enrichment rate (PRE) was calculated using the following formula:
where if PRE > 1, it indicates that available P is enriched in the rhizosphere soil relative to the non-rhizosphere soil; if PRE < 1, it indicates that available P is depleted in the rhizosphere soil relative to the non-rhizosphere soil [26].
2.4. Data Analysis
All statistical analyses were performed using R software (Version 4.4.1). Raw data were preprocessed, grouped and screened to retain complete experimental observations from 2023 to 2024 for subsequent modeling.
The statistical analysis was structured in four sequential stages. First, a linear mixed-effects model (LMM) was constructed using the lme4 package [27]. Root traits were measured for the whole system, and soil P indicators were measured separately in 0–20 cm and 20–40 cm soil layers. Mixed combination (3 monocultures + 1 intercropping mixture) and mixed-sowing pattern (intra-row/inter-row, only for intercropping) were clearly defined as fixed factors, alongside soil layer depth and experimental year. The unique pot ID (Pot_ID) was set as a random intercept (1|Pot_ID) to eliminate temporal autocorrelation of repeated measurements across 2023–2024 and avoid overestimating significance. Independent LMMs were run for all dependent variables: root morphological traits and rhizosphere/soil bulk phosphorus. We analyzed the main and two-way interactive effects, with significance tested via likelihood ratio tests (lmerTest [28]). Residual plots validated LMM normality and homoscedasticity with no assumption violations.
Pairwise Pearson’s correlation analysis between root morphological traits and soil phosphorus indicators was visualized using the GGally and ggplot2 packages in R. Root phenotypic variables (L, SA, V, NRT, RB) and rhizosphere/bulk soil-available P indices (P_rhiz, P_bulk, RPE) were log-transformed prior to correlation calculation to reduce skewness of raw data distribution. The scatter matrix plot integrated three modules: lower triangular panels displayed linear fitting scatter plots with 95% confidence intervals for pairwise variable relationships; upper triangular panels presented Pearson’s correlation coefficients with significance stars; and diagonal panels showed kernel density distributions of every single variable.
Second, to further reveal the P regulation mechanism underlying the interaction of deep and shallow roots, SEMs were constructed using the lavaan package [29] in R software by soil layers to quantify the chain pathway of “mixed-sowing pattern → root phenotype → soil P distribution → PUE.” For SEMs, the maximum likelihood (ML) estimation method was employed for model fitting. Model fit was evaluated using multiple goodness-of-fit indices: the ratio of chi-square to degrees of freedom (CMIN/DF), comparative fit index (CFI), goodness-of-fit index (GFI), and root mean square error of approximation (RMSEA). A well-fitting model was indicated by CMIN/DF < 3, CFI > 0.90, GFI > 0.90, and RMSEA < 0.08. To address potential temporal autocorrelation from repeated measurements of identical pots across 2023 and 2024, the intraclass correlation coefficient (ICC) was calculated for all variables included in SEM and Random Forest analyses. The ICC quantifies the proportion of total variance attributable to between-pot differences; values approaching zero indicate negligible temporal dependence among repeated observations (Table S3).
Third, Random Forest analysis was conducted using the randomForest package [30] with 800 trees (ntree = 800) to identify the key drivers of PUE and quantify their relative contributions without imposing a priori causal assumptions, complementing SEM by revealing which variables exert the strongest predictive power. The final model included V, NRT, L, SA, and Variety. Model performance was validated via three approaches: OOB error estimation, 70:30 external validation, and 5-fold cross-validation (see Table S4 for details). Variable importance was quantified using %IncMSE.
Finally, one-way ANOVA tested how stratified rhizosphere phosphorus gradients affect PUE, with graded subsoil-available P as the sole grouping factor and PUE as the response variable. Multi-way ANOVA further evaluated experimental treatment effects on all root and phosphorus indicators, incorporating three fixed factors: mixture variety, planting pattern and sampling year. All ANOVA calculations and Tukey’s HSD multiple comparisons were conducted via the agricolae package [31]. Multiple linear regression identified the rhizosphere P threshold for optimal PUE: PUE depended on root volume (V) and rhizosphere P (P_rhiz) in the 0–20 cm layer, while only V predicted PUE in the 20–40 cm layer after variable screening. Datasets were split into 70:30 training/testing subsets for external validation, with predictive performance assessed by test-set R2. This sequential analytical workflow integrates pattern detection, mechanistic verification, driver screening and threshold quantification to collectively reveal how root spatial allocation hierarchically regulates soil phosphorus utilization.
3. Results
3.1. Forage Productivity and Yield
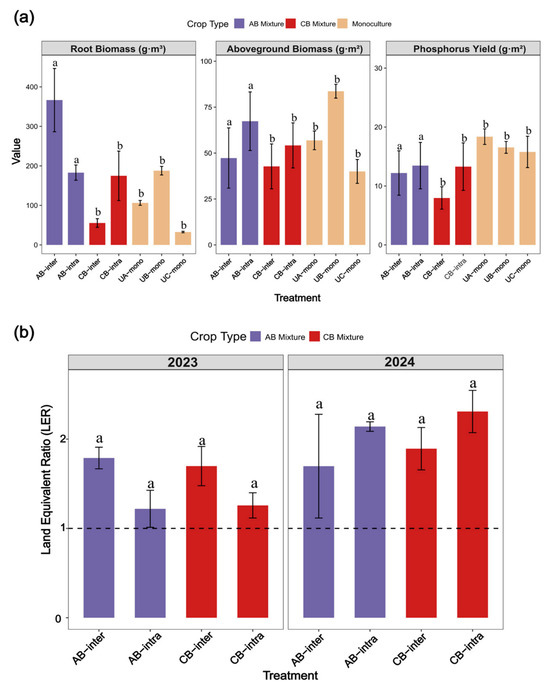
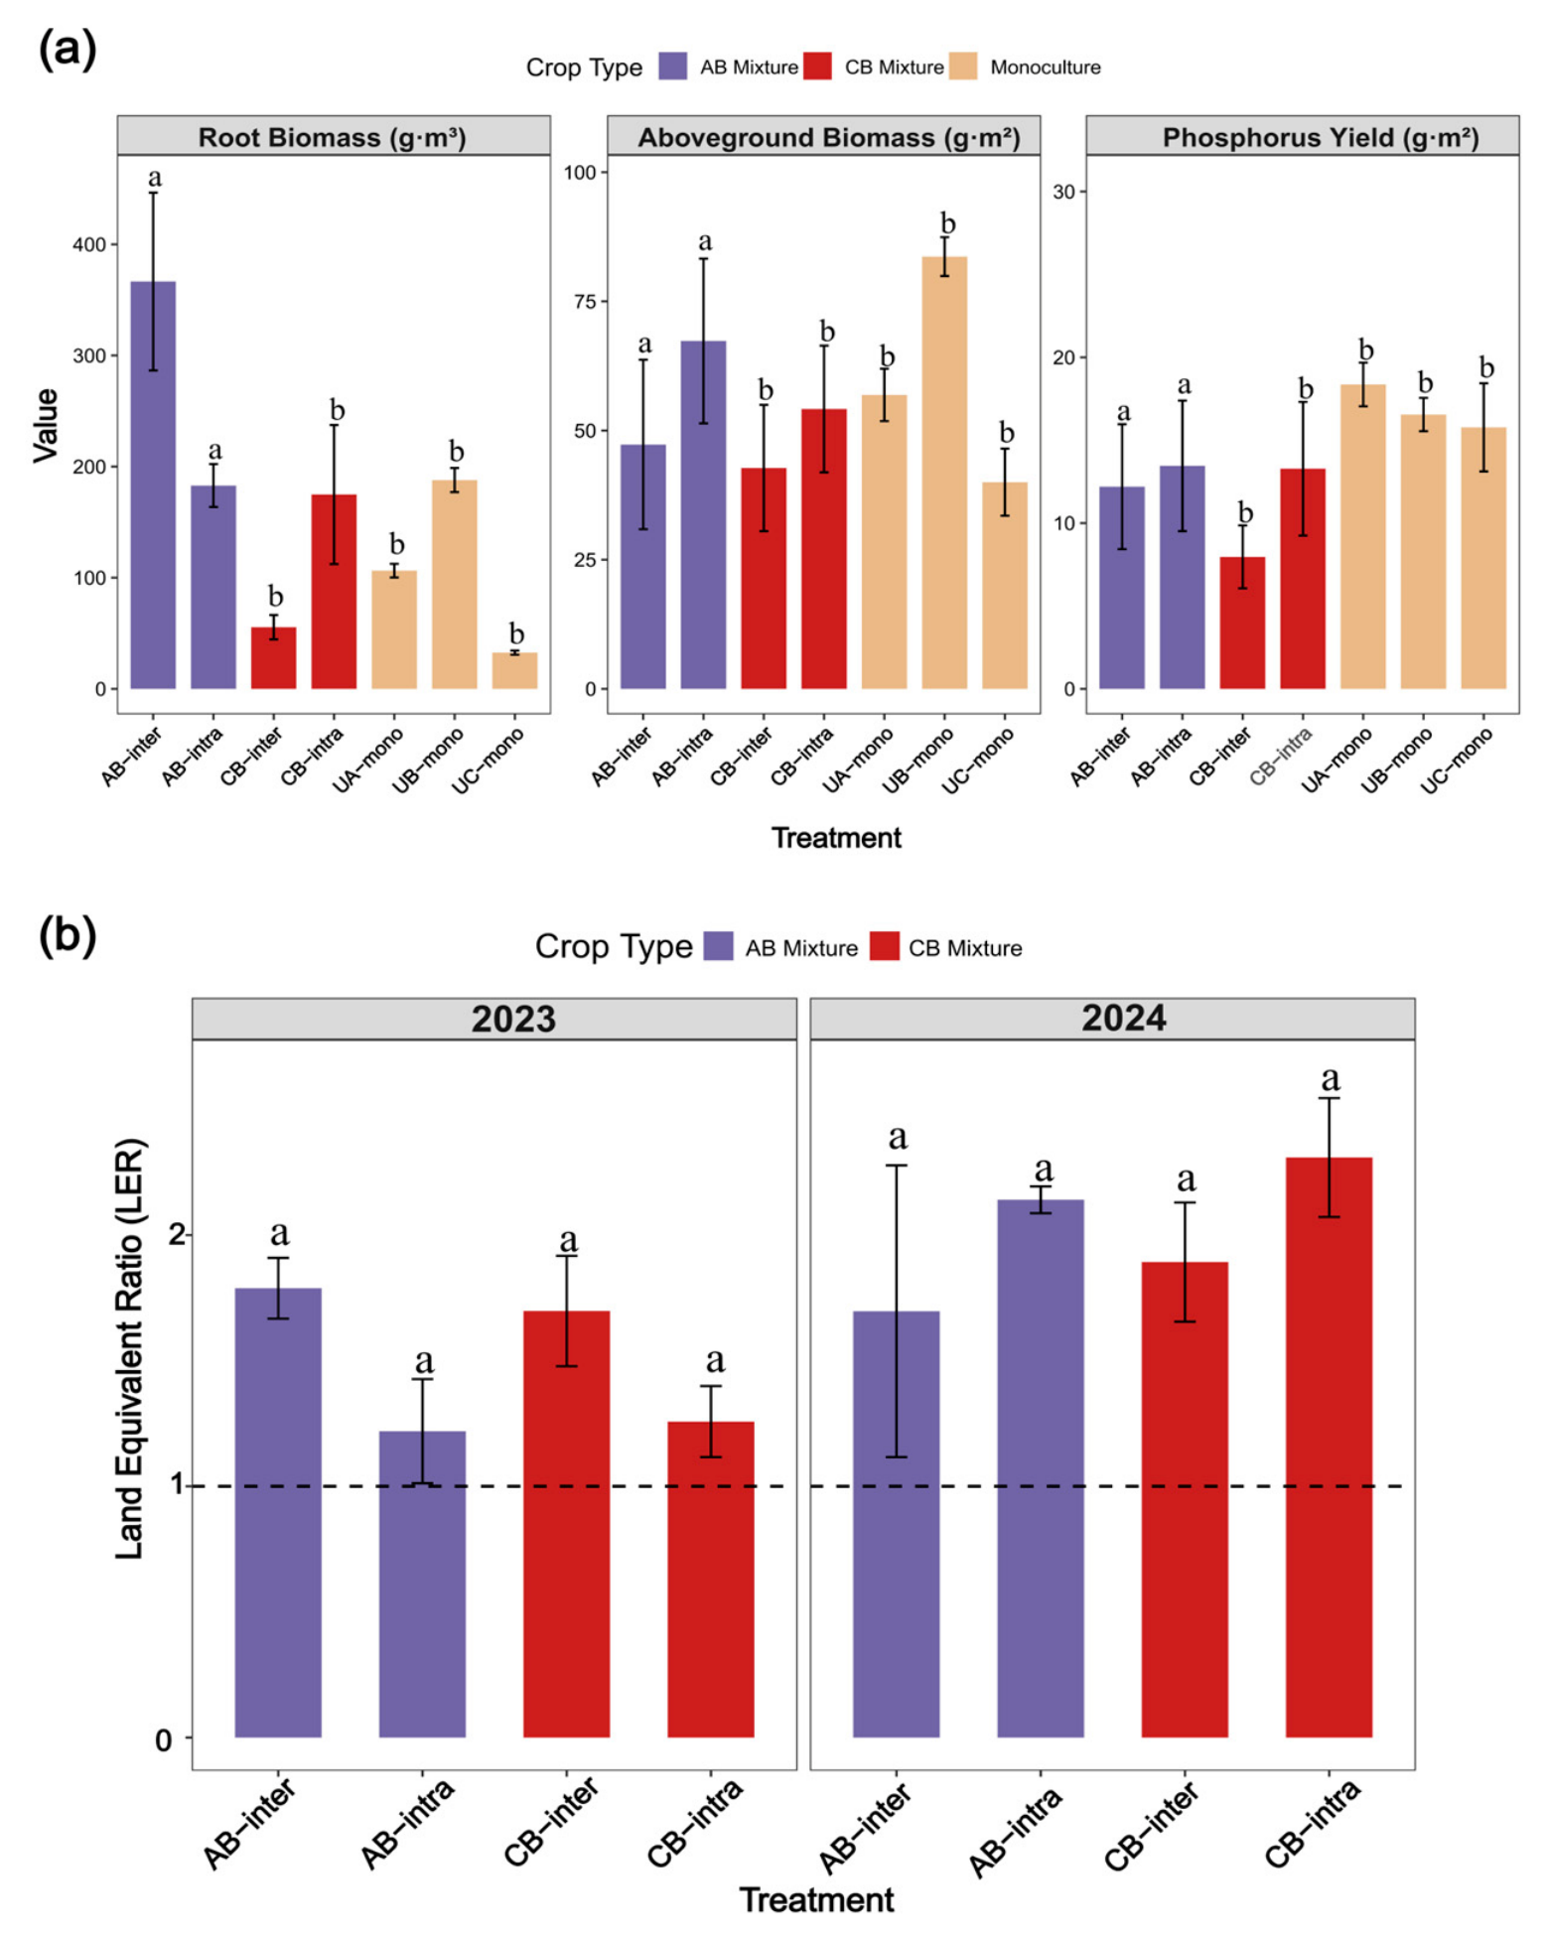
Significant differences were observed in forage aboveground and belowground biomass, P yield, and overyielding effect across different mixed-cropping patterns (Figure 3). Regarding biomass and P yield, the AB mixture (M. sativa vs. B. inermis) exhibited a distinct advantage in total biomass, significantly higher than both the CB mixture and monoculture treatments (p < 0.05). The AB combination increased aboveground biomass by 39.2% and belowground biomass by 138.5% compared with the CB combination. P yield followed a similar trend: AB mixture treatments had significantly higher P yield than the CB-intra-treatment (p < 0.05), with AB-inter and AB-intra showing increases of 42.2% and 46.7%, respectively, compared with their CB counterparts, confirming the P utilization advantage of the AB mixture. The overyielding effect analysis (Figure 3b) showed that the LER values of all mixed-sowing treatments exceeded 1 in both 2023 and 2024, indicating stable overyielding performance, with significantly higher resource-use efficiency than monocultures. The AB-inter treatment showed the highest LER in 2023, while the peak LER shifted to CB-intra in 2024. No significant differences in LER were detected among the mixed-cropping treatments (p < 0.05), indicating interannual fluctuation in the treatment with the highest overyielding potential. All mixed-sowing treatments maintained LER values ranging from 1.22 to 1.80, demonstrating the universality of overyielding effects, laying a yield foundation for subsequent root–soil interaction research.
Figure 3.
Forage yield and overyielding effect of specific mixed-cropping patterns. (a) Three subgraphs sequentially display root biomass, aboveground biomass and phosphorus yield of forage communities. Experimental treatments include UA-mono (monoculture of Medicago sativa), UB-mono (monoculture of Bromus inermis), UC-mono (monoculture of Trifolium pratense), AB-inter (inter-row mixed planting of M. sativa and B. inermis), AB-intra (intra-row mixed planting of M. sativa and B. inermis), CB-inter and CB-intra (inter-row and intra-row mixed planting of T. pratense and B. inermis). Consistent abbreviations apply below. (b) Land equivalent ratio (LER) of mixed cropping treatments in 2023 and 2024 to evaluate overyielding capacity; the horizontal dashed line marks LER = 1, the critical threshold for mixed cropping yield advantage. Only mixed-sowing groups are presented in this panel. Error bars represent standard error (SE). Lowercase letters above bars indicate significant differences among treatments (Tukey’s HSD test, p > 0.05).
3.2. Soil Phosphorus Distribution and Root Phenotypic Coupling
Based on the yield-increasing and efficiency-enhancing characteristics of the mixed-cropping system elaborated in Section 2.1, this section further analyzes the differentiation law of soil P under mixed-cropping patterns. The experimental results obtained across two consecutive years (2023–2024) showed a highly consistent trend. LMM analysis revealed that cropping variety, soil depth, planting pattern, and experimental year all significantly influenced soil P availability, with notable interactions among these factors (Table 2). The AB mixture maintained higher rhizosphere-available P (RAP) than the CB combination across both topsoil (0–20 cm) and subsoil (20–40 cm) layers, while intercropping systems consistently outperformed monocultures in subsoil P availability.
Table 2.
LMM analysis results for available P and enrichment rate.
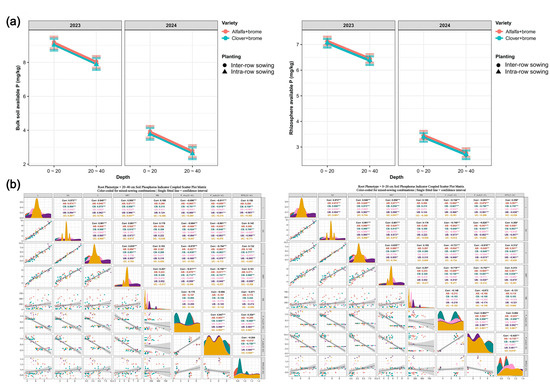
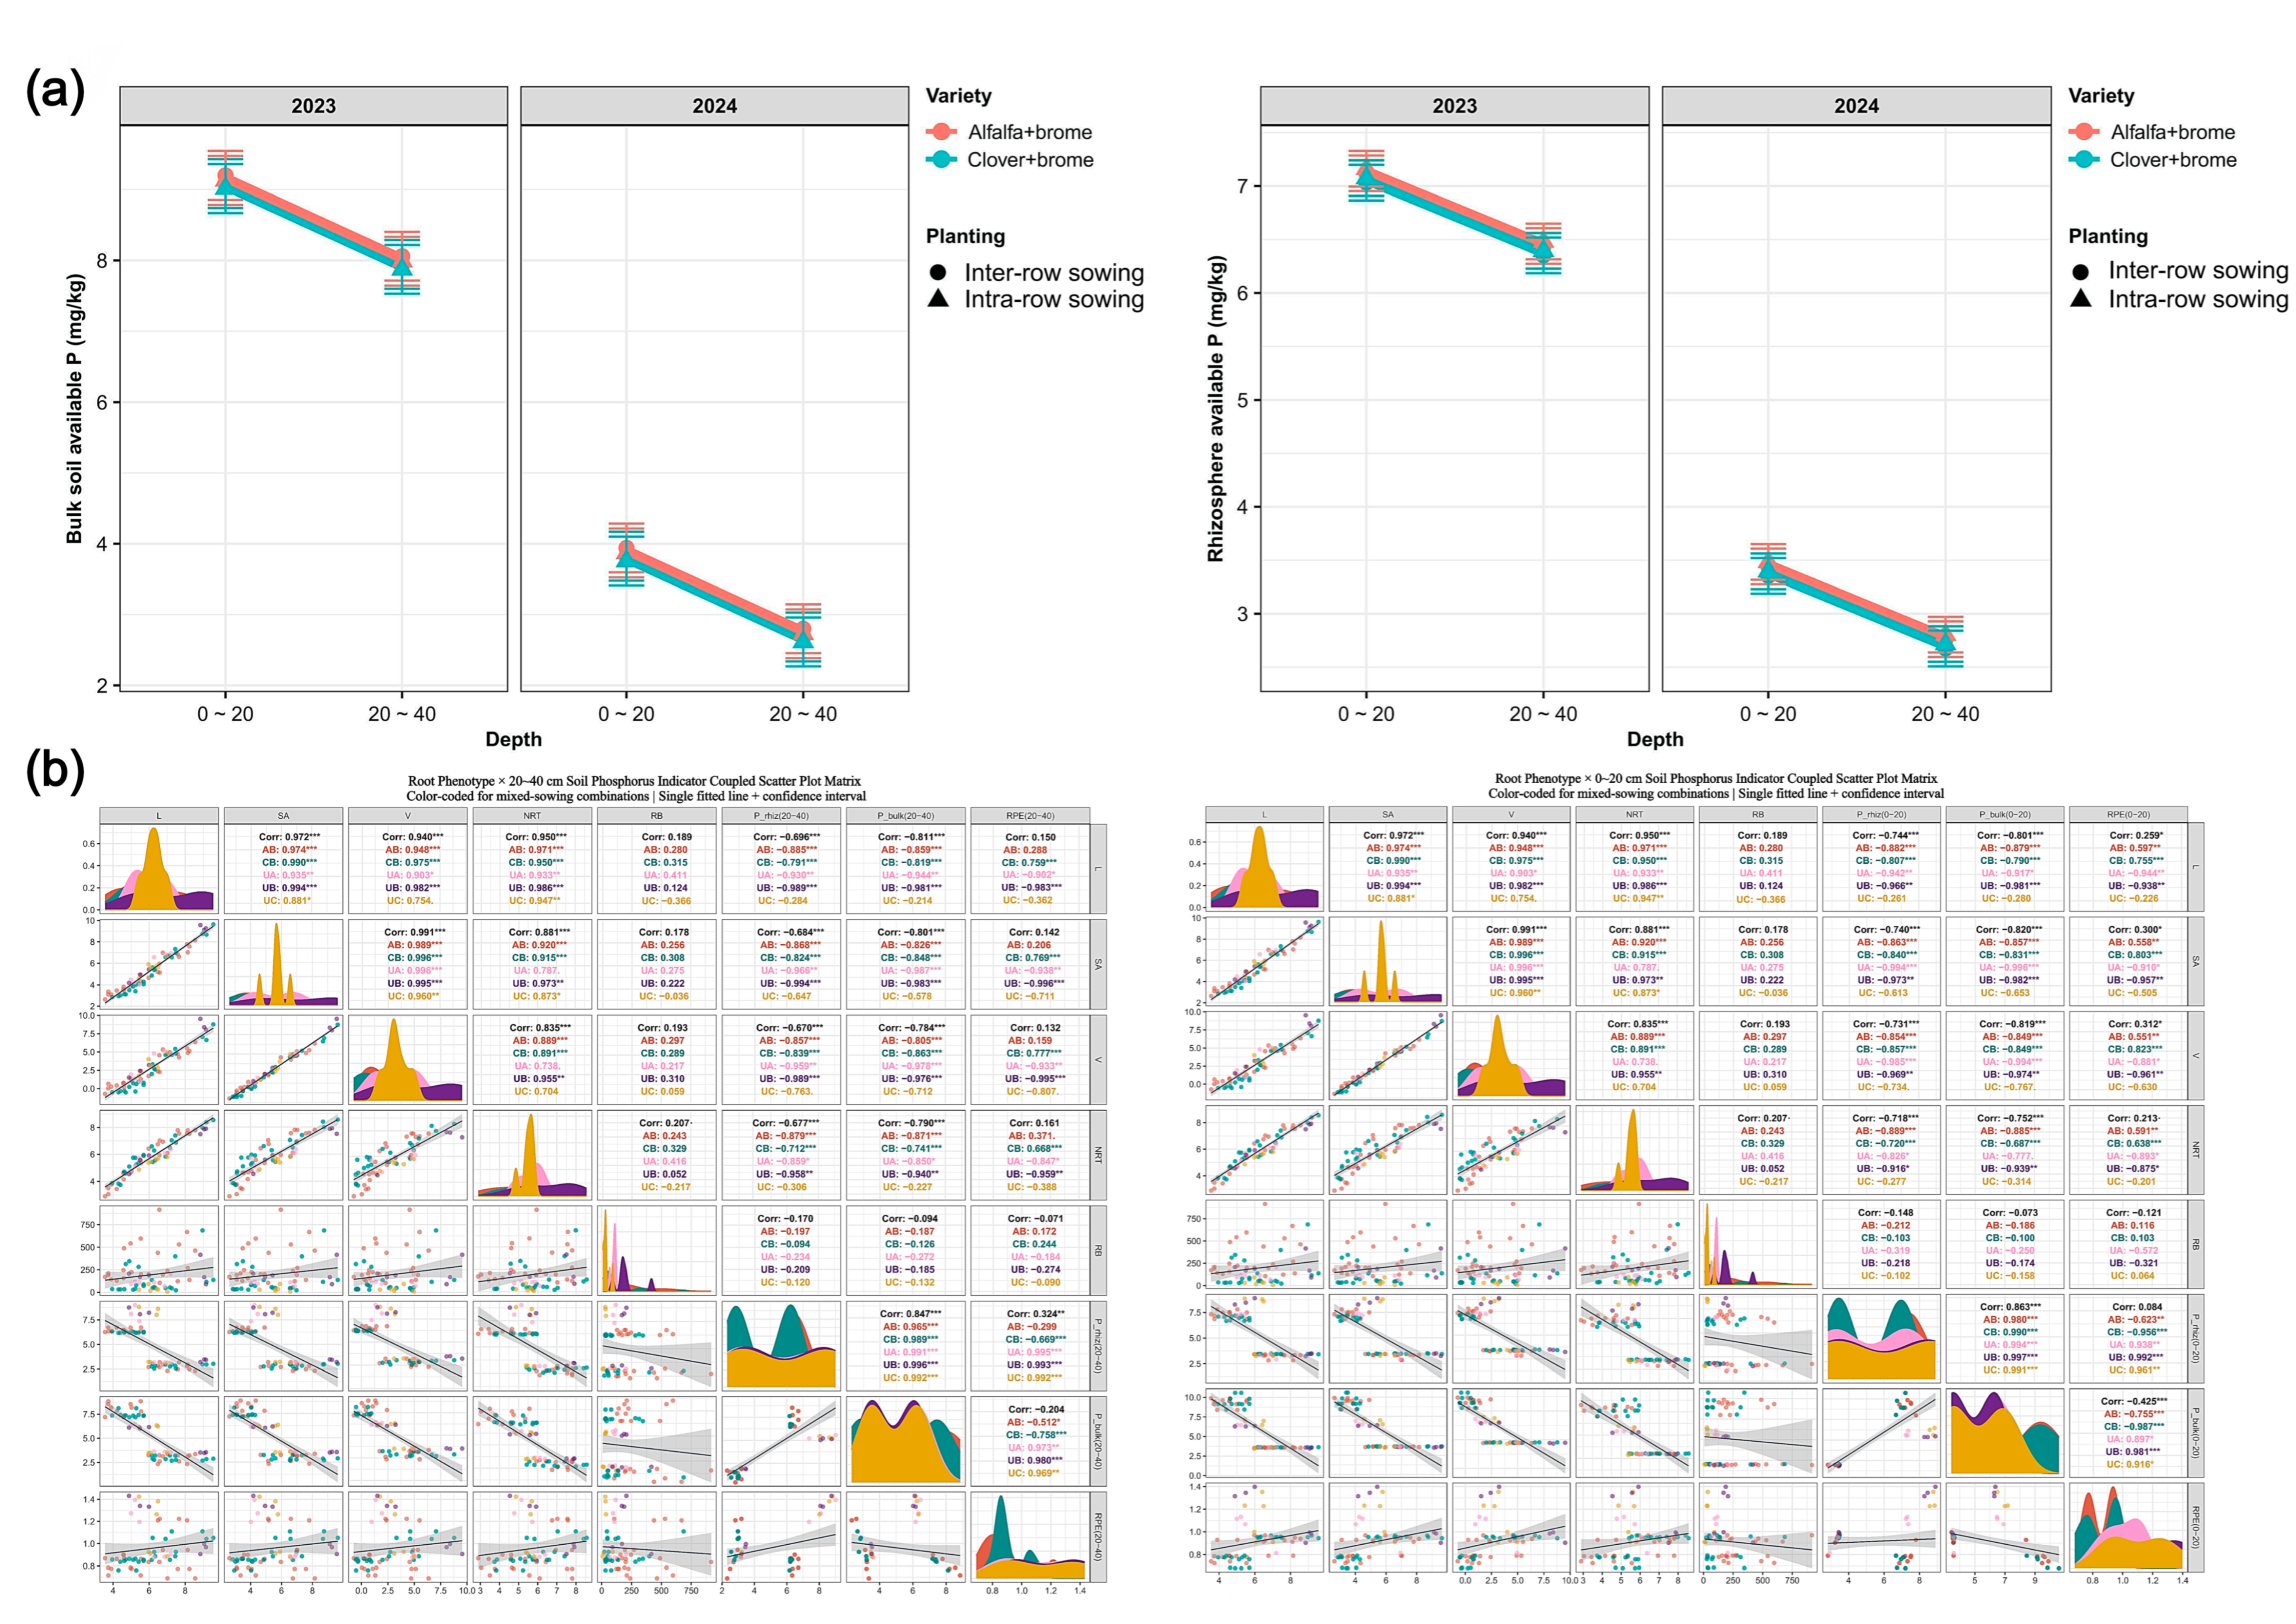
Mixed cropping promoted vertical P migration, as available P content decreased with increasing soil depth in both rhizosphere and nonrhizosphere soils, yet this decline was less pronounced than that observed under monoculture (Figure 4). This vertical pattern remained consistent across both years, despite lower overall soil P availability in 2024. This finding demonstrated that mixed cropping facilitates vertical P migration and enhances deep-soil P availability (Figure 4). The rhizosphere/nonrhizosphere P ratio (RPE) was generally higher in AB mixtures than in CB combinations, reflecting greater root P uptake efficiency. Notably, RPE remained stable across all soil layers and both years (Figure 4a), suggesting a robust regulatory mechanism of P acquisition in mixed-cropping systems.
Figure 4.
Profile distribution of available P in rhizosphere and non-rhizosphere soil and coupling relationship between root phenotypes and P indicators under mixed-sowing patterns. (a) Profile distribution of rhizosphere and bulk soil-available P across 0–20 cm and 20–40 cm soil layers in 2023 and 2024. Red and cyan lines represent the AB (M. sativa vs. B. inermis) and CB (T. pratense vs. B. inermis) mixed-sowing combinations, respectively, with different planting patterns (inter-row sowing and intra-row sowing) indicated in the legend. Different colors in panel (b) represent different treatments as shown in the legend. (b) Coupled scatter matrix of root phenotypes and soil P indicators in 0–20 cm and 20–40 cm soil layers. Root phenotypic traits include L (root length), RSA (root surface area), V (root volume), NRT (root tip number), and RB (root biomass), all of which were log-transformed. Soil P indicators include P_rhiz (rhizosphere soil P content), P_bulk (bulk soil P content), and RPE (available P enrichment rate). The figure shows the correlations between root traits and soil P indicators under different species (A, B, C) and mixed-sowing combinations (AB, CB). *, **, *** indicate significant differences at p < 0.05, p < 0.01 and p < 0.001, respectively. Significant differences between treatments and soil layers are presented in Table 2.
Distinct differences in root phenotypic characteristics were observed among different treatments. The core root indicators (e.g., RB, RSA, and root volume) of the AB combination were significantly superior to those of the CB combination and monocropping treatments (p < 0.05). At the same time, no significant difference was detected in the mean RD (Figure S1). Correlation analysis showed that the root morphological indicators were extremely significantly positively correlated in the 0–20 cm and 20–40 cm soil layers, and extremely significantly negatively correlated with rhizosphere-available P. In the AB combination, the deep root indicators (20–40 cm soil layer) showed the strongest correlation with rhizosphere-available P. The two-year experiments verified that its deep roots had a greater potential for P absorption. The above results clarified the core mechanism by which mixed-cropping patterns regulate the spatial distribution of soil P by shaping dominant root phenotypes, providing a key basis for subsequent analysis of PUE driving factors and regulatory pathways (Figure 4b, Table S2).
3.3. Driving Factors and Stratified Regulation of PUE
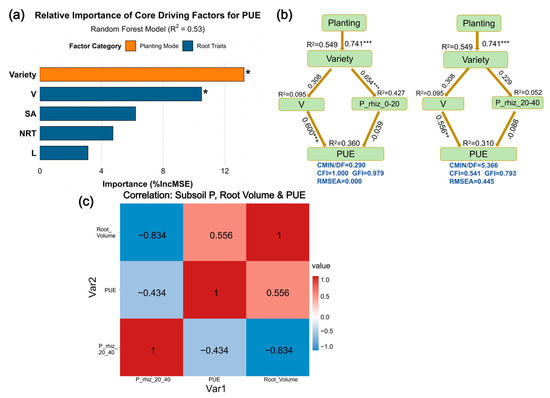
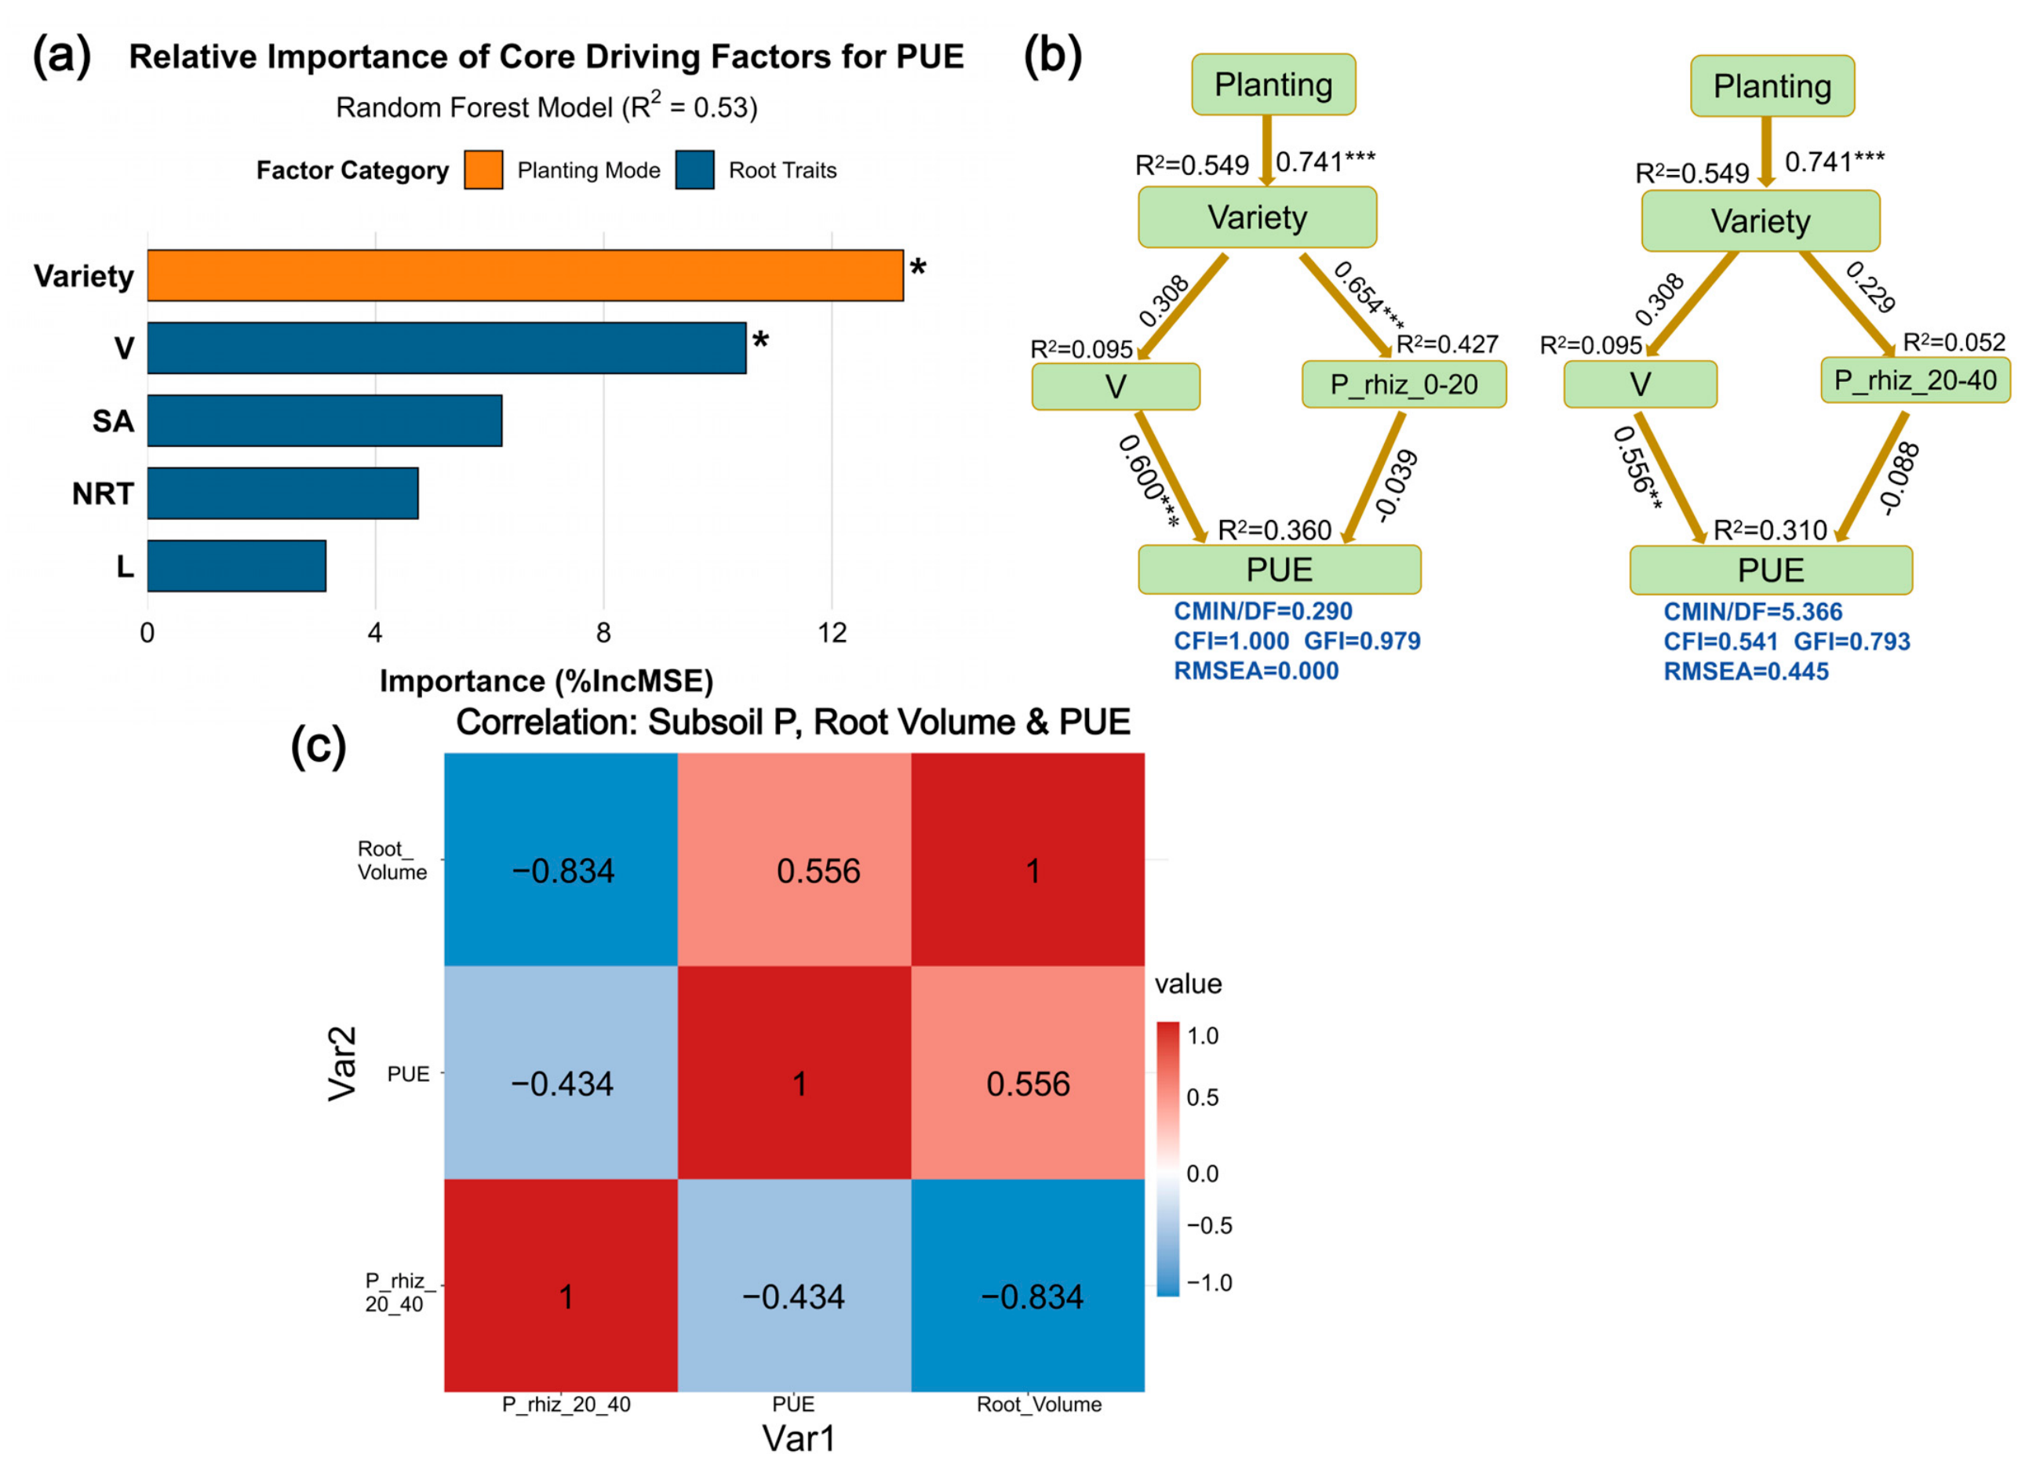
Prior to SEM and Random Forest construction, we verified that temporal autocorrelation among repeated measurements was negligible for all model variables (ICC < 0.05, Table S3), supporting the independence assumption for both analytical approaches. Analysis of the core factors driving PUE showed that root volume (V) was the primary statistically significant driver of PUE (p < 0.05), followed by NRT, root length (L), and RSA. In addition, planting pattern (variety) significantly affected PUE (p < 0.05), but its importance was far lower than that of core root traits (Figure 5a). This model could explain 53% of the variation in PUE (R2 = 0.53), and the OOB R2 of 0.407 further reflects its generalization ability. SEM revealed distinct hierarchical regulatory effects of mixed-sowing patterns on PUE (Figure 5b). The model for the 0–20 cm topsoil layer exhibited excellent fitting performance, forming a stable regulatory network of “planting method → mixed-sowing variety → root volume/topsoil rhizosphere-available P → PUE.” Root volume exerted the strongest positive effect on PUE (path coefficient = 0.600, p < 0.001), and, together with rhizosphere P, explained 36.0% of the variation. In the 20–40 cm subsoil layer, only root volume showed a significant positive effect (path coefficient = 0.556, p = 0.002), with the total explanatory power decreasing to 31.0%. Notably, this subsoil SEM exhibited poor global model fit, which restricts reliable interpretation of the complete multivariate regulatory network; only the direct association between root volume and PUE can be biologically interpreted. The quantitative PUE model further verified the above hierarchical characteristics (Figure S2). For the 0–20 cm layer, the fitted model was PUE = 8.66 + 5.96 × V + 3.73 × P_rhiz (R2 = 0.90), with no collinearity risk among core variables (VIF = 3.33).
Figure 5.
Driving mechanisms and regulatory network of PUE under mixed-sowing patterns. (a) Relative importance of core driving factors for PUE (R2 = 0.53). Random Forest model was constructed using 800 trees with OOB validation (OOB R2 = 0.407). (b) SEM of PUE and regulatory factors in the 0–20 cm and 20–40 cm topsoil layer. (c) Correlation heatmap of subsoil P, root volume, and PUE. *, **, *** indicate significant differences at p < 0.05, p < 0.01 and p < 0.001, respectively.
Correlation analysis indicated that subsoil rhizosphere-available P was significantly negatively correlated with PUE (r = –0.434, p = 0.002), while root volume was strongly positively correlated with PUE. ANOVA showed no significant differences in PUE among subsoil P groups (F = 2.454, p = 0.0974), suggesting that subsoil P exerts its regulatory function through synergistic interaction with root phenotype (Table 3). Notably, subsoil root volume was strongly negatively correlated with subsoil rhizosphere-available P (r = −0.834), indicating that an expanded root system can compensate for low P availability in deep soil by enhancing the P uptake range. Root phenotype, especially root volume, serves as the core compensatory mechanism for efficient subsoil P utilization. Improving PUE should focus on regulating the root phenotype to exploit native P resources, which refines the mechanistic understanding of subsoil P utilization in mixed-sowing systems.
Table 3.
Correlation and ANOVA analysis results between subsoil P and PUE.
3.4. PUE Quantitative Model and Phosphorus Fertilization Optimization
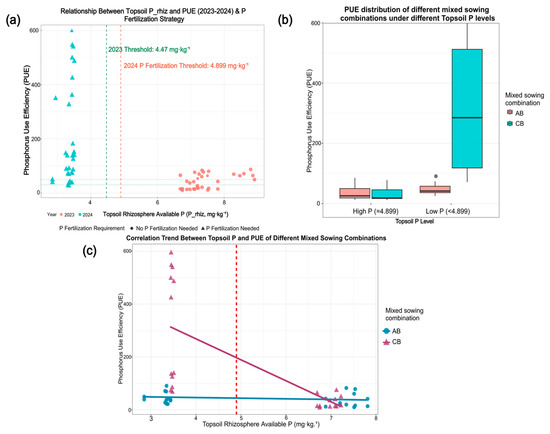
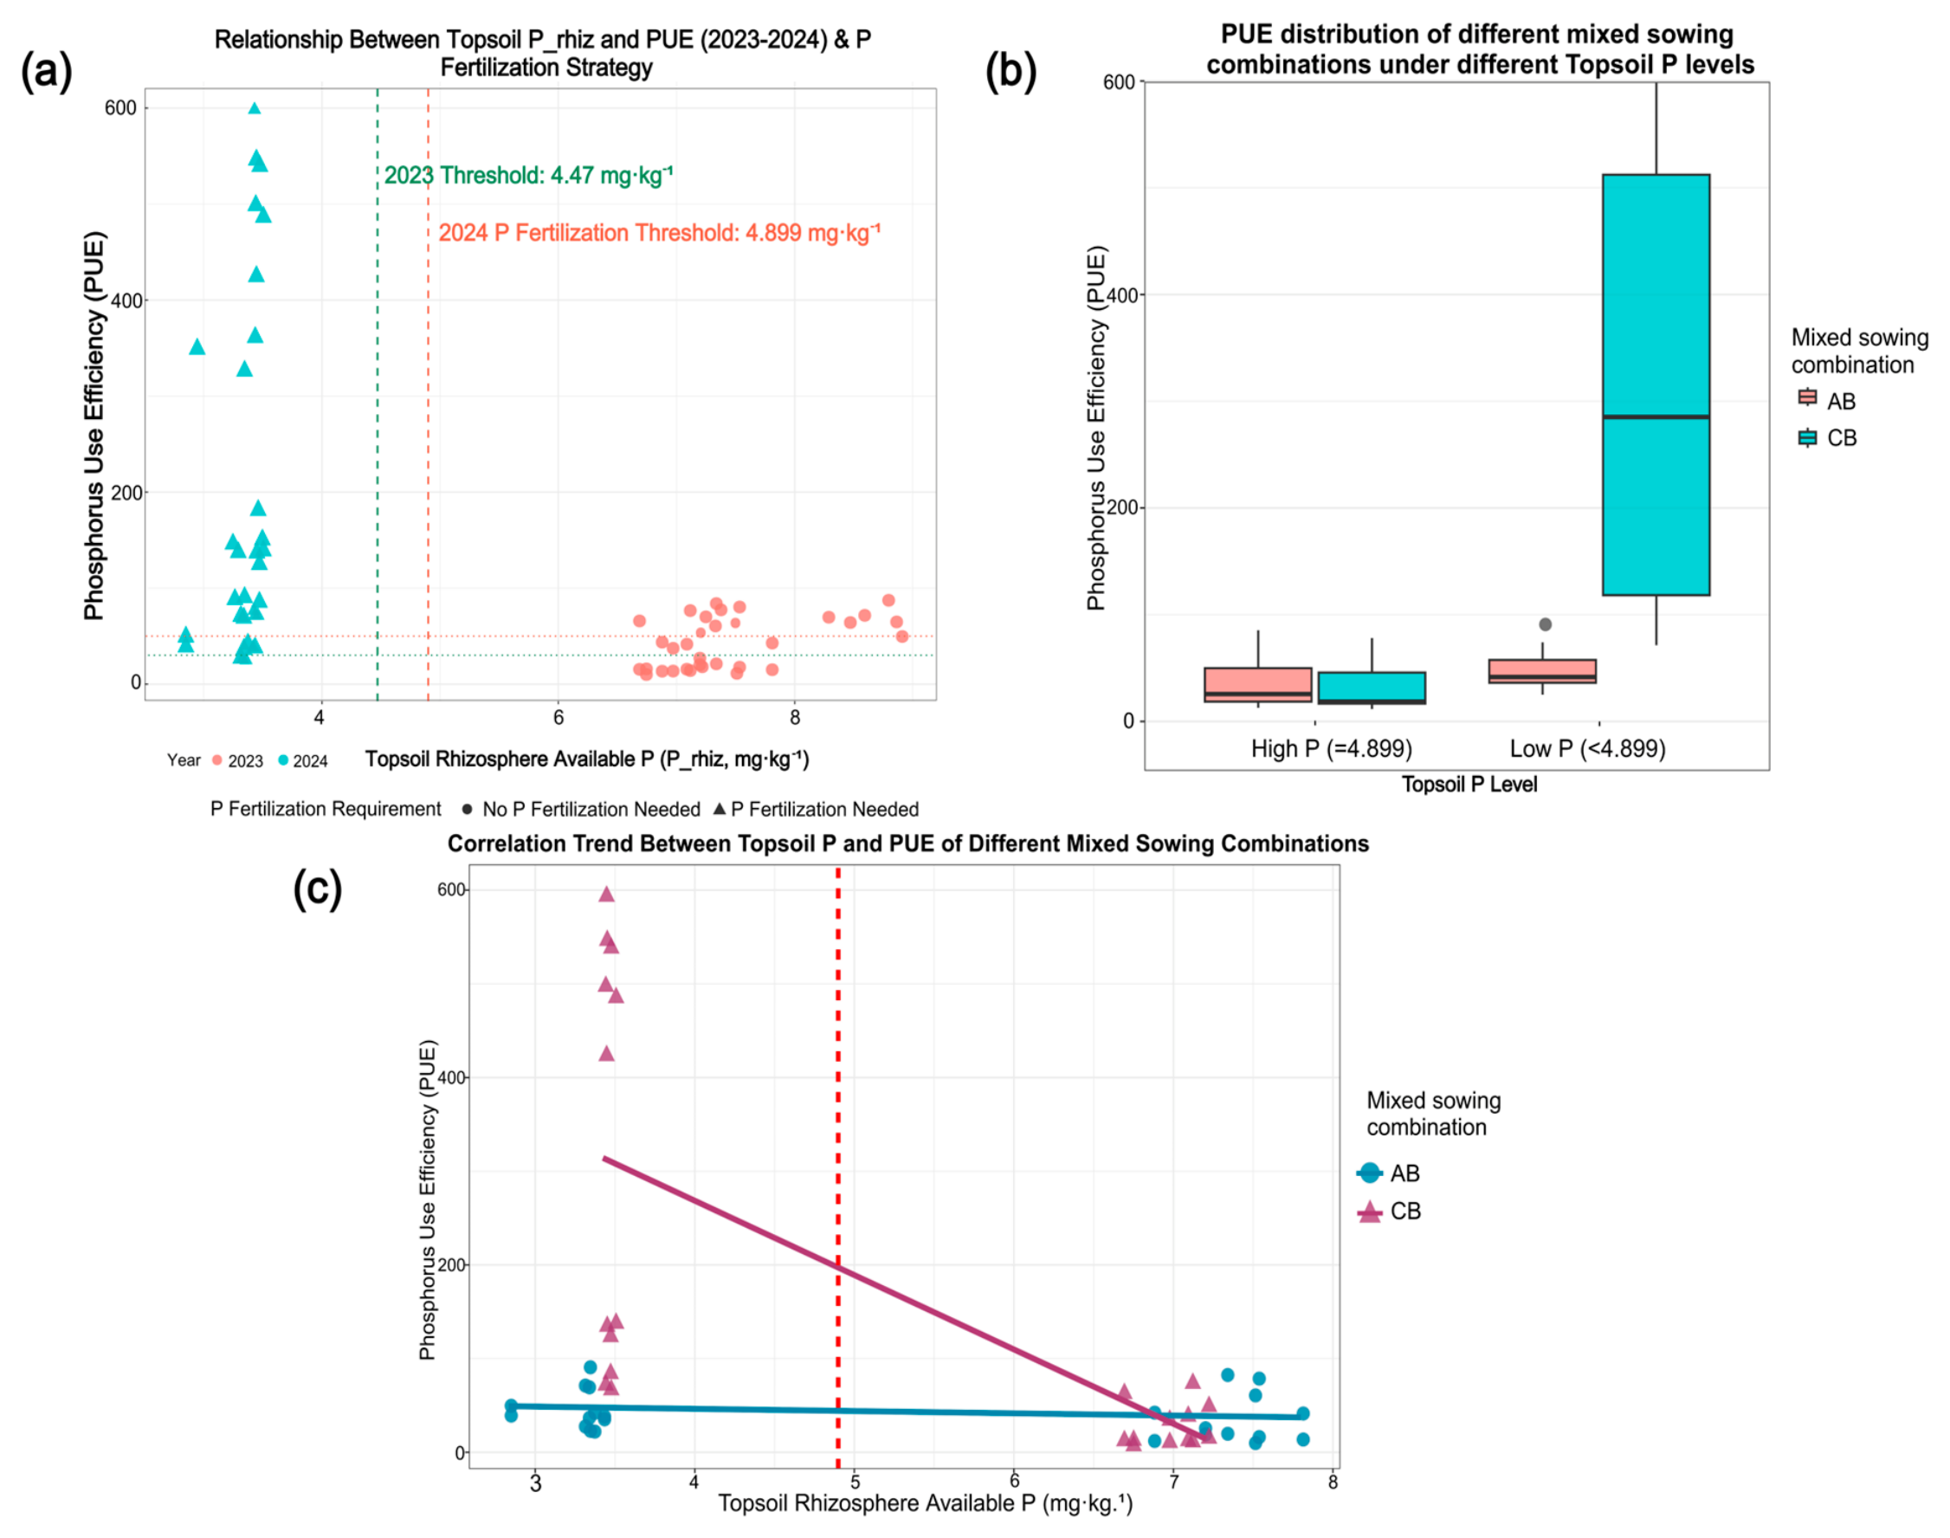
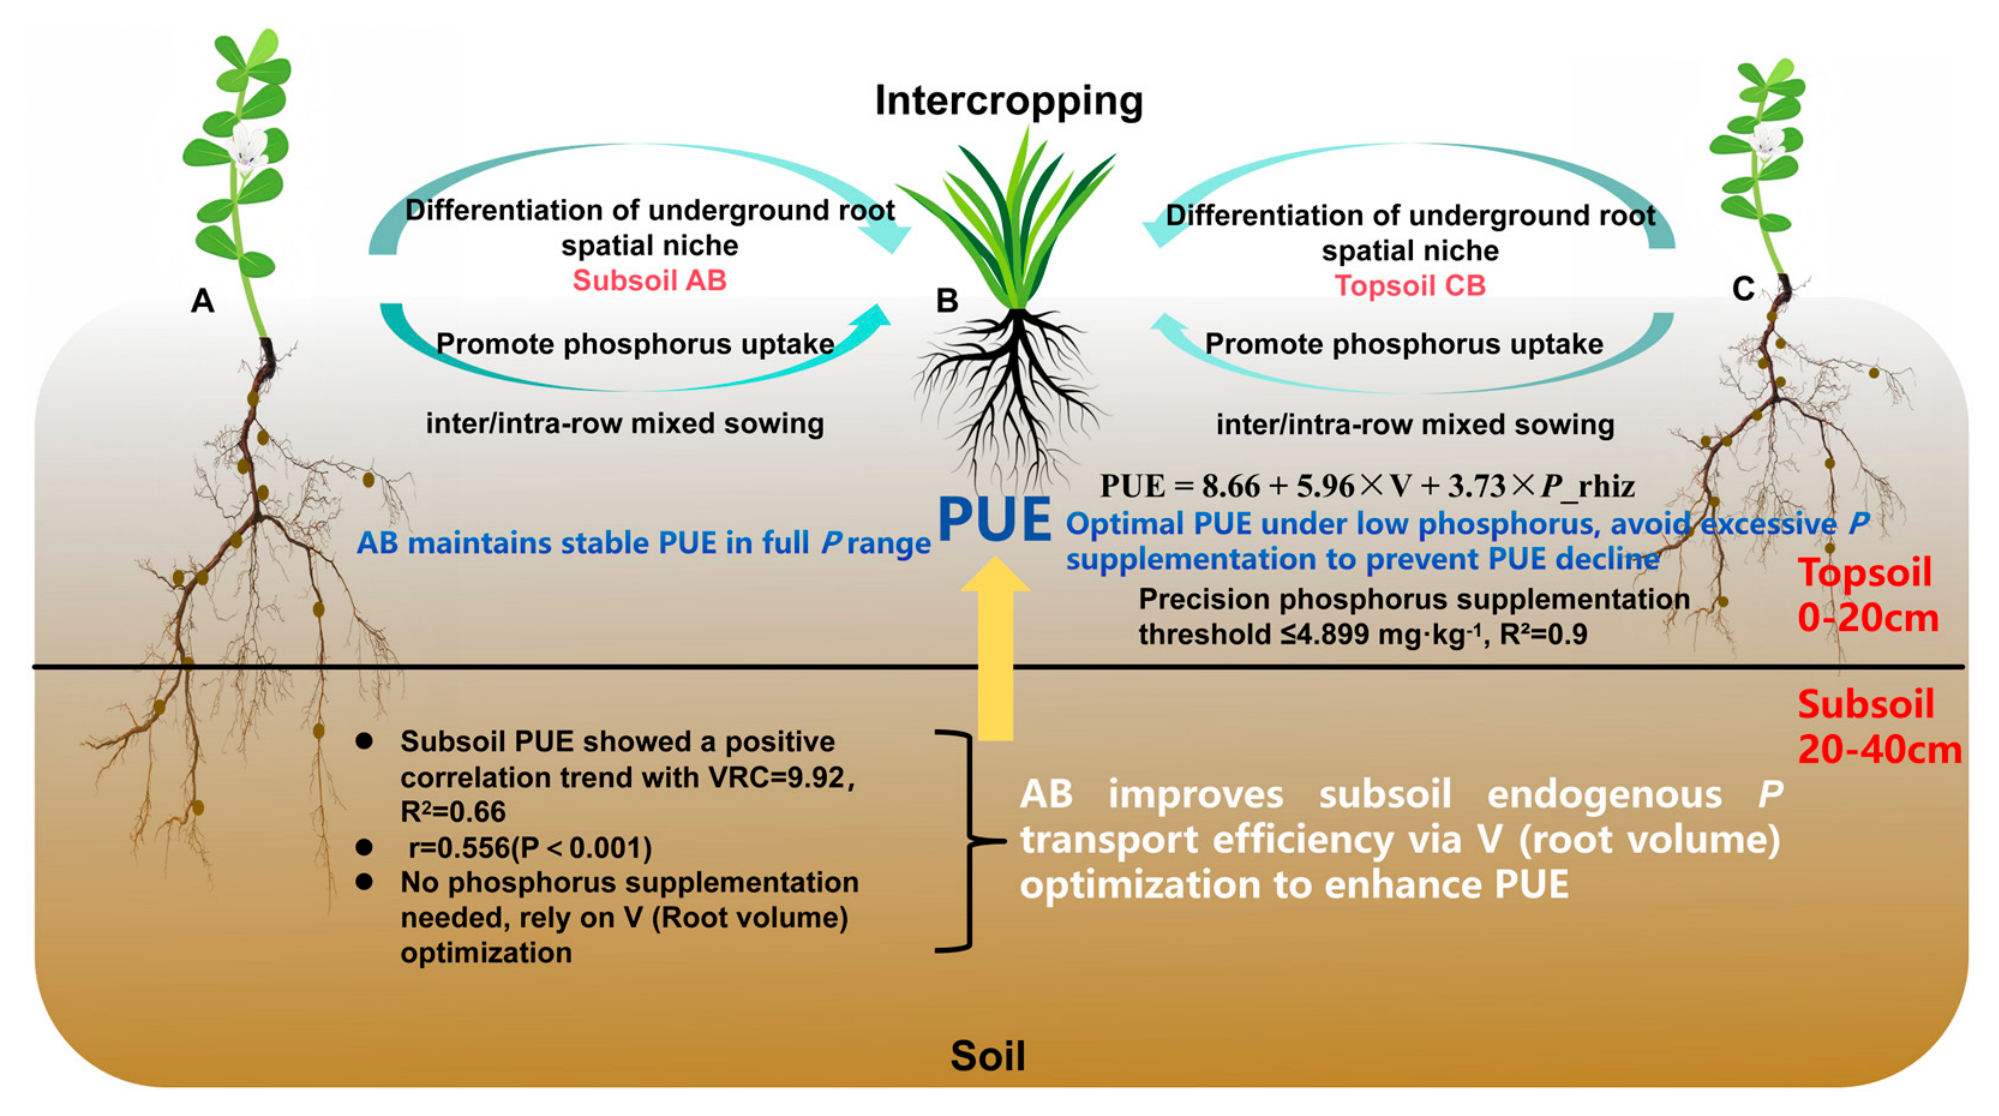
Based on two-year repeated experiments, the critical threshold range of topsoil rhizosphere-available P was determined to be 4.47−4.899 mg·kg−1 (Figure 6a). When rhizosphere-available P exceeded this range, PUE of approximately 78−82% of samples reached a high-efficiency level (≥30) and tended to stabilize, indicating sufficient P supply and no requirement for exogenous P supplementation. Conversely, when P was below this range, PUE increased significantly with P content, and root volume could partially compensate for low P effects by expanding the P uptake range, though the overall PUE fluctuation increased by 41%. This threshold provides a quantitative basis for precision P management: the AB combination maintains stable PUE within this range and requires no additional P input when levels exceed 4.899 mg·kg−1; the CB combination performs better under low-P conditions but shows PUE decline with excessive P, thus requiring targeted root branching optimization in topsoil. For subsoil, improving endogenous P transport via deep-root trait optimization in the AB combination is more effective than P supplementation, consistent with the hierarchical regulatory mechanism (Figure 7).
Figure 6.
Correlation between topsoil rhizosphere-available P, PUE, and optimization of P supplementation strategies for mixed-sowing combinations during 2023−2024. (a) Relationship between topsoil rhizosphere available P (P_rhiz) and PUE across 2023−2024 and corresponding P fertilization thresholds. Scatter points with different colors represent experimental years (red = 2023, blue = 2024); scatter points with different shapes indicate P supplementation requirements (circle = no P supplementation needed, triangle = P supplementation needed). The green dashed line denotes the critical value of sufficient P in 2023 (4.47 mg·kg−1); the red dashed line denotes the P supplementation threshold in 2024 (4.899 mg·kg−1). (b) Distribution of PUE for different mixed-sowing combinations under low and high topsoil rhizosphere available P levels (threshold: 4.899 mg·kg−1). (c) Correlation trend between topsoil rhizosphere available P and PUE of different mixed-sowing combinations. The red dashed line represents the P fertilization threshold (4.899 mg·kg−1).
Figure 7.
Schematic diagram of the hierarchical regulation mechanism of PUE in intercropping systems of M. sativa−B. inermis and T. pratense−B. inermis. (A) represents M. sativa (deep-rooted leguminous plant); (B) represents B. inermis; (C) represents T. pratense (shallow-rooted leguminous plant); V = root volume; P_{rhiz} = rhizosphere-available phosphorus; RC = regression coefficient; R2 = model goodness of fit; topsoil (0–20 cm) = surface soil layer; subsoil (20–40 cm) = subsoil layer. The topsoil layer (0−20 cm) was dominated by the CB mixed-sowing combination with a precise P supplementation threshold of ≤4.899 mg·kg−1; the subsoil layer (20–40 cm) was dominated by the AB mixed-sowing combination, which relied on root volume optimization (no additional P supplementation required). All quantitative parameters of the PUE model were derived from Table S3.
4. Discussion
4.1. Differences in Yield and Productivity Among Mixed-Sowing Combinations
The superior productivity of the AB mixture (M. sativa/B. inermis) reflects a functional complementarity between species with contrasting root architectures. Unlike the CB combination, where both component species exhibit shallow-rooted traits and thus compete for the same topsoil P pool [32], the AB pairing combines a deep-rooted legume with a shallow-rooted grass, partitioning belowground resources vertically. This spatial segregation reduces direct interspecific competition while expanding the total soil volume exploited [33], a mechanism that underpins overyielding in diverse intercropping systems [34]. The pronounced advantage in root biomass further suggests that M. sativa facilitates P acquisition from deeper horizons, whereas B. inermis exploits surface P pools—an interspecific division of labor that aligns with the root plasticity-mediated buffering of nutrient heterogeneity documented in legume–cereal mixtures [35]. Whether this structural advantage translates into differential P-use efficiency across soil layers, however, depends on how species-specific root traits modulate rhizosphere P dynamics [36], a question addressed in the following sections.
4.2. Regulatory Effects of Root Traits on Vertical Soil Phosphorus Distribution
The contrasting root system architectures between AB and CB combinations generate divergent patterns of soil P exploitation that reflect distinct phosphorus acquisition strategies [37]. In the AB mixture, the deep-rooted M. sativa accesses P from the 20−40 cm layer, while B. inermis scavenges residual P in the topsoil, creating a complementary spatial niche as noted in Section 4.1. This partitioning is reflected in the negative relationship between root morphological investment and available P across soil depths, indicating that greater root expansion corresponds to more intensive P depletion [38]. The CB combination, by contrast, concentrates root biomass in the surface layer, rapidly depleting rhizosphere-available P [39] and creating a steeper P gradient between rhizosphere and bulk soil. These divergent strategies represent two adaptive solutions to P limitation: the AB combination employs “spatial exploration” through deep-root expansion, whereas the CB combination appears to rely on “intensive exploitation” of localized surface P pools [36]. The steeper P depletion gradients observed under the CB combination are consistent with rhizosphere acidification and organic anion-mediated P mobilization reported in shallow-rooted legume–grass systems [40], though direct evidence for these biochemical processes was not obtained in this study and remains to be experimentally validated. This functional dichotomy provides a mechanistic foundation for the soil-layer-specific PUE regulation examined below.
4.3. Differentiated Impacts of Soil Depth on PUE Driving Mechanisms
The structural differences in root deployment between AB and CB combinations manifest as divergent PUE regulatory pathways across soil depths, as verified by structural equation modeling. In the surface layer (0−20 cm), where P availability is relatively high, PUE is synergistically driven by root volume and rhizosphere-available P, reflecting the combined influence of morphological plasticity and rhizosphere biochemistry (Figure 5). The CB combination excels in this environment, leveraging its dense surface root network and the low-P tolerance of T. pratense to maximize P capture efficiency [41]. In the deep layer (20−40 cm), however, where background P levels are low and rhizosphere activation is constrained, root volume emerges as the dominant driver of PUE [42]. Here, the AB combination gains a decisive advantage through the deep-root expansion capacity of M. sativa, which overcomes P limitation by increasing root−soil contact area [43]. This depth-dependent shift in PUE regulation—from multifactorial synergy in topsoil to root-volume dominance in subsoil—explains why the AB combination maintains stable PUE across P levels, whereas the CB combination exhibits PUE fluctuations under high-P conditions. The latter observation is derived from our experimental data (Figure 6) and may reflect the energy-saving adaptation strategy of low-P-tolerant plants under high-P environments, where reduced investment in root branching or elongation leads to declining PUE [44]. The compensatory effect of root morphological plasticity has its limits; when soil P falls below the critical threshold, root expansion alone cannot sustain PUE stability [45], pointing to the potential need for integrated physiological and microbial strategies [46]. We also note that the structural equation model constructed for the 20−40 cm subsoil layer fails to meet standard global fit criteria. Therefore, robust conclusions regarding the complete multi-path cascade regulatory network cannot be derived for deep soil, and we only focus on the validated dominant relationship between root volume and PUE.
4.4. Threshold Effects of PUE and Phosphorus Response Differences Among Combinations
The soil-layer-specific quantitative model developed in this study revealed a critical threshold of topsoil rhizosphere-available P (4.47−4.899 mg·kg−1) that distinguishes stable from fluctuating PUE states under the experimental conditions. Below this threshold, PUE becomes highly variable, indicating that the compensatory capacity of root phenotypic plasticity is insufficient to maintain efficiency under severe P limitation [45]. Although plants can partially buffer PUE through root volume expansion (as detailed in Section 4.3), this morphological compensation cannot fully offset the inhibitory effect of low P availability on metabolic processes. Above the threshold, PUE enters a saturation state where additional P supply no longer enhances efficiency, consistent with the diminishing returns of P fertilization documented in diverse cropping systems [47]. The differential responses of AB and CB combinations to P supplementation further highlight the importance of matching root system architecture to soil P conditions: the CB combination, reliant on surface root niche differentiation, exhibits superior PUE in low-P environments but suffers efficiency losses when P is abundant, whereas the AB combination maintains stable PUE across P levels through stratified P absorption achieved by deep-root spatial exploration. This threshold effect provides a quantitative basis for precision P management, though its applicability beyond controlled pot conditions remains to be validated. Notably, the model’s lower explanatory power for deep-soil P utilization (R2 = 0.66 versus 0.90 for topsoil) suggests that unmeasured biological processes, potentially including arbuscular mycorrhizal fungi (AMF) colonization [40] and root exudate-mediated P mobilization (Section 4.2), may contribute to subsoil PUE, a hypothesis requiring direct experimental testing.
4.5. Targeted Phosphorus Management Strategies and Research Prospects
Based on the soil-layer-mediated regulatory mechanisms elucidated above, this study proposes a conceptual framework of “Phosphorus Supply−Demand Assessment–Deep and Shallow Root Combination Matching–Soil-Layer-Oriented Regulation” (Figure 7). For the surface soil layer, precision P supplementation should be guided by the established threshold, maintaining rhizosphere-available P within the optimal range to maximize fertilizer use efficiency while minimizing P fixation [47]. For the deep soil layer, management should prioritize the optimization of root volume in deep-rooted species such as M. sativa, enabling exploitation of indigenous subsoil P reserves without additional fertilization. This dual-layer approach aligns with the viewpoint that crop P management should focus on regulating root phenotypes rather than indiscriminate P supplementation [48]. However, several caveats apply. First, the threshold values and regulatory pathways identified herein are based on two-year pot experiments under controlled conditions; their extrapolation to field settings requires validation through long-term trials accounting for spatial heterogeneity, climatic variability, and edaphic factors not captured in pots. Second, the proposed strategy addresses P management in isolation; integrated nutrient management considering nitrogen fixation by legumes and interactions with other nutrients remains to be developed. Third, the role of arbuscular mycorrhizal fungi in deep-layer P acquisition, though hypothesized [39], was not directly measured and represents a critical knowledge gap. Future research should integrate functional factors such as root exudate composition [38], rhizosphere microbial community structure [49], and AMF hyphal P transport [46] into the quantitative model to refine the mechanistic basis for deep-soil P management.
5. Conclusions
This study systematically elucidated the soil-layer-mediated regulatory mechanism of PUE in legume–grass mixed cropping systems. The results demonstrate that mixed-sowing combinations achieve efficient stratified utilization of soil P through spatial niche differentiation between deep and shallow root systems. The CB combination (T. pratense/B. inermis), relying on dense surface roots and rhizosphere P activation, exhibits excellent P capture capacity in low-P topsoil. In contrast, the AB combination (M. sativa/B. inermis), with its advantage in deep mg·kg−1 root expansion, maintains stable PUE across P levels by accessing subsoil P reserves. The critical threshold of topsoil rhizosphere-available P (4.47−4.899 mg·kg−1) provides a quantitative decision tool for precision P fertilization in pot cultivation, while the differentiated regulatory pathways across soil layers offer mechanistic guidance for species selection in mixed-sowing systems. These findings advance the theoretical understanding of root-mediated PUE regulation and establish a root phenotype-based framework for optimizing P management in mixed forage cultivation. Future research can incorporate functional factors such as root exudate composition, rhizosphere microbial community structure, and AMF hyphal P transport into quantitative models to further refine the mechanistic basis for deep-subsoil phosphorus management under field conditions.
Supplementary Materials
The following supporting information can be downloaded at: https://www.mdpi.com/article/10.3390/agronomy16151465/s1, Figure S1: differences in root phenotypic characteristics under different treatments. Figure S2: validation of the PUE multi-factor prediction model across different soil layers. Figure S3: graph of collinearity test (VIF values) for predictive model variables. Table S1: mixed-sowing patterns and sowing quantity of legume–grass mixtures. Table S2: linear mixed-effects model analysis results for root phenotypes. Table S3: Intraclass Correlation Coefficient (ICC) for variables included in Structural Equation Modeling (SEM) and Random Forest (RF) analyses. Table S4: Random Forest Model validation results. Table S5: parameters of the multi-factor linear prediction model for PUE.
Author Contributions
Z.D.: conceptualization, methodology, investigation, data curation, and writing—original draft preparation; K.L.: conceptualization and writing—review and editing; Y.D., G.L., L.W. and J.F.: data curation and investigation; Y.W. and L.H.: investigation and formal analysis; W.Z.: methodology, writing—review and editing, and funding acquisition. All authors have read and agreed to the published version of the manuscript.
Funding
This research was financially supported by the National Natural Science Foundation of China (32573595) and the Project for Collection, Evaluation and Innovative Utilization of Elite Legume Forage Germplasm Resources in Arid Regions of Central Asia (CCPTZX2024GH02).
Data Availability Statement
The original contributions presented in the study are included in the article; further inquiries can be directed to the corresponding author.
Conflicts of Interest
Author Likai He was employed by the company Inner Mongolia Pratacultural Technology Innovation Center Co., Ltd. The remaining authors declare that the research was conducted in the absence of any commercial or financial relationships that could be construed as a potential conflict of interest.
References
- Vitousek, P.M.; Porder, S.; Houlton, B.Z.; Chadwick, O.A. Terrestrial phosphorus limitation: Mechanisms, implications, and nitrogen-phosphorus interactions. Ecol. Appl. 2010, 20, 5–15. [Google Scholar] [CrossRef] [PubMed]
- Wahid, F.; Fahad, S.; Danish, S.; Adnan, M.; Yue, Z.; Saud, S.; Siddiqui, M.H.; Brtnicky, M.; Hammerschmiedt, T.; Datta, R. Sustainable Management with Mycorrhizae and Phosphate Solubilizing Bacteria for Enhanced Phosphorus Uptake in Calcareous Soils. Agriculture 2020, 10, 334. [Google Scholar] [CrossRef]
- Fahad, S.; Bajwa, A.A.; Nazir, U.; Anjum, S.A.; Farooq, A.; Zohaib, A.; Sadia, S.; Nasim, W.; Adkins, S.; Saud, S.; et al. Crop Production under Drought and Heat Stress: Plant Responses and Management Options. Front. Plant Sci. 2017, 8, 1147. [Google Scholar] [CrossRef] [PubMed]
- Farooq, M.; Almamari, S.A.D.; Rehman, A.; Al-Busaidi, W.M.; Wahid, A.; Al-Ghamdi, S.S. Morphological, physiological and biochemical aspects of zinc seed priming-induced drought tolerance in faba bean. Sci. Hortic. 2021, 281, 109894. [Google Scholar] [CrossRef]
- Cho, H.; Bouain, N.; Zheng, L.; Rouached, H. Plant resilience to phosphate limitation: Current knowledge and future challenges. Crit. Rev. Biotechnol. 2021, 41, 63–71. [Google Scholar] [CrossRef] [PubMed]
- Xia, Z.; He, Y.; Zhou, B.; Korpelainen, H.; Li, C. Sex-related responses in rhizosphere processes of dioecious Populus cathayana exposed to drought and low phosphorus stress. Environ. Exp. Bot. 2020, 175, 104049. [Google Scholar] [CrossRef]
- Cakmak, I. Plant nutrition research: Priorities to meet human needs for food in sustainable ways. Plant Soil 2002, 247, 3–24. [Google Scholar] [CrossRef]
- Lynch, J.P. Root Phenes for Enhanced Soil Exploration and Phosphorus Acquisition: Tools for Future Crops. Plant Physiol. 2011, 156, 1041–1049. [Google Scholar] [CrossRef] [PubMed]
- Hodge, A. Root decisions. Plant Cell Environ. 2009, 32, 628–640. [Google Scholar] [CrossRef] [PubMed]
- Cordeiro, C.F.D.S.; Echer, F.R.; Rosolem, C.A. Root systems of peanut cultivars respond differently to soil P availability to improve P uptake. J. Plant Nutr. Soil Sci. 2024, 187, 484–493. [Google Scholar] [CrossRef]
- Freschet, G.; Roumet, C.; Comas, L.H.; Weemstra, M.; Bengough, A.G.; Rewald, B.; Bardgett, R.D.; Deyn, G.B.D.; Johnson, D.; Klimešová, J.; et al. Root traits as drivers of plant and ecosystem functioning: Current understanding, pitfalls and future research needs. New Phytol. 2021, 232, 1123–1158. [Google Scholar] [CrossRef] [PubMed]
- Liang, L.; An, T.; Liu, S.; Gao, Y.; Yu, M.; Xu, B.; Zhang, S.; Deng, X.; Bolan, N.; Siddique, K.H.M.; et al. Assessing phosphorus efficiency and tolerance in maize genotypes with contrasting root systems at the early growth stage using the semi-hydroponic phenotyping system. J. Plant Nutr. Soil Sci. 2023, 186, 286–297. [Google Scholar] [CrossRef]
- Miguel, M.A.; Postma, J.A.; Lynch, J.P. Phene synergism between root hair length and basal root growth angle for phosphorus acquisition. Plant Physiol. 2015, 167, 1430–1439. [Google Scholar] [CrossRef] [PubMed]
- Lynch, J.P. Root architecture and plant productivity. Plant Physiol. 1995, 109, 7–13. [Google Scholar] [CrossRef] [PubMed]
- Li, L.; Sun, J.; Zhang, F.; Guo, T.; Bao, X.; Smith, F.A.; Smith, S.E. Root distribution and interactions between intercropped species. Oecologia 2006, 147, 280–290. [Google Scholar] [CrossRef] [PubMed]
- Nadeem, M.; Wu, J.; Ghaffari, H.; Kedir, A.J.; Saleem, S.; Mollier, A.; Singh, J.; Cheema, M. Understanding the Adaptive Mechanisms of Plants to Enhance Phosphorus Use Efficiency on Podzolic Soils in Boreal Agroecosystems. Front. Plant Sci. 2022, 13, 804058. [Google Scholar] [CrossRef] [PubMed]
- Streit, J.; Meinen, C.; Rauber, R. Intercropping effects on root distribution of eight novel winter faba bean genotypes mixed with winter wheat. Field Crops Res. 2019, 235, 1–10. [Google Scholar] [CrossRef]
- Wang, L.; Hou, B.; Zhang, D.; Lyu, Y.; Zhang, K.; Li, H.; Rengel, Z.; Shen, J. The niche complementarity driven by rhizosphere interactions enhances phosphorus-use efficiency in maize/alfalfa mixture. Food Energy Secur. 2020, 9, e252. [Google Scholar] [CrossRef]
- Sun, H.; Wu, R.; Li, P.; Shao, S.; Qi, L.; Han, J. Rooting depth of alfalfa. Acta Prataculturae Sin. 2008, 16, 307–312. [Google Scholar] [CrossRef]
- Byers, E.; Dörsch, P.; Eich-Greatorex, S.; Bleken, M.A. Deep N acquisition in cultivated grasslands. Plant Soil 2024, 499, 393–408. [Google Scholar] [CrossRef]
- USDA NRCS. Bromus inermis Leyss. Plant Materials Program; U.S. Department of Agriculture: Washington, DC, USA, 2024. Available online: https://www.nrcs.usda.gov/plant-materials (accessed on 5 July 2026).
- Coronado Aleans, V.; Barrera Sánchez, C.F.; Guzmán, M. High-Throughput Phenotyping of Maize Roots Using Digital Image Analysis. Cienc. y Tecnol. Agropecu. 2023, 25, e3312. [Google Scholar] [CrossRef]
- Veneklaas, E.J.; Lambers, H.; Bragg, J.; Finnegan, P.M.; Lovelock, C.E.; Plaxton, W.C.; Price, C.A.; Scheible, W.R.; Shane, M.W.; White, P.J.; et al. Opportunities for improving phosphorus-use efficiency in crop plants. New Phytol. 2012, 195, 306–320. [Google Scholar] [CrossRef] [PubMed]
- Wu, S.; Nan, L.; Wang, K. Effects of alfalfa–grass mixed sowing on grass yield and rhizosphere soil characteristics. Agronomy 2025, 15, 830. [Google Scholar] [CrossRef]
- Holland, J.E.; White, R.; Haefele, S.M.; Goulding, K.W.T.; McGrath, S.P.; Glendining, M.J. Long-Term Effects of Lime and Phosphorus Application on Soil Phosphorus Differ Between Two Arable UK Soils. Soil Use Manag. 2024, 40, e13160. [Google Scholar] [CrossRef]
- Han, B.; He, Y.; Chen, J.; Wang, Y.; Shi, L.; Lin, Z.; Yu, L.; Wei, X.; Zhang, W.; Geng, Y.; et al. Different Microbial Functional Traits Drive Bulk and Rhizosphere Soil Phosphorus Mobilization in an Alpine Meadow after Nitrogen Input. Sci. Total Environ. 2024, 931, 172904. [Google Scholar] [CrossRef] [PubMed]
- Bates, D.; Mächler, M.; Bolker, B.; Walker, S. Fitting Linear Mixed-Effects Models Using lme4. J. Stat. Softw. 2015, 67, 1–48. [Google Scholar] [CrossRef]
- Kuznetsova, A.; Brockhoff, P.B.; Christensen, R.H.B. lmerTest Package: Tests in Linear Mixed Effects Models. J. Stat. Softw. 2017, 82, 1–26. [Google Scholar] [CrossRef]
- Rosseel, Y. Lavaan: An R Package for Structural Equation Modeling. J. Stat. Softw. 2012, 48, 1–36. [Google Scholar] [CrossRef]
- Liaw, A.; Wiener, M. Classification and Regression by randomForest. R News 2002, 2, 18–22. [Google Scholar]
- Mendiburu, F.D. Agricolae: Statistical procedures for agricultural research. J. Am. Stat. Assoc. 2017, 80, 390. [Google Scholar] [CrossRef]
- Li, H.; Zhang, D.; Wang, X.; Li, H.; Rengel, Z.; Shen, J. Competition between Zea mays genotypes with different root morphological and physiological traits is dependent on phosphorus forms and supply patterns. Plant Soil 2019, 434, 125–137. [Google Scholar] [CrossRef]
- Gong, X.; Dang, K.; Lv, S.; Zhao, G.; Tian, L.; Luo, Y.; Feng, B. Interspecific root interactions and water-use efficiency of intercropped proso millet and mung bean. Eur. J. Agron. 2020, 115, 126034. [Google Scholar] [CrossRef]
- Su, Y.; Zhang, W.; Zhao, J.; Sun, J.; Zheng, H.; Callaway, R.M.; Li, L. Cultivar mixtures increase stability and productivity over time through asynchrony and complementarity. Agron. Sustain. Dev. 2025, 45, 20. [Google Scholar] [CrossRef]
- Zhao, Z.; Yan, P.; Chang, Z.; Li, L.; Ge, Y.; Wu, X.; Shen, X.; Ren, M.; Li, Z.; Kang, Y.; et al. Synergistic Promotion of Phosphorus Uptake by Root Architecture and Exudates in Legume–Cereal Intercropping Systems: A Review. Agronomy 2026, 16, 543. [Google Scholar] [CrossRef]
- Liu, Q.; Wan, W.; Chen, W.; Zhang, C.; Gao, H.; Zhang, J.; Sun, Z.; Li, H. Adaptation strategies of three legumes to soil phosphorus availability in steppes of Inner Mongolia. Plant Soil 2025, 513, 1067–1084. [Google Scholar] [CrossRef]
- Li, M.; Cao, Z.; Zhang, X.; Chen, F.; Ma, J.; Wang, Z.; Hu, X.; Wu, P.; Ma, X. Differentiation and trade-offs of root phosphorus acquisition strategies in different phosphorus efficiency genotypes of Chinese fir. Plant Soil 2025, 517, 1583–1603. [Google Scholar] [CrossRef]
- Salim, M.; Chen, Y.; Solaiman, Z.M.; Siddique, K.H.M. Phosphorus Application Enhances Root Traits, Root Exudation, Phosphorus Use Efficiency, and Seed Yield of Soybean Genotypes. Plants 2023, 12, 1110. [Google Scholar] [CrossRef] [PubMed]
- Zhang, H.; Xiao, Y. Contribution of mycorrhizal symbiosis and root strategy to red clover aboveground biomass under nitrogen addition and phosphorus distribution. Mycorrhiza 2024, 34, 489–502. [Google Scholar] [CrossRef] [PubMed]
- Sun, B.; Gao, Y.; Wu, X.; Ma, H.; Zheng, C.; Wang, X.; Zhang, H.; Li, Z.; Yang, H. The relative contributions of pH, organic anions, and phosphatase to rhizosphere soil phosphorus mobilization and crop phosphorus uptake in maize/alfalfa polyculture. Plant Soil 2020, 447, 117–133. [Google Scholar] [CrossRef]
- Dias de Oliveira, E.A.; Reed, N.; Yun, K.; Habermann, E.; Matamala, R.; Zare, A.; Kim, S.-H.; Gonzalez-Meler, M. Root architectural plasticity optimizes nutrient acquisition in switchgrass under variable phosphorus forms. Plant Soil 2025, 513, 185–196. [Google Scholar] [CrossRef]
- Ribeiro, C.A.G.; Tinoco, S.M.d.S.; Souza, V.F.d.; Negri, B.F.; Gault, C.M.; Pastina, M.M.; Magalhaes, J.V.; Guimarães, L.J.M.; Barros, E.G.d.; Buckler, E.S.; et al. Genome-wide association study for root morphology and phosphorus acquisition efficiency in diverse maize panels. Int. J. Mol. Sci. 2023, 24, 6233. [Google Scholar] [CrossRef] [PubMed]
- Hao, Y.; Wang, X.; He, J.; Dhanuskodi, H.; Chen, Y.; Li, Z.; Zhao, X.; Chen, J.; Gu, X.; Chen, C.; et al. Unveiling the impact of phosphorus availability on growth, root morphological and physiological traits of different phosphorus-tolerant alfalfa (Medicago sativa L.) in acidic soils in the karst region of southwest China. Environ. Exp. Bot. 2025, 240, 106271. [Google Scholar] [CrossRef]
- Gatti, M.L.; Cornaglia, P.S.; Re, P. Morphogenetical, structural and functional plastic responses to simultaneous shading and phosphorous shortage during establishment of Trifolium repens L. Agrofor. Syst. 2025, 99, 41. [Google Scholar] [CrossRef]
- Khan, F.; Siddique, A.B.; Shabala, S.; Zhou, M.; Zhao, C. Phosphorus plays key roles in regulating plants’ physiological responses to abiotic stresses. Plants 2023, 12, 2861. [Google Scholar] [CrossRef] [PubMed]
- Dai, J.; Kuyper, T.W.; Zhao, C.; Liu, Y.; Zhang, C.; Zhang, L.; Li, C. Mycorrhizal networks promote interspecific facilitation in P uptake by a maize/faba bean mixture. Plant Soil 2025, 514, 345–358. [Google Scholar] [CrossRef]
- An, R.; Yu, R.; Xing, Y.; Zhang, J.; Bao, X.; Lambers, H.; Li, L. Enhanced phosphorus-fertilizer-use efficiency and sustainable phosphorus management with intercropping. Agron. Sustain. Dev. 2023, 43, 57. [Google Scholar] [CrossRef]
- Li, L.; Liu, Y.; Li, X. Intercropping to Maximize Root–Root Interactions in Agricultural Plants. In The Root Systems in Sustainable Agricultural Intensification; Rengel, Z., Djalovic, I., Eds.; Wiley: Hoboken, NJ, USA, 2021; pp. 309–328. [Google Scholar] [CrossRef]
- Bargaz, A.; Noyce, G.L.; Fulthorpe, R.; Carlsson, G.; Furze, J.R.; Jensen, E.S.; Dhiba, D.; Isaac, M.E. Species interactions enhance root allocation, microbial diversity and P acquisition in intercropped wheat and soybean under P deficiency. Appl. Soil Ecol. 2017, 120, 179–188. [Google Scholar] [CrossRef]

Disclaimer/Publisher’s Note: The statements, opinions and data contained in all publications are solely those of the individual author(s) and contributor(s) and not of MDPI and/or the editor(s). MDPI and/or the editor(s) disclaim responsibility for any injury to people or property resulting from any ideas, methods, instructions or products referred to in the content. |
© 2026 by the authors. Licensee MDPI, Basel, Switzerland. This article is an open access article distributed under the terms and conditions of the Creative Commons Attribution (CC BY) license.