


Abstract
Soil amendments are widely applied for water conservation in urban turfgrass, yet whether establishment-phase benefits persist into a mature-stand remains unclear. This study evaluated biochar, biosolids, and greenwaste on tall fescue (Schedonorus arundinaceus) over a 108-day mature-stand trial under deficit (50% ET0) and moderate (85% ET0) irrigation, both below full replacement. Canopy performance was assessed by visual quality and NDVI, with van Genuchten soil-water retention modeling. Unlike the establishment-phase advantages reported for the organic amendments in Part I, the second-year results reversed sharply: moderate biochar (12.36 t ha−1) was most hydraulically stable, holding the highest plant-available water (PAW ≈ 0.18 cm3 cm−3, above the control and organic amendments) and the most stable canopy. High-rate biochar (24.71 t ha−1) underperformed the control under deficit irrigation, indicating constraints beyond water retention at the highest rate. Greenwaste and biosolids raised volumetric water content but provided lower PAW than moderate biochar. For greenwaste, a reduced field capacity offset this; for biosolids, an elevated permanent wilting point limited the extractable fraction. Biosolids failed to maintain acceptable quality even under the 85% ET0. Because first-year success does not guarantee mature-stand resilience, amendment stability and rate optimization, rather than application volume, emerge as long-term management priorities under water-limited conditions.
1. Introduction
Soil amendments are widely used to modify the physical and hydraulic properties of turfgrass root zones, with the primary goals of increasing plant-available water, reducing compaction, and sustaining canopy quality under water-limited management conditions [1]. Among the materials evaluated in recent decades, composted organic amendments and biochar have received particular attention for their capacity to alter soil pore architecture, organic matter dynamics, and nutrient availability in ways that can support turfgrass performance in structurally deficient or low-fertility soils [1,2,3]. Tall fescue (Schedonorus arundinaceus [Schreb.] Dumort.) is a common target species for such interventions because of its comparatively deep root system and moderate drought tolerance [4], though its performance under sustained deficit irrigation remains sensitive to the soil hydraulic environment in which it is grown [5].
Research on composted amendments in turfgrass systems has established that greenwaste, biosolids, and similar materials can improve soil organic matter content, aggregate stability, and early shoot growth when incorporated prior to establishment [6,7,8,9]. However, the extent of these benefits depends heavily on the compost’s maturity and carbon-to-nitrogen ratio at the time of application [10]. Immature or high-carbon materials are prone to microbial nitrogen immobilization during active decomposition, which can suppress plant-available nitrogen precisely when establishing stands are most dependent on it [10]. Biosolids present a different set of constraints: at higher application rates, elevated electrical conductivity and accumulating solute loads can impose osmotic limitations on root development and seedling establishment [11]. Biochar, by contrast, is a recalcitrant carbon source that does not decompose appreciably on agronomic timescales. Its internal micropore and mesopore structure has been shown to increase plant-available water capacity by shifting water retention toward finer capillary fractions, and its progressive integration into soil aggregates suggests that these hydraulic benefits may be more durable than those of labile organic amendments [12,13,14].
Despite this body of work, most studies have evaluated amendment effects over a single growing season, typically during or immediately following establishment. This temporal limitation matters because the mechanisms driving amendment performance are not static: the physical improvements from composted amendments may diminish as their labile organic pool is consumed [10], whereas biochar’s recalcitrant structure may sustain or strengthen its hydraulic influence as it integrates into the soil matrix [13,14]. Whether these amendment-induced benefits observed during establishment are sustained, attenuated, or intensified in a mature stand, therefore, remains an open question with direct implications for long-term management under deficit irrigation.
Part I of this two-year field study documented the initial post-establishment phase responses of tall fescue to biochar, biosolids, and greenwaste amendments under deficit (50% ET0) and moderate (85% ET0) irrigation at the University of California, Riverside [15]. High-rate biochar concentrated nitrogen in the upper soil profile and moderated canopy decline under deficit conditions; greenwaste was associated with nitrogen immobilization that constrained early canopy development; and biosolids impaired root development at higher application rates. Part II reports second-year, mature-stand responses from the same experimental plots, using the eight-treatment design detailed in Section 2. Whereas most turfgrass amendment studies report only establishment-phase or single-season outcomes, few follow the same amended plots into a mature stand to test whether early hydraulic and nutritional benefits persist, attenuate, or reverse. Part II addresses this gap directly. Canopy performance was assessed through NDVI, digital image analysis (percent green cover and dark green color index), and volumetric water content (θv), while soil-water retention characteristics, field capacity, permanent wilting point, and plant-available water (PAW) were used to relate second-year canopy responses to underlying hydraulic mechanisms.
The objectives of Part II were to (i) quantify mature-stand tall fescue canopy and soil moisture responses to biochar, biosolids, and greenwaste amendments under both irrigation regimes; (ii) evaluate the persistence of amendment-induced differences in canopy vigor and soil water availability relative to post-establishment phase responses; and (iii) relate second-year performance to soil water-retention characteristics to determine the long-term functional consequences of each amendment. Based on the divergent first-year responses documented in Part I and the contrasting stability of recalcitrant and labile amendments, we developed two hypotheses: first, that moderate biochar rates would sustain higher plant-available water and canopy quality than the composted amendments in the second year, as the early advantages of the high-rate organic amendments attenuated with decomposition; and second, that high biosolids rates would continue to impair canopy performance even under the less restrictive irrigation regime. The two parts of this study provide a field-validated, multi-year assessment of amendment performance across the full post-establishment-to-maturity transition in a water-limited turfgrass system.
2. Materials and Methods
2.1. Experimental Site and Conditions
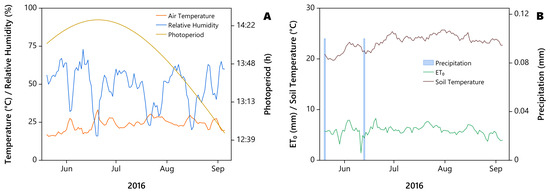
This study was conducted at the University of California Turfgrass Research Facility in Riverside, CA (33°57′47.55″ N, 117°20′16.36″ W; 340 m elevation), on a Hanford fine sandy loam soil under a semi-arid Mediterranean climate, within the same experimental layout described in Part I [15]. The site soil is moderately alkaline (pH 8.32), low in organic matter (1.14%), and has a cation exchange capacity of 10.29 cmolc dm−3; further physicochemical characterization is reported in the companion study [16]. Daily weather data, including average temperatures, relative humidity, photoperiod, ET0, soil temperature, and precipitation, are presented in Figure 1.
Figure 1.
(A) Average daily air temperature (°C), average relative humidity (%), and photoperiod (h). (B) Daily reference evapotranspiration (ET0, mm), average soil temperature (°C), and daily precipitation (mm). Source: CIMIS (California Irrigation Management Information System).
2.2. Design and Amendments Characterization
The experiment followed a split-plot arrangement within a randomized complete block design with four replications. The irrigation regime served as the main-plot factor at two levels (50% and 85% of reference evapotranspiration [ET0]), and eight soil amendment treatments were assigned to 2.4 × 2.4 m subplots. Each of the four blocks contained two irrigation main plots, and each main plot was divided into eight amendment subplots, for 64 subplots in total (2 irrigation regimes × 8 amendments × 4 blocks). Amendment treatments comprised an untreated control; three biochar rates (2.47, 12.36, and 24.71 t ha−1); composted biosolids and composted greenwaste, each applied at a 5 cm incorporation depth; greenwaste at a 10 cm depth; and a combined treatment of 5 cm greenwaste with 12.36 t ha−1 biochar. The amendments were characterized at the time of application [15]. The biochar was produced from yellow pine sawdust pyrolyzed at 350 °C and was carbon-rich and near-neutral (organic carbon 75.6%, pH 7.45, electrical conductivity [EC] 0.12 dS m−1). The greenwaste compost had a high carbon-to-nitrogen ratio (C:N 57; total N 0.67%), with a pH of 7.71 and an EC of 2.4 dS m−1. The biosolids compost, produced from stable bedding, green waste, and biosolids supplied by the Inland Empire Utilities Agency, had a low C:N ratio (7.1) and a high total nitrogen content (4.0%), with a pH of 7.59 and a markedly higher EC of 20 dS m−1, reflecting a substantial soluble-salt load. Full characterization of each material is reported in the companion study [16]. All amendments were incorporated on 16 April 2014, using a rototiller to a depth of 15 cm, consistent with recommended incorporation depths for compost in turfgrass systems [17]. Tall fescue (S. arundinaceus) was subsequently seeded on 5 May 2014, at a rate of 39.1 g m−2 (equivalent to 8 lbs 1000 ft−2). This sequence ensured that the mature-stand evaluation (2016) captured the longitudinal effects of the amendments after two full years of field conditions, as further detailed in the post-establishment phase report [15].
2.3. Irrigation Management
Irrigation scheduling in Year 2 followed the procedures established in Part I [15]. Reference evapotranspiration (ET0) was calculated daily from an on-site California Irrigation Management Information System (CIMIS) weather station and used to determine weekly irrigation targets for each main-plot treatment (50% or 85% ET0). Water was applied in three equal events per week, with each event delivering one-third of the weekly target volume, using the same sprinkler system as in Year 1. No amendments were reapplied, and no soil disturbances occurred between Year 1 and Year 2, ensuring that all observed second-year responses reflect residual amendment effects under continued deficit irrigation. Turf maintenance was applied uniformly across all plots and both irrigation regimes. At establishment, the stand received a single starter fertilization (16-16-16 fertilizer at 5 g N m−2) on 21 May 2014, and broadleaf weed control with 2,4-D on 4 June 2014, applied identically to every plot. During the Year 2 evaluation, the turf was mowed weekly to a height of 5.75 cm and received no fertilizer, herbicide, or pesticide. Because these practices were identical across all treatments, second-year amendment effects were not confounded with differential management. Over the evaluation period, cumulative reference evapotranspiration was 641 mm and precipitation was negligible (0.2 mm); total water applied was therefore approximately 320 mm under the 50% ET0 regime and 545 mm under the 85% ET0 regime.
2.4. Data Collection and Analytical Protocols
The Year 2 evaluation period spanned 108 days, from 20 May to 5 September 2016. Tall fescue was established on 5 May 2014, and had achieved full canopy closure (>95% green cover) by the 2015 growing season [15], confirming a mature stand entering the second warm-season evaluation period.
2.4.1. Canopy Reflectance and Physiological Assessment
Turfgrass canopy performance was evaluated at six sampling dates corresponding to 0, 16, 32, 59, 88, and 108 days after initiation (DAI) of the evaluation period (20 May 2016). Soil volumetric water content (θv) was measured at DAI 0, 16, 59, 88, and 108, and digital image variables were collected at DAI 16, 32, 59, 88, and 108. The following variables were assessed:
- •
- Visual Quality (VQ): Rated on a 1–9 scale according to Morris and Shearman [18], where 6 represents the minimum acceptable quality.
- •
- Normalized Difference Vegetation Index (NDVI): Measured using a handheld active optical sensor (GreenSeeker RT100, Trimble Inc., Sunnyvale, CA, USA) at a fixed nadir height of 1 m above the canopy at all six sampling dates.
- •
- Percent Green Cover (PGC) and Dark Green Color Index (DGCI): Derived from digital images captured in a standardized lightbox. Images were processed using TurfAnalyzer (Green Research Services, LLC, Fayetteville, AR, USA) with calibrated color-segmentation algorithms to isolate green vegetation and compute DGCI as described by Karcher and Richardson [19].
2.4.2. Soil Hydrological Dynamics
Volumetric water content (θv) was measured at each sampling date using a FieldScout TDR 300 (Spectrum Technologies, Aurora, IL, USA) equipped with 12 cm rods. Three measurements were taken at fixed marked locations within each subplot and averaged to obtain a single subplot-level estimate.
2.4.3. Soil Water Retention Characteristics
Soil water retention curves (SWRC) were generated in Year 2 to quantify amendment-induced differences following two years of field aging. One undisturbed core (5 cm diameter × 12 cm length) was collected per subplot from the 0–15 cm depth at a fixed marked location; the intact-structure requirement for pressure-plate analysis precluded multiple destructive samples within the limited subplot area. Cores were equilibrated on a pressure plate apparatus (Model 1500F1, Soil Moisture Equipment Corp., Santa Barbara, CA, USA) at the USDA–ARS U.S. Salinity Laboratory (Riverside, CA, USA) at matric potentials corresponding to pF 0.0 (h = 1 cm), 2.54 (h = 346.7 cm), 3.0 (h = 1000 cm), 3.7 (h = 5011.9 cm), 4.15 (h = 14,125 cm), 4.52 (h = 33,113 cm), and 5.8 (h ≈ 64,654 cm), following standard pressure plate methods [20]. Field capacity (θFC) and permanent wilting point (θPWP) were derived from van Genuchten model predictions at h = 346.7 cm (pF 2.5) and h = 15,849 cm (pF 4.2), respectively, and plant-available water was calculated as PAW = θFC − θPWP (cm3 cm−3). These suctions correspond to the matric potentials conventionally used to approximate field capacity (pF 2.5) and the permanent wilting point (pF 4.2) in agricultural soils [21]. The equivalent water-depth storage for the sampled layer is obtained by multiplying PAW by the core length (12 cm). Because pF 2.5 (θFC) coincides with the measured pF 2.54 point and pF 4.2 (θPWP) lies between the measured pF 4.15 and pF 4.52 points, both values were interpolated within the measured suction range rather than extrapolated. As a single intact core was obtained per subplot and the retention curves were fitted at the treatment level, the resulting van Genuchten parameters, θFC, θPWP, and PAW, are reported as descriptive treatment-level summaries and were not subjected to statistical mean separation; comparisons among these hydraulic quantities are therefore interpretive rather than inferential. The replicated canopy and volumetric water content data (n = 4) retain the full mean-separation analysis described in Section 2.5.
2.5. Data Analysis
The longitudinal canopy and soil-moisture variables were analyzed as a split-split-plot arrangement in time within a randomized complete block design, with irrigation regime as the main-plot factor, soil amendment as the subplot factor, and evaluation date as the sub-subplot factor. Block was treated as a random effect to reflect the hierarchical structure of the experimental design. The analysis tested the irrigation, amendment, and date main effects and all of their interactions, including the three-way irrigation × amendment × date interaction. Treatment means were separated within individual evaluation dates when interactions involving date were significant and pooled across dates otherwise; the date-by-date treatment groupings reported in the Results correspond to the dates at which these interactions were significant.
When F-tests indicated significant effects (p < 0.05), means were separated according to factor type. Because the irrigation factor comprised only two levels, the two regimes were compared by a t-test, which, for a two-level factor, is equivalent to the F-test for that effect (F = t2) and requires no grouping procedure. The eight-level amendment factor, by contrast, required separation among multiple means, for which the Scott–Knott clustering algorithm was used; it partitions treatment means into non-overlapping, homogeneous groups without inflating the Type I error rate [22].
Residual normality was assessed with the Shapiro–Wilk test on the within-date model residuals and homoscedasticity by residual plots. Visual quality and volumetric water content met normality at all evaluation dates and NDVI at most; the bounded green-cover and DGCI scales showed departures consistent with ceiling effects near their limits. For green cover, amendment-effect significance and treatment rank order were unchanged under an arcsine-square-root transformation, which did not itself remove the departures, indicating that they reflect the bounded structure of the data rather than model misspecification. Because analyses were balanced within evaluation dates (n = 4), under which the analysis of variance and the Scott–Knott procedure are robust to moderate non-normality, untransformed data were retained.
Season-long performance was additionally summarized as the area under the quality progress curve (AUPC), computed for each plot by trapezoidal integration of visual quality over days after initiation, yielding a single cumulative value per plot [23,24]. AUPC was analyzed as a split-plot within the randomized complete block design, with irrigation regime as the whole-plot factor and soil amendment as the subplot factor [25]. Where the irrigation × amendment interaction was significant, amendment means were separated within each regime by the Scott–Knott procedure [26], and the irrigation effect within each amendment was tested using the combined whole-plot and subplot error.
The temporal dynamics of turfgrass performance and soil moisture depletion were characterized through a hierarchical regression selection process. Model acceptance was governed by biological plausibility, statistical significance of regression coefficients (p < 0.05), and a minimum explanatory threshold of R2 ≥ 0.70. Non-linear models were retained only when the adjusted R2 demonstrated an improvement over the linear alternative; otherwise, first-order linear models (Y = a + bX) or treatment means (Y = ȳ) were adopted as the most parsimonious descriptors of the data. The R2 ≥ 0.70 criterion governed the acceptance of higher-order models rather than the detection of trends: a significant but lower-R2 trend was represented by the linear model rather than discarded, and the treatment mean was adopted only when no significant temporal trend was present. The fitted regressions describe the treatment-level temporal trajectories; statistical inference on treatment differences was provided by the split-split-plot analysis, so the regressions serve as descriptive summaries rather than independent hypothesis tests. The split-split-plot analysis of variance, mean separations, and descriptive regressions were performed in SAEG (v9.1; Federal University of Viçosa, Viçosa, Minas Gerais, Brazil) [27]; the area under the quality progress curve and the soil water retention curves were analyzed in R (v4.3.3) [24], with the relevant packages cited at each point. Figure 1 was generated in OriginPro 2026 (OriginLab Corporation, Northampton, MA, USA) [28], and the remaining figures in R using ggplot2 [29] and patchwork (v1.3.2) [30].
Soil water retention curves were fitted to the van Genuchten [31] model:
where θ(h) is the volumetric water content at matric suction h; θs and θr are the saturated and residual volumetric water contents, respectively; and α and n are empirical shape parameters. The parameter m was constrained as m = 1 − 1/n following the Mualem [32] conductivity model assumption. Parameter estimation was performed in R (v4.3.3) [24] using the Levenberg–Marquardt nonlinear least-squares algorithm implemented in the minpack.lm package (v1.2-1) [33]. Fitted curves were visualized using ggplot2 [29].
3. Results
3.1. Canopy Reflectance and Physiological Assessment
3.1.1. Turf Visual Quality and Temporal Stability of Visual Quality
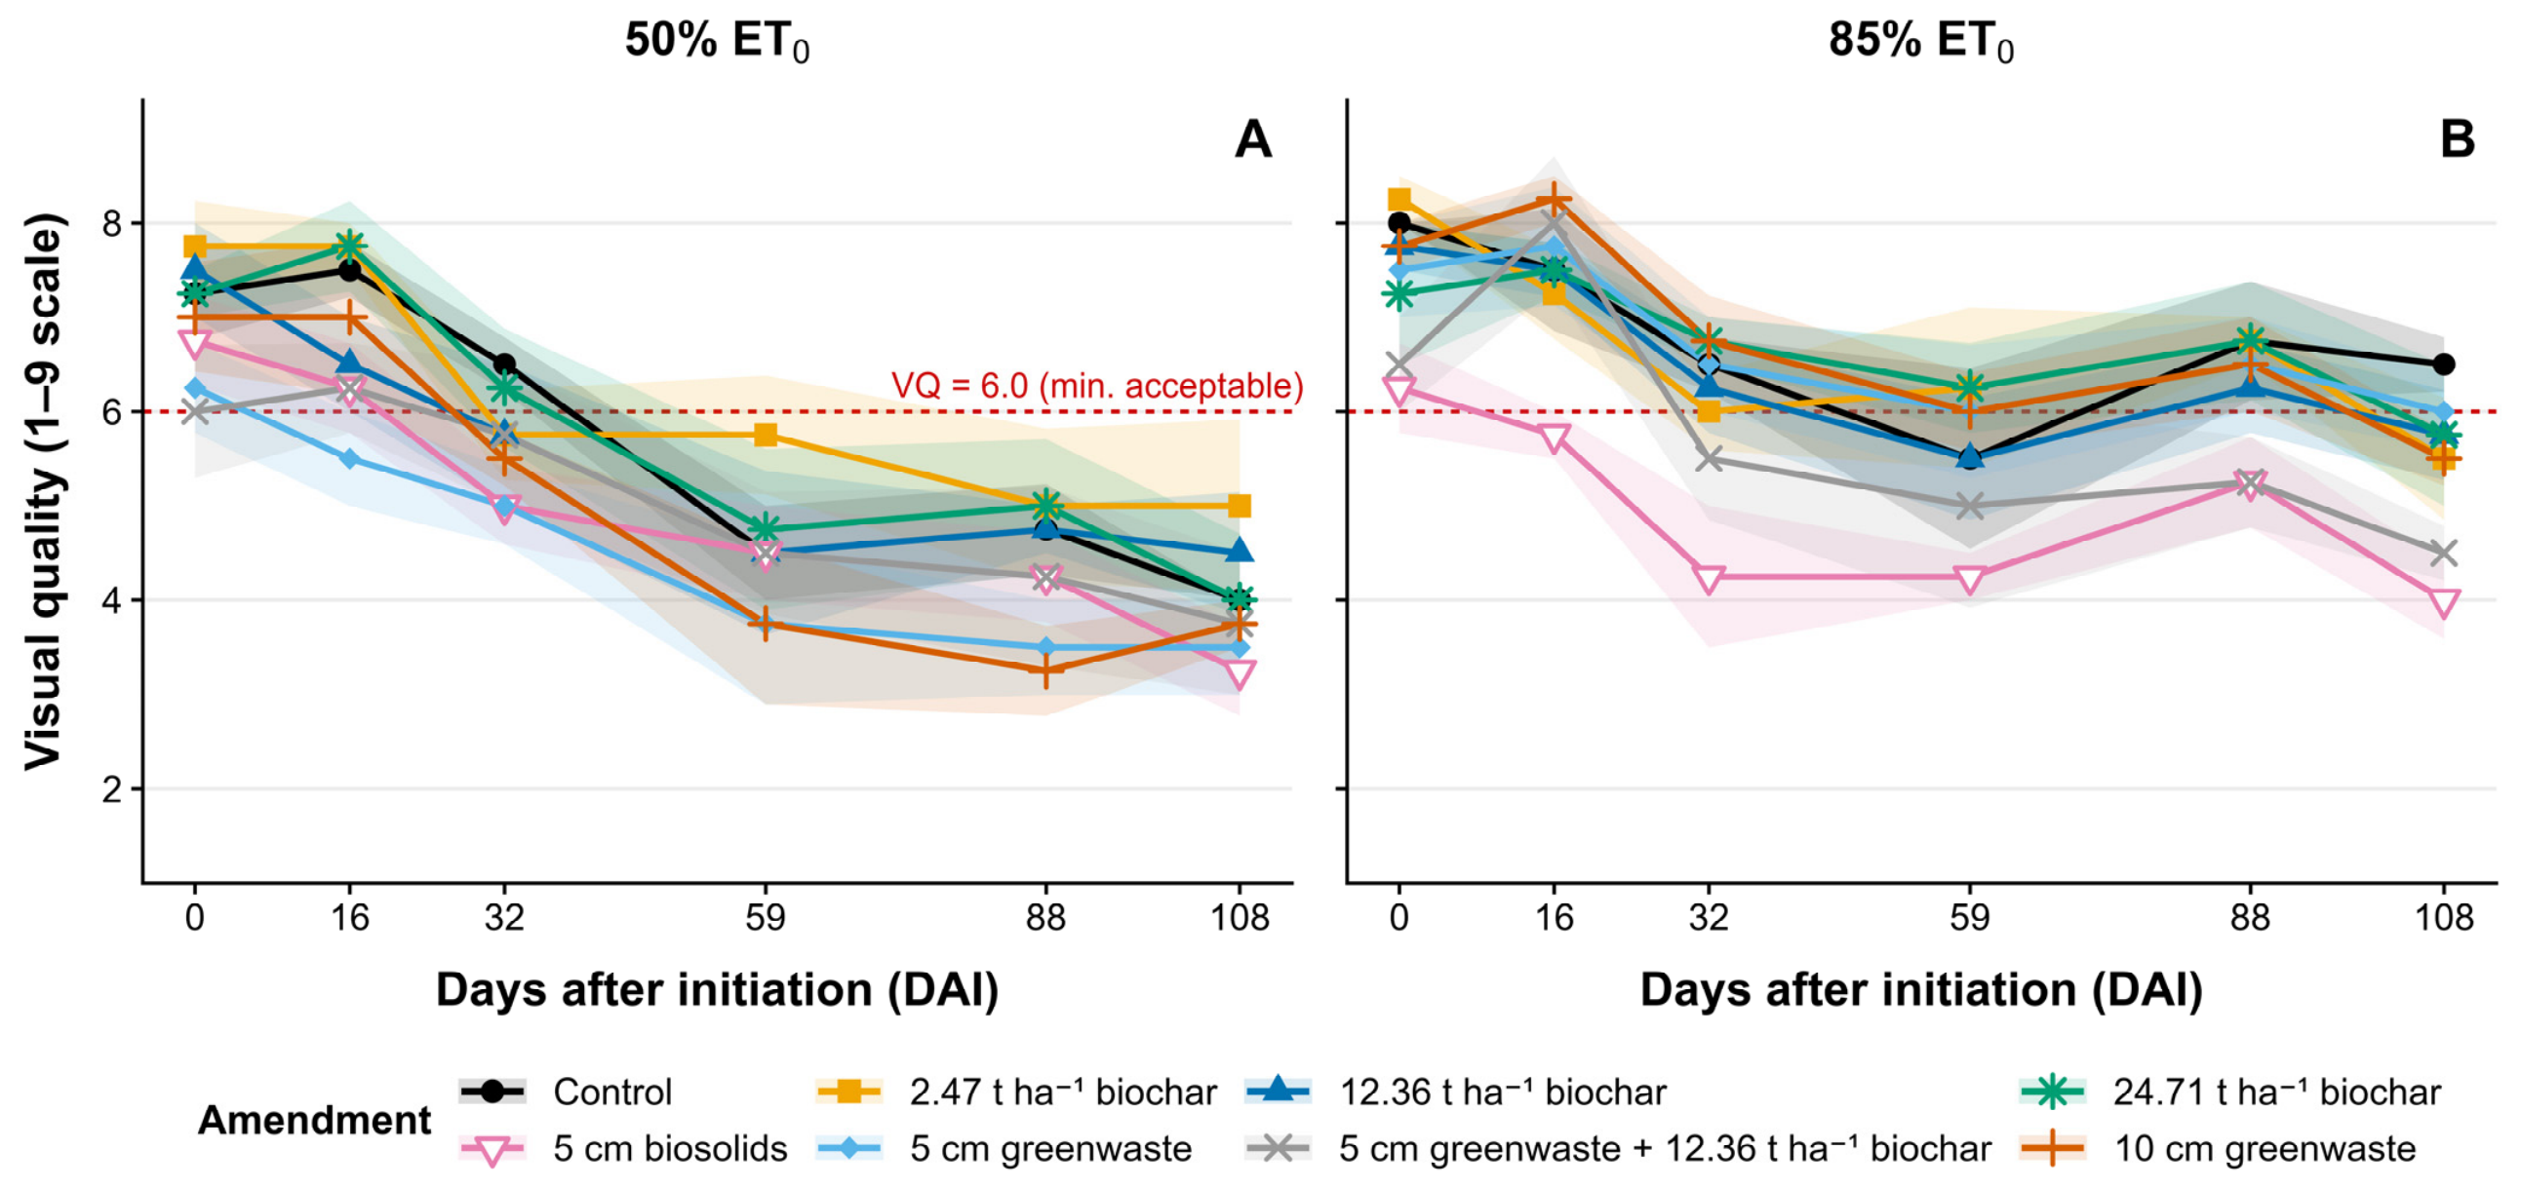
Visual quality (VQ) declined across all treatments as the season progressed, with the steepest reductions observed under the 50% ET0 deficit irrigation regime (Table S1). By 108 DAI, all treatments under 50% ET0 had fallen below the minimum acceptable threshold (VQ < 6.0). Although the 2.47 t ha−1 biochar treatment maintained the highest numerical VQ (5.00) at this date, no statistically significant differences were detected among soil amendments within the 50% ET0 regime, as all treatments were assigned to a single homogeneous group by the Scott–Knott clustering algorithm.
Under the 85% ET0 regime, significant separation among soil amendments persisted through the end of the season. At 108 DAI, the untreated control, all biochar treatments, 5 cm greenwaste, and 10 cm greenwaste were assigned to the same statistically homogeneous group. In contrast, the 5 cm biosolids and 5 cm greenwaste + 12.36 t ha−1 biochar treatments fell into a distinct, significantly lower group (Table S1). Notably, the 5 cm biosolids treatment fell below the minimum acceptable quality threshold (VQ = 6.0) from DAI 16 onward under 85% ET0, indicating persistent canopy impairment even under moderate irrigation.
Irrigation effects were treatment-dependent and emerged primarily in the latter half of the season, with significant 85% > 50% ET0 differences for the untreated control and the 5 cm and 10 cm greenwaste treatments at the later dates and for 12.36 t ha−1 biochar at DAI 88; the remaining treatments showed no significant irrigation difference at any date (Table S1, Figure 2).
Figure 2.
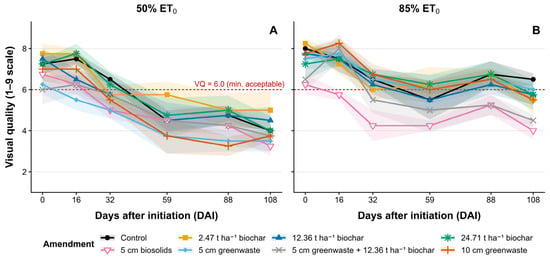
Temporal dynamics of visual quality (VQ) in tall fescue as influenced by soil amendment treatments under 50% ET0 (A) and 85% ET0 (B) irrigation regimes across the 108-day evaluation period. The dashed red line indicates the minimum acceptable quality threshold (VQ = 6.0). Shaded ribbons represent ±1 SE (n = 4 replicates). Date-by-date treatment groupings (Scott–Knott, p < 0.05) are reported in Table S1. Treatment symbols and colors are defined in the legend.
Regression analyses described the temporal decline within the 50% ET0 regime (Table S2). Most treatments declined linearly (adjusted R2 ≥ 0.76). The 12.36 t ha−1 biochar and 5 cm greenwaste treatments instead followed upward-opening quadratic models with late-season minima (Table S2), reflecting a rapid early decline and a mathematical upturn near the end of the season. This upturn should not be read as canopy recovery: the measured visual quality of both treatments remained below the acceptable threshold at the final evaluation (12.36 t ha−1 biochar, 4.50; 5 cm greenwaste, 3.50; Table S1), and the greenwaste minimum occurred only days before that evaluation, leaving no interval for measurable change. The 5 cm greenwaste treatment recorded the lowest minimum VQ under deficit irrigation, and the 10 cm greenwaste treatment declined linearly, comparable to the untreated control.
Under the 85% ET0 regime, no treatment exhibited a significant temporal trend. All treatments were best represented by intercept-only models (VQ = ȳ), indicating stable visual quality throughout the season when soil moisture was maintained at moderate irrigation levels.
Cumulative visual quality across the 108-day season, summarized as the area under the quality progress curve (AUPC), showed significant effects of irrigation regime (p = 0.018), soil amendment (p < 0.001), and their interaction (p = 0.024; Table 1). Because the interaction was significant, amendments were grouped separately within each regime. Under 50% ET0, the untreated control and the three biochar rates made up the higher group (575–643), while the two greenwaste treatments, the greenwaste + biochar blend, and biosolids made up the lower group (471–539). Under 85% ET0, all treatments shared a single higher group (681–721) apart from the blend (612) and biosolids (521), which again grouped lower. Within individual amendments, AUPC was significantly higher under 85% than under 50% ET0 for the control, the 12.36 and 24.71 t ha−1 biochar rates, and both greenwaste treatments, while the 2.47 t ha−1 biochar, biosolids, and greenwaste + biochar blend treatments showed no significant difference between regimes (Table 1).
Table 1.
Area under the progress curve (AUPC) of tall fescue visual quality as influenced by soil amendment and irrigation regime across the 108-day evaluation period (DAI 0–108).
3.1.2. Normalized Difference Vegetation Index (NDVI)
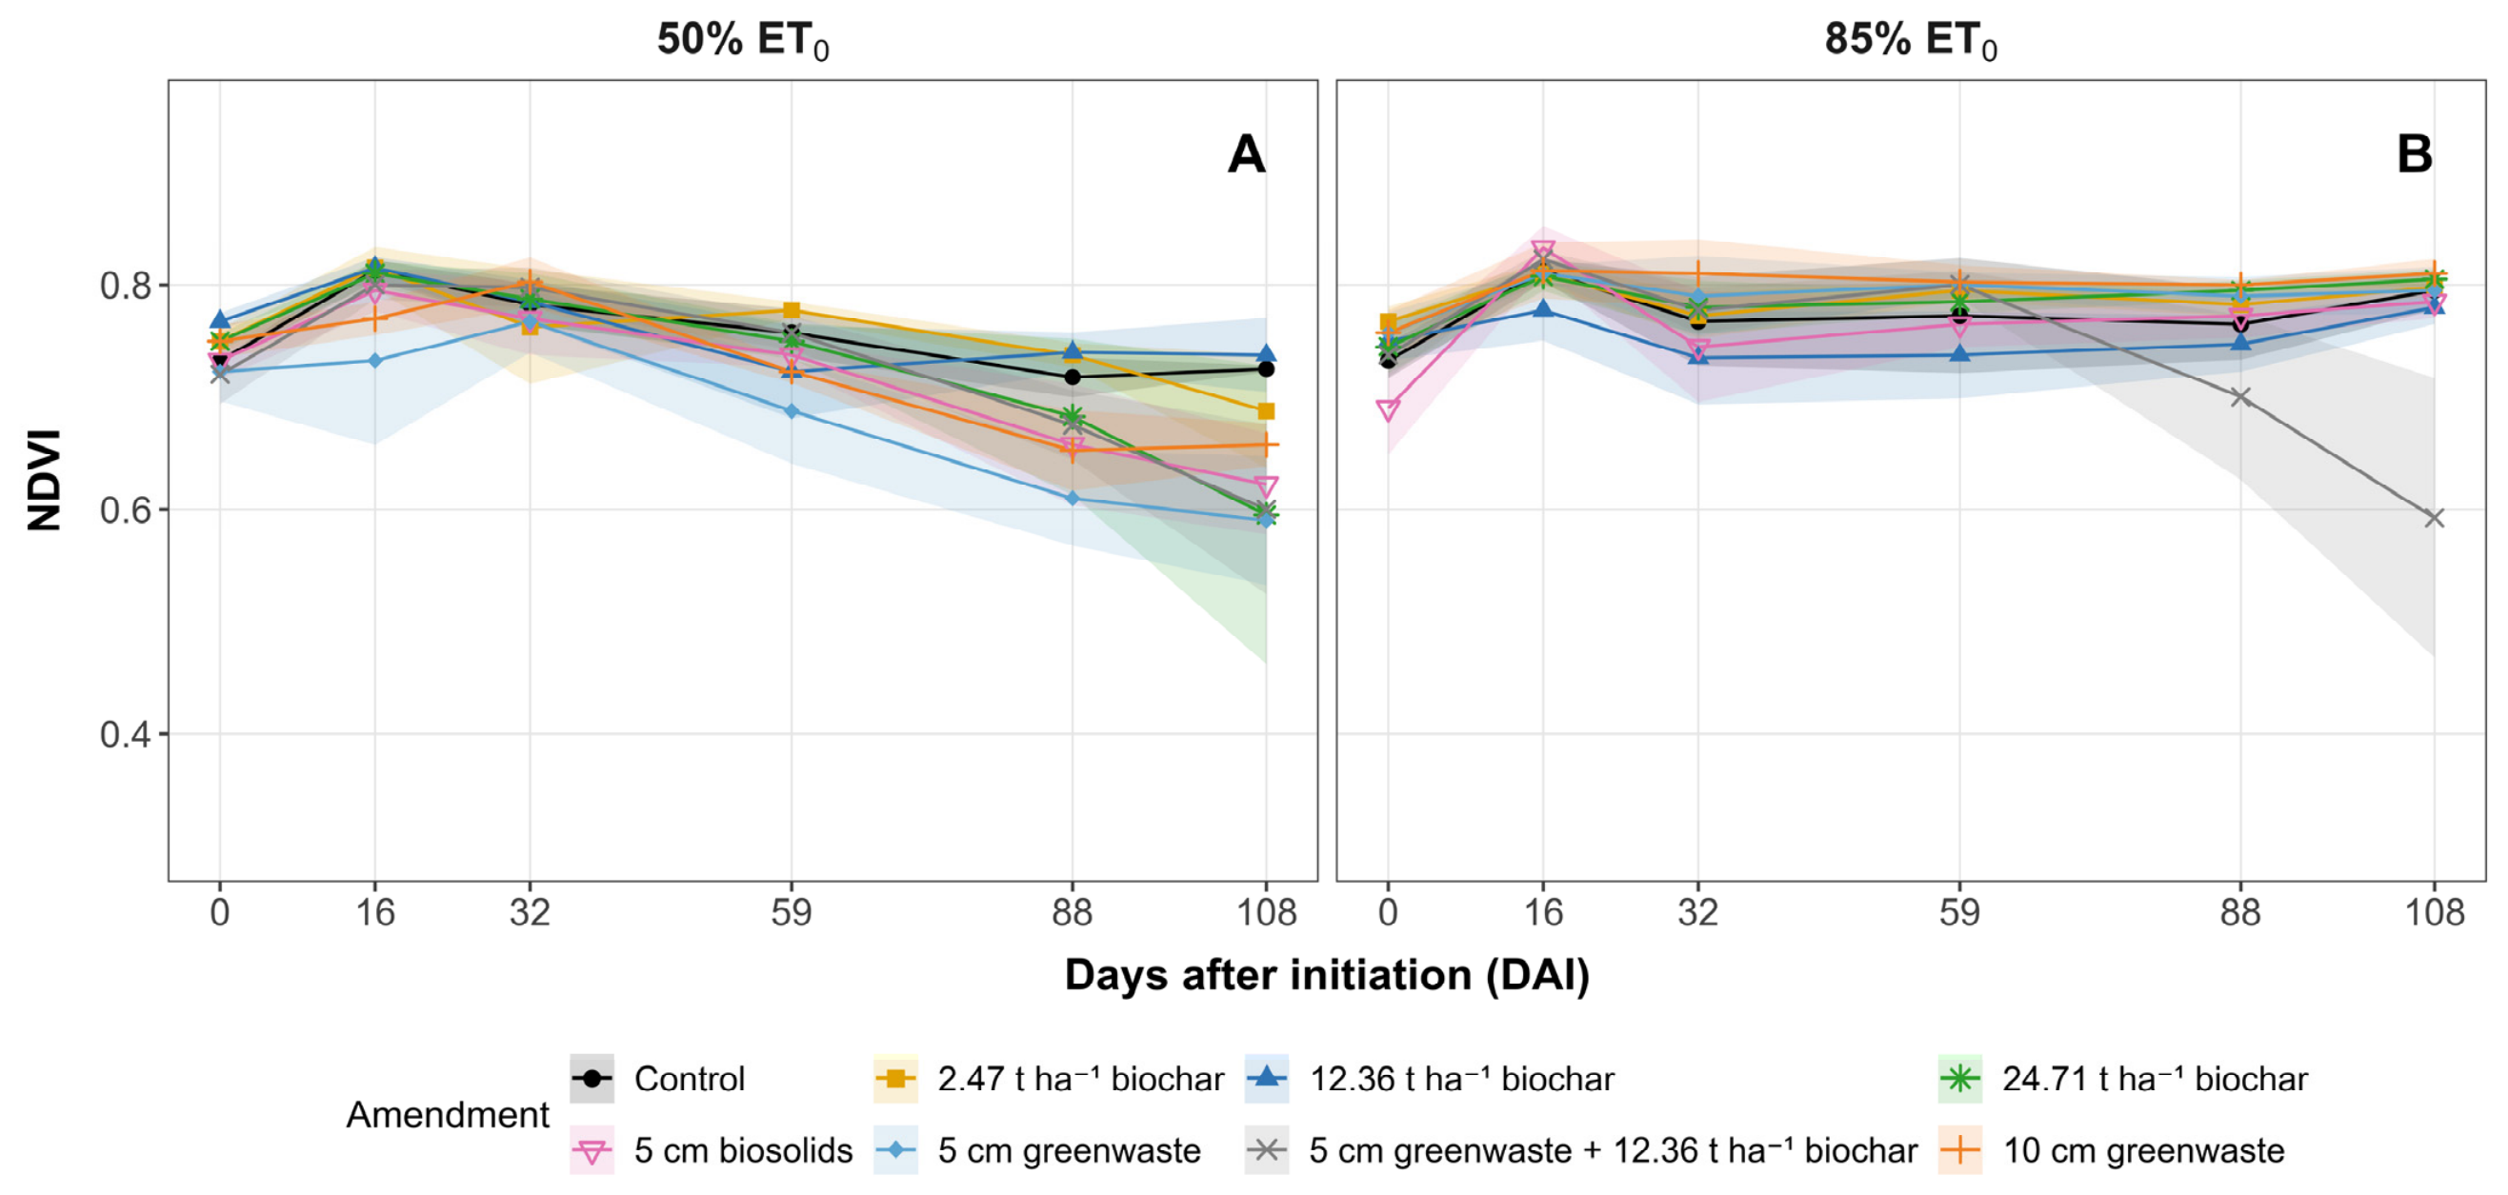
NDVI values were uniform early in the season, with no significant differences among amendment treatments or irrigation regimes through 32 DAI (Table S3, Figure 3). An early-season increase in NDVI was observed across all treatments between 0 and 16 DAI.
Figure 3.
Temporal dynamics of the normalized difference vegetation index (NDVI) in tall fescue in response to soil amendment treatments under 50% ET0 (A) and 85% ET0 (B) irrigation regimes across the 108-day evaluation period. Shaded ribbons represent ±1 SE (n = 4 replicates). Date-by-date treatment groupings (Scott–Knott, p < 0.05) are reported in Table S3. Treatment symbols and colors are defined in the legend.
Significant irrigation effects emerged from mid-season onward, first at 59 DAI (10 cm greenwaste) and, by the final evaluation, for the untreated control, 5 cm biosolids, and the 5 cm and 10 cm greenwaste treatments; NDVI was higher under 85% than 50% ET0 in every case except the greenwaste + biochar blend, whose slightly higher value under deficit irrigation was not statistically significant (Table S3).
Significant separation among amendment treatments within a given irrigation regime occurred only at 108 DAI. Under 50% ET0, the untreated control, 2.47 t ha−1 biochar, and 12.36 t ha−1 biochar maintained the highest NDVI values (0.69–0.74) and were assigned to a single homogeneous group by the Scott–Knott algorithm. All remaining treatments, including the 24.71 t ha−1 biochar, were assigned to a distinct lower-performing group, indicating that the highest biochar rate underperformed relative to lower rates and the control under sustained deficit stress. Under 85% ET0 at 108 DAI, the 5 cm greenwaste + 12.36 t ha−1 biochar blend exhibited the lowest NDVI (0.59) and was classified in a distinct inferior group, while all other treatments remained in the same homogeneous group.
Regression analyses showed no significant temporal trend for most treatments under either regime (Table S4). Downward-opening quadratic responses occurred for the 24.71 t ha−1 biochar treatment under 50% ET0 and the greenwaste + biochar blend under both regimes, with predicted maxima between 30 and 41 DAI (Table S4), indicating early-season canopy gains followed by progressive late-season decline.
3.1.3. Percentage of Green Cover (PGC) Dynamics
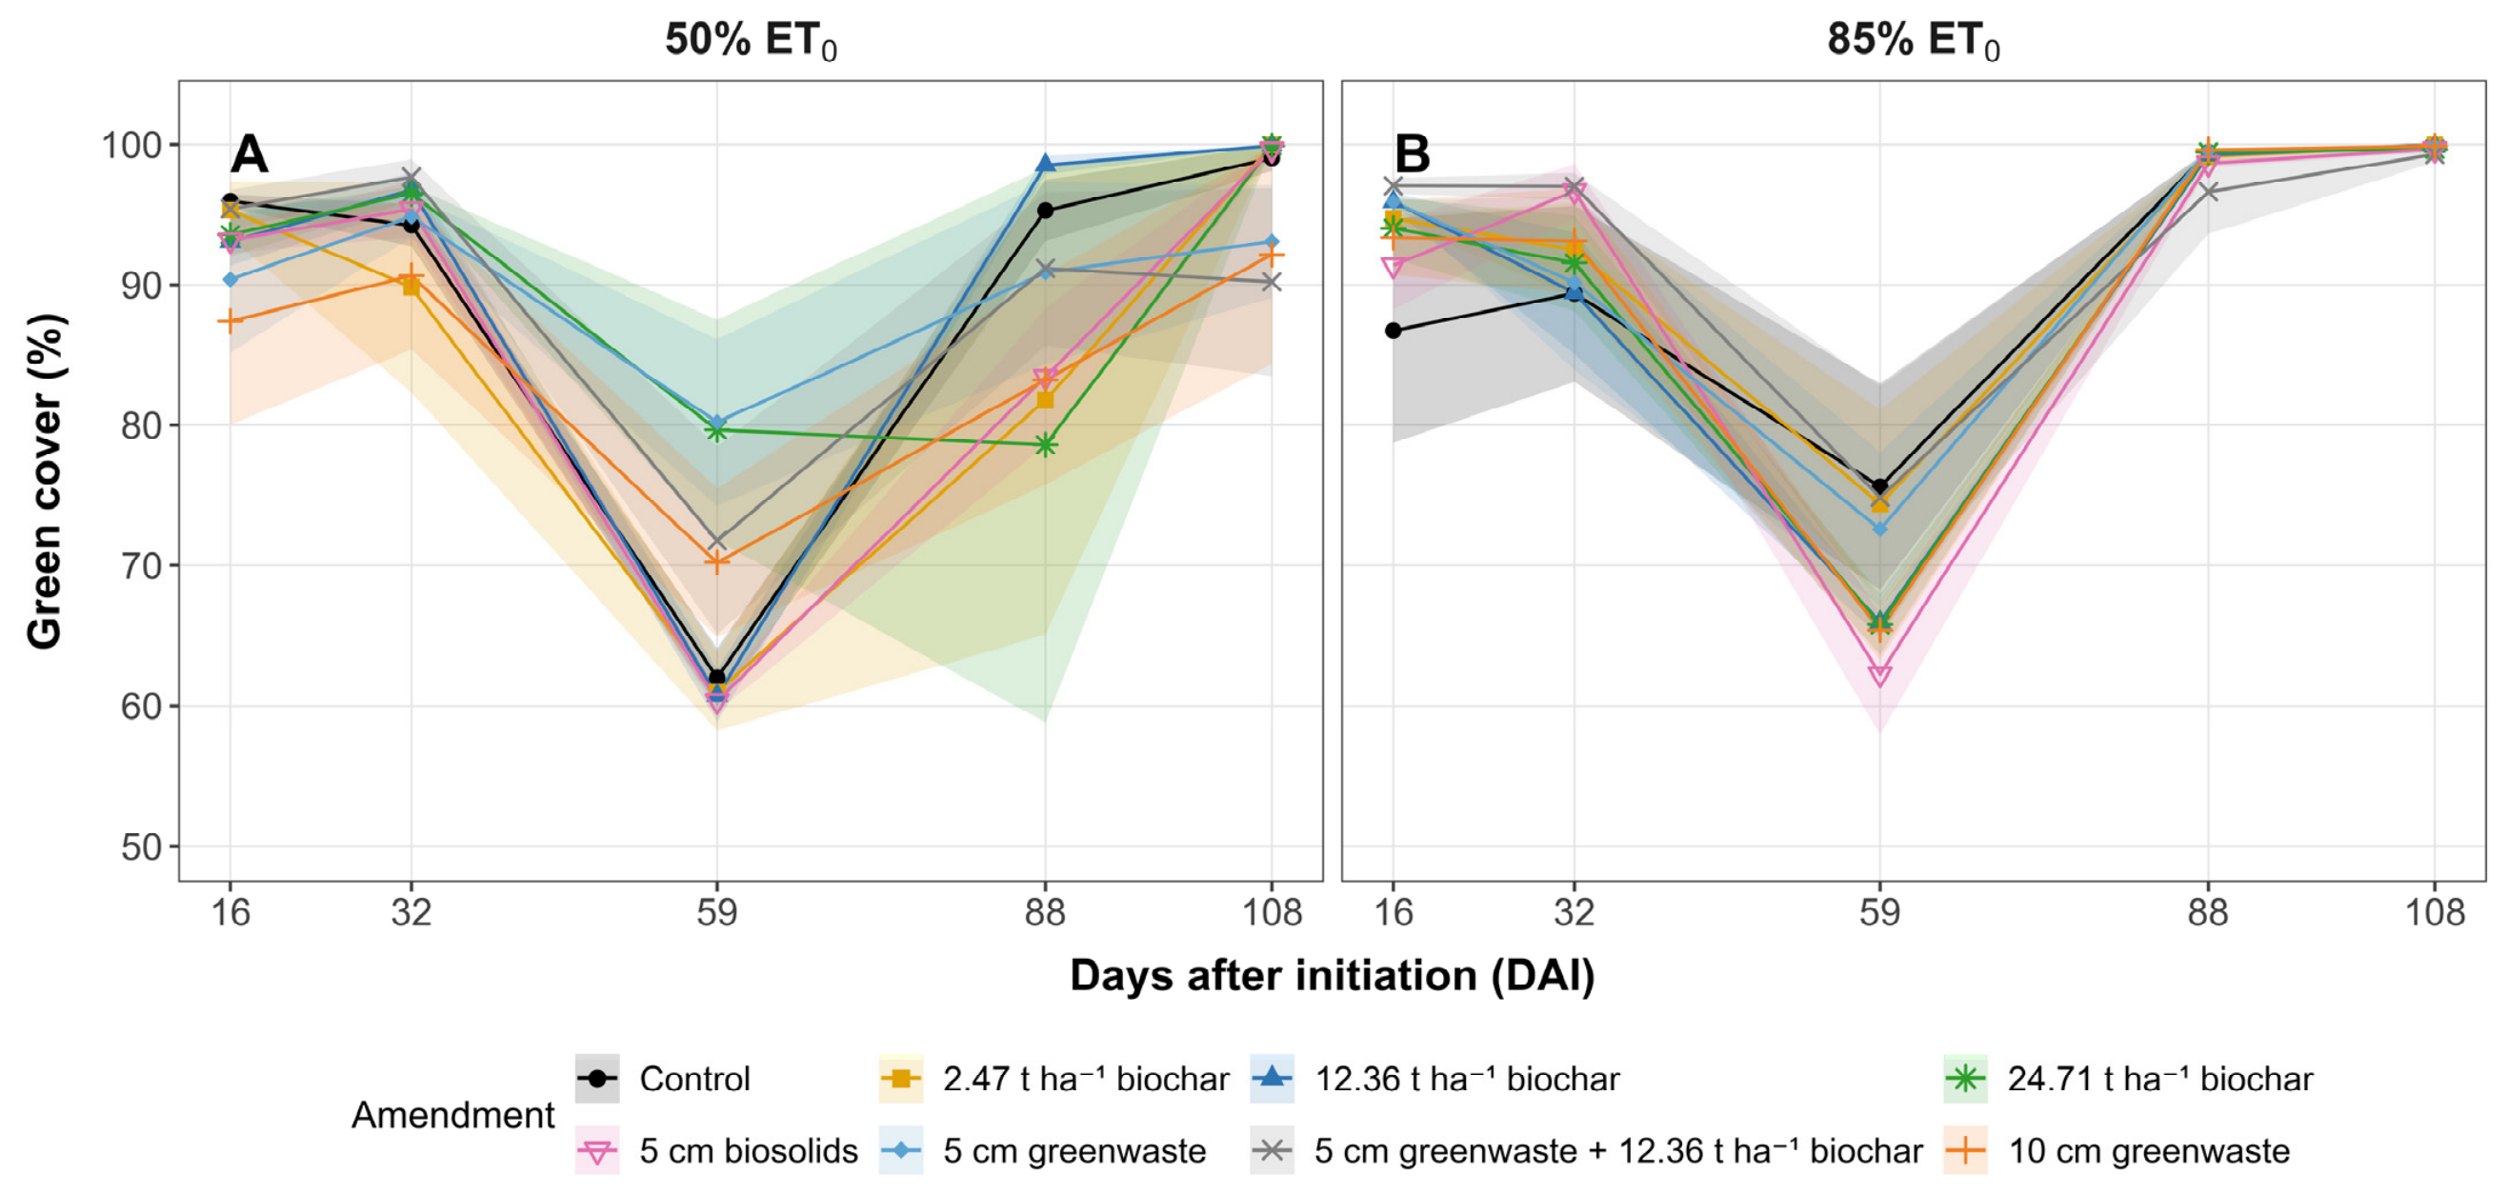
Percentage green cover remained high during the early season, with all treatments exceeding 86% at 16 and 32 DAI across both irrigation regimes (Table S5, Figure 4). During this period, no significant differences among soil amendment treatments were detected within either irrigation regime.
Figure 4.
Temporal dynamics of percent green cover (PGC) in tall fescue in response to soil amendment treatments under 50% ET0 (A) and 85% ET0 (B) irrigation regimes from 16 to 108 days after initiation (DAI). Shaded ribbons represent ±1 SE (n = 4 replicates). Date-by-date treatment groupings (Scott–Knott, p < 0.05) are reported in Table S5. Treatment symbols and colors are defined in the legend.
Significant treatment effects first emerged at 59 DAI under the 50% ET0 regime. The 24.71 t ha−1 biochar, 5 cm greenwaste, 5 cm greenwaste + 12.36 t ha−1 biochar, and 10 cm greenwaste treatments maintained significantly higher PGC (70.21–80.21%) and were assigned to a single homogeneous group. Conversely, the untreated control, 2.47 t ha−1 biochar, 12.36 t ha−1 biochar, and 5 cm biosolids exhibited lower PGC (60.36–62.03%) and were assigned to a distinct inferior group. No significant differences among amendment treatments were observed under the 85% ET0 regime at this date.
By 88 DAI, the grouping hierarchy under 50% ET0 shifted. The untreated control, 12.36 t ha−1 biochar, 5 cm greenwaste, and 5 cm greenwaste + 12.36 t ha−1 biochar formed the superior group, while the 2.47 t ha−1 biochar, 24.71 t ha−1 biochar, 5 cm biosolids, and 10 cm greenwaste were assigned to the inferior group. Notably, the 24.71 t ha−1 biochar treatment was reclassified from the superior to the inferior group between 59 and 88 DAI, indicating a mid-season decline in canopy coverage relative to other treatments. Under 85% ET0, PGC remained uniformly high (96.65–99.62%) with no significant differences among amendment treatments.
At the final evaluation (108 DAI), PGC returned to high levels across all treatments under both irrigation regimes. No significant differences were detected among amendment treatments within either regime, with values ranging from 90.21% to 99.95% under 50% ET0 and remaining ≥99% under 85% ET0. Due to the mid-season decline and late-season recovery pattern, PGC did not exhibit consistent temporal trajectories amenable to regression modeling, and no significant regression fits were obtained for this variable. Notably, a severe directional divergence developed during the late season (88–108 DAI) under the 50% ET0 regime; while automated canopy metrics recorded near-total green coverage (≥90.21%; Table S5), concurrent subjective visual quality evaluations dropped to their lowest recorded values of the season, falling into a failing range of 3.25–5.00 (Table S1).
3.1.4. Dark Green Color Index (DGCI)
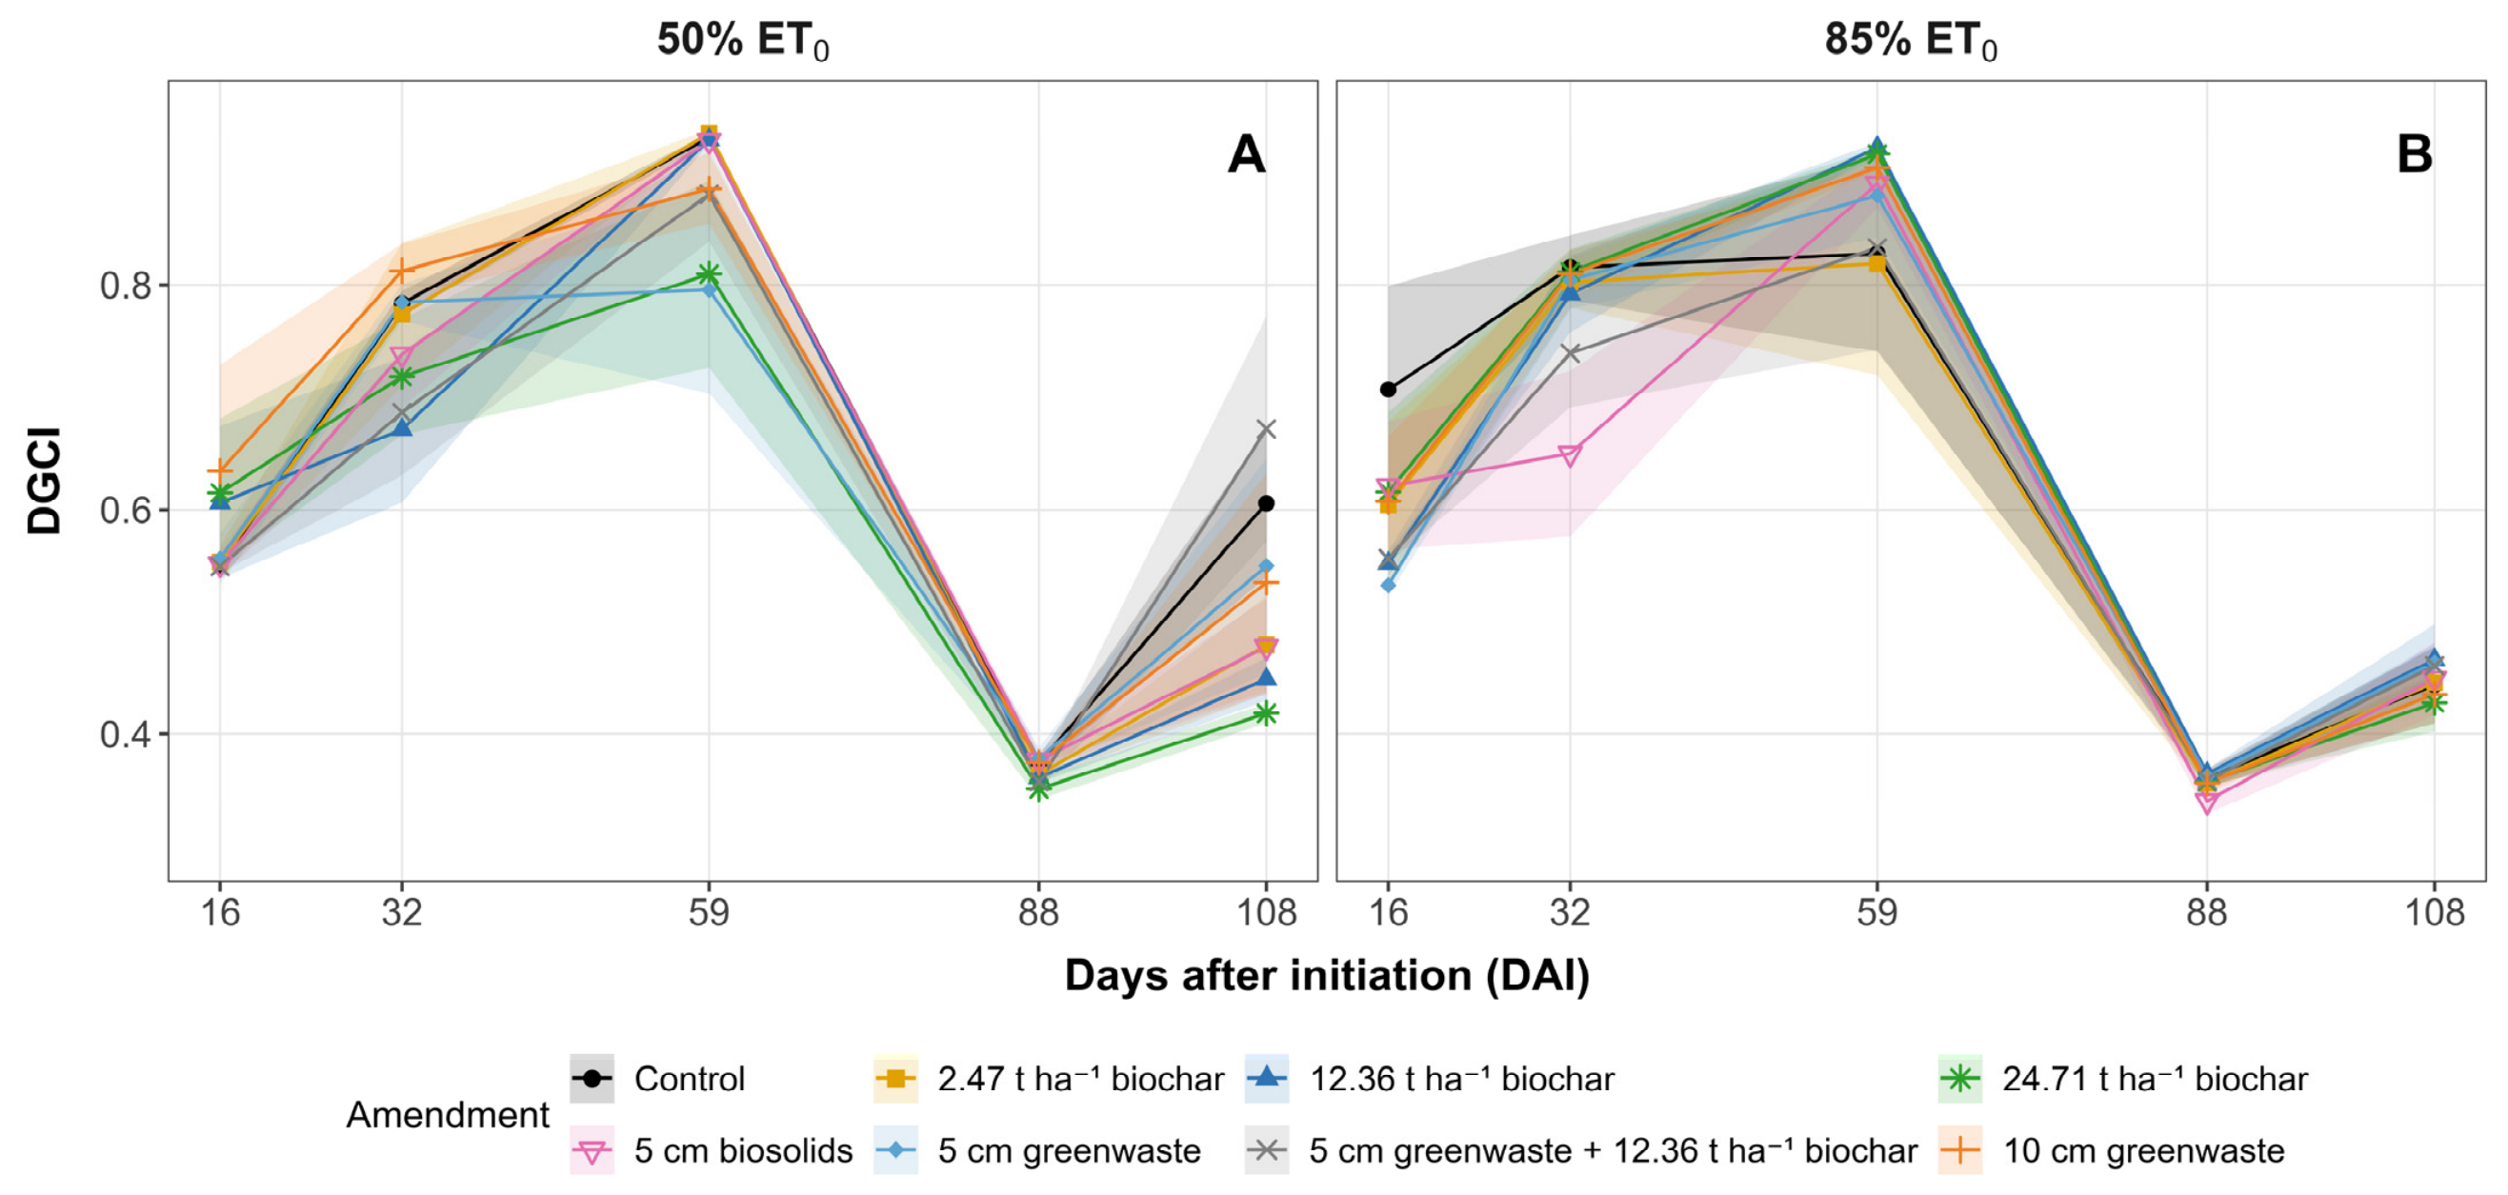
DGCI was uniform early and then tracked the canopy decline (Table S6, Figure 5). The 5 cm biosolids treatment separated downward first (significantly lower under 85% ET0 by 32 DAI), and a seasonal maximum at 59 DAI placed the 24.71 t ha−1 biochar and 5 cm greenwaste treatments in a lower group under deficit. DGCI then collapsed sharply by 88 DAI, converging to a narrow range (0.34–0.38) with no treatment differences, before diverging again at the final evaluation: under 50% ET0, the untreated control and greenwaste treatments held higher DGCI, while the biochar and biosolids treatments grouped lower, whereas under 85% ET0, values remained uniformly low. Because of this mid-season collapse and partial late-season divergence, DGCI was not amenable to regression modeling.
Figure 5.
Temporal dynamics of the dark green color index (DGCI) in tall fescue in response to soil amendment treatments under 50% ET0 (A) and 85% ET0 (B) irrigation regimes from 16 to 108 days after initiation (DAI). Shaded ribbons represent ±1 SE (n = 4 replicates). Date-by-date treatment groupings (Scott–Knott, p < 0.05) are reported in Table S6. Treatment symbols and colors are defined in the legend.
3.2. Soil Hydrological Dynamics (θv)
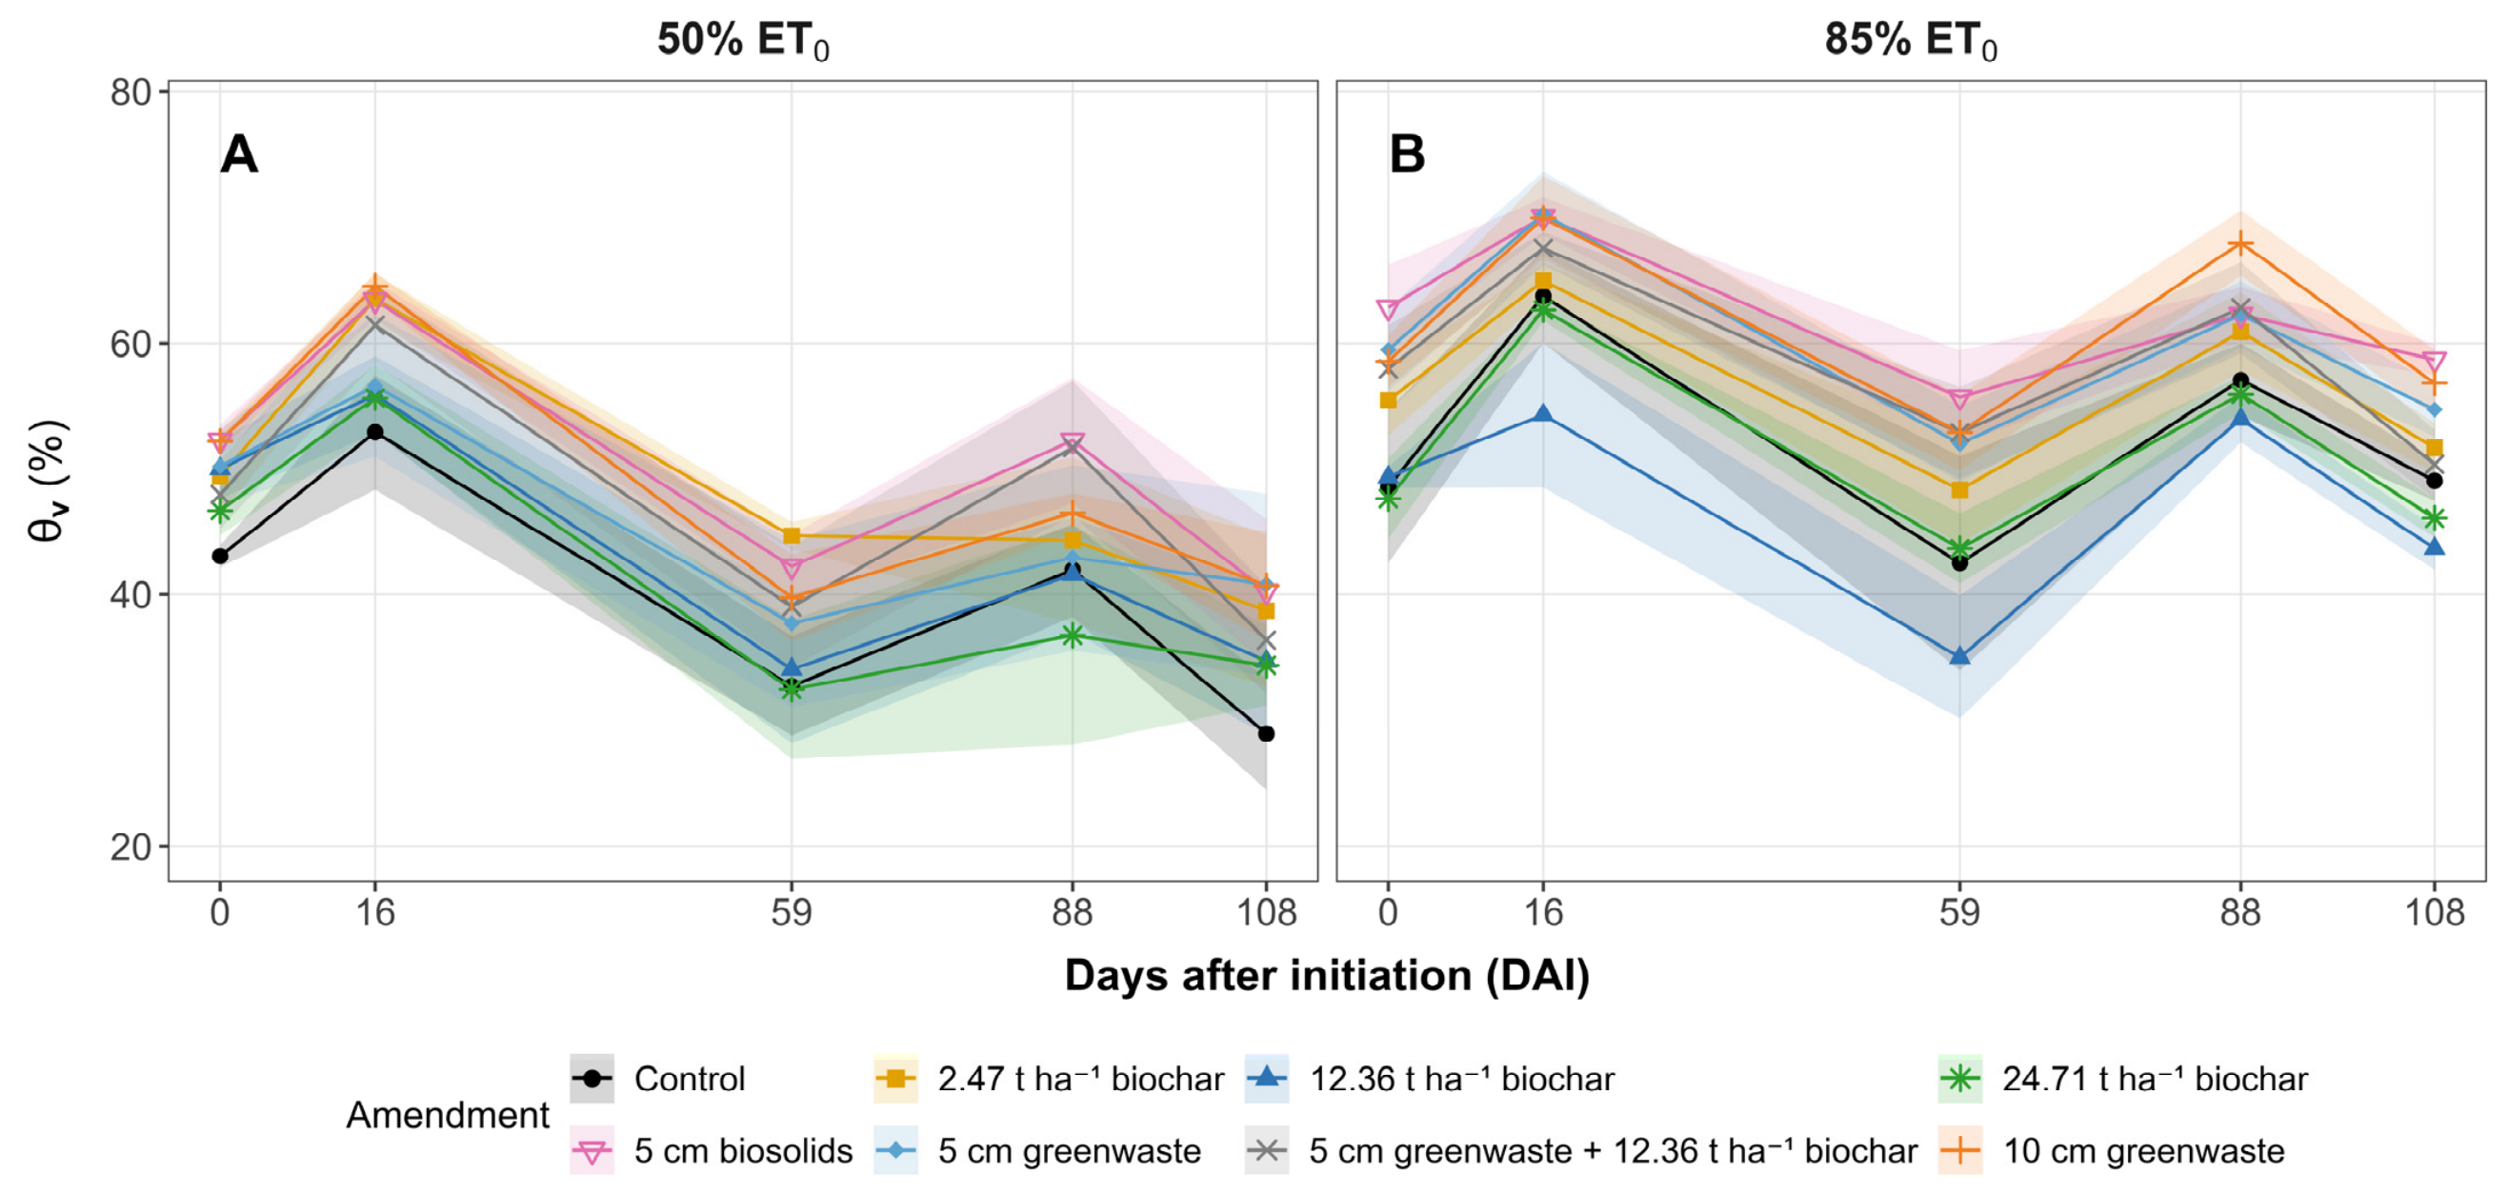
Volumetric water content (θv) represents the total water held in the soil profile; the plant-available fraction is reported in the soil-water-retention and plant-available water analyses below. θᵥ was high early in the season, peaking near 16 DAI (up to 64.50% under 50% ET0 and 70.28% under 85% ET0), then declined through the season (Table S7, Figure 6). Composted amendments generally retained higher θᵥ than the untreated control, while biochar responses were variable. Under 50% ET0, the treatment differences that emerged by 88 DAI (biosolids and 10 cm greenwaste retaining the most moisture) had collapsed by the final evaluation, when θᵥ reached a seasonal minimum (28.93–40.80%) with no significant treatment differences among amendments. Under 85% ET0, the 5 cm biosolids, 5 cm greenwaste, and 10 cm greenwaste treatments retained significantly higher θᵥ than the control and biochar treatments through the end of the season. θᵥ did not follow a consistent temporal pattern amenable to regression modeling.
Figure 6.
Temporal dynamics of soil volumetric water content (θᵥ) under tall fescue in response to soil amendment treatments under 50% ET0 (A) and 85% ET0 (B) irrigation regimes at 0, 16, 59, 88, and 108 days after initiation (DAI). Shaded ribbons represent ±1 SE (n = 4 replicates). Date-by-date treatment groupings (Scott–Knott, p < 0.05) are reported in Table S7. Treatment symbols and colors are defined in the legend.
3.3. Soil Water Retention Curves and Van Genuchten Parameters
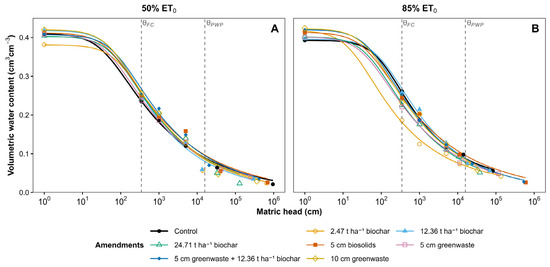
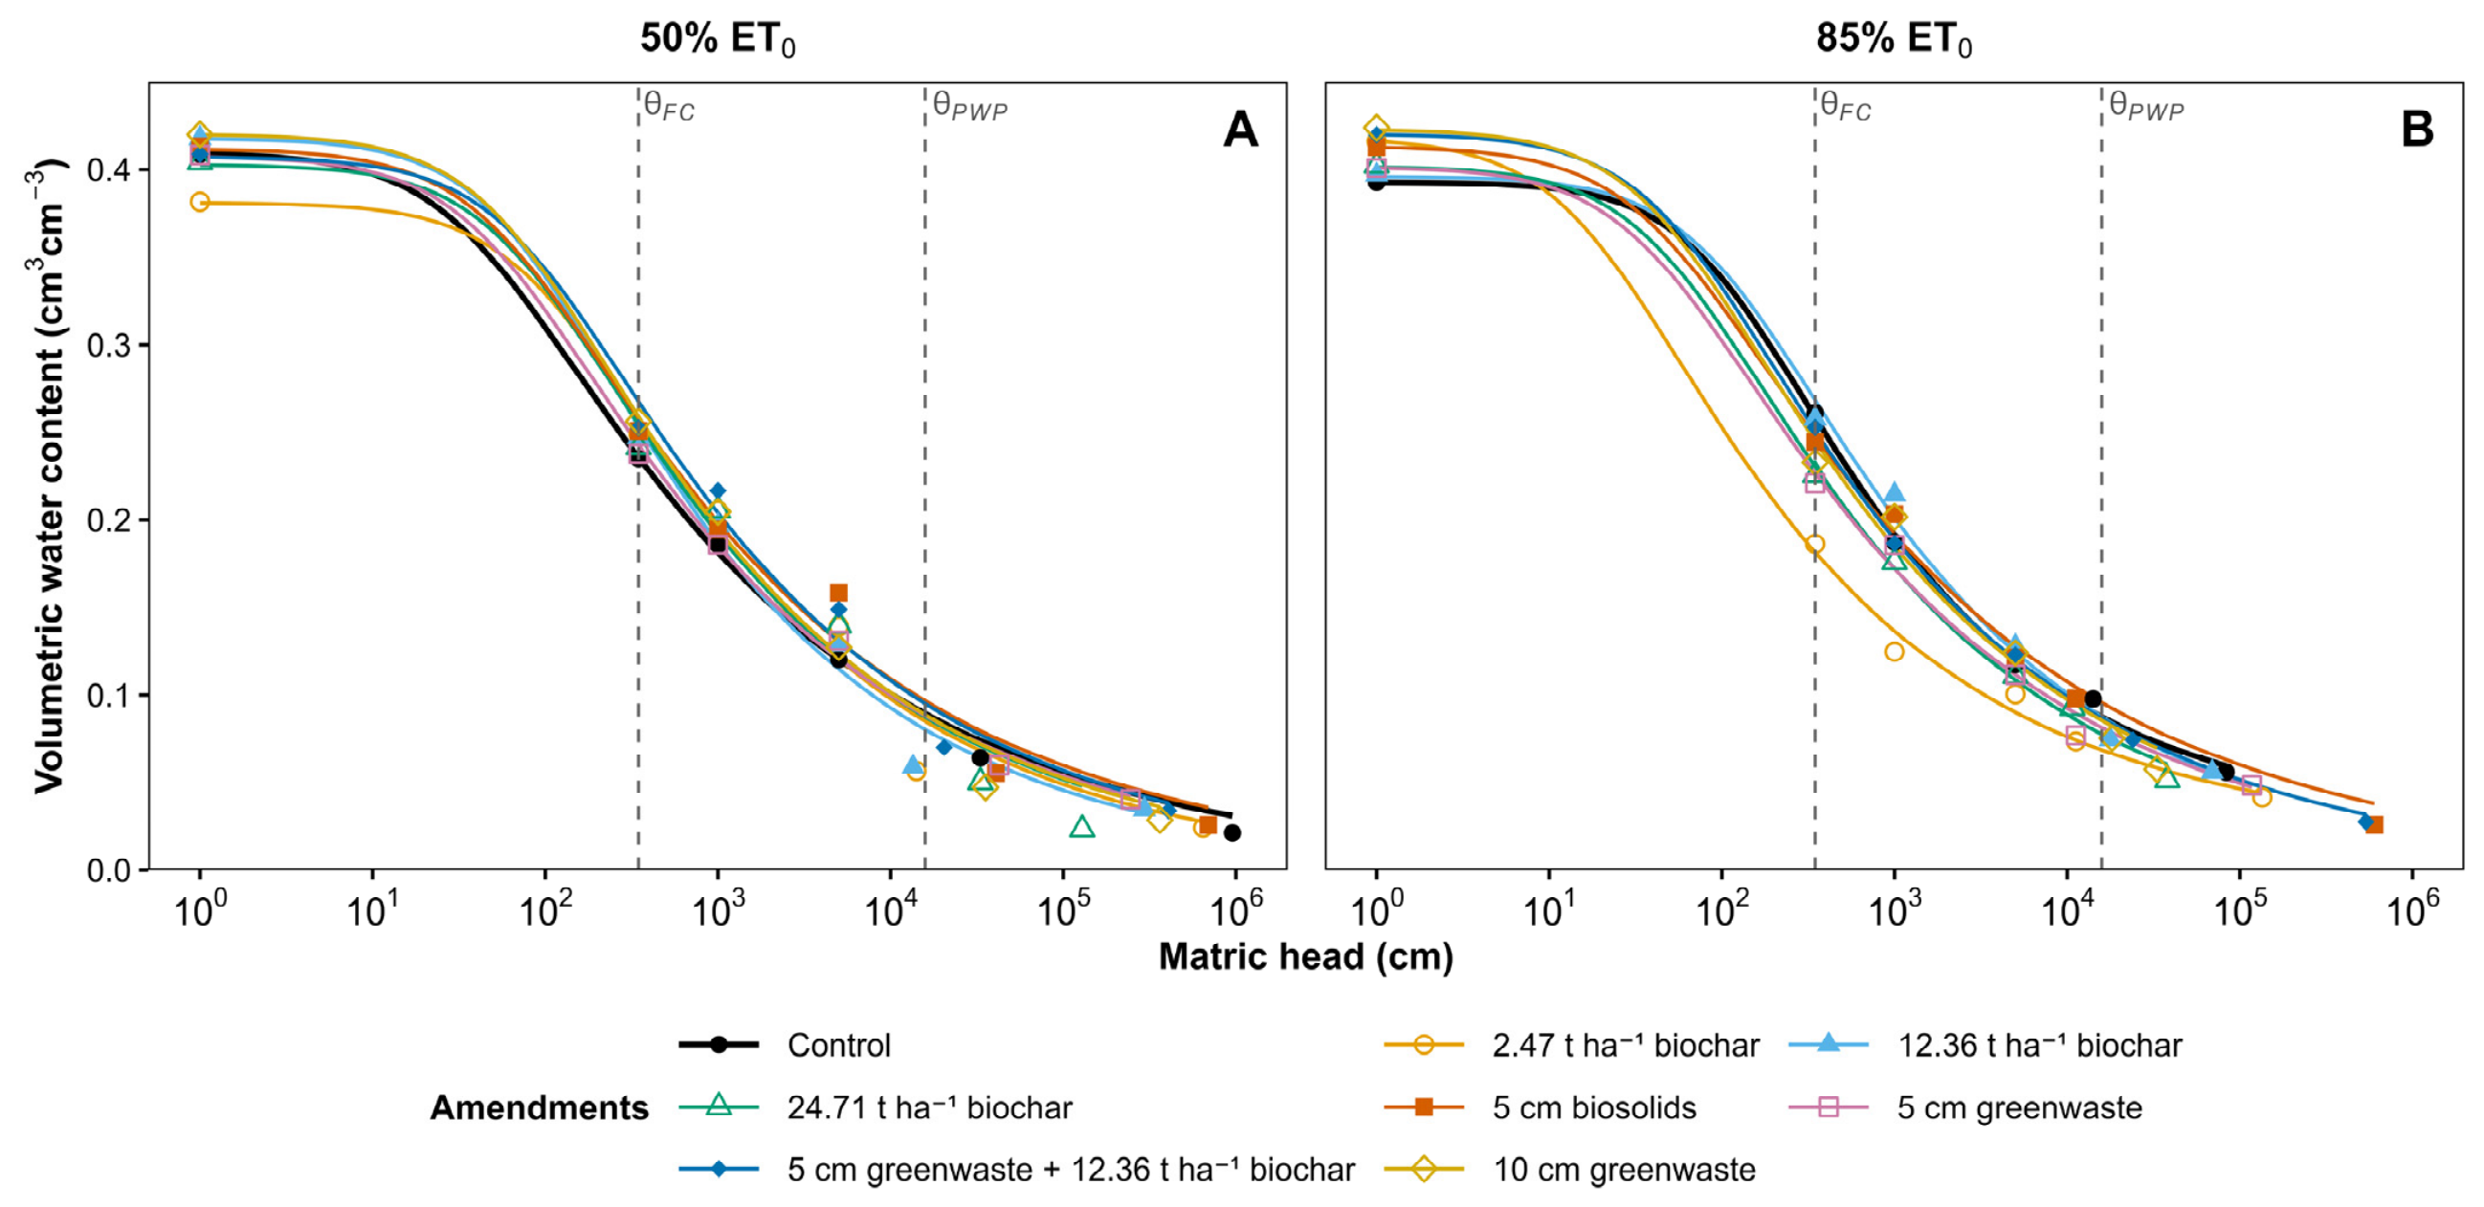
Soil water retention curves and van Genuchten fitting parameters differed among treatments and irrigation regimes (Figure 7; Table 2). Each curve was fitted to the mean retention points of the corresponding treatment × irrigation combination, so the van Genuchten parameters and the derived water contents are descriptive and were not statistically compared among treatments (Section 2.4.3). Across all fitted curves, the shape parameters spanned α = 0.0088–0.0522 cm−1 and n = 1.25–1.36, reflecting treatment-specific differences in air-entry behavior and pore-size distribution. Model fit was high across all treatments (R2 = 0.9818–0.9996; RMSE = 0.0026–0.0169 cm3 cm−3).
Figure 7.
Soil water retention curves for the eight soil-amendment treatments under 50% ET0 (A) and 85% ET0 (B) regime irrigation. Symbols show measured retention points, and lines show van Genuchten fits (Table 2). The x-axis is matric suction (cm, log scale), and the y-axis is volumetric water content (θ, cm3 cm−3). Vertical dashed lines mark the suctions used to define field capacity (θFC, h = 346.7 cm) and permanent wilting point (θPWP, h = 15,849 cm). Treatment symbols and colors are defined in the legend.
Table 2.
Van Genuchten model parameters and performance metrics for soil water retention curves.
Under 50% ET0, biochar-amended soils exhibited θs values of 0.3808–0.4178 cm3 cm−3, similar to the untreated control (θs = 0.4097 cm3 cm−3), while compost-based amendments generally increased θv relative to the control across the 300–5000 cm suction range, indicating greater water retention within the capillary domain under chronic moisture stress. Under 85% ET0, amendments increased θs but exhibited more rapid desorption at intermediate suctions compared to the control. Residual water content (θr) was zero for most treatments under 50% ET0, whereas the untreated control and 2.47 t ha−1 biochar under 85% ET0 exhibited non-zero θr values (0.0247 and 0.0174 cm3 cm−3, respectively), indicating greater modeled retention at suctions beyond the measured range.
3.4. Plant-Available Water (PAW)
Under 50% ET0, the 12.36 t ha−1 biochar (0.1729 cm3 cm−3), 5 cm greenwaste + 12.36 t ha−1 biochar (0.1723 cm3 cm−3), and 2.47 t ha−1 biochar (0.1718 cm3 cm−3) treatments produced the highest PAW values, indicating the greatest water retention within the plant-extractable range under chronic deficit conditions (Table 3). The 5 cm biosolids treatment exhibited the highest θPWP among all treatments under this regime (0.0968 cm3 cm−3), which constrained its PAW (0.1612 cm3 cm−3) relative to the biochar-amended treatments. The untreated control produced the lowest PAW (0.1462 cm3 cm−3), associated with the lowest θFC in the regime (0.2356 cm3 cm−3).
Table 3.
Predicted volumetric water content at field capacity (θFC) and permanent wilting point (θPWP), and resulting plant available water (PAW = θFC − θPWP), all in cm3 cm−3. Values are van Genuchten predictions at h = 346.7 cm (pF 2.5) and h = 15,849 cm (pF 4.2); both suctions lie within the measured retention range (Section 2.4.3).
Under 85% ET0, the 12.36 t ha−1 biochar treatment again achieved the highest PAW (0.1805 cm3 cm−3). In contrast, the 2.47 t ha−1 biochar treatment exhibited the lowest PAW under moderate irrigation (0.1129 cm3 cm−3), a consequence of a markedly reduced θFC (0.1816 cm3 cm−3) relative to all other treatments, indicating a rapid moisture desorption profile under this regime. The 5 cm biosolids treatment maintained the highest θPWP under 85% ET0 (0.0958 cm3 cm−3), limiting its PAW (0.1518 cm3 cm−3) despite a θFC (0.2476 cm3 cm−3) comparable to other treatments.
4. Discussion
4.1. Amendment Efficacy and Performance Reversals
The statistical convergence between the 10 cm greenwaste treatment and the untreated control by the end of the 108-day mature-stand evaluation represents a clear departure from the post-establishment phase advantages reported in the companion study [15]. High-rate organic topdressing initially improved moisture retention and canopy performance, yet these benefits were not sustained into the second year. The trajectory is consistent with the mineralization of labile organic fractions over two growing seasons of biological activity [10]. As the labile organic fraction was consumed, the enhanced soil water-holding capacity observed during the post-establishment phase declined, a change consistent with a reduced contribution of organic matter to the soil matrix, although organic-matter content was not measured in this second-year evaluation.
The most revealing expression of this process was the hydraulic behavior of the 10 cm greenwaste treatment under 85% ET0. Despite carrying the highest saturated water content in the regime (θs = 0.4230 cm3 cm−3), this treatment yielded a θFC of only 0.2452 cm3 cm−3 and a PAW of 0.1596 cm3 cm−3, below both the untreated control (PAW = 0.1710 cm3 cm−3) and the 12.36 t ha−1 biochar treatment (PAW = 0.1805 cm3 cm−3). The divergence between high bulk storage and comparatively low plant-extractable water is consistent with the release of fine particulate material as organic fractions decompose under sustained wet conditions: as such material redistributes within the pore network, water previously held in the extractable capillary range is lost to pores that drain at suctions below field capacity. This functional response is consistent with the reduction in macroporosity reported to follow organic-matter decomposition in field-amended soils [34], and points to a loss of the amendment’s structural contribution, rather than increased matric suction, as the limiting factor, although the relevant pore and structural properties were not measured in this study. Under 50% ET0, the PAW of the 10 cm greenwaste treatment (0.1700 cm3 cm−3) exceeded the untreated control (0.1462 cm3 cm−3) and the 24.71 t ha−1 biochar rate (0.1668 cm3 cm−3), but remained below the 2.47 and 12.36 t ha−1 rates (0.1718 and 0.1729 cm3 cm−3, respectively), yet the severity of the moisture deficit ultimately overwhelmed any hydraulic distinction.
The persistently poor performance of the 5 cm biosolids treatment is difficult to explain in hydraulic terms alone. It failed to reach the minimum acceptable canopy quality at any point under 85% ET0, a regime in which soil moisture was not limiting, so adequate irrigation by itself did not restore it. Soil chemical properties were not measured in this study, so any chemical interpretation remains tentative; even so, the response is consistent with the osmotic and phytotoxic effects documented for high-salt biosolids and compost amendments, whose soluble-salt loads can impair plant growth at elevated electrical conductivity [35]. The biosolids compost applied here carried an EC of 20 dS m−1 (Section 2.2), among the highest of the materials evaluated. Turfgrass is sensitive to salinity and related soil chemical imbalances, under which canopy quality can be suppressed independently of water availability [36]. The pattern suggests that non-hydraulic constraints may have contributed, but additional soil chemical measurements are needed.
The biochar treatments revealed a third, and in some respects the clearest, pattern. Their stable pore architecture resists microbial decomposition and preserves hydraulic function across seasons, precisely the property that matters when the question is whether amendment benefits will still be present in a mature stand [37]. But the relationship between application rate and plant-available water was not monotonic. The 12.36 t ha−1 treatment yielded higher PAW than the 24.71 t ha−1 rate in both irrigation regimes (0.1729 vs. 0.1668 cm3 cm−3 under 50% ET0; 0.1805 vs. 0.1527 cm3 cm−3 under 85% ET0), suggesting that beyond a threshold, additional biochar volume occupies pore space without generating a commensurate increase in accessible water storage [38,39].
What the mature-stand responses collectively demonstrate is that the operative variable under prolonged deficit is not how much water an amendment holds but whether that water remains accessible to the root system as the season progresses. These responses point to a single underlying principle. An amendment that decomposes gradually loses the structural basis for its early benefit, a change reflected in how its retention characteristics shift over the season. One carrying a chemical legacy can depress canopy function through pathways that added water does not relieve. Even an otherwise stable amendment, applied at a high enough rate, can begin to reduce rather than add to the water a plant can take up. In each case, performance under deficit was governed by the plant-available fraction rather than by the total amount of water the soil held [21].
4.2. Spectral Reflectance and Canopy Health
The NDVI data at 108 DAI added little that was new; rather, they confirmed the visual-quality pattern with an independent measurement. Visual quality reflected the decline in canopy appearance, while NDVI tracked the loss of photosynthetically active green biomass, and the close agreement between the two across treatments lends weight to the interpretation [19].
Under 50% ET0, the late-season NDVI groupings placed the 5 cm biosolids, both greenwaste treatments, and the 24.71 t ha−1 biochar in the inferior group. The greenwaste treatments declined because their extractable water pool had shrunk; less water in the root zone means less turgor, less shoot extension, and eventually less chlorophyll expression. The biosolids treatment declined for chemical reasons already discussed. The 24.71 t ha−1 biochar treatment declined for a third reason and the more revealing one: it performed worse than the untreated control.
That result, a high-rate amendment falling below the unamended baseline, points to mechanisms beyond hydraulics. Biochar surfaces with elevated alkalinity or incomplete oxidative weathering can become hydrophobic under drying conditions. This water repellency produces localized dry patches that interrupt root-zone moisture continuity [39]. High biochar loadings can also alter soil nitrogen availability through surface sorption of inorganic nitrogen and biochar-catalyzed abiotic transformations that shift nitrogen speciation away from plant-available forms, which can in turn limit chlorophyll synthesis and canopy greenness [40,41]. Either mechanism, or both acting together under Southern California summer conditions, could account for the outcome, although neither was measured directly in this study. The 12.36 t ha−1 rate avoided both constraints and maintained spectral stability, providing enough stable carbon to support its retention benefit without so much that hydrophobicity or nitrogen limitations emerged.
The treatments that held their grouping have something in common: the untreated control and the two lower biochar rates all kept NDVI stable through the end of the season under deficit conditions. That the control held its position suggests native soil, with no added amendment layer, offered a chemical and hydraulic environment that was, in some respects, more dependable under prolonged stress than either a decomposing organic layer or an over-applied stable amendment. What mattered most for sustained performance, then, was recalcitrance at an appropriate rate, not total water content, organic matter addition, or application volume [42].
The significant irrigation effects detected for the greenwaste treatments in the final weeks of the season reinforce the point from a different angle. When moisture was adequate, greenwaste-amended soils could sustain canopy function; when it was not, they could not. The lower biochar rates showed no such sensitivity; performance was consistent across irrigation regimes, as one would expect from a material whose hydraulic contribution does not depend on biological processes that stop working when the soil dries out [42].
4.3. Temporal Shifts in Canopy Greenness
The percentage green cover data contribute a dimension that NDVI and visual quality alone could not resolve: timing. At 59 DAI, the bulky organic amendments and the highest biochar rate maintained canopy coverage, while the untreated control and lower biochar rates did not, providing a real and measurable mid-season buffer driven by higher volumetric water content at that point in the season [43]. By 88 DAI, the 10 cm greenwaste treatment had dropped to the inferior group, while the greenwaste + 12.36 t ha−1 biochar blend held its position. A plausible interpretation is that the biochar component helped stabilize the organic layer against the loss of structural benefit that can accompany advanced mineralization, a synergistic effect that co-application studies have reported [44], though the relevant structural properties were not measured here. Without that stable co-amendment, high-rate organic layers could not sustain their early advantage through a full Southern California dry season.
By 108 DAI, green cover had recovered to near-saturation across all treatments, even under 50% ET0, which appears to contradict the visual quality data, where all treatments had fallen below the minimum acceptable threshold. The contradiction resolves once the limits of pixel-based analysis are considered. Because the images were captured in a standardized lightbox and segmented with calibrated algorithms (Section 2.4.1), the divergence is not attributable to variable lighting or to segmentation error; it reflects what green-cover analysis can and cannot detect. A camera counting green pixels cannot detect canopy thinning, leaf firing, or reduced tiller density when surviving shoots retain their color. The sward can register as predominantly green, while a trained evaluator correctly identifies it as unacceptable [19,45]. The divergence between these two metrics at 108 DAI is not a flaw in either measurement; it is a reminder that they are measuring different things.
The untreated control’s return from the inferior group at 59 DAI to the superior group by 88 DAI is easily overlooked, yet it is informative. The shift reflects relative change rather than any real gain in the control itself: it held its mid-season standing, while several amended treatments, among them the decomposing organic layers and the highest biochar rate, declined over the same interval [42].
Because local records show no precipitation during the final 90 days of the evaluation, a true physiological recovery of this cool-season turf under severe deficit is not plausible. The persistently high green cover therefore reflects a limitation of the metric rather than turf recovery: percent green cover registers surviving green tissue and cannot detect canopy thinning, leaf firing, and reduced tiller density that visual quality ratings capture, so it remains high while overall quality declines. The modest late-season uptick may additionally reflect canopy geometry and color-thresholding effects because, under advanced drought, leaf rolling and changing sun angles can lead segmentation algorithms to count residual pigment or exposed thatch as living green canopy. Either way, the pattern shows why image-based greenness should be interpreted alongside visual quality ratings rather than on its own.
4.4. Canopy Pigmentation Dynamics
DGCI dynamics appeared to reflect both seasonal stress intensity and, potentially, amendment-driven differences in nutrient cycling in ways that the other canopy metrics did not fully capture. The early-season uniformity at 16 DAI is consistent with a period in which soil moisture and temperature had not yet diverged sufficiently among plots to induce measurable chlorophyll differentiation [46].
The mid-season peak at 59 DAI under 50% ET0 is physiologically interpretable. Moisture-restricted leaf blades undergo reduced cell expansion, which concentrates chlorophyll pigments per unit leaf area and elevates DGCI relative to well-watered tissue [47]. Against this backdrop, the significantly lower DGCI values of the 24.71 t ha−1 biochar and 5 cm greenwaste treatments stand out, and not in a way that reflects water stress alone. Both treatments were already associated with nitrogen availability constraints discussed in earlier sections: the high biochar rate through surface sorption and abiotic nitrogen transformation [40,41], and the greenwaste treatment through nitrogen immobilization during the decomposition of a high carbon-to-nitrogen substrate [48]. Because reduced nitrogen availability limits chlorophyll synthesis, the lower DGCI of these treatments at 59 DAI is consistent with the nitrogen constraints noted above, at a point when the other canopy metrics had not yet separated treatments as clearly.
The collapse of DGCI across all treatments by 88 DAI reflects a stand-wide reduction in leaf chlorophyll under cumulative heat and moisture stress that overwhelmed any amendment-driven differentiation. By 108 DAI, however, differences re-emerged under 50% ET0. The untreated control, 5 cm greenwaste, 5 cm greenwaste + 12.36 t ha−1 biochar, and 10 cm greenwaste maintained comparatively higher DGCI and were assigned to the superior group, while all three biochar-only treatments and 5 cm biosolids fell into the inferior group. Because hydraulic differences among treatments had largely equalized by this point, the late-season DGCI separation is unlikely to be explained by soil moisture alone. One possible contributor is residual nutrient status: organic amendments that had undergone substantial decomposition may have released mineral nitrogen during late-season rewetting events, partially offsetting mid-season chlorophyll losses [49]. However, tissue nitrogen, soil nitrogen, and leaf chlorophyll were not measured in this second-year evaluation, so this nutrient-based interpretation remains a hypothesis rather than a demonstrated mechanism, and DGCI alone cannot distinguish a nutritional cause from other influences on canopy color. Under 85% ET0, DGCI remained uniformly low across all treatments with no significant differences, indicating that when moisture was sufficient at this stage of stand maturity, amendment-driven differences in leaf pigmentation were no longer detectable.
4.5. Soil Hydrological Dynamics (θᵥ)
The θᵥ data expose what the canopy metrics could only imply: that high soil water content and high plant-available water are not the same thing, and that confusing the two leads to predictable misreadings of amendment performance. The 5 cm biosolids treatment consistently stored more water than the untreated control across the evaluation period yet produced the worst canopy outcomes in the study, regardless of irrigation regime. A θᵥ sensor would have read these plots as well-supplied, even though their canopy performance was the poorest observed. The SWRC data make the mechanism explicit: biosolids exhibited the highest θPWP in both irrigation regimes (0.0968 cm3 cm−3 under 50% ET0; 0.0958 cm3 cm−3 under 85% ET0), confirming that a disproportionate share of retained water was locked below the plant-extractable threshold, unavailable for uptake regardless of what the sensor registered [35,49]. For the 10 cm greenwaste treatment, the mechanism was different: its θPWP was moderate (0.0857–0.0889 cm3 cm−3), but under 85% ET0, its θFC fell below that of the 12.36 t ha−1 biochar treatment (0.2452 vs. 0.2682 cm3 cm−3), indicating that much of the water in bulk θᵥ readings drained before reaching plant-accessible suctions. Under 50% ET0, by contrast, the PAW deficit relative to 12.36 t ha−1 biochar reflected comparatively elevated θPWP (0.0889 vs. 0.0805 cm3 cm−3), indicating that a greater fraction of retained water was held below the plant-extractable threshold rather than draining freely before field capacity was reached.
The convergence of all treatments into a single statistical group under 50% ET0 at 108 DAI reflects a related process. By that date, the prolonged deficit had drawn the readily available water fraction down evenly across plots, erasing the amendment differences seen earlier in the season. This was not agronomic equivalence in any meaningful sense; the accessible water had run low at much the same time in every plot. Under 85% ET0, by contrast, the 5 cm biosolids, 5 cm greenwaste, and 10 cm greenwaste treatments maintained higher θᵥ through the end of the season, reflecting their capacity to retain bulk water when moisture was abundant. But retention again did not translate into canopy vigor. For biosolids, elevated θPWP constrained the plant-extractable fraction. For the greenwaste treatments, PAW was lower than that of the 12.36 t ha−1 biochar despite a higher measured θᵥ [48,50].
The biochar treatments present the counterpoint. Their θᵥ values were generally lower than those of the high-rate organic amendments, yet their canopy performance was more stable, a result that makes sense only if the water they held was more efficiently distributed across plant-accessible pore sizes. The biochar treatments held water mainly at tensions within the extractable range, and because biochar resists decomposition, this retention behavior would be expected to persist across the season, though pore structure and its change over time were not measured directly here [51].
The θᵥ data reinforce the central argument of this study: total soil moisture is not a reliable predictor of turfgrass performance under deficit irrigation. What governs plant response to drought is not how much water the soil holds but how much of it the plant can actually use, and the distribution of water across pore domains, as characterized by the SWRC data, is the physical basis for that distinction [21].
4.6. Biochar and Functional Resilience
Under deficit irrigation, all treatments had declined below acceptable quality by 108 DAI, but the trajectory mattered. The 2.47 t ha−1 biochar treatment maintained the highest numerical visual quality score among deficit-irrigated plots at that date (VQ = 5.00), and although statistical separation among treatments was no longer detectable, its moderate PAW and stable θᵥ trajectory through the mid-season period are consistent with a material that improved water availability without inducing the fine-pore retention penalties or osmotic constraints observed in the higher-rate organic and biosolids treatments [52]. Even at the lowest rate tested, biochar provided a measurable buffer during the period of the dry-down when the margin between acceptable and unacceptable canopy quality was narrowest.
Under moderate irrigation, the 12.36 t ha−1 biochar treatment was the only amendment to meaningfully increase PAW relative to the untreated control (0.1805 vs. 0.1710 cm3 cm−3). This reflects the rate-dependent nature of biochar’s hydraulic contribution: sufficient application to increase capillary storage within the extractable range without crossing the rate at which added biochar begins to occupy volume that reduces rather than increases accessible water. The convergence of these two findings across both irrigation regimes suggests that the functional window for biochar in this soil type and climate lies between 2.47 and 12.36 t ha−1, a range within which the structural benefit appears to be realized without the penalties associated with excessive loading.
These patterns carry a straightforward management implication: biochar at moderate rates behaves as a different kind of amendment than greenwaste. Its benefits derive from structural stability rather than biological activity; they do not diminish as the stand matures, and they are not conditional on irrigation consistency. For urban turfgrass managers facing water restrictions, the most important distinction is that amendment performance must be durable rather than merely immediate.
Read together with Part I, these results trace a clear longitudinal arc. During establishment, the bulky organic amendments delivered the early moisture-retention and canopy advantages reported in the first-year study; by the mature stand, those advantages had diminished or become less reliable, as the labile fractions decomposed and the high-rate greenwaste treatment ultimately held less plant-available water than the untreated control. Biochar followed a different, rate-dependent trajectory: the benefit associated with biochar in the first-year study narrowed to the moderate rate, which was the most hydraulically stable treatment in the second year, while the highest rate lost its early advantage and fell below the control under deficit irrigation. Biosolids behaved consistently across both years, failing to support acceptable canopy quality regardless of irrigation. The transition from establishment to mature stand therefore reordered the amendments: the materials that looked most promising at establishment were not the ones that sustained tall fescue through a second season of deficit irrigation, which is the central reason a multi-year evaluation was necessary.
4.7. Study Limitations
Several of the mechanisms used above to interpret the treatment differences were not measured directly in this study, and they should be read as the most plausible explanations for the observed responses rather than as demonstrated causes. Nitrogen immobilization during greenwaste decomposition, surface sorption and abiotic transformation of nitrogen by biochar, salinity and osmotic constraints associated with biosolids, biochar hydrophobicity under drying, and the decomposition-driven changes in pore structure proposed for the high-rate greenwaste treatment were each inferred from canopy and soil-water behavior together with prior literature, not from corresponding measurements. Soil chemical properties such as electrical conductivity, pH, and ion composition, along with tissue and soil nitrogen and leaf chlorophyll, were not determined in this second-year evaluation, so the nutritional and chemical interpretations of the DGCI and biosolids results remain hypotheses to be tested. Pore-size distribution, porosity, bulk density, aggregate stability, and organic-matter content were likewise not characterized directly; the structural interpretations rest on the water-retention behavior summarized by the van Genuchten parameters, which describe how water is held across a range of suctions but do not by themselves establish the underlying pore geometry. The retention curves were also fitted to the mean of a single undisturbed core per subplot, so the fitted parameters represent treatment-level central tendency rather than within-plot spatial variability. Confirming the proposed mechanisms will require targeted follow-up measurements, including soil and tissue chemical analysis, direct tests of hydrophobicity, and repeated characterization of porosity and bulk density as the amendments age. None of these gaps affect the central, measurement-based result of the study, that the plant-available fraction of soil water, rather than its total amount, governs turfgrass performance under deficit irrigation; they bound the mechanistic explanations offered for the treatment-specific differences, not the primary finding.
5. Conclusions
Soil amendments produced divergent effects on soil hydraulics and tall fescue performance that became apparent only in the second year of the stand. The central finding is that total volumetric water content is a poor predictor of drought resilience: canopy performance was governed not by the total volume of soil water but by the fraction that remained within the plant-extractable tension range.
Greenwaste benefits were reduced or became less reliable by the second year, as the early hydraulic advantage of the high-rate organic amendments diminished with decomposition; under 85% ET0, the 10 cm greenwaste treatment ultimately held less plant-available water than the untreated control despite its high saturated water content. Biosolids performed poorly even when moisture was abundant, indicating a constraint that adequate irrigation did not resolve. Biochar at 12.36 t ha−1 provided the most durable benefit, sustaining stable water storage and canopy quality across the season, whereas the 24.71 t ha−1 rate underperformed, consistent with constraints at the higher rate that offset its water-retention advantage.
These results show that first-year performance is a poor proxy for mature-stand behavior and that, for the conditions tested, amendment stability and rate optimization mattered more than application volume. A smaller volume of water held at accessible tensions proved more valuable than a larger reservoir held beyond the reach of the roots. These conclusions are specific to tall fescue grown on a Hanford fine sandy loam under Southern California (semi-arid Mediterranean) conditions and to the amendment types and rates evaluated here; extrapolation to other species, soils, climates, or application rates should be made with caution.
Supplementary Materials
The following supporting information can be downloaded at: https://www.mdpi.com/article/10.3390/agronomy16131230/s1, Table S1: Visual quality (VQ) evaluations of tall fescue as influenced by irrigation regimes and soil amendments; Table S2: Regression parameters describing temporal changes in visual quality (VQ) under 50% and 85% ET0 irrigation regimes; Table S3: Normalized difference vegetation index (NDVI) evaluations of tall fescue canopy vigor as influenced by irrigation regimes and soil amendments; Table S4: Regression parameters for the temporal dynamics of the normalized difference vegetation index (NDVI) under two irrigation regimes; Table S5: Percentage of green cover evaluations of tall fescue canopy vigor as influenced by irrigation regimes and soil amendments; Table S6: Dark green color index (DGCI) evaluations of tall fescue canopy vigor as influenced by irrigation regimes and soil amendments; Table S7: Volumetric water content (θv) evaluations of the soil profile as influenced by irrigation regimes and soil amendments.
Author Contributions
Conceptualization, J.M. and M.E.M.J.; methodology, J.M. and M.E.M.J.; formal analysis, J.B.S.F.; investigation, J.B.S.F. and J.M.; resources, J.M. and J.B.S.F.; data curation, J.M.; writing—original draft preparation, J.B.S.F. and J.M.; writing—review and editing, J.B.S.F., M.E.M.J., R.G.A. and J.M.; visualization, J.B.S.F. and M.E.M.J.; supervision, M.E.M.J.; project administration, M.E.M.J.; funding acquisition, M.E.M.J. All authors have read and agreed to the published version of the manuscript.
Funding
This research received no external funding.
Data Availability Statement
The original contributions presented in this study are included in the article/supplementary material. Further inquiries can be directed to the corresponding authors.
Acknowledgments
The authors would like to thank the National Council for Scientific and Technological Development (CNPq, Brazil) for the support provided through the Science without Borders Program. We also extend our gratitude to the Department of Botany and Plant Sciences at the University of California, Riverside, for providing the facilities and technical support necessary to conduct this research. Dennise Jenkins (USDA-ARS) provided analytical assistance. Ray Anderson was supported by the U.S. Department of Agriculture, Agricultural Research Service (project number 2036-61000-018-000-D). USDA is an equal opportunity employer and provider.
Conflicts of Interest
The authors declare no conflicts of interest.
References
- Lindsey, A.J.; Singh, J.; Restuccia, N.; Abarca, V. Impact of amendments in combination with fertilizers on turfgrass and soil quality. Agronomy 2026, 16, 573. [Google Scholar] [CrossRef] [Scilit]
- Siedt, M.; Schäffer, A.; Smith, K.E.C.; Nabel, M.; Roß-Nickoll, M.; van Dongen, J.T. Comparing straw, compost, and biochar regarding their suitability as agricultural soil amendments to affect soil structure, nutrient leaching, microbial communities, and the fate of pesticides. Sci. Total Environ. 2021, 751, 141607. [Google Scholar] [CrossRef] [Scilit] [PubMed]
- Adetunji, A.T.; Blanco-Canqui, H. Soil health response to biochar combined with other amendments: A review. Biochar 2026, 8, 23. [Google Scholar] [CrossRef] [Scilit]
- Huang, B.; Gao, H. Root physiological characteristics associated with drought resistance in tall fescue cultivars. Crop Sci. 2000, 40, 196–203. [Google Scholar] [CrossRef] [Scilit]
- Carrow, R.N. Drought resistance aspects of turfgrasses in the Southeast: Root-shoot responses. Crop Sci. 1996, 36, 687–694. [Google Scholar] [CrossRef] [Scilit]
- Loschinkohl, C.; Boehm, M.J. Composted biosolids incorporation improves turfgrass establishment on disturbed urban soil and reduces leaf rust severity. HortScience 2001, 36, 790–794. [Google Scholar] [CrossRef] [Scilit]
- Linde, D.T.; Hepner, L.D. Turfgrass seed and sod establishment on soil amended with biosolid compost. HortTechnology 2005, 15, 577–583. [Google Scholar] [CrossRef] [Scilit]
- Pease, B.; Thompson, G.L.; Thoms, A.W. Evaluation of compost and soil mix ratios for perennial ryegrass establishment on topsoil and subsoil. HortTechnology 2022, 32, 191–198. [Google Scholar] [CrossRef] [Scilit]
- Morash, J.; Pamuru, S.T.; Lea-Cox, J.D.; Ristvey, A.G.; Davis, A.P.; Aydilek, A.H. Using organic amendments in disturbed soil to enhance soil organic matter, nutrient content and turfgrass establishment. Sci. Total Environ. 2024, 945, 174033. [Google Scholar] [CrossRef] [Scilit] [PubMed]
- Bernal, M.P.; Alburquerque, J.A.; Moral, R. Composting of animal manures and chemical criteria for compost maturity assessment. A review. Bioresour. Technol. 2009, 100, 5444–5453. [Google Scholar] [CrossRef] [Scilit] [PubMed]
- Tester, M.; Davenport, R. Na+ tolerance and Na+ transport in higher plants. Ann. Bot. 2003, 91, 503–527. [Google Scholar] [CrossRef] [Scilit] [PubMed]
- Laird, D.A.; Fleming, P.; Wang, B.; Horton, R.; Karlen, D. Biochar impact on nutrient leaching from a Midwestern agricultural soil. Geoderma 2010, 158, 436–442. [Google Scholar] [CrossRef] [Scilit]
- Lehmann, J.; Abiven, S.; Elias, M.; Kleber, M.; Pan, G.; Singh, B.P.; Sohi, S.; Zimmerman, A.R. Persistence of biochar in soil. In Biochar for Environmental Management: Science, Technology and Implementation, 2nd ed.; Lehmann, J., Joseph, S., Eds.; Routledge: London, UK, 2015; pp. 235–282. [Google Scholar]
- Pignatello, J.J.; Uchimiya, M.; Abiven, S.; Schmidt, M.W.I. Evolution of biochar properties in soil. In Biochar for Environmental Management: Science, Technology and Implementation, 2nd ed.; Lehmann, J., Joseph, S., Eds.; Routledge: London, UK, 2015; pp. 195–233. [Google Scholar]
- Silva Filho, J.B.; Montgomery, J.; Anderson, R.G.; McGiffen, M.E., Jr. Second-Year Effects of Biochar, Biosolids, and Greenwaste on Tall Fescue Under Deficit Irrigation: Part II. Agronomy 2026, 16, 1230. [Google Scholar] [CrossRef] [Scilit]
- Montgomery, J.; Crohn, D.; Schiavon, M.; Silva Filho, J.B.; Leinauer, B.; McGiffen, M.E. Effects of biochar and compost on turfgrass establishment rates. Agronomy 2024, 14, 960. [Google Scholar] [CrossRef] [Scilit]
- Landschoot, P. Using Composts to Improve Turf Performance; Pennsylvania State University Cooperative Extension; Lawn Care 112, 241–244; Publications Distribution Center: University Park, PA, USA, 1996. [Google Scholar]
- Morris, K.N.; Shearman, R.C. NTEP Turfgrass Evaluation Guidelines; National Turfgrass Evaluation Program: Beltsville, MD, USA, 2000; Available online: https://www.ntep.org/pdf/ratings.pdf (accessed on 16 April 2026).
- Karcher, D.E.; Richardson, M.D. Quantifying turfgrass color using digital image analysis. Crop Sci. 2003, 43, 943–951. [Google Scholar] [CrossRef]
- U.S. Salinity Laboratory Staff. Diagnosis and Improvement of Saline and Alkali Soils; Agriculture Handbook No. 60; United States Department of Agriculture: Washington, DC, USA, 1954. Available online: https://www.ars.usda.gov/pacific-west-area/riverside-ca/agricultural-water-efficiency-and-salinity-research-unit/docs/publications/handbook-no-60/ (accessed on 18 June 2026).
- Kirkham, M.B. Field capacity, wilting point, available water, and the non-limiting water range. In Principles of Soil and Plant Water Relations; Academic Press: London, UK, 2005; pp. 169–186. [Google Scholar]
- Scott, A.J.; Knott, M. A cluster analysis method for grouping means in the analysis of variance. Biometrics 1974, 30, 507–512. [Google Scholar] [CrossRef] [Scilit]
- Shaner, G.; Finney, R.E. The effect of nitrogen fertilization on the expression of slow-mildewing resistance in Knox wheat. Phytopathology 1977, 67, 1051–1056. [Google Scholar] [CrossRef] [Scilit]
- R Core Team. R: A Language and Environment for Statistical Computing; R Foundation for Statistical Computing: Vienna, Austria, 2024; Available online: https://www.R-project.org (accessed on 4 April 2026).
- Pinheiro, J.; Bates, D.; R Core Team. nlme: Linear and Nonlinear Mixed Effects Models, R Package version 3.1-162; R Foundation for Statistical Computing: Vienna, Austria, 2023; Available online: https://CRAN.R-project.org/package=nlme (accessed on 8 May 2026).
- Jelihovschi, E.G.; Faria, J.C.; Allaman, I.B. ScottKnott: A Package for Performing the Scott–Knott Clustering Algorithm in R. Trends Comput. Appl. Math. 2014, 15, 3–17. [Google Scholar] [CrossRef] [Scilit]
- Ribeiro Júnior, J.I.; de Melo, A.L.P. Guia Prático Para Utilização do SAEG; Editora Folha de Viçosa: Viçosa, Brazil, 2008; pp. 1–287. [Google Scholar]
- OriginPro, version 2026; OriginLab Corporation: Northampton, MA, USA, 2026. Available online: https://www.originlab.com/index.aspx?go=Products/Origin (accessed on 13 April 2026).
- Wickham, H. ggplot2: Elegant Graphics for Data Analysis; Springer: New York, NY, USA, 2016; Available online: https://ggplot2.tidyverse.org (accessed on 8 May 2026).
- Pedersen, T.L. Patchwork: The Composer of Plots, R Package version 1.3.2; R Foundation for Statistical Computing: Vienna, Austria, 2025. Available online: https://cran.r-project.org/web/packages/patchwork/patchwork.pdf (accessed on 8 May 2026).
- Van Genuchten, M.T. A closed-form equation for predicting the hydraulic conductivity of unsaturated soils. Soil Sci. Soc. Am. J. 1980, 44, 892–898. [Google Scholar] [CrossRef] [Scilit]
- Mualem, Y. A new model for predicting the hydraulic conductivity of unsaturated porous media. Water Resour. Res. 1976, 12, 513–522. [Google Scholar] [CrossRef] [Scilit]
- Elzhov, T.V.; Mullen, K.M.; Bolker, B.; Porto, B. minpack.lm: R Interface to the Levenberg-Marquardt Nonlinear Least-Squares Algorithm, version 1.2-1; R Foundation for Statistical Computing: Vienna, Austria, 2016. Available online: https://CRAN.R-project.org/package=minpack.lm (accessed on 21 April 2026).
- Pagliai, M.; Vignozzi, N.; Pellegrini, S. Soil structure and the effect of management practices. Soil Tillage Res. 2004, 79, 131–143. [Google Scholar] [CrossRef] [Scilit]
- Gondek, M.; Weindorf, D.C.; Thiel, C.; Kleinheinz, G. Soluble salts in compost and their effects on soil and plants: A review. Compost Sci. Util. 2020, 28, 59–75. [Google Scholar] [CrossRef] [Scilit]
- Marcum, K.B. Use of saline and non-potable water in the turfgrass industry: Constraints and developments. Agric. Water Manag. 2006, 80, 132–146. [Google Scholar] [CrossRef] [Scilit]
- Blanco-Canqui, H. Biochar and soil physical properties. Soil Sci. Soc. Am. J. 2017, 81, 687–711. [Google Scholar] [CrossRef] [Scilit]
- Rabbi, S.M.; Minasny, B.; Salami, S.T.; McBratney, A.B.; Young, I.M. Greater, but not necessarily better: The influence of biochar on soil hydraulic properties. Eur. J. Soil Sci. 2021, 72, 2033–2048. [Google Scholar] [CrossRef] [Scilit]
- Gray, M.; Johnson, M.G.; Dragila, M.I.; Kleber, M. Water uptake in biochars: The roles of porosity and hydrophobicity. Biomass Bioenergy 2014, 61, 196–205. [Google Scholar] [CrossRef] [Scilit]
- Deenik, J.L.; McClellan, T.; Uehara, G.; Antal, M.J.; Campbell, S. Charcoal volatile matter content influences plant growth and soil nitrogen transformations. Soil Sci. Soc. Am. J. 2010, 74, 1259–1270. [Google Scholar] [CrossRef] [Scilit]
- Spokas, K.A.; Cantrell, K.B.; Novak, J.M.; Archer, D.W.; Ippolito, J.A.; Collins, H.P.; Boateng, A.A.; Lima, I.M.; Lamb, M.C.; McAloon, A.J.; et al. Biochar: A synthesis of its agronomic impact beyond carbon sequestration. J. Environ. Qual. 2012, 41, 973–989. [Google Scholar] [CrossRef] [Scilit] [PubMed]
- Harvey, O.R.; Kuo, L.J.; Zimmerman, A.R.; Louchouarn, P.; Amonette, J.E.; Herbert, B.E. An index-based approach to assessing recalcitrance and soil carbon sequestration potential of engineered black carbons (biochars). Environ. Sci. Technol. 2012, 46, 1415–1421. [Google Scholar] [CrossRef] [Scilit] [PubMed]
- Hale, L.; Curtis, D.; Azeem, M.; Montgomery, J.; Crowley, D.E.; McGiffen, M.E. Influence of compost and biochar on soil biological properties under turfgrass supplied deficit irrigation. Appl. Soil Ecol. 2021, 168, 104134. [Google Scholar] [CrossRef] [Scilit]
- Azeem, M.; Hale, L.; Montgomery, J.; Crowley, D.; McGiffen, M.E., Jr. Biochar and compost effects on soil microbial communities and nitrogen induced respiration in turfgrass soils. PLoS ONE 2020, 15, e0242209. [Google Scholar] [CrossRef] [Scilit] [PubMed]
- Leinauer, B.; VanLeeuwen, D.M.; Serena, M.; Schiavon, M.; Sevostianova, E. Digital image analysis and spectral reflectance to determine turfgrass quality. Agron. J. 2014, 106, 1787–1794. [Google Scholar] [CrossRef] [Scilit]
- Jiang, Y.; Huang, B. Drought and heat stress injury to two cool-season turfgrasses in relation to antioxidant metabolism and lipid peroxidation. Crop Sci. 2001, 41, 436–442. [Google Scholar] [CrossRef] [Scilit]
- Huang, B.; Gao, H. Physiological responses of diverse tall fescue cultivars to drought stress. HortScience 1999, 34, 897–901. [Google Scholar] [CrossRef] [Scilit]
- Agegnehu, G.; Srivastava, A.K.; Bird, M.I. The role of biochar and biochar-compost in improving soil quality and crop performance: A review. Appl. Soil Ecol. 2017, 119, 156–170. [Google Scholar] [CrossRef] [Scilit]
- Epstein, E. Effect of sewage sludge on some soil physical properties. J. Environ. Qual. 1975, 4, 139–142. [Google Scholar] [CrossRef] [Scilit]
- Rawls, W.J.; Pachepsky, Y.A.; Ritchie, J.C.; Sobecki, T.M.; Bloodworth, H. Effect of soil organic carbon on soil water retention. Geoderma 2003, 116, 61–76. [Google Scholar] [CrossRef] [Scilit]
- Abel, S.; Peters, A.; Trinks, S.; Schonsky, H.; Facklam, M.; Wessolek, G. Impact of biochar and hydrochar addition on water retention and water repellency of sandy soil. Geoderma 2013, 202–203, 183–191. [Google Scholar] [CrossRef] [Scilit]
- Hardie, M.; Clothier, B.; Bound, S.; Oliver, G.; Close, D. Does biochar influence soil physical properties and soil water availability? Plant Soil 2014, 376, 347–361. [Google Scholar] [CrossRef] [Scilit]

Disclaimer/Publisher’s Note: The statements, opinions and data contained in all publications are solely those of the individual author(s) and contributor(s) and not of MDPI and/or the editor(s). MDPI and/or the editor(s) disclaim responsibility for any injury to people or property resulting from any ideas, methods, instructions or products referred to in the content. |
© 2026 by the authors. Licensee MDPI, Basel, Switzerland. This article is an open access article distributed under the terms and conditions of the Creative Commons Attribution (CC BY) license.