


Abstract
The Nutrient Tracking Tool (NTT) is a free and user-friendly modeling program developed by the Texas Institute for Applied Environmental Research (TIAER) at Tarleton State University in cooperation with the USDA Office of Environmental Markets. NTT simulates various cropping systems to evaluate management practices that optimize crop production while improving water quality and quantity. The objective of this study is to evaluate the capability of NTT to predict corn yield under different agricultural management scenarios. To assess model performance, 45 management scenarios from three field studies conducted in Iowa, Colorado, and Kansas were replicated in NTT. These scenarios included variations in nutrient sources and application rates, tillage practices, seeding rates, and irrigation management. Field data, including location, slope, planting dates, tillage practices, fertilization rates, and soil properties, were entered into NTT, and simulated crop yields were compared with measured values reported in the studies. Results showed strong agreement between measured and predicted corn yields across the evaluated scenarios. For example, the average measured yield of combined strip-tillage and manure treatment reported by Al-Kaisi and Kwaw-Mensah was 9.48 Mg ha, while NTT predicted 9.45 Mg ha. Similarly, for Halvorson et al., NTT predicted a yield of 8.06 Mg ha, compared with the measured yield of 8.23 Mg ha. Overall, the results indicate that NTT can reliably predict corn yield under a range of management practices, demonstrating its potential as a decision-support tool for agricultural management.
1. Introduction
Agricultural systems face the dual challenge of maintaining high crop productivity while minimizing negative environmental impacts, particularly nutrient losses, soil degradation, and water quality impairment. These challenges are especially relevant in intensive row-crop systems such as corn production across the U.S. Corn Belt, where management decisions directly influence both agronomic outcomes and environmental sustainability. Decision support tools that can simulate crop response to management practices are therefore increasingly important for evaluating sustainable agricultural strategies.
Agricultural decision-making is further complicated by increasing climate variability, fluctuating input costs, and the growing need for quantifying environmental impacts of production systems. In particular, uncertainty in precipitation patterns and nutrient losses make it difficult for producers and policymakers to evaluate management strategies using empirical data alone. Process-based simulation tools, therefore, provide a bridge between field experimentation and large-scale sustainability assessment. Recent studies have emphasized the importance of process-based agricultural models for evaluating climate resilience, nitrogen-use efficiency, and long-term crop productivity under variable environmental conditions [1,2].
The APEX model, developed by the USDA-ARS (Grassland, Soil and Water Research Laboratory, Temple, TX) and Texas A&M AgriLife (Blackland Research and Extension Center), was created in the 1990s as an extension of the older Environmental Policy Integrated Climate (EPIC) model [3,4]. APEX, when used with EPIC concepts, expands the modeling scale to whole watersheds and was originally developed to better quantify the environmental impacts of intensive livestock production [5,6,7]. Since its development, it has been applied to a diverse range of agricultural systems worldwide [8].
The development of APEX from EPIC was driven by the need to improve representation of spatially distributed hydrologic and biogeochemical processes at the watershed scale. APEX addresses these limitations by incorporating a subarea-based watershed representation, thereby improving simulation of nutrient transport, sediment movement, and hydrologic connectivity across heterogeneous landscapes.
APEX simulates a wide variety of environmental and agricultural outcomes, including soil erosion, nutrient runoff and leaching, soil carbon dynamics, crop yield, and the movement of pollutants within watersheds [3,6]. Similar process-based agricultural models have recently been applied to evaluate nutrient-use-efficient conservation practices and to assess large-scale crop productivity under varying climatic conditions [2,9]. However, despite its robustness, APEX requires detailed input data and technical expertise, which can limit its accessibility to non-specialist users. Recent modeling studies have also identified calibration complexity, parameter uncertainty, and spatial variability as continuing challenges for process-based agroecosystem models [10]. These limitations include high calibration demands, extensive parameterization requirements, and significant time investment for scenario setup, which collectively restrict their use in practical decision-making and policy environments.
To address this limitation, the Nutrient Tracking Tool (NTT) was developed by the Texas Institute for Applied Environmental Research (TIAER) at Tarleton State University in cooperation with the USDA Office of Environmental Markets. NTT serves as a simplified, web-based interface that uses the APEX model [3,4], allowing users to simulate nutrient fluxes and crop growth from a variety of agricultural systems in the United States without requiring advanced modeling skills [11]. By integrating preloaded spatial datasets, including Web Soil Survey (USDA-NRCS) and weather data from the PRISM database (PRISM Climate Group, Oregon State University), NTT reduces the data burden typically associated with process-based modeling while maintaining an APEX-based process simulation structure. This integration of standardized spatial datasets enables consistent simulation of agricultural systems across different geographic regions, making NTT particularly useful for conservation planning, water quality trading programs, and environmental policy applications that require comparable outputs across landscapes.
These features allow users to simply select their field(s) in default Google Maps JavaScript API and enter their current and future management information [11]. The built-in spatial datasets substantially reduce user data requirements, which is particularly important for expanding the accessibility of agricultural and environmental modeling tools among producers, land managers, and conservation planners.
NTT provides farmers, government officials, researchers, and land managers with an efficient, web-based, and user-friendly method for evaluating environmental and agronomic impacts of a wide range of management and conservation practices, including fertilizer application strategies, tillage systems, irrigation scheduling, and crop rotations. Outputs from the model include crop yield, runoff, sediment loss, crop stress, and soil carbon dynamics. Because of its accessibility and broad applicability, NTT has been successfully utilized to assist decision-makers in adopting management practices that reduce nutrient pollution and improve water quality while maintaining agricultural productivity [12,13].
Although multiple studies have evaluated NTT and its underlying APEX framework, most validations have been conducted under limited geographic regions or single management systems. Few studies have systematically evaluated model performance across multiple climatic regions and diverse combinations of irrigation, fertilizer application, tillage, and plant density within a single framework. In addition, the reliance on generalized climate and soil datasets in many applications introduces uncertainty regarding the model’s sensitivity to site-specific variability.
Previous studies have evaluated the performance of the NTT program. Menefee et al. (2024) compared measured and predicted soil carbon sequestration using NTT [8]. They input field-measured data from multiple studies and simulated scenarios, finding a reasonable correlation between measured and predicted values. They concluded that NTT is reliable in predicting soil carbon changes under different management and environmental conditions. Another study conducted across the Western Lake Erie Basin evaluated NTT performance when simulating annual crop yields, water balance, and nutrient loads [14]. In this work, NTT results were compared with observed data collected across 12 paired edge-of-field sites between 2015 and 2017 at various locations throughout the Western Lake Erie Basin. The results showed that NTT satisfactorily predicted crop yield, with a percent bias of 5–6%, close to the optimal value of 0% [14]. Nelson et al. (2019) [15] compared differences in input values between ArcAPEX and NTT. For this study, water quality data were obtained from the Rock Creek watershed in Ohio. The results indicated that NTT’s ability to predict crop yields showed greater agreement than ArcAPEX [15]. In 2015, a verification study of NTT was conducted for Yakima County, Washington. Burnett gathered relevant agricultural data and results from the Yakima area for validation. After running sensitivity tests to ensure that NTT responded appropriately to slight alterations in management practices, the predicted results for nutrient loss, runoff, and crop yield accurately represented the county-level data for Yakima [16]. In a study conducted by Pawlowski et al. (2023) [17], field- and watershed-scale models were applied in the Fox River Watershed in Wisconsin. NTT was used to evaluate how corn and soybean production could be modified to reduce nutrient and sediment runoff. The study found that properly planned management practices could reduce nutrient loads by up to 90%. The results of this work demonstrated that, at the field scale, NTT was precise and could serve as a powerful tool for assisting agricultural producers [17]. NTT has also been used to simulate and quantify reductions in nitrogen, phosphorus, and sediment runoff when reforestation practices are implemented by converting cropland to forested land. Keller and Fox (2019) [18] first ran a baseline scenario consisting of a typical cropping system, such as corn or a corn–soybean rotation. A reforestation scenario was then implemented, in which the same land was converted to forest cover. In this study, NTT was used as a simulation tool to model how converting marginal cropland to forest reduces nutrient and sediment runoff.
These previous studies demonstrate that while NTT has been validated under a range of conditions, its performance across fully integrated combinations of irrigation, fertilization, tillage, and plant density under multi-location scenarios remains less extensively evaluated.
Given the variability in model performance across studies and the continued reliance on generalized spatial datasets, further evaluation of NTT under multi-location and multi-management scenarios is necessary to better understand its predictive robustness under realistic agricultural conditions.
Therefore, the objective of this study is to evaluate the capability of NTT to predict corn yields under a range of agricultural management practices across multiple U.S. locations, including Nashua, Iowa; Fort Collins, Colorado; and Colby, Kansas. The studies examined the impacts of agricultural practices such as tillage methods, nitrogen source applications, irrigation strategies, and seeding rates on corn yields [19,20,21]. The findings provide insight into the accuracy and robustness of NTT under diverse production conditions and contribute to its ongoing evaluation as a field-scale decision-support tool for sustainable agricultural management.
2. Materials and Methods
2.1. Measured Input Data from Field Studies
Measured data from field studies conducted by Al-Kaisi and Kwaw-Mensah (2007), Halvorson et al. (2006), and Lamm et al. (2009) [19,20,21] were used to verify the NTT program’s ability to predict crop yield under various management practices (Table 1). Management practices, soil data, and crop yield information were obtained from the selected studies, which together comprised a total of 45 management practices, including various fertilizer types and application rates, irrigation management strategies, seeding rates, and tillage operations. The list of treatments and the corresponding measured crop yields for each study are presented in Table 2, Table 3 and Table 4.
Table 1.
Summary of the studies used.
Table 2.
Measured corn yield data.
Table 3.
Measured corn yield data.
Table 4.
Measured corn yields data.
The study conducted by Al-Kaisi and Kwaw-Mensah (2007) [19] included treatments consisting of three tillage operations, two types of fertilizers (commercial and manure), and four levels of nitrogen (N) application (Table 2). The treatments in the Halvorson et al. (2006) [20] study included two tillage practices and six N application rates (Table 3). Finally, the Lamm et al. (2009) [21] study included multiple irrigation schedules, seeding rates, and tillage practices (Table 4).
These studies were selected because they represent a wide range of agroclimatic conditions across the U.S. Corn Belt and High Plains regions, as well as diverse management intensity. Together, they provide a robust dataset for evaluating model performance under varying nitrogen applications, irrigation practices, and tillage systems.
2.2. NTT Input Data
Table 5 lists the reported management scenarios simulated using NTT. In addition to the management information, the geographical location, weather, and soil data for each study site were obtained from the currently available NTT database. Weather data, including daily minimum and maximum temperatures and precipitation from PRISM, and soil information from the USDA-NRCS Soil Survey are included within the NTT database.
Table 5.
Reported management data for each study.
It is important to note that the soil and weather data available in the NTT database matched those reported in each study. Therefore, since all weather and soil data from NTT matched those reported in the field studies used, there was no prior calibration, and the default PRISM and NRCS data remained.
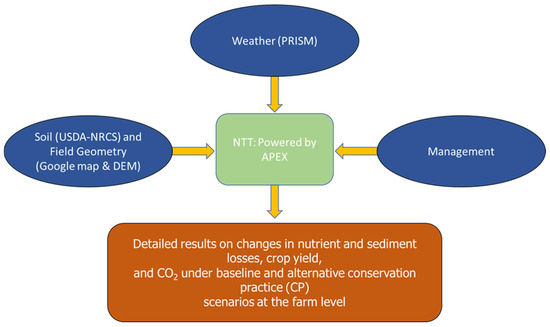
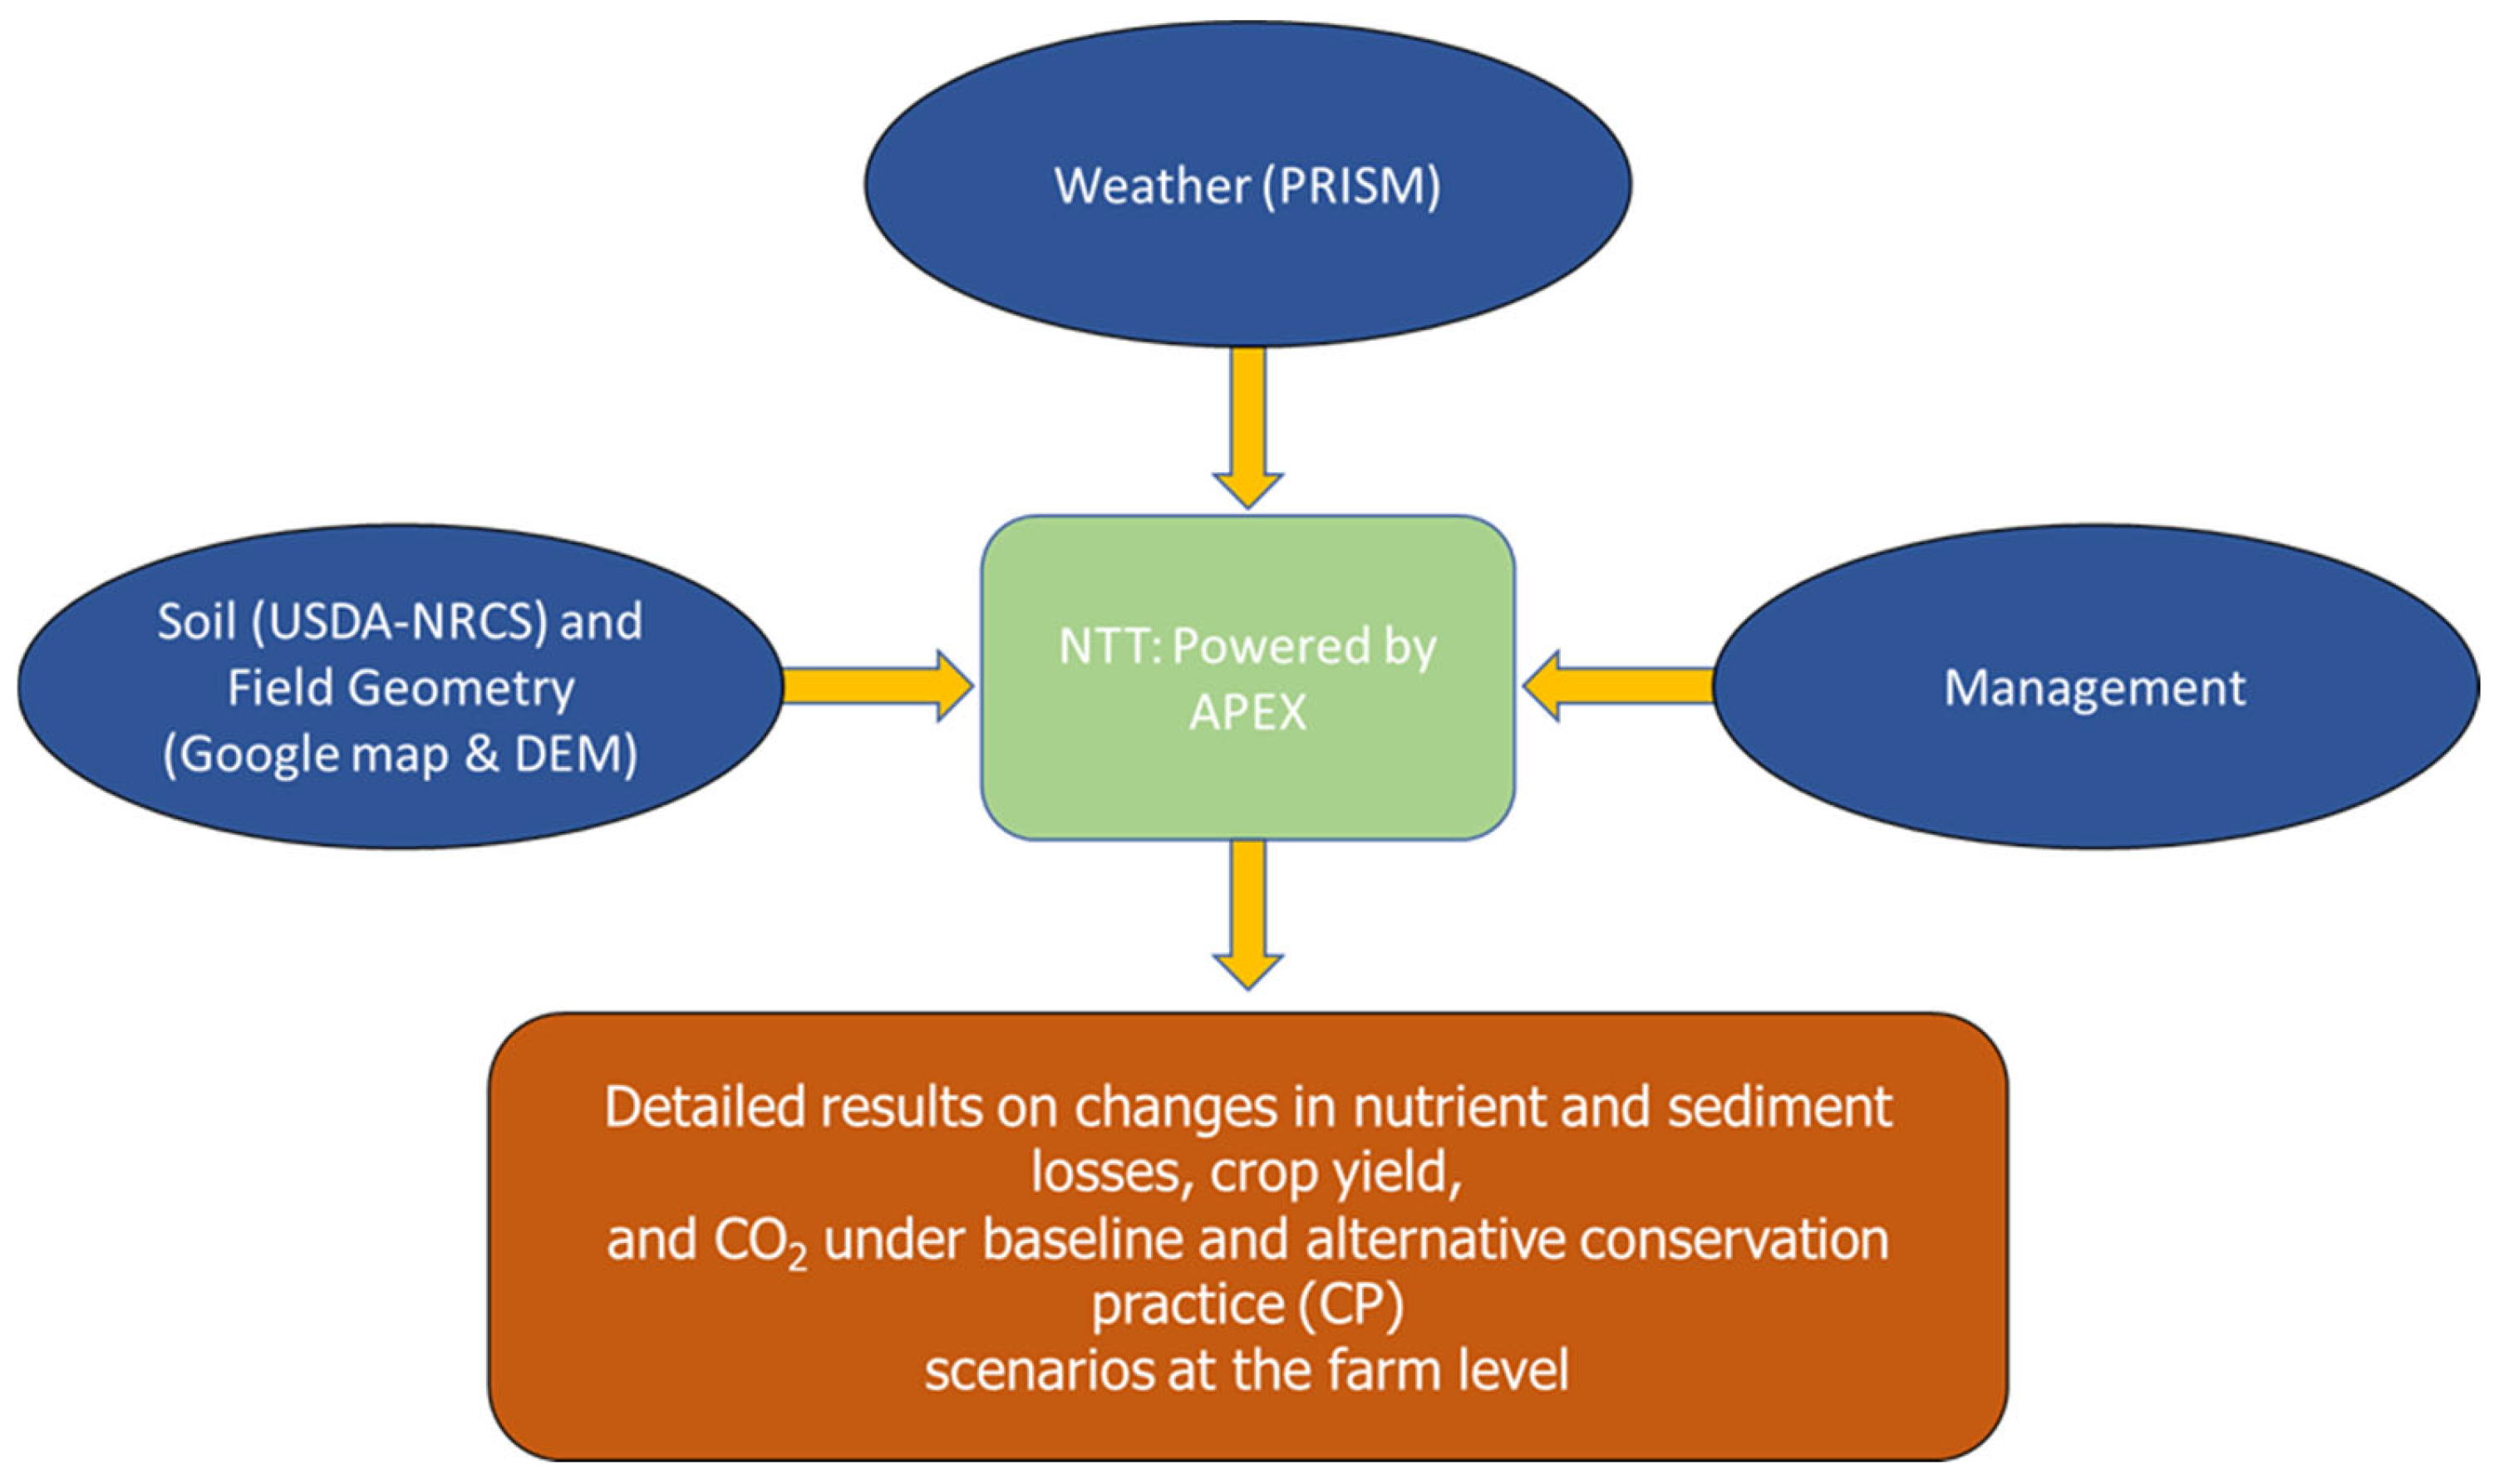
The use of standardized datasets within NTT ensures consistency across simulations but also may introduce limitations when representing local-scale variability. PRISM climate data are spatially interpolated and may smooth extreme precipitation events, while NRCS soil databases represent generalized soil map units rather than measured field-specific profiles. These characteristics are important to consider when interpreting model performance at the field scale. The framework of how NTT works and what inputs are used to influence NTTs outputs shown in Figure 1.
Figure 1.
Framework of NTT.
2.3. NTT Model Setup and Simulation Procedure
For each study location (Iowa, Colorado, and Kansas), fields were delineated within the NTT interface using geographic coordinates corresponding to the original measured field study sites. No calibration or modification of input datasets was performed prior to simulation.
Each management scenario (n = 45) was manually constructed in NTT by specifying tillage operations, fertilizer type, and application rate, planting date, seeding rate, and irrigation schedule as reported in the original studies. Simulations were run annually, corresponding to the study years. Only simulated corn yield outputs were extracted from NTT for comparison with measured values. Although the model also generated outputs for runoff, sediment, and nutrient losses, these were not analyzed in the present study.
2.4. Statistical Analysis
Statistical analyses were conducted to evaluate the accuracy of the predicted results. The Mean Bias Error (MBE) was used to determine the average difference between the predicted and measured values. The MBE formula is shown below:
where SIM represents the predicted values and OBS represents the measured data. A positive MBE indicates that the predicted values, on average, overestimate the measured data, while a negative value indicates underestimation. Values close to zero suggest minimal bias between predicted and observed results.
The Nash–Sutcliffe Efficiency (NSE) was used to quantitatively evaluate the agreement between the predicted results and the measured data. The NSE formula used is shown below:
where is the mean of the measured data, represents the predicted values, and represents the measured data points. An NSE of 1 indicates perfect agreement between the measured and predicted data. Statistical analyses and graphical visualizations were performed using Microsoft Excel.
3. Results
3.1. Al Kaisi M. and Kwaw-Mensah Study Results [19]
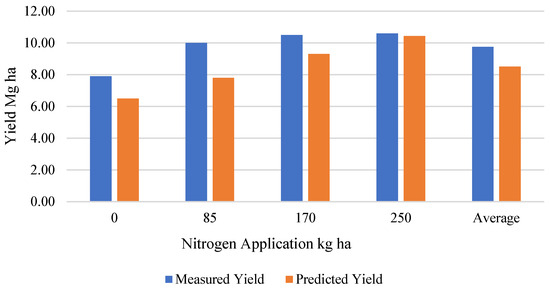
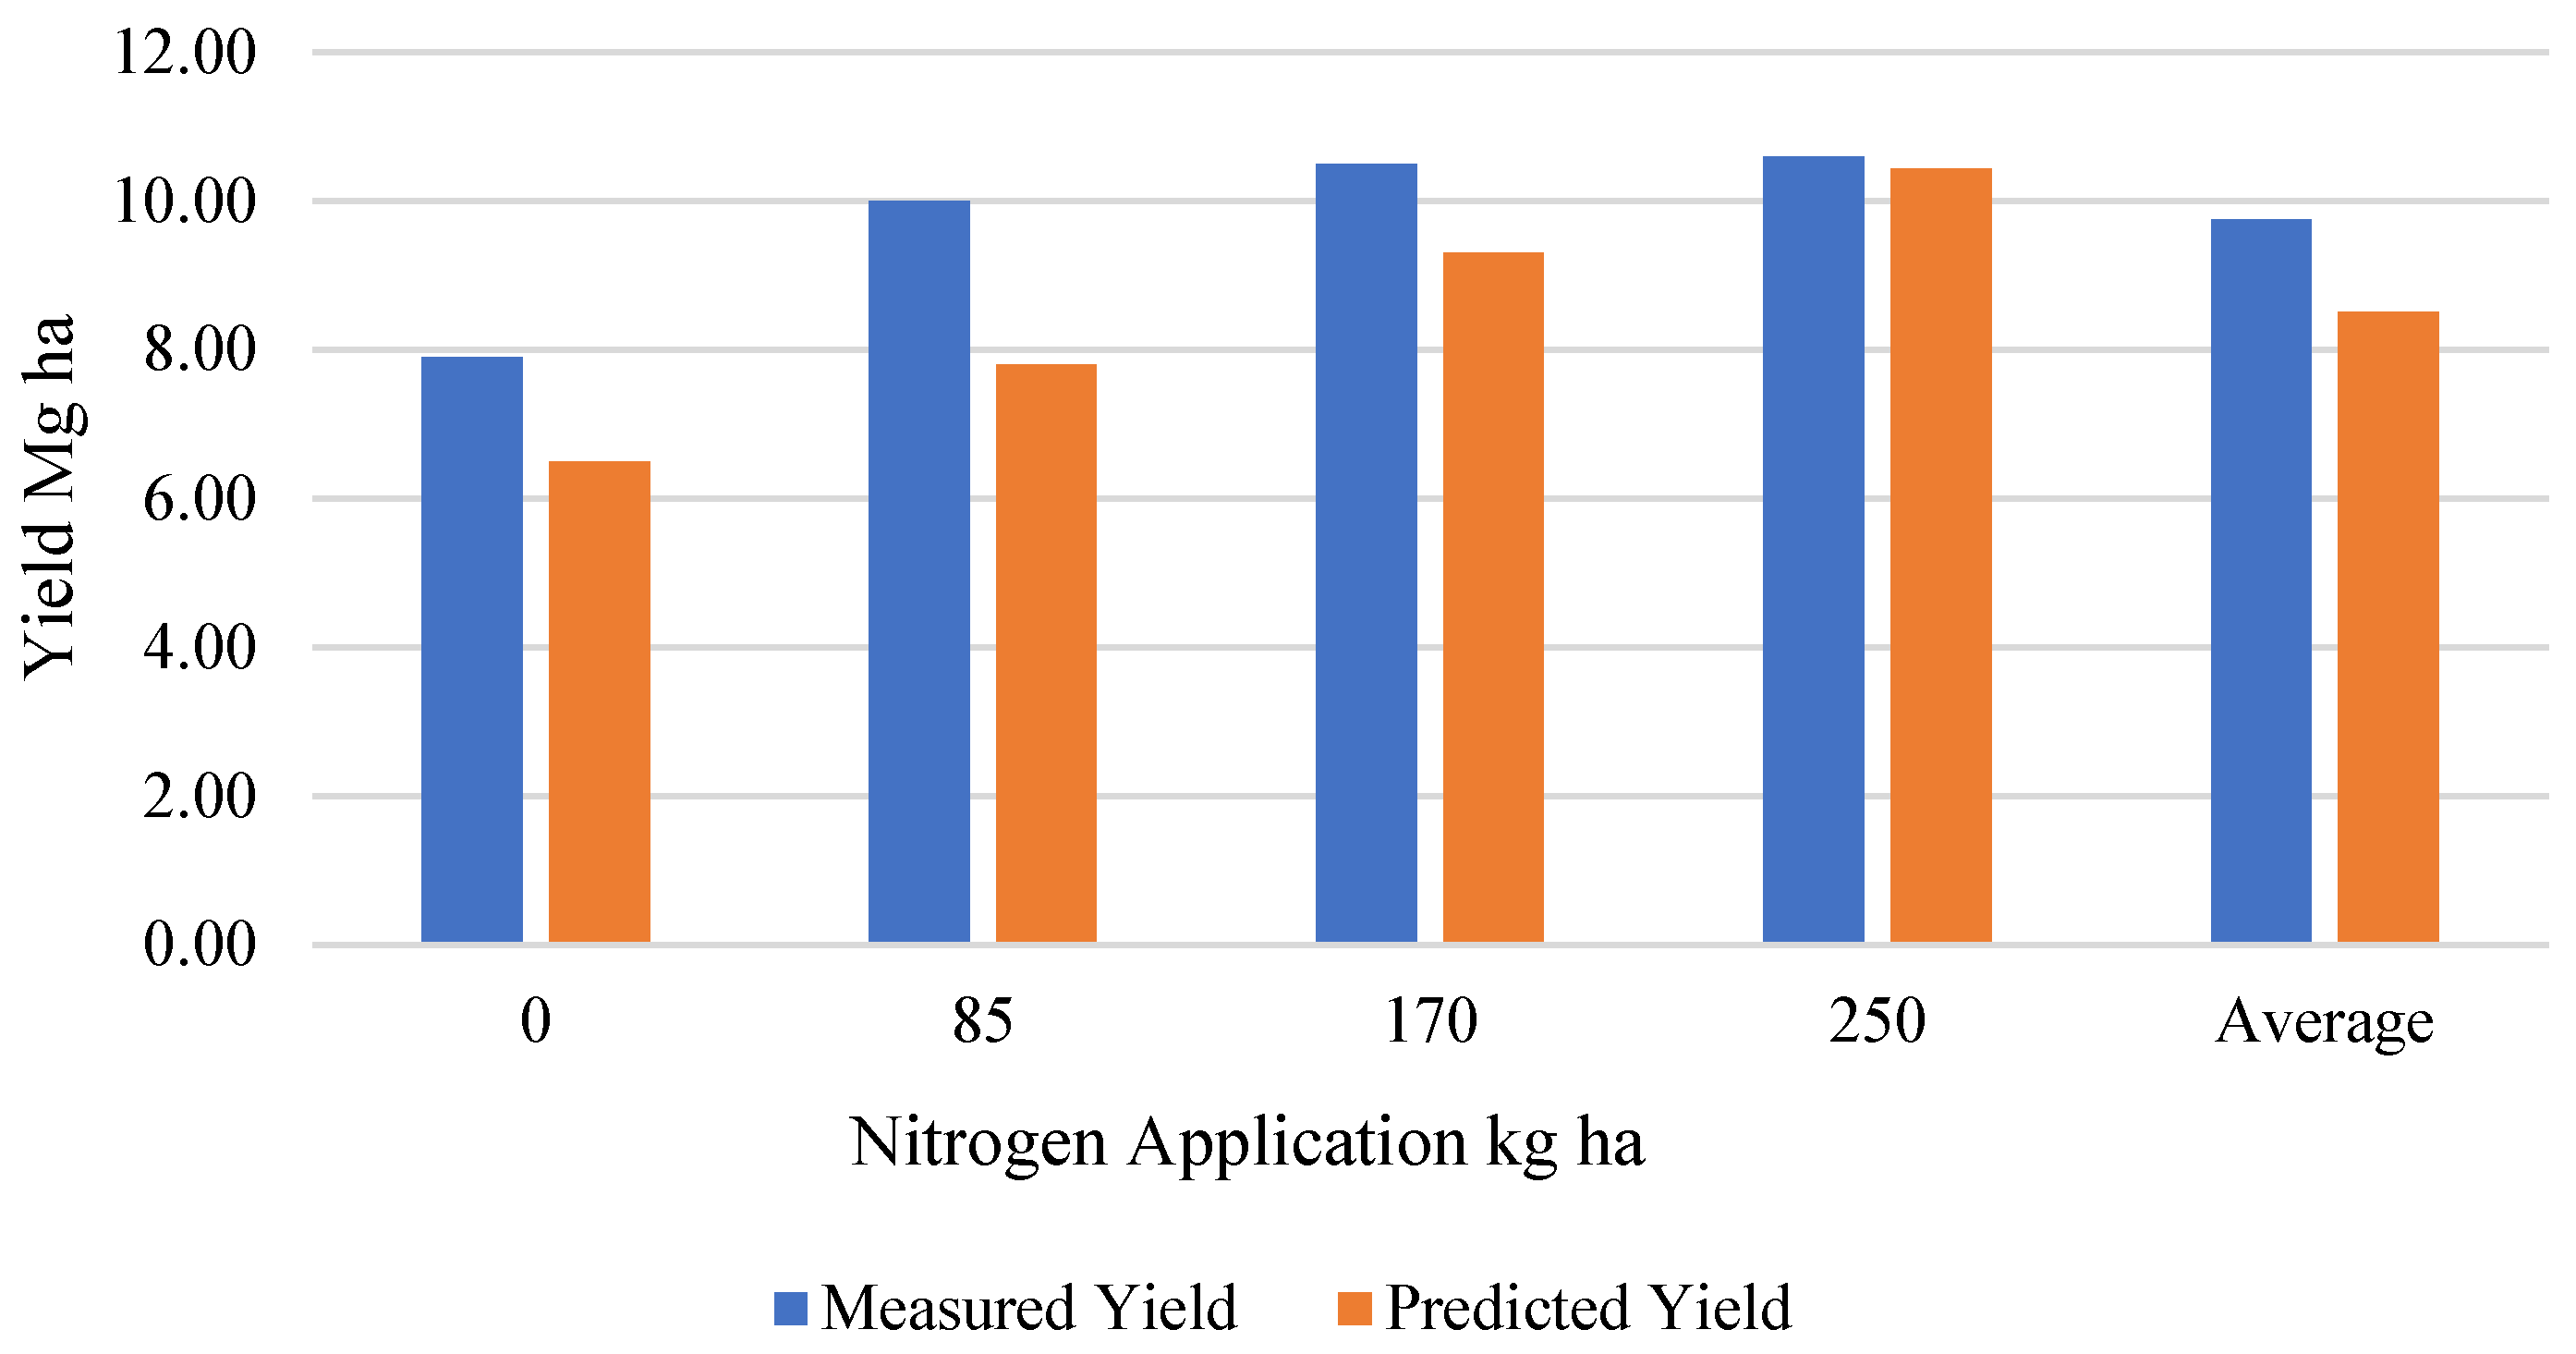
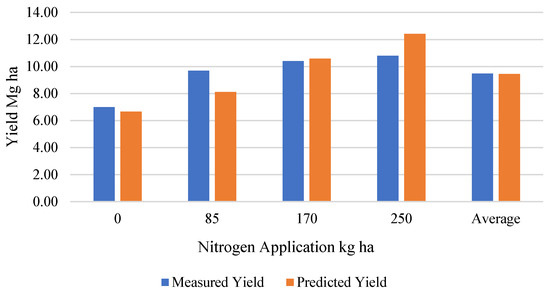
In the study by Al-Kaisi and Kwaw-Mensah [19], the average difference between measured and predicted corn yields for the tillage and fertilizer source treatments remained within ±1.25 Mg ha. The largest difference between predicted and measured yields occurred under chisel plow with 85 kg ha of anhydrous ammonia, at 2.20 Mg ha.
The MBE for corn yield under ST with manure treatments was −0.03 Mg ha, indicating a strong agreement between the measured and predicted values. The observed discrepancies at intermediate nitrogen rates suggest potential nonlinearities in nitrogen response that may not be fully captured by generalized parameterizations within the model. Figure 2 shows the measured and predicted NTT corn yields under CP incorporation using increasing fertilizer treatments along with the average of all treatments. Figure 3 presents the measured and predicted corn yields under ST with increasing manure fertilizer treatments. Table 6 is the predicted corn yields from NTT under all fertilizer and tillage managements. Figure 2 and Figure 3 as well as Table 6 use [19] for measured yields and NTT scenario development.
Figure 2.
Measured and NTT predicted corn yields CP fertilizer treatments.
Figure 3.
Measured and NTT predicted corn yields of ST manure fertilizer treatments.
Table 6.
NTT predicted corn yields.
3.2. Halvorson et al. Study Results [20]
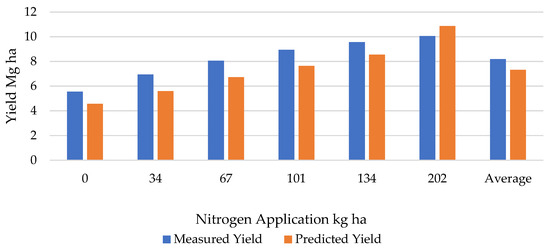
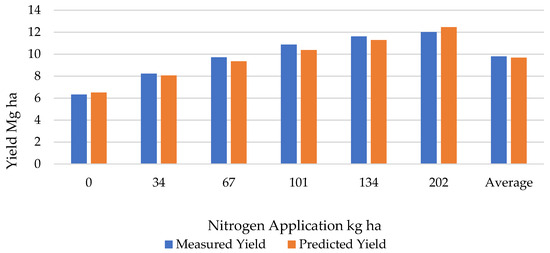
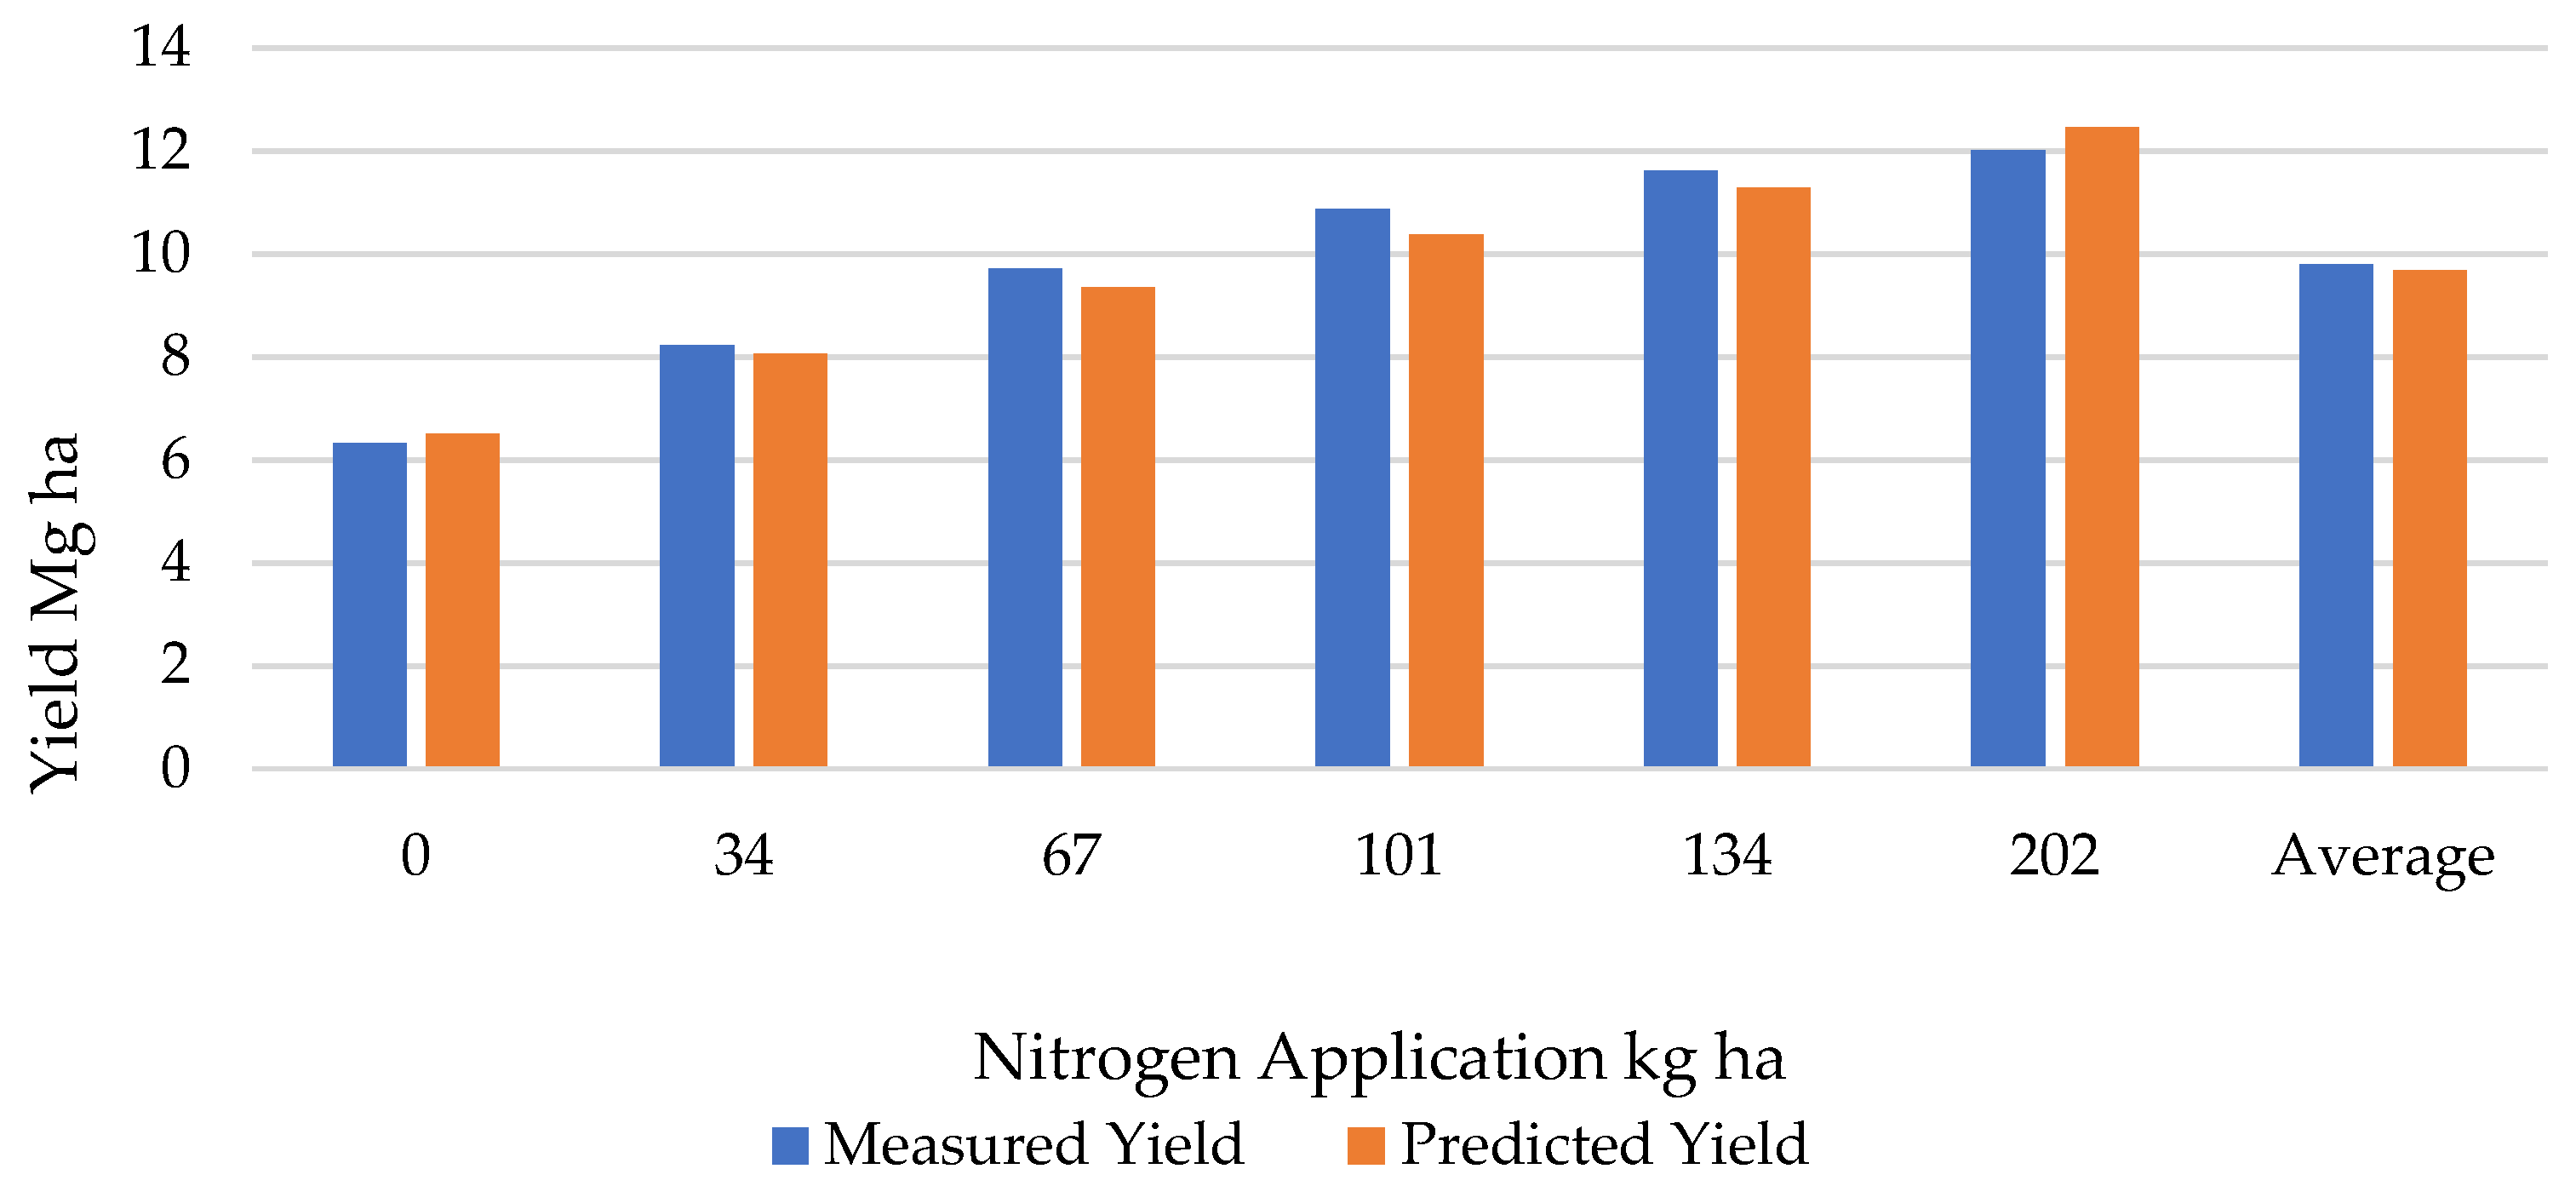
Simulation of the data reported by Halvorson et al. [20] using NTT resulted in a strong correlation between measured and predicted crop yields, with the NSE reaching 0.97 for CT treatments. The highest discrepancy (1.34 Mg ha) between the measured and predicted corn yields occurred for the no-till (NT) × 67 kg ha nitrogen treatment (Figure 4).
Figure 4.
Measured and predicted corn yields for NT treatments.
The most precise predicted corn yield under the replicated conditions was observed for the CT treatment with no nitrogen application, with a difference of only −0.18 Mg ha compared with the measured values (Figure 5). The MBE values indicate reasonable agreement between measured and predicted yields for both CT (MBE = −0.12 Mg ha) and NT (MBE = −0.86 Mg ha) treatments (Figure 5). The higher NSE values observed under CT management compared to NT suggest that the model may better represent systems with more homogeneous soil disturbance and residue distribution. Table 7 shows the predicted NTT corn yields under all conditions from measured field study [20].
Figure 5.
Measured and NTT predicted corn yields for CT treatments.
Table 7.
NTT predicted corn yields.
3.3. Lamm et al. Study Results [21]
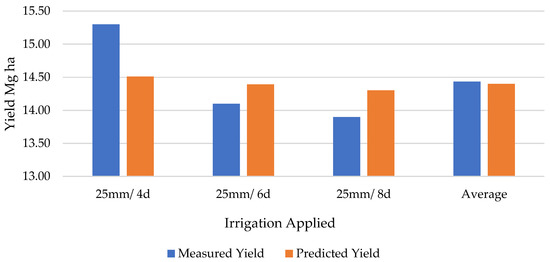
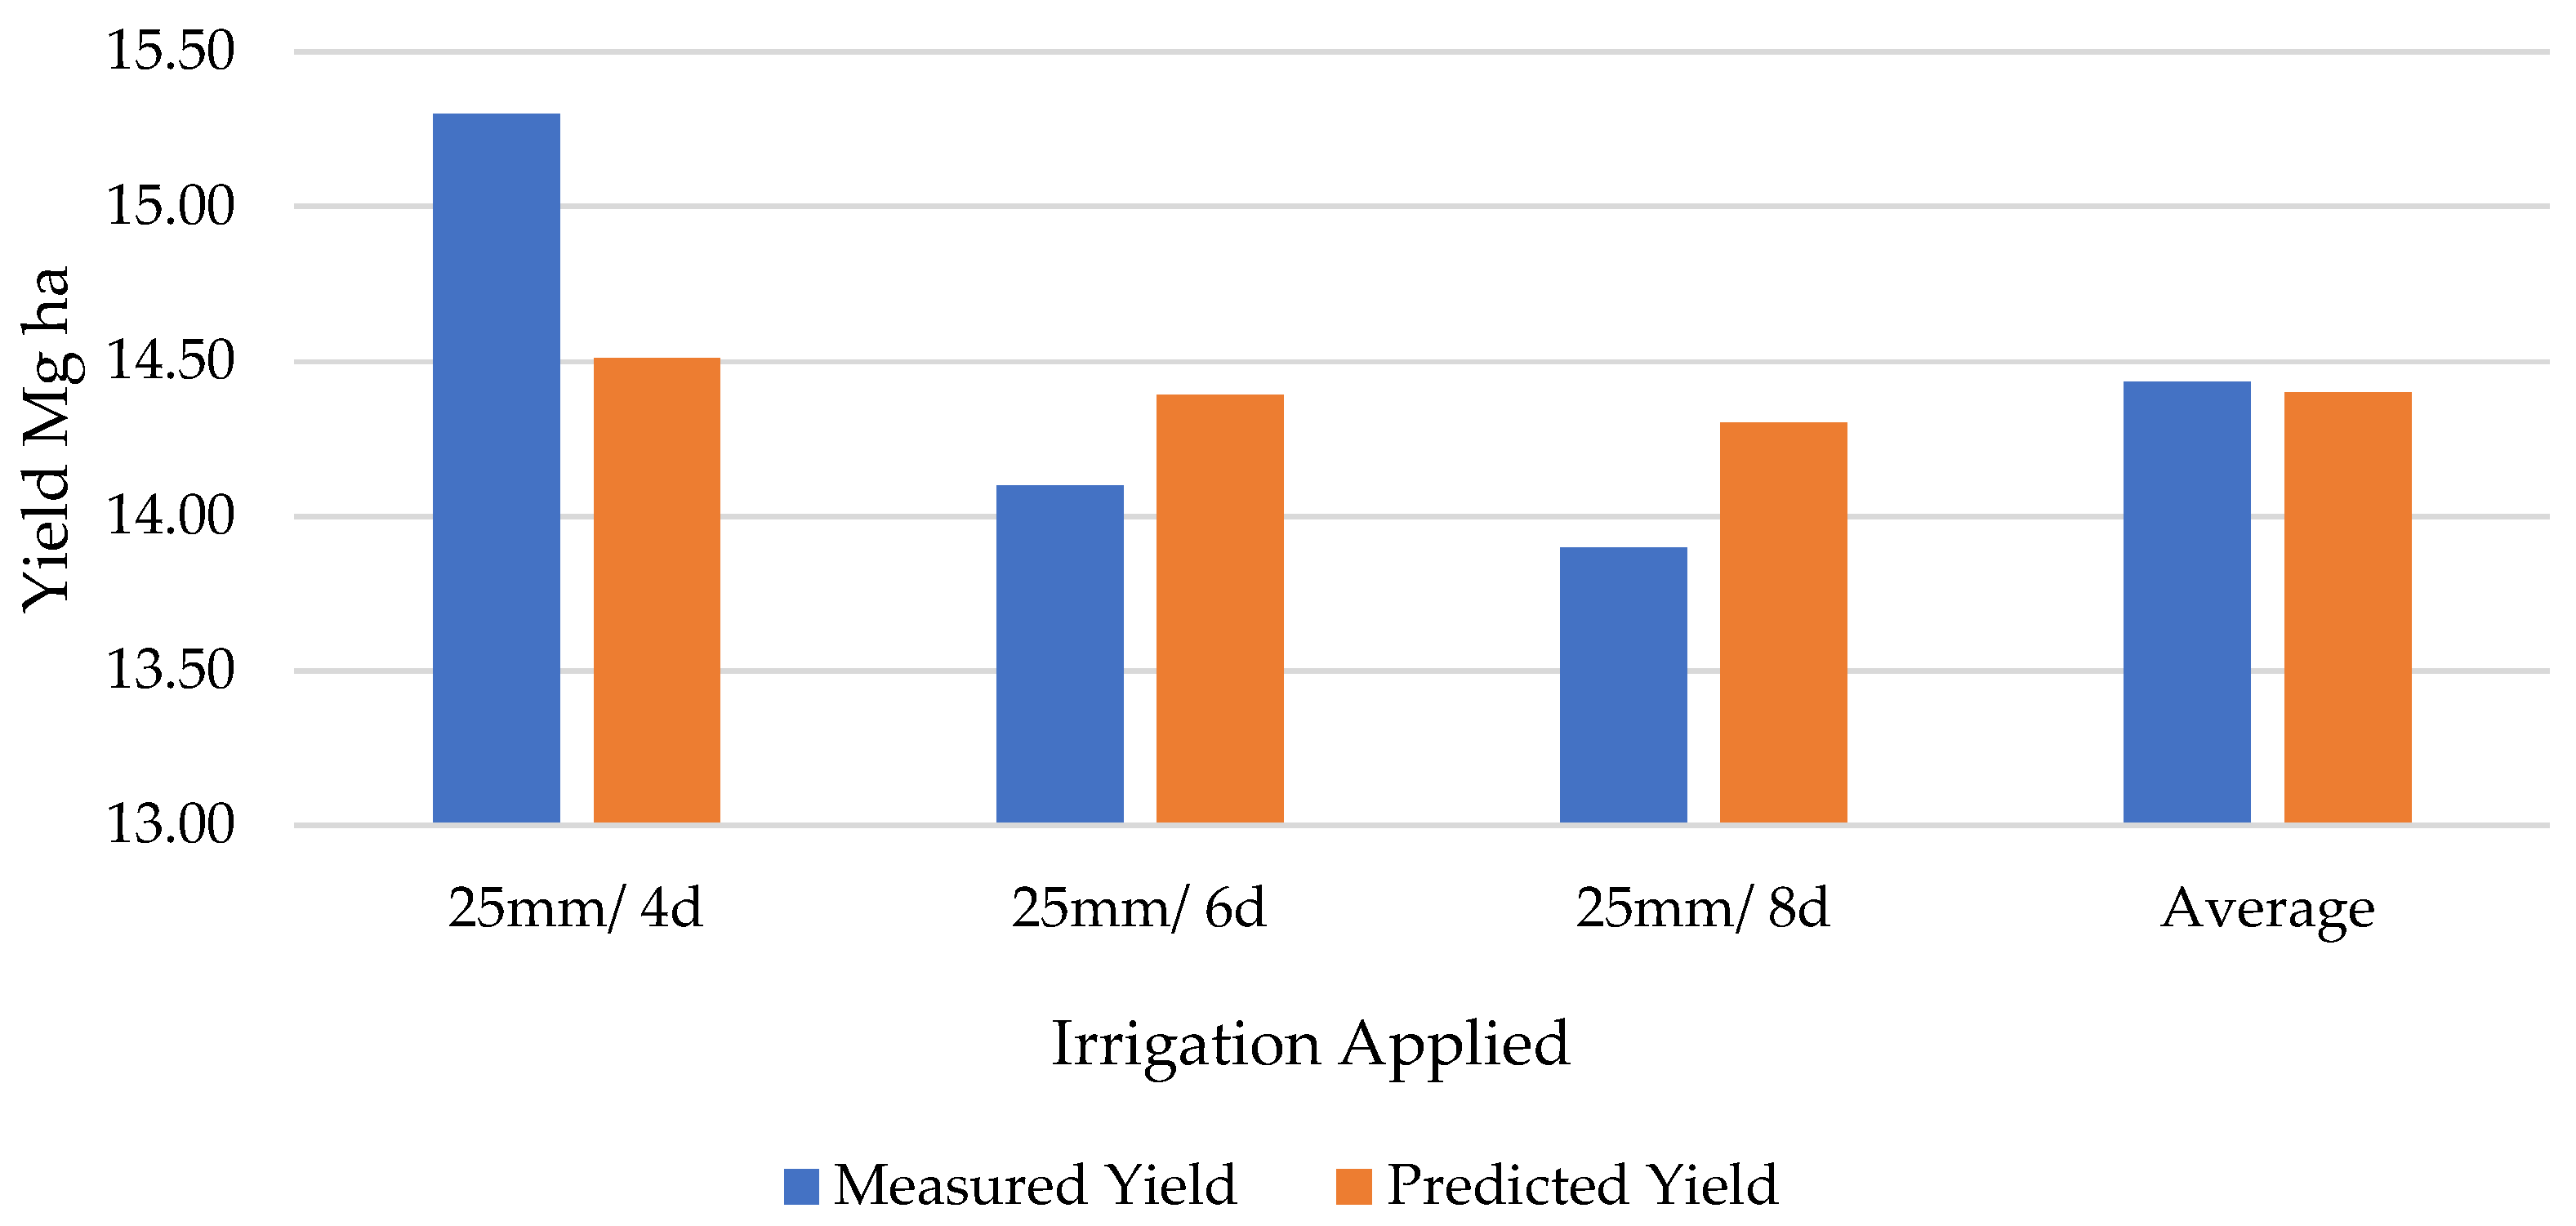
The corn yields predicted by NTT and those measured in the Lamm et al. [21] study showed good agreement across all treatments and scenarios, including irrigation schedules, seeding rates, and tillage types. The difference between predicted and measured corn yields did not exceed 0.8 Mg ha. The greatest difference between measured and predicted corn yields occurred under the 25 mm 4 d irrigation schedule, with a difference of 0.79 Mg ha (Figure 6).
Figure 6.
Measured and NTT predicted corn yields under different irrigation application rates.
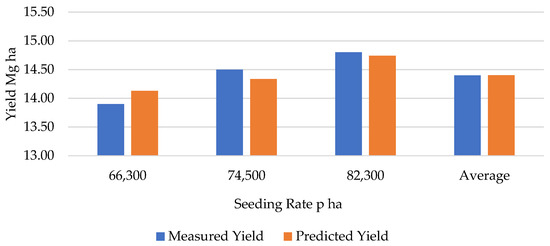
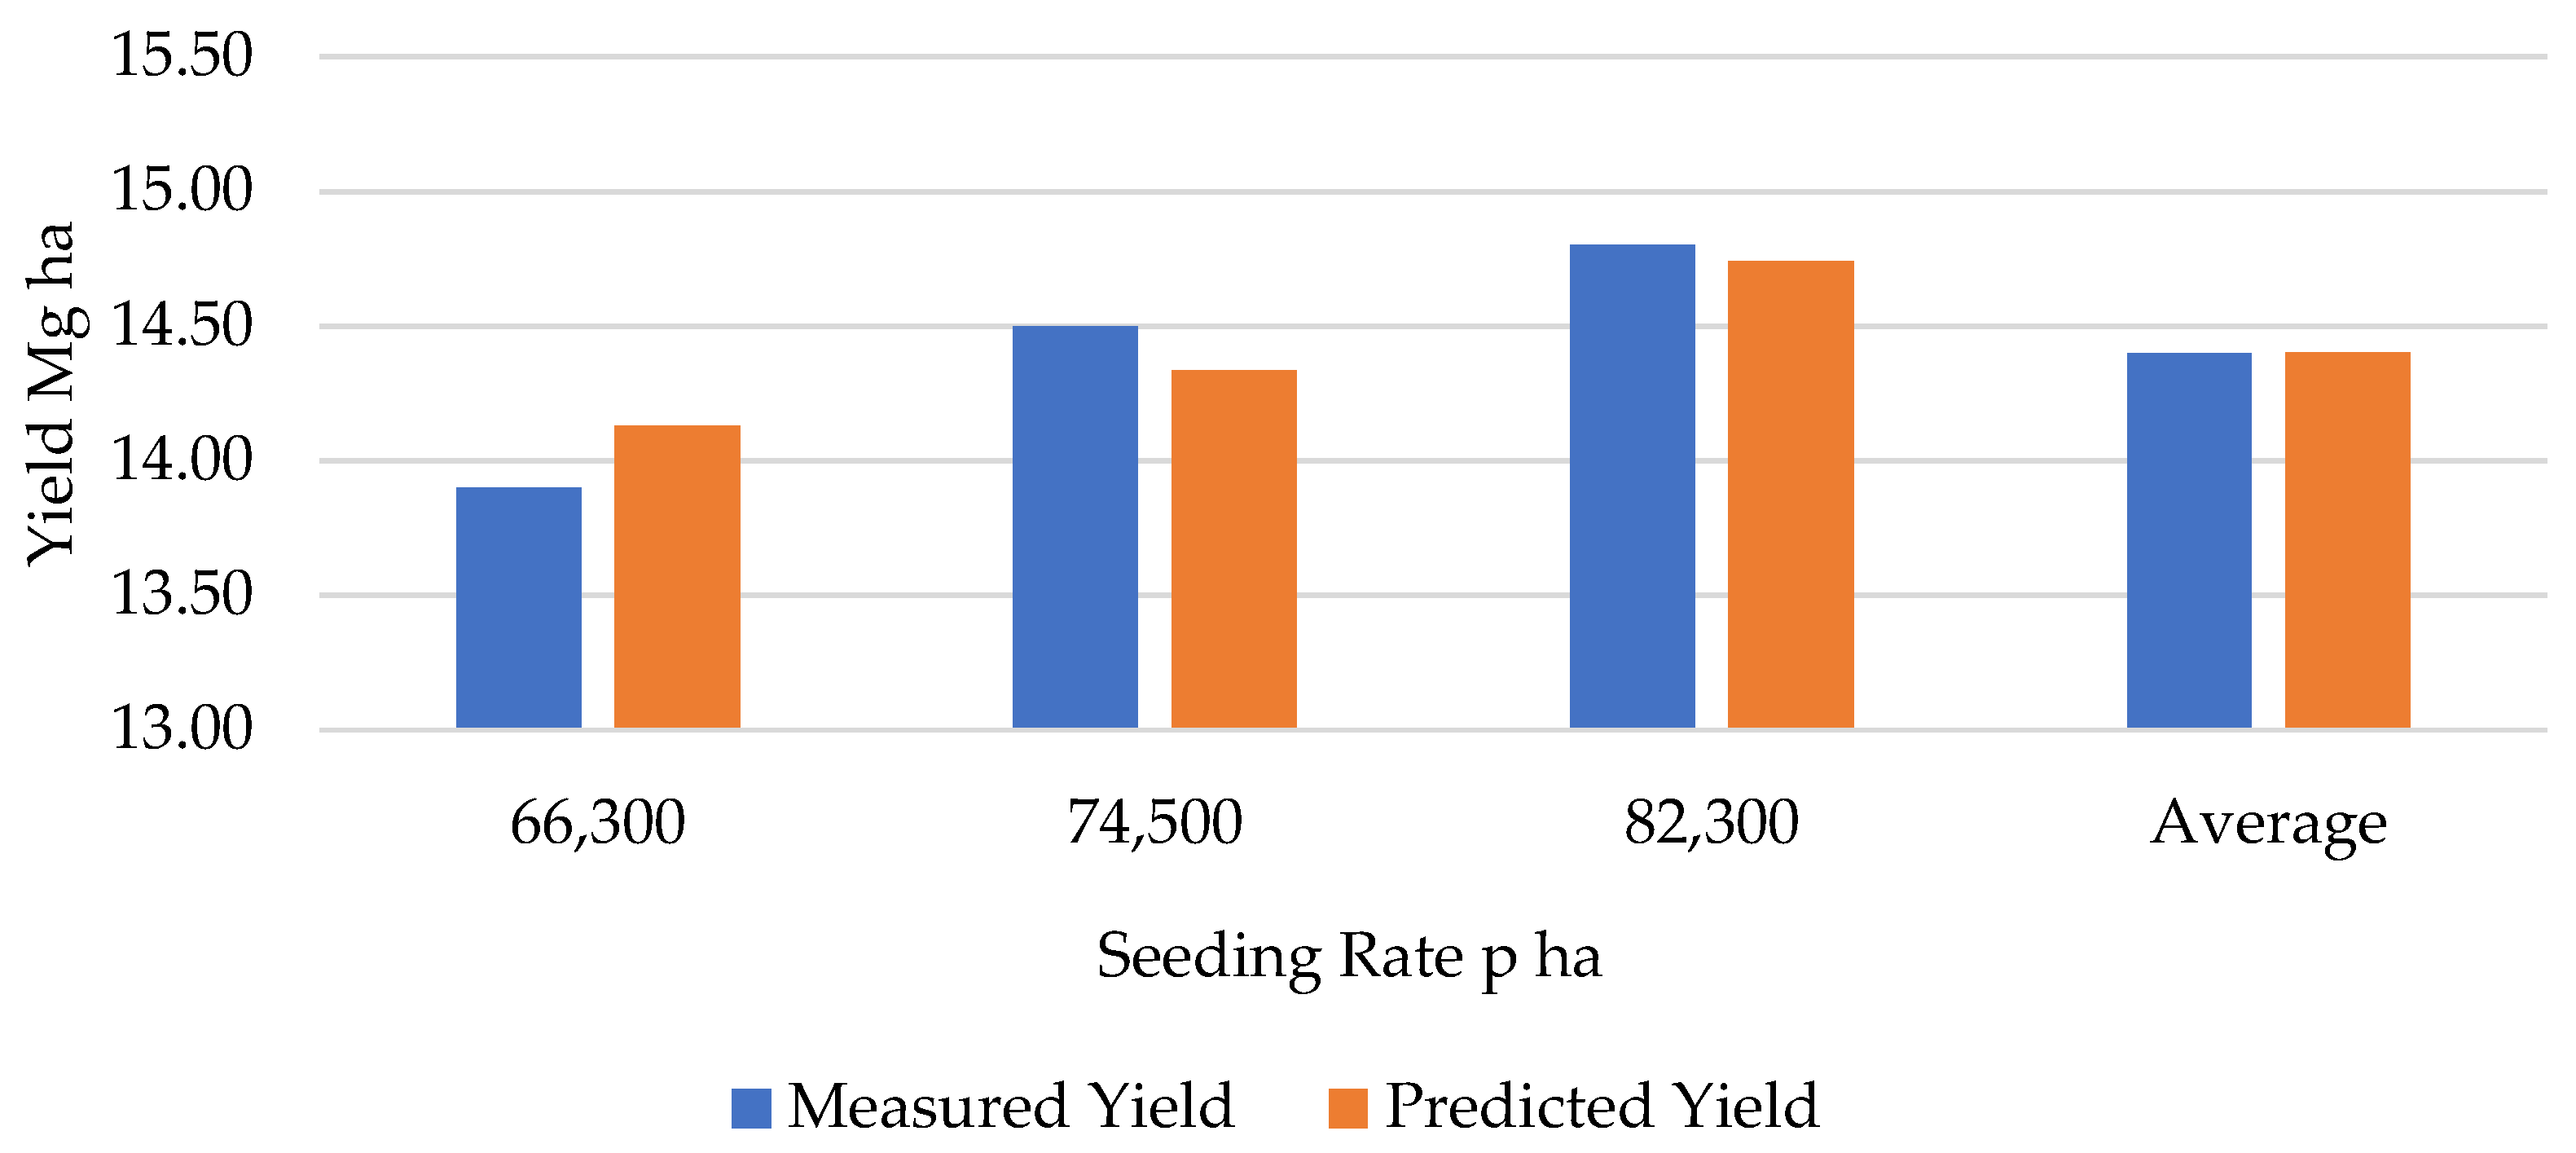
A close agreement was also observed between the predicted corn yield (14.46 Mg ha) and the measured yield (14.80 Mg ha) for the 82,300 plants ha seeding rate (Figure 7). Strong agreement was also observed across other treatments, including various seeding rates (66,300; 74,500; and 82,300 plants ha), tillage practices (CT, ST, and NT), and irrigation schedules (25 mm/4 d; 25 mm/6 d; and 25 mm/8 d).
Figure 7.
Measured and NTT predicted corn yields under different seeding rates.
This agreement was further supported by the MBE values, which were close to zero for all management scenarios. Both seeding rate and tillage management treatments showed minimal bias, with an MBE of 0.002 Mg ha. Similarly, for the irrigation treatments, the MBE value was −0.03 Mg ha. The minimal variation in predicted yields across tillage treatments indicates that NTT may exhibit reduced sensitivity to tillage-induced changes in soil physical properties under irrigated conditions. Table 8 presents predicted corn yields under all conditions from Lamm et al. study.
Table 8.
NTT predicted corn yields.
To further evaluate model performance across all studies, the MBE and NSE values were calculated and are summarized in Table 9.
Table 9.
MBE and NSE values for NTT-predicted corn yields across all studies and management scenarios.
4. Discussion
The corn yields from each scenario showed a consistent pattern between measured and predicted values across all treatments in the three studies. The strong agreement observed across multiple studies suggests that NTT effectively captures first-order crop responses to nitrogen and water management, indicating robust predictive capability under default conditions. Among all scenarios, the closest agreement between predicted and measured yields occurred in the Lamm et al. [21] study at the 82,300 plants ha seeding rate, with a difference of 0.06 Mg ha.
The largest discrepancy between measured and predicted corn yields in this evaluation occurred in the Al-Kaisi and Kwaw-Mensah study [19] under the CP treatment with 85 kg ha of anhydrous ammonia, which resulted in a difference of 2.20 Mg ha. This may be attributed to the increased sensitivity of crop yield to nitrogen availability at moderate fertilizer application rates. At this level, small differences in simulated nitrogen mineralization, timing of availability, and soil-water interactions can lead to amplified deviations between predicted and measured yields. As the nitrogen levels increased from this application rate, predicted yields began to follow measured patterns. This mid-range nitrogen rate can be more difficult to model compared to limited or high application of fertilizers.
The use of generalized PRISM climate data and NRCS soil datasets may limit the model’s ability to capture field-scale spatial variability and short-term weather extremes, which can influence yield predictions. Similar limitations associated with spatial variability, calibration uncertainty, and climate representation have also been reported in recent agricultural systems modeling studies [1,10]. As a result, the discrepancies likely reflect both the uncertainty of the input dataset and the structural limitations of the model. While NTT performs well with generalized inputs, incorporating site-specific weather and soil data would likely improve prediction accuracy.
Under tillage treatments (CP, ST, NT) in the Lamm et al. [21] study, predicted results (14.44, 14.35, 14.42 Mg ha) were all closely related to each other. Limited variation suggests that the model may have reduced sensitivity to tillage effects under the simulated conditions. This may be attributed to the use of generalized soil and weather inputs, as well as default parameterization of tillage processes within the model, which may not fully capture field-scale differences in soil structure, residue dynamics, and water availability. This suggests that the model’s sensitivity to tillage-induced changes in soil physical properties may be reduced under default parameterization. Overall, the findings indicate that NTT can serve as a practical decision-support tool for evaluating management scenarios without requiring extensive calibration. Similar conclusions have been reported in recent studies evaluating process-based agricultural models for conservation planning and nutrient management across diverse production systems.
5. Conclusions
The objective of this study was to evaluate the performance of NTT in simulating corn yield responses under a range of agricultural management scenarios across multiple geographic locations. This evaluation was conducted by comparing the corn yields predicted by NTT with those reported in three independent field studies [19,20,21].
Overall, NTT demonstrated strong agreement with observed corn yields, with NSE values up to 0.97 and MBE values close to zero, indicating minimal bias and reliable predictive capability across diverse conditions. While minor deviations were observed under intermediate nitrogen rates and certain tillage practices, predicted yields generally followed measured trends across all studies.
These results indicate that NTT is capable of representing crop yield responses under varying management systems when using integrated climate and soil datasets, supporting its use as a field-scale decision-support tool. However, reliance on generalized spatial datasets may limit the model’s sensitivity to site-specific conditions, particularly under variable climate and soil environments.
Future research should focus on evaluating NTT performance for additional crops and management systems, as well as incorporating site-specific data to further improve prediction accuracy.
Author Contributions
Conceptualization, A.S. and K.H.; methodology, A.S.; software, A.S.; validation, K.H.; formal analysis, K.H.; investigation, K.H.; resources, K.H.; data curation, K.H.; writing—original draft preparation, K.H.; writing—review and editing, A.S.; visualization, K.H.; supervision, A.S.; project administration, K.H. and A.S. All authors have read and agreed to the published version of the manuscript.
Funding
This research was funded by the USDA Office of the Chief Economist, grant number 58-0111-24-010.
Data Availability Statement
The input data used in this study were obtained from previously published sources [19,20,21]. The NTT-generated simulation outputs produced during this study are not publicly archived but are available from the corresponding author upon reasonable request.
Acknowledgments
Special thanks are due to the USDA Office of the Chief Economist for funding this project. GenAI tools (ChatGPT version GPT-5.5 and Grammarly v14.1287.0) were used in this study for grammar and spelling.
Conflicts of Interest
The authors declare no conflicts of interest.
References
- Baum, M.E.; Sawyer, J.E.; Nafziger, E.D.; Huber, I.; Thorburn, P.J.; Castellano, M.J.; Archontoulis, S.V. Evaluating and improving APSIM’s capacity in simulating long-term corn yield response to nitrogen in continuous- and rotated-corn systems. Agric. Syst. 2023, 207, 103629. [Google Scholar] [CrossRef] [Scilit]
- Čerkasova, N.; White, M.; Arnold, J.; Bieger, K.; Allen, P.; Gao, J.; Gambone, M.; Meki, M.; Kiniry, J.; Gassman, P.W. Field scale SWAT+ modeling of corn and soybean yields for the contiguous United States: National Agroecosystem Model Development. Agric. Syst. 2023, 210, 103695. [Google Scholar] [CrossRef] [Scilit]
- Wang, X.; Williams, J.R.; Gassman, P.W.; Baffaut, C.; Izaurralde, R.C.; Jeong, J.; Kiniry, J. EPIC and APEX: Model Use, Calibration, and Validation. Trans. ASABE 2012, 55, 1447–1462. [Google Scholar] [CrossRef] [Scilit]
- Williams, J.R.; Izaurralde, R.C. The APEX Model. In Watershed Models; Singh, V.P., Frevert, D.K., Eds.; CRC Press: Boca Raton, FL, USA, 2010. [Google Scholar]
- Gassman, P.W.; Hauck, L. Environmental Component of the National Pilot Project Integrated Modeling System. Livestock Series Report 8, The; Staff report 96-SR 84; Center for Agricultural and Rural Development, Iowa State University: Ames, IA, USA, 1996. [Google Scholar]
- Gassman, P.W.; Williams, J.R.; Wang, X.; Saleh, A.; Osei, E.; Hauck, L.; Izaurralde, R.C.; Flowers, J. The Agricultural Policy/Environmental Extender (Apex) Model: An Emerging Tool for Landscape and Watershed Environmental Analyses; Technical Report; Center for Agriculture and Rural Development, Iowa State University: Ames, IA, USA, 2010. [Google Scholar]
- Assefa, T.; Jha, M.; Reyers, M.; Worqlul, A.W.; Doro, L.; Tilahun, S. Conservation agriculture with drip irrigation: Effects on soil quality and crop yield in sub-Saharan Africa. J. Soil Water Conserv. 2020, 75, 209–217. [Google Scholar] [CrossRef] [Scilit]
- Menefee, D.; Saleh, A.; Gallego, O. Estimating soil carbon change using the web-based Nutrient Tracking Tool (NTT) with APEX. J. Soil Water Conserv. 2024, 79, 180–190. [Google Scholar] [CrossRef] [Scilit]
- Singh, S.; Hwang, S.; Arnold, J.G.; Bhattarai, R. Evaluation of agricultural BMPs’ impact on water quality and crop production using SWAT+ model. Agriculture 2023, 13, 1484. [Google Scholar] [CrossRef] [Scilit]
- Wallach, D.; Buis, S.; Seserman, D.M.; Palosuo, T.; Thorburn, P.; Mielenz, H.; Justes, E.; Kersebaum, K.-C.; Dumont, B.; Launay, M.; et al. A calibration protocol for soil-crop models aimed at reducing prediction error and inter-model variability. bioRxiv 2023. [Google Scholar] [CrossRef] [Scilit]
- Saleh, A.; Gallego, O.; Osei, E.; Gross, C.; McKinney, S.; Cover, H. Nutrient Tracking Tool—A user-friendly tool for calculating nutrient reductions for water quality trading. J. Soil Water Conserv. 2011, 66, 400–410. [Google Scholar] [CrossRef] [Scilit]
- Delgado, J.A.; Sassenrath, G.F. (Eds.) From the Dust Bowl to Precision Conservation: A Call for Conservation Agriculture; Soil and Water Conservation Society: Ankeny, IA, USA, 2021. [Google Scholar]
- Moriasi, D.N.; King, K.W.; Bosch, D.D.; Bjorneberg, D.L.; Teet, S.B.; Guzman, J.A.; Williams, M.R. Framework to parameterize and validate APEX to support deployment of the nutrient tracking tool. Agric. Water Manag. 2016, 177, 146–164. [Google Scholar] [CrossRef] [Scilit]
- Guo, T.; Confesor, R., Jr.; Saleh, A.; King, K. Crop growth, hydrology, and water quality dynamics in agricultural fields across the Western Lake Erie Basin: Multi-site verification of the Nutrient Tracking Tool (NTT). Sci. Total Environ. 2020, 726, 138485. [Google Scholar] [CrossRef] [Scilit] [PubMed]
- Nelson, A.M.; Moriasi, D.N.; Talebizadeh, M.; Tadesse, H.K.; Steiner, J.L.; Gowda, P.H.; Starks, P.J. Comparing the Effects of Inputs for NTT and ArcAPEX Interfaces on Model Outputs and Simulation Performance. J. Water Resour. Prot. 2019, 11, 554–580. [Google Scholar] [CrossRef]
- Burnett, J.R. Validation and Verification of the Nutrient Tracking Tool for Yakima County, Washington; Tarleton State University: Stephenville, TX, USA, 2015. [Google Scholar]
- Pawlowski, E.D.; Karwan, D.L.; Kolka, R.K. Assessing nutrient and sediment load reduction potential of vegetation by utilizing the nutrient tracking tool at the field and watershed scale in a Great Lakes priority watershed. J. Soils Sediments 2023, 23, 2905–2921. [Google Scholar] [CrossRef] [Scilit]
- Keller, A.A.; Fox, J. Giving credit to reforestation for water quality benefits. PLoS ONE 2019, 14, e0217756. [Google Scholar] [CrossRef] [Scilit] [PubMed]
- Al-Kaisi, M.; Kwaw-Mensah, D. Effect of Tillage and Nitrogen Rate on Corn Yield and Nitrogen and Phosphorus Uptake in a Corn-Soybean Rotation. Agron. J. 2007, 99, 1548–1558. [Google Scholar] [CrossRef] [Scilit]
- Halvorson, A.D.; Mosier, A.R.; Reule, C.A.; Bausch, W.C. Nitrogen and tillage effects on irrigated continuous corn yields. Agron. J. 2006, 98, 63–71. [Google Scholar] [CrossRef] [Scilit]
- Lamm, F.R.; Aiken, R.M.; Kheira, A.A. Corn yield and water use characteristics as affected by tillage, plant density, and irrigation. Trans. ASABE 2009, 52, 133–143. [Google Scholar] [CrossRef] [Scilit]

Disclaimer/Publisher’s Note: The statements, opinions and data contained in all publications are solely those of the individual author(s) and contributor(s) and not of MDPI and/or the editor(s). MDPI and/or the editor(s) disclaim responsibility for any injury to people or property resulting from any ideas, methods, instructions or products referred to in the content. |
© 2026 by the authors. Licensee MDPI, Basel, Switzerland. This article is an open access article distributed under the terms and conditions of the Creative Commons Attribution (CC BY) license.