


Abstract
Recent first principles simulation of the Raman spectral intensity of a bis(ethylenedithio)-tetrathiafulvalene (BEDT-TTF or ET) singly charged dimer suggested that the very important C=C stretching region of a κ-phase BEDT-TTF salt needs a reinterpretation. In fact, the possible presence of the out-of-phase coupled infrared active C=C anti-symmetric stretching b1uν27 did not receive the proper attention Here, the comparison of the calculated Raman spectra of ET+ cation with those of a doubly charged dimer, (ET)22+, shows that in a dimer, not only the C=C stretching modes but also anti-symmetric C-S stretching and ring breathing b1u modes show Raman intensity comparable to that of the corresponding totally symmetric phonons. The calculations are validated through the comparison with the experimental Raman spectra of two charge-transfer salts, (ET)2[Re2Cl8] and (ET)2[Re2Br6CH3COO]0.5(C2H3Cl3), in which the ET molecules form almost isolated centrosymmetric (ET)22+ dimers. We also present the Raman spectra of a well-known ET salt, κ-(ET)2Cu[N(CN)2]Br (κ-CuBr), the experiment being performed on the rarely investigated (101) crystal face. The comparison with the Raman calculations on a singly charged ET dimer oriented as in the κ-CuBr salt allows us to clearly identify the out-of-phase coupled b1u phonons, yielding a reliable interpretation of the most important (ET)2+ spectral regions, i.e., the C=C and C-S stretching, and the ring breathing ones. The present results constitute a reliable basis for the interpretation of the Raman spectra of ET crystals characterized by the presence of isolated or almost isolated singly or doubly charged ET dimers.
1. Introduction
Since the discovery of superconductivity in its iodide salts [1], the organic donor molecule bis(ethylenedithio)-tetrathiafulvalene (BEDT-TTF or ET) occupies a prominent role in the field of molecular materials [2,3]. Most of the salts exhibit 2:1 stoichiometry with closed-shell counter-anions (i.e., formally +0.5e charge per ET molecule), and the ET donors are usually arranged in two-dimensional conducting layers alternating with insulating acceptor layers. Inside the layers, the ET molecules are arranged in various patterns described by Greek letters: α, β, θ, κ … [4,5].
In many salts, the ET molecules are grouped in dimers, isolated like in the (ET)22+[Mo6O19] salt [6], or weakly interacting, like in the so-called κ-phase salts, where the layers of ET molecules form (ET)2+ dimers oriented perpendicularly to each other in a chessboard pattern [5]. The dimer approach is quite naturally used to model the complex physics of ET salts, particularly for the just-mentioned κ-phase [7], the one that has attracted most attention since it exhibits a plethora of intriguing phenomena such as unconventional superconductivity, Mott metal–insulator transition, etc. [2,3]. A dimer model has also been used for the analysis of the coupling of electrons with intra-molecular vibrations (e-mv coupling) [6,8,9], and the model has indeed been often used for the analysis of the spectra of many other organic charge-transfer (CT) salts based on different donors like TMTTF and TMTSF [10,11] or acceptors like Ni(dmit)2 [12] and TCNQ [13,14,15].
The presence of mobile, low-energy electrons implies important electron-phonon coupling, and its relevance for the unusual physical properties of ET salts cannot be underestimated [3,16,17]. In addition to the characterization of e-mv coupling, vibrational spectroscopy is a valid and rather precise method to estimate the average charge on the molecular units, based on phonon frequency shift upon charge variation. For these reasons, a lot of effort has been devoted to the full characterization of ET complex vibrational spectra, starting with the pioneering experiments and calculations by Kozlov and co-workers [18,19]. To simplify the analysis, the empirical calculations, the spectral assignments, and the mode labeling were based on the D2h symmetry of the tetrathiafulvalene (TTF) planar central skeleton, whose vibrations are the most coupled to electrons and display important frequency lowering upon ionization [20]. This simplification ended up introducing some confusion in the overall assignment of the modes, as the classification and associated selection rules are more stringent than in the D2 lower symmetry induced by the position of the CH2-CH2 end groups [9]. On the other hand, Kozlov et al.’s papers provided a reliable starting basis for subsequent work, both experimental [20,21] and computational [9,20,22].
From the above-cited literature, it seemed that the interpretation of the vibrational spectra of ET salts was settled, with particular reference to the C=C stretching region, where two totally symmetric modes are expected in Raman spectra (ag ν2 and ν3 in Kozlov’s D2h labeling), and one anti-symmetric stretching (b1uν27) in infrared (IR) spectra. But recent calculations of the Raman intensities of a symmetric dimer (ET)2+ showed, rather surprisingly, that three bands, not two, have to be expected: the in-phase (i-ph) coupling of agν2 and agν3 of the monomer, and the out-of-phase (o-ph) coupling of b1uν27 [22]. Of course, this is just what is predicted by vibrational selection rules, but since only two intense bands were observed in the relevant spectral region, researchers assumed that the intensity of o-ph b1uν27 was small. On the opposite, according to calculations, the Raman intensity of o-ph b1uν27 is the highest, and obscures the presence of the nearby agν3, which appears as a shoulder of the main band. The calculations have been compared with the experimental spectra of one κ-phase salt, κ-(ET)2Hg(SCN)2Cl in the C=C spectral region [22]. The spectra are polarized and of high quality, but of course, a single comparison does not constitute an unquestionable proof of the validity of the calculations: the shoulder visible in the spectra might be due to a Davydov splitting (there are two ET dimers in the unit cell), or resonance Raman effects might be at stake. To confirm and extend the above finding, in this paper, we present calculations and experiments relevant to the full Raman spectra of the doubly charged and singly charged ET dimers, as well as calculations for the isolated ET+ cation. We show that o-ph b1uν27 is not the only vibration showing intensity comparable to the totally symmetric i-ph phonons: other in-plane modes involving the central TTF core also do. In this way, a complete and reliable interpretation of Raman spectra of singly and doubly charged BEDT-TTF dimers is achieved.
2. Methods and Materials
Quantum chemical calculations have been performed with the ORCA package [23,24], version 6.1, using DFT-B3LYP, and the 6-31G(d) basis set, following the previously adopted protocol [9,22]. The initial dimer geometry was taken from the 10 K structure of κ-(ET)2Hg(SCN)2Cl [25], imposing the D2 geometry for the ET+ ion radical, and the inversion symmetry to (ET)2 singly and doubly charged dimers, so the charge is equally shared between the two molecules. The calculations are relevant to an isolated (gas-phase) molecule, so that the starting geometry has little influence on the convergence to the final equilibrium position for the vibrational part. No imaginary frequencies appeared, but since the computed equilibrium geometry is different from that in the solid state, low-frequency modes have to be evaluated with care.
For the interpretation of the Raman spectra of (ET)22+ dimers, we have chosen to reanalyze the Raman spectra of two CT salts: (ET)2[Re2Cl8] (ReCl salt) and (ET)2[Re2Br6CH3COO]0.5(C2H3Cl3) (ReBr salt). The donor molecules in both salts are arranged into almost isolated centro-symmetrical (ET)22+ dimers. Details about sample preparation, crystal structures, and spectra collection can be found in the original literature [26,27,28]. The IR spectra of the powders of ReCl salt dispersed in a KBr pellet have been collected using an Equinox 55 FT-IR spectrometer (Bruker Optics, Ettlingen, Germany.)
For a complete analysis of the spectra of singly ionized (ET)2+, we focus on the Raman spectra of a well-known and widely investigated compound κ-(ET)2Cu[N(CN)2]Br (κ-CuBr salt) [21,29,30,31,32,33,34], in which the dimers (ET)2+ in the conducting two-dimensional layers are perpendicular to each other. As we shall detail in Section 3.3, we extend the measurements to the full spectral range of both κ-CuBr and its fully deuterated analog, using the less studied (101) face with 780 nm excitation and in the 298-10 K temperature range. The samples were prepared as described elsewhere [21], and the spectra were measured in backscattering geometry with a Ramascope System-1000 (Renishaw, Woodchester, UK) with a spectral resolution of 2 cm−1. To avoid sample damage, the laser beam power was kept to about 0.1 mW, and it was focused on an area with a diameter of about 5 μm. The polarization of the scattered light was not analyzed.
3. Results
3.1. Comparison of the Computed Raman Spectra of ET + and (ET)22+
When two identical molecules associate to form a symmetric Ci dimer, all the single-molecule vibrations couple in-phase and out-of-phase, and become active in Raman spectra and IR spectra (cf. Table I of Ref. [22]). With reference to the D2h symmetry of the TTF core, the o-ph coupled gerade modes become IR-active (and the ag modes give rise to the strong IR bands due to the e-mv coupling [8]) and the o-ph ungerade ones become Raman-active. Up to now, the possible presence of the latter in the Raman spectra of ET dimers has not received due attention.
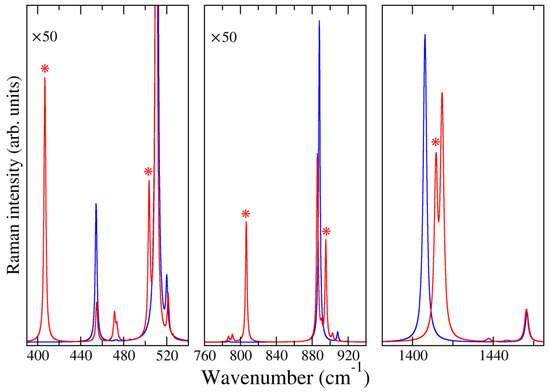
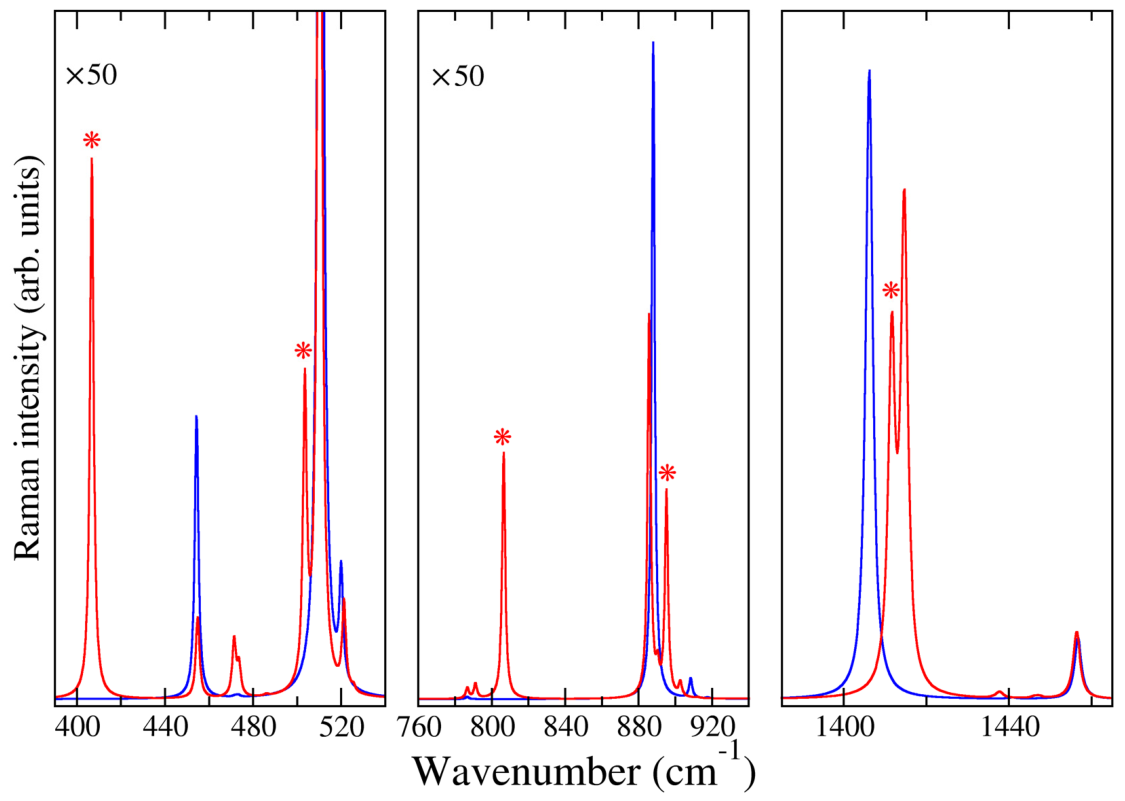
In Figure 1, we report the computed Raman spectra of isolated ET+ and (ET)22+. The comparison allows us to identify the o-ph phonons of the dimer, obviously not present in the monomer spectra. The vibrations relevant to CH stretching or bending are not considered, and we report only spectral regions where bands due to the dimer have intensity comparable to that of corresponding monomer vibrations. We identify five dimer bands, marked with an asterisk in Figure 1.
Figure 1.
Calculated Raman spectra of ET+ (blue curve) and (ET)22+ (red curve). The bands are simulated by Lorentzians of 0.5 cm−1 bandwidth to allow clear identification of quasi-degenerate vibrations. Raman intensity is in arbitrary units, but the scale of the leftmost and central panels is enlarged by 50 times with respect to that of the rightmost panel reporting the very intense C=C stretching vibrations. The new dimer bands, whose eigenvectors are reported in Figure 2, are identified by asterisks.
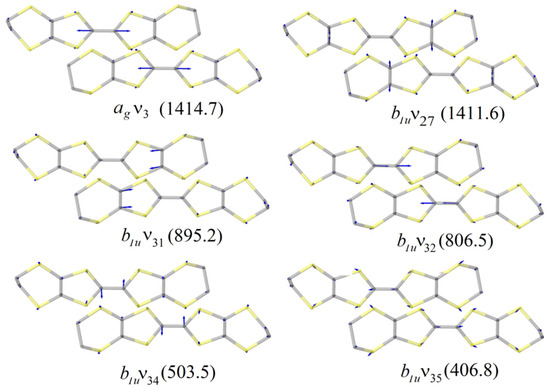
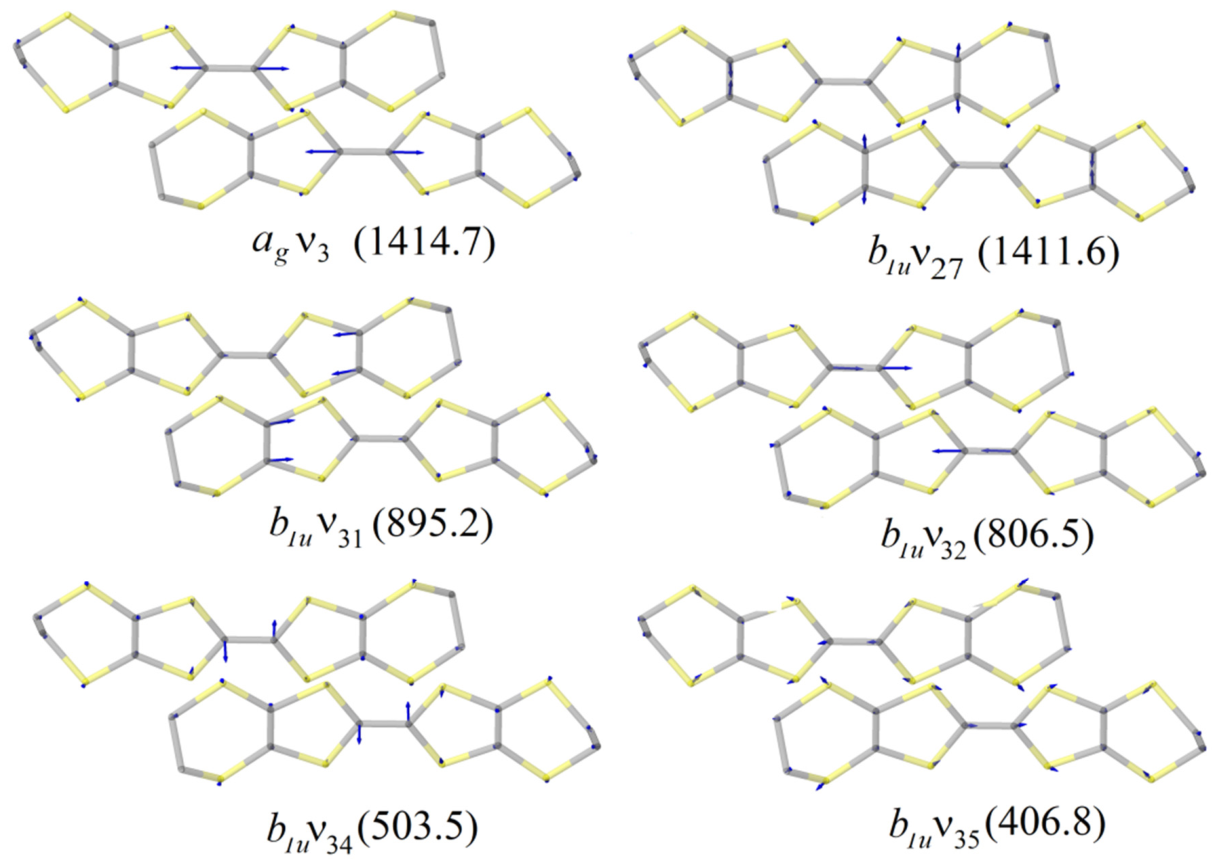
Figure 2 reports the eigenvectors relevant to the five extra Raman bands marked with an asterisk in the previous Figure 1. All the vibrational motions mostly occur in the plane defined by the central TTF core, implying C=C stretching, ring breathing, etc., so we label them following Kozlov’s scheme that adopts the D2h symmetry. However, it has to be kept in mind that some mixing with out-of-plane vibrations may occur (e.g., the b1uν34 in Figure 2) since no symmetry constraints except the Ci are imposed on the dimer calculations. In the following, wherever it is necessary to avoid confusion, we shall add the D2 labeling [9] in parentheses. From Figure 2, it is seen that the important Raman intensity can be ascribed to the charge oscillation induced by the planar core vibrations along the long axis of the molecule.
Figure 2.
Vibrational eigenvectors for the five o-ph coupled b1u modes showing appreciable Raman intensity. The corresponding computed frequencies (in wavenumbers) are reported in parentheses. The eigenvectors of the i-ph coupled agν3 are also shown, since this mode is quasi-degenerate with o-ph b1uν27, and there may be mode mixing. Hydrogen atoms are omitted for clarity.
3.2. Analysis of the Raman Spectra of ET Salts with Well-Isolated (ET)22+ Dimers
The crystal structures of ReCl and ReBr salts we are going to analyze are different: ReCl crystallizes in the monoclinic system, space group P-1, with two inequivalent (ET)22+ dimers in the unit cell, whereas ReBr crystallizes in the orthorhombic system, space group I 2/a, with eight equivalent dimers in the unit cell [26,27]. However, in both cases, the dimers are well separated by the Re-containing anions, i.e., the interdimer interaction is very small, and the spectra can be assimilated to those of isolated (ET)22+, in a manner analogous to what is done in the case of (ET)2[Mo6O19] salt [6].
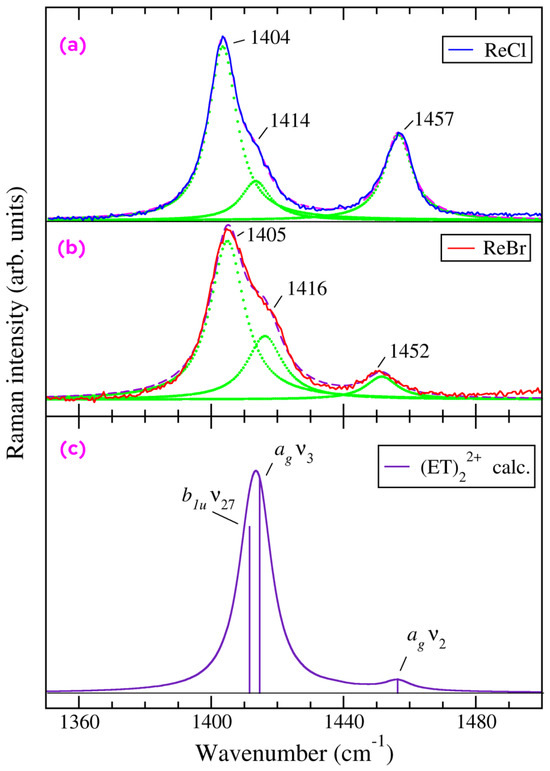
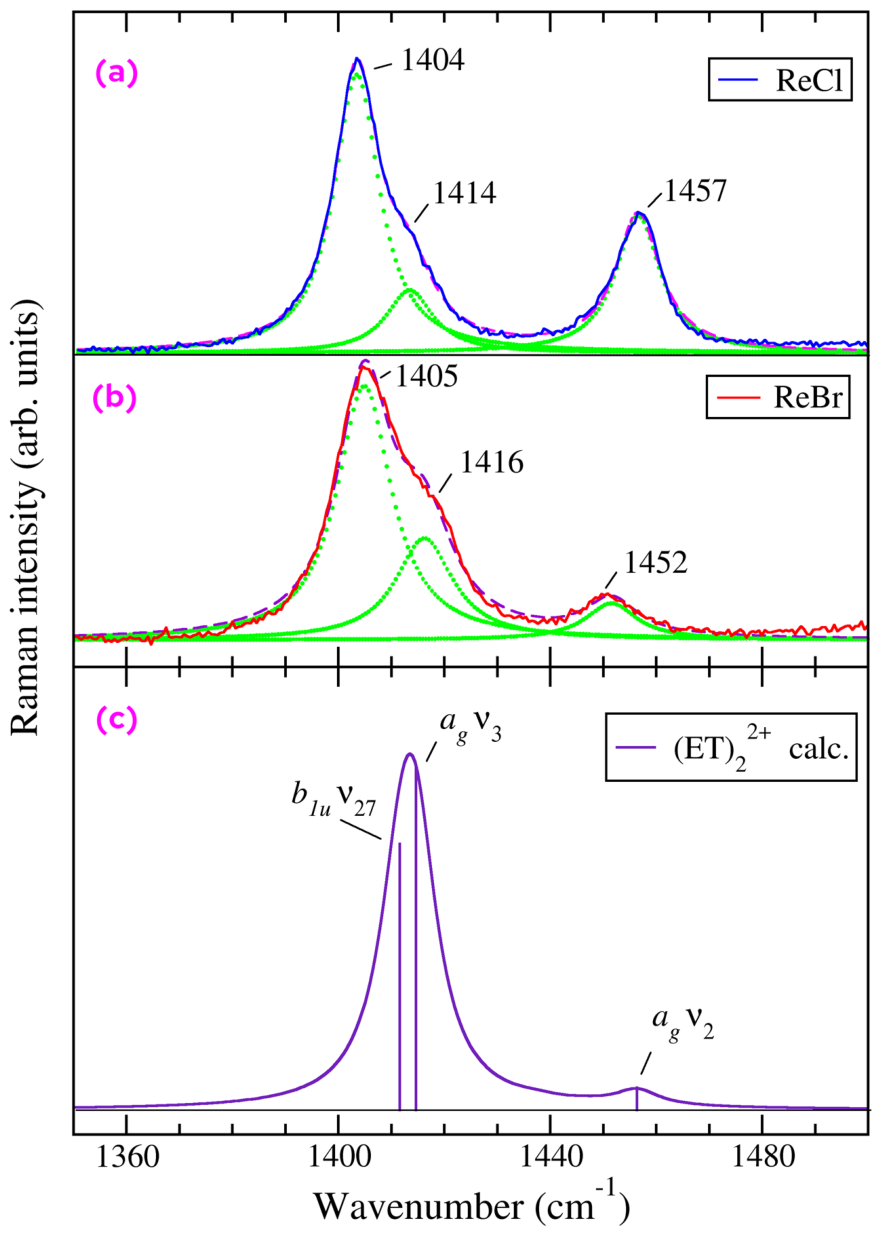
The room-temperature unpolarized Raman spectra of ReCl and ReBr salts (excitation λexc = 488 nm) in the region of C=C stretching are displayed in Figure 3a,b. In both cases, a clear shoulder is present on the high-frequency side of the most intense band, which has been left unassigned in Ref. [28]. From a band deconvolution (green dots in Figure 3), the frequency difference between the band and its shoulder is about 10 cm−1 in both salts, with a bandwidth of about 5 cm−1. Figure 3c reports the calculated spectra, where, to better simulate the experiment, we have used Lorentzians with a bandwidth of 5 cm−1. Vertical lines indicate the phonon frequency and Raman relative intensity.
Figure 3.
Raman spectra in the region of C=C stretching vibrations. Panels (a,b): Room temperature experimental spectra (excitation line: λexc = 488 nm) of (ET)2[Re2Cl8] (ReCl salt) and (ET)2[Re2Br6CH3COO]0.5(C2H3Cl3) (ReBr salt), respectively. Spectral deconvolution is shown by green dots. Adapted from Ref. [28]. Panel (c): Calculated Raman spectra of (ET)22+. The bands are Lorentzians centered at the calculated frequencies (vertical lines), with a bandwidth comparable to the experiment. Experimental frequencies (in cm−1) and mode assignment are also shown.
Despite the above-mentioned difference in the unit cell, the spectra of ReCl and ReBr appear very similar. We see three bands: a medium intensity one at 1457 cm−1 (1452 cm−1 in the Br salt), due to the i-ph agν2 mode, and a strong one at 1404 cm−1 (1405 cm−1 in the Br salt) with a shoulder at 1414 cm−1 (1416 cm−1 in ReBr), which we assign to the o-ph b1uν27 and i-ph agν3 modes of the dimer, respectively. The same three-band pattern is observed (albeit with some difference in relative intensities due to resonance effects) by changing the excitation line [28], and also in the (ET)2[Mo6O19] salt [6], whose deconvoluted spectrum (digitized from the original figure) is reported in Figure S1 of Supplementary Materials.
As in the case of singly charged (ET)2+ dimer [22], for the double-charged (ET)22+ dimer, the calculated o-ph b1uν27 frequency is lower than that of i-ph agν3, but its calculated intensity is comparable, whereas for (ET)2+ dimer, the o-ph b1uν27 is by far the most intense. On the other hand, we have to keep in mind that the two modes are very close in frequency (only 3 cm−1 in the calculation, cf. Figure 2) and mixing and intensity borrowing are likely to occur. Therefore, it is inappropriate to choose between the two alternative assignments on the basis of the calculated frequencies and intensities, a question relatively unimportant at this stage—we have just chosen the most plausible. On the other hand, the present data definitely demonstrate the presence of the o-ph b1uν27 together with the agν3 (and of course of the agν2) in the Raman spectra of strongly dimerized ET salts.
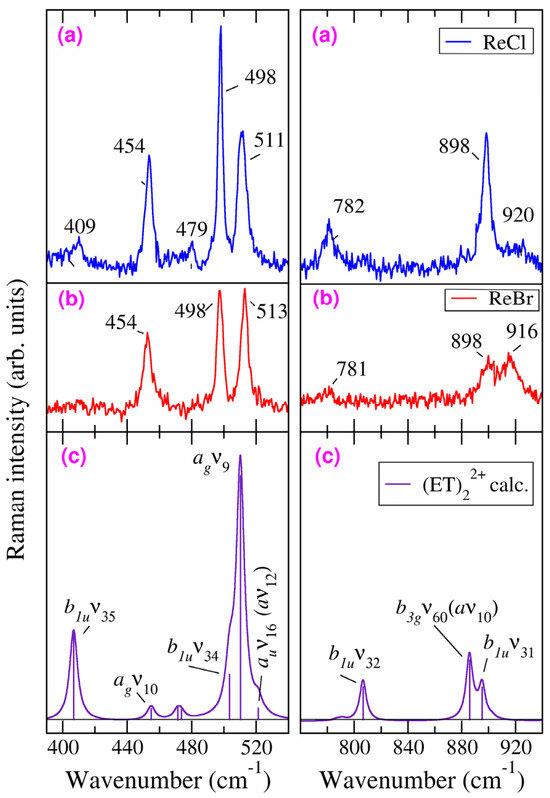
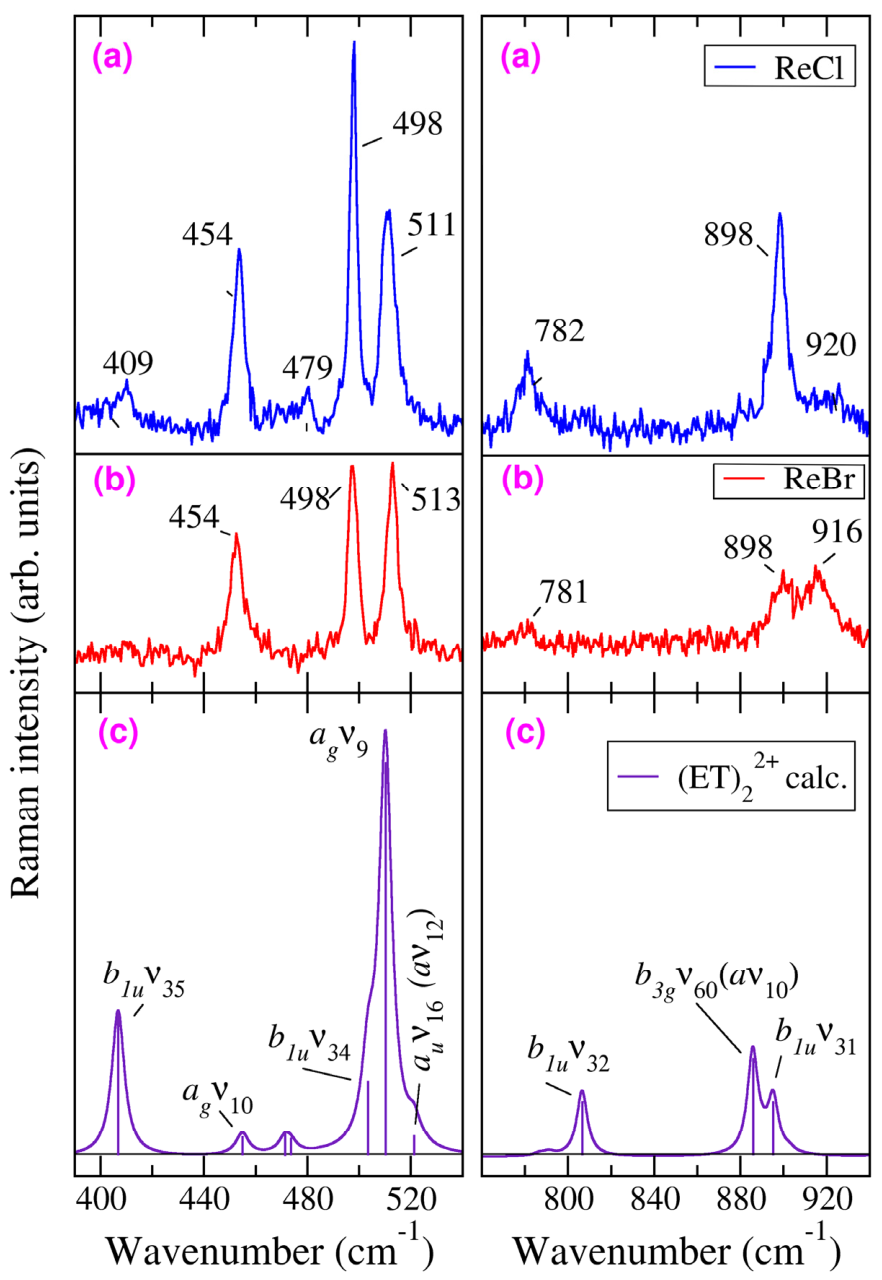
We now turn attention to the far less investigated ring breathing and C-S stretching spectral regions, namely the 940–760 cm−1 and the 540–390 cm−1, respectively. The relevant experimental room-temperature ReCl and ReBr Raman spectra are reported in Figure 4a,b. We have chosen the blue excitation (λexc = 488 nm) to avoid the resonance effects with the anions [28]. The calculated dimer spectrum is reported in the bottom panels of the figure. In both experiment and calculation, the spectral intensity is far weaker than that relevant to the C=C stretching region, but in any case the detected bands—with the exception of the very weak band at 479 cm−1, that we attribute to the b2g ν40 (b2ν48 in D2 symmetry [9])—can be associated either to i-ph coupling of totally symmetric ag modes, or to o-ph coupling of b1u modes. In particular, for ReCl salt, the 511 and 454 cm−1 bands are associated with ag modes, whereas the 920, 782, 498, and 409 cm−1 bands are assigned to modes b1uν31, b1uν32, b1uν34, and b1uν35, respectively. The experimental frequency of the bands that we assign to b1uν32 is rather different from the calculation (781 vs. 807 cm−1), but the calculation does not predict any other band in the relevant spectral region. Furthermore, as we have mentioned in Section 2, the calculated equilibrium geometry is not the one in the crystal, and this may have a role in the discrepancy. Finally, a particular mention can be reserved for the 898 cm−1 band, which puzzled the researchers, since it appeared coupled to the electronic system, despite the fact that in D2h symmetry, it was attributed to a non-totally symmetric species (b3gν60) [30,31,32,33,34]. The puzzle has been solved by calculations and experiments showing that the vibrational motion also involves the lateral CH2-CH2 wings [9,35], and therefore, it is better to be classified in terms of the D2 symmetry (aν10).
Figure 4.
Room-temperature Raman spectra of ReCl (panels (a)) and ReBr (panels (b)) in the 390–540 cm−1 and 760–940 cm−1 spectral regions, where the b1u o-ph coupled modes are expected (cf. Figure 1 and Figure 2). Adapted from Ref. [28]. Exciting line: 488 nm. The experimental phonon frequencies are in wavenumbers. Panels (c): calculated Raman spectra of (ET)22+, with corresponding assignment.
Therefore, by taking into account the presence of o-ph b1u modes, we have reached a satisfactory and rather complete reinterpretation of the published Raman spectra of ReCl and ReBr [28]. For completeness, we report and shortly discuss in Supplementary Materials (Section S2) the unpublished IR spectra of ReCl powders dispersed in a KBr matrix.
3.3. Analysis of the Raman Spectra of κ-Phase ET Salts
We now turn our attention to the spectra of κ-phase ET salts, where (ET)2+ dimers are present, arranged in a chessboard pattern. In this case, the dimers are not as isolated as in the case of (ET)22+ dimers in the ReCl and ReBr salts, discussed in Section 3.2. Nevertheless, the effects of inter-dimer interaction can be disregarded or dealt with as a perturbation, and its analysis becomes important when inter-dimer e-mv coupling is involved [22]. In this paper, we shall present and interpret the Raman spectra of κ-(ET)2Cu[N(CN)2]Br (κ-CuBr). Several vibrational studies of this salts have already appeared [21,29,30,31,32,33,34], so it would seem that very little can be added. However, most of the studies collected the spectrum from the most developed crystal face (010) (or ac), and, apart from the pioneering work by Eldridge et al. [29,30,31,32,33], were not aimed at obtaining an exhaustive interpretation of the spectra, but focused on particular aspects, most notably on the e-mv coupled modes and on the analysis of the C=C stretching spectral region. A deep Raman analysis of the latter spectral region has been reported by Maksimuk et al. [21], with the use of different laser excitations and isotopically substituted ET, but still lacking the fundamental help provided by calculations of the Raman intensities. Here, we shall compare calculations with extended Raman spectra of κ-CuBr and its fully deuterated analog, κ-CuBr[d8], collected on the less studied (101) crystal face. The spectra have been recorded as a function of temperature down to 10 K and using the far-red excitation λexc = 780 nm, to avoid as much as possible resonance effects, which may be confusing, notably in making comparison with calculations relevant to normal, non-resonance Raman.
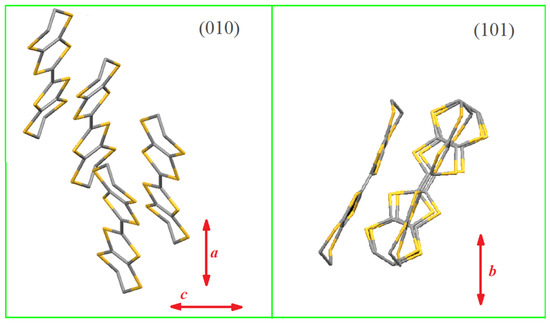
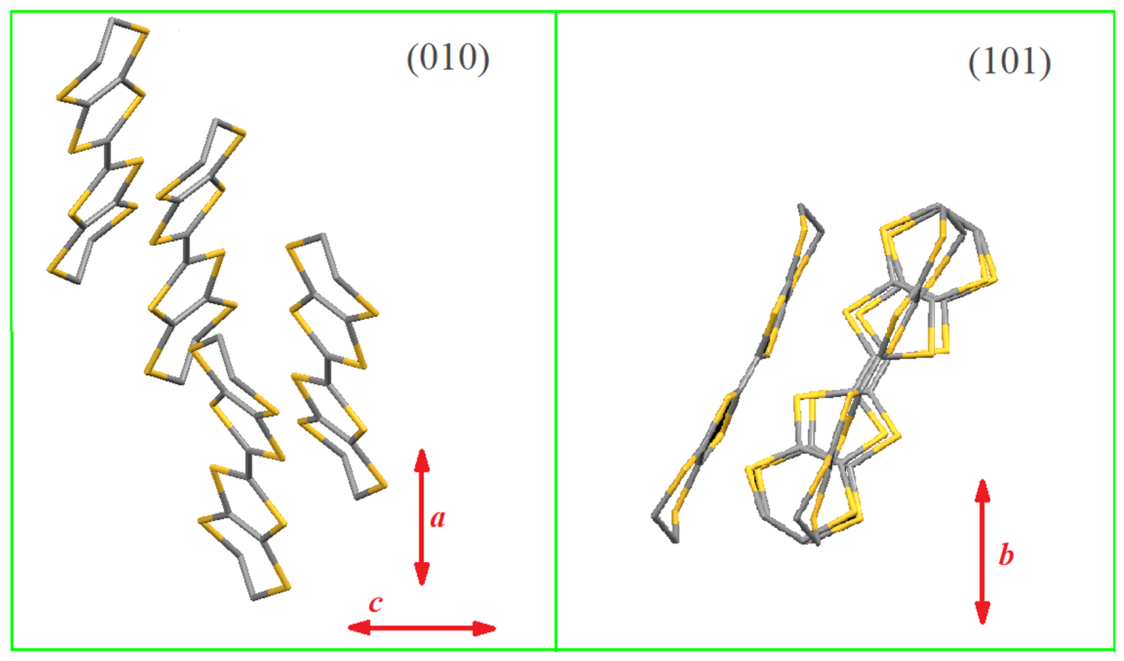
The κ-CuBr salt crystallizes in the orthorhombic system, Pnma, with four dimers in the unit cell (CCDC 1185003). In order to understand the difference in the information gathered by collecting the Raman from different crystal faces, we show in Figure 5 the orientation of two ET dimers (the other two are in a parallel layer, separated by the counterions) with respect to the ac face and with respect to the (101) face. The direction of the laser/collection polarization is also indicated. The figure shows that when the (010) plane is used, the ET long molecular axes are almost perpendicular to the light polarization directions a and c, whereas when the investigated plane is (101), the long molecular axes are roughly directed along the b polarization. Therefore, the information gathered from the two crystal faces complements each other.
Figure 5.
The crystal structure of κ-CuBr viewed from the direction of the backscattering Raman geometry, i.e., perpendicular to the (010) and (101) crystal faces ((left) and (right) panels, respectively). The H atoms of ET are omitted or clarity. The directions of the laser polarizations, which are along the crystal axes, are indicated by the red double arrows. Structure from CCDC 1185003.
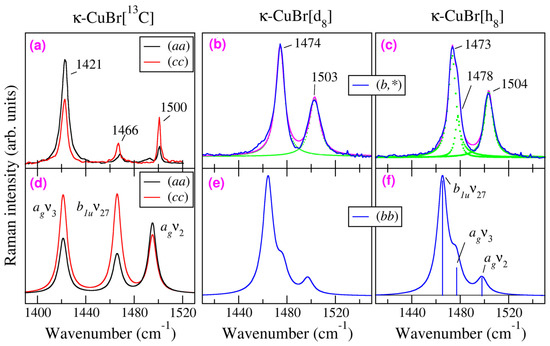
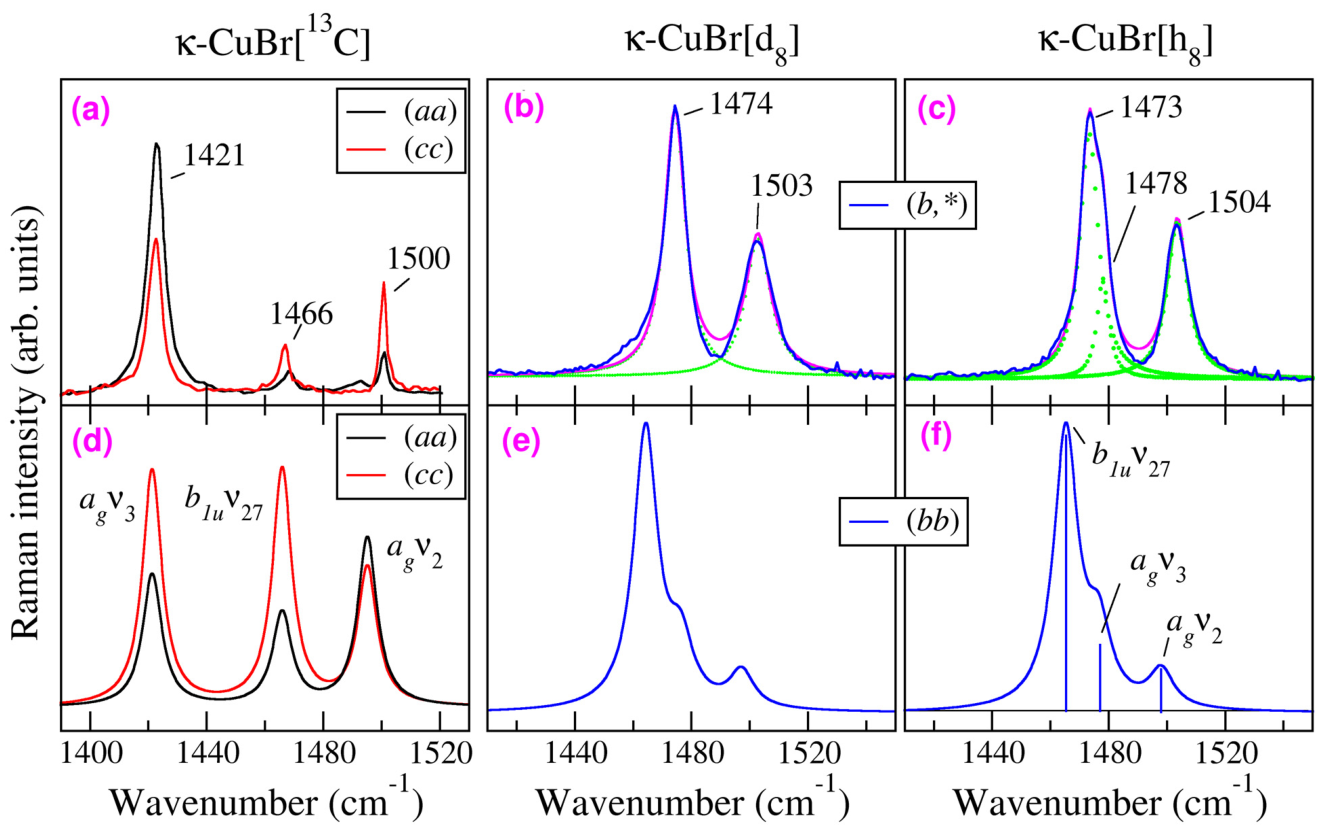
Figure 6 compares the experimental and calculated spectra in the C=C stretching spectral region. Panels (b) and (c) report the experimental spectra of fully deuterated and pristine κ-CuBr, collected at 120 K from the (101) crystal face, incident 780 nm laser with polarization along the b crystal axis, and no polarization analyzer for the scattered light, which therefore is a mixture of (bb), (ab), and (bc) Raman polarizability components. The full temperature dependence of pristine and fully deuterated κ-CuBr is reported in the Supplementary Materials. We have chosen to report in the main paper only the 120 K spectrum because at this temperature in the pristine κ-CuBr, the overlap of two bands deconvoluted at 1473 and 1478 cm−1 is clearly evident. On the other hand, in the spectrum of the deuterated sample shown in Figure 6, panel (b), the presence of two peaks cannot be hinted at, and although two Lorentzians would give a better fit, we have used only one, assuming complete overlap. The calculation (panels (e) and (f) of the Figure) indeed predicts the overlapping of agν2 and b1uν27 modes [22], with the b1uν27 dominating the spectra. In the calculation, we have chosen for comparison the (bb) polarization, assuming that this polarization is predominant in the experiment, where the polarization of the scattered light has not been analyzed (symbolized by inserting an asterisk in the Figure’s notation).
Figure 6.
Top (a–c) panels: Polarized experimental Raman spectra of pristine and isotopically substituted κ-CuBr in the C=C stretching region. Bottom panels (d–f): Calculated spectra for (ET)2+ oriented dimer. Panels (a,d) on the left compare the calculation with the experimental data (λexc = 633 nm, T = 20 K) reported by Maksimuk et al. [21] for the ac plane of κ-CuBr, with 13C replacing the central double-bond C atoms. The (aa) and (cc) labeling indicates the incident and scattered light polarization in the usual Porto’s notation. The other panels compare the calculations with the Raman spectra from this work for pristine (panel (c)) and fully deuterated (panel (b)) κ-CuBr (λexc = 780 nm, T = 120 K) collected on the (101) crystal face with incident laser light polarized along the b crystal axis and no polarization analyzer. The deconvolution of the experimental spectra is shown as green dots; the resulting sum is shown by a magenta line over the blue lines of the experiment. The top panel frequencies are in wavenumber.
A confirmation of the assignment reported in the bottom panels of Figure 6 is given by the comparison of calculations with the literature spectrum of κ-CuBr, where the C atoms of the central C=C bond have been substituted by 13C isotope (κ-CuBr [13C]) [21]. The experimental spectra, reported in Figure 6, panel (a), have been recorded on the ac face only, and we selected the diagonal polarizations (aa) and (cc) obtained with red excitation (633 nm), the most similar to our excitation for the (101) face. The isotopic substitution lowers the frequency of the agν3 mode, decoupling it from agν2 and b1uν27, involving the lateral C=C, and the calculation reported in panel (d) shows that the intensity of the three bands is similar, as in the experiment. So, we can safely assign the band at 1466 cm−1 to the o-ph b1uν27, confirming the tentative assignment of Ref. [21].
The reason for the qualitatively different relative intensity of the three C=C stretching bands in the ac and (101) Raman spectra derives from the mentioned decoupling of agν3 mode, with consequent change in the eigenvectors: in the κ-CuBr [13C] salt, the o-ph b1uν27 Raman polarizability becomes predominantly along the ET long molecular axis [22], perpendicular to the ac plane (Figure 5). In the Supplementary Materials (Figure S3), we compare the calculated spectra relevant to the ac and (101) planes, showing that in the former case, the o-ph b1uν27 intensity is strongly attenuated, whereas it dominates the spectra polarized along the b crystal axis or the unpolarized spectra. On the other hand, Figure S3 also shows that in pristine κ-CuBr, the o-ph b1uν27 stretching is the strongest band also in the ac spectra, obscuring almost completely the nearby i-ph agν3. Thus, the analysis of the κ-CuBr [13C] spectra in light of the dimer calculations indirectly confirms the assignment of the o-ph b1uν27 mode as the strongest band in the pristine salt.
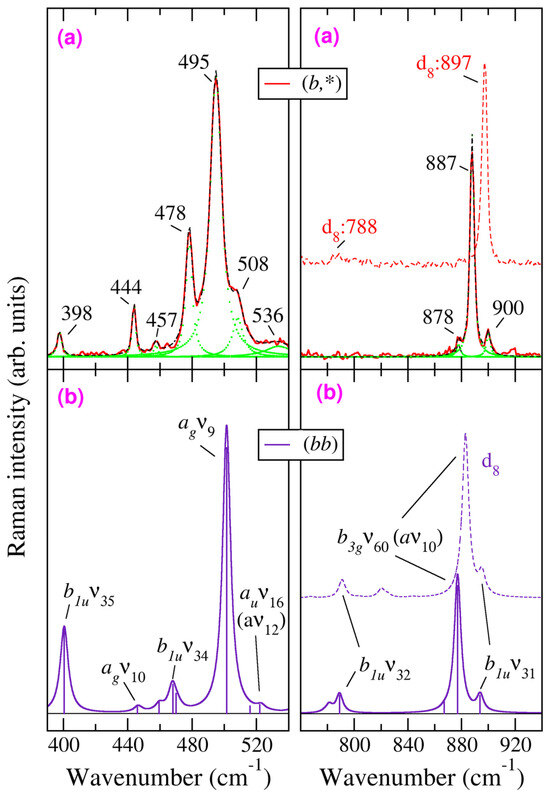
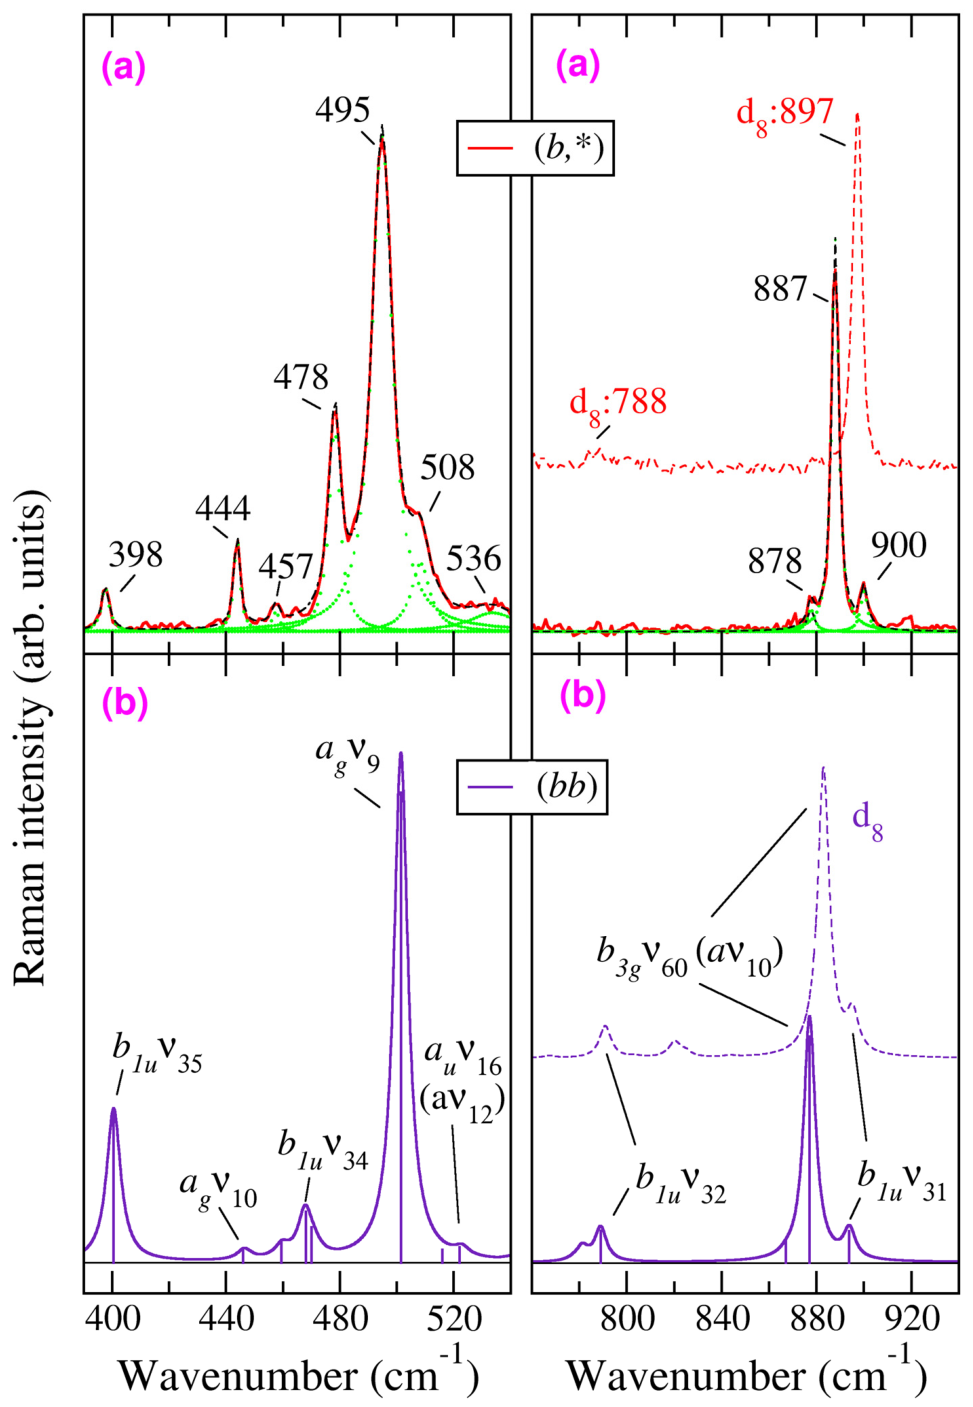
Raman spectra of κ-CuBr salt within the region of ring breathing and C-S stretching spectral regions are presented in Figure 7, where, as in the previous figures, the top panels report the experiment and the bottom panels the calculation. The right panels also show the spectra of the fully deuterated κ-CuBr salt to evidence the upward 10 cm−1 frequency shift of the b3gν60 (aν10) vibration, reproduced in the calculation. As already mentioned above, the 887 cm−1 band attracted much attention since it is e-mv coupled to the electronic system and is sensitive to chemical and physical tuning [32,33,34]. These properties appeared anomalous in a classification and normal coordinated analysis based on the planar D2h symmetry [18,19], but phonon calculations in terms of the proper D2 molecular symmetry showed that this mode involves both the central TTF skeleton and the CH2-CH2 lateral wings, fully explaining the origin of the apparent anomalies [9]. In the 390–540 cm−1 spectral region, the deuterated sample spectra essentially overlap those of the pristine compound and are omitted in Figure 7. The full temperature dependence of Raman spectra of κ-CuBr and its deuterated analog is reported in the Supplementary Materials.
Figure 7.
Comparison of κ-CuBr 120 K experimental spectra (top (a) panels) with the calculation relevant to an oriented (ET)2+ dimer (bottom (b) panels) in the 390–540 and 760–940 cm−1 spectral regions. Line colors and symbols are as in Figure 6. In the right (a,b) panels, we have also reported with dashed lines the spectra of fully deuterated κ-CuBr salt, to put in evidence the upward shift of the b3gν60 (aν10) mode. The deuterated salt spectra are not reported in the left panels (390–540 cm−1 region) as they overlap with the ones of the pristine salt.
The proposed assignment of the b1u and ag modes descends directly from the comparison of the upper and lower panels of Figure 7, whereas the overall assignment of (ET)22+ and (ET)2+ Raman spectra is reported in Table 1 of the next section. Here, we comment only on the two bands appearing at 478 and 508 cm−1 besides the strong ag ν9 mode at 495 cm−1. We associate the former with the b1uν34 vibration despite the appreciable frequency difference between calculation and experiment, since, as we mentioned in the previous section in discussing the analogous discrepancy for the b1uν32 mode, the calculated equilibrium geometry is not the one in the crystal, and this may have a role in this spectral region. On the other hand, at room temperature, the 508 cm−1 band is fully masked by the agν9, and it becomes evident as a shoulder when the main band narrows due to temperature lowering. We assign it to the au ν16 mode, which is an out-of-plane vibration. It should be Raman-inactive in D2h symmetry, but again it is actually a Raman-active mode in the proper D2 symmetry (totally symmetric aν12).
Table 1.
Assignment of the main Raman bands of singly and doubly occupied BEDT-TTF dimers. Frequencies in cm−1.
4. Discussion and Conclusions
Table 1 collects the achieved interpretation of the Raman spectra of singly and doubly charged ET dimers in the spectral regions of C=C stretching, ring breathing, and C-S stretching. The spectral regions where the CH stretching and bending occur are of minor importance for the characterization of ET e-mv coupling and charge distribution, and easily interpreted on the basis of the available calculations [9]. Even though the adoption of the less stringent and more realistic D2 symmetry is needed for a proper ET spectral interpretation, in this paper, we have chosen to follow the conventional mode labeling based on D2h molecular symmetry. In fact, the main achievement of this paper is the confirmation that in ET dimers o-ph coupled b1u (b1) modes involving the central planar TTF skeleton have Raman intensity comparable to that of the corresponding i-ph coupled ag (a) phonons. This has already been suggested for the most studied C=C stretching region [22], but this finding needed confirmation since it was based on a single example, and the agν3 and b1uν27 are almost degenerate, appearing as a single band with a shoulder. In Section 3.2, we have shown that Raman spectra of almost isolated (ET)22+ dimers in ReBr and ReCl exhibit the same pattern of a single band with a shoulder (Figure 3), irrespective of the number of dimers per unit cell, hence excluding Davydov effects. Moreover, calculations on an isolated (ET)2+ dimer oriented as in the widely studied κ-CuBr crystal demonstrate that in the spectra of the most investigated ac crystal plane, the o-ph b1uν27 is weakened, since its Raman polarization is mainly along the ET long axis, perpendicular to such plane (Figure 5 and Figure 6, leftmost panels). On the other hand, many o-ph b1u modes (not only the ν27) are particularly evident in the Raman spectra presented here on the (010) face (Figure 5 and Figure S3), which allows the straightforward assignment reported in Table 1.
Assessing the role of o-ph b1u modes is particularly important for the correct interpretation of the complex C-S stretching region (350–550 cm−1), where notable e-mv coupled modes are found, which so far have not been exhaustively analyzed due to the fact that the possible presence of b1u modes was overlooked. We stress that such a result has been achieved by standard calculations of isolated dimers, avoiding the complexity of a computation for the whole crystal. Indeed, a mixed approach (crystal calculation for the lattice modes, and molecular calculation for intramolecular ones) has been recently suggested for accurate and efficient phonon calculations in molecular crystals [35]. Of course, the dimer approach may not be suitable to model the phonon structure in the case of different packing of the ET layer, like in the so-called β or θ phases, where dimeric units are less isolated or not present [4,5].
Supplementary Materials
The following supporting information can be downloaded at: https://www.mdpi.com/article/10.3390/cryst16060369/s1, Section S1: Raman spectrum of (ET)2[Mo6O19] in the C=C stretching region. Section S2: Assignment of the main IR bands of ReCl salt. Section S3: Simulated polarized Raman spectra in the C=C stretching region for the 13C-substituted and pristine (ET)2+ dimer oriented as in κ-CuBr crystal. Section S4: Temperature dependence of the Raman spectra of κ-CuBr salt; Section S5: Temperature dependence of Raman spectra of fully deuterated κ-CuBr. Table S1. Assignment of the main totally symmetric and b1u Raman and IR bans of ReCl and ETMo. Figure S1. Deconvoluted Raman spectrum of (ET)2[Mo6O19] in the C=C stretching region, evidencing the shoulder on the high frequency side of the band at 1414 cm−1. The spectrum has been digitized from Ref. [6]. Figure S2. Room-temperature IR absorption spectra of (ET)2[Re2Cl8] (ReCl salt) powders dispersed in KBr pellet within the C-S (a) and C=C (b) stretching regions. Figure S3. Computed Raman spectra of 13C-substituted (left panels) and pristine (right panels) (ET)2+ dimer oriented as in the k-CuBr crystal. Panels (a) and (b), black line: Total Raman intensity. Panels (c) and (d), green line: (bb) polarization. Panels (e) and (f), blue line: (aa) polarization; red line: (cc) polarization. Only the C=C stretching region is shown. The bands are Lorentzians with 3 cm−1 bandwidth. The Raman intensity is arbitrary, but the scale is the same for each polarization of 13C-substituted and pristine (ET)2+ dimer. Figure S4. Temperature dependence of C=C stretching modes in the Raman spectra of κ-(ET)2Cu[N(CN)2]Br (κ-CuBr salt). Figure S5. Temperature dependence of the Raman spectra of salt κ-(ET)2Cu[N(CN)2]Br (κ-Br salt) in the region of ring breathing and C-S stretching modes. Figure S6. Panel (a): Temperature dependence of the Raman spectra of deuterated salt κ-(d8ET)2Cu[N(CN)2]Br (κ-d8Br salt) in the region of C=C stretching modes; panel (b): Band deconvolution at 120 K. Figure S7. Temperature dependence of the Raman spectra of deuterated salt κ-(d8ET)2Cu[N(CN)2]Br (κ-d8Br salt) in the region of C-S stretching modes. Reference [36] is cited in the Supplementary Materials.
Author Contributions
Conceptualization: R.Ś. and A.G.; collection of spectral data: B.B. and R.Ś.; computation: A.G. All authors have read and agreed to the published version of the manuscript.
Funding
This research received no external funding.
Data Availability Statement
The original spectral data and calculations supporting the conclusions of this article are available from the authors on request.
Acknowledgments
One author (R.Ś.) is very grateful to Kyuya Yakushi for cooperation and to Atsushi Kawamoto for the κ-CuBr samples. The Raman studies on the salts were performed at the Institute for Molecular Science in Okazaki (Japan).
Conflicts of Interest
The authors declare no conflicts of interest.
Abbreviations
The following abbreviations are used in this manuscript:
| BEDT-TTF | bis(ethylenedithio)-tetrathiafulvalene |
| CT | charge transfer |
| ET | bis(ethylenedithio)-tetrathiafulvalene |
| i-ph | in-phase |
| IR | infrared |
| κ-CuBr | κ-(BEDT-TTF)2Cu[N(CN)2]Br |
| o-ph | out-of-phase |
| Ni(dmit)2 | Ni(1,3-dithiole-2-thione-4,5-dithiolato)2 |
| ReBr | (ET)2[Re2Br6CH3COO]0.5(C2H3Cl3) |
| ReCl | (ET)2[ReCl6] |
| TCNQ | 7,7,8,8-tetracyano-p-quinodimethane |
| TMTSF | tetramethyl-tetraselenofulvalene |
| TMTTF | tetramethyl-tetrathiafulvalene |
| TTF | tetrathiafulvalene |
References
- Yagubskii, E.B.; Schegolev, I.F.; Laukhin, V.N.; Kononovich, P.A.; Kartsovnik, M.V.; Zvarykina, A.V.; Buravov, L.I. Normal pressure superconductivity in an organic metal (BEDT-TTF)2I3 [bis (ethylene dithiolo) tetrathiofulvalene triiodide]. JETP Lett. 1984, 39, 12–16. [Google Scholar]
- Dressel, M.; Tomić, S. Molecular quantum materials: Electronic phases and charge dynamics in two-dimensional organic solids. Adv. Phys. 2020, 69, 1–120. [Google Scholar] [CrossRef] [Scilit]
- Lang, M.; Lunkenheimer, P.; Ganter, O.; Winter, S.; Müller, J. Ferroelectric and multiferroic properties of quasi-2D organic charge-transfer salts: A review. J. Electr. Mater. 2025, 54, 5087–5129. [Google Scholar] [CrossRef] [Scilit]
- Mori, T. Structural genealogy of BEDT-TTF based organic conductors I. Parallel molecules: β and β’’ phases. Bull. Chem. Soc. Jpn. 1998, 71, 2509. [Google Scholar] [CrossRef] [Scilit]
- Mori, T.; Mori, H.; Tanaka, S. Structural genealogy of BEDT-TTF based organic conductors II. Inclined molecules: θ, α, and κ phases. Bull. Chem. Soc. Jpn. 1999, 72, 179. [Google Scholar] [CrossRef] [Scilit]
- Visentini, G.; Masino, M.; Bellitto, C.; Girlando, A. Experimental determination of BEDT-TTF+ electron-molecular vibration constants through optical microreflectance. Phys. Rev. B 1998, 58, 9460–9467. [Google Scholar] [CrossRef] [Scilit]
- Visentini, G.; Painelli, A.; Girlando, A.; Fortunelli, A. The dimer model for κ-phase organic superconductors. Europhys. Lett. 1998, 42, 467–472. [Google Scholar] [CrossRef] [Scilit]
- Painelli, A.; Girlando, A. Electron-molecular vibration (e-mv) coupling in charge-transfer compounds and its consequences on the optical spectra: A theoretical framework. J. Chem. Phys. 1986, 84, 5655–5671. [Google Scholar] [CrossRef] [Scilit]
- Girlando, A. Charge Sensitive Vibrations and Electron-Molecular Coupling in Bis(ethylenedithio)-tetrathiafulvalene (BEDT-TTF). J. Phys. Chem. C 2011, 115, 19371–19378. [Google Scholar] [CrossRef] [Scilit]
- Jacobsen, C.S.; Tanner, D.B.; Bechgaard, K. Optical and infrared properties of tetramethyltetraselenafulvalene [TMTSF)2X] and tetramethyltetrathialvalene [TMTTF)2X] compounds. Phys. Rev. B 1983, 28, 7019–7032. [Google Scholar] [CrossRef] [Scilit]
- Pedron, D.; Bozio, R.; Meneghetti, M.; Pecile, C. Electronic interactions in the organic conductors (TMTSF)2X (X = ClO4 and PF6) and (TMTTF)2X (X = Br and PF6) from their infrared spectra. Phys. Rev. B 1994, 49, 10893–10907. [Google Scholar] [CrossRef] [Scilit]
- Liu, H.L.; Tanner, D.B.; Pullen, A.E.; Abboud, K.A.; Reynolds, J.R. Optical and transport studies on Ni(dmit)2-based organic conductors. Phys. Rev. B 1996, 53, 10557–10568. [Google Scholar] [CrossRef] [Scilit]
- Rice, M.J.; Lipari, N.O.; Strässler, S. Dimerized Organic Linear-Chain Conductors and the unambiguous experimental determination of electron-molecular-vibration coupling constants. Phys. Rev. Lett. 1977, 39, 1359–1362. [Google Scholar] [CrossRef] [Scilit]
- Rice, M.J.; Yartsev, V.M.; Jacobsen, C.S. Investigation of the nature of the unpaired electron states in the organic semiconductor N-methyl-N-ethylmorpholinium-tetracyanoquinodimethane. Phys. Rev. B 1980, 21, 3437. [Google Scholar] [CrossRef] [Scilit]
- Yartsev, V.M.; Świetlik, R. Infrared properties of quasi-one-dimensional organic conductors. Rev. Solid State Sci. 1990, 4, 69–117. [Google Scholar]
- Matsuura, M.; Sasaki, T.; Iguchi, S.; Gati, E.; Müller, J.; Stockert, O.; Piovano, A.; Böhm, M.; Park, J.T.; Biswas, S.; et al. Lattice dynamics coupled to charge and spin degrees of freedom in the molecular Dimer-Mott insulator κ-(BEDT-TTF)2Cu[N(CN)2]Cl. Phys. Rev. Lett. 2019, 123, 027601. [Google Scholar] [CrossRef] [Scilit] [PubMed]
- Girlando, A.; Masino, M.; Brillante, A.; Della Valle, R.G.; Venuti, E. BEDT-TTF organic superconductors: The role of phonons. Phys. Rev. B 2002, 66, 100507. [Google Scholar] [CrossRef] [Scilit]
- Kozlov, M.; Pokhodnia, K.I.; Yurchenko, A.A. The assignment of fundamental vibrations of BEDT-TTF and BEDT-TTF-d8. Spectrochim. Acta 1987, 43, 323–329. [Google Scholar] [CrossRef] [Scilit]
- Kozlov, M.; Pokhodnia, K.I.; Yurchenko, A.A. Electron molecular vibration coupling in vibrational spectra of BEDT-TTF based radical cation salts. Spectrochim. Acta 1989, 45, 437–444. [Google Scholar] [CrossRef] [Scilit]
- Yamamoto, T.; Uruichi, M.; Yamamoto, K.; Yakushi, K.; Kawamoto, A.; Taniguchi, H. Examination of the charge-sensitive vibrational modes in bis(ethylenedithio)tetrathiafulvalene. J. Phys. Chem. B 2005, 109, 15226. [Google Scholar] [CrossRef] [Scilit]
- Maksimuk, M.; Yakushi, K.; Taniguchi, H.; Kanoda, K.; Kawamoto, A. The C=C stretching vibrations of κ-(BEDT-TTF)2Cu[N(CN)2]Br and its isotope analogues. J. Phys. Soc. Jpn. 2001, 70, 3728–373328. [Google Scholar] [CrossRef] [Scilit]
- Girlando, A. Raman signatures of the strong intramolecular and intermolecular charge oscillations in bis(ethylenedithio)-tetrathiafulvalene (BEDT-TTF) κ-phase salts. Phys. Rev. B 2024, 110, 035101. [Google Scholar] [CrossRef] [Scilit]
- Neese, F. The ORCA program system. Wiley Interdiscip. Rev. Comput. Mol. Sci. 2012, 2, 73–78. [Google Scholar] [CrossRef] [Scilit]
- Neese, F. Software update: The ORCA program system—Version 6.0. Wiley Interdiscip. Rev. Comput. Mol. Sci. 2025, 15, e70019. [Google Scholar] [CrossRef] [Scilit]
- Hassan, N.M.; Thirunavukkuarasu, K.; Lu, Z.; Smirnov, D.; Zhilyaeva, E.I.; Torunova, S.; Lyubovskaya, R.N.; Drichko, N. Melting of charge order in the low-temperature state of an electronic ferroelectric-like system. npj Quantum Mater. 2020, 5, 15. [Google Scholar] [CrossRef] [Scilit]
- Golichenko, A.A.; Kravchenko, A.V.; Omelchenko, I.V.; Chudak, D.M.; Starodub, V.A.; Barszcz, B.; Shtemenko, A.V. Crystal structure of bis(ethylenedithio)tetrathiafulvalenium μ2-acetato-bis[tribromidorhenate(III)] 1,1,2-trichloroethane hemisolvate. Acta Cryst. 2016, E72, 712–715. [Google Scholar] [CrossRef] [Scilit] [PubMed]
- Reinheimer, E.W.; Galán-Mascarós, J.R.; Gómez-García, C.J.; Zhao, H.; Formigué, M.; Dumbar, K.R. Radical salts of TTF derivatives with the metal-metal bonded [Re2Cl8]2− anion. J. Mol. Struct. 2008, 890, 81–89. [Google Scholar] [CrossRef] [Scilit]
- Barszcz, B.; Bednarski, W.; Starodub, V.A.; Golichenko, A.A.; Kravchenko, A.V.; Shtemenko, A.V. Resonant Raman scattering and ESR study of ET salts with rhenium-containing anions. J. Raman Spectrosc. 2017, 49, 238–244. [Google Scholar] [CrossRef] [Scilit]
- Eldridge, J.E.; Kornelsen, K.; Wang, H.H.; Williams, J.M.; Strieby Crouch, A.V.; Watkins, G.M. Infrered optocal properties of the 12 K organic superconductor κ-(BEDT-TTF)2Cu[N(CN)2]Br. Solid State Commun. 1991, 79, 583–598. [Google Scholar] [CrossRef] [Scilit]
- Eldridge, J.E.; Xie, Y.; Wang, H.H.; Williams, J.M.; Kini, A.M.; Schlueter, J.A. Two interesting features in the infrared and Raman spectra of the 12 K organic superconductor κ-(BEDT-TTF)2Cu[N(CN)2]Br. Mol. Cryst. Liq. Cryst. 1996, 284, 97–106. [Google Scholar] [CrossRef] [Scilit]
- Eldridge, J.E.; Xie, Y.; Wang, H.H.; Williams, J.M.; Kini, A.M.; Schlueter, J.A. Electron-phonons effects in the organic superconductor κ-(BEDT-TTF)2Cu[N(CN)2]Br. Spectrochim. Acta A 1996, 52, 45–46. [Google Scholar] [CrossRef] [Scilit]
- Eldridge, J.E.; Lin, Y.; Wang, H.H.; Williams, J.M.; Kini, A.M. Tc-dependent Raman scattering from a high-frequency phonon in κ-(BEDT-TTF)2Cu[N(CN)2]Br. Phys. Rev. B 1998, 57, 597–601. [Google Scholar] [CrossRef] [Scilit]
- Eldridge, J.E.; Wang, H.H.; Kini, A.M.; Schlueter, J.A. Assignment of the Raman spectra of some deuterated BEDT-TTF superconductors. Spectrochim. Acta 2002, 58, 2237–2243. [Google Scholar] [CrossRef] [Scilit]
- Musfeldt, J.L.; Świetlik, R.; Olejniczak, I.; Eldridge, J.E.; Geiser, U. Understanding electron-molecular vibrational coupling in organic molecular solids: Experimental evidence for strong coupling of the 890-cm−1 mode in ET-based materials. Phys. Rev. B 2005, 72, 014516. [Google Scholar] [CrossRef] [Scilit]
- Soprani, L.; Giunchi, A.; Bardini, M.; Meier, Q.N.; D’Avino, G. Accurate and efficient phonon calculations in molecular crystals via minimal molecular displacements. J. Chem. Theory Comput. 2025, 21, 8073–8085. [Google Scholar] [CrossRef] [Scilit]
- Wojdyr, M. Fityk: A general-purpose peak fitting program. J. Appl. Cryst. 2010, 43, 1126. [Google Scholar] [CrossRef] [Scilit]

Disclaimer/Publisher’s Note: The statements, opinions and data contained in all publications are solely those of the individual author(s) and contributor(s) and not of MDPI and/or the editor(s). MDPI and/or the editor(s) disclaim responsibility for any injury to people or property resulting from any ideas, methods, instructions or products referred to in the content. |
© 2026 by the authors. Licensee MDPI, Basel, Switzerland. This article is an open access article distributed under the terms and conditions of the Creative Commons Attribution (CC BY) license.