


Abstract
With the rapid expansion of wind energy infrastructure, there is an increasing accumulation of wind turbine blade waste (WTBW), which is mainly composed of glass fiber-reinforced thermosetting composites. Due to the irreversible nature of polymer crosslinking, conventional recycling methods remain limited. In this study, plasma vitrification was employed to convert WTBW into a reactive calcium-aluminum-silicate slag suitable for use in geopolymer materials. Plasma treatment at a temperature of approximately 2750 K resulted in the formation of predominantly amorphous vitrified slag (VS). Structural characterization using X-ray diffraction (XRD), Fourier transform infrared spectroscopy (FTIR), and scanning electron microscopy with energy-dispersive X-ray spectroscopy (SEM-EDS) revealed the spatial heterogeneity of the VS. This heterogeneity was influenced by thermal gradients and varied between samples collected from different slag discharge zones, both vertically and horizontally from the reactor. All VS samples contained between 30 and 89% amorphous phase and 10–55% anorthite, with the proportions varying by sampling location. Chemical stability tests showed the dissolution of calcium and aluminum in acidic media, resulting in a silica-enriched residual structure in which the Ca and Al content decreased to less than 0.5 at.% after 100 days. In contrast, exposure to alkaline media caused only minimal surface reorganization—the addition of 5 wt.% VS to acid-based geopolymers made with two metakaolin precursors resulted in a 35% decrease in the mechanical strength of pure metakaolin-based systems. In contrast, when metakaolin containing illite impurities was used, strength values were similar to those of the reference geopolymer. The results quantitatively demonstrate that plasma-derived slag exhibits composition-dependent reactivity, directly linked to its amorphous content and dissolution behavior.
1. Introduction
The rapid growth of wind energy has caused a significant increase in the production of wind turbine blades (WTBs), most of which are made from glass fiber-reinforced polymer (GFRP) composites. These materials usually include thermosetting epoxy or polyester matrices reinforced with glass fibers and mineral fillers [1,2]. Although their high mechanical strength and corrosion resistance ensure long-term durability, the irreversible crosslinked structure of thermosetting polymers prevents remelting or reshaping after curing, thereby limiting traditional recycling methods [3,4]. Consequently, more end-of-life wind turbine blades are being landfilled, raising environmental and resource-efficiency concerns [5].
Various strategies have been investigated to utilize wind turbine blade waste (WTBW) in construction materials. These include using WTBW as fillers, fibers, or supplementary cementitious materials, achieved through methods such as mechanically shredding or grinding virgin WTBW, or processing it via pyrolysis [6,7,8,9]. However, these methods often leave behind the organic polymer fraction, which can adversely affect the durability, interfacial bonding, and long-term stability when integrated into cementitious or geopolymer matrices. Therefore, alternative techniques for completely decomposing these polymers and effectively recovering inorganic materials are essential.
Plasma-based thermal technologies provide an advanced method for treating hazardous and composite wastes at high temperatures [10,11,12,13,14]. Plasma systems can reach temperatures of 2000–10,000 K, allowing for the rapid decomposition of organic components and complete melting of inorganic materials [8]. When processing GFRP composites using plasma, the polymer matrix breaks down into low-molecular-weight gaseous products. Meanwhile, the glass fibers and mineral fillers melt to form a molten aluminosilicate phase. When this melt cools rapidly, it undergoes vitrification, forming a glassy slag primarily composed of silicon, aluminum, and calcium oxides [15,16].
WTBW plasma treatment effectively addresses several challenges by completely breaking down the polymer phase and converting inorganic materials into a uniform aluminosilicate slag. Ž. Kavaliauskas et al. [15] conducted prior research in this area focusing on recovering glass fibers from WTBW using thermal plasma; however, the authors did not investigate the secondary applications of these fibers. Preliminary durability studies of the recovered and recycled glass fibers, as well as their potential uses in geopolymers or cement-based materials, were carried out by R. Kalpokaitė-Dičkuvienė and V. Snapkauskienė [16].
The chemical composition and cooling process significantly affect the structure and reactivity of vitrified aluminosilicate slag. Rapid quenching typically promotes the formation of amorphous phases, whereas slower cooling or variations in local composition can result in the crystallization of calcium-aluminosilicate phases, such as anorthite (CaAl2Si2O8) [17]. Amorphous phases usually have higher free energy and dissolve more quickly than their crystalline counterparts, thereby enhancing their chemical reactivity [18]. In contrast, crystalline phases are more thermodynamically stable and less prone to dissolution. Thus, the balance between amorphous and crystalline forms is crucial to determining whether plasma-derived slag can function effectively as a reactive precursor. Aluminosilicate materials with sufficient reactivity can be utilized as precursors for geopolymer production.
Geopolymers are inorganic binders formed by the dissolution and polycondensation of aluminosilicate sources in either alkaline or acidic media, resulting in three-dimensional networks of SiO4 and AlO4 tetrahedra [19,20,21]. While alkali-activated geopolymers are widely studied, acid-based systems have attracted growing interest due to improved chemical resistance [22] and broader applications in construction, medical applications, and waste treatment technologies [21,22,23,24]. In phosphate systems, geopolymerization involves the dealumination of aluminosilicate species, which then react with the phosphate (PO4) tetrahedra from phosphoric acid. This process is followed by a polycondensation step [22], resulting in crosslinked phosphate-aluminosilicate networks. Several factors affect the final properties of acid-based geopolymers, including the acid concentration, curing temperature, molar ratios of phosphorus to aluminum (P/Al) or silicon to phosphorus (Si/P), and the characteristics of the aluminosilicate precursor. These characteristics may include particle size and the presence of impurities such as calcium oxide (CaO), silica (SiO2), or iron(II) oxide (Fe2O3) [19,22,25,26,27]. According to the findings presented in [25], the acid-based geopolymer formation process strongly depends on the P/Al molar ratio, which increases as the intermediate P-O-P structure forms and ultimately transforms into the Al-O-P structure [25].
Although there is growing interest in alternative waste-derived aluminosilicate sources to enhance sustainability and support circular material flows [22,28], common precursors include metakaolin, fly ash, volcanic ash, and blast furnace slag [19,21]. The choice of precursor significantly affects the setting time, mechanical strength, and thermal properties of geopolymers, making it a key factor in the geopolymerization process [19]. The chemical and mineralogical composition of the precursor significantly influences the performance of the geopolymer matrix [19,22,24,28]. For instance, using calcium-rich amorphous slag promotes the formation of a dense geopolymer, while the incorporation of crystalline phases may diminish pozzolanic activity [19]. Additionally, the presence of calcium can considerably affect the reaction pathways, potentially leading to the formation of calcium phosphate phases or altering the stability of aluminosilicate structures. Therefore, it is essential to evaluate the dissolution behavior of plasma-vitrified slag in both acidic and alkaline conditions to assess its reactivity and binding potential.
Despite increasing research on plasma-treated waste [29], no studies have linked WTBW thermal plasma processing conditions to phase composition, dissolution behavior, and performance in geopolymer systems. The novelty of this study lies in establishing this relationship by analyzing how the amorphous–crystalline structure of plasma-vitrified WTBW slag governs its chemical stability and performance in acid-based geopolymers.
The study aims to evaluate the potential of plasma processing applications in transforming WTBW into valuable inorganic materials suitable for construction applications. The research specifically investigates the potential use of amorphous slag in geopolymer systems. Rather than focusing on optimization, this study aims to enhance the mechanistic understanding of these processes.
2. Materials and Methods
2.1. Vitrified Slag Production
2.1.1. Feedstock Preparation for Plasma Treatment
WTBW consists of multilayer composite structures, including glass fiber-reinforced polymer laminates, adhesive layers, and protective coatings, each with distinct chemical compositions and thermal behavior [30]. This heterogeneity does not affect the melting behavior or the final slag composition during plasma processing, unlike chemical, pyrolysis, and other thermal processing methods, which can generate unwanted by-products [31]. This study focused on glass fiber-reinforced polymer (GFRP) composites derived from end-of-life wind turbine blade waste. Due to the polymer matrix’s crosslinked structure, these materials cannot be remelted or reshaped using standard thermoplastic recycling techniques.
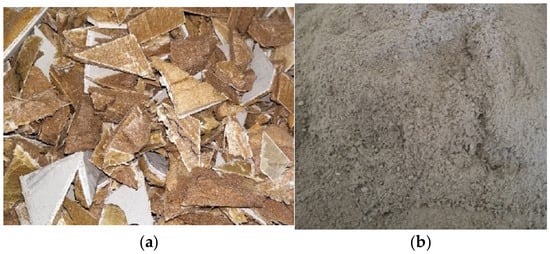
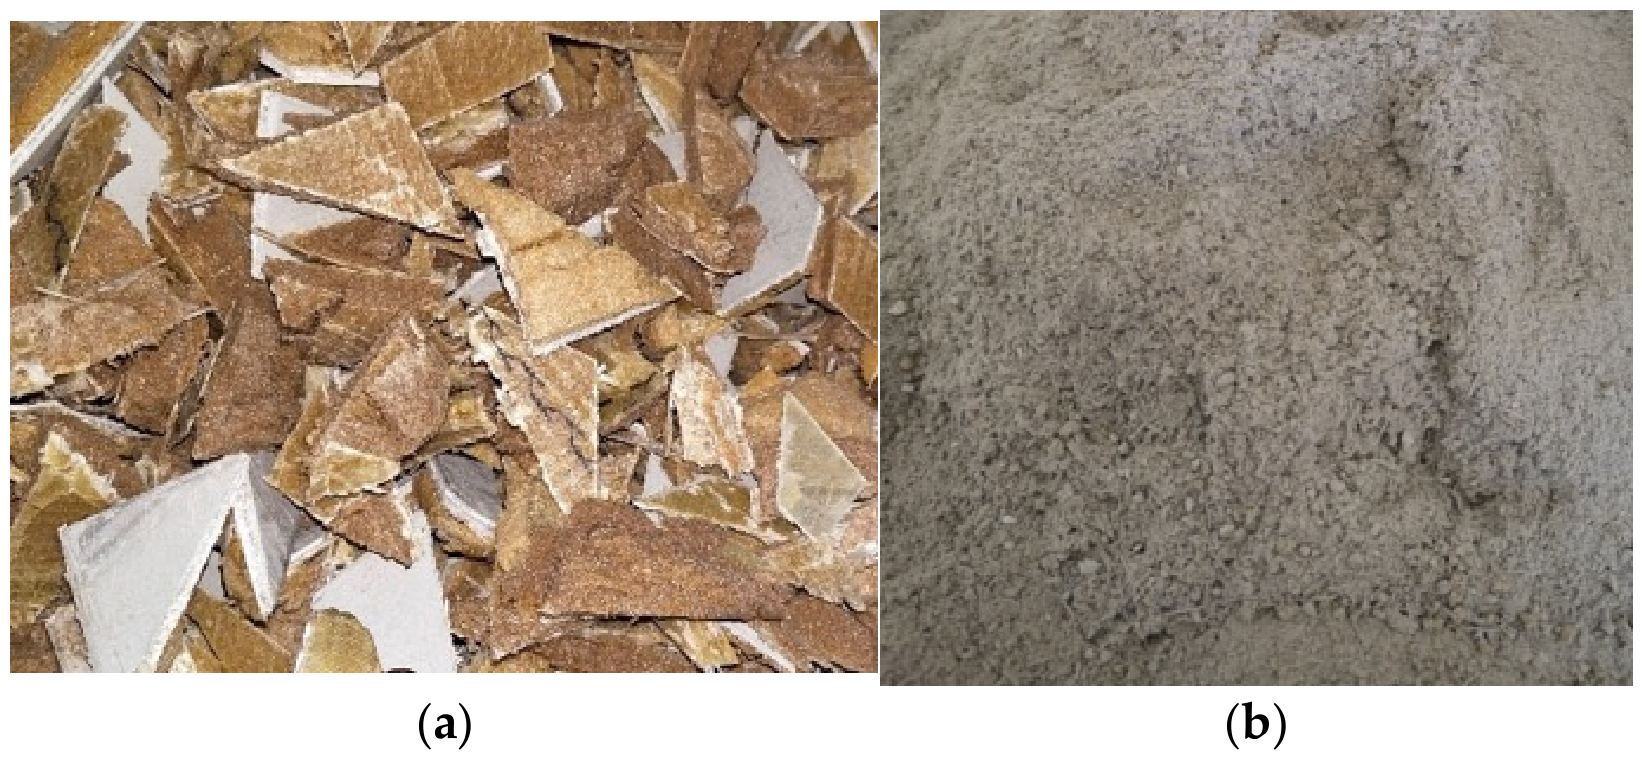
Before plasma treatment, the WTBW was mechanically shredded and ground to achieve a particle size that enabled stable, continuous feeding of the plasma reactor (see Figure 1). This grinding process ensured uniform feeding conditions and minimized fluctuations in the mass flow rate during the melting experiments. A 0.5 mm sieve was used to ensure uniform particle sizes.
Figure 1.
Mechanically shredded (a) and ground (b) WTBW.
The vitrified slag obtained through plasma treatment was used as a partial substitute for metakaolin in specific formulations. Metakaolin was the main source of aluminosilicates for the geopolymer synthesis.
2.1.2. Plasma Melting Setup and Vitrified Slag Sampling
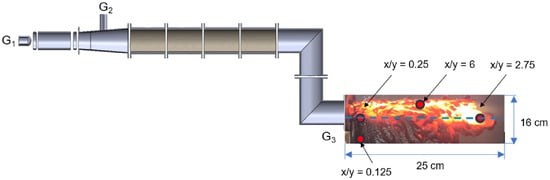
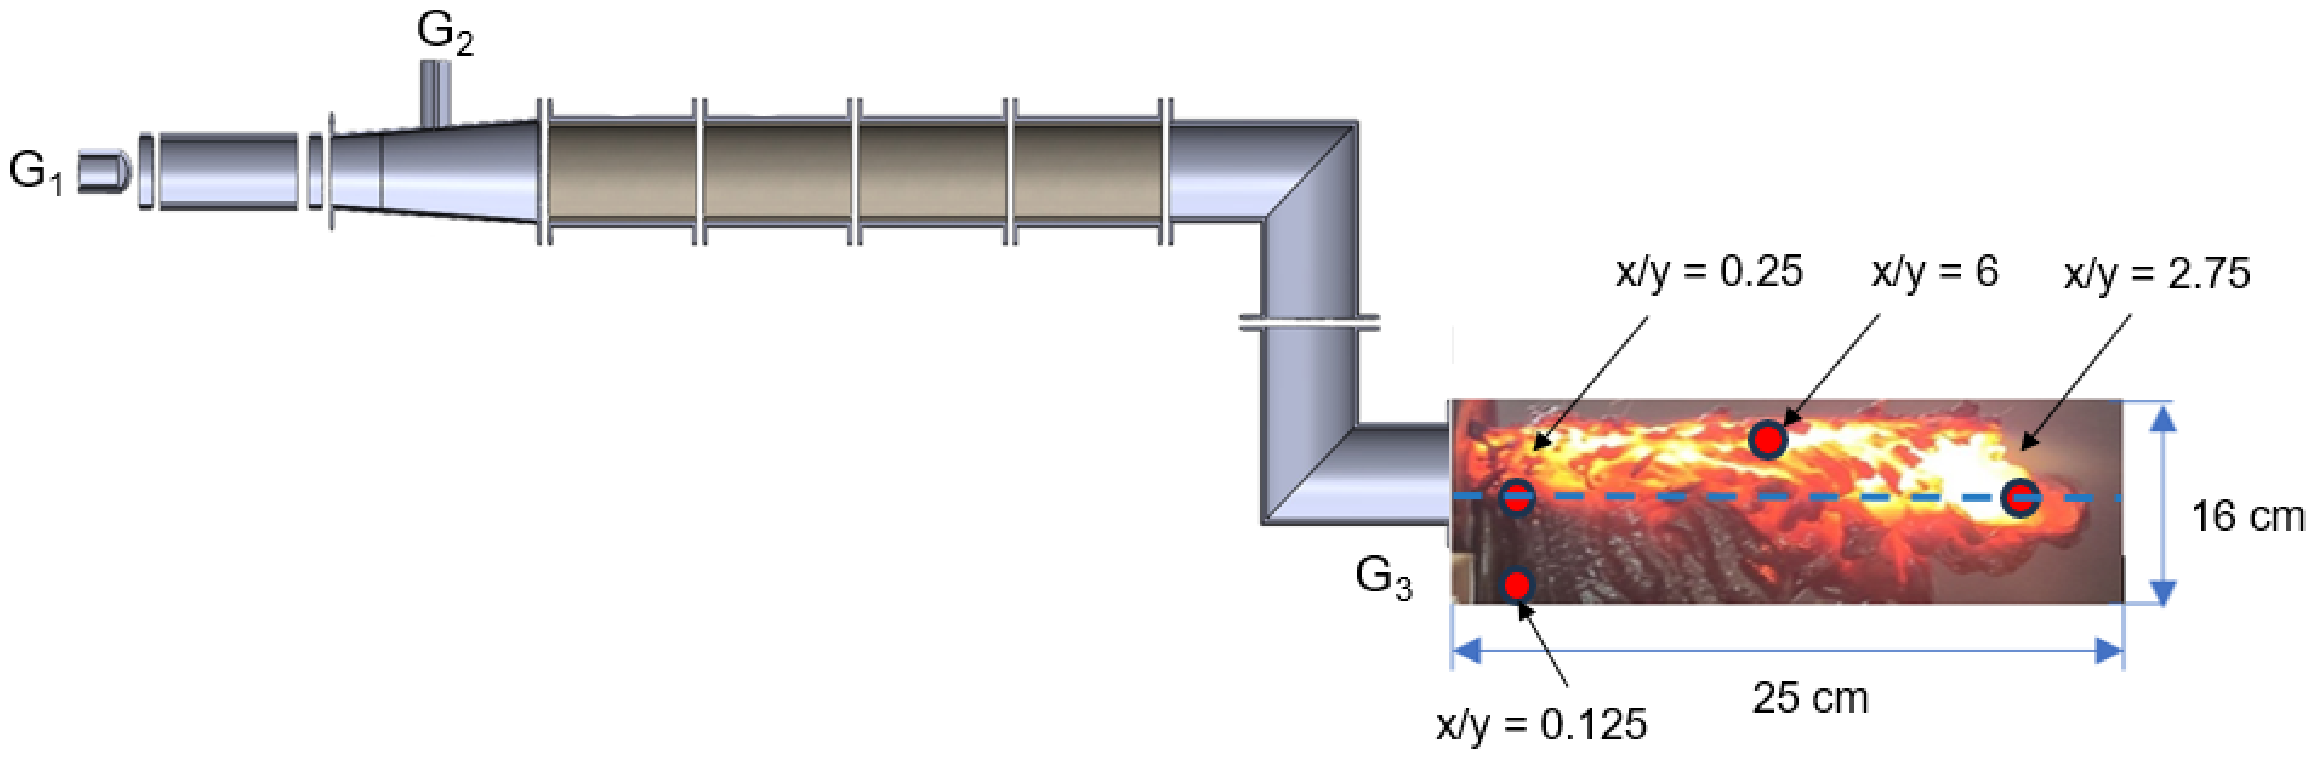
Plasma vitrification was performed using a direct-current (DC) arc plasma torch reactor (Kaunas) developed at the Lithuanian Energy Institute in Kaunas, Lithuania (see Figure 2). The system is designed for processing solid feedstock materials at high temperatures under controlled conditions.
Figure 2.
The experimental setup for plasma melting comprises: (G1) plasma torch, (G2) feedstock input, and (G3) slag output. The blue dashed line indicates the sample centerline.
The plasma torch operated at an arc current of 160 A and a voltage of 375 V (Table 1), yielding an electrical power output of approximately 60 kW. With an estimated torch efficiency of around 70%, the effective thermal power supplied to the plasma was approximately 42 kW. The mean temperature of the plasma jet reached about 2750 K, while the average jet velocity was around 180 m/s.
Table 1.
Plasma-melting conditions for the vitrification of a thermosetting WTBW composite.
Air served as both the plasma-forming gas and the feedstock carrier. The primary gas flow rate was maintained at 10 g/s, while the WTBW feed rate was set at 1.3 g/s. A secondary gas flow of 4 g/s was also introduced to stabilize the plasma plume and improve mixing. Each experimental run lasted 35 min.
The reactor comprised four straight cylindrical steel sections (0.2 m each) and two curved sections (0.15 m each, 90° bend), all with an internal diameter of 0.04 m. The sections were joined by flanged joints and fitted with external water-cooling jackets to ensure structural stability. The internal reactor surface was lined with a two-layer refractory insulation comprising a 2 mm asbestos layer and an 18 mm alumina-based ceramic layer to reduce heat losses and protect the steel casing.
During operation, the shredded WTBW was continuously fed into the plasma zone, where the organic matrix decomposed into gaseous products. Simultaneously, the inorganic fraction melted to form a molten aluminosilicate phase. The melt flowed toward the reactor outlet and was rapidly cooled, forming vitrified slag (see Figure 2). Notably, the transition from the liquid to the solid state occurs outside the plasma equipment zone under atmospheric conditions. Further details of the melting processes during plasma recycling are reported in [23].
VS samples were collected at various locations along the slag outflow path from the plasma-chemical reactor, indicating distinct thermal regimes and cooling conditions. The sampling locations were defined using normalized coordinates (x/y), representing relative distances in the horizontal (x) and vertical (y) directions from the slag outlet.
Four representative samples were selected for analysis: x/y = 6, 2.75, 0.25, and 0.125 (Figure 2). These positions correspond to different process zones: the region closest to the plasma flow core (x/y = 6), where the highest temperature and longest residence time occur; the intermediate zones (x/y = 2.75 and 0.25), where mixed cooling conditions are observed; and the peripheral zone (x/y = 0.125), which is characterized by the fastest cooling and the lowest plasma influence. All samples were collected after complete solidification, so each position indicates material formed under distinct non-equilibrium cooling conditions.
These positions reflect local variations in temperature, cooling rate, and residence time, which directly influence phase evolution, amorphous content, and the material’s final reactivity.
2.2. Chemical Stability of Vitrified Slag (VS)
To evaluate the chemical stability and reactivity of vitrified slag, samples were exposed to two types of solutions that represent geopolymer hardening conditions: (1) an acidic solution consisting of phosphoric acid and water (8 M H3PO4), and (2) an alkaline solution composed of sodium silicate, sodium hydroxide, and water, with a SiO2/Na2O molar ratio of 2.8 [16].
Vitrified slag was crushed, and a fraction of 1.6 mm was selected for the chemical stability test. The samples were exposed to two different solutions at a sample-to-solution weight ratio of 1:40 and stored in sealed containers at room temperature for up to 100 days. A previous study by the authors [16] indicated that rapid chemical degradation began approximately 2 weeks after exposure, and by 100 days, the samples completely dissolved. Therefore, at least ten specimens of the vitrified slag were removed from both solutions after 14 and 100 days, rinsed with distilled water to eliminate any residual solution, and then dried in an oven at 105 °C before being characterized by SEM-EDS (Carl Zeiss SMT Ltd., Cambridge, England). Ground powder samples were used for the FTIR measurements.
2.3. Geopolymer Samples Production
2.3.1. Materials
Based on the chemical stability test in Section 3.2, an acid-based activator was chosen to synthesize the geopolymer with plasma-vitrified slag (VS). Phosphate-based geopolymer binders were created using two types of metakaolin, MK1 and MK2, with 5 wt.% of each replaced by VS. MK1 and MK2 were produced by heating kaolinitic (K1) and kaolinitic-illitic (K2) clay at 800 °C for 2 h [24,32]. Appendix A provides a detailed analysis of K1, K2, MK1, and MK2. The replacement selection was determined by the slag sample with the highest amorphization level (see Section 3.1). Both kaolinitic clays are 1:1 layer silicates composed of a tetrahedral silicon-oxygen layer and an octahedral cation layer. However, K1 is a pure kaolin clay, while K2 contains illite inclusions (see Appendix A, Figure A1). The relatively high cost of pure kaolin requires the use of more affordable, locally available clay alternatives [33].
The oxide composition of the resulting MKs is presented in Table 2. To produce the geopolymer, 85% phosphoric acid (H3PO4) from Lerochem, Lithuania, and deionized water were used. The activation solution was prepared by diluting the phosphoric acid with water at the specified ratio. The solution was stirred for 2 h, then left to stand overnight to allow protonation.
Table 2.
Oxide composition of metakaolins.
2.3.2. Mix Proportions of Geopolymer Samples
The results presented in Reference [31] indicate that phosphoric acid concentration affects the depolymerization and polycondensation reactions during geopolymerization. The presence of PO4 units in the geopolymer network, as observed in the FTIR spectra [34], provides a common method for determining the appropriate molar concentration of the phosphoric acid solution. Therefore, the first set of samples was prepared using MK1 clay and acid solutions of varying molarity (6 M, 8 M, and 10 M), with a liquid-to-solid ratio of 1.0.
A new set of samples was prepared, both with and without 5% vitrified slag (VS). Since the mechanical strength of acid-based geopolymers depends on the silica-to-phosphorus (Si/P) ratio [35], this ratio was maintained nearly constant across all compositions, as detailed in Table 3. To prepare the geopolymers, an activation solution was mechanically mixed with metakaolin (MK) and vitrified slag at a liquid-to-solid ratio of 1.0. The obtained homogeneous slurry was then cast into a cylindrical mold with a diameter of 35 mm and a height of 70 mm and sealed. A minimum of six specimens was prepared for each composition. The samples were left to cure at room temperature for 24 h, followed by an additional 72 h at 50 °C.
Table 3.
Molar ratio of the geopolymer samples.
The split tensile strength of the solidified samples was measured using a ZwickRoell Universal Testing Machine (ZwickRoell GmbH, Ulm, Germany) at a loading rate of 0.5 mm/min. According to the relationship provided in [36], the measured splitting tensile strength (fsp) was converted to the calculated compressive strength (fc) using the appropriate equation:
fsp = 0.17(fc)3/4,
2.4. Analytical Techniques for Sample Characterization
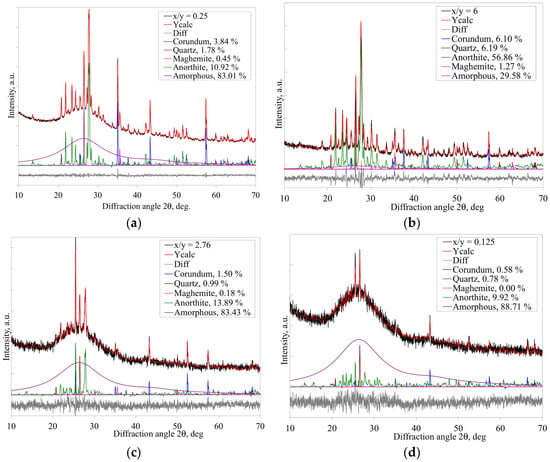
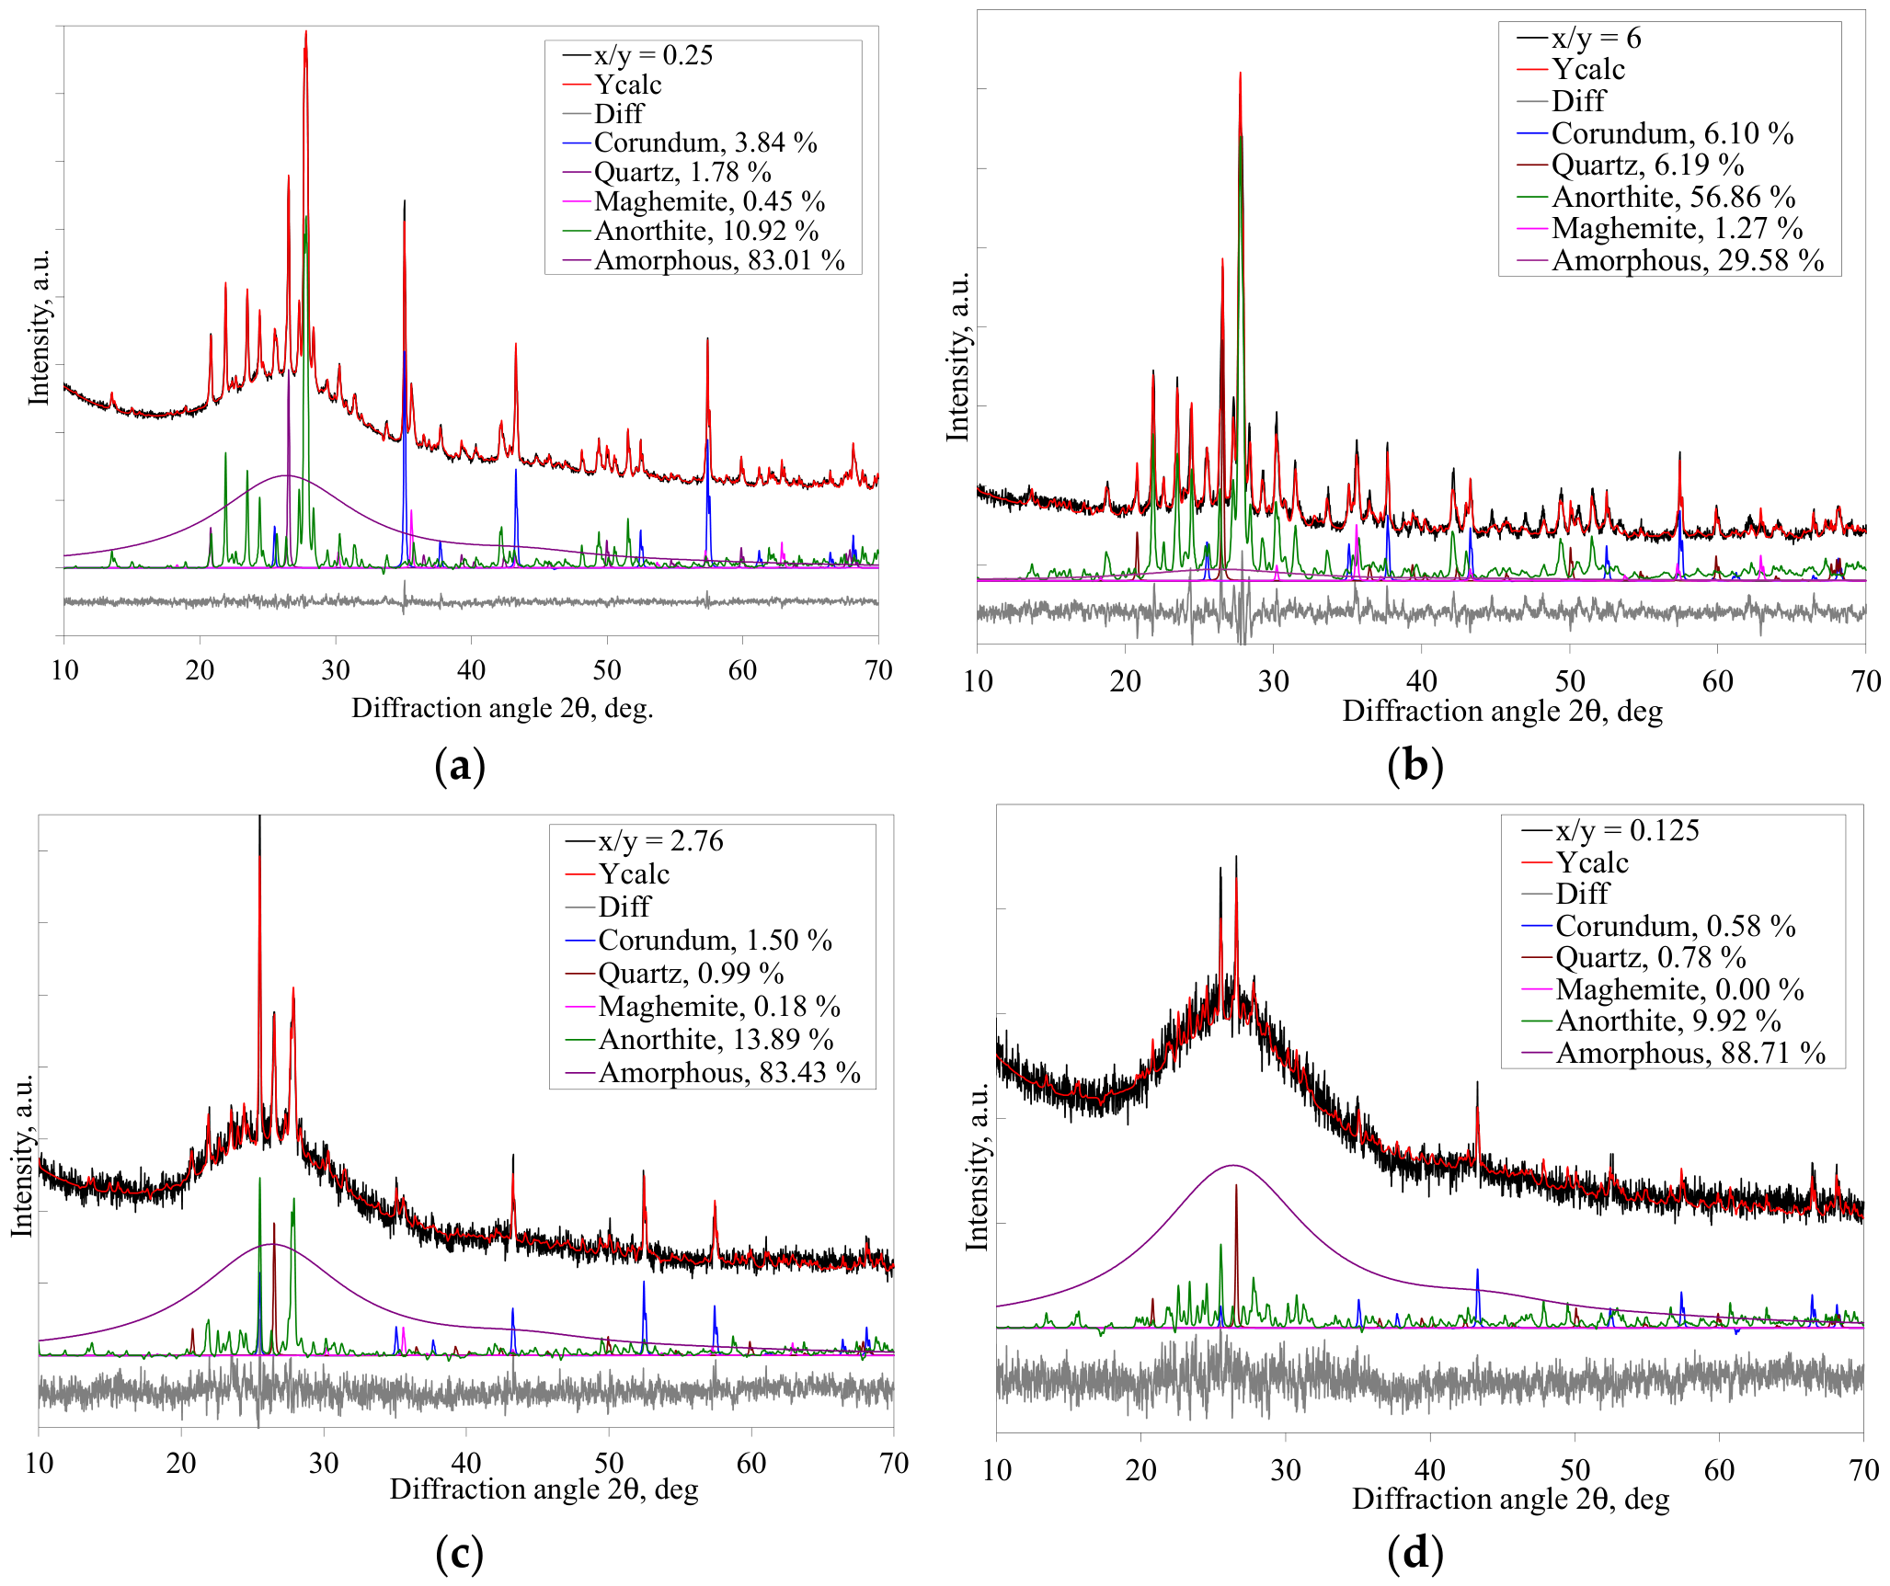
The phase composition of the vitrified slag and geopolymer samples was analyzed by X-ray diffraction (XRD) using a Bruker D8 Advance diffractometer (Bruker Nano GmbH, Hamburg, Germany) with CuKα radiation (λ = 0.154059 nm). The diffraction patterns were collected over a 2θ range of 20° to 70°, with a step size of 0.02°, and a counting time that was adjusted to ensure an adequate signal-to-noise ratio. The qualitative phase identification was performed using reference patterns from the ICDD PDF-4+ database. For quantitative phase analysis, Rietveld refinement was performed using the TOPAS software (Bruker AXS GmbH, Karlsruhe, Germany). The refinement process involved iteratively adjusting the background, scale factors, lattice parameters, and peak shape parameters until convergence was achieved. The reliability of the Rietveld refinement was evaluated using statistical agreement indices and the physical consistency of the refined model. Parameters, such as Rwp—weighted profile residual, Rp—profile residual and χ2—goodness of fit, were used for the quantitative evaluation, while the obtained values are presented below (see Figure 2 for x/y notations):
x/y = 0.25: Rwp = 1.62%, Rp = 1.25%, χ2 = 0.33
x/y = 6.00: Rwp = 8.43%, Rp = 6.49%, χ2 = 1.82
x/y = 2.76: Rwp = 6.09%, Rp = 4.75%, χ2 = 1.23
x/y = 0.125: Rwp = 6.19%, Rp = 4.83%, χ2 = 1.21
Results indicate a satisfactory agreement between the experimental and calculated diffraction patterns. In addition, the low intensity of the difference curve with the absence of systematic misfit at major reflections confirms the quality of the refinement. The refined values of the lattice parameters, phase composition, and crystallite size align well with the expected crystal structure.
Functional groups in the samples were identified using Fourier transform infrared (FTIR) spectroscopy on a Bruker ALPHA spectrometer (Bruker, Hamburg, Germany) equipped with an attenuated total reflectance (ATR) module. Spectra were collected at room temperature over the range 4000 to 350 cm−1, with a resolution of 4 cm−1 and 24 scans per sample, repeated three times. FTIR analysis was used to assess structural modifications in the aluminosilicate network, specifically examining changes in Si–O–Si, Si–O–Al, and P–O bonding following chemical activation.
Microstructural observations were conducted using a ZEISS EVO MA10 scanning electron microscope (SEM) (Carl Zeiss SMT Ltd., Cambridge, UK) operating at 20 kV. The surface morphology, fracture characteristics, and microstructural homogeneity of both vitrified slag and geopolymer samples were examined. Each sample was coated with gold to create a conductive layer. The elemental composition was analyzed using energy-dispersive X-ray spectroscopy (EDS) (Bruker Nano GmbH, Hamburg, Germany) with a Bruker QUANTAX 5040 system attached to the SEM. Measurements were performed at 20 kV in both point and selected-area modes. During the point EDS analysis, at least ten spots across the sample were examined.
3. Results and Discussion
3.1. Characterization of Plasma Vitrified Slag (VS)
Plasma processing of wind turbine blade waste generates a fully molten phase characterized by high temperature and viscous flow behavior. When the melt exits the plasma torch, it flows into the surrounding atmosphere, where a steep temperature gradient between the melt and the ambient air causes rapid cooling and quenching. Consequently, the material quickly solidifies, forming vitrified slag.
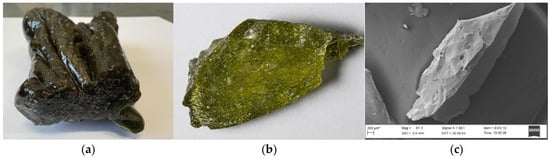
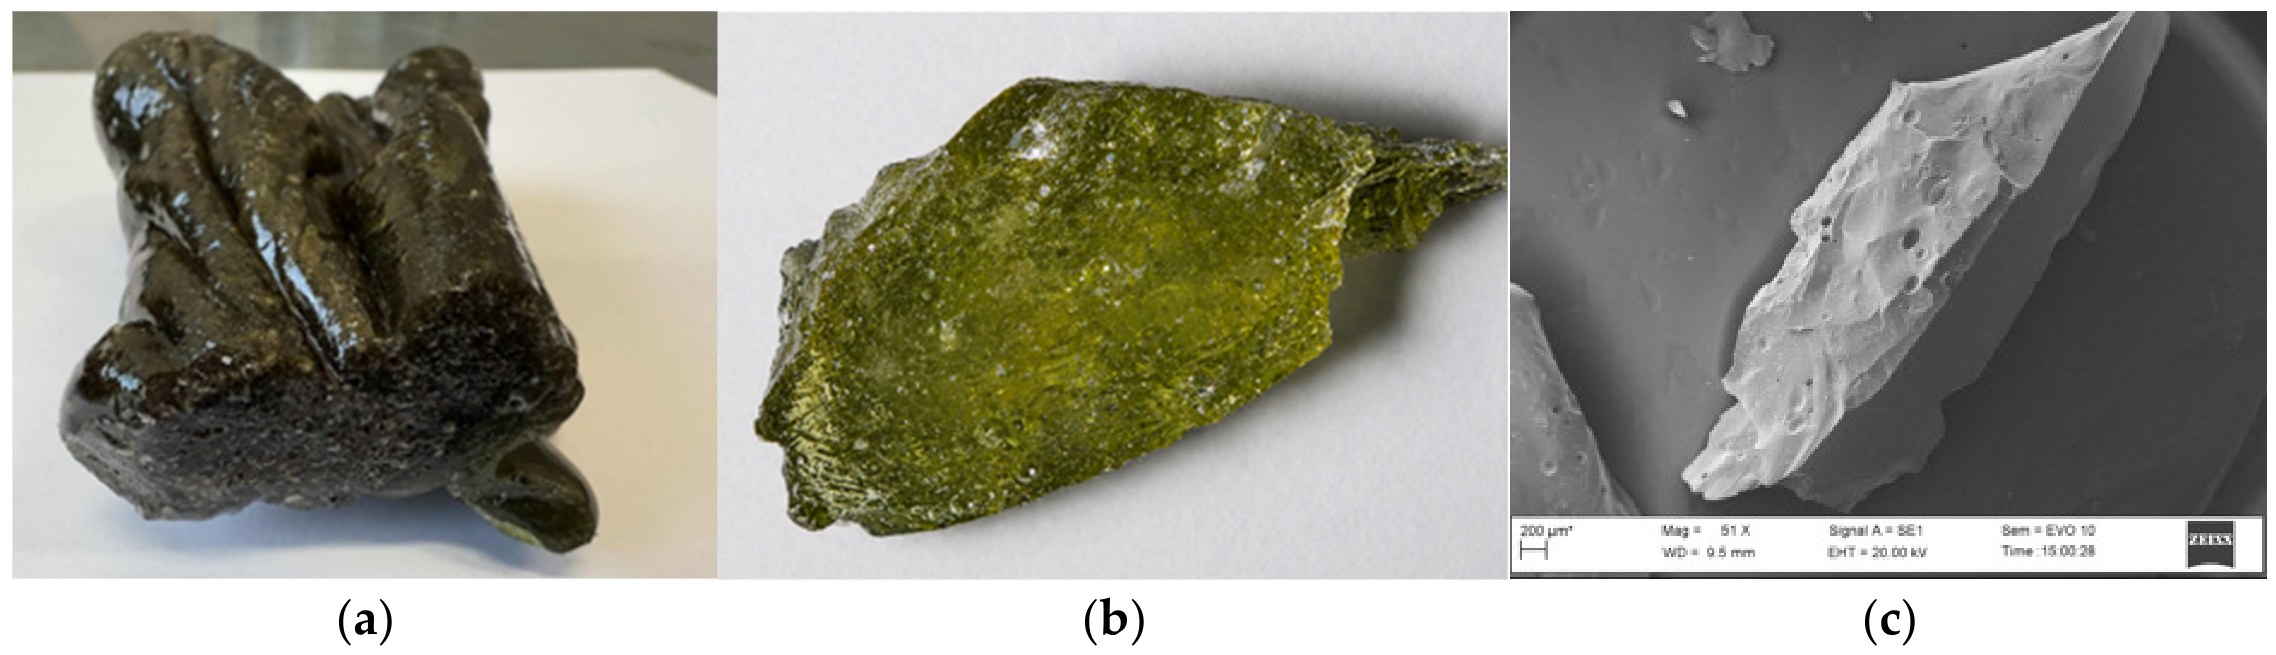
During cooling, the melt gradually loses its fluidity, and under the influence of surface tension and viscous forces, coalesces into a continuous, glassy monolithic body (Figure 3a,b) rather than breaking into individual particles, indicating cohesive viscous flow behavior. The SEM image in Figure 3c shows fracture features typical of brittle, rapidly quenched amorphous materials. Local gas release and thermal fluctuations during solidification can cause pores and partial foaming within the material. The lack of fibrous morphology suggests effective melting and transformation of the initial composite.
Figure 3.
Images of vitrified slag: (a) as received; (b) optical micrograph at 70× magnification; and (c) SEM image of plasma vitrified slag.
EDS analysis in Table 4 confirms that plasma vitrification decomposes the organic matrix, producing a vitrified slag mainly composed of silicon, along with aluminum and calcium, forming a Ca–Al–Si-based system. These microstructural and compositional results are consistent with the FTIR and XRD findings.
Table 4.
Elemental composition of VS detected by SEM-EDS.
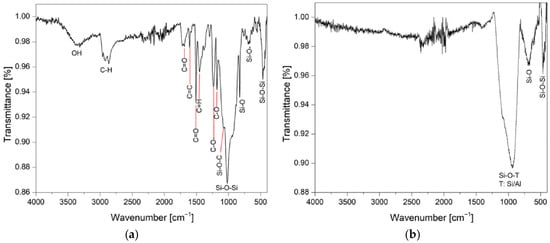
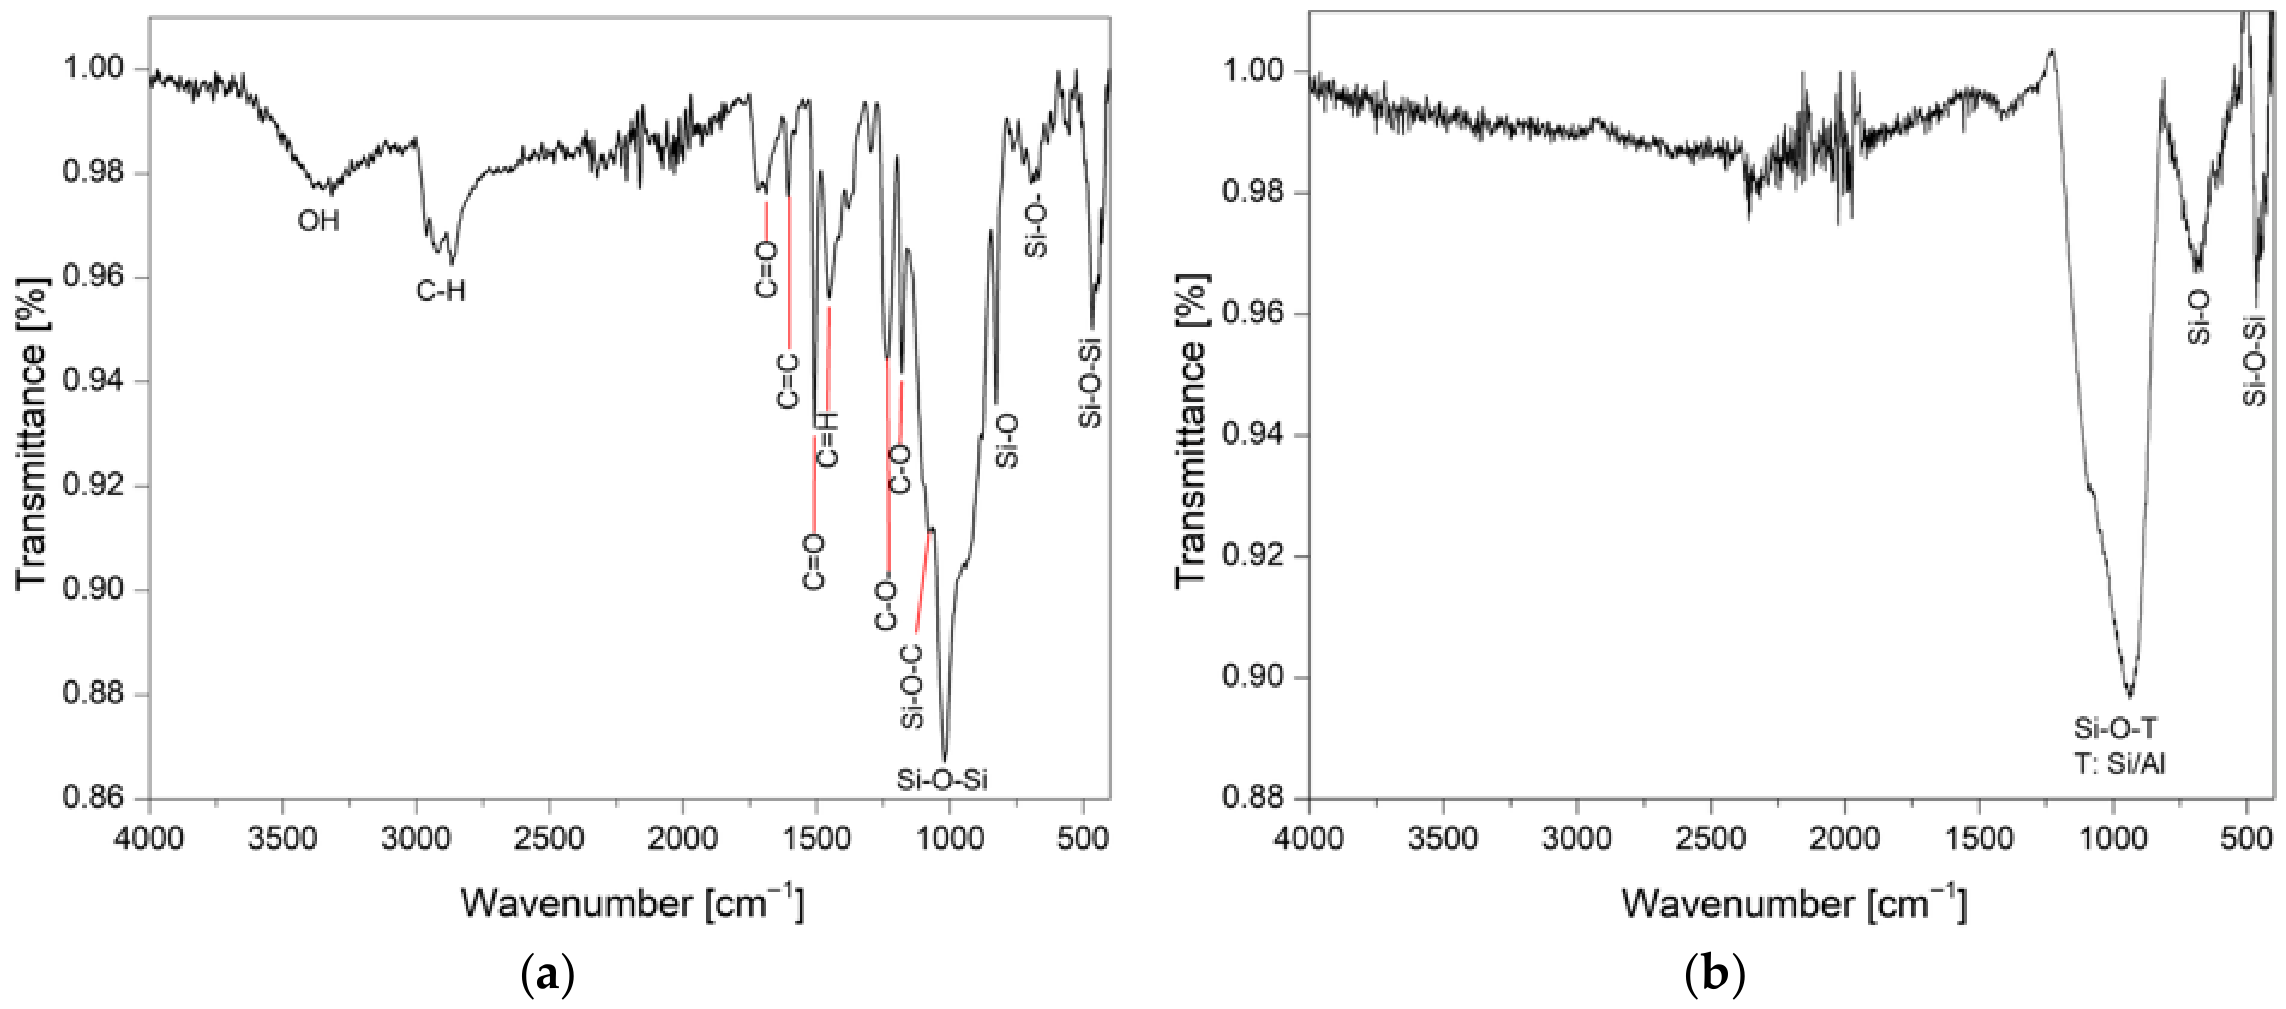
The FTIR spectrum of the ground wind turbine blade powder (Figure 4a) shows the typical structure of glass fiber-reinforced polymer (GFRP), in which both inorganic and organic phases are clearly identified [37]. The broad, relatively weak absorption band near 3350 cm−1 is attributed to the O–H stretching vibrations of adsorbed water. The weak bands in the range 2950–2850 cm−1 correspond to aliphatic C–H stretching vibrations (CH2 and CH3 groups), indicating the presence of an organic matrix.
Figure 4.
Reference FTIR transmittance spectra of (a) raw WTBW and (b) vitrified slag (VS).
The medium-intensity bands at ~1600 cm−1 are linked to C=C vibrations of the aromatic ring, characteristic of the epoxy resin structure [38,39]. The possibly weak signal around ~1730 cm−1 can be attributed to carbonyl (C=O) groups, as the sample contains components of polyester origin [37]. The bands between 1500–1450 cm−1 are related to CH2 deformation vibrations and aromatic fragments, while the 1263 cm−1 band corresponds to the C–O alkyl asymmetric stretch, and the 1180 cm−1 band is associated with C–OH stretching [37,39]. The Si–OH bending band was observed at 830 cm−1, corresponding to the non-bridging oxygen [39].
The brightest spectral region was observed in the 1150–850 cm−1 range, where a very intense, broad absorption band with a peak near 1020 cm−1 dominated, characteristic of Si–O–Si asymmetric stretching vibrations in the glass fiber. This band may overlap with C–O–C vibrations from the epoxy matrix [40]. An additional band near ~680 cm−1 was assigned to Si–O–Si symmetric stretching vibrations, and Si–O–Si bending vibrations were observed at lower wavenumbers (~500–400 cm−1). The set of these three bands is a characteristic feature of the siliceous glass phase, as confirmed in [15,25,37,39].
All organic phases disappeared after plasma treatment. The FTIR spectrum of VS (Figure 4b) was dominated by a broad Si–O–T (T:Si/Al) stretching vibration band from 1200 to 800 cm−1, a narrower Si–O band at 800–500 cm−1 peaking at 683 cm−1, and a band near 450 cm−1, typical of amorphous aluminosilicates [25,37,39]. The Si–O–T band, peaking at about 935 cm−1, is a combination of Si–O–Si and Si–O–Al bonds, reflecting a distribution of bond environments typical of disordered networks [28]. A band at 450 cm−1 corresponded to Si–O–Si bending vibrations, confirming the formation of a disordered calcium–aluminosilicate glassy network [25]. Although calcium is clearly detected by EDS (Table 4), it does not produce distinct FTIR bands; instead, it acts as a network modifier [27].
XRD-Rietveld refinement (Figure 5, Table 5) provides deeper understanding of the structural evolution of VS formed under plasma conditions. Samples collected from different zones, as indicated in Figure 2, exhibited significant variation in phase composition, reflecting differences in kinetic conditions and thermal history. Beyond simple phase identification, the diffraction patterns revealed the non-equilibrium nature of solidification, with a broad amorphous halo coexisting with crystalline peaks, indicating the presence of short-range order within a disordered matrix. In the VS sample closest to the plasma core (x/y = 6) (see Figure 2), where higher temperature and extended residence times occurred, increased atomic mobility promoted structural reorganization and partial crystallization. Under these conditions, the formation of anorthite (CaAl2Si2O8) indicates the development of a fully polymerized framework of interconnected SiO4 and AlO4 tetrahedra. The presence of corundum further suggests the local segregation of Al-rich domains, indicating incomplete homogenization of the melt and highlighting the role of compositional heterogeneity during crystallization. In contrast, in the peripheral (x/y = 0.125) and intermediate (x/y = 2.75 and 0.25) zones, rapid quenching dominates, suppressing crystallization and preserving the disordered liquid state. This results in a predominantly amorphous network characterized by short-range-ordered Q0–Q2 species, with increasing structural disorder reflected in the progressive broadening of diffraction features. The coexistence of approximately 10–15% anorthite within an amorphous matrix indicates that solidification occurs within the crystallization interval, resulting in incomplete phase separation and the formation of structurally strained interfaces between the crystalline and amorphous domains. These interfaces are energetically unstable and can act as preferential sites for subsequent chemical reactions, particularly dissolution.
Figure 5.
XRD patterns of plasma vitrified slag collected from various locations at coordinates (a) 6, (b) 0.25, (c) 2.75, and (d) 0.125.
Table 5.
XRD-Rietveld refinement data of VS samples from different locations.
Overall, the combined XRD and FTIR analyses demonstrate that plasma processing allows for precise control of the amorphous–crystalline balance via thermal gradients and cooling dynamics. At 2750 K under plasma conditions, partial crystallization is thermodynamically favored. However, rapid quenching increases structural disorder and maintains the dominance of amorphous phases. Plasma creates a highly nonequilibrium environment characterized by rapid heating–cooling cycles, high-energy electron impact, and enhanced chemical reactivity, all of which strongly affect nucleation and crystallization processes [31].
3.2. Chemical Stability of Vitrified Slag (VS) in Acidic and Alkaline Media
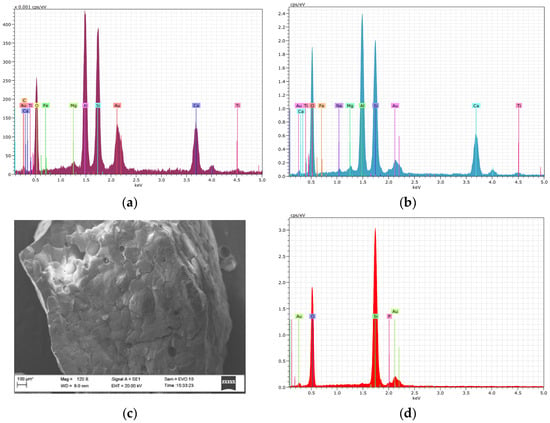
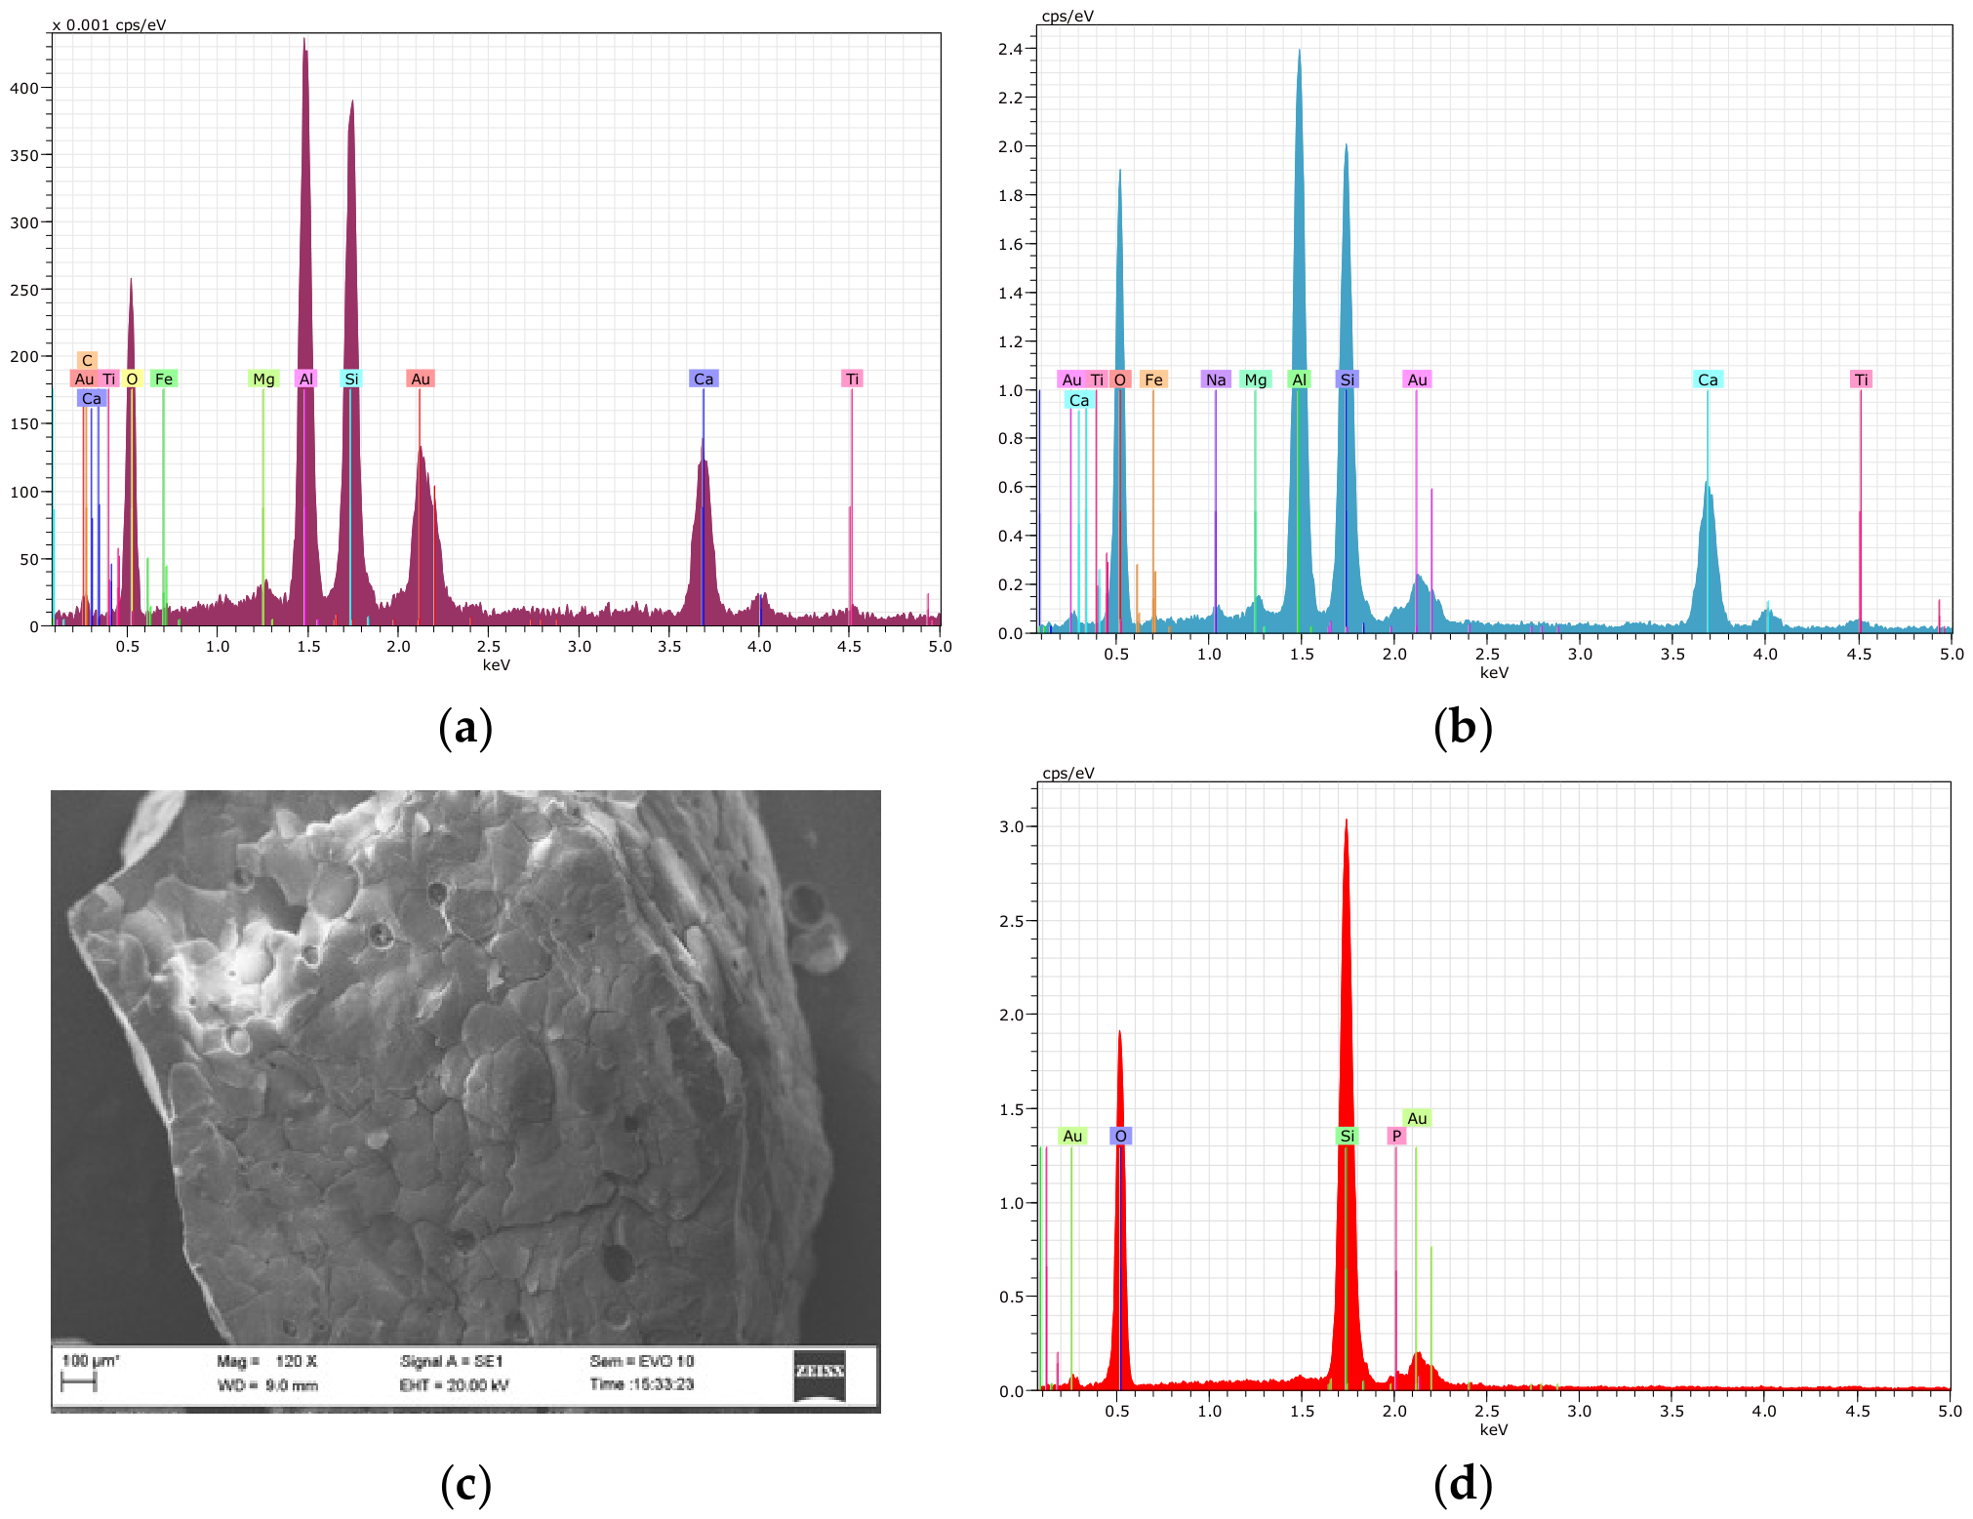
The chemical stability of VS was evaluated in acidic and alkaline media over exposure periods of 14 and 100 days. The initial EDS elemental composition (Table 4, Figure 6a) mainly consisted of Si, Al, and Ca, with minor amounts of Fe, Mg, and Ti. Even after prolonged exposure to an alkaline solution for 100 days, no significant compositional changes were observed, except for minor reductions in Ti and Mg (Figure 6b), indicating relatively high stability under alkaline conditions. In contrast, exposure to acidic media resulted in pronounced compositional and morphological changes. After prolonged acid exposure, only Si and O peaks remained detectable (Figure 6d), while the SEM observations revealed significant surface etching (Figure 6c).
Figure 6.
EDS spectra of slag surface: (a) before exposure; (b) after exposure in alkaline solution for 100 days; (c,d) SEM-EDS micrographs after exposure in acid solution for 100 days.
These findings demonstrate the selective dissolution of Ca and Al species, resulting in a silica-rich residual structure. This behavior can be explained by the structural role of network modifiers in the aluminosilicate framework. In the glass structure, Ca2+ acts as a charge-balancing cation for AlO4− tetrahedra, thereby generating non-bridging oxygen sites that weaken the network. Under acidic conditions, protonation reactions preferentially target these weaker bonds, leading to the selective breaking of Si–O–Ca and Si–O–Al linkages and the release of Ca2+ and Al3+ into solution. From a structural perspective, this corresponds to a transition from a depolymerized Q2–Q3 network to a more polymerized Q4 silica framework.
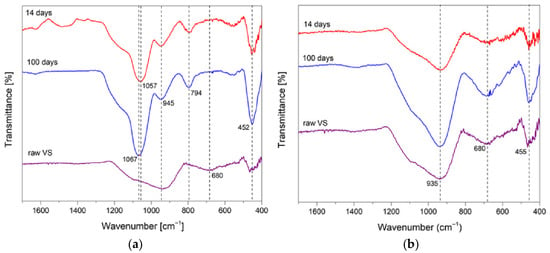
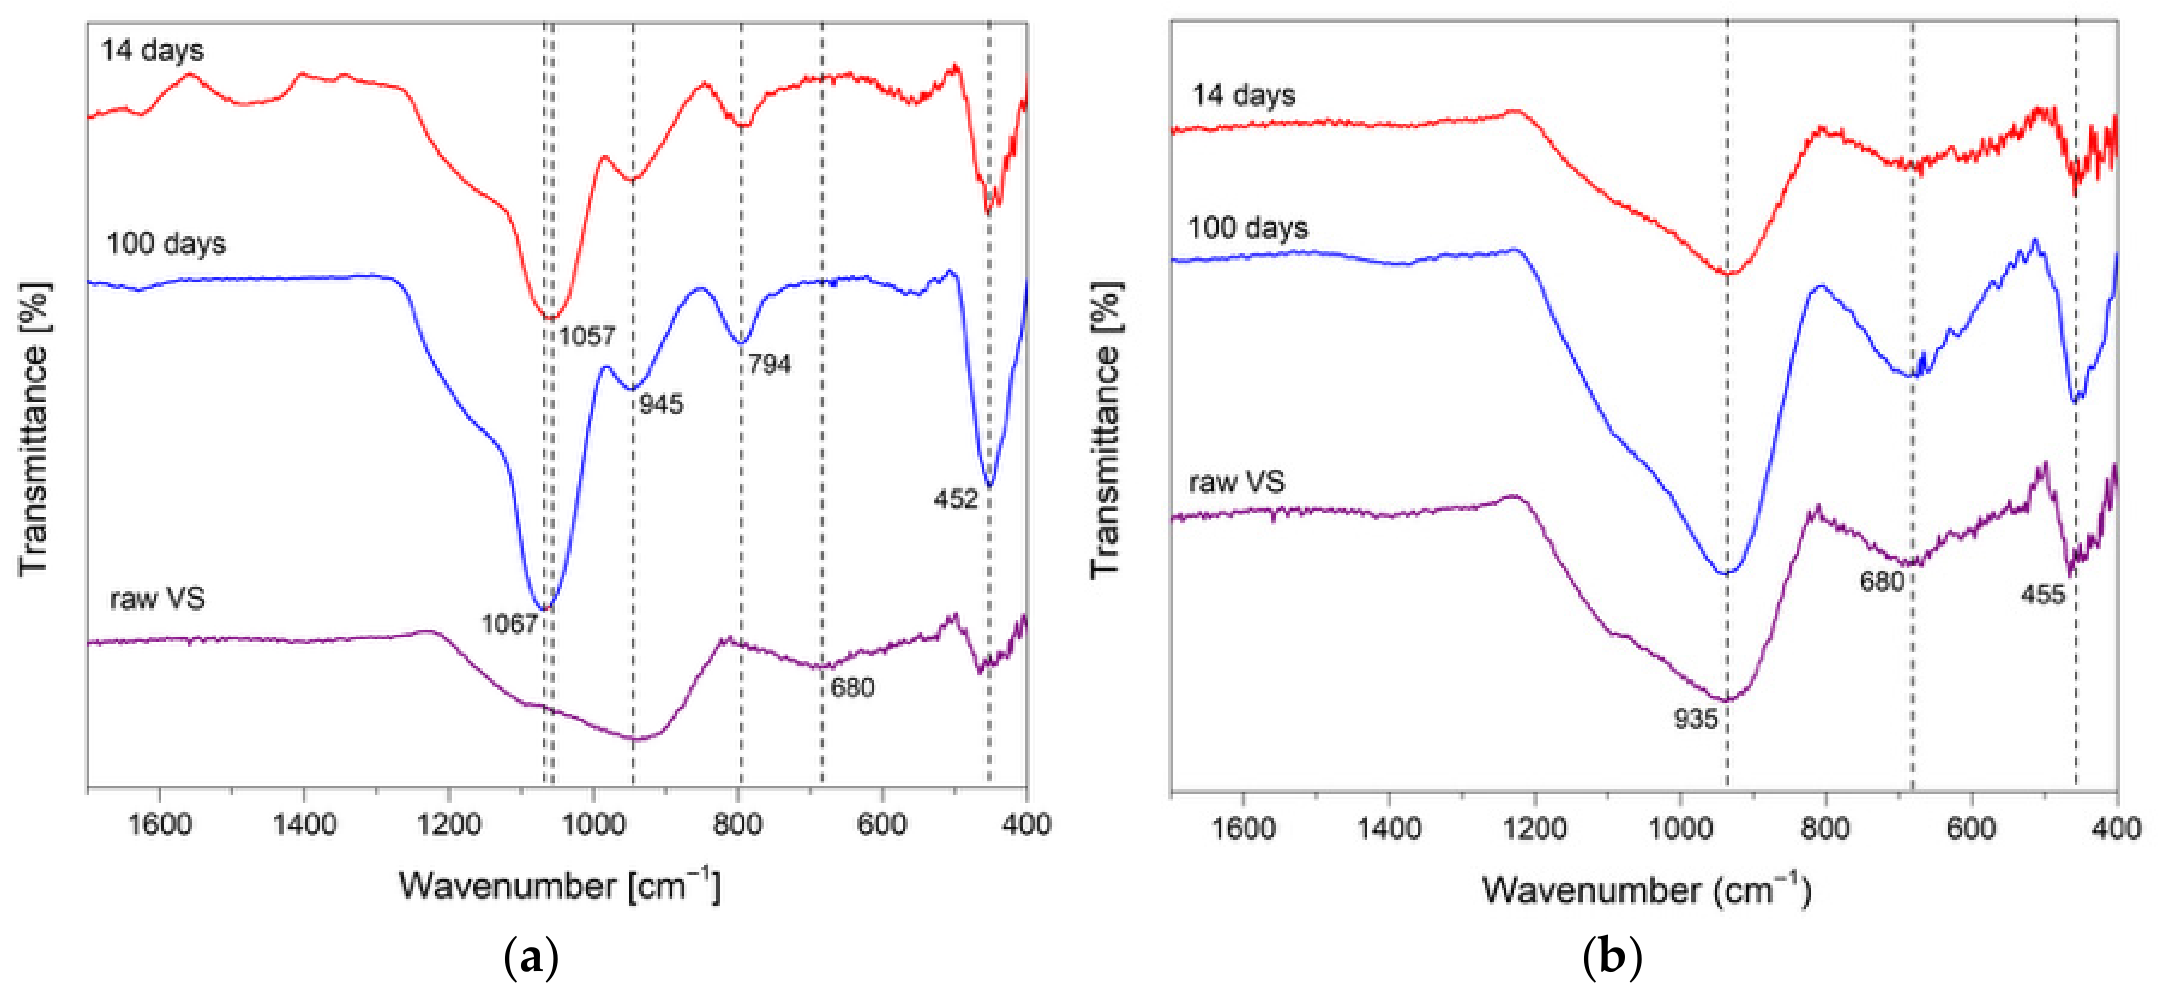
FTIR analysis confirmed this interpretation and allowed for a more detailed assessment of the structural changes. Under acidic conditions (Figure 7a), the primary Si–O–T band shifted from approximately 935 cm−1 in the raw VS to about 1057 cm−1 after 14 days, and it continued to change after 100 days. This was accompanied by a notable decrease in the intensity of the ~945 cm−1 band, which is linked to non-bridging oxygen [37,39]. This suggests the removal of network modifiers and a growing dominance of Si–O–Si linkages. In addition, the appearance of the ~794 cm−1 band and the significant increase of the ~452 cm−1 Si–O–Si bending vibrations confirm the formation of a more polymerized silica structure [41]. The weakening of the ~680 cm−1 region (Si–O–Al) further indicates the removal of aluminum, consistent with the EDS results.
Figure 7.
FTIR spectra of plasma-vitrified slag after 14 and 100 days of exposure in (a) acidic and (b) alkaline environments.
Under alkaline conditions (Figure 7b), the changes differ: the main band (~935 cm−1) remains broad, while the intensities of the bands around ~680 cm−1 and ~455 cm−1 increase after 100 days, showing active Si–O–Si bending. This indicates ongoing bond breaking and reformation processes.
Unlike acidic media, where selective dissolution dominates, alkaline conditions promote a dissolution–reprecipitation mechanism, leading to partial structural reorganization without significant changes in overall composition. This interpretation aligns with the evolution of Si/Al and Ca/Si atomic ratios (Table 6), which remained nearly unchanged in alkaline media but decreased significantly under acidic conditions.
Table 6.
EDS data of vitrified slag (VS) before and after exposure to alkaline and acidic media.
These results indicate that the dissolution-induced release of Ca2+ and Al3+ ions governs the slag reactivity. Acidic conditions promote selective leaching and structural polymerization, while alkaline conditions limit dissolution–reprecipitation and partial reorganization. As a result, the amorphous VS fraction may act as a chemically reactive component rather than an inert filler [26].
3.3. Characterization of Acid-Based Geopolymer
3.3.1. Effect of Phosphoric Acid Concentration on Geopolymer Structure
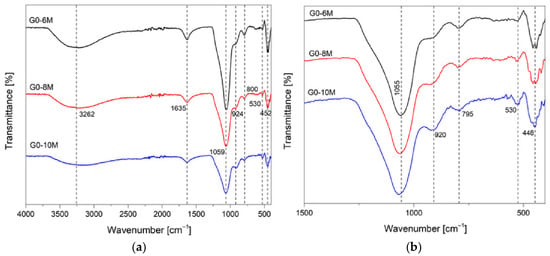
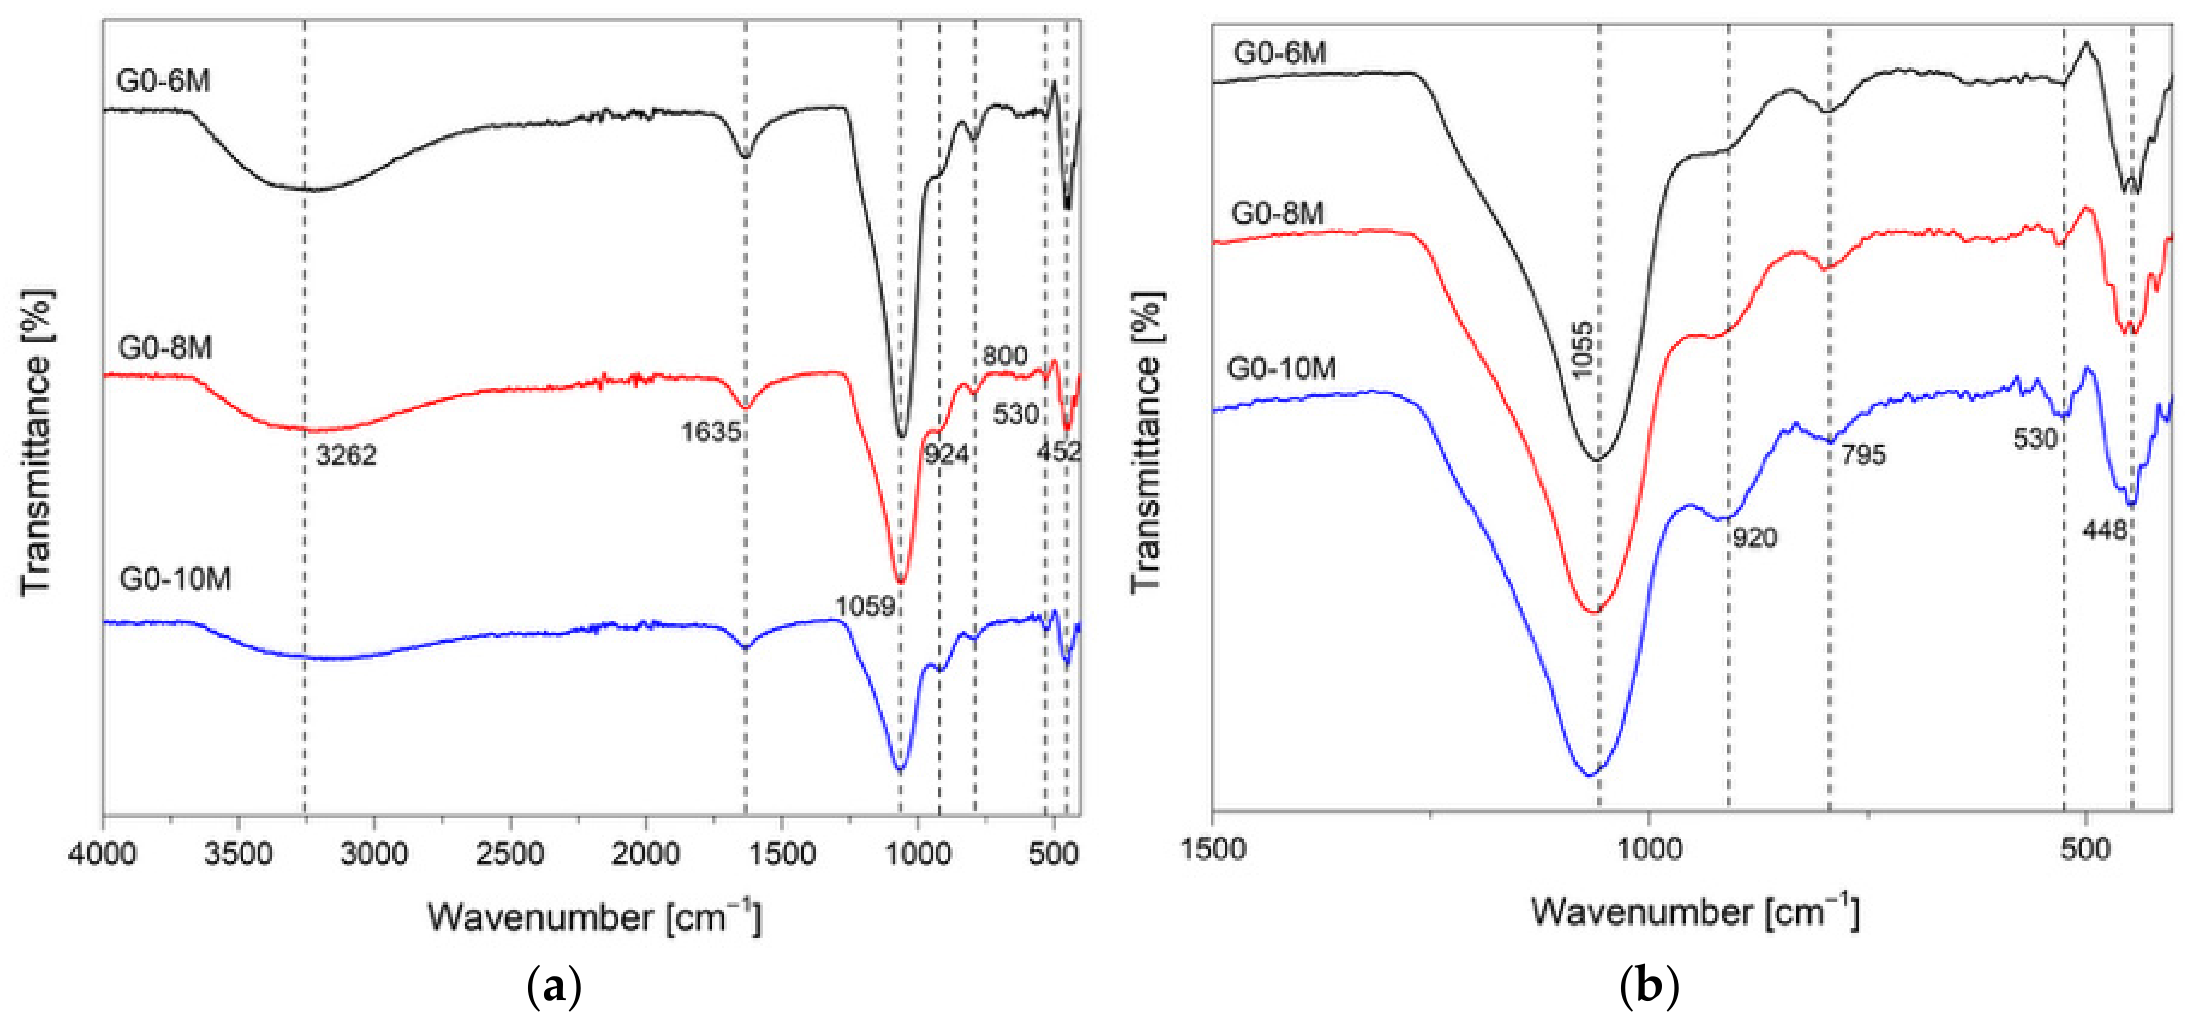
The FTIR spectra of the G0-6M, G0-8M, and G0-10M geopolymer samples synthesized using phosphoric acid solutions at concentrations of 6 M, 8 M, and 10 M are shown in Figure 8a. Notably, the absolute intensities of the FTIR bands did not increase consistently with phosphoric acid concentration. For instance, the sample prepared with 10 M H3PO4 showed lower overall absorbance compared to the G0-6M sample. This behavior can be attributed to various factors affecting the ATR-FTIR measurements, including differences in sample densification, porosity, contact quality with the ATR crystal, and variations in water content. Lower-acid-concentration samples tended to retain more physically bound water, which significantly contributes to FTIR absorption, especially in the O–H stretching region. Vibrations at 3262 cm−1 and 1635 cm−1 are particularly associated with O–H stretching and H–O–H bending vibrations, respectively, representing structural hydroxyl groups and physically adsorbed water. To allow for a comparison of structural features independent of absolute absorbance, the spectra were also normalized (Figure 8b). The normalized spectra revealed systematic changes in band shape and relative contributions as the acid concentration increased.
Figure 8.
ATR-FTIR spectra of geopolymer samples synthesized with varying concentrations of phosphoric acid: (a) original spectra; (b) normalized spectra.
The asymmetric Si–O–Al and Si–O–Si bonds, observed in MK at 1070 cm−1 (Appendix A), shifted toward lower 1055 cm−1 in the geopolymer system, indicating the formation of the asymmetric stretching vibrations of P–O–T (where T = Si or Al) units [25,36]. The slight displacement of the peak maximum from 1055 to 1059 cm−1 suggests a contribution from phosphate-related structural units (P=O and P–O–Si), which increases with increasing acid concentration [25]. Bending vibrations of Si–O–P at 920 cm−1) were the strongest for G0-10M, indicating a higher phosphate content within the structure [42]. On the contrary, the weak adsorption indicates a phosphorus deficit in the G0-6M matrix. The adsorption bands at around 800 cm−1 and 450 cm−1, characteristic of Si–O vibration, indicate the presence of unreacted quartz [36], which are also visible in metakaolin FTIR spectra (Appendix A). The band at approximately 530 cm−1 was the strongest for G0-6M and weakest for G0-10M. This may be attributed to the stretching vibration of the P–O–Al band arising from the transformations of the symmetric stretching vibration of P–O–P, recently observed by H. Lin et al. [42].
These observations suggest that 8M is an optimal phosphoric acid concentration that promotes the formation of a more condensed phosphate-containing geopolymer network, confirming the results reported by others [34,42].
3.3.2. Vitrified Slag in Geopolymer Systems
Based on the initial structural characterization (Figure 6) and chemical stability tests of the vitrified slag (VS), the mixture of fractions primarily containing anorthite and amorphous phases (x/y = 2.75 and x/y = 0.125 in Table 5) were selected as representative VS samples for the geopolymer formulations (Table 3) and used in geopolymer systems.
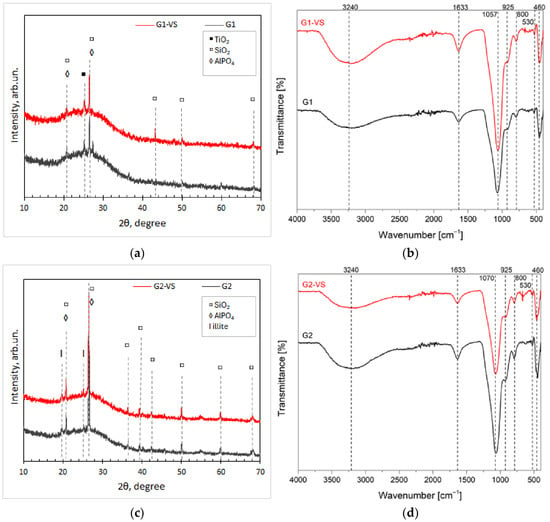
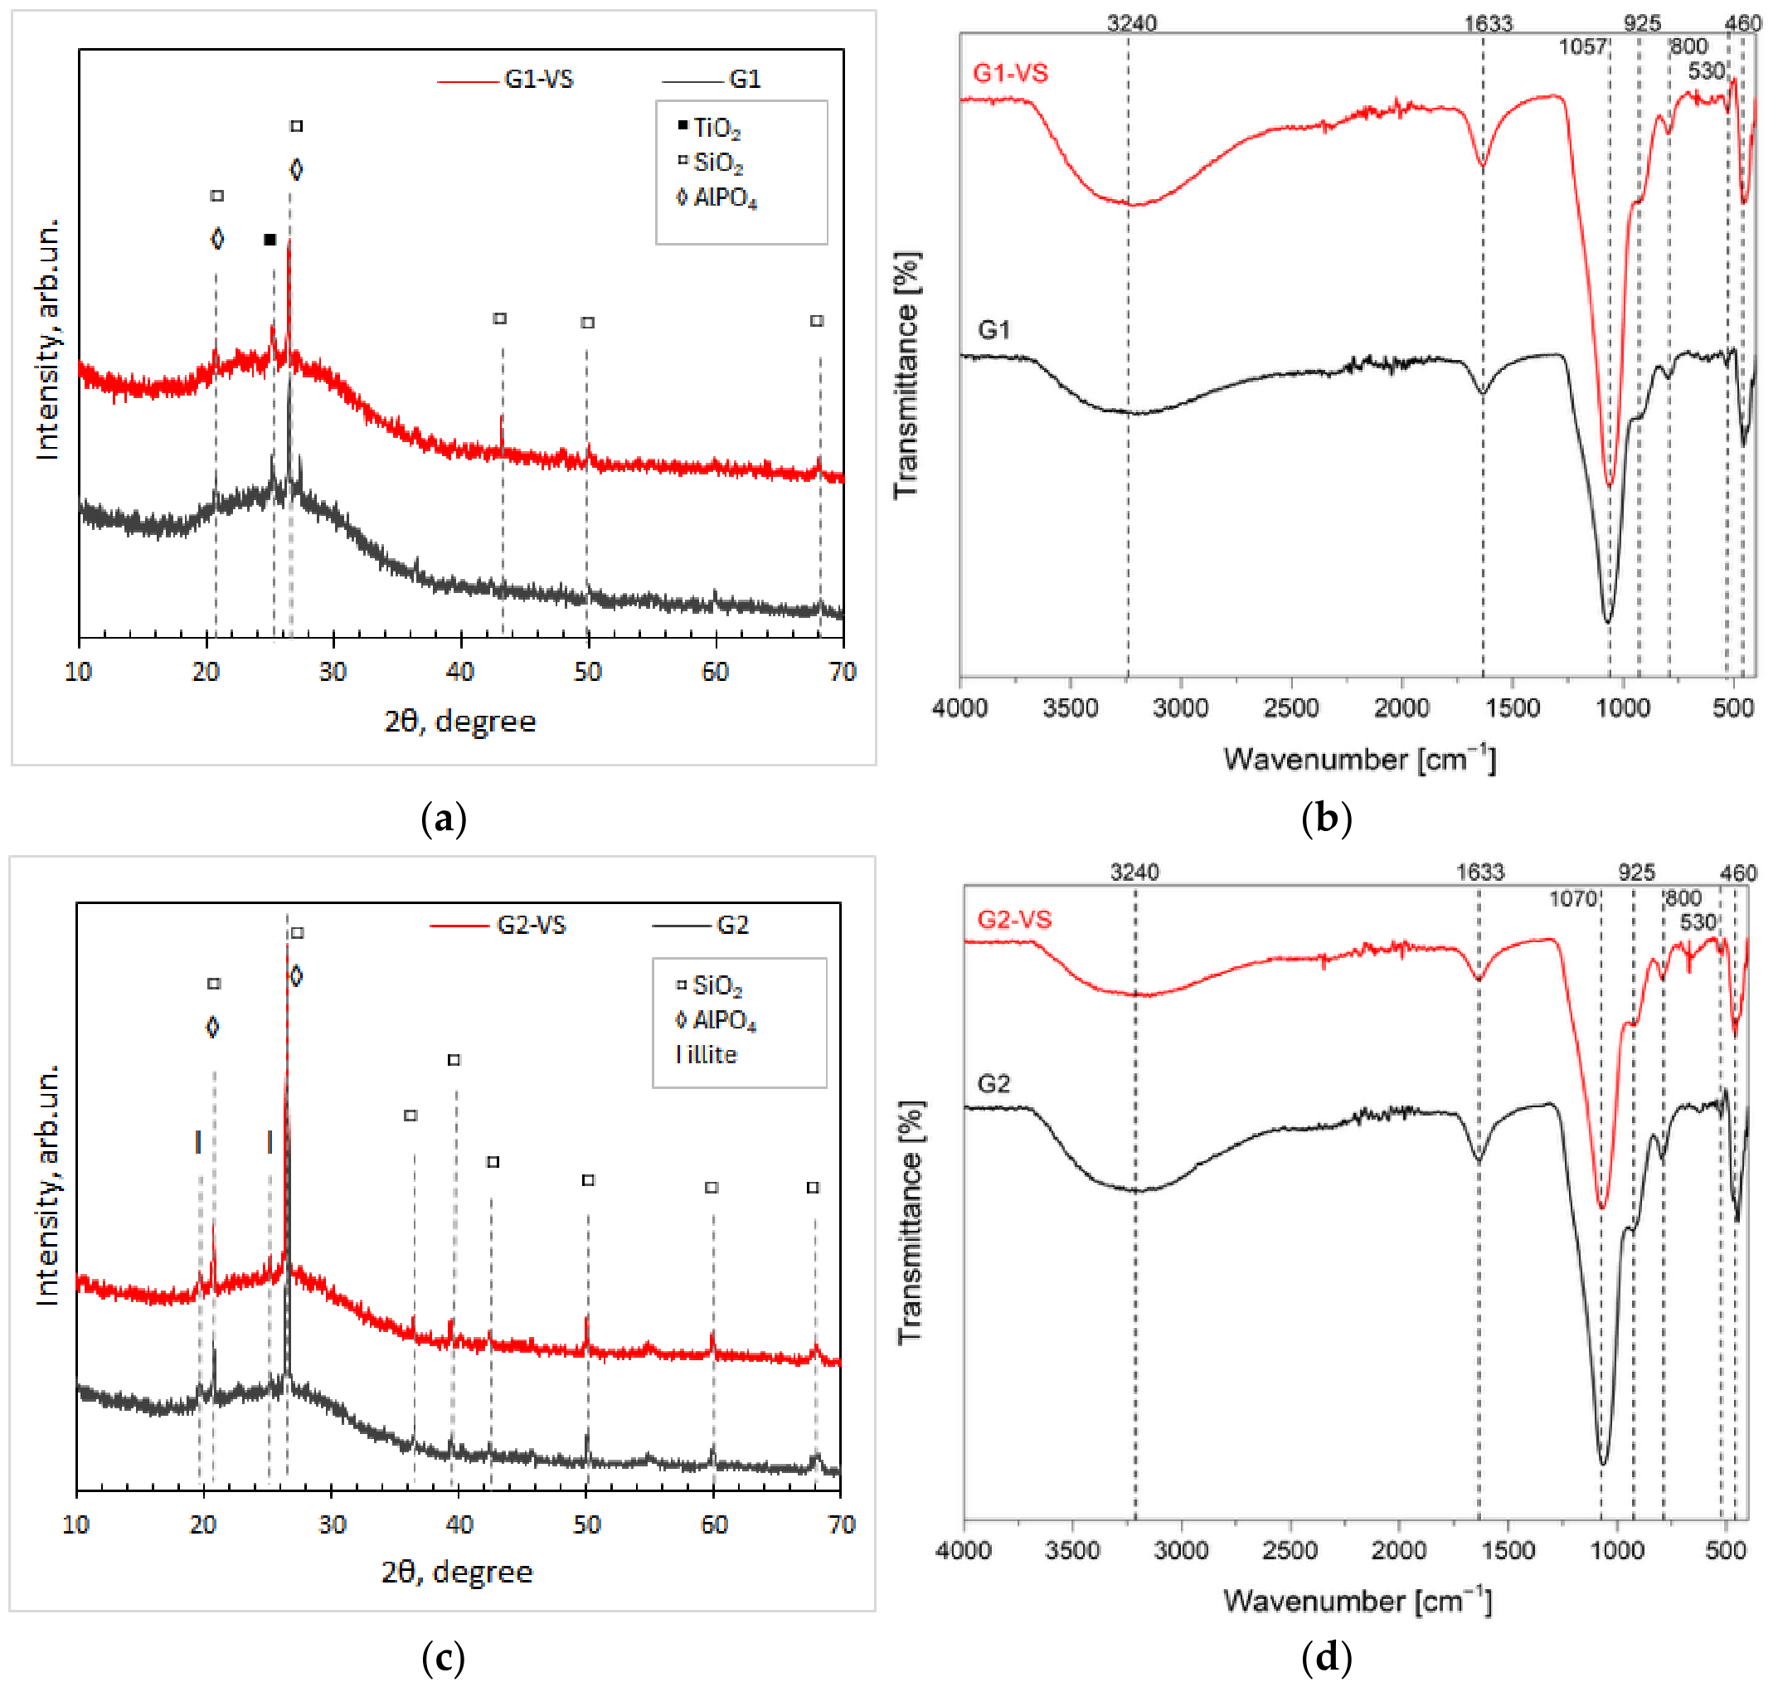
The XRD and FTIR results are shown in Figure 9, allowing for a comparative assessment of the G1-VS and G2-VS geopolymer systems regarding their responses to VS addition.
Figure 9.
XRD patterns and FTIR spectra of geopolymers with 5 wt.% of VS replaced MK: (a,b) geopolymer prepared from metakaolin MK1; (c,d) geopolymer prepared from metakaolin MK2.
The X-ray diffraction pattern (Figure 9) indicates that the modified geopolymer systems did not differ significantly from the systems without VS inclusion. The matrix mainly consisted of an amorphous phase with inclusions of crystalline phases, such as anatase (TiO2) or traces of raw kaolinite-illite metaclay, indicating incomplete chemical reactions. Other peaks corresponded to quartz (SiO2) and aluminum phosphate (AlPO4). Since aluminum phosphate is isostructural with silicon dioxide [26], it exhibits the same peaks, making it difficult to confirm or deny its formation. Nevertheless, these peaks were more prominent in the G2-VS samples, suggesting changes in geopolymerization due to VS addition [28].
FTIR analysis revealed that the MK type modifies the geopolymer network structure. In the G1 system (Figure 9b), the main band at ~1057 cm−1, corresponding to stretching vibrations of P–O–Al or P–O–Si, shifted to higher wavenumbers (~1070 cm−1) in the G2 sample. In MK, this band relates to Si–O–Si and Si–O–Al vibrations (Appendix A), thus suggesting a higher degree of dealumination in G2. The band at ~925 cm−1, associated with P–O– linkages, was less prominent in G1 than in G2, implying more effective incorporation of phosphate units into the G2 structure, with a possible formation of an aluminum phosphate phase [28,34,42], which was confirmed by XRD. Characteristic bands of unreacted quartz were located at 800 cm−1 and 460 cm−1 [28], and also confirmed by XRD data (Figure 9).
The incorporation of VS may have altered polycondensation reactions in the G1-VS sample, as the bands at 1633 cm−1 and 3240cm−1, characteristic of adsorbed water, became more prominent (Figure 9b). Contrary to this, in G2-VS, the appearance of a weak band around ~530 cm−1 region, assigned to Si–O–P bonds [28,43], indicates possible alterations in aluminum coordination, likely related to the additional aluminum supplied by VS. The same band appeared in VS after short exposure to acidic media (Figure 7).
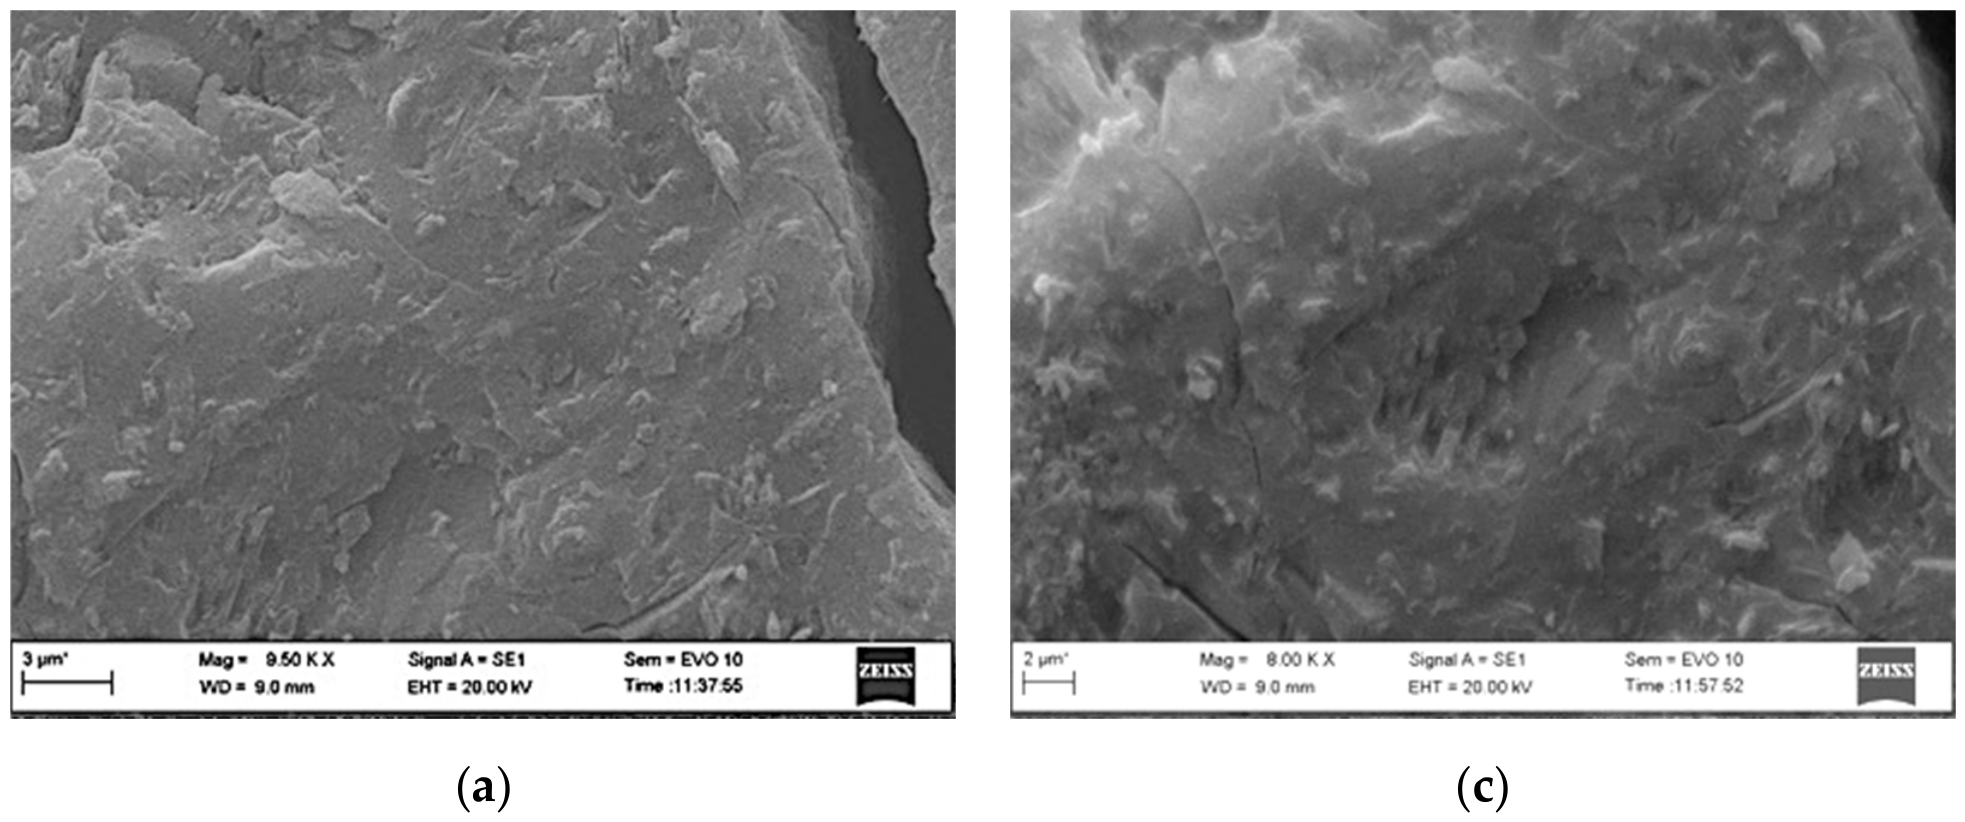
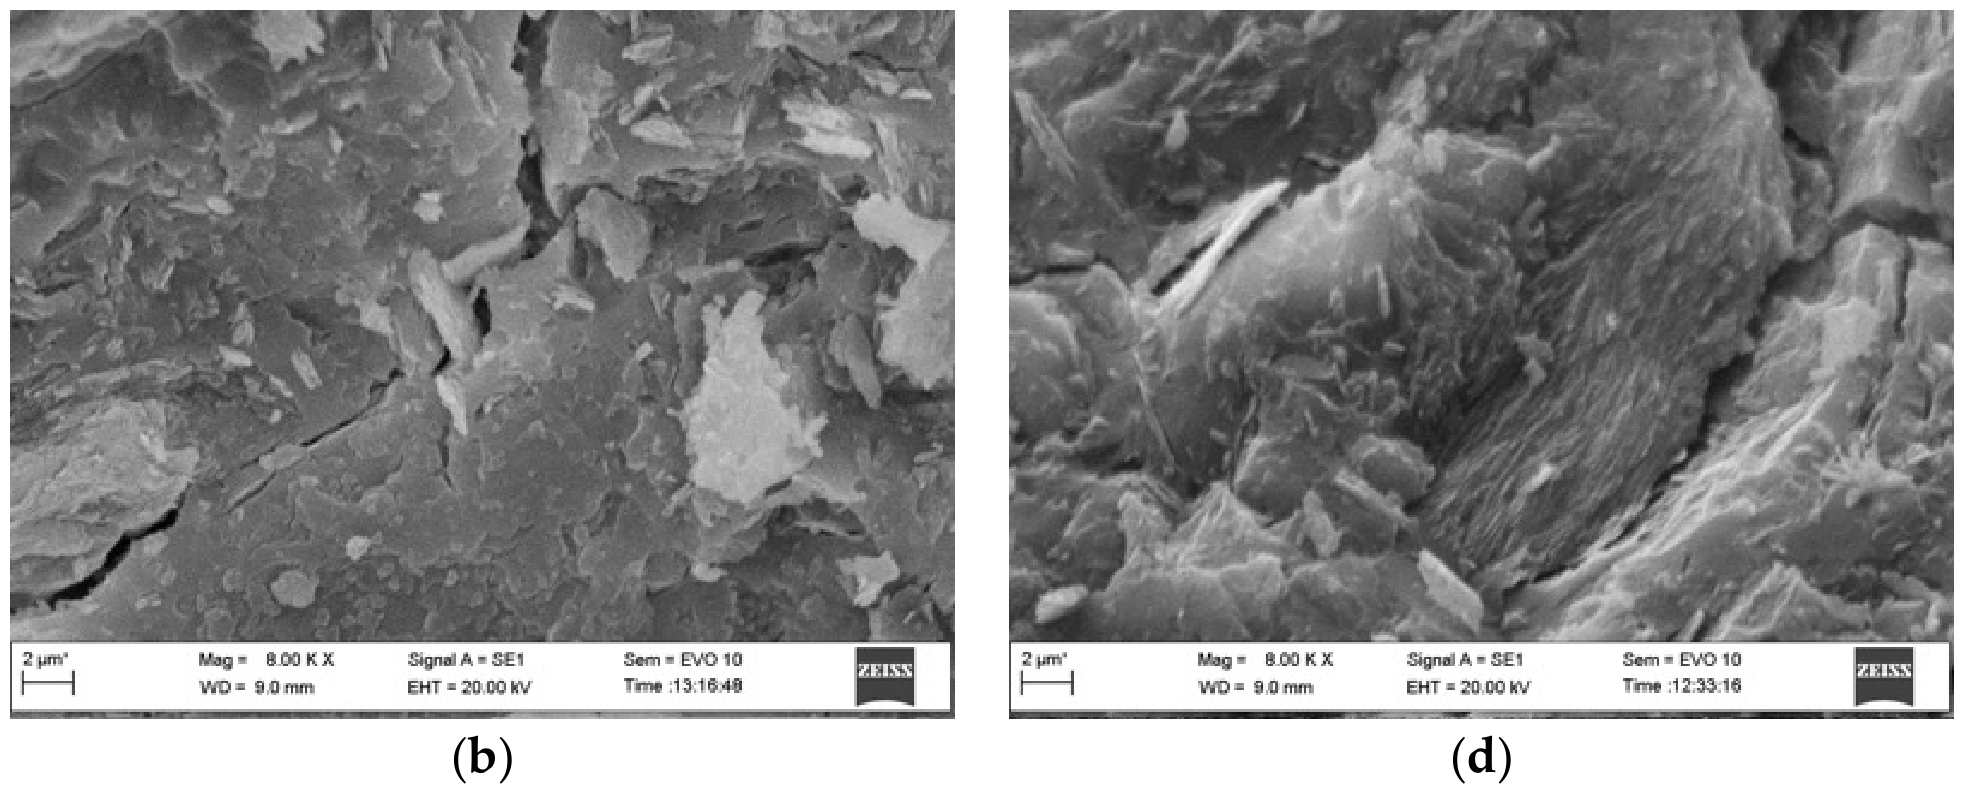
SEM images of geopolymer samples with and without VS addition are presented in Figure 10. Although both geopolymers without VS exhibited a dense structure, the G2 sample showed bright inclusions, possibly traces of unreacted kaolinitic-ilitic metaclay particles (Figure 9c). The incorporation of VS significantly altered the geopolymer structure, with more unreacted particles observed on the fracture surfaces of the G1-VS sample (Figure 10b). In contrast, the particles appeared more embedded in the amorphous, though heterogeneous, G2-VS matrix (Figure 10d). Point EDS analysis was performed, and the data are summarized in Table 7.
Figure 10.
SEM micrographs of geopolymer samples with and without VS: (a) G1; (b) G1-VS, (c) G2, (d) G2-VS, see notations in Table 7.
Table 7.
EDS data of geopolymer samples with and without VS.
Elemental analysis revealed that the G2 system contained a slightly lower content of Al and Si than the G1 composition. The incorporation of VS resulted in a nearly twofold reduction in P content, while the Si content doubled, suggesting partial dissolution of the reactants [28]. The main distinction among the samples lies in the Al content, which increased in G1-VS and decreased in G2-VS. Additionally, only two compositions, G1 and G2-VS, had an Al/P ratio close to 1.0, implying the formation of a well-formed geopolymer system [25,26,28,44]. On the contrary, an Al/P ratio greater than 2 was observed only in the G1-VS sample (Table 7), emphasizing the significance of the MK type in forming geopolymers, as noted by other studies [45]. On the other hand, the findings presented in [25,44] indicate that variable Al/P ratios reduce the mechanical strength of consolidated geopolymer material.
The measured splitting tensile strength and calculated compressive strength data are provided in Table 8. Despite variations in formulation parameters and raw materials used for geopolymer production, the calculated compressive strengths of both compositions without VS inclusion (G1 and G2) are in good agreement with those reported by others [19,25,28,46]. Nevertheless, the impact of the partial substitution of MK by 5% VS on the geopolymer mechanical strength was controversial. The G1-VS sample showed a strength reduction of approximately ~35%, whereas the G2-VS system exhibited a mechanical performance comparable to that of the reference sample (Table 8). According to the EDS data (Table 7), the increased Al content in the G1-VS sample suggests that the released Ca2+ and Al3+ ions from VS may have promoted the formation of poorly connected regions or –Si–O–P–O–Si– bonds [26]. The presence of unreacted MK particles (Figure 10b) suggests an excess of PO4 units, leading to a weakened structure [30]. The high strength of G2-VS might be related to the use of kaolinitic-illitic metakaolin (MK2), which, when partially replaced by faster-dissolving VS, contributes to the formation of a more stable matrix that effectively accommodates additional species released from VS. The FTIR results support this assumption, as the shift of the Si–O–P band to higher wavenumbers (around 1070 cm−1) indicates a more efficient incorporation of phosphate units into the structure (Figure 9d), thus implying the formation of the crystalline AlPO4 phase detected by XRD (Figure 9c).
Table 8.
Split tensile strength of geopolymer samples with and without VS addition.
Overall, the results demonstrate that even a small addition of 5% vitrified slag (VS) significantly influences the geopolymer structure and performance, confirming that its effect is controlled not only by its presence but also by its intrinsic physicochemical characteristics. Specifically, the impact of VS depends on its amorphous content, dissolution behavior, and interactions with the primary metakaolin precursor. Therefore, careful adjustment of the alumino-silicate precursor and the Si/P ratio is required to achieve optimal mechanical performance.
Building on these observations, a unified mechanistic framework can be proposed as follows: (1) plasma processing governs the amorphous-to-crystalline ratio in VS through thermal gradients and cooling rates; (2) the structural state of the amorphous phase features a network of non-bridging oxygens with inclusions of modifiers, such as Ca2+ or Al3+, which control the dissolution kinetics; and (3) in acidic media, the release of Ca2+ and Al3+ species may contribute differently to the depolymerization and polycondensation reactions, determining the mechanical properties of the geopolymer.
4. Concluding Remarks
In this study, atmospheric plasma processing technology was used to transform wind turbine blade waste into vitrified slag with potential valorization pathways. Results showed that plasma processing governs the amorphous-to-crystalline phase ratio in VS through thermal gradients and cooling rates. XRD analysis revealed that VS in the peripheral zone, rather than in the zone closest to the plasma flow core, exhibited the highest amorphous content, along with a minor crystalline phase primarily composed of anorthite. Based on the chemical stability test, VS showed a nearly inert character, with partial reorganization within the structure in alkaline media. In contrast, dissolution of Ca and Al ions with structural polymerization was observed in acidic environments, therefore highlighting its possible application as an active component in acid-based geopolymer systems. Structural characterization of geopolymers with a reactive precursor (metakaolin) replaced by 5% VS revealed that the Al/P ratio of the geopolymer is not the major factor. The activity of VS and the polymerization reactions depend primarily on the raw alumino-silicate precursor, which determines the formation of a crystalline aluminum phosphate phase along with an amorphous phase, thus resulting in strength comparable to that of the reference material. Nevertheless, the impact of the source materials on the fundamental chemistry of geopolymerization requires a more comprehensive analysis, which was beyond the scope of this study, though it should be considered in future work. The VS content should be increased to evaluate the effects of Ca and Al on geopolymerization reactions, including TGA, XPS, and other analytical tools. The mixture design and curing conditions should also be evaluated. Overall, the potential application of vitrified slag from recycled WTBW obtained via plasma technology in construction materials appears promising, although practical implementation remains to be developed.
Author Contributions
Conceptualization, V.S. and R.K.-D.; Methodology, V.S. and R.K.-D.; Software, A.B.; Validation, V.S., A.B. and R.K.-D.; Formal analysis, V.S., A.B. and R.K.-D.; Resources, V.G., V.S. and R.K.-D.; Data curation, V.S., A.B. and R.K.-D.; Writing—original draft preparation, V.S. and R.K.-D.; Writing—review and editing, V.G.; Project administration, V.G. All authors have read and agreed to the published version of the manuscript.
Funding
This research received no external funding.
Institutional Review Board Statement
Not applicable.
Informed Consent Statement
Not applicable.
Data Availability Statement
The original contributions presented in this study are included in the article. Further inquiries can be directed to the corresponding authors.
Acknowledgments
During the preparation of this manuscript, the authors used Grammarly tool (Grammarly for Microsoft Office, Version 2.8.262) for the purposes of improving grammar and language clarity. The authors have reviewed and edited the output and take full responsibility for the content of this publication.
Conflicts of Interest
The authors declare no conflicts of interest.
Appendix A
Clay Characterization Before and After Thermal Treatment
The transformation of kaolinitic/illitic clay into reactive metakaolin is a crucial step in the synthesis of geopolymers, as the reactivity of the precursor largely depends on its structural disorder and the availability of reactive aluminum species [47]. The X-ray diffraction patterns of raw kaolin samples (Figure A1) exhibited well-defined reflections characteristic of crystalline kaolinite, along with quartz (SiO2) impurities (at 2θ = 26.6°, and 50.1°), which were larger for the K2 sample.
Figure A1.
XRD patterns and FTIR spectra of kaolin and metakaolin precursors: (a) XRD of raw kaolins; (b) FTIR of raw kaolins; (c) XRD of metakaolins; (d) FTIR of metakaolins.
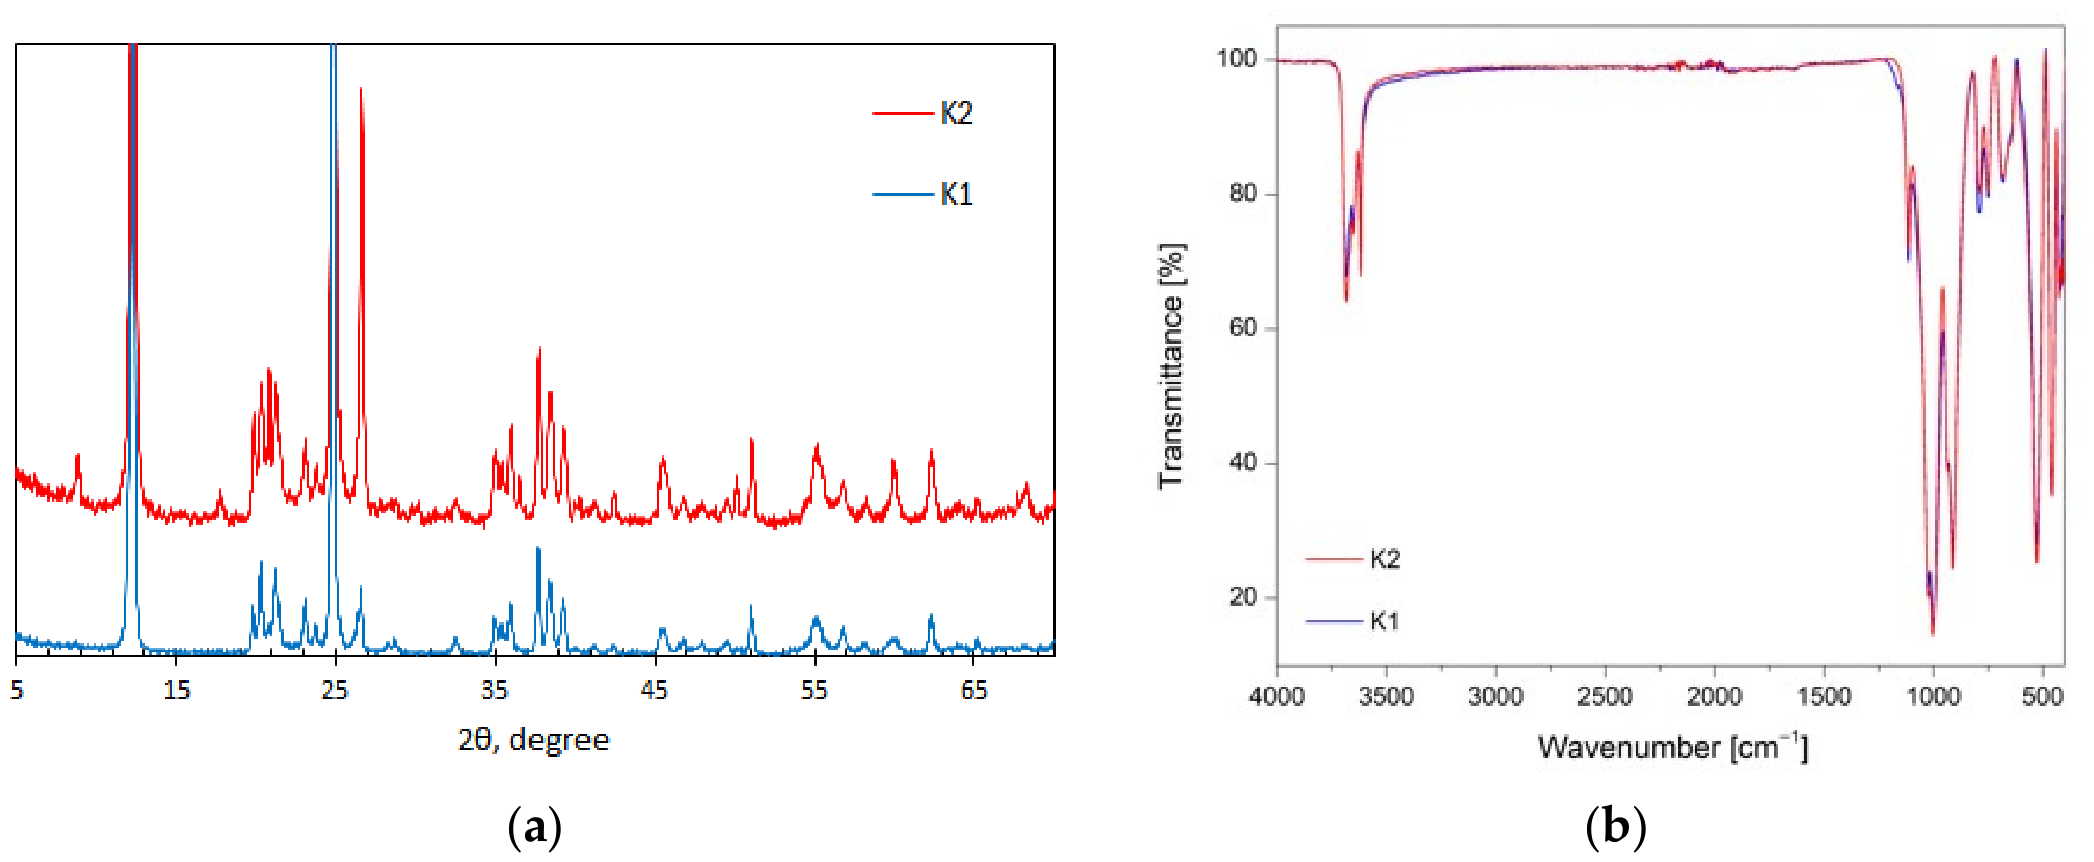
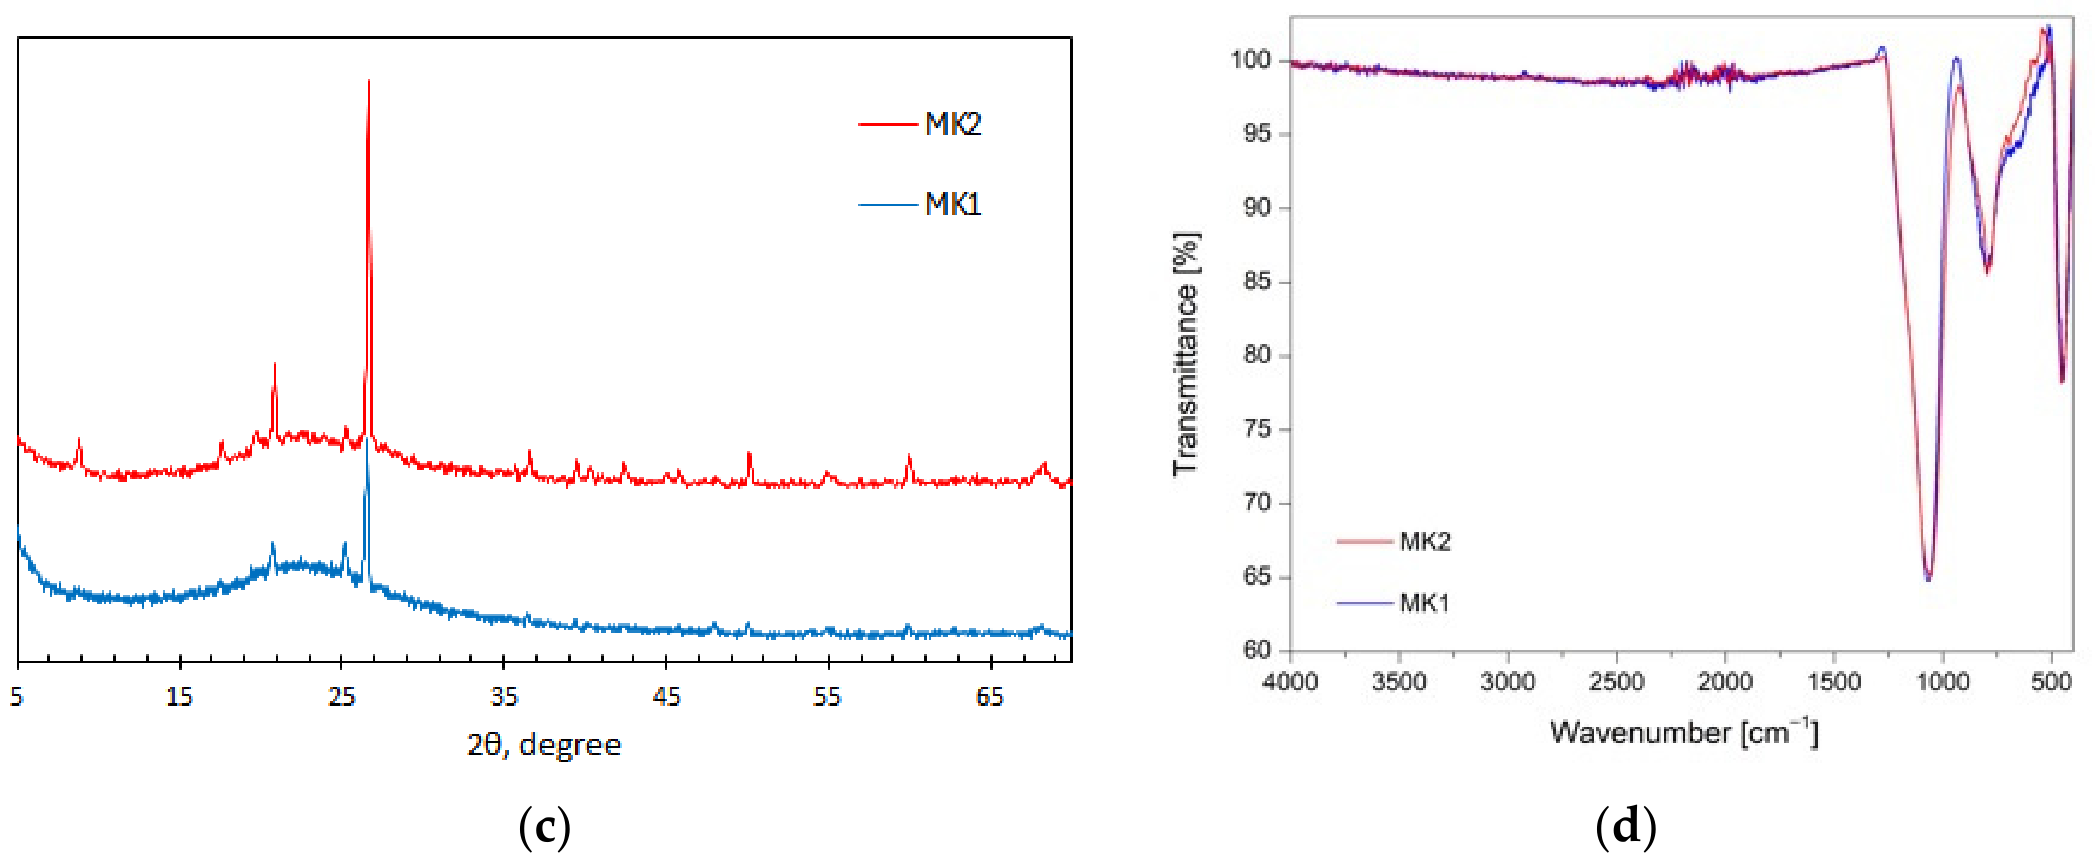
After calcination at 800 °C, the peaks of kaolinite completely disappeared, while peaks of SiO2 (2θ = 26.6°), TiO2 (2θ = 25.2°) remained in both MKs (Figure A1). A broad diffuse halo centered at approximately 2θ = 19–25° indicates the dihydroxylation of kaolinite and the collapse of its ordered layered structure. However, the small illite peaks were still visible in the MK2 sample (Figure A1). Nevertheless, the high amorphization of both metakaolins significantly enhanced the material’s chemical reactivity by shifting aluminum atoms from octahedral coordination in kaolinite to a more reactive environment that can participate in geopolymerization reactions [48].
Structural changes observed by FTIR are presented in Figure A1b,d. In the raw K1 and K2 samples, distinct absorption bands at 3620 cm−1 and 1000 cm−1, associated with OH stretching and Al–OH vibrations, respectively, reflect the ordered structure of kaolinite. After calcination, these bands were significantly reduced or disappear, indicating dihydroxylation and structural collapse. Additionally, the main Si–O–T (where T = Si or Al) vibration band (Figure A1b) became broader and slightly shifted to approximately 1070 cm−1 (Figure A1d), which is typical of amorphous aluminosilicate networks [34,41]. The presence of quartz, as indicated by XRD (Figure A1c), was also evident in the FTIR spectrum as Si–O vibrations at 800 and 449 cm−1, characteristic of amorphous silica.
References
- Mishnaevsky, L.; Branner, K.; Petersen, H.N.; Beauson, J.; McGugan, M.; Sørensen, B.F. Materials for wind turbine blades: An overview. Materials 2017, 10, 1285. [Google Scholar] [CrossRef] [Scilit]
- Riley, D.-K.; Chen, Y.; Lu, C.; Mohagheghian, I.; Hassanin, H.; Sareh, P. Morphing structural materials used in wind turbine blades. Renew. Sustain. Energy Rev. 2025, 216, 115618. [Google Scholar] [CrossRef] [Scilit]
- Rani, M.; Choudhary, P.; Krishnan, V.; Zafar, S. A review on recycling and reuse methods for carbon fiber/glass fiber composites waste from wind turbine blades. Compos. Part B Eng. 2021, 215, 108768. [Google Scholar] [CrossRef] [Scilit]
- Paulsen, E.B.; Enevoldsen, P. A multidisciplinary review of recycling methods for end-of-life wind turbine blades. Energies 2021, 14, 4247. [Google Scholar] [CrossRef] [Scilit]
- Broniewicz, M.; Halicka, A.; Buda-Ożóg, L.; Broniewicz, F.; Nykiel, D.; Jabłoński, Ł. The Use of Wind Turbine Blades to Build Road Noise Barriers as an Example of a Circular Economy Model. Materials 2024, 17, 2048. [Google Scholar] [CrossRef] [Scilit]
- Pławecka, K.; Przybyła, J.; Korniejenko, K.; Lin, W.T.; Cheng, A.; Łach, M. Recycling of mechanically ground wind turbine blades as filler in geopolymer composite. Materials 2021, 14, 6539. [Google Scholar] [CrossRef] [Scilit]
- Liu, T.; Paraskevoulakos, C.; Mughal, U.A.; Tyurkay, A.; Lushnikova, N.; Song, H.; Duyal, C.; Karnick, S.T.; Gauvin, F.; Lima, A.T. Mechanisms and applications of wind turbine blade waste in cementitious composites: A review. Mater. Des. 2025, 251, 113732. [Google Scholar] [CrossRef] [Scilit]
- Boulos, M.I.; Fauchais, P.L.; Pfender, E. (Eds.) Handbook of Thermal Plasmas; Springer International Publishing: Cham, Switzerland, 2023. [Google Scholar] [CrossRef] [Scilit]
- Kępys, W.; Tora, B.; Václavík, V.; Jaskowska-Lemańska, J. The Effect of Recycled Wind Turbine Blade GFRP on the Mechanical and Durability Properties of Concrete. Sustainability 2025, 17, 8201. [Google Scholar] [CrossRef] [Scilit]
- Zhang, J.; Zeng, J.; Wu, J.; Yue, Y.; Zhang, J.; Qian, G. A plasma thermal slag-derived from hazardous waste has a born hydrothermal stability. J. Hazard. Mater. 2021, 401, 123444. [Google Scholar] [CrossRef] [Scilit] [PubMed]
- Uscila, R.; Grigaitienė, V.; Valinčius, V.; Kėželis, R.; Gimžauskaitė, D.; Kavaliauskas, Ž. Research on the Energy Characteristics of a Transferred Arc Plasma-Chemical Reactor for Waste Treatment. Appl. Sci. 2023, 13, 4221. [Google Scholar] [CrossRef] [Scilit]
- Kavaliauskas, Ž.; Kėželis, R.; Grigaitienė, V.; Milieška, M.; Valinčius, V.; Uscila, R.; Kriūkienė, R.; Baltušnikas, A. An Investigation of Fly Ash and Slag Processing and Fiber Production Using Plasma Technology. Appl. Sci. 2024, 14, 4801. [Google Scholar] [CrossRef] [Scilit]
- Ma, W.; Shi, W.; Shi, Y.; Chen, D.; Liu, B.; Chu, C.; Li, D.; Li, Y.; Chen, G. Plasma vitrification and heavy metals solidification of MSW and sewage sludge incineration fly ash. J. Hazard. Mater. 2021, 408, 124809. [Google Scholar] [CrossRef] [Scilit]
- Boulos, M.I.; Jurewicz, J.W.; Fauchais, P.L.; Pfender, E. Plasma in the Waste Treatment Industry. In Handbook of Thermal Plasmas; Springer International Publishing: Cham, Switzerland, 2023; pp. 1739–1804. [Google Scholar] [CrossRef] [Scilit]
- Kavaliauskas, Ž.; Kėželis, R.; Grigaitienė, V.; Marcinauskas, L.; Milieška, M.; Valinčius, V.; Uscila, R.; Snapkauskienė, V.; Gimžauskaitė, D.; Baltušnikas, A. Recycling of Wind Turbine Blades into Microfiber Using Plasma Technology. Materials 2023, 16, 3089. [Google Scholar] [CrossRef] [Scilit]
- Kalpokaitė-Dičkuvienė, R.; Snapkauskienė, V. Prospects for the Valorization of Wind Turbine Blade Waste: Fiber Recovery and Recycling. Sustainability 2025, 17, 4202. [Google Scholar] [CrossRef] [Scilit]
- Deubener, J.; Müller, R.; Behrens, H.; Heide, G. Water and the glass transition temperature of silicate melts. J. Non-Cryst. Solids 2003, 330, 268–273. [Google Scholar] [CrossRef] [Scilit]
- Provis, J.L.; van Deventer, J.S.J. Geopolymers; Woodhead Publishing Limited: Cambridge, UK, 2009. [Google Scholar] [CrossRef] [Scilit]
- Tochetto, G.; Goulart Oliveira, K.; D’Agostini, M.; Franchin, G.; Elsayed, H.; Hotza, D.; Nagel-Hassemer, M.E.; Colombo, P. A comprehensive review of phosphate-based acid geopolymers: Production, properties, and applications. J. Phys. Chem. Solids 2026, 211, 113489. [Google Scholar] [CrossRef] [Scilit]
- Zhao, J.; Tong, L.; Li, B.; Chen, T.; Wang, C.; Yang, G.; Zheng, Y. Eco-friendly geopolymer materials: A review of performance improvement, potential application and sustainability assessment. J. Clean. Prod. 2021, 307, 127085. [Google Scholar] [CrossRef] [Scilit]
- Zribi, M.; Baklouti, S. Investigation of Phosphate based geopolymers formation mechanism. J. Non-Cryst. Solids 2021, 562, 120777. [Google Scholar] [CrossRef] [Scilit]
- Zribi, M.; Baklouti, S. Phosphate-based geopolymers: A critical review. Polym. Bull. 2022, 79, 6827–6855. [Google Scholar] [CrossRef] [Scilit]
- Grigaitienė, V.; Milieška, M.; Kėželis, R.; Valinčius, V. Investigation of In-Flight Alumina Particle Interaction with a Plasma Jet in a Thermal Plasma Reactor. Crystals 2025, 15, 851. [Google Scholar] [CrossRef] [Scilit]
- Kalpokaitė-Dičkuvienė, R.; Baltušnikas, A.; Levinskas, R.; Čėsnienė, J. Incinerator residual ash—Metakaolin blended cements: Effect on cement hydration and properties. Constr. Build. Mater. 2019, 206, 297–306. [Google Scholar] [CrossRef] [Scilit]
- Le Parc, R.; Champagnon, B.; Dianoux, J.; Jarry, P.; Martinez, V. Anorthite and CaAl2Si2O8 glass: Low frequency Raman spectroscopy and neutron scattering. J. Non-Cryst. Solids 2003, 323, 155–161. [Google Scholar] [CrossRef] [Scilit]
- Djobo, J.N.Y.; Stephan, D. The reaction of calcium during the formation of metakaolin phosphate geopolymer binder. Cem. Concr. Res. 2022, 158, 106840. [Google Scholar] [CrossRef] [Scilit]
- Panda, S.; Liu, M.; Purusottam, R.N.; Walls, J.D.; Pestana, L.R.; Suraneni, P. Composition-structure relationships for calcium aluminosilicate glasses. Mater. Struct. 2025, 58, 187. [Google Scholar] [CrossRef] [Scilit]
- Pantongsuk, T.; Yu, T.; Zhang, B.; Liu, H.; Yuan, P.; Liu, D. Enhancing the performance of acid-activated geopolymer by substituting sugarcane bagasse ash with effective pre-treatment strategies. Cem. Concr. Compos. 2026, 169, 106537. [Google Scholar] [CrossRef] [Scilit]
- Gomez, E.; Rani, D.A.; Cheeseman, C.R.; Deegan, D.; Wise, M.; Boccaccini, A.R. Thermal plasma technology for the treatment of wastes: A critical review. J. Hazard. Mater. 2009, 161, 614–626. [Google Scholar] [CrossRef] [Scilit]
- Cheng, X.; Du, B.; He, J.; Long, W.; Su, G.; Liu, J.; Fan, Z.; Chen, L. A review of thermoplastic composites on wind turbine blades. Compos. Part B Eng. 2025, 299, 112411. [Google Scholar] [CrossRef] [Scilit]
- Snapkauskienė, V.; Tamošiūnas, A.; Grigaitienė, V. Sustainable Development of Renewable Energy; Elsevier: Amsterdam, The Netherlands, 2026; pp. 313–349. [Google Scholar] [CrossRef] [Scilit]
- Kalpokaitė-Dičkuvienė, R.; Stasiulaitiene, I.; Baltušnikas, A.; Yousef, S. Transforming Waste into Value: The Role of Recovered Carbon Fibre and Oil Shale Ash in Enhancing Cement-Based Structural Composites. Materials 2025, 18, 5636. [Google Scholar] [CrossRef] [Scilit]
- Dietel, J.; Warr, L.N.; Bertmer, M.; Steudel, A.; Grathoff, G.H.; Emmerich, K. The importance of specific surface area in the geopolymerization of heated illitic clay. Appl. Clay Sci. 2017, 139, 99–107. [Google Scholar] [CrossRef] [Scilit]
- Tchakouté, H.K.; Rüscher, C.H.; Kamseu, E.; Andreola, F.; Leonelli, C. Influence of the molar concentration of phosphoric acid solution on the properties of metakaolin-phosphate-based geopolymer cements. Appl. Clay Sci. 2017, 147, 184–194. [Google Scholar] [CrossRef] [Scilit]
- Lin, J.; Zaoui, A.; Sekkal, W. Nanoscale analysis of Si/P effects on the bonding and mechanical enhancement of phosphoric acid-based geopolymers. J. Sci. Adv. Mater. Devices 2026, 11, 101133. [Google Scholar] [CrossRef] [Scilit]
- Ryu, G.S.; Lee, Y.B.; Koh, K.T.; Chung, Y.S. The mechanical properties of fly ash-based geopolymer concrete with alkaline activators. Constr. Build. Mater. 2013, 47, 409–418. [Google Scholar] [CrossRef] [Scilit]
- Akanda, M.S.; Islam, M.S.; Akbar, M.A.; Chowdhury, A.M.S.; Gafur, M.A.; Uddin, M.S. Thermal and Morphological Assessment of the Penta-Layered, Hybrid U-Polyester Composite Reinforced with Glass Fibers and Polypropylene. Adv. Mater. Sci. Eng. 2024, 2024, 3911466. [Google Scholar] [CrossRef] [Scilit]
- Sorte, S.; Figueiredo, A.; Vela, G.; Oliveira, M.S.A.; Vicente, R.; Relvas, C.; Martins, N. Evaluating the feasibility of shredded wind turbine blades for sustainable building components. J. Clean. Prod. 2024, 434, 139867. [Google Scholar] [CrossRef] [Scilit]
- Bonon, A.J.; Weck, M.; Bonfante, E.A.; Coelho, P.G. Physicochemical characterization of three fiber-reinforced epoxide-based composites for dental applications. Mater. Sci. Eng. C 2016, 69, 905–913. [Google Scholar] [CrossRef] [Scilit]
- Ardhyananta, H.; Wijaya, A.M.; Hidayat, M.I.P.; Laksmono, J.A.; Sagadevan, S. Enhanced mechanical performance of epoxy/micro balloon/micro fibril cellulose composites. J. Mater. Res. Technol. 2025, 38, 1377–1388. [Google Scholar] [CrossRef] [Scilit]
- Capeletti, L.B.; Zimnoch, J.H. Fourier Transform Infrared and Raman Characterization of Silica-Based Materials. In Applications of Molecular Spectroscopy to Current Research in the Chemical and Biological Sciences; InTech: London, UK, 2016. [Google Scholar] [CrossRef] [Scilit]
- Lin, H.; Liu, H.; Li, Y.; Kong, X. Properties and reaction mechanism of phosphoric acid activated metakaolin geopolymer at varied curing temperatures. Cem. Concr. Res. 2021, 144, 106425. [Google Scholar] [CrossRef] [Scilit]
- Louati, S.; Hajjaji, W.; Baklouti, S.; Samet, B. Structure and properties of new eco-material obtained by phosphoric acid attack of natural Tunisian clay. Appl. Clay Sci. 2014, 101, 60–67. [Google Scholar] [CrossRef] [Scilit]
- Mathivet, V.; Jouin, J.; Parlier, M.; Rossignol, S. Control of the alumino-silico-phosphate geopolymers properties and structures by the phosphorus concentration. Mater. Chem. Phys. 2021, 258, 123867. [Google Scholar] [CrossRef] [Scilit]
- Celerier, H.; Jouin, J.; Tessier-Doyen, N.; Rossignol, S. Influence of various metakaolin raw materials on the water and fire resistance of geopolymers prepared in phosphoric acid. J. Non-Cryst. Solids 2018, 500, 493–501. [Google Scholar] [CrossRef] [Scilit]
- Louati, S.; Baklouti, S.; Samet, B. Geopolymers Based on Phosphoric Acid and Illito-Kaolinitic Clay. Adv. Mater. Sci. Eng. 2016, 2016, 2359759. [Google Scholar] [CrossRef] [Scilit]
- Buchwald, A.; Hohmann, M.; Posern, K.; Brendler, E. The suitability of thermally activated illite/smectite clay as raw material for geopolymer binders. Appl. Clay Sci. 2009, 46, 300–304. [Google Scholar] [CrossRef] [Scilit]
- Li, C.; Sun, H.; Li, L. A review: The comparison between alkali-activated slag (Si + Ca) and metakaolin (Si + Al) cements. Cem. Concr. Res. 2010, 40, 1341–1349. [Google Scholar] [CrossRef] [Scilit]

Disclaimer/Publisher’s Note: The statements, opinions and data contained in all publications are solely those of the individual author(s) and contributor(s) and not of MDPI and/or the editor(s). MDPI and/or the editor(s) disclaim responsibility for any injury to people or property resulting from any ideas, methods, instructions or products referred to in the content. |
© 2026 by the authors. Licensee MDPI, Basel, Switzerland. This article is an open access article distributed under the terms and conditions of the Creative Commons Attribution (CC BY) license.