


Abstract
In this study, zinc sulfide (ZnS) and manganese (Mn)-doped ZnS nanopowder were successfully prepared via a simple and cost-effective chemical precipitation method with various concentrations of Mn for use in UV photodetectors. The effects of Mn doping on the structural, morphological, and optoelectronic properties of ZnS nanopowder were studied. Structural analysis showed that all samples had a cubic structure with crystallite sizes approximately in the region of 2–3 nm. The morphological analysis using scanning electron microscopy confirmed the formation of well-dispersed spherical nanoparticles. Photoluminescence spectra show that Mn doping increased the luminescence intensity and caused a red shift in the emission peaks. Electrical properties such as conductivity and dielectric constant showed marked improvement with increasing Mn content. The conductivity increased from 3.7 mΩ−1·m−1 for pure ZnS to 6.3 mΩ−1·m−1 for the 1.03 mol% Mn2+ sample. The performance of photodetectors was evaluated under UV light. It was revealed that the photodetector based on a sample with 1.03 mol% Mn2+ reached an optimum state with an EQE of 9.8%, a detectivity of 4.65 × 10⁹ Jones, and a responsivity of 3.64 × 10⁻² A/W, indicating the effectiveness of Mn doping in improving the photo-generated carrier collection.
1. Introduction
Nanostructured (NS) materials have recently attracted attention due to their unique structural, optical, and electrical features when compared to bulk material properties, which make them useful in various applications in energy sources, health, and the environment [1,2]. In the last few years, research has been focused on the preparation and characterization of II-VI semiconductor such as ZnS, ZnSe, CdS, and CdSe nanoparticles for use as biomarkers in the biological field and their size give them outstanding electro and photoluminescence properties such as long excited state lifetime, excellent chemical and thermal stability, wide Stokes shift (to prevent energy transfer and self-absorption) [3,4]. This makes the II-VI semiconductor group a strong choice for many biomedical imaging and optoelectronic device applications, such as solar cells, photodetectors, and light-emitting diodes [3,4,5,6,7,8]. Zinc sulfide (ZnS) is a highly appealing semiconductor within the group II-VI category, having outstanding electroluminescent capabilities and a typical wide bandgap energy of approximately 3.66 eV [9]. ZnS is regarded as one of the most promising candidates for UV detectors because of its wide bandgap, low cost, excellent radiation hardness, and good chemical stability [10]. Optoelectronic devices, especially UV photodetectors, represent a vital category widely used in civilian and military applications such as missile tracking, space communications, astronomical research, flame detection, and biological/chemical analysis [11,12,13]. Furthermore, ZnS doped with various transition-metal (TMs) ions, such as Co, Ni, Mn, Cu, and Cd, possesses an efficient phosphor that emits in the visible blue–green spectrum [14,15,16,17]. Consequently, ZnS doped with transition-metal ions has garnered significant interest due to the considerable photoluminescence (PL) characteristics. Therefore, they have been used as a phosphor for light-emitting components in devices, including electroluminescent, field-emission devices, and cathode-ray tubes [18,19,20,21,22,23]. ZnS semiconductor nanocrystals are frequently doped by adding a small amount of atomic impurities to improve their electrical and optical properties [24]. In general, the differences in valence states and ionic radii between dopants and the fundamental crystalline ZnS could cause the formation of structural defects in the ZnS matrix. The properties of the ZnS NS may change as a result of these flaws that may generate certain intermediary bands between the conduction and valence bands of ZnS. Ions such as Mn2+, Co2+, and Cu2+ have chemical properties similar to those of Cd2+ or Zn2+, therefore Mn+2 can be easily doped with II-VI ZnS semiconductor [2]. Mn2+ dopant is the most representative of all the TM ions used for doping ZnS NS due to its nonlinear optical multiphoton absorption properties in the infrared and visible wavelength bands, which make it suitable for use as an effective phosphor and in bio-imaging applications. The Mn2+ ion also acts as a strong light activator, enhancing light emission by introducing new impurity levels into the host. It has a d5 structure, and the Mn2+ d-electron states interact strongly with the ZnS host’s s-p electronic states, which are typically the target of external electronic stimulation, serving as effective luminous centers [25,26,27]. In addition, both Mn and Zn have comparable physical and chemical properties [28]. ZnS NS doped Mn2+ was prepared by several methods, including hydrothermal, wet chemical route, sol–gel processing, micro-emulsion, and precipitation in a solid polymer matrix, and interaction with H2S gas [29,30,31,32,33,34,35]. In this work, the most effective and simple chemical precipitation method has been used to prepare ZnS N- doped Mn2+ [36]. The co-precipitation technique was chosen over other methods due to its cost-effectiveness, low-energy consumption, and high scalability. In order to comprehend the influence of the Mn dopant, the structure, optical properties, and morphology of ZnS nanostructured powders were investigated. X-ray diffraction (XRD), a field-emission scanning electron microscope (FESEM), energy-dispersive X-ray spectroscopy (EDX), a UV–visible spectrometer, an LCR meter, and photoluminescence (PL) spectroscopy were employed to characterize the synthesized particles. Moreover, the nanostructured ZnS samples were deposited on an indium tin oxide (ITO) substrate and used to study the photoconductive behavior under ultraviolet illumination. Unlike previous reports focusing mainly on the luminescent properties of Mn:ZnS, the novelty of this study can be attributed to the stress laid upon the significance of both ultrafine grain size and lattice strain induced by doping on the performance of the device for UV detection. The synergy achieved by this combination results in a superior responsivity-to-dark-current ratio that outperforms many existing low-cost UV photodetector alternatives.
2. Experimental Section
2.1. Chemicals
All chemicals were purchased from Sigma-Aldrich (St. Louis, MO, USA). Zinc acetate (Zn(CH3COO)2·2H2O, 99%), manganese acetate tetrahydrate (Mn(CH3COO)2·4H2O, 99%), sodium sulfide nonahydrate (Na2S·9H2O, 98%), polyvinylpyrrolidone (PVP-40000, 99%), and methanol (CH3OH) were used as precursors for the synthesis of ZnS-doped Mn nanoparticles.
2.2. Synthesis of Nanoparticles
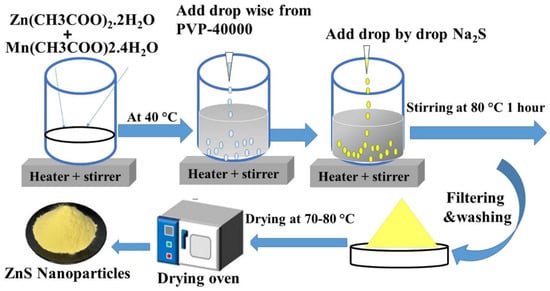
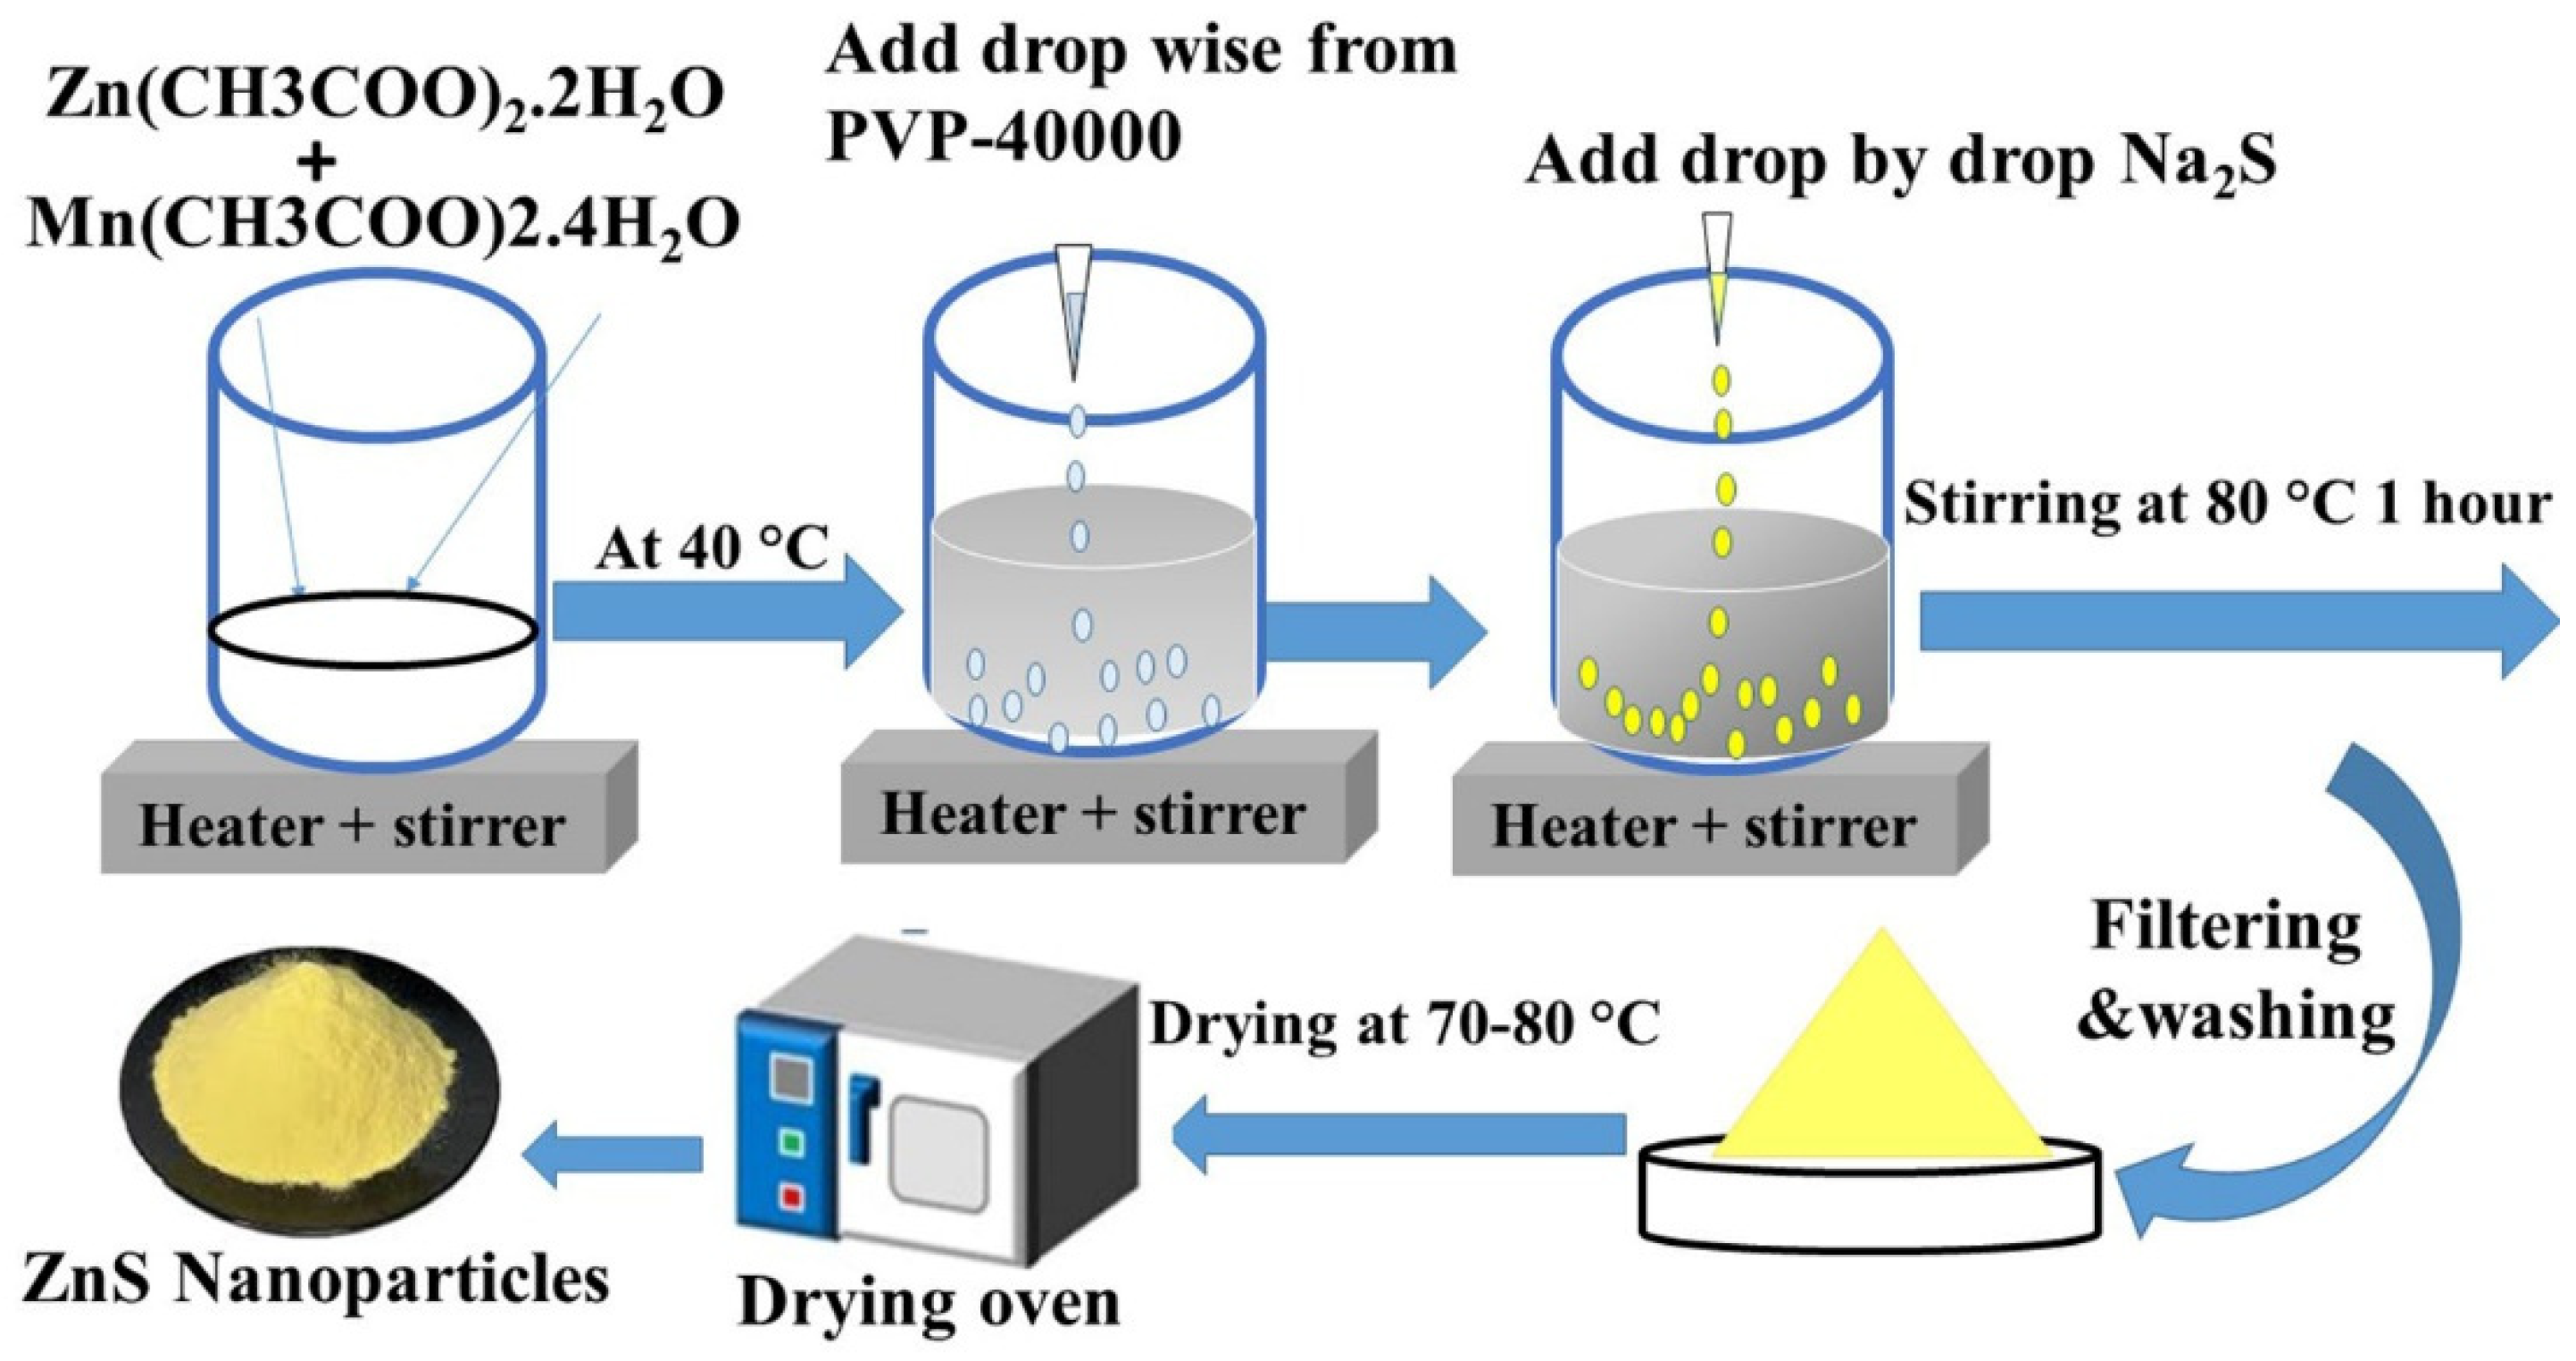
The pristine and Mn-doped ZnS nanoparticles were prepared using a simple chemical precipitation route, as explained by Kumari [37]. In a typical synthesis, Mn(CH3COO)2.4H2O in various concentrations of 0.0 mol%Mn2+, 0.89 mol%Mn2+, 1.03 mol% Mn2+, and 1.27 mol% Mn2+—corresponding to ~0 ppm, 220 ppm, 250 ppm, and 320 ppm, respectively—were combined with a 50 ml aqueous solution of 0.5 M Zn(CH3COO)2.2H2O and mixed well by stirring. The selected concentrations have been chosen based on earlier studies done by others and some initial optimizations done to ensure that we modify the structure effectively without causing distortion or damage to performance. Subsequently, to regulate nanoparticle size and prevent aggregation in solution, a 50 mL PVP-40000 aqueous solution was added incrementally to the mixture. An equimolar (0.5 M) aqueous solution of Na2S was added incrementally to the previously described combination, which was continuously agitated for 1 hour at 80 °C. To get rid of any unreacted precursors or contaminants, the produced precipitates were filtered and repeatedly cleaned with ethanol and deionized water. The nanoparticles were then dried at 70–80 °C in a vacuum oven and crushed into powder; this is shown in Figure 1. From this, the following samples were obtained: pristine, ZMN-1, ZMN-2, and ZMN-3.
Figure 1.
Schematic diagram for the preparation of samples by the chemical precipitation route.
2.3. Characterization
The synthesized pristine and Mn-doped ZnS nanoparticles were characterized utilizing a variety of techniques. The X’Pert Pro X-ray diffractometer was used to investigate the crystalline structure and phase purity using X-ray diffraction (XRD) with Cu Kα radiation (λ = 1.5406 Å) (Malvern Panalytical, Malvern, UK). The surface morphology, elemental composition, and particle size distribution of the synthesized particles were studied using field-emission scanning electron microscopy (FE-SEM) (JSM–7600F; JEOL Ltd., Tokyo, Japan) equipped with an EDS instrument to investigate the fundamental components of all prepared samples. Gwyddion software version 2.6x was used to process the micrographs. A Jasco FP-6500 Spectrofluorometer (Jasco Inc., Tokyo, Japan) was employed to obtain the photoluminescence (PL) spectrum of the synthesized nanoparticles, with an excitation wavelength of λ = 340 nm. An ultraviolet–visible spectrometer (Jasco V-770, Jasco Inc., Tokyo, Japan) was used to measure the diffuse reflectance spectra (DRS) of the UV–visible (UV-vis) spectrum, spanning 190 to 800 nm. The samples were compacted into small, rounded tablets using a uniaxial press at 8 × 10⁵ N·m−2. Before each tablet was examined for appropriate conduction, its two surfaces were carefully covered with silver paste. An LCR meter (Hioki, Nagano, Japan) was used to measure capacitance, frequency, and conductivity, and analyze the impedance and dielectric constant of prepared samples. Results were collected from 50 Hz to 5 MHz using computer software driven by 1 V of alternating current.
2.4. Device Fabrication
Nafion is used to spread the powder on a sterilized ITO substrate (1 × 1 cm2). We combined 0.5 g of the powdered sample with 20 µL of polymer Nafion and 480 µL of isopropanol. The suspended solution is then placed in an ultrasonic bath for 10 minutes. To clean the substrate, use acetone, ethanol, and distilled water. The first layer of powder was applied to the ITO substrate using a micropipette. The sample was then allowed to dry naturally. The solution was repeatedly placed on the ITO substrate to ensure complete coverage. Ultimately, we possess four thin films distributed on the ITO substrate suitable for use in UV photodetector applications [38].
2.5. Photodetection Experiment
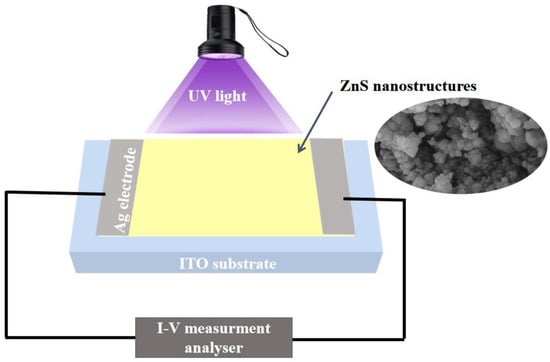
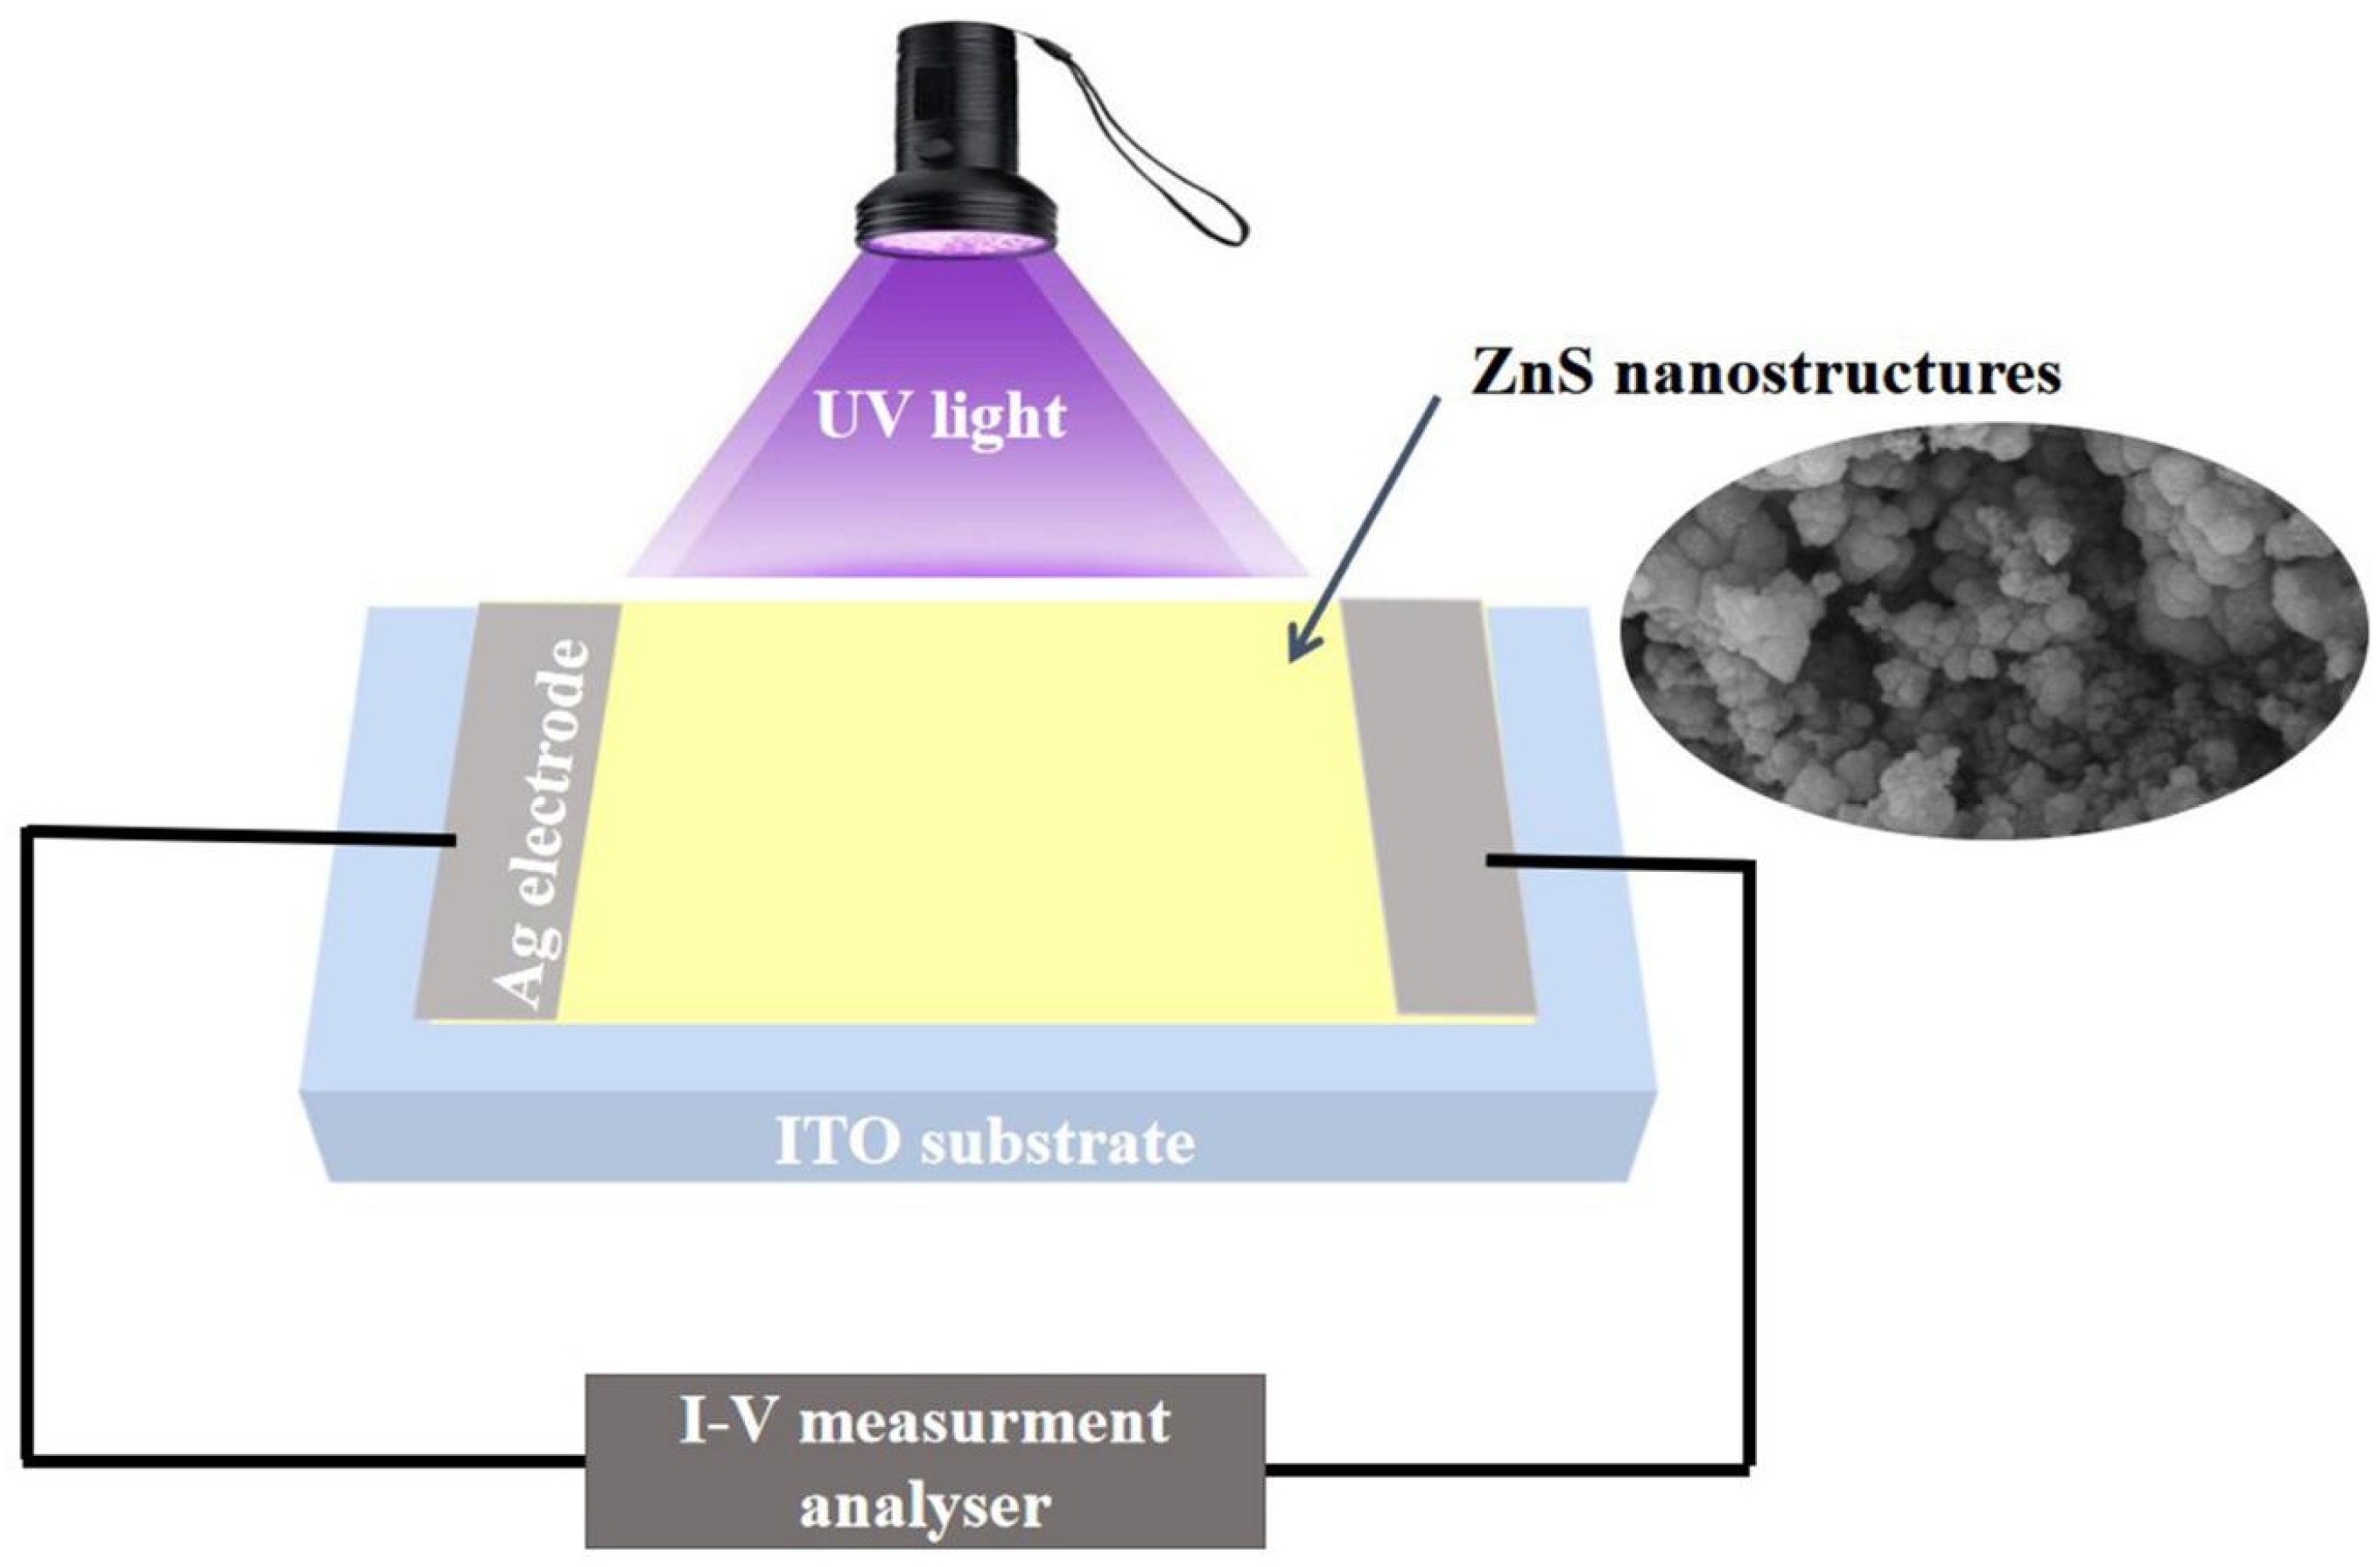
The schematic diagram of the manufactured ZnxMn1−xS (x = 0, 0.89, 1.03, and 1.27 wt.%) photodetector is displayed in Figure 2. Using a VersaSTAT3 potentiostat, an applied voltage between −1 and +1 V, and an Xe lamp (Newport, Irvine, CA, USA) as the light source, the characteristic (I-V) curves of each film were analyzed at room temperature [39]. Two electrodes were created by attaching silver paste to the opposite edges of a 1 cm2 sample. Using a monochromator with a 460–635 nm grating, the effects of normal light and monochromatic light (certain wavelengths) on the photodetectors were investigated. The device’s attributes, including detectivity levels, responsivity, and external quantum efficiency (EQE), were calculated. To evaluate reproducibility, 3 devices were fabricated under identical conditions.
Figure 2.
Schematic diagram of ZnS photodetector under UV illumination.
3. Results and Discussions
3.1. Structure Properties
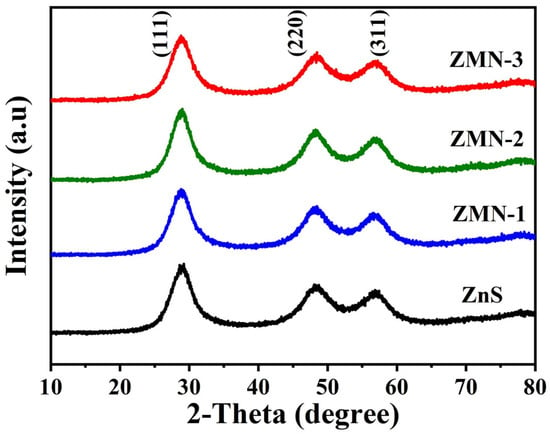
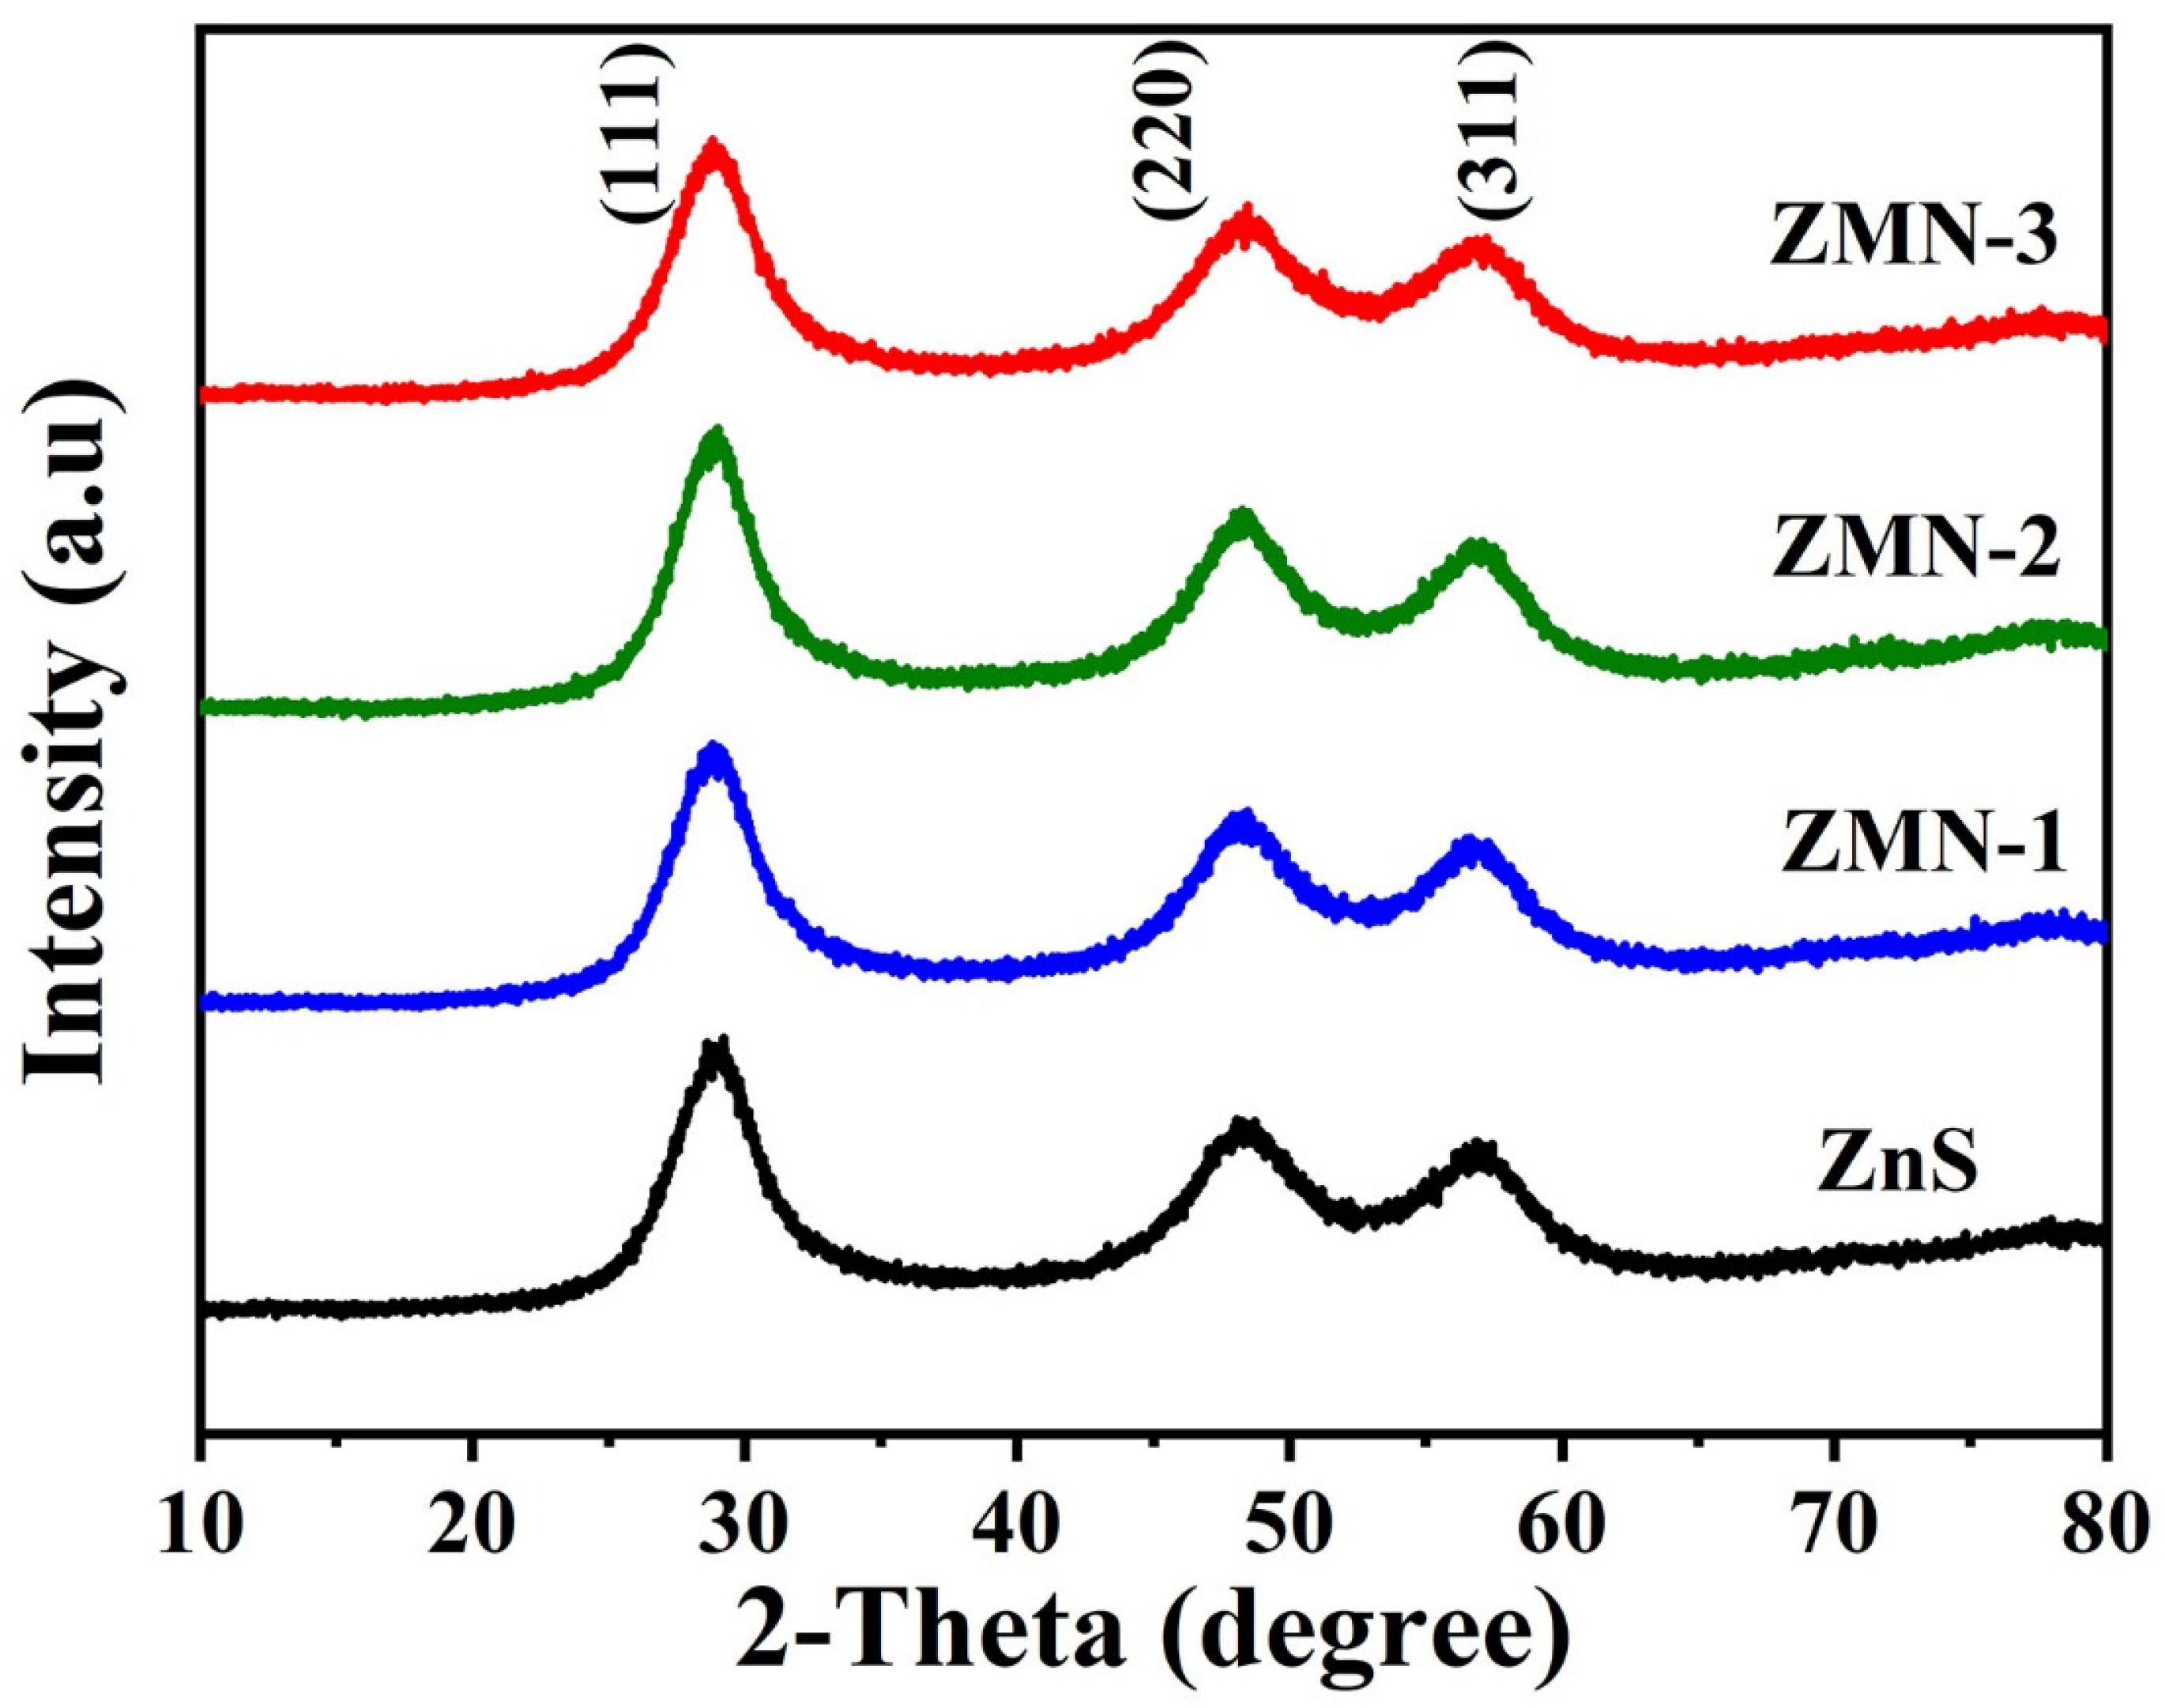
The structural properties of the pristine and Mn-doped ZnS nanopowder were investigated through the PANalytical X’Pert Pro XRD powder diffractometer with monochromatic CuKα radiation (λ = 1.54060 Å), a scan rate of 0.02 s−1, and a 2-theta range of 10 to 80° at room temperature. XRD patterns of pristine ZnS and Mn-doped ZnS nanoparticles are shown in Figure 3. The figure illustrates that the samples possess polycrystalline structures characterized by a cubic configuration and space group (F-43m). The XRD patterns of the prepared samples showed three main diffraction peaks at 2θ values of 28.92°, 48.20°, and 56.98°, corresponding to the (111), (220), and (311) planes, respectively. These XRD patterns correlate effectively with the standard data JCPDS card no. (00-065-0722). No additional impurity peaks due to Mn2+ doping have been observed, confirming the purity of the ZnS samples and the incorporation of the doping ions into the cubic structure. As illustrated in Figure 3, the XRD peaks are broadened due to the nanocrystalline nature of the prepared samples [40]. The (111) peak is significantly more intense than the (220) and (311) peaks. This indicates that all samples show a pronounced preferential alignment along the a-axis (111). The Scherrer’s formula is employed to compute the mean crystallite sizes from FWHM (full width at half maximum) of the most prominent peak (111) in the XRD pattern [41].
where λ denotes the wavelength of X-rays (λ = 1.5406 Å), β signifies the full width at half maximum for the (111) plane, and θ represents Bragg’s angle. Table 1 includes the estimated crystallite sizes for all the prepared nanoparticle samples. From Table 1, the crystallite size obtained from XRD fell within the range of 2 to 3 nm. The crystallite size primarily grew from 2.3 nm to 2.4 nm, then to 2.5 nm via elevating the Mn content to 0.89% Mn2+ (ZMN-1 sample), then to 1.03% Mn2+ (ZMN-2 sample), respectively, and thereafter decreasing to 2.3 nm for a 1.27% Mn concentration (ZMN-3 sample). The slightly increasing of crystallite size from 2.3 nm to 2.4 nm may be ascribed to the ionic radius of Mn2+, which is 0.80 Å is slightly greater than the ionic radius of Zn2+, which is 0.74 Å, so when the Mn2+ ions replace the Zn2+ ion position in the lattice, the crystallite size shows a slight increase [27,42,43]. The crystallite size then decreases as the Mn concentration increases up to 1.27% Mn2+ (ZMN-3 sample). The Zener pinning effect may be responsible for this decrease in crystallite size. The decrease in crystallite size from 2.5 nm to 2.3 nm is attributed to the inhibition of grain growth caused by the higher concentration of Mn2+ions. These ions act as impurities that segregate at the grain boundaries, creating a pinning effect that prevents further growth. Furthermore, the incorporation of Mn2+ ions, which possess a slightly larger ionic radius than Zn2+, induces lattice distortion, which increases the nucleation rate while simultaneously hindering the subsequent growth of the crystals [44].
Figure 3.
XRD patterns of the undoped and Mn-doped ZnS nanoparticles.
Table 1.
Calculated values of the crystallite size from SEM and XRD, dislocation density, micro-strain, and band gap energy.
The dislocation density (δ) and micro-strain (ε) of all the synthesized samples were determined using the following equations [45,46]:
where θ is the diffraction angle, β is the (111) full-width half maximum, and D is the crystallite size of the produced samples. Table 1 also includes the computed dislocation density (δ) and micro-strain (ε) of the produced nanoparticles. As the Mn concentration rises, the produced samples’ dislocation density (δ) and micro-strain (ε) decrease from the pristine sample to the ZMN-1 sample with 0.89% Mn2+, reaching a minimum at the 1.03% Mn2+ for the ZMN-2 sample and subsequently rise for the ZMN-3 sample, which has a Mn concentration of 1.27% Mn2+. At first glance, a reduction in micro-strain and dislocation density would indicate a reduction in lattice defects. The elevation in micro-strain and dislocation density of the ZMN-3 sample could be ascribed to the elevated Mn content, since the substantial replacement of Mn for Zn ions results in lattice distortion, hence augmenting strain and dislocation density [47].
3.2. Morphological and Elemental Analyses
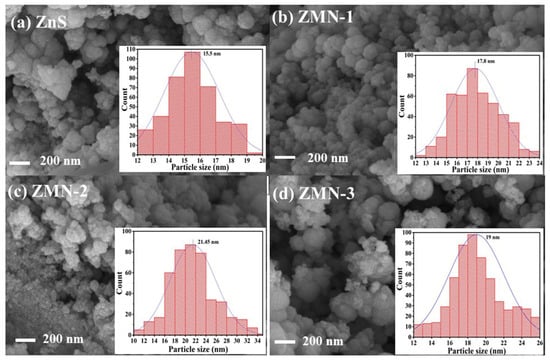
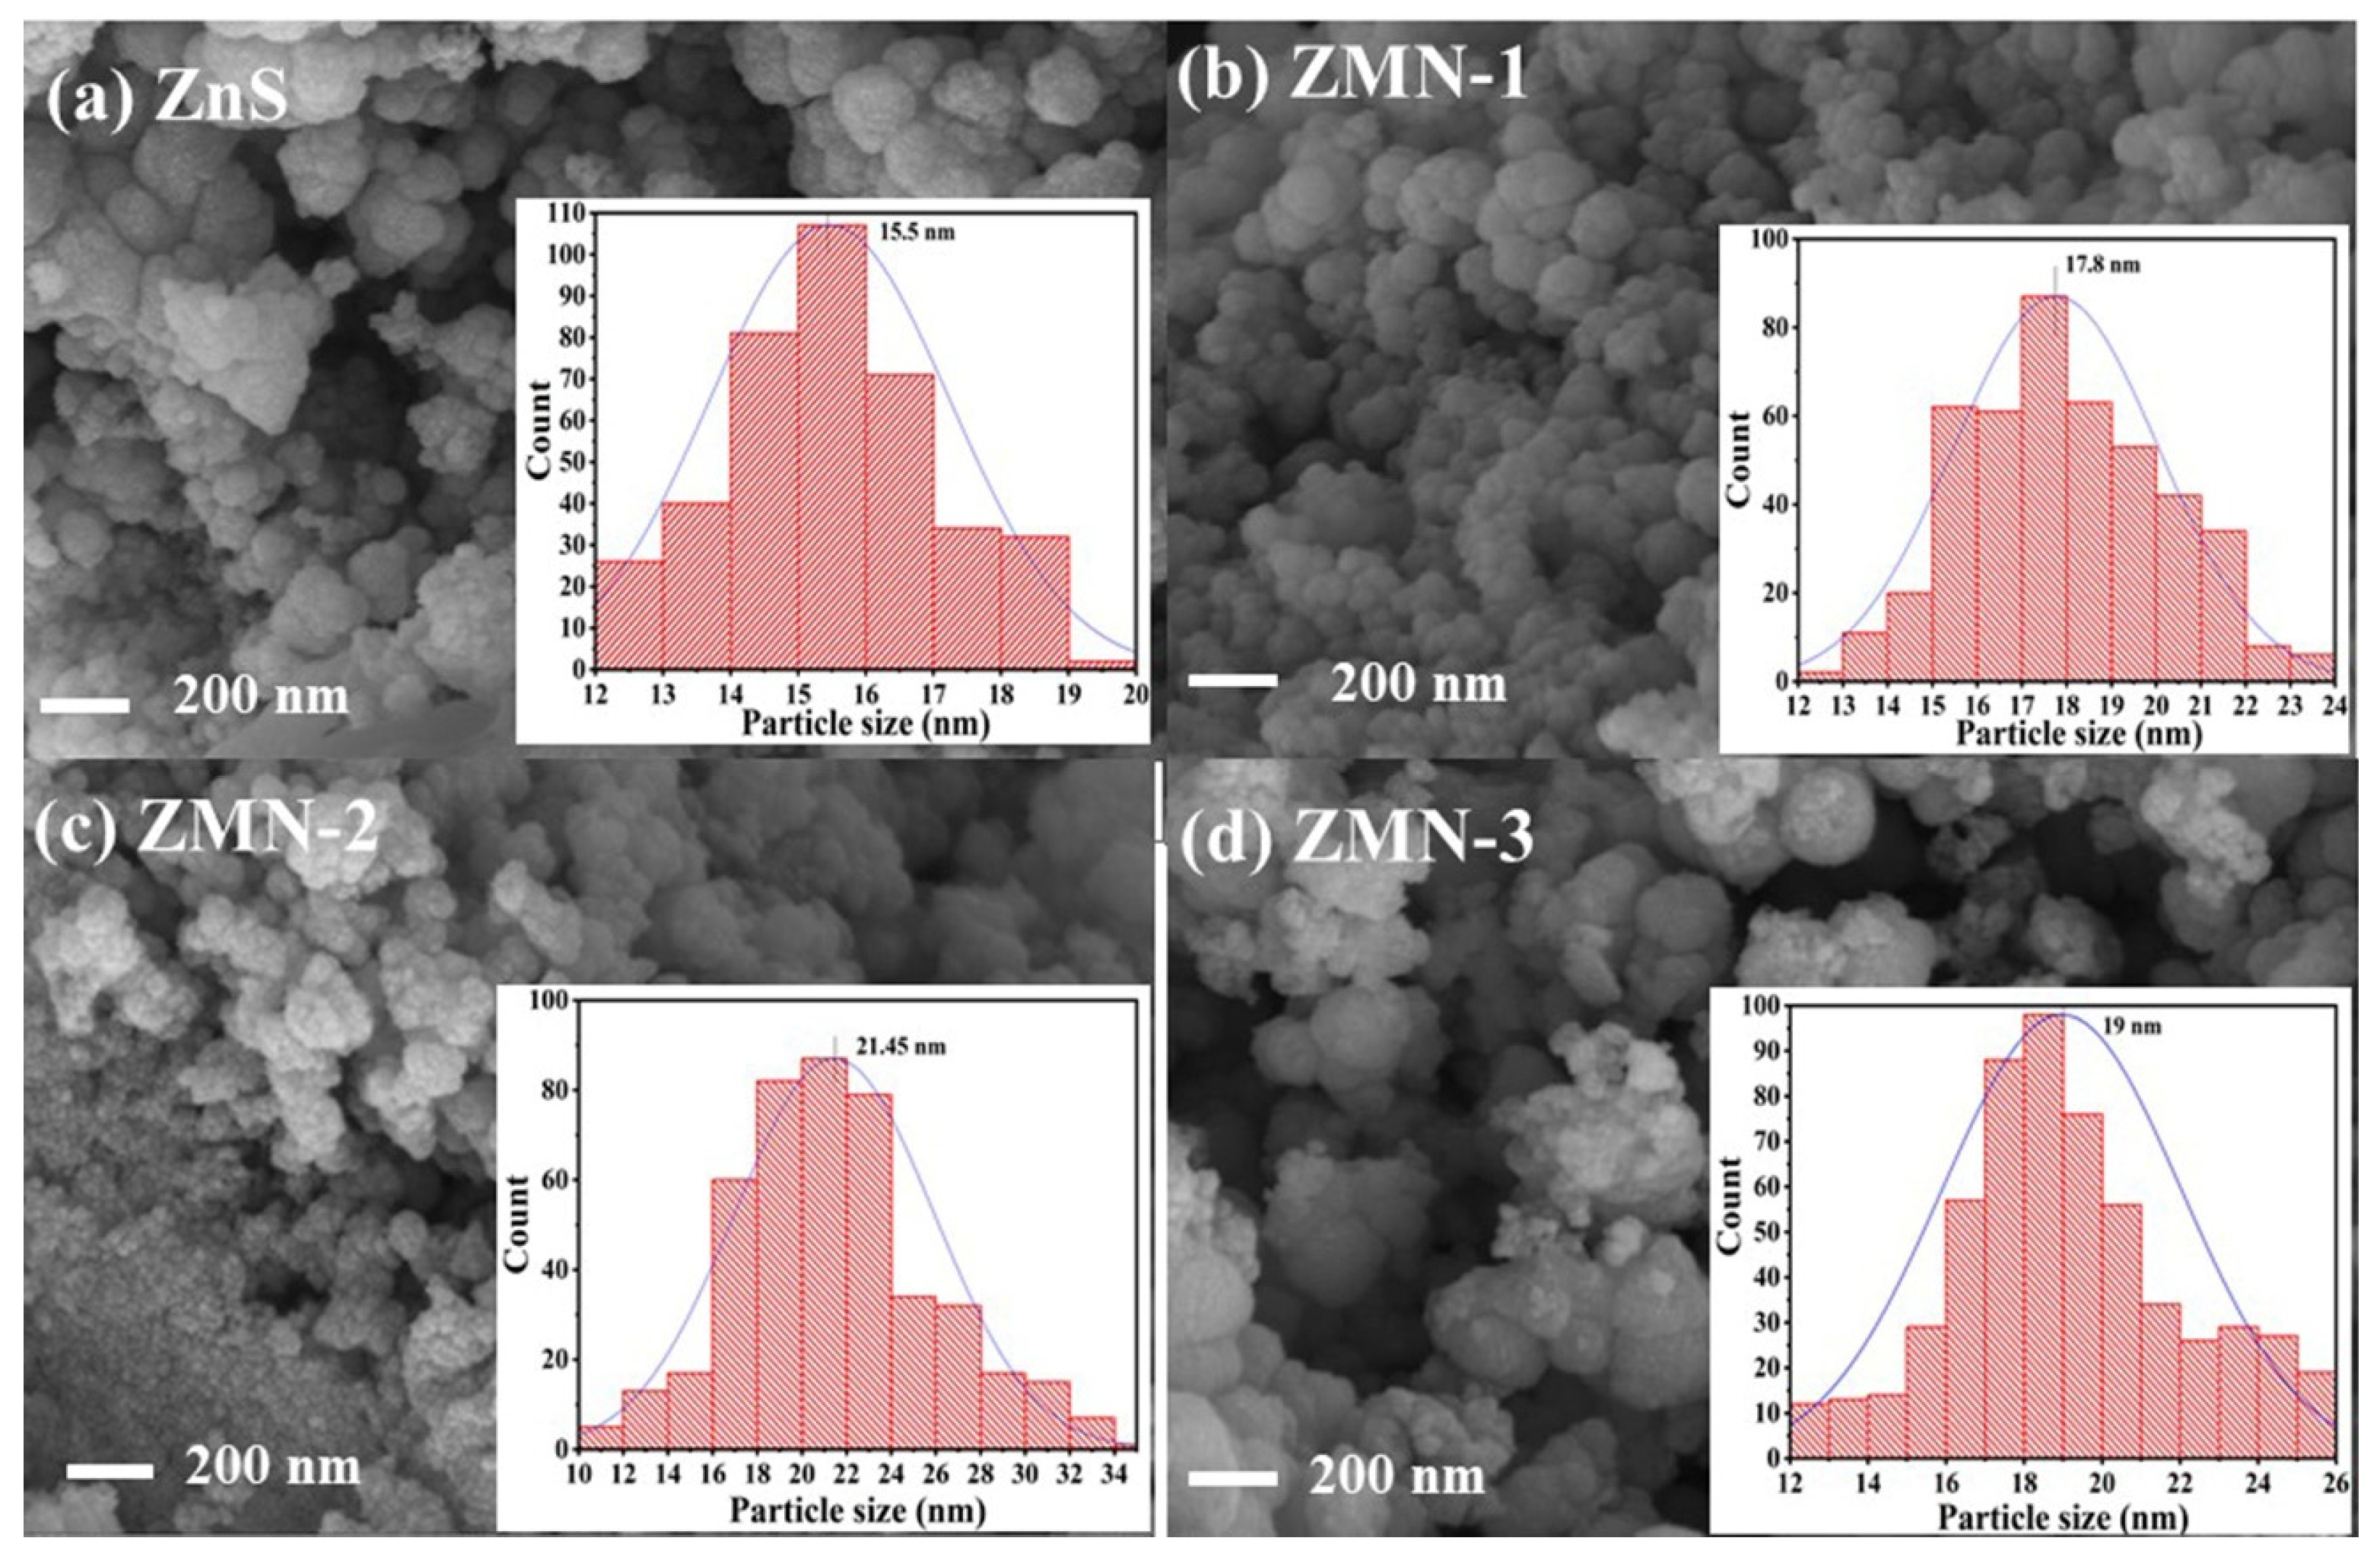
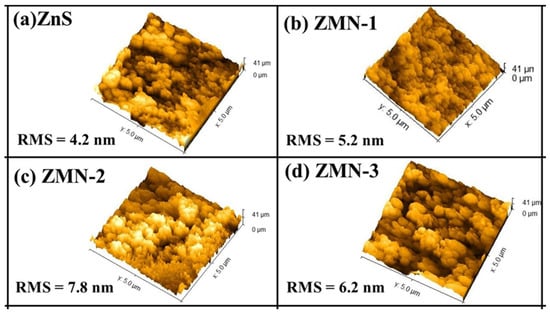
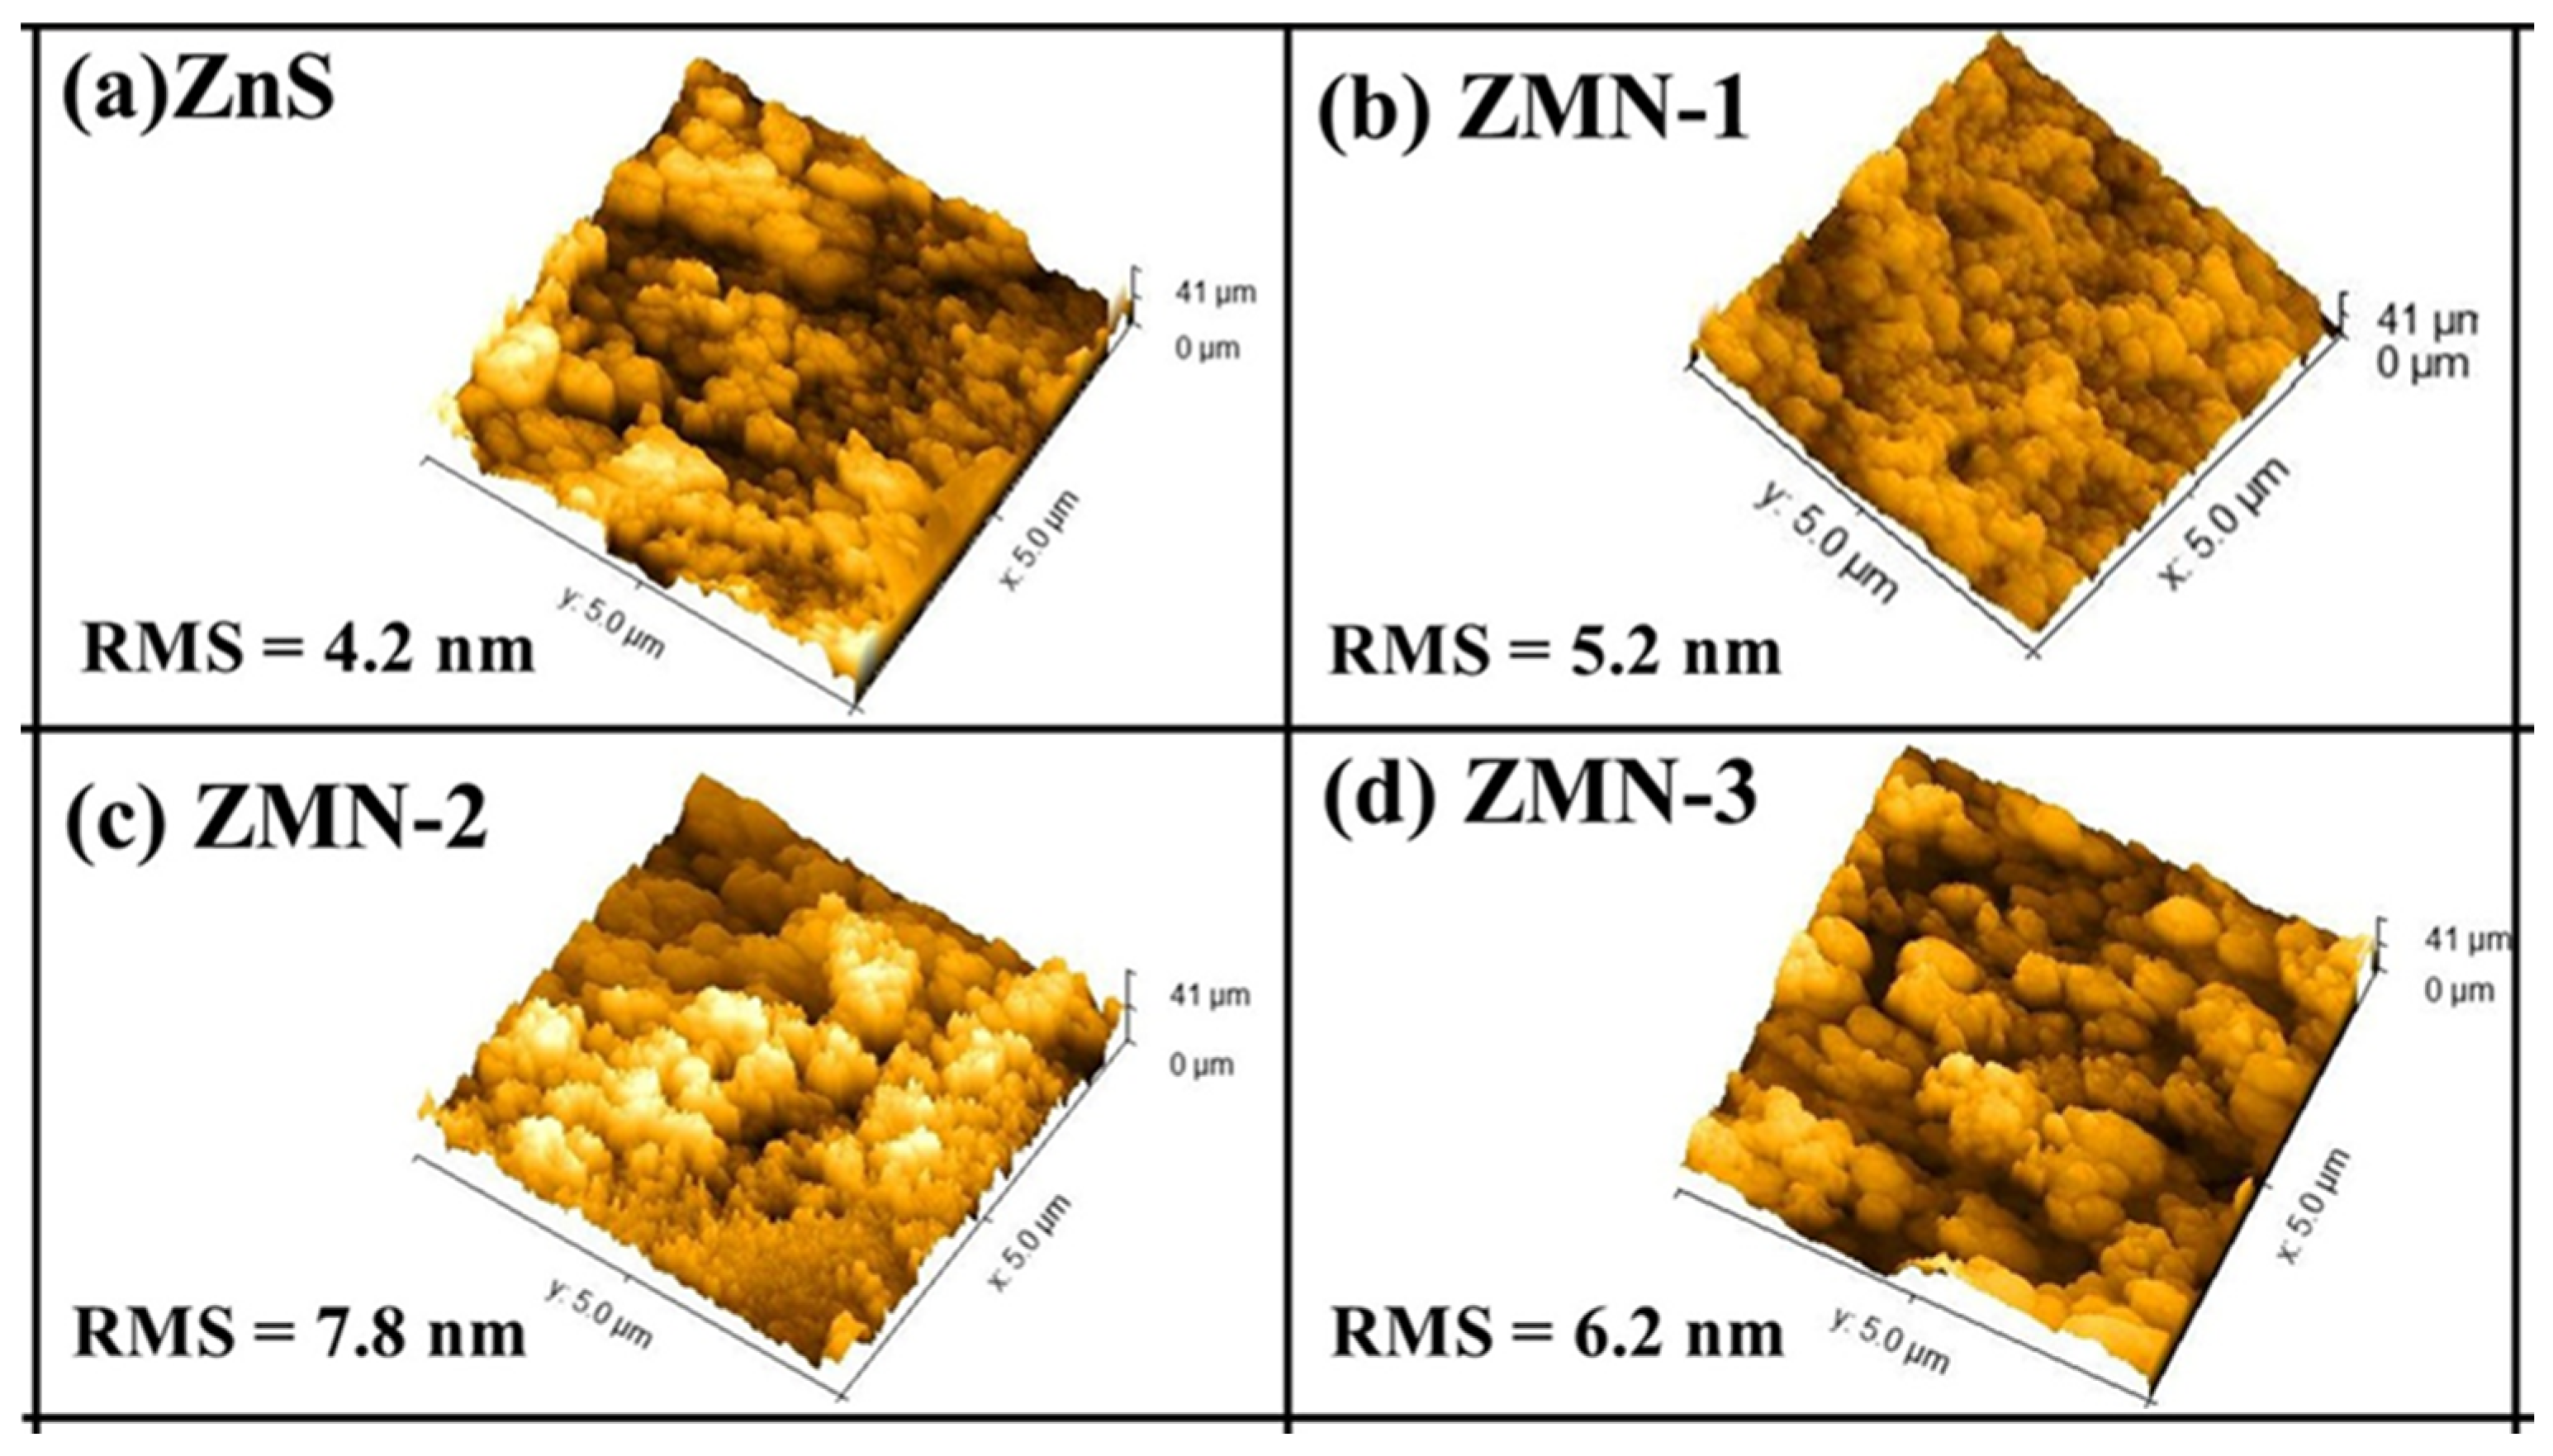
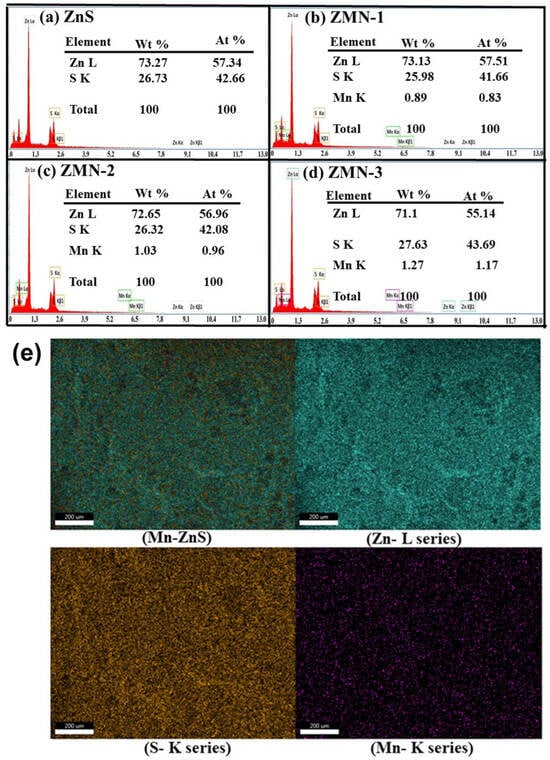
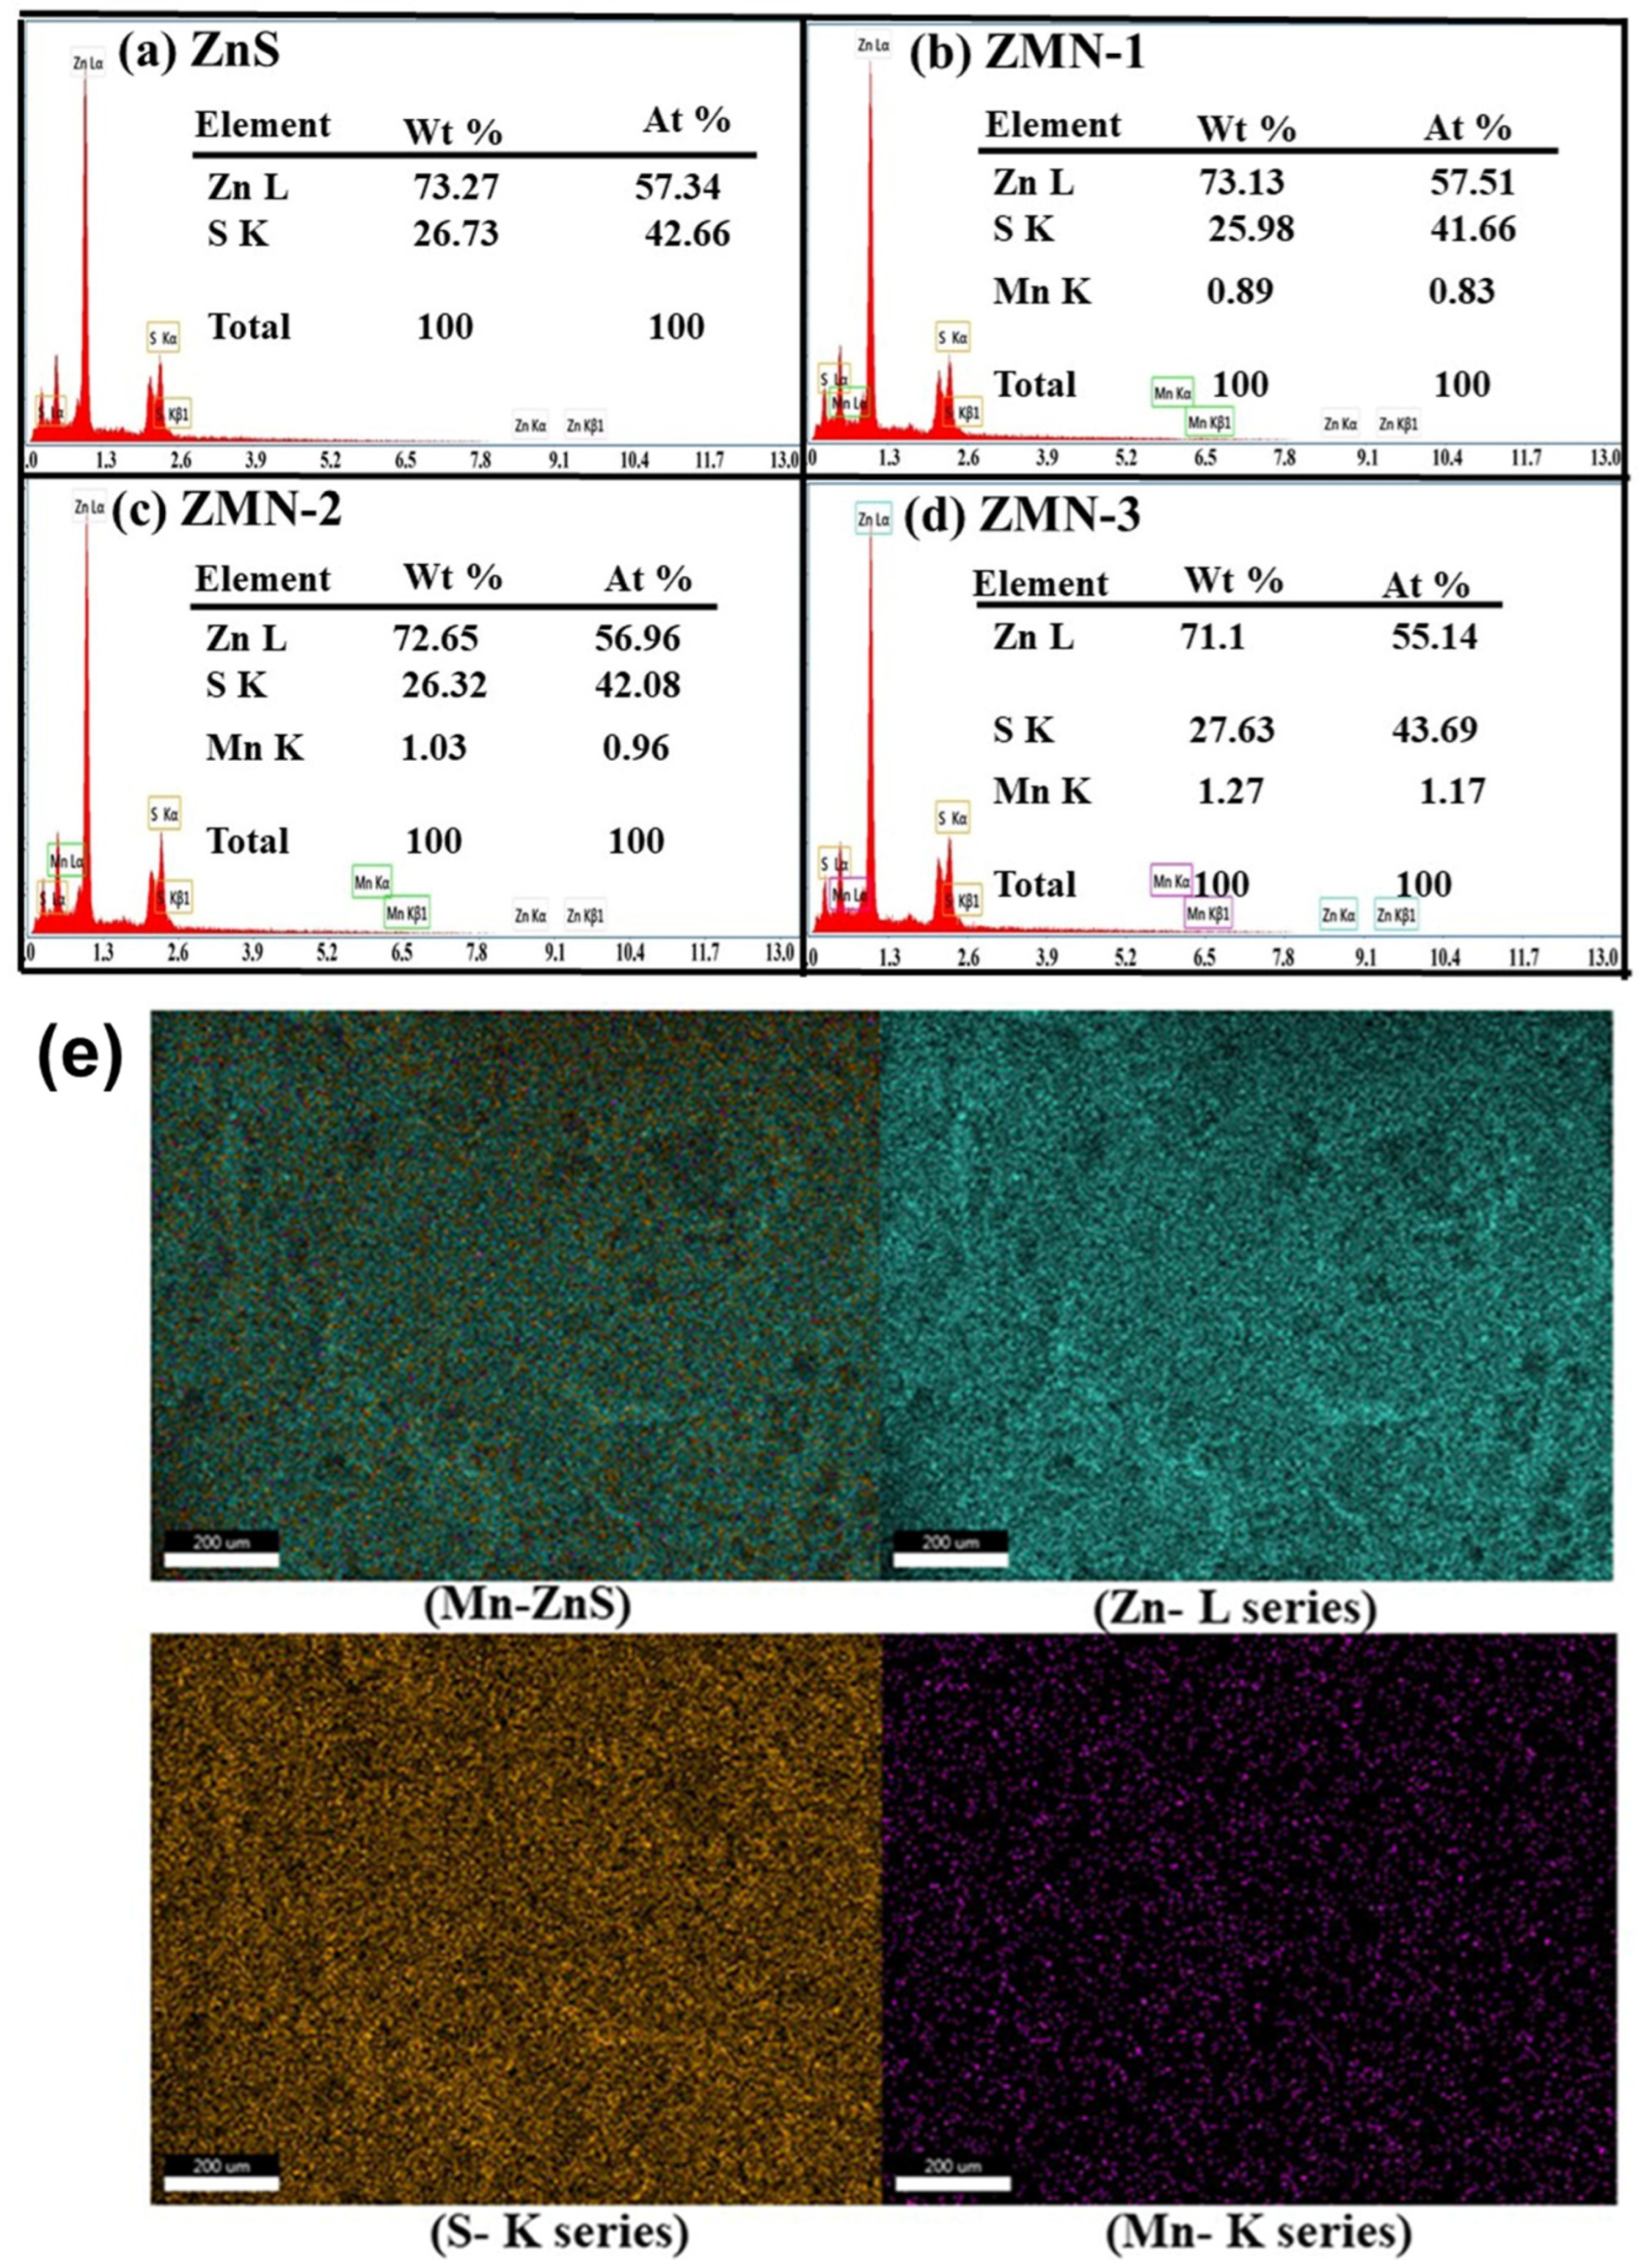
The optical and electrical properties of Mn-doped ZnS can be influenced by surface morphology; therefore, it is important to analyze the surface texture of the synthesized nanoparticles. FE-SEM was used to study the surface morphology of the pristine ZnS and Mn-doped ZnS nanoparticles. Figure 4 shows surface morphology images of pristine ZnS and Mn-doped ZnS nanoparticles. According to SEM images, the ZnS nanoparticles exhibit a spherical shape with a rough surface. The ZnS nanoparticles exhibit heterogeneity, with diameters ranging from 15 to 19 nm. With increasing Mn concentration, the size of the ZnS nanoparticles increases up to ZMN-2 and then decreases in ZMN-3. The size of the particles, as determined using SEM, is generally larger compared to the crystallite size recorded using XRD due to the presence of different crystallites in a single particle. The roughness of the surface was determined after analysis utilizing the Gwyddion 2.45 program [48]. Figure 5 shows that the surface roughness is influenced by the dopant concentration. Table 1 clearly indicates that the average roughness (Ra) escalates with rising Mn concentration, reaching its peak for ZMN-2, followed by a decline for ZMN-3 nanoparticles. To verify the presence of Mn in the doped samples, the investigation using energy dispersive X-ray spectroscopy (EDX) was used, as illustrated in Figure 6a–d. These data verified that the samples contain Mn, Zn, and S; they are listed in Table 1. The mapping investigation, illustrated in Figure 6e, confirms the distribution of Mn-doped ZnS nanoparticles, indicating that the Zn, S, and Mn components are uniformly spread throughout the nanoparticles.
Figure 4.
Surface roughness of the pristine and Mn-doped ZnS nanoparticles. (a) ZnS, (b) ZMN-1, (c) ZMN-2, (d) ZMN-3.
Figure 5.
Surface morphology of ZnS and ZMN samples (SEM). (a) ZnS, (b) ZMN-1, (c) ZMN-2, (d) ZMN-3.
Figure 6.
(a–d) EDS spectrum of ZnS and ZMN samples and (e) EDS mapping images of the ZMN-3 sample.
3.3. Optical Analyses
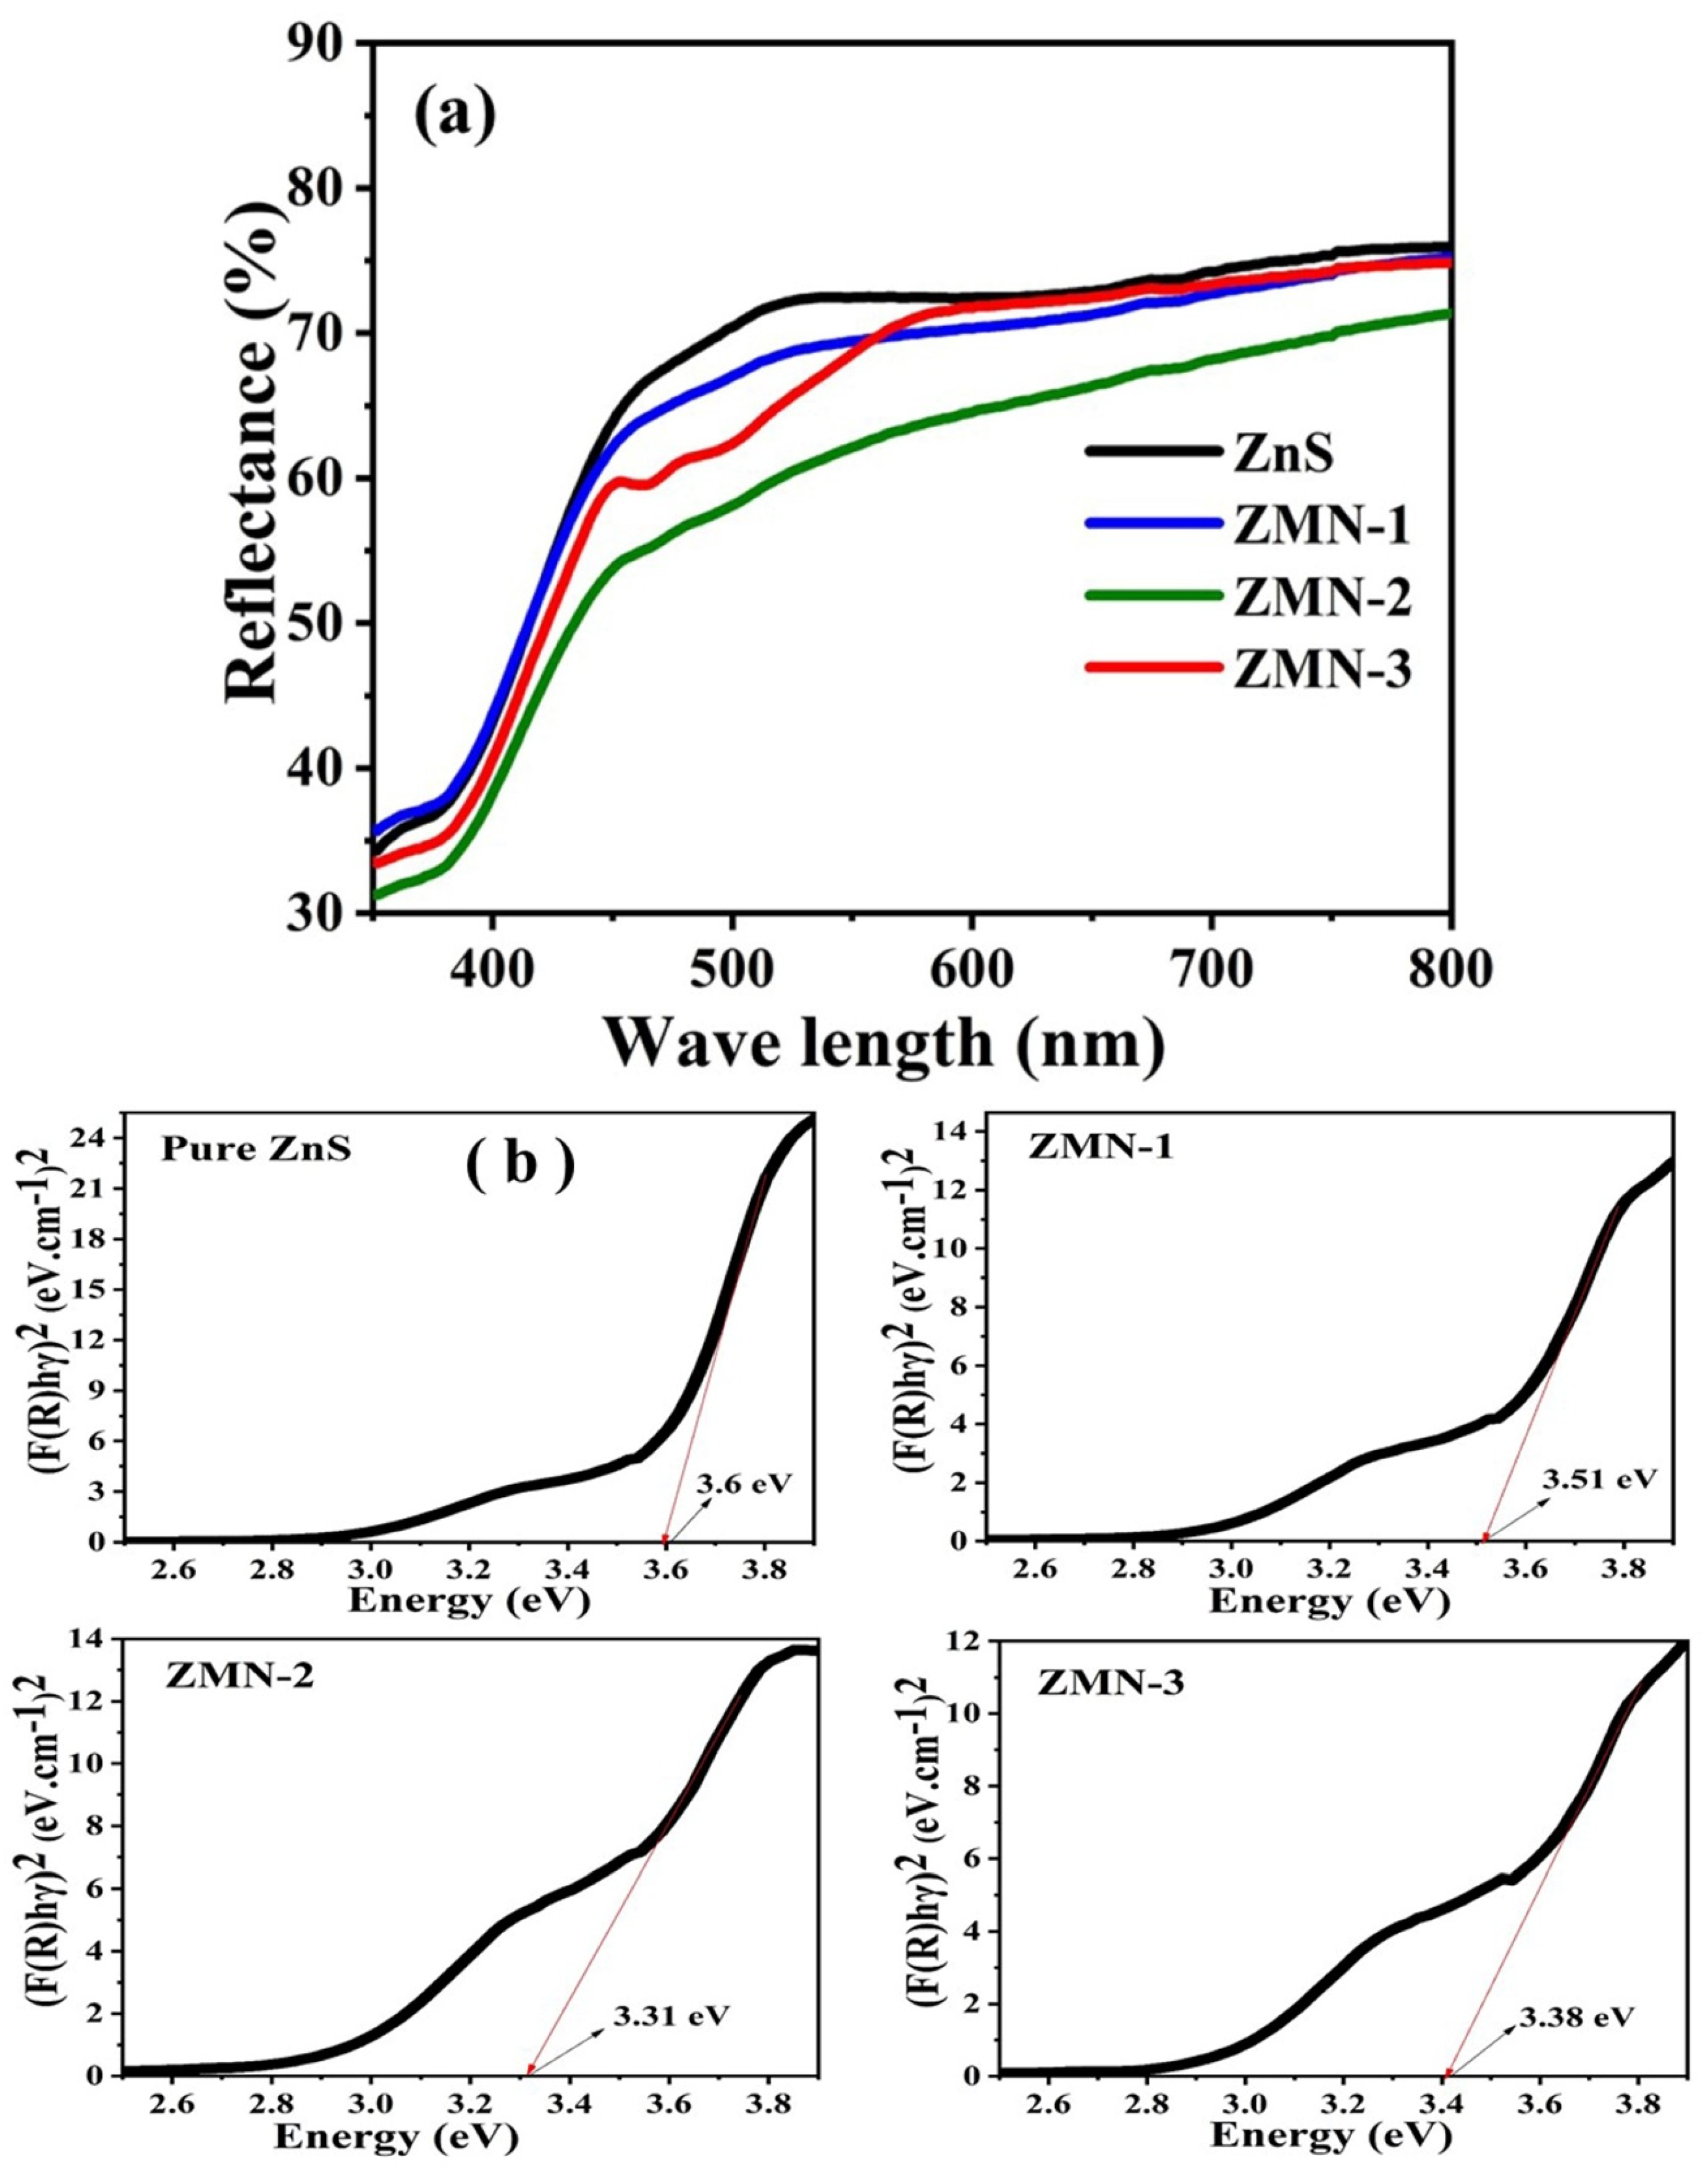
UV-Vis diffuse reflectance spectroscopy (UV-Vis DRS) analysis can provide valuable information about the optical properties, including their absorption and reflectance behavior in the UV-Vis region. The UV–vis absorption spectroscopy (Jasco spectrometer V770) was used to obtain the diffuse reflectance spectra using BaSO4 as a reference within wavelengths ranging from 190 to 800 nm, and calculating the optical band gap. The UV–Vis diffuse reflectance spectra of ZnS and ZMN nanoparticles are shown in Figure 7a. It is clearly observed that the reflectance decreases significantly as the Mn concentration increases. This reduction in reflectance is attributed to the increased absorption by the Mn2+ impurity levels created within the ZnS bandgap [49]. The lower reflectance in doped samples, especially ZMN-2, indicates a higher photon-trapping capability, which directly contributes to the enhanced responsivity of the fabricated UV photodetectors [50]. For all samples, a high absorption peak was seen at about 300 nm, suggesting that the most significant absorption edge is in the ultraviolet region. This could be attributed to the charge transmission interaction between the 2p orbital electrons of (O2−) ions and the 3d orbital electrons of (Mn2+) [51]. The optical and electrical properties of semiconductors with a direct electronic transition are strongly influenced by the band gap energy (Eg). It is a key factor in determining how these materials interact with light and conduct electricity, and it can be calculated using the Tauc relation. The Kubelka–Munk function F(R) was used to convert the diffused reflectance into the absorption coefficient, as shown in the equation [52,53]:
where R stands for reflectance, F(R) for the Kubelka–Munk function, and α for the absorption coefficient. The optical band gap (Eg) of all prepared samples was estimated using Tauc’s plot by extrapolating the linear region of the (F(R)hν)2 vs. (hν) curve to the energy axis, as expressed in the equation below [54,55,56]:
In this context, hν stands for incident light energy, α for absorption coefficient, Eg represents band gap energy, and the sort of transition determines n (for indirect permitted transitions, n = 2, while for direct permitted transitions, n = ½). A is a constant. In ZnS and ZMN samples, the transition is direct; therefore, n = ½. Figure 7b shows the plot of (F(R)hν)2 vs. photon energy (hν) of ZnS and ZMN nanoparticles. The calculated optical band gaps of ZnS, ZMN-1, ZMN-2, and ZMN-3 nanoparticles increased with increasing Mn concentration: 3.6 eV, 3.51 eV, 3.31 eV, and 3.38 eV, respectively. The decrease in the optical band gap could be attributed to doping ZnS nanoparticles with manganese, which introduces impurity energy levels within the ZnS band structure. These impurity levels can act as intermediate energy states, reducing the material’s effective band gap. Generally, optical characteristics based on size differences depend on variation in the electronic density of states at the nanoscale, in which energy levels are quantized and discrete rather than continuous in between the atom and bulk scales, with the Fermi energy being dominant for optical/electrical behavior [57]. The dual-slope nature of the Tauc plots suggests the presence of sub-bandgap states. While the higher-energy intercept defines the fundamental optical band gap of the ZnS nanostructures, the lower-energy feature is associated with dopant-induced impurity levels and structural defects, which facilitate electronic transitions at lower energies. Furthermore, the addition of Mn2+ ions leads to the formation of localized impurity states within the energy gap, resulting in lower-energy transition events [58,59].
Figure 7.
(a) Diffuse reflectance spectra of ZnS and ZMN nanoparticles; (b) the plot of (F(R)hν)2 vs. photon energy (hν) of ZnS and ZMN nanoparticles.
3.4. Photoluminescence Studies
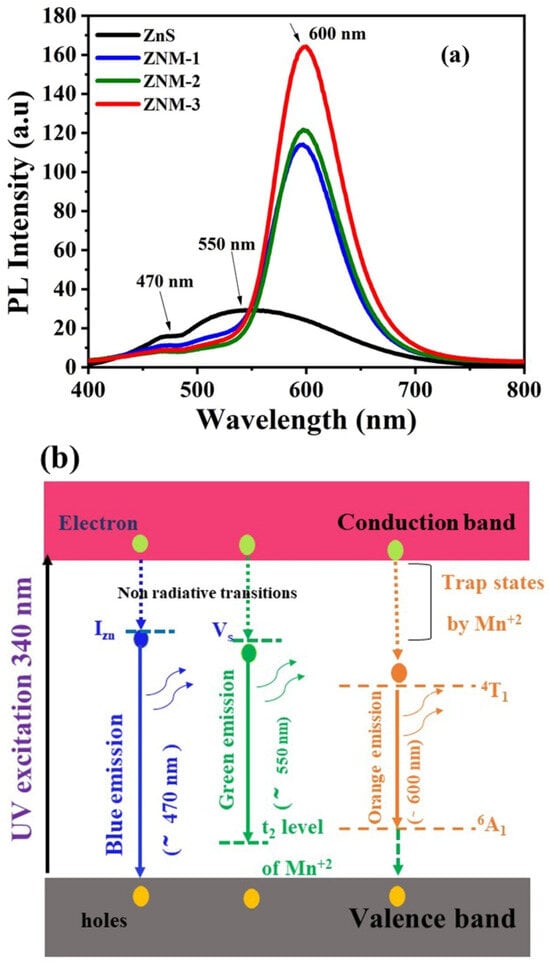
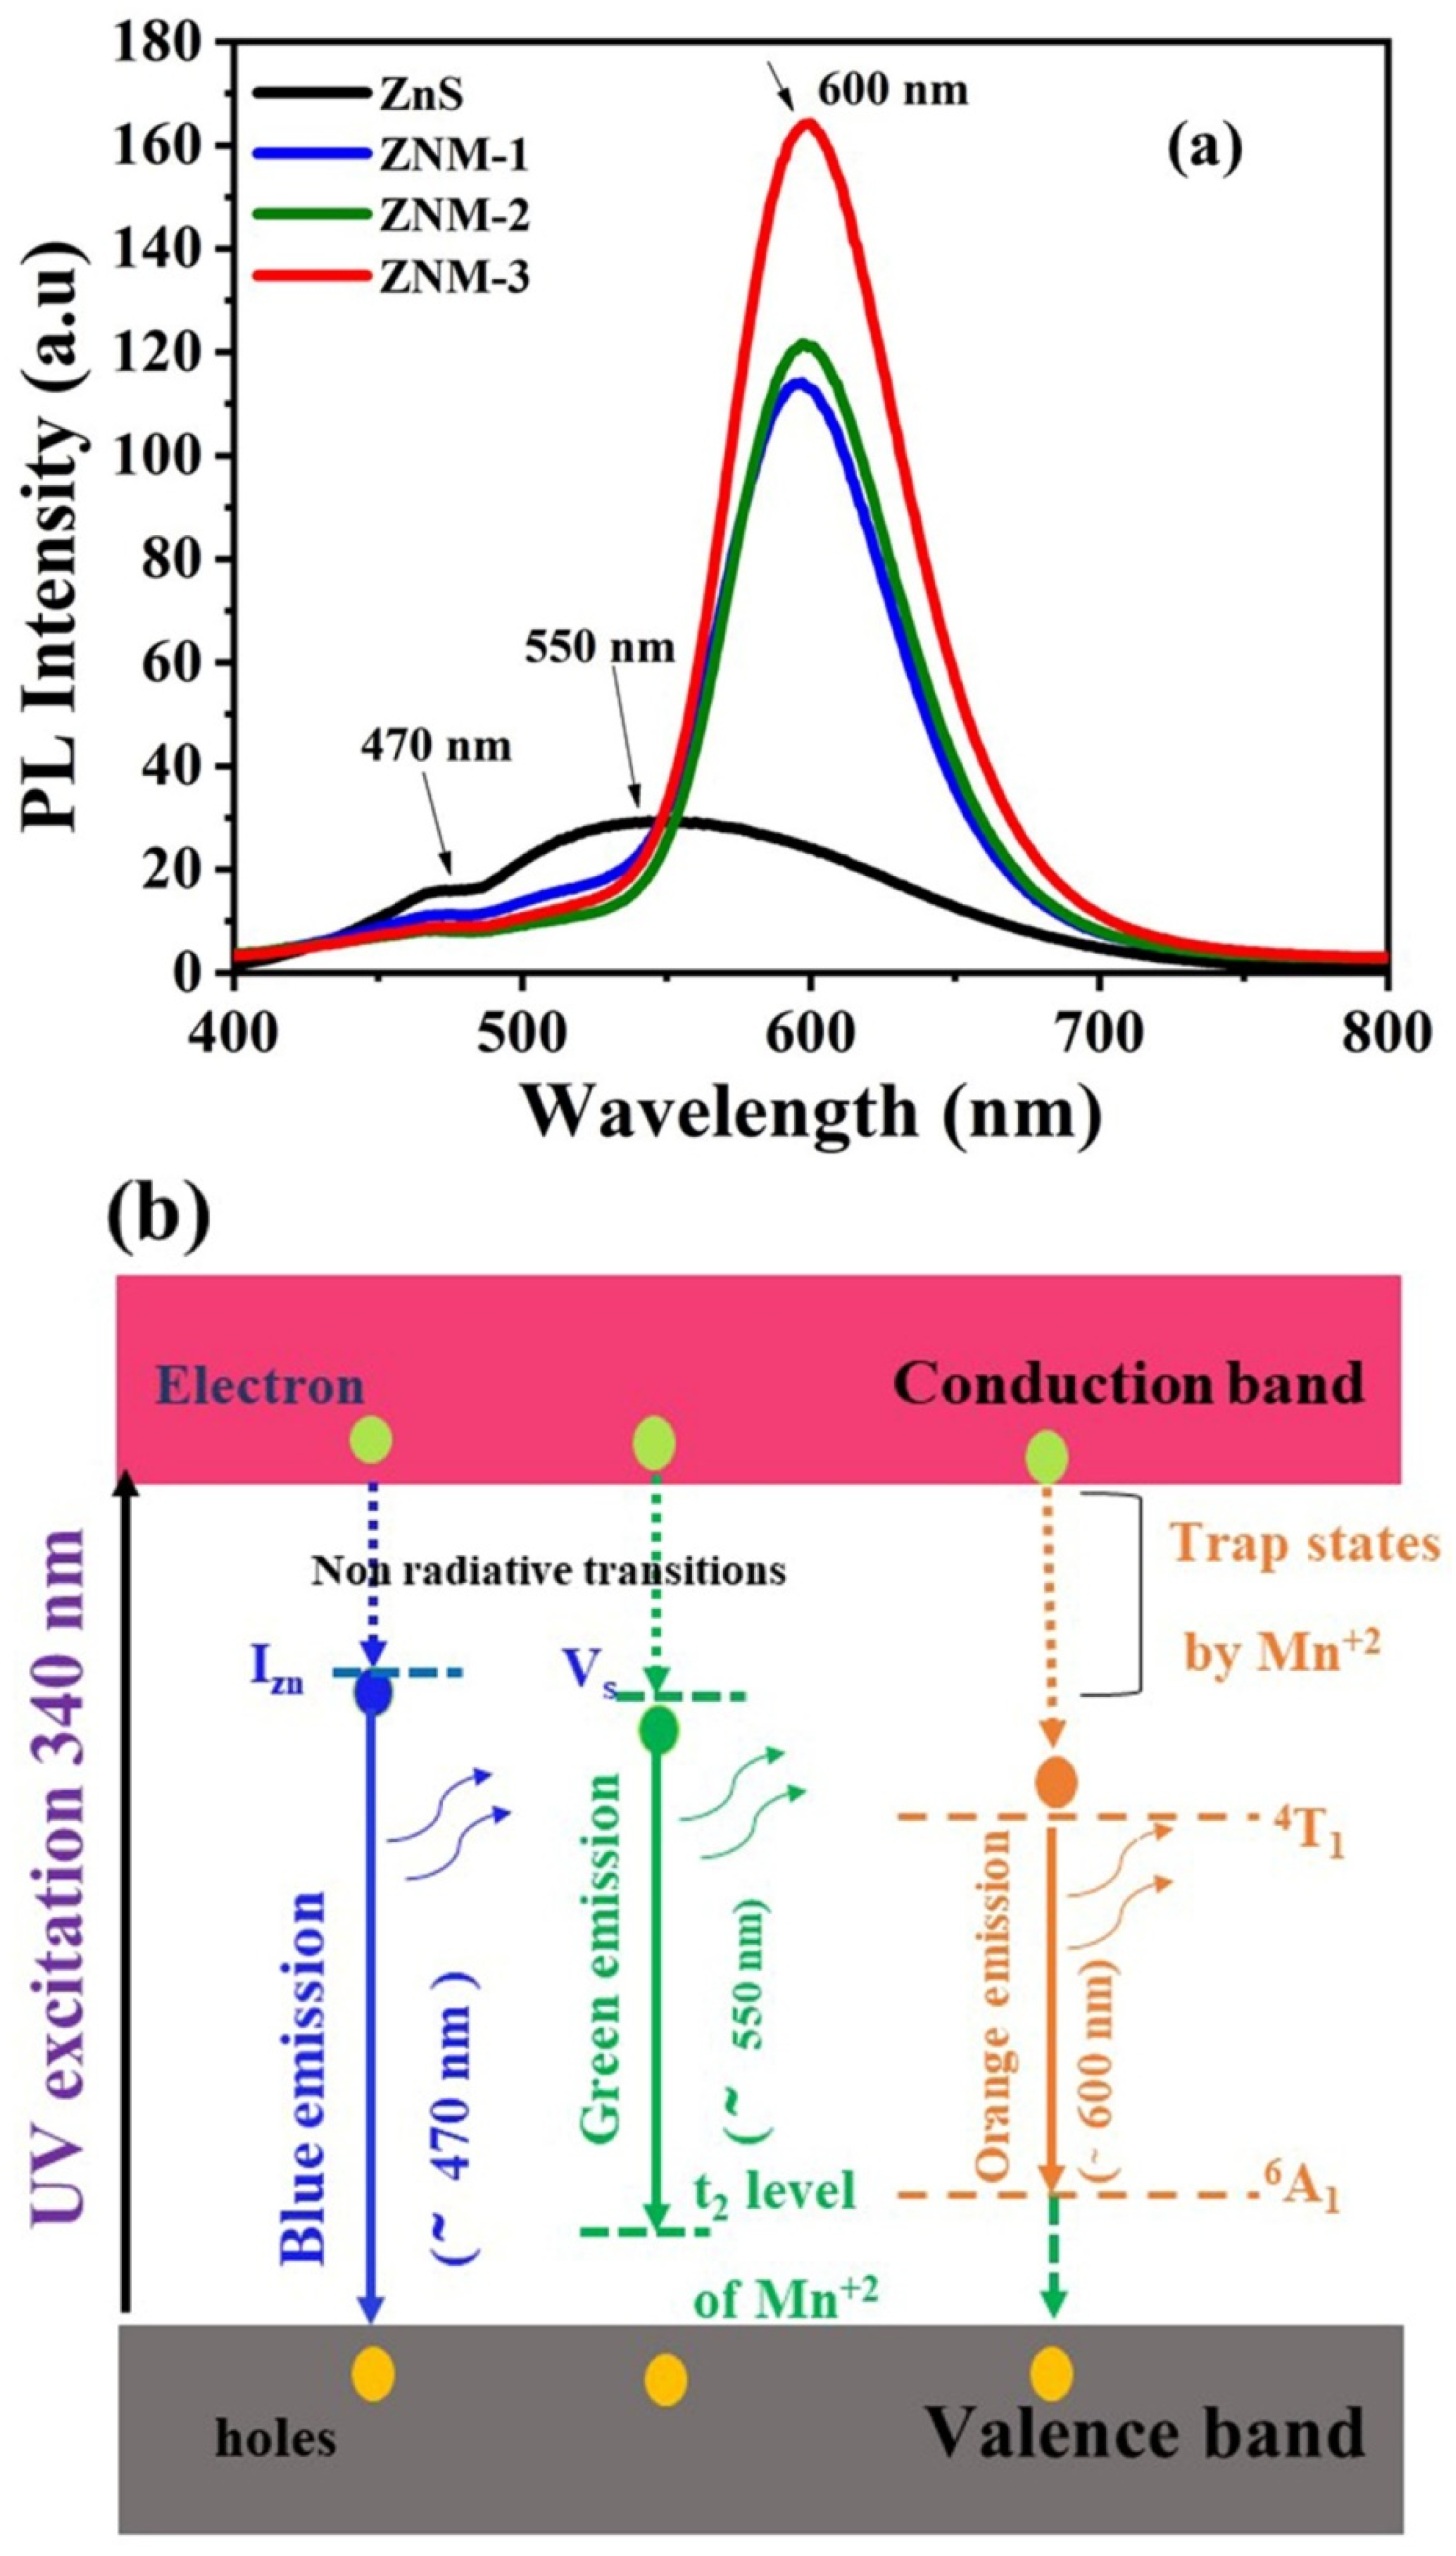
The photoluminescence (PL) emission spectra of ZnS nanoparticles doped with varying Mn concentrations were analyzed, and the results are presented in Figure 8. These were collected at ambient temperature with an excitation wavelength of 340 nm and a detection range of 400–800 nm. The photoluminescence (PL) process involves photoexciting a valence-band electron across the band gap, which then decays to various defect states via the usual recombination process. Photoluminescence spectra are an essential tool for detecting crystal structures, defect states, and emission peaks, providing insights into the electronic and optical properties of the material [46]. The study reveals a distinct enhancement in PL intensity with increasing Mn concentration, highlighting the role of dopant ions in tuning the luminescence properties of ZnS. The emission peaks of pure ZnS were observed at 550 and 470 nm (2.25 eV and 2.63 eV), corresponding to intrinsic defect and band–edge transitions of ZnS. The emission peak that appears at 470 nm is ascribed to sulfur bonds at the interface of ZnS nanoparticles, while the green photoluminescence peak at 550 nm validates the distinguishing feature of Zn2+ as luminous locations within the lattice. Furthermore, green PL emissions could be associated with the shift from the shallow donor (sulfur-vacancy) to the “t2” stage [2,60]. There were noticeable shifts in the location and intensity of the emission peaks after Mn doping. The photoluminescence emission spectra of doped ZnS nanopowder indicate that the peak emission bands are located at 600, 597, and 598 nm for 0.89%, 1.03%, and 1.27% Mn2+, respectively. The photoluminescence spectra displayed a prominent yellow-orange band at 600 nm, which was ascribed to the radiative transitions of electrons in the 3d5 unfilled shell of Mn2+ions 4T1(4G) → 6A1(6S) transition [61,62]. The PL intensity increased progressively with increasing Mn concentration. This enhancement is likely due to an optimal Mn-ion concentration, acting as luminescent centers without significant quenching effects from non-radiative recombination pathways. The observed red shift and increased PL intensity underscore the impact of Mn doping on tailoring the optical properties of ZnS nanoparticles. The ability to control emission characteristics through dopant concentration makes Mn-doped ZnS an excellent candidate for optoelectronic applications, such as light-emitting diodes, phosphors, and bio-imaging probes. Figure 8b shows a schematic energy band diagram of Mn-doped ZnS nanoparticles illustrating the proposed luminescence mechanism. The diagram shows the UV excitation (340 nm). Upon UV excitation at 340 nm, electrons are promoted from the valence band to the conduction band. In the pure ZnS host, the blue emission at 470 nm originates from the recombination of electrons at interstitial zinc (IZn) or sulfur vacancy (Vs) levels [63]. The transport of electrons from the sulfur vacancy (VS) to the low-energy (valence) band induces the green emission at 550 nm [64]. The green light emission exhibits a significant photoluminescence peak at 550 nm (2.25 eV), likely resulting from the recombination of holes in the lower energy valence band with negatively charged electrons localized in a sulfur vacancy (VS) [65]. Arora et al. reported analogous photoluminescence emissions at 530 nm in manganese-doped cadmium sulfide nanostructures [66]. The third significant orange emission band, centered at ~600 nm, is detected in all three doped samples. The energy transfer during the internal transitions of Mn ions within the 3d orbitals induced an orange emission at 600 nm with increased intensity. The substitution of Mn2+ for Zn in the Zn–S lattice alters the energy levels and induces lattice deformation due to discrepancies in ionic sizes [67]. Upon the incorporation of Mn into ZnS, Mn2+ ions function as luminescent centers, establishing a robust connection between the s-p states of the Mn–Zn–S framework. The energy transition between 4T1 and 6A1 in the 3 d5 configuration of Mn2+ ions correlates with the broader band observed at ~600 nm, associated with orange light emission in ZMN samples [68].
Figure 8.
(a)The PL spectrum of ZnS and ZMN nanoparticles; (b) energy level diagram of PL emissions of pure ZnS and Mn-doped ZnS nanoparticles.
3.5. Electrical Features
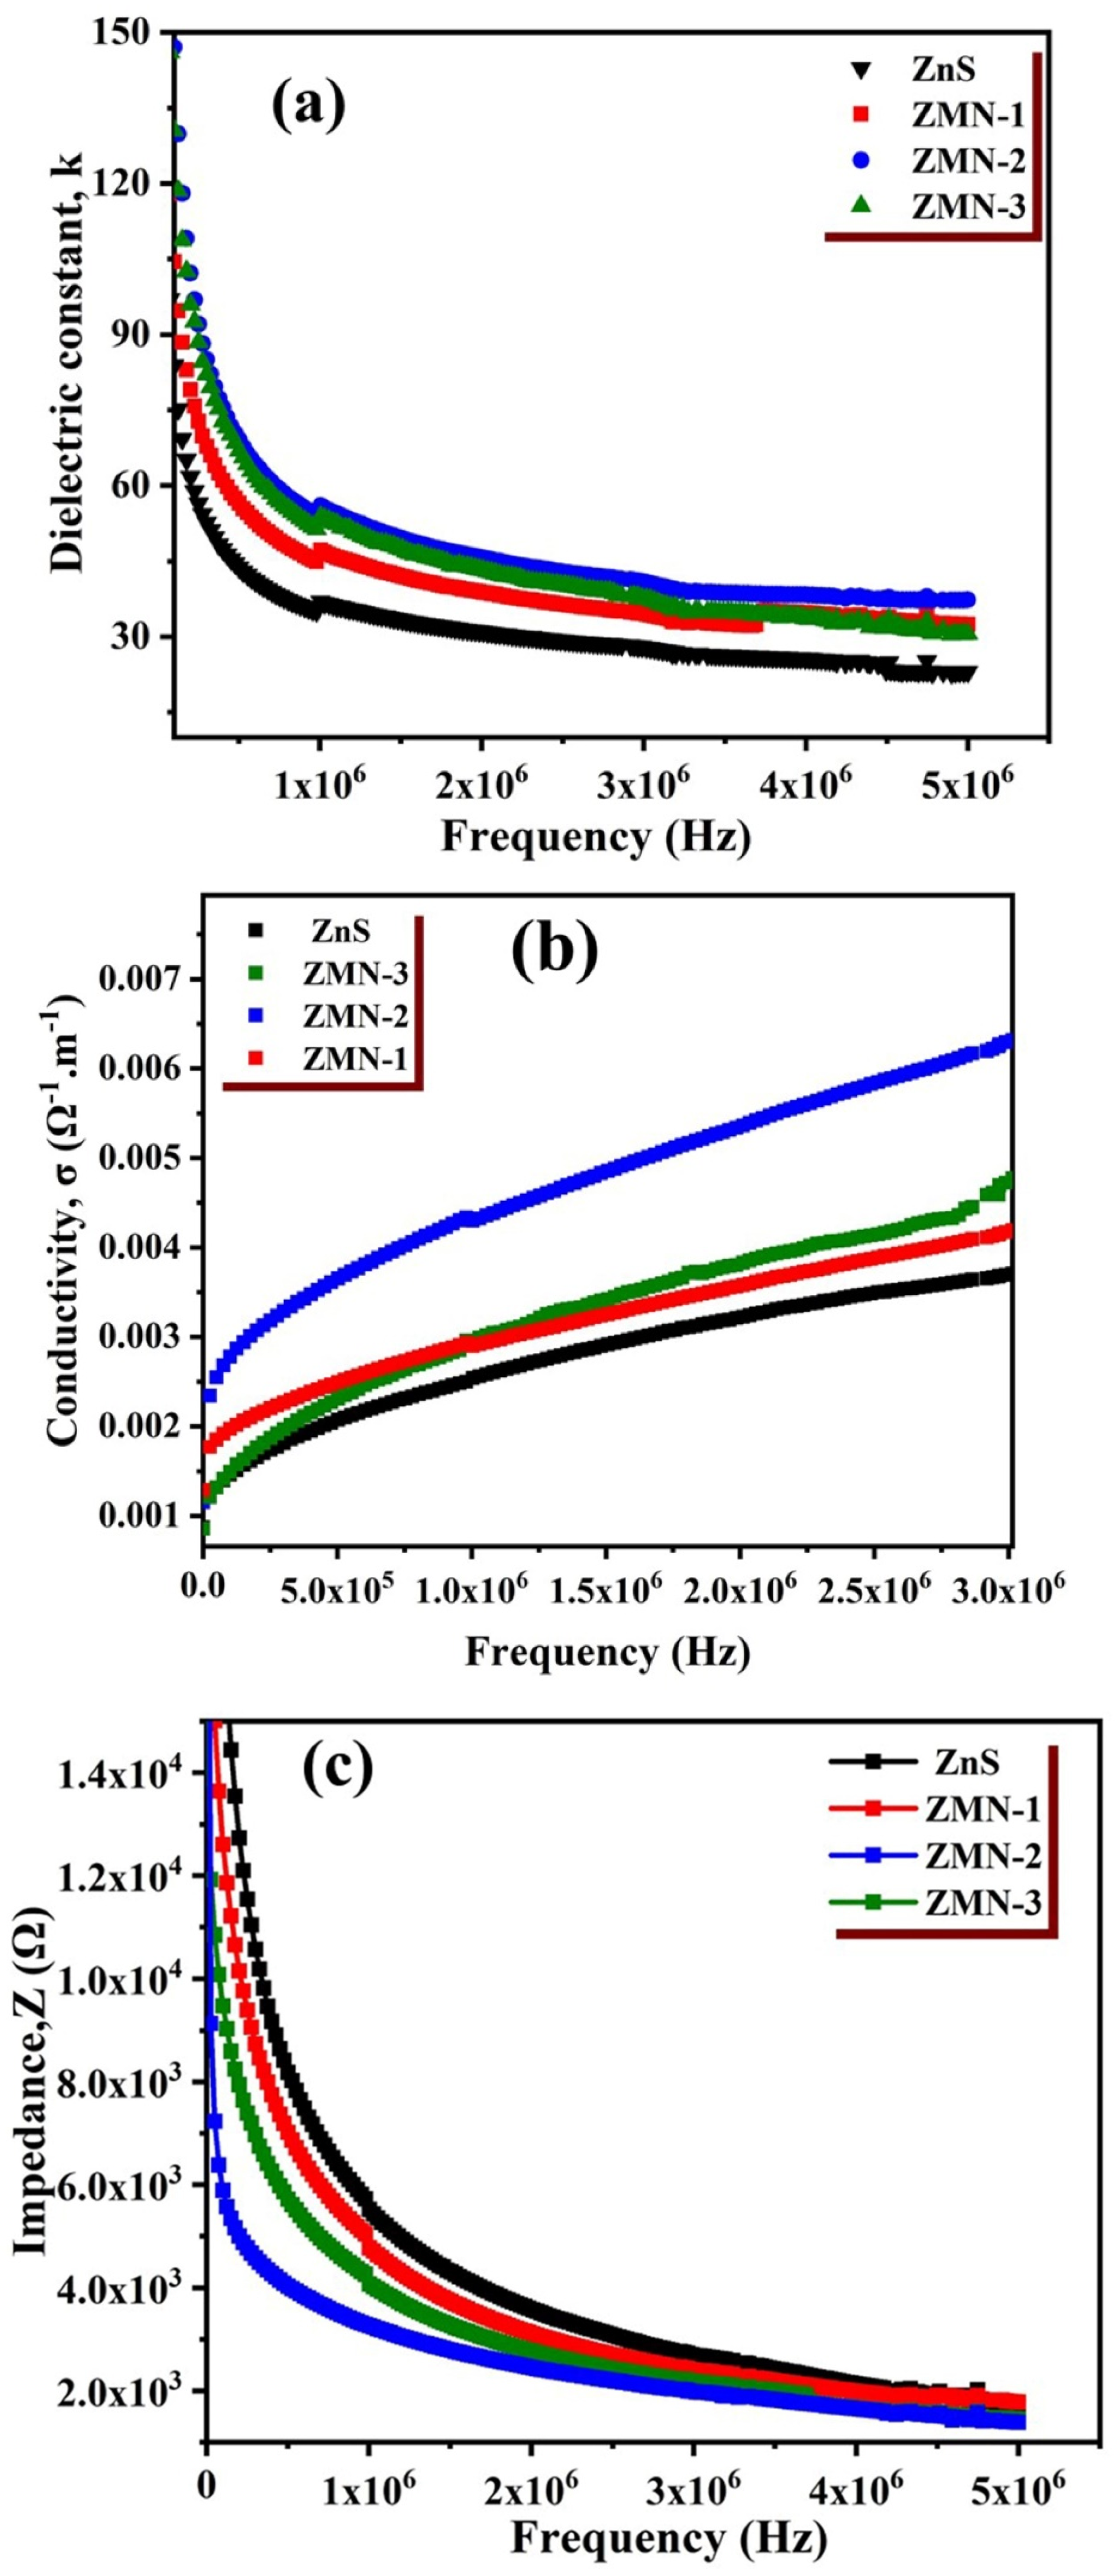
Relations between frequency and impedance, ac conductivity, and dielectric constant are illustrated in Figure 9a–c. The aforementioned electrical parameters of ZnS nanoparticles exhibit variations over a frequency range from 50 Hz to 5 MHz. The dielectric constant (k) is estimated using the following relation [69]:
Here, C represents the capacitance, drepresents the sample thickness, ε0 is the permittivity of the free space, and Adenotes the sample area. The sample thicknesses are listed in Table 1. Figure 9a shows that the dielectric constant decreases with increasing frequency, exhibiting significant dispersion at low frequencies but remaining stable at higher frequencies. The results indicate that the dielectric constant is highly dependent on the frequency of the applied AC signal. At lower frequencies, ZnS nanoparticles exhibit a high dielectric constant due to contributions from electronic, ionic, dipolar, and space charge polarizations, all of which vary with frequency [70]. Space charge polarization, typically active at low frequencies, serves as an indicator of the nanoparticles’ purity and structural quality. Its effect is particularly pronounced within the low-frequency range. The dielectric constant decreases with increasing frequency, as space charge and dipolar polarizations cannot respond quickly to high-frequency AC fields. It is observed that all Mn-doped samples exhibit a larger ε՝ than the pure sample. Mn doping enhances the dielectric constant slightly by creating additional polarization centers. The fluctuations in ac conductivity and the frequency of the synthesized nanoparticles are displayed in Figure 9b. The conductivity is generally influenced by grain boundaries, which act as barriers to charge–carrier movement, leading to charge accumulation and impacting overall electrical conductivity, especially in polycrystalline materials. These boundaries can enhance conductivity. Conductivity increases with increasing doping concentration, with the maximum value occurring at a higher frequency. Figure 9c represents the relation of impedance with frequency; the results show that the impedance diminishes with manganese doping concentration and frequency. Higher frequency values indicated reduced dispersion.
Figure 9.
Relation between frequency and (a) the dielectric constant, (b) the AC conductivity, and (c) the impedance at ambient temperature.
3.6. Photodetector Measurements
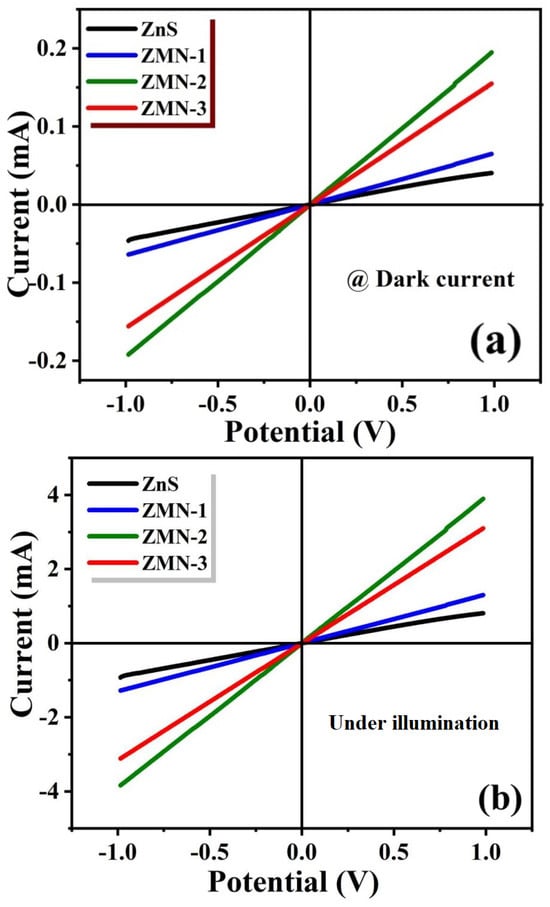
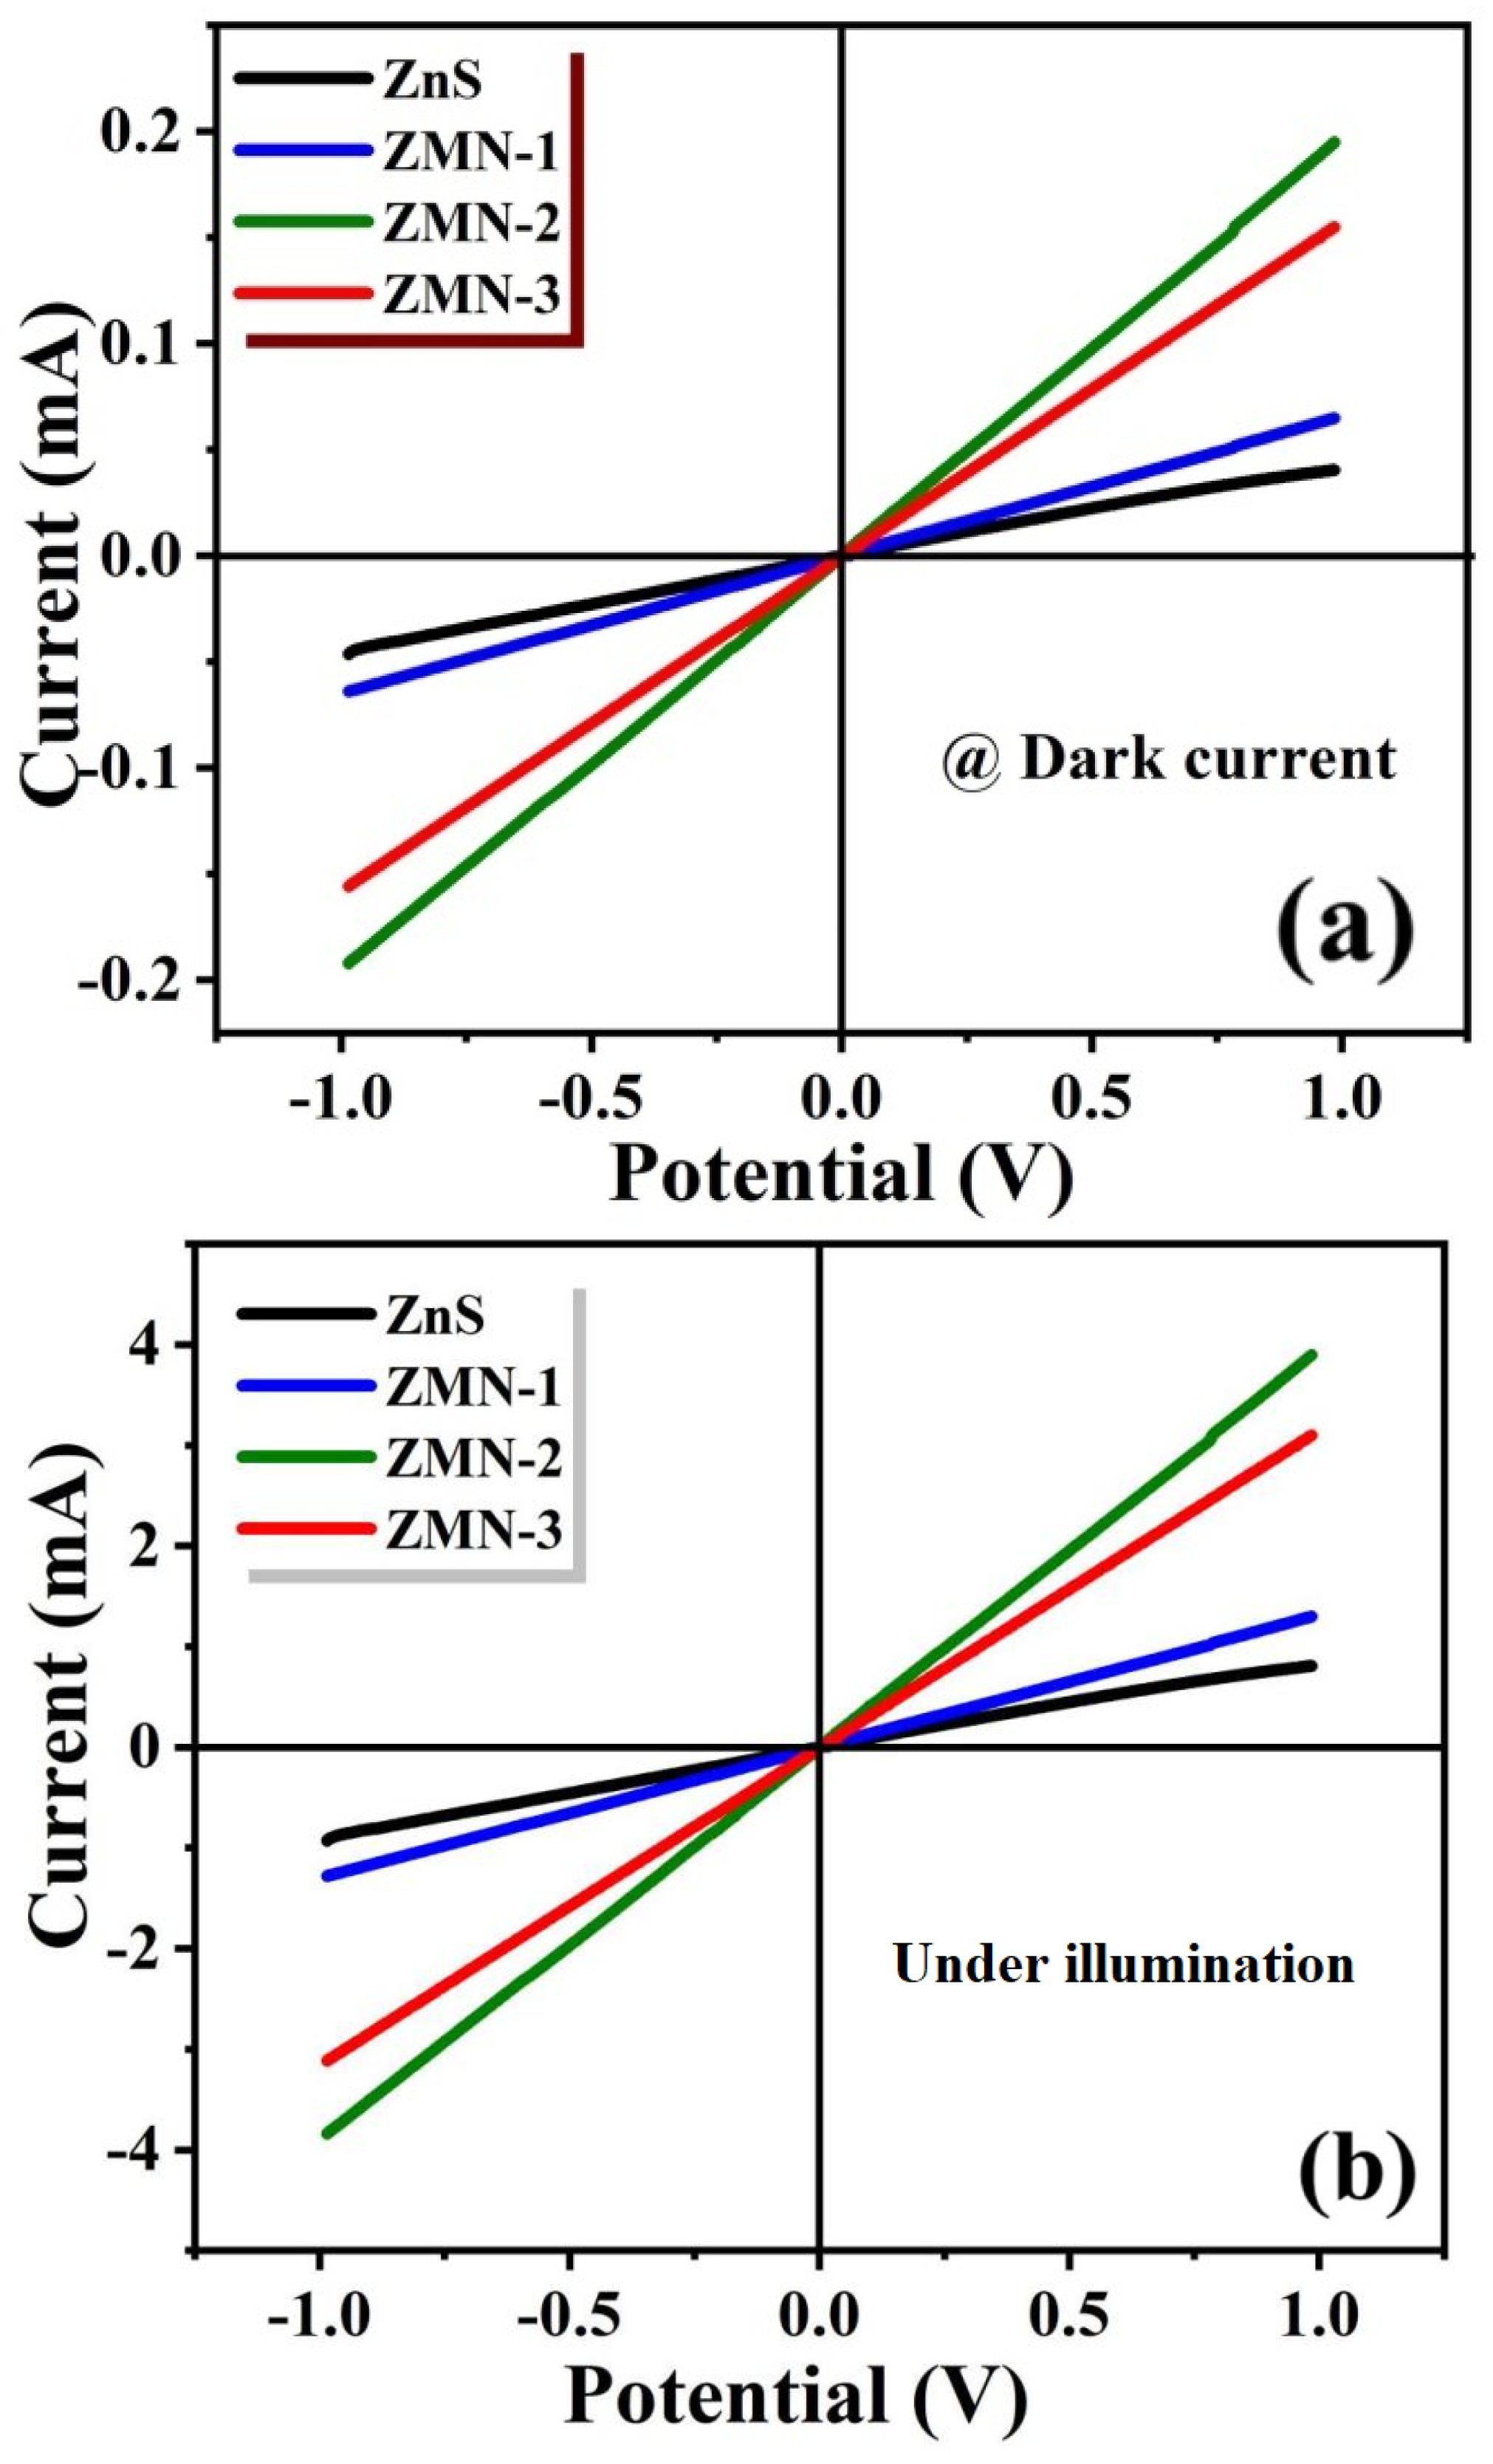
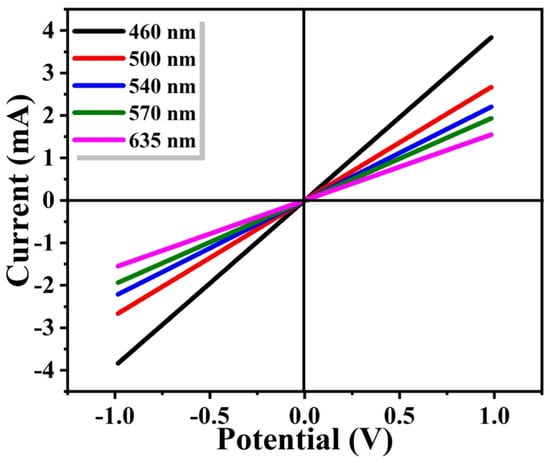
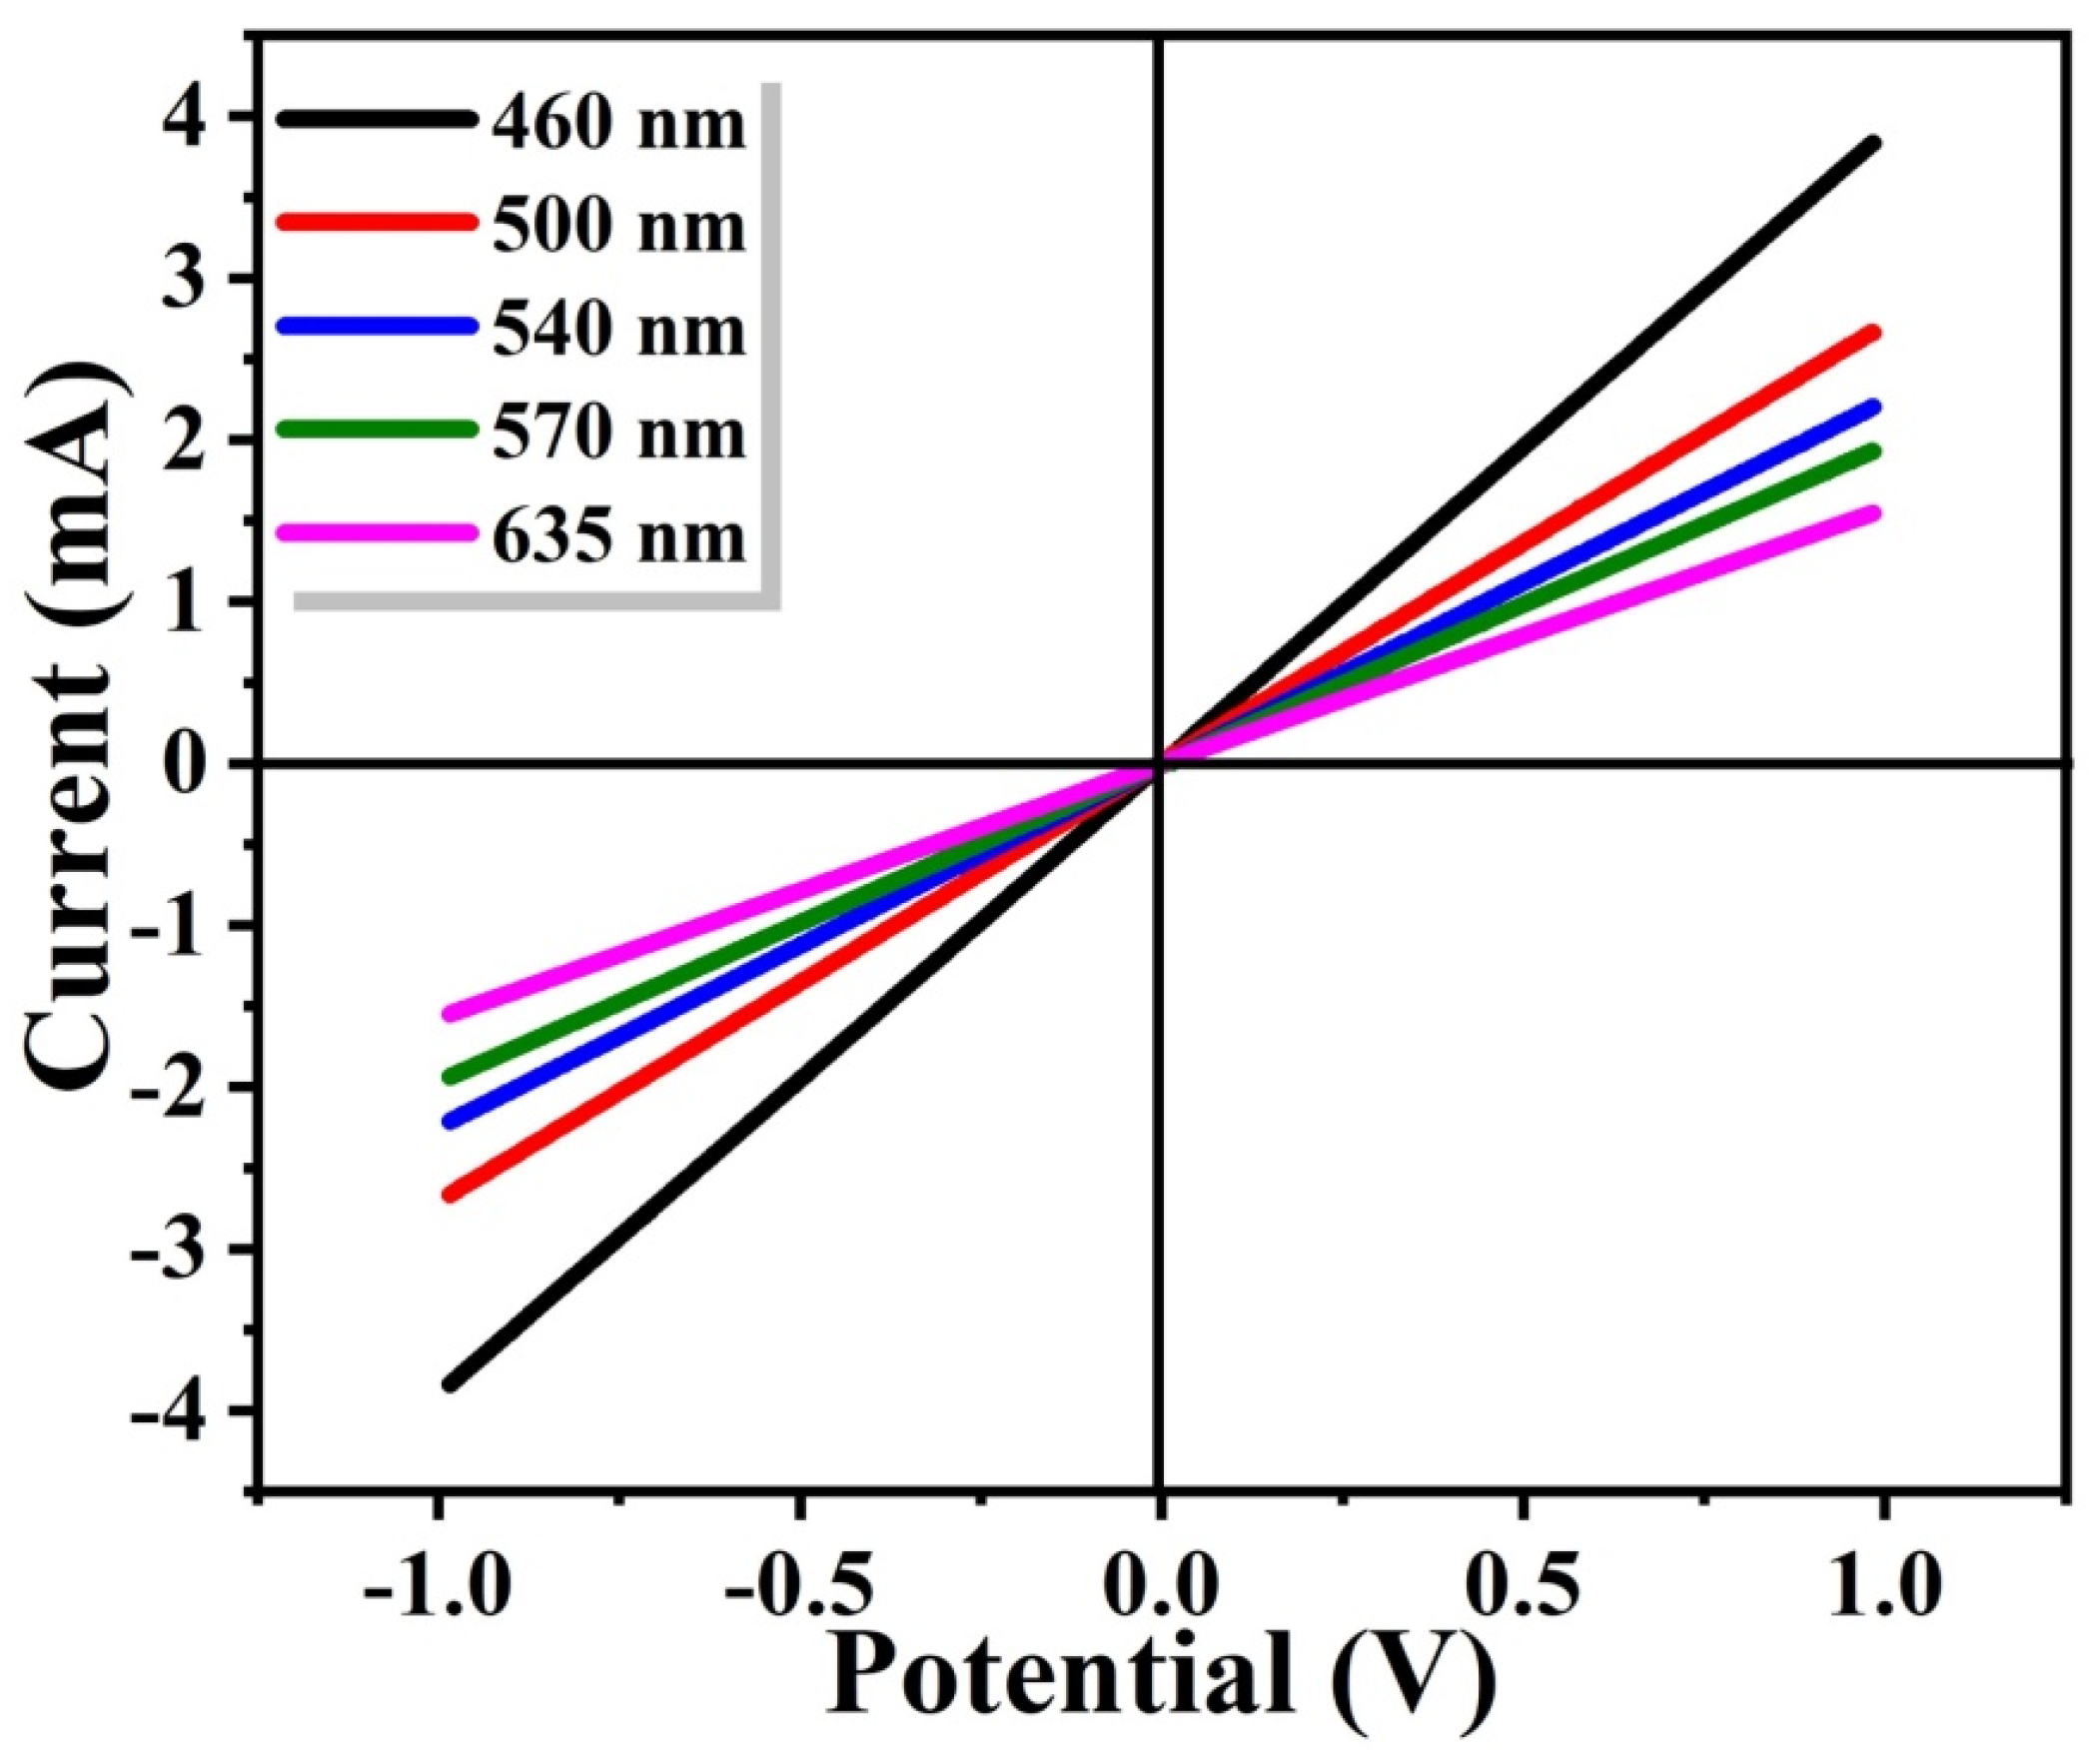
Figure 10 illustrates the photoconductive properties of the synthesized and Mn-doped ZnS nanoparticles under UV light with a wavelength of 460 nm and an intensity of 100 mW/cm2. The photocurrent exhibits linear behavior with the applied potential, indicating the ohmic nature of the samples. Furthermore, it is noted that Mn doping greatly increases the photocurrent from 0.8 mA, 1.3 mA, 3.8 mA, and 3.1 mA for pure ZnS, ZMN-1, ZMN-2, and ZMN-3, respectively. This could be ascribed to charge carriers being collected at the electrodes, with few recombination events and electron–hole pairs being readily generated. ZMN-2 exhibits the highest photocurrent among the three samples. This could be explained by the sample’s smaller band gap, which increases its interaction with the incoming UV light. Figure 11 shows the ZMN-2 sample’s (I-V) characteristics under light (various filters) (460–610 nm). The maximum current of 3.8 mA was measured at 460 nm, which is the closest wavelength to UV light and matches the band gap.
Figure 10.
(a) I-V characteristic curves for all samples at dark current; (b) I-V characteristic curves of all samples under illumination.
Figure 11.
Current–voltage (I-V) characteristic curves of the ZMN-2 photodetector with different wavelengths.
Three key parameters, responsivity (R), detectivity (D*), and external quantum efficiency (EQE), can be used to characterize a photodetector’s performance. The relationship between the photocurrent (Ip) generated by the incoming light (Pin) and the photodetector’s effective area (A), referred to as the sample’s photoresponsivity, has been computed using the following formula [71], and Table 2 displays the results.
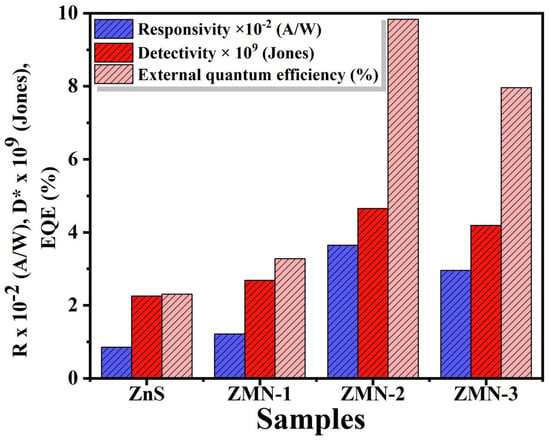
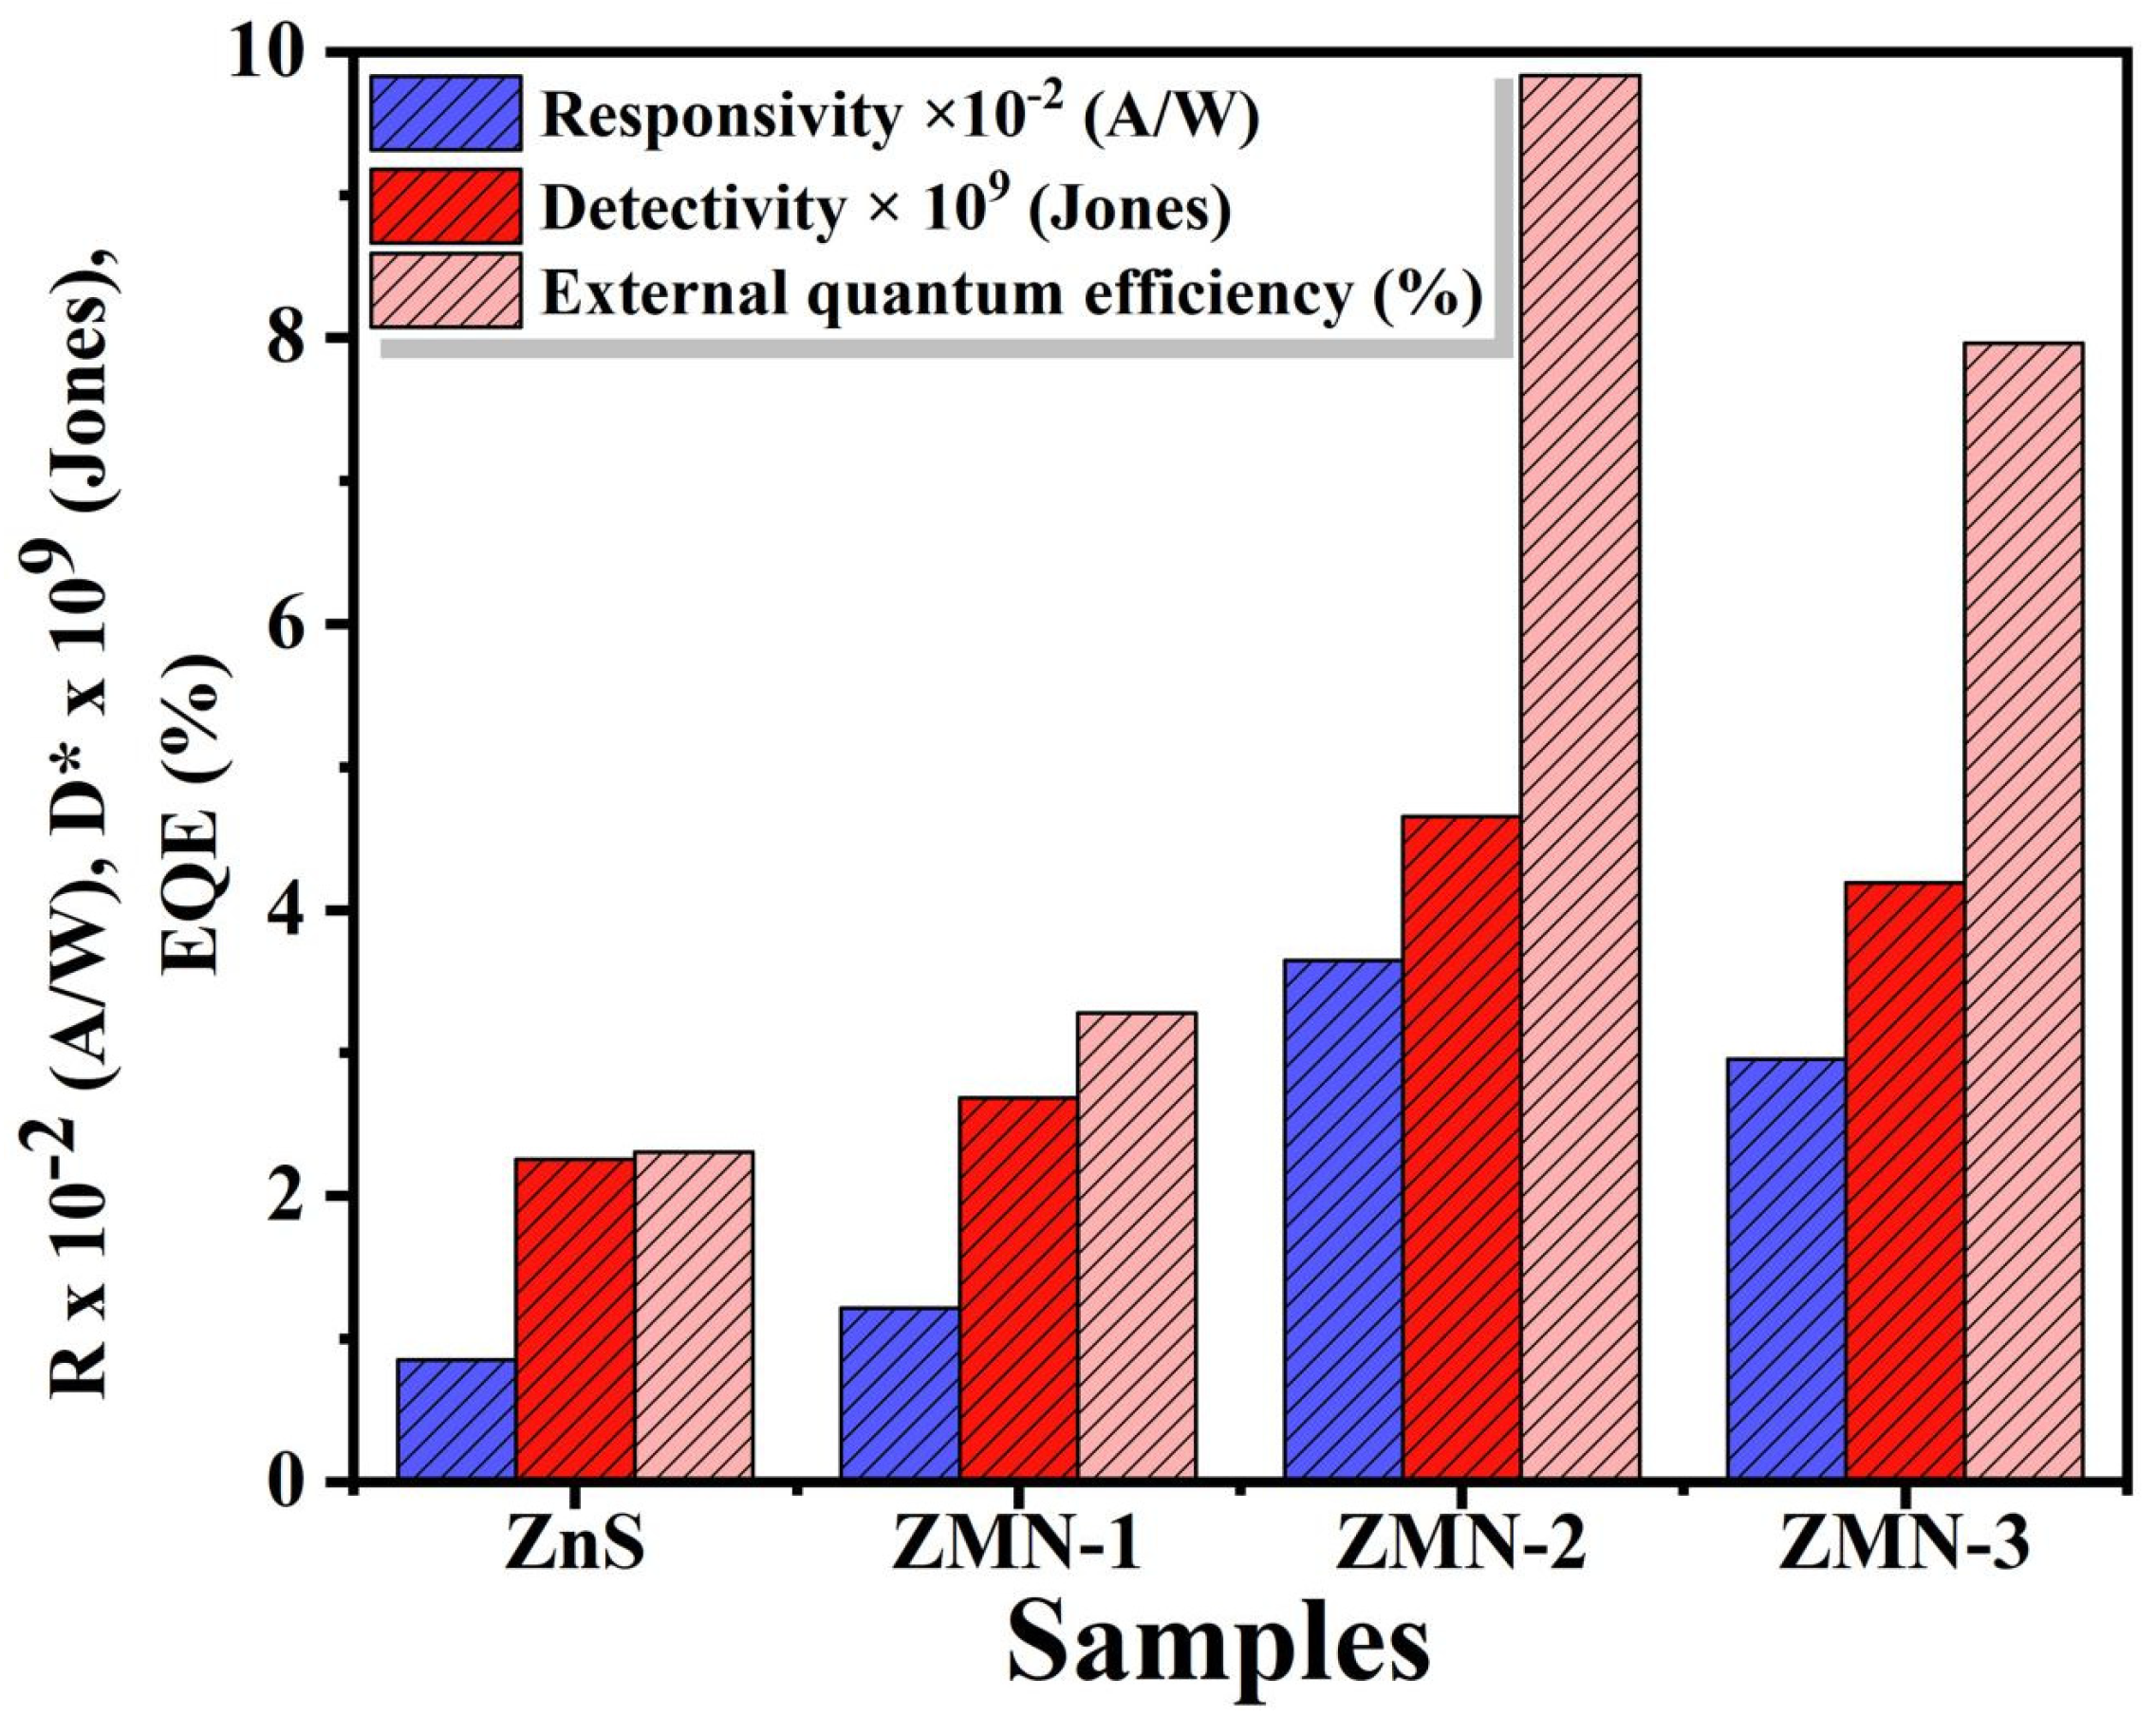
where Ip, A, and Pin denote the photocurrent, effective area, and incident light power, respectively. Table 2 reveals that responsivity increases from 0.8 × 10⁻² A/W to a peak of 3.6 × 10⁻² A/W for ZMN-2, then declines to 2.95 × 10⁻² A/W at ZMN-3. The optimal responsivity for ZMN-2 results from reduced band gap, which enhances photocurrent generation [72]. These values surpass previously reported results: A. Jesu Jebathew et al. obtained 2.24 × 10⁻² A/W [71]. Detectivity, a key parameter describing the photodetector’s ability to detect weak optical signals, can be calculated from the following equation [73,74].
In this context, R signifies the photoresponsivity, A represents the effective area, e denotes the elementary charge of an electron, and Id corresponds to the dark current. The introduction of manganese doping in ZnS enhances the D* values from 2.25 × 10⁹ to 4.65 × 10⁹ Jones for pure NiO and ZMN-2, while further increments of Mn result in a consistent decline in values for ZMN-3, which is measured at 4.18 × 10⁹ Jones, as detailed in Table 2. The peak value documented for ZMN-2 can be attributed to its exceptional crystalline structure and absorption properties. External quantum efficiency (EQE), the third pivotal parameter, is defined as the ratio of the number of absorbed photons to the number of electrons collected over a specified duration, and it was computed to evaluate the performance using the following equation [75].
where λ, c, and h denote the laser wavelength, speed of light, and Planck’s constant, respectively. The external quantum efficiency values for pristine, ZMN-1, ZMN-2, and ZMN-3 samples were calculated to be 2.3%, 3.2%, 9.8%, and 7.9%, respectively. Figure 12 shows the detectivity, external quantum efficiency, and responsivity of the ZnS photosensors at different Mn concentrations. Among all fabricated samples, the ZMN-2 sample exhibits the highest performance, with a quantum efficiency of 9.8% that significantly exceeds other doping levels. All three key parameters, responsivity, quantum efficiency, and detectivity, increase progressively as Mn concentration rises from 0.0 to 1.03% Mn2+. These results establish ZMN-2 as the optimal concentration for photosensor device fabrication, given its superior performance characteristics.
Figure 12.
Key photodetector parameters of ZnS and Mn-doped ZnS samples at 1 V bias and 460 nm wavelength.
The rise in quantum efficiency from 0.0 to 1.03% Mn2+ ions results from the greater availability of active sites and the effective transfer of energy from the host matrix to the Mn2+ ions, thereby enhancing radiative recombination. The optimal quantum efficiency is achieved by ensuring that the manganese ions are sufficiently distributed to reduce non-radiative processes and maximize radiative processes (charge-transfer efficiency). On the other hand, above an optimal doping level of 1.27% Mn2+ ions, concentration quenching occurs due to closer distances between Mn2+ ions, thereby enabling non-radiative energy transfer and cross-relaxation processes.
The performance of the proposed Mn-doped ZnS photo detector in Table 2 has been compared with that of existing ZnS and doped ZnS photodetectors synthesized by various methods. Clearly, almost all undoped ZnS photodetectors have a fairly low responsivity in the range of 10−6 to 10−3 AW−1, with moderate detectivity. On the other hand, despite a few exceptions, most of the doped ZnS photodetectors, like Cu and Pr-doped ZnS, display higher values of responsivity and detectivity; however, they do not provide optimum values for all three important parameters, such as responsivity, EQE, and detectivity, simultaneously. The Mn-doped ZnS photodetector developed in the current study is characterized by a very good combination of responsivity, EQE, and detectivity, exhibiting a high responsivity of (3.64 ± 0.11) × 10−2 AW−1, an EQE of 9.7 ± 0.2%, and a high value of detectivity of (4.65 ± 0.14) × 109 Jones when operated under UV illumination.
Table 2.
Comparative table of photodetector performance characteristics.
4. Conclusions
This study successfully synthesized and characterized Mn-doped ZnS nanoparticles, highlighting the influence of Mn doping on their structural, optical, morphological, and electrical properties. XRD results confirmed the cubic crystal structure of the samples, with an increase in crystallite size at optimal Mn concentrations. SEM analysis demonstrated the formation of spherical, well-dispersed nanoparticles, and EDS verified the uniform incorporation of Mn into the ZnS matrix. The photoluminescence analysis revealed enhanced luminescence intensity and a red shift in emission peaks due to the introduction of Mn2+-related energy levels, which act as efficient luminescent centers. Electrical measurements further showed improvements in dielectric constant and conductivity with Mn doping, underscoring the potential of these materials for advanced electronic applications. The findings of this study emphasize the importance of controlled doping in tuning the properties of ZnS nanoparticles. Mn doping not only improves luminescence and electrical characteristics but also introduces tunable optical properties, making these materials highly suitable for applications in optoelectronic devices, phosphors, and bio-imaging. Future research could explore higher doping levels, alternative synthesis methods, and real-world device integration to fully harness the potential of Mn-doped ZnS nanoparticles. The ZMN-2 photodetector exhibited optimal performance parameters: responsivity of 3.6 × 10⁻² AW−1, EQE of 9.8%, and detectivity of 4.65 × 10⁹ Jones. This study demonstrates how Mn doping affects the optical and photoconductivity properties of ZnS nanoparticles, suggesting their suitability for optoelectronic applications.
Author Contributions
Conceptualization, W.Z.T.; methodology, W.Z.T., H.H., M.A.M.A. and M.S.A.-w.; software, M.A.M.A.; validation, H.A.A.; formal analysis, H.H.; investigation, H.A.A., A.A.A. and M.S.A.-w.; resources, W.Z.T.; data curation, M.A.M.A.; writing—original draft preparation, H.H. and A.A.A.; writing—review and editing, W.Z.T. and M.S.A.-w.; visualization, A.A.A.; funding acquisition, H.A.A. All authors have read and agreed to the published version of the manuscript.
Funding
This research was funded by Princess Nourah bint Abdulrahman University Researchers Supporting Project number (PNURSP2026R458), Princess Nourah bint Abdulrahman University, Riyadh, Saudi Arabia.
Data Availability Statement
All data are available within the manuscript.
Acknowledgments
The authors acknowledge Princess Nourah bint Abdulrahman University Researchers Supporting Project number (PNURSP2026R458), Princess Nourah bint Abdulrahman University, Riyadh, Saudi Arabia.
Conflicts of Interest
There are no conflicts to declare.
References
- Shakil, M.A.; Das, S.; Rahman, M.A.; Akther, U.S.; Majumdar, M.K.H.; Rahman, M.K. A Review on zinc sulphide thin film fabrication for various applications based on doping elements. Mater. Sci. Appl. 2018, 9, 751–778. [Google Scholar] [CrossRef]
- Kole, A.; Kumbhakar, P. Effect of manganese doping on the photoluminescence characteristics of chemically synthesized zinc sulfide nanoparticles. Appl. Nanosci. 2012, 2, 15–23. [Google Scholar] [CrossRef] [Scilit]
- Cao, S.; Li, C.; Wang, L.; Shang, M.; Wei, G.; Zheng, J.; Yang, W. Long-lived and well-resolved Mn2+ ion emissions in CuInS-ZnS quantum dots. Sci. Rep. 2014, 4, 7510. [Google Scholar] [CrossRef] [Scilit]
- Yuan, X.; Ma, R.; Zhang, W.; Hua, J.; Meng, X.; Zhong, X.; Zhang, J.; Zhao, J.; Li, H. Dual emissive manganese and copper co-doped Zn–In–S quantum dots as a single color-converter for high color rendering white-light-emitting diodes. ACS Appl. Mater. Interfaces 2015, 7, 8659–8666. [Google Scholar] [CrossRef] [Scilit]
- Wu, P.; Yan, X.-P. Doped quantum dots for chemo/biosensing and bioimaging. Chem. Soc. Rev. 2013, 42, 5489–5521. [Google Scholar] [CrossRef] [Scilit] [PubMed]
- Pradhan, N.; Sarma, D. Advances in light-emitting doped semiconductor nanocrystals. J. Phys. Chem. Lett. 2011, 2, 2818–2826. [Google Scholar] [CrossRef] [Scilit]
- Santra, P.K.; Kamat, P.V. Mn-doped quantum dot sensitized solar cells: A strategy to boost efficiency over 5%. J. Am. Chem. Soc. 2012, 134, 2508–2511. [Google Scholar] [CrossRef] [Scilit] [PubMed]
- Bradshaw, L.R.; Knowles, K.E.; McDowall, S.; Gamelin, D.R. Nanocrystals for luminescent solar concentrators. Nano Lett. 2015, 15, 1315–1323. [Google Scholar] [CrossRef] [Scilit]
- Zhu, Y.-P.; Li, J.; Ma, T.-Y.; Liu, Y.-P.; Du, G.; Yuan, Z.-Y. Sonochemistry-assisted synthesis and optical properties of mesoporous ZnS nanomaterials. J. Mater. Chem. A 2014, 2, 1093–1101. [Google Scholar] [CrossRef] [Scilit]
- Xu, X.; Li, S.; Chen, J.; Cai, S.; Long, Z.; Fang, X. Design principles and material engineering of ZnS for optoelectronic devices and catalysis. Adv. Funct. Mater. 2018, 28, 1802029. [Google Scholar] [CrossRef] [Scilit]
- Alaie, Z.; Nejad, S.M.; Yousefi, M. Recent advances in ultraviolet photodetectors. Mater. Sci. Semicond. Process. 2015, 29, 16–55. [Google Scholar] [CrossRef] [Scilit]
- Hamdy, H.; Abdel-wahab, M.S.; Tammam, M.; Elfayoumi, M.A.K.; Shaban, M.; Tawfik, W.Z. Boosting UV Photodetector Performance with Copper-Doped NiO Nanoflake Thin Films. Phys. B Condens. Matter 2025, 707, 417196. [Google Scholar] [CrossRef] [Scilit]
- Waldiya, M.; Narasimman, R.; Bhagat, D.; Vankhade, D.; Mukhopadhyay, I. Nanoparticulate CdS 2D array by chemical bath deposition: Characterization and optoelectronic study. Mater. Chem. Phys. 2019, 226, 26–33. [Google Scholar] [CrossRef] [Scilit]
- Lee, G.-J.; Wu, J.J. Recent developments in ZnS photocatalysts from synthesis to photocatalytic applications—A review. Powder Technol. 2017, 318, 8–22. [Google Scholar] [CrossRef] [Scilit]
- Molaei, M.; Karimimaskon, F.; Lotfiani, A.; Samadpour, M.; Liu, H. Synthesis of ZnS:Ni nanocrystals (NCs) using a rapid microwave activated method and investigation of the structural and optical properties. J. Lumin. 2013, 143, 649–652. [Google Scholar] [CrossRef] [Scilit]
- Wang, Y.; Liang, X.; Ma, X.; Hu, Y.; Hu, X.; Li, X.; Fan, J. Simple and greener synthesis of highly photoluminescence Mn2+-doped ZnS quantum dots and its surface passivation mechanism. Appl. Surf. Sci. 2014, 316, 54–61. [Google Scholar] [CrossRef] [Scilit]
- Yan, J.; Wang, K.; Liu, Q.; Qian, J.; Dong, X.; Liu, W.; Qiu, B. One-pot synthesis of CdxZn1−xS–reduced graphene oxide nanocomposites with improved photoelectrochemical performance for selective determination of Cu2+. RSC Adv. 2013, 3, 14451–14457. [Google Scholar] [CrossRef] [Scilit]
- Ronda, C. Phosphors for lamps and displays: An applicational view. J. Alloys Compd. 1995, 225, 534–538. [Google Scholar] [CrossRef] [Scilit]
- Nien, Y.-T.; Chen, I.-G.; Hwang, C.-S.; Chu, S.-Y. Copper concentration dependence of structure, morphology and optical properties of ZnS:Cu, Cl phosphor powder. J. Phys. Chem. Solids 2008, 69, 366–371. [Google Scholar] [CrossRef] [Scilit]
- Chen, Y.; Duh, J.; Chiou, B.; Peng, C. Luminescent mechanisms of ZnS:Cu:Cl and ZnS:Cu:Al phosphors. Thin Solid Films 2001, 392, 50–55. [Google Scholar] [CrossRef] [Scilit]
- Chen, W.; Su, F.; Li, G.; Joly, A.G.; Malm, J.-O.; Bovin, J.-O. Temperature and pressure dependences of the Mn2+ and donor–acceptor emissions in ZnS:Mn2+ nanoparticles. J. Appl. Phys. 2002, 92, 1950–1955. [Google Scholar] [CrossRef] [Scilit]
- Nguyen, T.T.; Trinh, X.A.; Nguyen, L.H.; Pham, T.H. Photoluminescence characteristics of as-synthesized and annealed ZnS:Cu, Al nanocrystals. Adv. Nat. Sci. Nanosci. Nanotechnol. 2011, 2, 035008. [Google Scholar] [CrossRef] [Scilit]
- Abdelhalium, H.H.; Abdel-wahab, M.S.; Tamm, M.; Tawfik, W.Z. Highly efficient ultraviolet photodetector based on molybdenum-doped nanostructured NiO/ITO thin film. Appl. Phys. A 2023, 129, 459. [Google Scholar] [CrossRef] [Scilit]
- Song, C.; Chen, B.; Chen, Y.; Wu, Y.; Zhuang, Z.; Lu, X.; Qiao, X.; Fan, X. Microstructures and luminescence behaviors of Mn2+ doped ZnS nanoparticle clusters with different core/shell assembled orders. J. Alloys Compd. 2014, 590, 546–552. [Google Scholar] [CrossRef] [Scilit]
- Sooklal, K.; Cullum, B.S.; Angel, S.M.; Murphy, C.J. Photophysical properties of ZnS nanoclusters with spatially localized Mn2+. J. Phys. Chem. 1996, 100, 4551–4555. [Google Scholar] [CrossRef] [Scilit]
- Ibrahim, A.M.; Abdel-wahab, M.S.; Elfayoumi, M.A.K.; Tawfik, W.Z. Highly efficient sputtered Ni-doped Cu2O photoelectrodes for solar hydrogen generation from water-splitting. Int. J. Hydrogen Energy 2023, 48, 1863–1876. [Google Scholar] [CrossRef] [Scilit]
- Vikkash, R.; Muthukumaran, S.; Rakchana, M.; Sakthivel, P. Enhanced structural, optical and photocatalytic properties of Zn0.96Mn0.04S nanostructures with Ni doping. Opt. Mater. 2025, 169, 117623. [Google Scholar] [CrossRef] [Scilit]
- Sakthivel, P.; Muthukumaran, S.; Ashokkumar, M. Structural, band gap and photoluminescence behaviour of Mn-doped ZnS quantum dots annealed under Ar atmosphere. J. Mater. Sci. Mater. Electron. 2015, 26, 1533–1542. [Google Scholar] [CrossRef] [Scilit]
- Ren, Z.; Yang, H.; Shen, L.; Han, S.D. Hydrothermal preparation and properties of nanocrystalline ZnS:Mn. J. Mater. Sci. Mater. Electron. 2008, 19, 1–4. [Google Scholar] [CrossRef] [Scilit]
- Song, C.F.; Lü, M.K.; Yang, P.; Gu, F.; Xu, D.; Yuan, D.R. Luminescence Properties of Mn2+-Doped Sol-Gel Glasses. J. Sol-Gel Sci. Technol. 2003, 28, 193–197. [Google Scholar] [CrossRef] [Scilit]
- Lu, S.W.; Lee, B.I.; Wang, Z.L.; Tong, W.; Wagner, B.K.; Park, W.; Summers, C.J. Synthesis and photoluminescence enhancement of Mn2+-doped ZnS nanocrystals. J. Lumin. 2000, 92, 73–78. [Google Scholar] [CrossRef] [Scilit]
- Jin, C.; Yu, J.; Sun, L.; Dou, K.; Hou, S.; Zhao, J.; Chen, Y.; Huang, S. Luminescence of Mn2+ doped ZnS nanocrystallites. J. Lumin. 1995, 66, 315–318. [Google Scholar] [CrossRef] [Scilit]
- Yang, H.; Wang, Z.; Song, L.; Zhao, M.; Chen, Y.; Dou, K.; Yu, J.; Wang, L. Study of optical properties of manganese doped ZnS nanocrystals. Mater. Chem. Phys. 1997, 47, 249–251. [Google Scholar] [CrossRef] [Scilit]
- Gan, L.; Liu, B.; Chew, C.; Xu, S.; Chua, S.; Loy, G.; Xu, G. Enhanced photoluminescence and characterization of Mn-doped ZnS nanocrystallites synthesized in microemulsion. Langmuir 1997, 13, 6427–6431. [Google Scholar] [CrossRef] [Scilit]
- Cadiş, A.; Popovici, E.; Bica, E.; Perhaita, I.; Barbu-Tudoran, L.; Indrea, E.; Silaghi-Dumitrescu, L. Synthesis of Manganese Doped Zinc Sulphide Nanocrystalline Powders by Wet-Chemical Synthesis Route. Dig. J. Nanomater. Biostruct. 2011, 6, 1479. [Google Scholar]
- Kumar, R.; Sakthivel, P.; Mani, P. Structural, optical investigations of Zn0.98−xSn0.02MnxS (x ≤ 0.04) quantum dots for optoelectronic applications. Optik 2021, 240, 166788. [Google Scholar]
- Murugadoss, G. Luminescence properties of co-doped ZnS:Ni, Mn and ZnS:Cu, Cd nanoparticles. J. Lumin. 2012, 132, 2043–2048. [Google Scholar] [CrossRef] [Scilit]
- Samad, F.A.; Abdel-wahab, M.S.; Tawfik, W.Z.; Qayyum, H.; Apsari, R.; Mohamed, T. Thickness-dependent nonlinear optical properties of ITO thin films. Opt. Quantum Electron. 2023, 55, 753. [Google Scholar] [CrossRef] [Scilit]
- Lee, J.K.; Hyeon, G.Y.; Tawfik, W.Z.; Choi, H.S.; Ryu, S.-W.; Jeong, T.; Jung, E.; Kim, H. Electrochemical removal of hydrogen atoms in Mg-doped GaN epitaxial layers. J. Appl. Phys. 2015, 117, 185702. [Google Scholar] [CrossRef] [Scilit]
- Viswanath, R.; Naik, H.S.B.; Somalanaik, Y.K.G.; Neelanjeneallu, P.K.P.; Harish, K.N.; Prabhakara, M.C. Studies on characterization, optical absorption, and photoluminescence of yttrium doped ZnS nanoparticles. J. Nanotechnol. 2014, 2014, 924797. [Google Scholar] [CrossRef] [Scilit]
- Tawfik, W.Z.; Farghali, A.; Moneim, A.; Imam, N.; El-Dek, S. Outstanding features of Cu-doped ZnS nanoclusters. Nanotechnology 2018, 29, 215709. [Google Scholar] [CrossRef] [Scilit]
- Poornaprakash, B.; Sambasivam, S.; Reddy, D.A.; Murali, G.; Vijayalakshmi, R.; Reddy, B. Dopant induced RTFM and enhancement of fluorescence efficiencies in spintronic ZnS:Ni nanoparticles. Ceram. Int. 2014, 40, 2677–2684. [Google Scholar] [CrossRef] [Scilit]
- Ramasamy, V.; Praba, K.; Murugadoss, G. Synthesis and study of optical properties of transition metals doped ZnS nanoparticles. Spectrochim. Acta Part A Mol. Biomol. Spectrosc. 2012, 96, 963–971. [Google Scholar] [CrossRef] [Scilit]
- Najafkhani, F.; Kheiri, S.; Pourbahari, B.; Mirzadeh, H. Recent advances in the kinetics of normal/abnormal grain growth: A review. Arch. Civ. Mech. Eng. 2021, 21, 29. [Google Scholar] [CrossRef] [Scilit]
- Holzwarth, U.; Gibson, N. The Scherrer equation versus the ‘Debye-Scherrer equation’. Nat. Nanotechnol. 2011, 6, 534. [Google Scholar] [CrossRef] [Scilit]
- Scherrer, P. Estimation of the Size and Internal Structure of Colloidal Particles by Means of Röntgen. Nachr. Ges. Wiss. Gött. 1918, 2, 96–100. [Google Scholar]
- Sharma, A.; Rai, V.; Mani, S.; Chawade, S. A study of structural parameters and photoluminescence of Tb doped ZnO nanoparticles. Mater. Today Proc. 2020, 26, 58–63. [Google Scholar] [CrossRef] [Scilit]
- Qutb, S.R.; Tawfik, W.Z.; El-Dek, S.; Hussein, M.; Abdel-wahab, M.S. Superior photoelectrodes of nanostructured Mo-doped CuO thin film for green hydrogen generation from photoelectrochemical water-splitting. Int. J. Hydrogen Energy 2024, 76, 190–201. [Google Scholar] [CrossRef] [Scilit]
- Dong, B.; Cao, L.; Su, G.; Liu, W.; Qu, H.; Zhai, H. Water-soluble ZnS:Mn/ZnS core/shell nanoparticles prepared by a novel two-step method. J. Alloys Compd. 2010, 492, 363–367. [Google Scholar] [CrossRef] [Scilit]
- Geldasa, F.T.; Dejene, F.B. Transition metal doping effects on the structural, mechanical, electronic, and optical properties of α-NiS for photocatalysis applications via DFT + U insights. Appl. Phys. A 2025, 131, 869. [Google Scholar] [CrossRef] [Scilit]
- Shaterian, M.; Enhessari, M.; Rabbani, D.; Asghari, M.; Salavati-Niasari, M. Synthesis, characterization and photocatalytic activity of LaMnO3 nanoparticles. Appl. Surf. Sci. 2014, 318, 213–217. [Google Scholar] [CrossRef] [Scilit]
- Vijayan, S.; Dash, C.S.; Umadevi, G.; Sundararajan, M.; Mariappan, R. Investigation of structural, optical and antibacterial activity of ZnS nanoparticles. J. Clust. Sci. 2021, 32, 1601–1608. [Google Scholar] [CrossRef] [Scilit]
- Abdel-wahab, M.S.; Ibrahim, A.M.; Farghali, A.A.; Tawfik, W.Z. Sputtered nanocrystalline samarium doped CuO photoelectrode for efficient photoelectrochemical water splitting. Mater. Today Commun. 2023, 37, 107122. [Google Scholar] [CrossRef] [Scilit]
- Patra, A.S.; Kumar, N.V.; Barpuzary, D.; De, M.; Qureshi, M. Strontium doped lanthanum manganites for efficient and robust photocatalytic water oxidation coupled with graphene oxide. Mater. Lett. 2014, 131, 125–127. [Google Scholar] [CrossRef] [Scilit]
- Szabó-Bárdos, E.; Somogyi, K.; Törő, N.; Kiss, G.; Horváth, A. Photocatalytic decomposition of l-phenylalanine over TiO2: Identification of intermediates and the mechanism of photodegradation. Appl. Catal. B Environ. 2011, 101, 471–478. [Google Scholar] [CrossRef] [Scilit]
- Kripal, R.; Gupta, A.K.; Mishra, S.K.; Srivastava, R.K.; Pandey, A.C.; Prakash, S. Photoluminescence and photoconductivity of ZnS:Mn2+ nanoparticles synthesized via co-precipitation method. Spectrochim. Acta Part A Mol. Biomol. Spectrosc. 2010, 76, 523–530. [Google Scholar] [CrossRef] [Scilit]
- Mamiyev, Z.Q.; Balayeva, N.O. Optical and structural studies of ZnS nanoparticles synthesized via chemical in situ technique. Chem. Phys. Lett. 2016, 646, 69–74. [Google Scholar] [CrossRef] [Scilit]
- Divya, A.; Reddy, B.; Sambasivam, S.; Kumar, K.S.; Reddy, P.S. Structural and optical characterization of ZnS nanoparticles co-doped with Mn and Te. Phys. E Low-Dimens. Syst. Nanostruct. 2011, 44, 541–545. [Google Scholar] [CrossRef] [Scilit]
- Khan, M.S.; Shi, L.; Yang, X.; Ali, S.; Ullah, H.; Zou, B. Optoelectronic and magnetic properties of Mn-doped and Mn–C co-doped Wurtzite ZnS: A first-principles study. J. Phys. Condens. Matter 2019, 31, 395702. [Google Scholar] [CrossRef] [Scilit]
- Peng, W.; Cong, G.; Qu, S.; Wang, Z. Synthesis and photoluminescence of ZnS:Cu nanoparticles. Opt. Mater. 2006, 29, 313–317. [Google Scholar] [CrossRef] [Scilit]
- Bhargava, R.; Gallagher, D.; Hong, X.; Nurmikko, A. Optical properties of manganese-doped nanocrystals of ZnS. Phys. Rev. Lett. 1994, 72, 416. [Google Scholar] [CrossRef] [Scilit]
- Bol, A.; Meijerink, A. Long-lived Mn2+ emission in nanocrystalline ZnS:Mn2+. Phys. Rev. B 1998, 58, R15997. [Google Scholar] [CrossRef] [Scilit]
- Wu, J.-C.; Zheng, J.; Wu, P.; Xu, R. Study of native defects and transition-metal (Mn, Fe, Co, and Ni) doping in a zinc-blende CdS photocatalyst by DFT and hybrid DFT calculations. J. Phys. Chem. C 2011, 115, 5675–5682. [Google Scholar] [CrossRef] [Scilit]
- Deka, K.; Kalita, M.P. Structural phase controlled transition metal (Fe, Co, Ni, Mn) doping in CdS nanocrystals and their optical, magnetic and photocatalytic properties. J. Alloys Compd. 2018, 757, 209–220. [Google Scholar] [CrossRef] [Scilit]
- Wang, Y.; Herron, N. Photoluminescence and relaxation dynamics of cadmium sulfide superclusters in zeolites. J. Phys. Chem. 1988, 92, 4988–4994. [Google Scholar] [CrossRef] [Scilit]
- Arora, S.; Manoharan, S.S. Large shift in the photoluminescent properties of Mn2+-doped nanosized CdS–ZnS solid solutions. Solid State Commun. 2007, 144, 319–323. [Google Scholar] [CrossRef] [Scilit]
- Pejjai, B.; Reddy, V.R.M.; Seku, K.; Kotte, T.R.R.; Park, C. Chemical bath deposition of Mn-doped ZnS thin films using greener complexing agents: Effect of Mn-doping on the optical properties. Optik 2017, 130, 608–618. [Google Scholar] [CrossRef] [Scilit]
- Kole, A.; Tiwary, C.; Kumbhakar, P. Room temperature synthesis of Mn2+ doped ZnS d-dots and observation of tunable dual emission: Effects of doping concentration, temperature, and ultraviolet light illumination. J. Appl. Phys. 2013, 113, 114308. [Google Scholar] [CrossRef] [Scilit]
- Hastir, A.; Sharma, S.; Singh, R.C. Structural, optical and dielectric properties of lead doped ZnS nanoparticles. Appl. Surf. Sci. 2016, 372, 57–62. [Google Scholar] [CrossRef] [Scilit]
- Xue, D.; Kitamura, K. Dielectric characterization of the defect concentration in lithium niobate single crystals. Solid State Commun. 2002, 122, 537–541. [Google Scholar] [CrossRef] [Scilit]
- Jesu Jebathew, A.; Karunakaran, M.; Ade, R.; Ponraj, J.S.; Ganesh, V.; Manavalan, R.K.; Bitla, Y.; Yahia, I.; Algarni, H. Highly sensitive hexagonal-shaped ZnS–Cu thin films for photo-detector applications. J. Mater. Sci. Mater. Electron. 2022, 33, 2192–2203. [Google Scholar] [CrossRef] [Scilit]
- Mondal, S.; Sudhu, S.; Bhattacharya, S.; Saha, S.K. Strain-induced tunable band gap and morphology-dependent photocurrent in RGO–CdS nanostructures. J. Phys. Chem. C 2015, 119, 27749–27758. [Google Scholar] [CrossRef] [Scilit]
- Devi, M.D.; Juliet, A.V.; Hariprasad, K.; Ganesh, V.; Ali, H.E.; Algarni, H.; Yahia, I. Improved UV Photodetection of Terbium-doped NiO thin films prepared by cost-effective nebulizer spray technique. Mater. Sci. Semicond. Process. 2021, 127, 105673. [Google Scholar] [CrossRef] [Scilit]
- Abdelmoneim, A.; Abdel-wahab, M.S.; Lee, J.K.; Abdul Hameed, M.M.; Thamer, B.M.; Al-Enizi, A.M.; Alkhalifah, R.I.; Tawfik, W.Z. High performance of nanostructured Cu2O-based photodetectors grown on a Ti/Mo metallic substrate. Catalysts 2023, 13, 1145. [Google Scholar] [CrossRef] [Scilit]
- Shkir, M.; Ashraf, I.; Khan, A.; Khan, M.T.; El-Toni, A.M.; AlFaify, S. A facile spray pyrolysis fabrication of Sm:CdS thin films for high-performance photodetector applications. Sens. Actuators A Phys. 2020, 306, 111952. [Google Scholar] [CrossRef] [Scilit]
- Hajimazdarani, M.; Ghasali, E.; Naderi, N.; Orooji, Y. Enhanced optical properties and photodetection behavior of ZnS thin film deposited by electron beam evaporation upon doping with europium oxide. Ceram. Int. 2020, 46, 28382–28389. [Google Scholar] [CrossRef] [Scilit]
- Ebrahimi, S.; Yarmand, B. Solvothermal growth of aligned SnxZn1-xS thin films for tunable and highly response self-powered UV detectors. J. Alloys Compd. 2020, 827, 154246. [Google Scholar] [CrossRef] [Scilit]
- Prasad, N.; Karthikeyan, B. Phase-dependent structural, optical, phonon and UV sensing properties of ZnS nanoparticles. Nanotechnology 2019, 30, 485702. [Google Scholar] [CrossRef] [Scilit]
- Kumar, A.; Kumar, M.; Bhatt, V.; Kim, D.; Mukherjee, S.; Yun, J.-H.; Choubey, R.K. ZnS microspheres-based photoconductor for UV light-sensing applications. Chem. Phys. Lett. 2021, 763, 138162. [Google Scholar] [CrossRef] [Scilit]
- Chang, Y.-Y.; Fan, M.-M.; Xu, X.-J.; Wang, Y.-D.; Cao, L. A fast-speed self-powered ZnS nanoparticles/α-Ga2O3 nanorod array/FTO UV photodetector based on a photoeletrochemical cell for outdoor UV detection. Chem. Phys. Lett. 2023, 832, 140879. [Google Scholar] [CrossRef] [Scilit]
- Kaplan, H.K. High-speed Cu-doped ZnS/n-Si heterojunction photodiode for enhanced UV detection. J. Alloys Compd. 2025, 1038, 182849. [Google Scholar] [CrossRef] [Scilit]
- Houadsi, H.; Benzitouni, S.; Zaabat, M.; Remache, L.; Mahdjoub, A. Effect of thiourea concentration on the structural, optical and photoelectric properties of ZnO/ZnS/PVC composite films used as flexible UV photodetectors. Appl. Phys. A 2024, 130, 820. [Google Scholar] [CrossRef] [Scilit]
- Balakarthikeyan, R.; Santhanam, A.; Vinoth, S.; Abdeltawab, A.A.; Mohammady, S.Z.; Ubaidullah, M.; Shaikh, S.F.; Samdani, M.S.; Manthrammel, M.A.; Shkir, M. Enhancing the optoelectronic properties of low-cost nebulizer spray pyrolysis (NSP) prepared ZnS thin film through praseodymium doping for photodetector applications. Mater. Sci. Eng. B 2023, 289, 116213. [Google Scholar] [CrossRef] [Scilit]

Disclaimer/Publisher’s Note: The statements, opinions and data contained in all publications are solely those of the individual author(s) and contributor(s) and not of MDPI and/or the editor(s). MDPI and/or the editor(s) disclaim responsibility for any injury to people or property resulting from any ideas, methods, instructions or products referred to in the content. |
© 2026 by the authors. Licensee MDPI, Basel, Switzerland. This article is an open access article distributed under the terms and conditions of the Creative Commons Attribution (CC BY) license.