


Abstract
The effects of brazing temperature and holding time on the interfacial evolution and shear strength of Cu/Zn-15Al/Al joints were investigated. Joints were prepared at 480–540 °C for 1–9 min and characterized by SEM, EDS, shear testing and response-surface analysis. At low thermal input, an Al4.2Cu3.2Zn0.7-rich structure formed on the Cu9Al4-based layer. With increasing thermal input, CuAl2 formed and progressively dominated the interface, leading to a decrease in shear strength. The highest strength among the nine original conditions was 63 MPa at 510 °C for 1 min. The response-surface model predicted 488.3 °C and 1.0 min, with a predicted strength of 62.2 MPa. An independent joint prepared under this condition reached 65.4 MPa, giving a prediction error of 5.1%. The validation joint contained a 12 ± 2 μm reaction layer and a dense Al4.2Cu3.2Zn0.7-rich structure with limited coarse CuAl2 formation.
1. Introduction
Zn-Al filler metals are attractive for joining copper and aluminum because of their relatively low melting temperature, good wettability and favorable compatibility with dissimilar substrates. Cu/Al brazed joints are of interest in heat exchangers, electrical components and other lightweight conductive structures, where the high conductivity of Cu can be combined with the low density of Al. However, the Cu/Al interface is highly reactive during brazing. The molten filler can dissolve the Cu and Al substrates, while the subsequent interdiffusion of Cu, Al and Zn promotes the formation of interfacial intermetallic compounds (IMCs). The composition, morphology and continuity of these reaction products strongly affect the load-bearing capability and fracture behavior of the joint [1,2,3,4,5]. More broadly, nanoscale structure–property studies have shown that mechanically induced structural and morphological transformations can modify the resulting mechanical response, highlighting the importance of relating evolving morphology to material performance [6]. This perspective also motivates the present evaluation of interfacial phase evolution together with joint strength.
The Cu-side interface is particularly important in Zn-Al-brazed Cu/Al joints. Previous studies have reported the formation of Cu-Zn, Cu-Al and Cu-Al-Zn compounds at the interface, including CuAl2, Cu9Al4 and Al4.2Cu3.2Zn0.7 [1,2,7,8,9]. The interfacial phase constitution is affected not only by the nominal composition of the filler metal, but also by the brazing temperature, holding time, cooling condition and substrate dissolution behavior. A relatively thin and continuous reaction layer can provide effective metallurgical bonding, whereas excessive growth of Cu-Al-rich compounds may increase interfacial brittleness and provide preferential paths for crack propagation [1,2,7]. Studies on Zn-Al-based filler metals have further shown that alloying additions can modify wetting behavior, elemental redistribution, interfacial phase formation and the mechanical reliability of Cu/Al joints [3,4,10,11,12,13,14]. These results indicate that the mechanical response of the joint is determined by the combined effects of interfacial phase constitution, reaction-layer morphology and local substrate dissolution rather than by the nominal filler composition alone.
The role of interfacial phase constitution is also evident during the subsequent thermal exposure of Zn-Al-brazed Cu/Al joints. Previous studies have shown that Ga addition to Zn-15Al filler metals modifies the wetting behavior and initial Cu-side interfacial structure, promoting the formation of CuAl2 within the Cu9Al4/Al4.2Cu3.2Zn0.7-based reaction layer [15]. During thermal aging, the outer CuAl2-containing region of the Ga-modified interface undergoes reconstruction into an Al-Cu-Zn-rich lamellar structure, which acts as a diffusion barrier and changes the fracture behavior of the joint [16]. Ti addition to Zn-22Al filler metals has also been reported to refine the microstructure and reduce the thickness of the interfacial intermetallic compound layer, thereby improving the shear strength of Cu/Al brazed joints [11]. These results suggest that the phase constitution and morphology established during the initial brazing process are important for the subsequent stability and failure behavior of the joint.
However, the influence of the initial brazing thermal cycle on Zn-15Al/Cu-Al joints remains insufficiently clarified. In particular, the relationships among brazing temperature, holding time, Al-side substrate dissolution, Cu-side reaction-layer thickness, CuAl2-dominated regions and joint strength have not been systematically established. Increasing the thermal input may improve wetting and metallurgical bonding, but it may also intensify substrate dissolution and promote the growth or transformation of Cu-Al-rich interfacial phases. Therefore, the interfacial layer should not be evaluated only by its total thickness; its phase constitution, morphology, continuity and associated fracture behavior must also be considered.
In this study, Cu/Al joints were fabricated using Zn-15Al filler metal in a muffle furnace under different brazing temperatures and holding times. The interfacial morphology of nine brazing conditions was examined, and representative interfaces were further characterized by high-magnification scanning electron microscopy and energy-dispersive X-ray spectroscopy. The shear stress–strain response and fracture morphology were analyzed to establish the relationship between the brazing thermal cycle, interfacial phase evolution and mechanical failure. The results provide a systematic understanding of the initial interfacial evolution of Zn-15Al-brazed Cu/Al joints.
2. Materials and Methods
2.1. Materials and Brazing Procedure
Zn-15Al brazing filler metal was prepared in the laboratory using Zn and Al powders with a purity of 99.9%. The raw materials were melted in a high-frequency induction furnace under continuous water cooling. A small amount of CsAlF4 flux was added during melting to reduce oxidation and facilitate the removal of impurities. The alloy was remelted three times to improve compositional uniformity and then cast into thin sheets for brazing. The nominal composition of the filler metal was Zn-15Al.
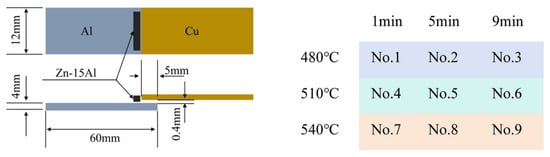
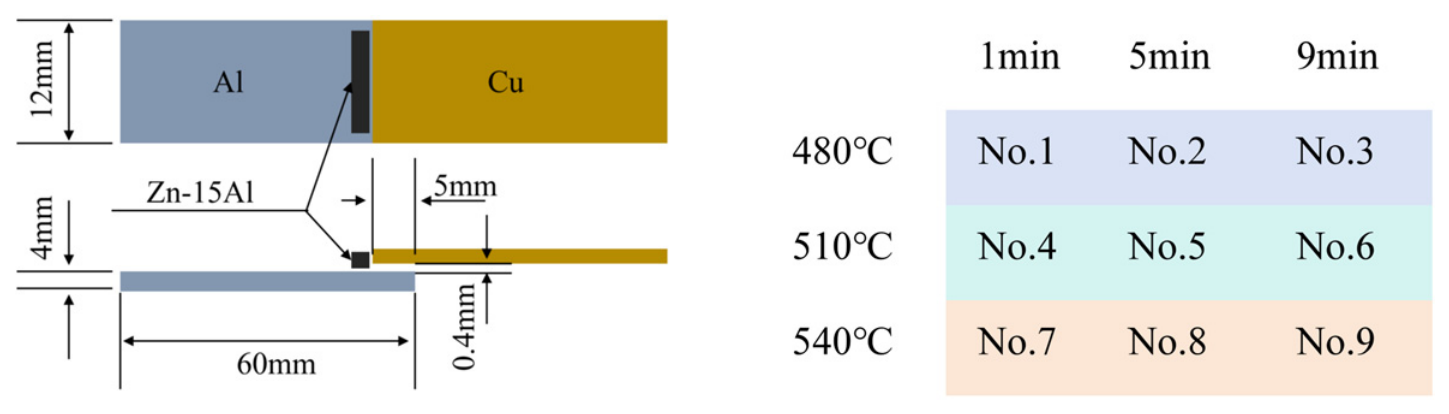
T2 Cu and 1060 Al sheets were used as the base materials. Their dimensions and the joint configuration are shown in Figure 1. Five joint specimens were prepared for each temperature–holding-time combination. The Cu and Al sheets had thicknesses of 2 and 4 mm, respectively. The Al sheet was 60 mm long, and the overlap length was 5 mm. A nominal brazing gap of 0.4 mm was maintained between the Cu and Al sheets.
Figure 1.
Schematic diagram of the brazed joint and experimental conditions.
Before brazing, the surfaces of the Cu and Al sheets were mechanically polished, degreased with anhydrous ethanol, and dried in air. CsAlF4 flux was then applied to the joining surfaces to remove surface oxides and promote wetting of the molten Zn-15Al filler metal. The specimens were assembled according to the configuration shown in Figure 1 and placed in a muffle furnace under an air atmosphere. The furnace was heated at a rate of 1 °C min−1.
The brazing temperature and holding-time ranges were selected based on the thermal behavior of the Zn-15Al filler metal, previous Zn-Al-based Cu/Al brazing studies [1,2,5,7,9], and our previous Zn-15Al-based work conducted at 500 °C for 5 min [15]. The DSC results showed a principal melting peak at approximately 458.4 °C. Therefore, 480 °C was selected as the lower temperature to ensure complete melting and wetting of the filler metal, whereas 510 and 540 °C represented progressively higher thermal inputs. The holding times of 1, 5, and 9 min were selected to distinguish short-time wetting, intermediate interfacial reaction, and prolonged reaction-layer growth, respectively. This temperature–time window was intended to cover the transition from sufficient metallurgical bonding to excessive substrate dissolution and interfacial compound growth.
Brazing was performed using all nine temperature–time combinations of 480, 510, and 540 °C and 1, 5, and 9 min. The samples were numbered No. 1–No. 9 according to the temperature–holding-time matrix shown in Figure 1. After brazing, the specimens were cooled in air to room temperature.
2.2. Characterization and Mechanical Testing
The microstructure of the as-prepared Zn-15Al filler metal was examined using scanning electron microscopy (SEM; ZEISS EVO 18, Oberkochen, Germany). The thermal behavior of the filler metal was analyzed by differential scanning calorimetry (DSC; NETZSCH DSC 404 F3, Selb, Germany) over the temperature range of 0–525 °C at a heating rate of 1 °C/min. The phase transformation characteristics of the filler metal were evaluated from the DSC heating curve.
The brazed joints were sectioned perpendicular to the longitudinal direction, mounted, ground and polished using standard metallographic procedures. The cross-sectional microstructures were examined by SEM equipped with an energy-dispersive X-ray spectrometer (EDS; Oxford Instruments X-Max 80, Oxford, UK). EDS point analyses, line scans and elemental mappings were used to characterize the elemental distribution and the phase constitution of the interfacial reaction layer.
The thickness of the total interfacial reaction layer was measured from cross-sectional SEM images using ImageJ software (Version: 1.54q). Three regions were measured for each brazing condition, and the mean and standard deviation were calculated. Because the phase constitution varied with the brazing temperature and holding time, the measured thickness represents the total interfacial reaction region rather than a single phase.
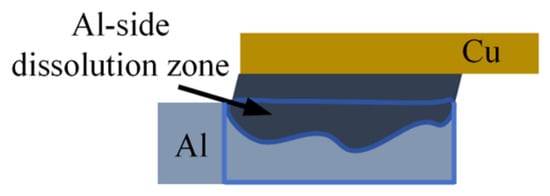
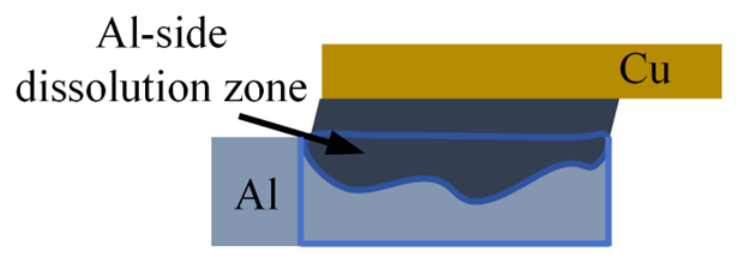
The apparent Al-side dissolution ratio was evaluated from the cross-sectional images according to the area method illustrated in Figure 2:
where Adiss is the projected area of the Al-side dissolution zone and AAl,total is the total analyzed cross-sectional area of the Al side. The calculated value is referred to as the apparent Al-side dissolution ratio because it represents the two-dimensional cross-sectional area loss observed in the metallographic section. Five regions were analyzed for each condition using ImageJ, and the results are presented as the mean ± standard deviation.
Figure 2.
Schematic diagram of the Al-side dissolution ratio.
The area fraction of the CuAl2-dominated region within the interfacial reaction layer was also determined by ImageJ. The CuAl2 area fraction was calculated as:
where is the area occupied by the CuAl2-dominated region and Areaction is the total area of the interfacial reaction layer. When no distinguishable CuAl2-dominated region was observed, the corresponding area fraction was assigned a value of zero. Five regions were evaluated for each condition.
The mechanical properties of the brazed joints were measured using a universal testing machine (Instron 5982, Norwood, MA, USA) at room temperature and a crosshead speed of 1 mm min−1. Five specimens were tested for each brazing condition. The joint strength was calculated from the maximum load and the nominal overlap area. The average strength and standard deviation were used for statistical comparison among the nine brazing conditions.
After mechanical testing, the fracture surfaces were cleaned with ethanol and examined by SEM. The fracture morphology was analyzed to identify the dominant failure characteristics, including interfacial separation, cleavage-like fracture, tearing features and fracture through the interfacial reaction layer. The relationship between the fracture morphology, interfacial reaction-layer thickness, Al-side dissolution and joint strength was then established.
3. Results and Discussion
3.1. Microstructure and Melting Behavior of the Zn-15Al Filler Metal
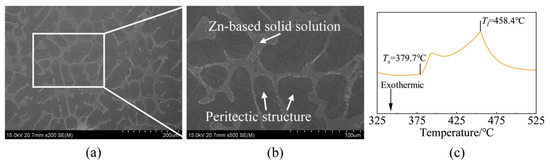
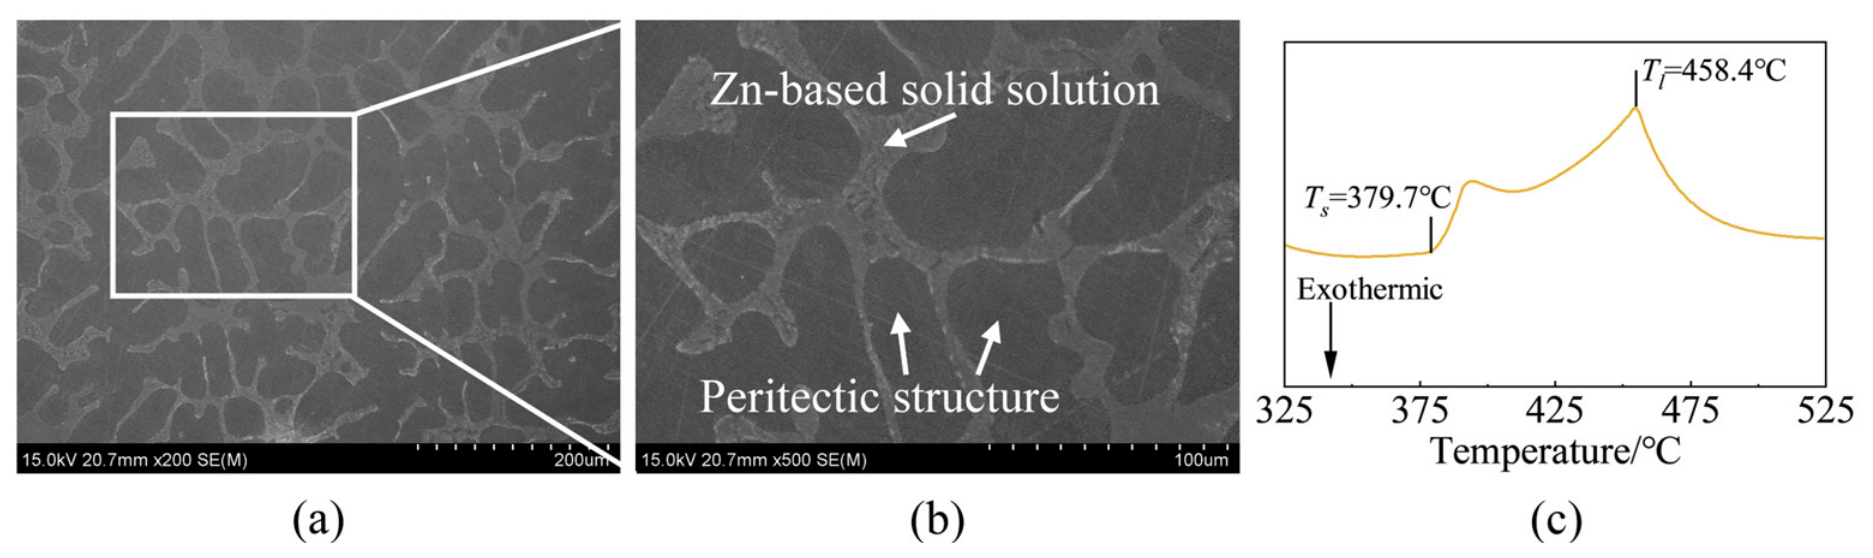
Figure 3a,b shows the microstructure of the Zn-15Al filler metal at different magnifications. Dark dendritic regions are surrounded by a relatively bright interdendritic network. This morphology is consistent with the solidification behavior of hypereutectic Zn-Al alloys, in which an Al-rich phase forms first, followed by solidification of the remaining liquid in the interdendritic regions. During subsequent cooling, the high-temperature solid solution undergoes eutectoid decomposition into Al-rich and Zn-rich phases. The dendritic outlines can therefore remain visible even though their internal phase constitution changes during cooling [17].
Figure 3.
SEM micrographs (a,b) and DSC heating curve (c) of the Zn-15Al filler metal.
The DSC heating curve in Figure 3c shows a melting onset at approximately 379.7 °C, followed by a broad endothermic response with a principal peak at 458.4 °C. The lower-temperature feature is consistent with the melting of the eutectic constituent, whereas the higher-temperature response can be associated with the progressive melting of the remaining Al-rich constituent. This interpretation is consistent with the eutectic and primary-phase constituents expected in hypereutectic Zn-Al alloys [17]. The value of 458.4 °C is reported here as the melting peak temperature, Tl, rather than a definitively measured liquidus temperature. Determining the liquidus from a DSC peak requires a justified evaluation procedure that accounts for the measurement conditions [18]. All three brazing temperatures used in this study, 480, 510 and 540 °C, were above this principal melting peak.
3.2. Macroscopic Appearance and Interfacial Reaction-Layer Structure
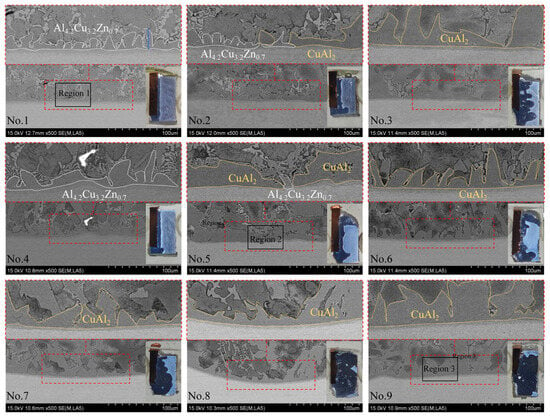
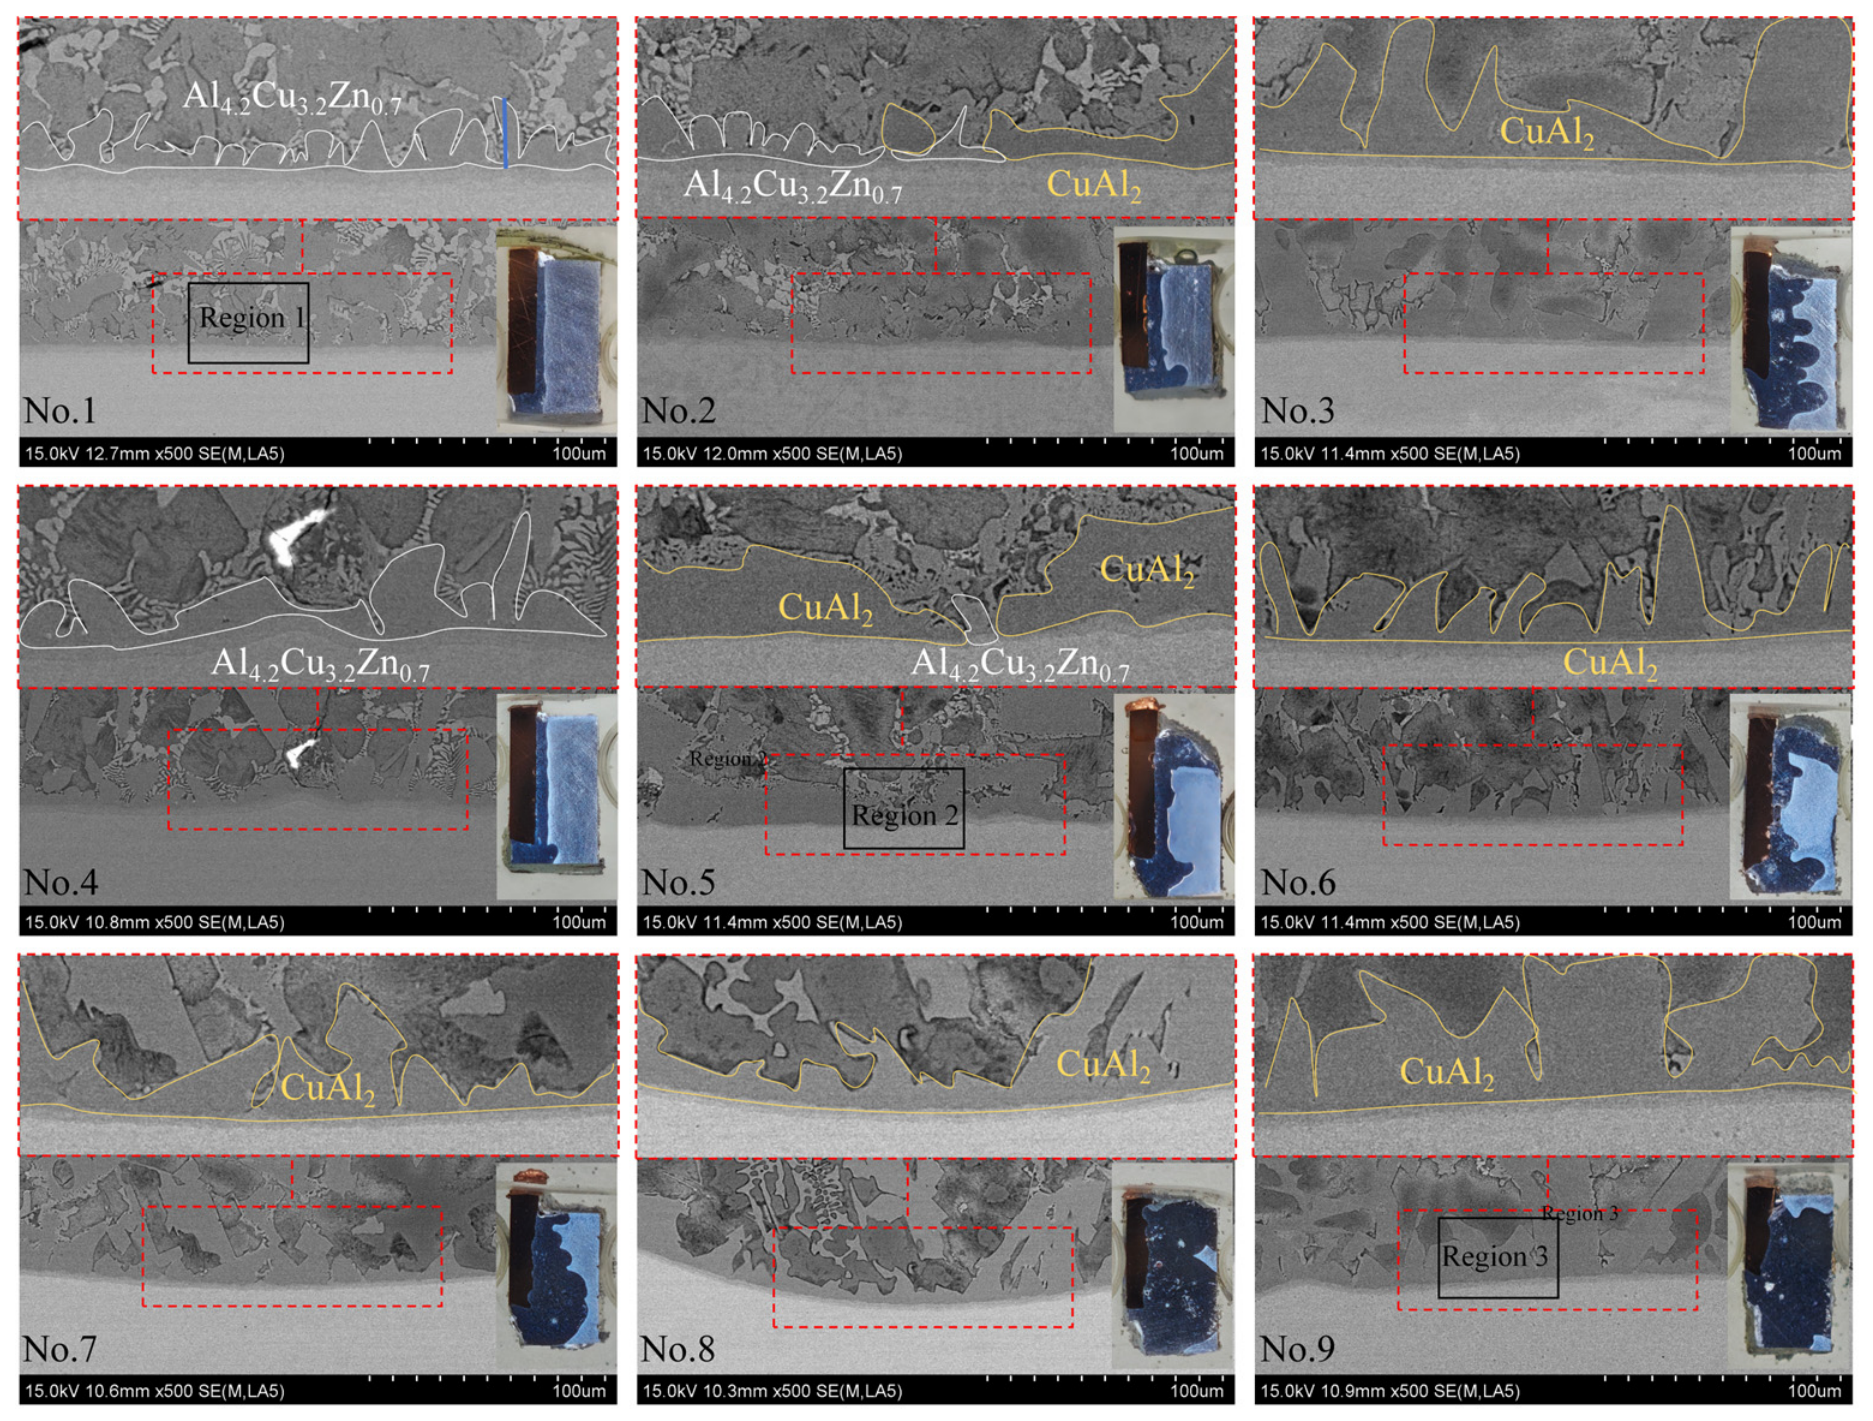
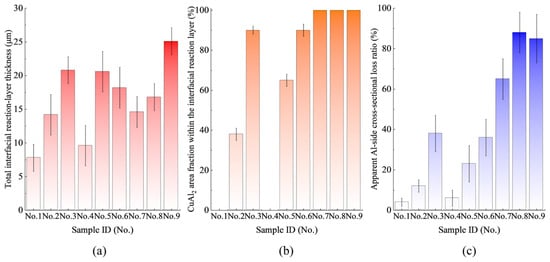
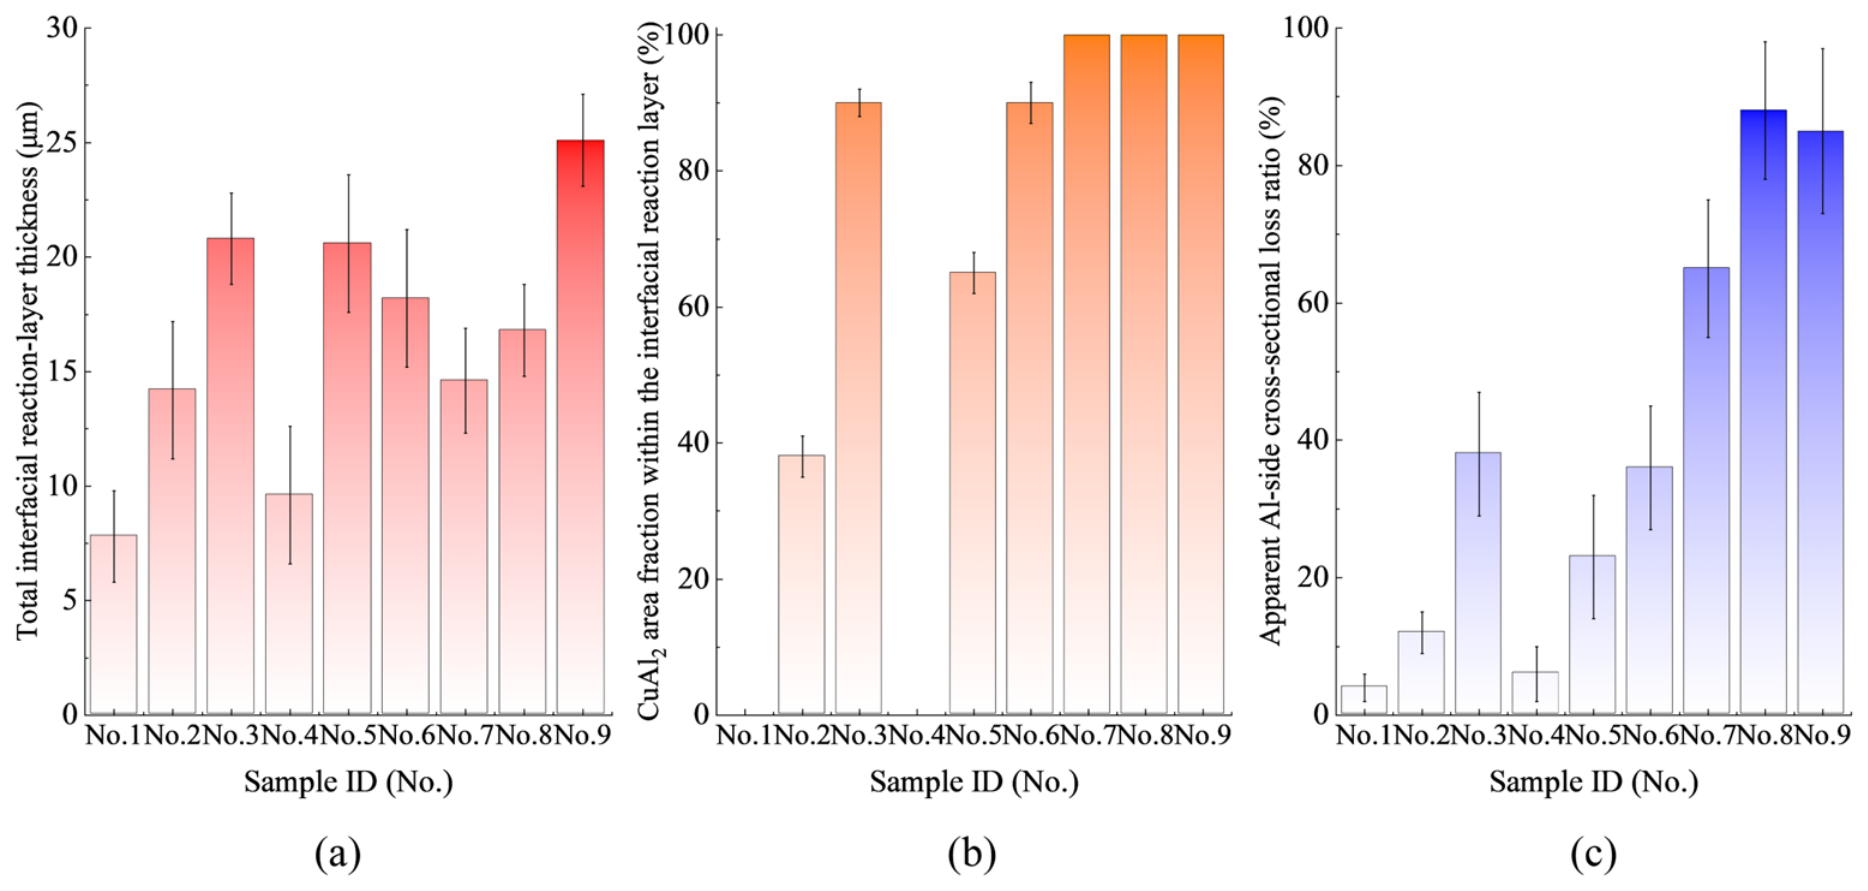
Figure 4 shows the cross-sectional morphologies of the Cu/Zn-15Al/Al brazed joints prepared under the nine brazing conditions, while Figure 5 summarizes the corresponding quantitative results. All samples formed continuous brazed joints. However, both the thickness and phase constitution of the interfacial reaction layer changed markedly with the brazing temperature and holding time.
Figure 4.
Cross-sectional SEM images of the Cu/Zn-15Al/Al brazed joints under different brazing conditions.
Figure 5.
Statistical results for the interfacial characteristics of the Cu/Zn-15Al/Al brazed joints: (a) Total interfacial reaction-layer thickness; (b) CuAl2 area fraction within the interfacial reaction layer; (c) Apparent Al-side dissolution ratio.
At 480 °C, the No. 1 joint, held for 1 min, contained a relatively thin interfacial layer composed entirely of Al4.2Cu3.2Zn0.7. No CuAl2-dominated region was observed under this condition. When the holding time was increased to 5 min, as in No. 2, CuAl2 began to appear within the interfacial reaction layer, together with the remaining Al4.2Cu3.2Zn0.7 phase. After 9 min, the No. 3 joint exhibited a much thicker CuAl2 layer, indicating that prolonged heating promoted the transformation from the Al4.2Cu3.2Zn0.7-dominated structure to a CuAl2-dominated structure.
A similar evolution was observed at 510 °C. The No. 4 joint, produced with a 1 min holding time, consisted mainly of a continuous Al4.2Cu3.2Zn0.7 layer. With increasing holding time to 5 min, CuAl2 appeared in No. 5 and coexisted with Al4.2Cu3.2Zn0.7. After 9 min, the No. 6 joint was characterized by a thick CuAl2-dominated layer. Compared with the 480 °C condition, the reaction layer developed more rapidly at 510 °C, reflecting the enhanced interfacial reaction and elemental diffusion at the higher temperature.
The phase evolution became more pronounced at 540 °C. The interfacial reaction layers of No. 7–No. 9 were mainly composed of CuAl2, and the CuAl2 region occupied nearly the entire analyzed interfacial layer. Among these samples, No. 9 exhibited the thickest and most irregular reaction layer. This morphology suggests that the combined effect of high temperature and prolonged holding time strongly promoted CuAl2 formation and layer coarsening.
The quantitative results in Figure 5a,b support the microstructural observations. The total interfacial reaction-layer thickness increased overall with increasing thermal input, although local fluctuations were observed among individual samples. More importantly, the CuAl2 area fraction increased with holding time at both 480 and 510 °C. It was approximately zero for No. 1 and No. 4, increased in No. 2 and No. 5 because of the coexistence of CuAl2 and Al4.2Cu3.2Zn0.7, and reached a high level in No. 3 and No. 6 owing to the formation of thick CuAl2 layers. At 540 °C, CuAl2 dominated the interfacial reaction layer under all three holding times.
The two interfacial regions have different effects on joint reliability. Previous work combining SEM-EDS, XRD and HAADF-STEM analysis reported that the Al4.2Cu3.2Zn0.7-rich region contained approximately 57.25–58.13 at.% Al, 33.18–34.30 at.% Cu and 8.45–8.69 at.% Zn, whereas the CuAl2-rich region contained approximately 63.11–66.58 at.% Al, 33.18–34.44 at.% Cu and 0.21–2.45 at.% Zn [1]. These compositional ranges provide reference values for interpreting the EDS results in the present study. Because the reaction layer is thin and locally multiphase, the interfacial regions are described as Al4.2Cu3.2Zn0.7-rich or CuAl2-rich regions rather than as strict single-phase crystallographic domains. The increase in CuAl2 fraction, reaction-layer thickness and phase continuity is therefore considered together when discussing the reduction in joint strength.
The apparent Al-side dissolution ratio also increased overall under the higher thermal-input conditions, as shown in Figure 5c. The enhanced dissolution of Al supplied additional Al to the molten filler-metal region and changed the local composition near the interface. This compositional change promoted the growth of the interfacial reaction layer and favored the formation of the CuAl2-dominated structure during prolonged heating. Thus, the evolution from Al4.2Cu3.2Zn0.7 to CuAl2 was associated with both the duration of interfacial reaction and the dissolution of the Al substrate.
Overall, the interfacial evolution followed a temperature-time-dependent sequence derived from the comparative SEM/EDS observations and the measured CuAl2 area fraction:
Al4.2Cu3.2Zn0.7 → Al4.2Cu3.2Zn0.7 + CuAl2 → CuAl2
The first stage represents the formation of a relatively favorable Al4.2Cu3.2Zn0.7 layer at short holding times. The second stage corresponds to the gradual appearance of CuAl2. At longer holding times or higher temperatures, the interface evolved into a thick CuAl2-dominated layer, which is expected to increase the susceptibility of the joint to brittle interfacial failure.
3.3. High-Magnification Characterization and Elemental Redistribution at Representative Interfaces
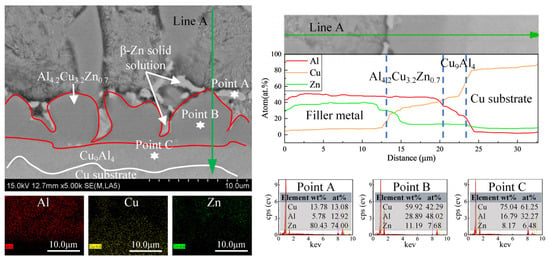
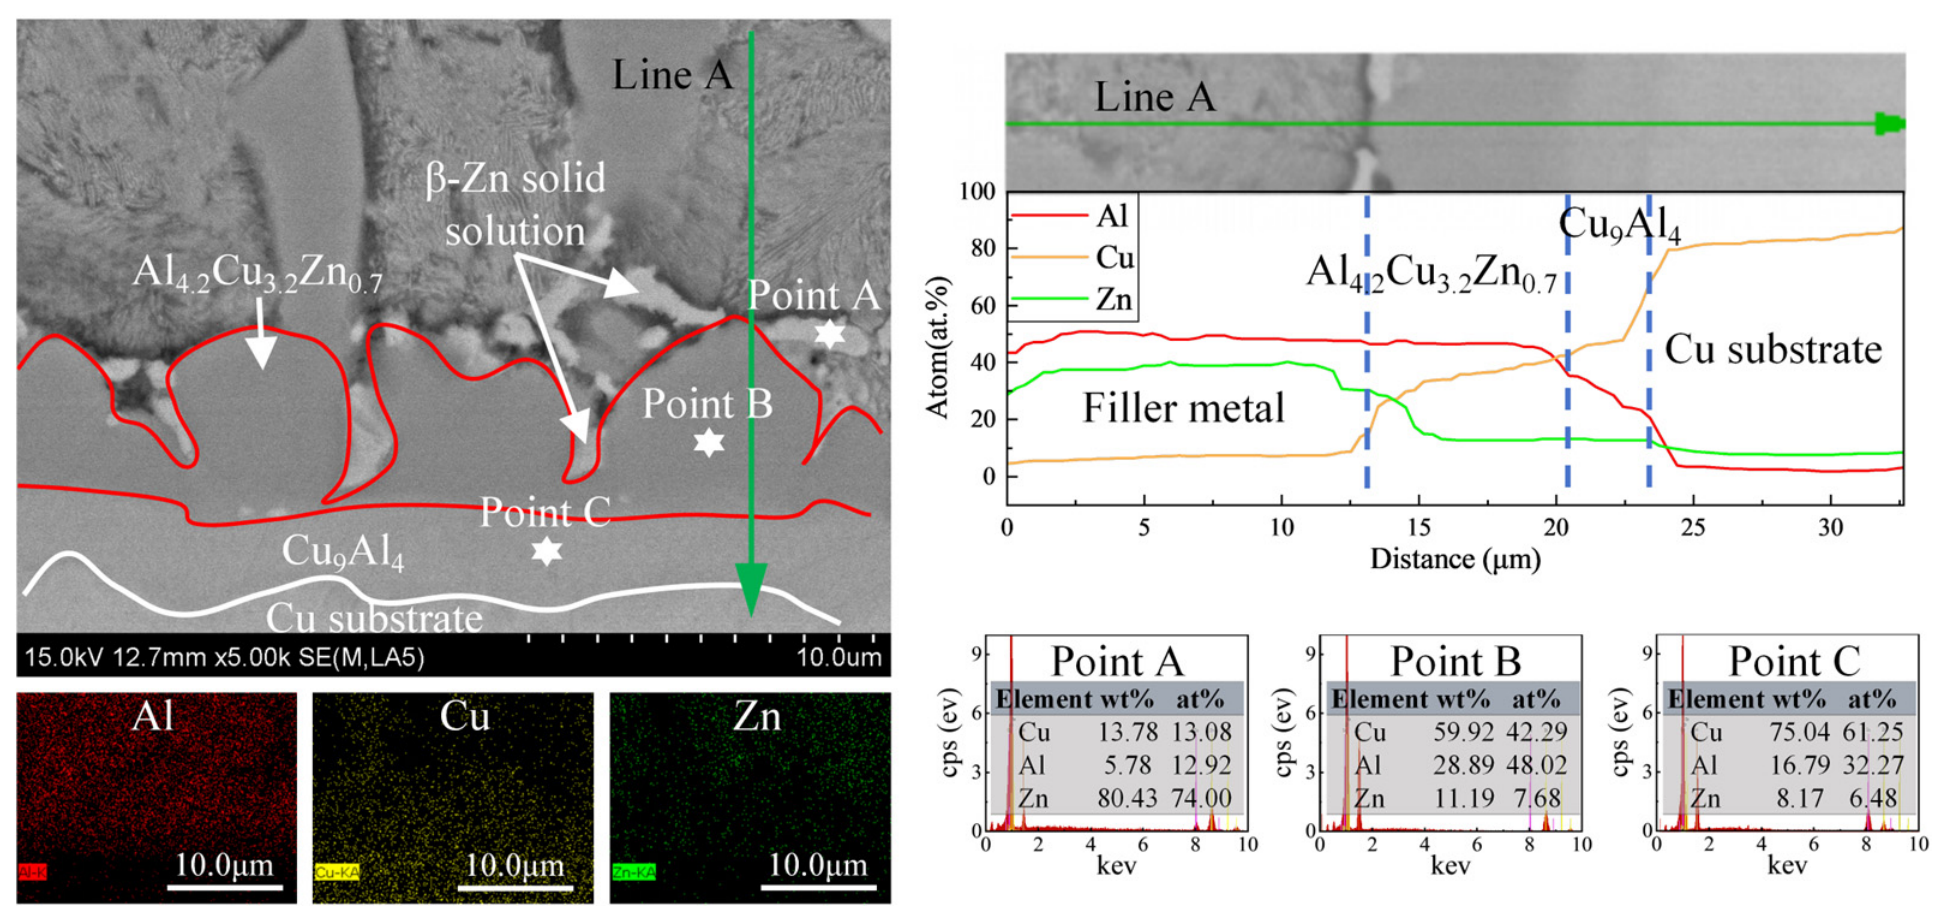
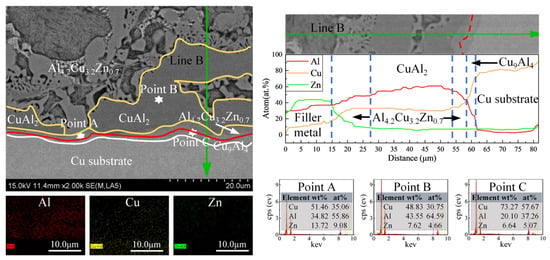
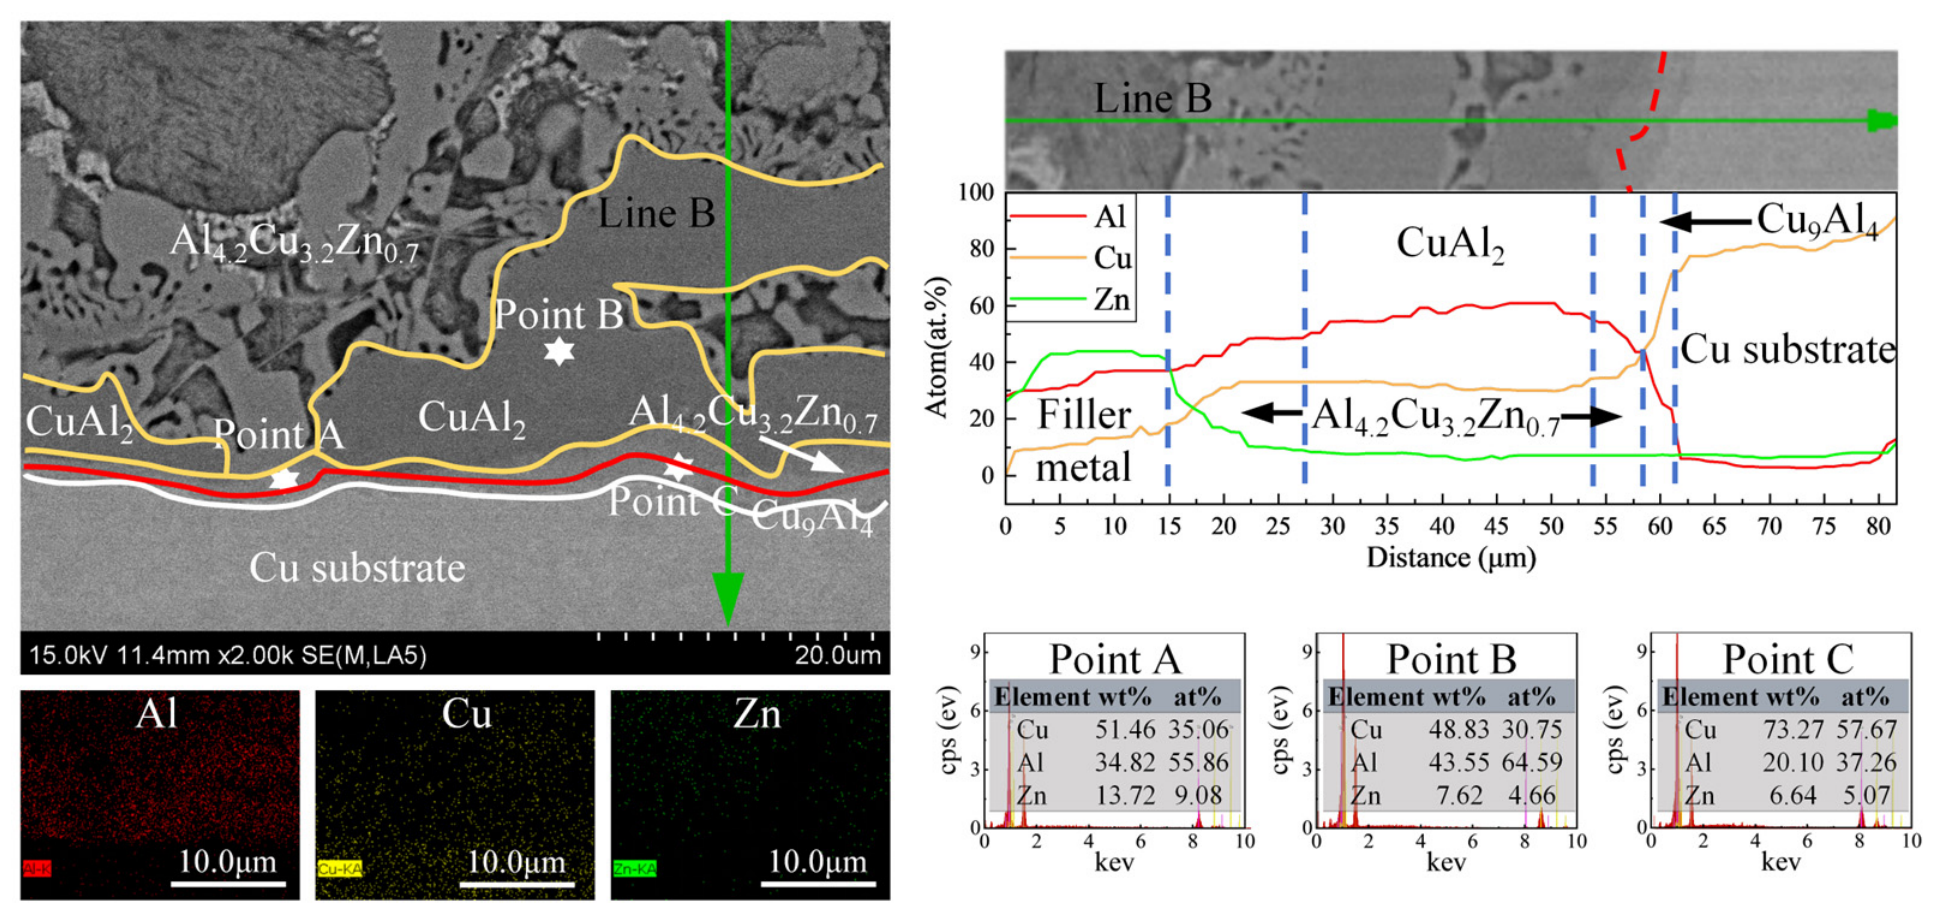
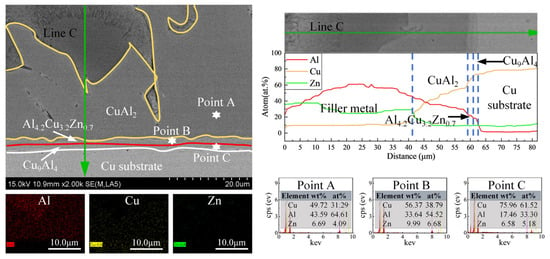
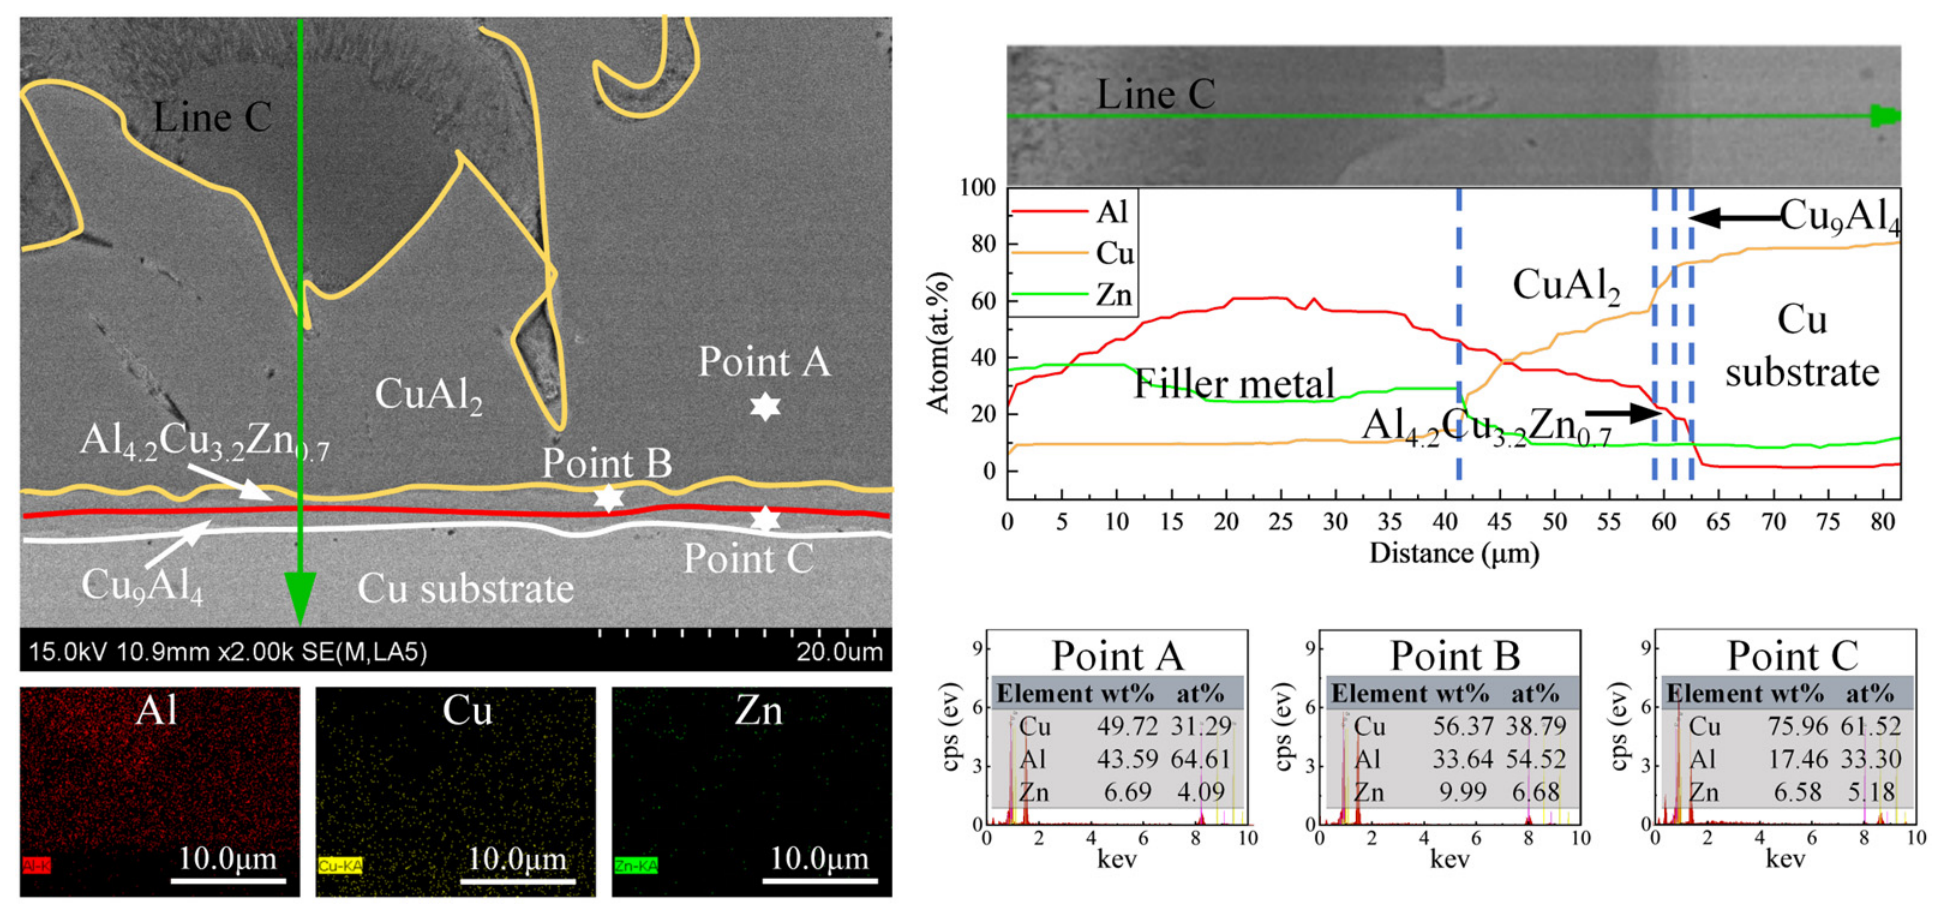
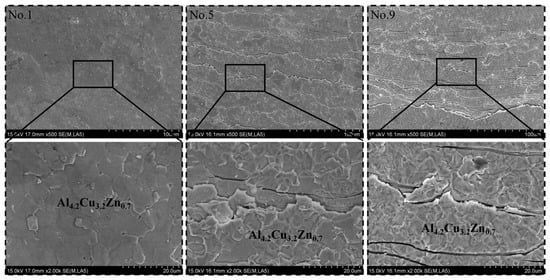
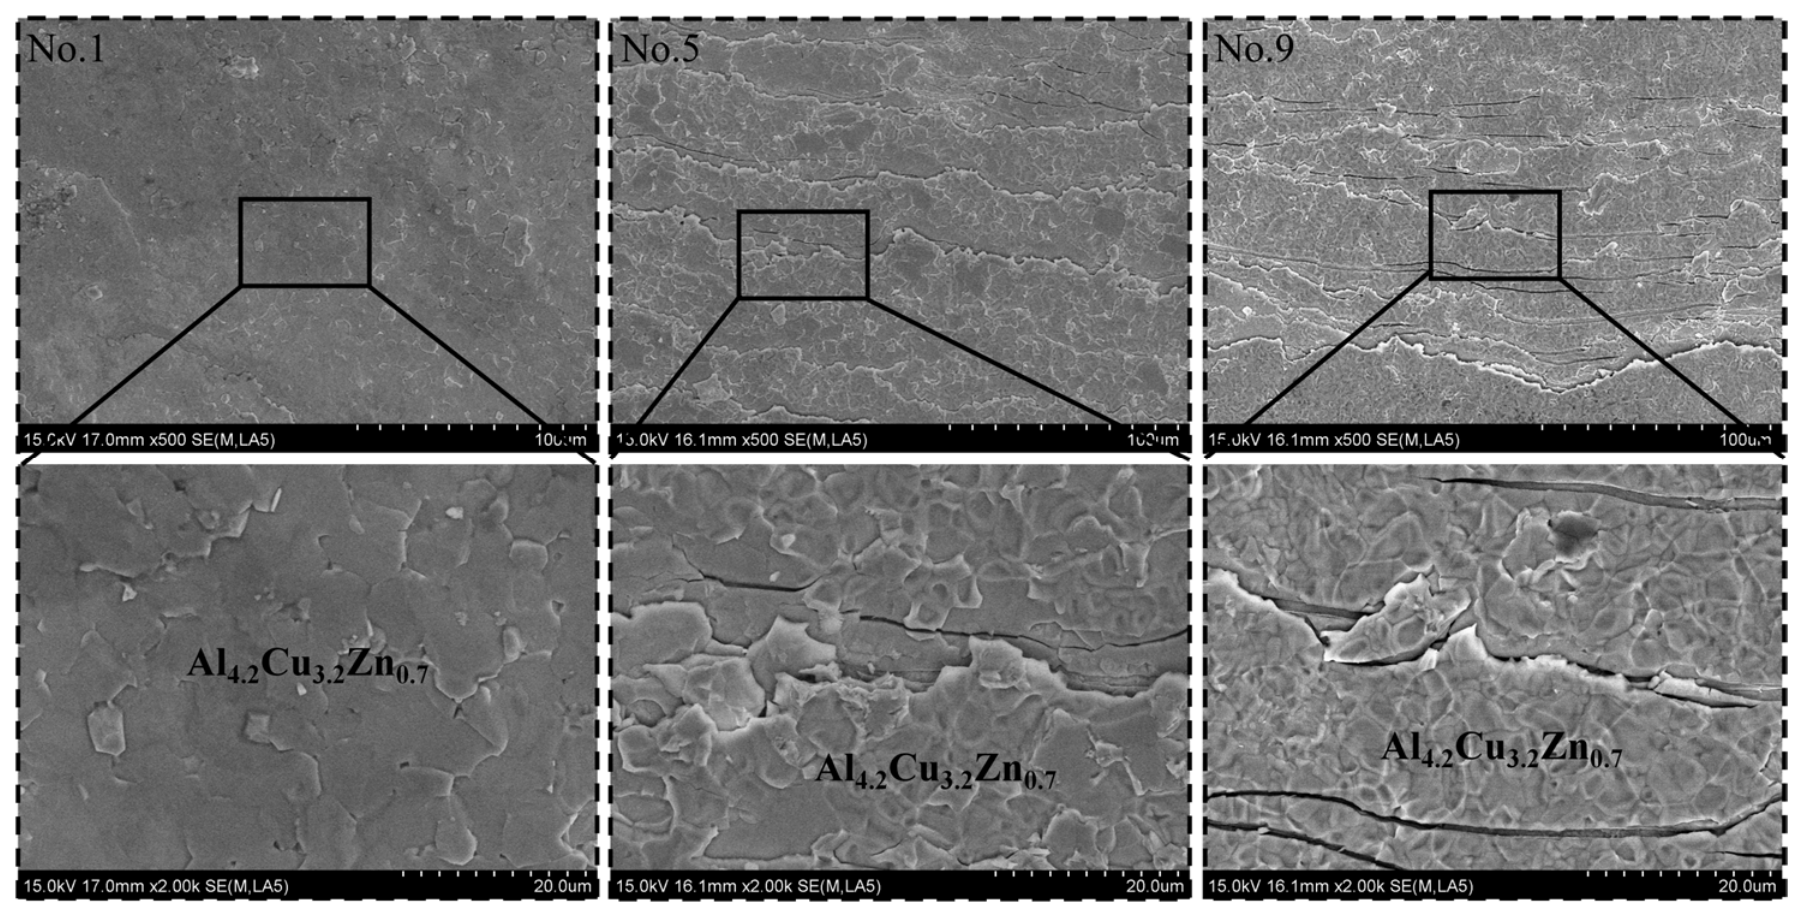
The phase assignments below were based on the interfacial morphology, EDS composition and comparison with previously reported Cu/Al brazed-joint interfaces [1]. Since the reaction layers were thin and locally multiphase, the identified compositions are interpreted as phase-rich or compositionally consistent regions. To further clarify the phase constitution and elemental redistribution within the interfacial reaction layer, high-magnification SEM observations and EDS analyses were performed on three representative regions selected from No. 1, No. 5, and No. 9 joints. These samples correspond to the low-, intermediate-, and high-thermal-input conditions, respectively. The selected areas are marked as Region 1, Region 2, and Region 3 in Figure 4, while the corresponding detailed SEM images, elemental mappings, point analyses, and line-scan results are presented in Figure 6, Figure 7 and Figure 8.
Figure 6.
High-magnification SEM image, EDS elemental mappings, line-scan profile along Line A, and point analyses of Region 1 in the No. 1 Cu/Zn-15Al/Al brazed joint of Figure 4.
Figure 7.
High-magnification SEM image, EDS elemental mappings, line-scan profile along Line B, and point analyses of Region 2 in the No. 5 Cu/Zn-15Al/Al brazed joint of Figure 4.
Figure 8.
High-magnification SEM image, EDS elemental mappings, line-scan profile along Line C, and point analyses of Region 3 in the No. 9 Cu/Zn-15Al/Al brazed joint of Figure 4.
For the No. 1 joint, the high-magnification SEM image in Figure 6 shows a relatively thin and continuous interfacial reaction layer between the filler metal and the Cu substrate. The layer adjacent to the filler metal is mainly identified as an Al4.2Cu3.2Zn0.7-rich region, whereas a Cu9Al4 layer is present toward the Cu substrate. The EDS line scan along Line A shows a clear compositional transition from the Zn-rich filler metal to the interfacial reaction layer and then to the Cu substrate. In the filler-metal region, Zn is the dominant element, while Cu and Al remain at relatively low concentrations. Upon entering the interfacial layer, the Cu and Al contents increase, whereas the Zn content decreases. This compositional transition indicates that Cu and Al diffused or dissolved from the substrate into the molten filler during brazing, followed by interfacial reaction and compound formation. The relatively limited thickness of the reaction layer suggests that the interfacial reaction was not excessively developed under the low-temperature/short-time condition.
The point analyses further support the compositional distinction between the different regions. Point A, located in the filler-metal-side region, is characterized by a high Zn content together with lower Cu and Al contents. Point B, located within the intermediate reaction region, contains substantially higher Cu and Al concentrations and a reduced Zn content, consistent with an Al-Cu-Zn intermetallic region. Point C, located near the Cu substrate, is dominated by Cu and Al and contains only a small amount of Zn, which is consistent with the formation of a Cu-rich interfacial phase such as Cu9Al4. The elemental maps also show that Al and Cu are concentrated within the reaction layer, whereas Zn is mainly distributed in the filler metal and is relatively depleted in the Cu-rich interfacial region.
A more complex interfacial structure is observed in the No. 5 joint, as shown in Figure 7. Compared with No. 1, the reaction layer is significantly thicker and contains multiple contrast regions. The high-magnification image and Line B profile indicate the coexistence of CuAl2, Al4.2Cu3.2Zn0.7, and Cu9Al4 across the interface. The CuAl2 region occupies a substantial portion of the reaction layer, while the Al4.2Cu3.2Zn0.7 phase is retained in the region closer to the filler metal. This distribution suggests that increasing the thermal input promotes a transition from the initially formed Al-Cu-Zn-rich reaction layer toward a Cu-Al-rich intermetallic structure.
The EDS line scan in Figure 7 shows that the filler-metal region contains relatively high Zn and Al contents and a lower Cu content. Across the reaction layer, the Cu and Al signals increase, whereas the Zn signal decreases markedly. In the CuAl2-dominated region, the Al concentration remains high and the Cu concentration is also substantial, while Zn is strongly depleted. This Zn depletion is consistent with the limited solubility of Zn in Cu-Al intermetallic phases and indicates a Zn-exclusion effect during the growth of the CuAl2 layer. Toward the Cu substrate, the Cu concentration increases sharply and the Al and Zn contents decrease, confirming the formation of a Cu-rich transition region. The point analyses at Points A-C are consistent with the line-scan profile and distinguish the filler-metal-side Al-Cu-Zn-rich region, the CuAl2-containing reaction layer, and the Cu-rich substrate-side region.
The No. 9 joint exhibits the most developed reaction layer, as shown in Figure 8. The interface contains a thick CuAl2-dominated region, accompanied by a thinner Al4.2Cu3.2Zn0.7-containing region near the filler metal and a Cu9Al4-rich layer adjacent to the Cu substrate. Compared with No. 1 and No. 5, the CuAl2 region in No. 9 is more continuous and occupies a larger fraction of the interfacial layer. The line-scan results along Line C show a broad region with high Al and Cu contents and a relatively low Zn content between the filler metal and the Cu substrate. This profile confirms that the prolonged high-temperature exposure enhanced the dissolution of the Cu substrate, the diffusion of Al and Cu, and the growth of Cu-Al-rich intermetallic compounds.
The point analysis results provide additional evidence for the compositional evolution across the No. 9 interface. Point A, located within the CuAl2-dominated region, contained 64.61 at.% Al, 31.29 at.% Cu and 4.09 at.% Zn. Point B, located in the thin Al4.2Cu3.2Zn0.7 interlayer, contained 54.52 at.% Al, 38.79 at.% Cu and 6.68 at.% Zn. Point C was associated with the Cu-rich substrate-side region. The elemental maps show that Cu and Al are concentrated in the reaction layer, whereas Zn is mainly retained in the filler-metal region and is depleted from the CuAl2-rich layer.
The comparison of Figure 6, Figure 7 and Figure 8 reveals a clear thermal-input-dependent evolution of the Cu-side interface. Under the low thermal input of No. 1, the interface is relatively thin and is mainly composed of an Al4.2Cu3.2Zn0.7-rich region and a Cu9Al4 transition layer. At the intermediate condition of No. 5, CuAl2 begins to occupy a substantial part of the reaction layer, while the Al4.2Cu3.2Zn0.7 phase remains near the filler-metal side. Under the high thermal input of No. 9, the interfacial layer becomes thicker and more CuAl2-dominated, with a corresponding reduction in the relative proportion of the Al-Cu-Zn-rich region.
This evolution can be attributed to the coupled effects of substrate dissolution and interfacial diffusion. Increasing the brazing temperature and holding time accelerates the dissolution of Cu into the molten Zn-Al filler and enhances the transport of Al and Cu toward the reaction front. As the local supply of Cu and Al increases, the interfacial composition gradually shifts from a Zn-containing Al-Cu-Zn-rich state toward a Cu-Al-rich state. The resulting growth of CuAl2 and Cu9Al4 consumes Cu and Al while excluding Zn from the reaction layer. Therefore, the observed decrease in Zn concentration within the interfacial layer should not be interpreted simply as a loss of Zn from the joint; rather, it reflects the combined effects of Zn exclusion from Cu-Al intermetallic compounds and dilution of the filler-metal composition by dissolved Cu and Al.
The high-magnification and EDS results therefore provide direct compositional evidence for the phase evolution proposed from the lower-magnification observations. The transition from an Al4.2Cu3.2Zn0.7-rich layer to a CuAl2-dominated reaction layer explains why excessive thermal input increases the thickness and brittleness of the interface. This interfacial evolution is expected to influence crack initiation and propagation during subsequent mechanical loading and provides the microstructural basis for interpreting the mechanical reliability of the Zn-15Al-brazed Cu/Al joints.
3.4. Shear Strength and Fracture Characteristics
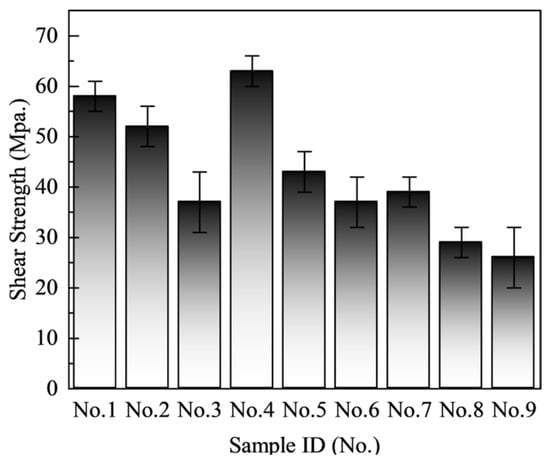
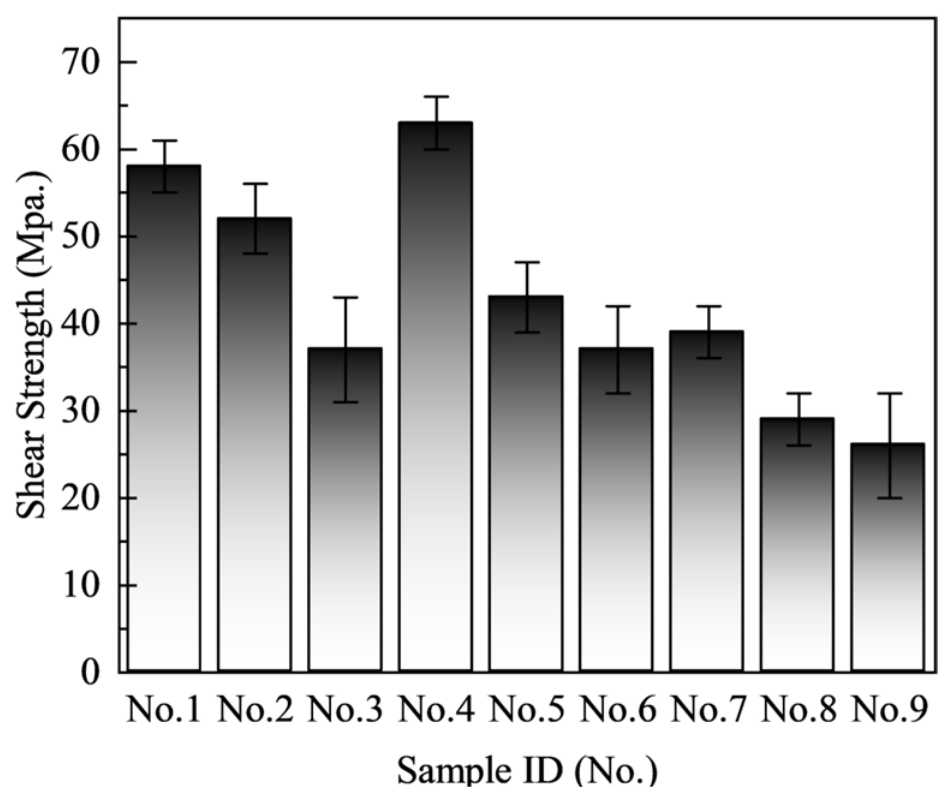
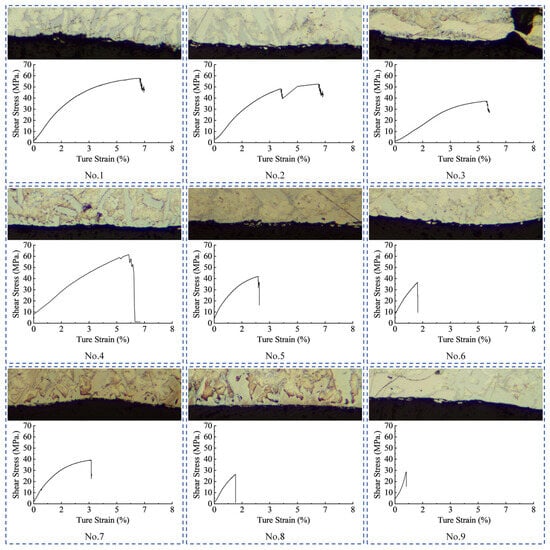
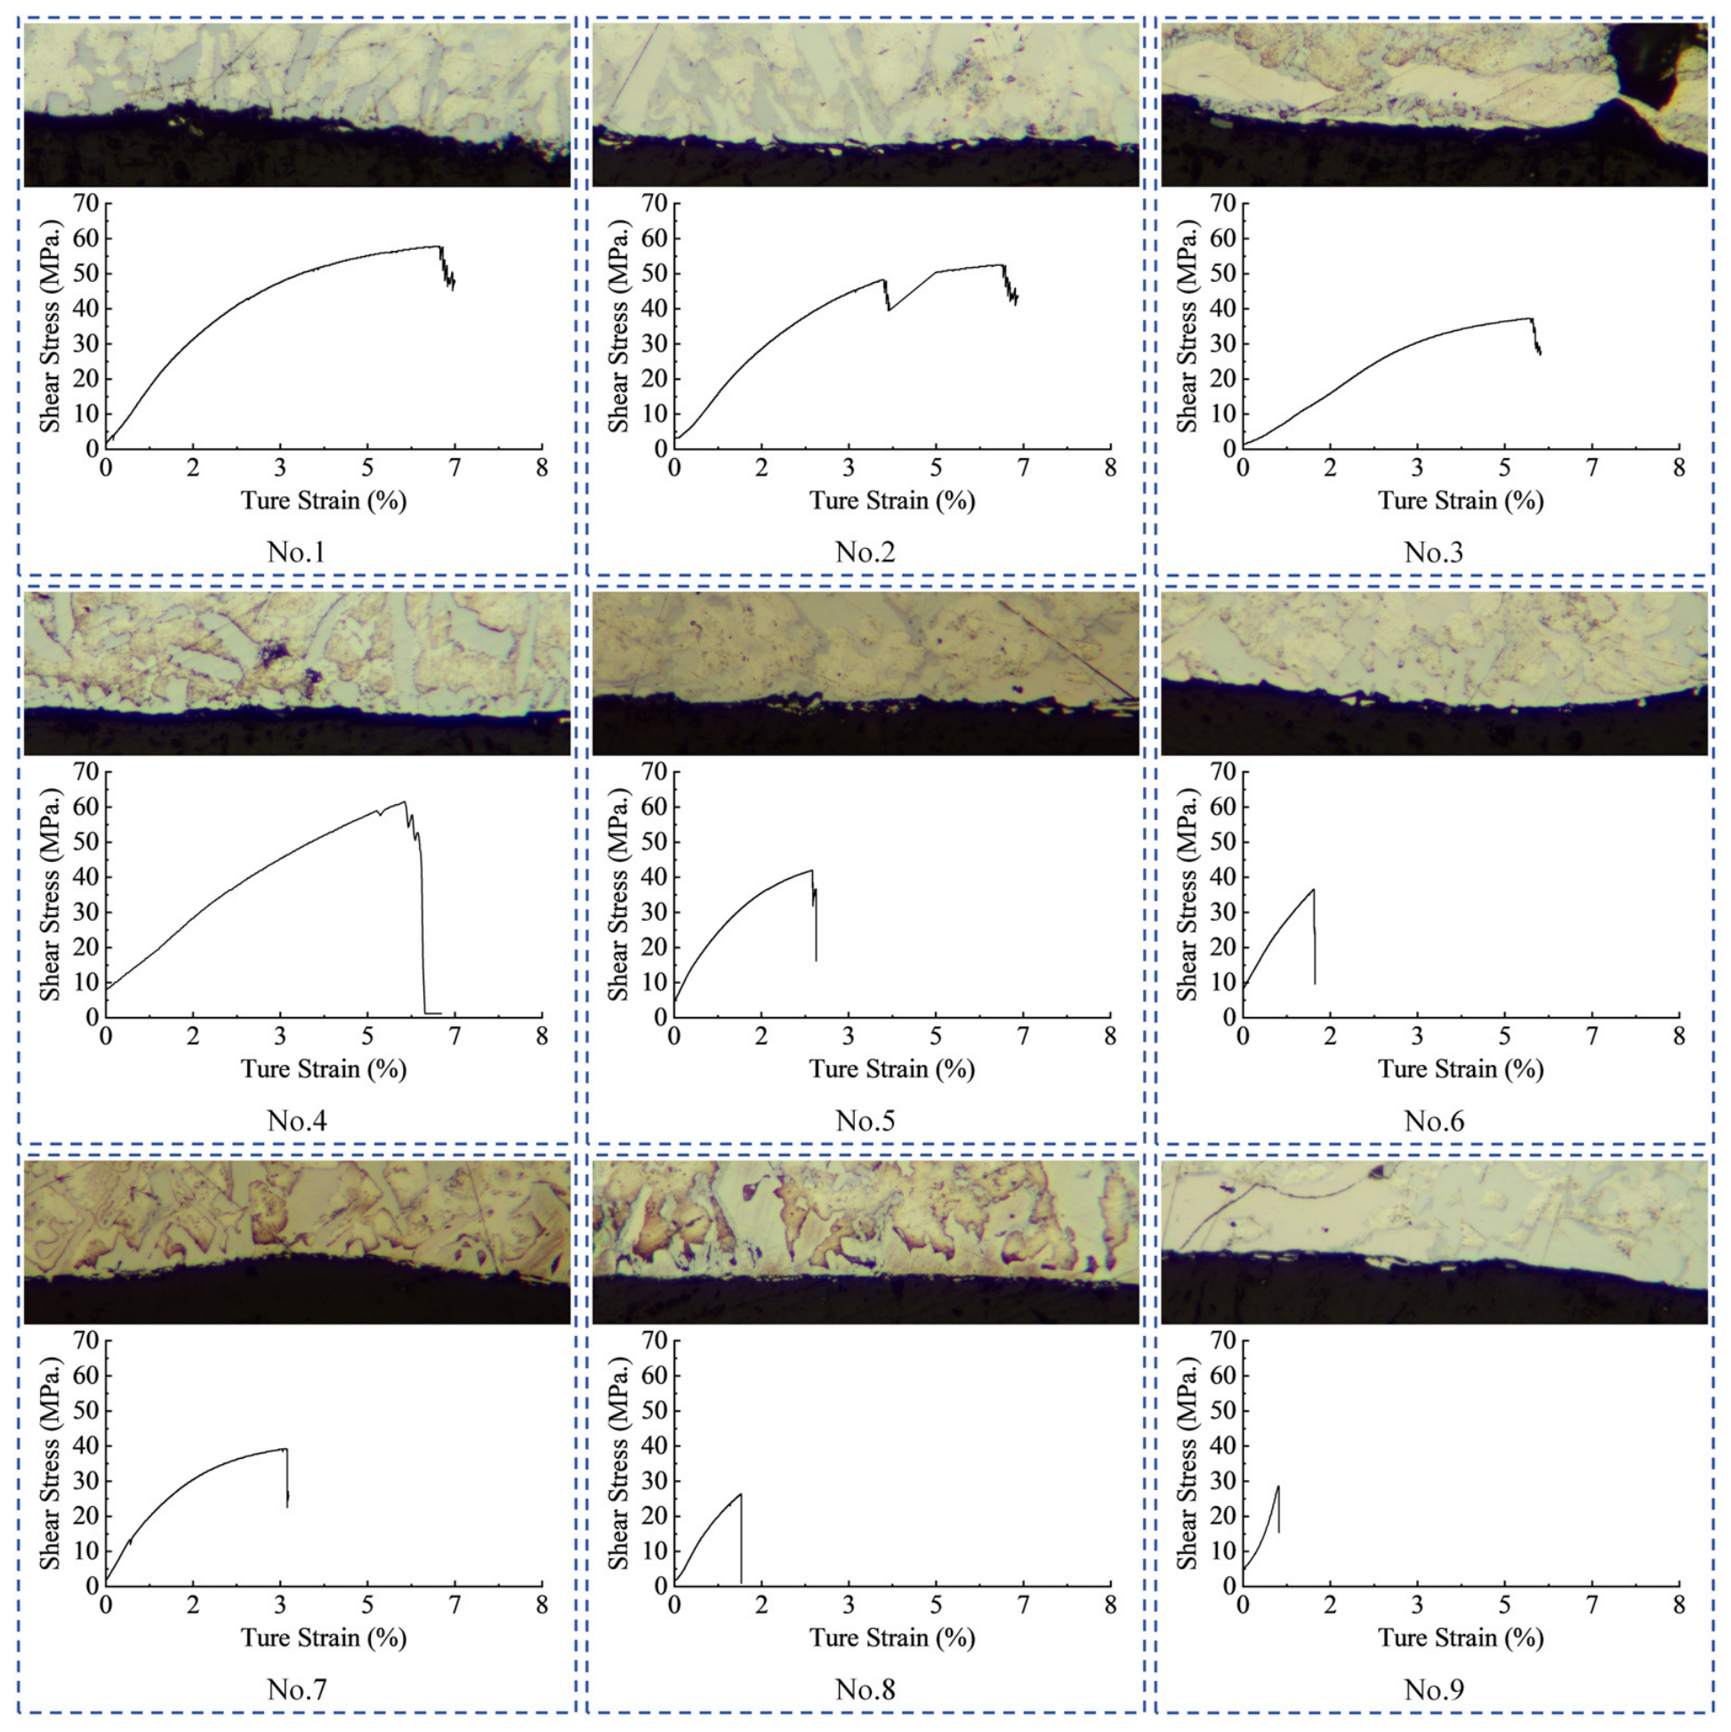
The shear strength and fracture behavior of the Cu/Zn-15Al/Al brazed joints were further evaluated to establish the relationship between the thermal-input-dependent interfacial phase evolution and mechanical failure. The shear-strength results for all nine joints are summarized in Figure 9, while the corresponding side-view metallographic images and shear stress–true strain curves are shown in Figure 10. The Cu-side fracture surfaces of the representative No. 1, No. 5, and No. 9 joints are presented in Figure 11.
Figure 9.
Shear strengths of the Cu/Zn-15Al/Al brazed joints fabricated under different brazing temperatures and holding times.
Figure 10.
Side-view metallographic images of the fracture regions and corresponding shear stress–true strain curves for the Cu/Zn-15Al/Al brazed joints under different brazing conditions.
Figure 11.
Cu-side fracture surfaces of the representative Cu/Zn-15Al/Al brazed joints.
The shear strength exhibited a clear dependence on the brazing temperature and holding time. At 480 °C, the strength decreased from approximately 58 MPa for No. 1 to 52 MPa for No. 2 and 37 MPa for No. 3 as the holding time increased from 1 to 9 min. A similar but more pronounced decrease was observed at 510 °C. The No. 4 joint reached the highest shear strength of approximately 63 MPa at a holding time of 1 min, whereas the strength decreased to approximately 43 and 37 MPa for No. 5 and No. 6, respectively. At 540 °C, the shear strength further decreased to approximately 39, 29, and 26 MPa for No. 7, No. 8, and No. 9, respectively.
These results indicate that the highest strength was obtained under a relatively high temperature combined with a short holding time, rather than under the longest holding time. The No. 4 joint exhibited the highest average strength, suggesting that rapid wetting and sufficient metallurgical bonding were achieved at 510 °C for 1 min without excessive growth of the brittle CuAl2-containing reaction layer. In contrast, prolonged holding or excessive brazing temperature promoted the thickening and coarsening of the CuAl2-dominated interfacial layer, which significantly reduced the load-bearing capability of the joint.
The side-view metallographic images in Figure 10 provide direct evidence of the fracture locations. For No. 1, the fracture surface is located within the relatively uniform interfacial reaction region. According to the interfacial phase analysis in Figure 6, this region is mainly associated with the Al4.2Cu3.2Zn0.7-rich phase. The corresponding shear stress–true strain curve shows a relatively high ultimate shear stress and a comparatively large strain to failure. This combination suggests that the Al4.2Cu3.2Zn0.7-rich interfacial layer can sustain substantial shear deformation before final fracture, even though the fracture remains located within the interfacial reaction zone.
A different fracture configuration is observed when CuAl2 appears in the reaction layer. In the No. 5 joint, the fracture location in the side-view metallographic image is associated with the CuAl2-containing interfacial region. Based on the high-magnification SEM and EDS results in Figure 7, the interface contains both CuAl2- and Al4.2Cu3.2Zn0.7-rich regions. The fracture path is therefore likely to be controlled by the CuAl2-containing layer and may preferentially develop along the CuAl2/Al4.2Cu3.2Zn0.7 phase boundary. The presence of a hard and brittle CuAl2 phase introduces a mechanically weak path within the interfacial layer. Consequently, the No. 5 joint exhibits a lower shear strength and a smaller failure strain than No. 1.
The fracture behavior becomes more severe for the No. 9 joint. Figure 8 shows that No. 9 contains a relatively thick CuAl2-dominated reaction layer, together with a reduced proportion of the Al4.2Cu3.2Zn0.7-rich region. The side-view metallographic image in Figure 10 indicates that fracture occurred at or very close to the CuAl2-containing interfacial layer. The corresponding stress–strain curve displays the lowest strength and the smallest strain to failure among the three representative joints. This behavior reflects the reduced deformation tolerance of the thick CuAl2-dominated layer and its increased susceptibility to crack initiation and rapid propagation.
The Cu-side fracture surfaces shown in Figure 11 further reveal the evolution of the fracture morphology. The No. 1 fracture surface in Figure 11 is relatively flat and consists of irregularly distributed polygonal or granular features. The surface morphology is consistent with fracture within the Al4.2Cu3.2Zn0.7-rich reaction region. The absence of a thick, continuous CuAl2 layer allows the fracture process to remain primarily controlled by the intrinsic fracture resistance and local microstructure of the Al4.2Cu3.2Zn0.7-rich phase. The observed morphology is therefore consistent with a transgranular fracture component within this phase-rich region, although definitive identification of the crystallographic fracture mode would require EBSD, TEM, or additional crystallographic characterization.
After the formation of CuAl2, the fracture morphology changes markedly. The No. 5 fracture surface in Figure 11 contains elongated, layered, and locally torn features, together with relatively sharp linear cracks. These features differ from the more uniform morphology observed in No. 1 and indicate that crack propagation was affected by the heterogeneous multiphase structure of the reaction layer. In particular, the crack may have propagated along the CuAl2/Al4.2Cu3.2Zn0.7 phase boundary or repeatedly deflected between the two phases. The retained Al4.2Cu3.2Zn0.7-rich regions on the fracture surface suggest that the crack did not simply pass through a single homogeneous phase.
The No. 9 fracture surface in Figure 11 exhibits more pronounced parallel cracks, stepped features, and locally fractured regions. These features are consistent with fracture through or along a thick and brittle CuAl2-dominated interfacial layer. The increase in crack density and the more sharply delineated fracture features indicate a lower resistance to crack initiation and propagation than that of No. 1. The fracture surface also retains Al4.2Cu3.2Zn0.7-rich regions, suggesting that the final fracture path may involve a combination of phase-boundary separation, local fracture within the Al4.2Cu3.2Zn0.7-rich phase, and fracture through the CuAl2-containing layer.
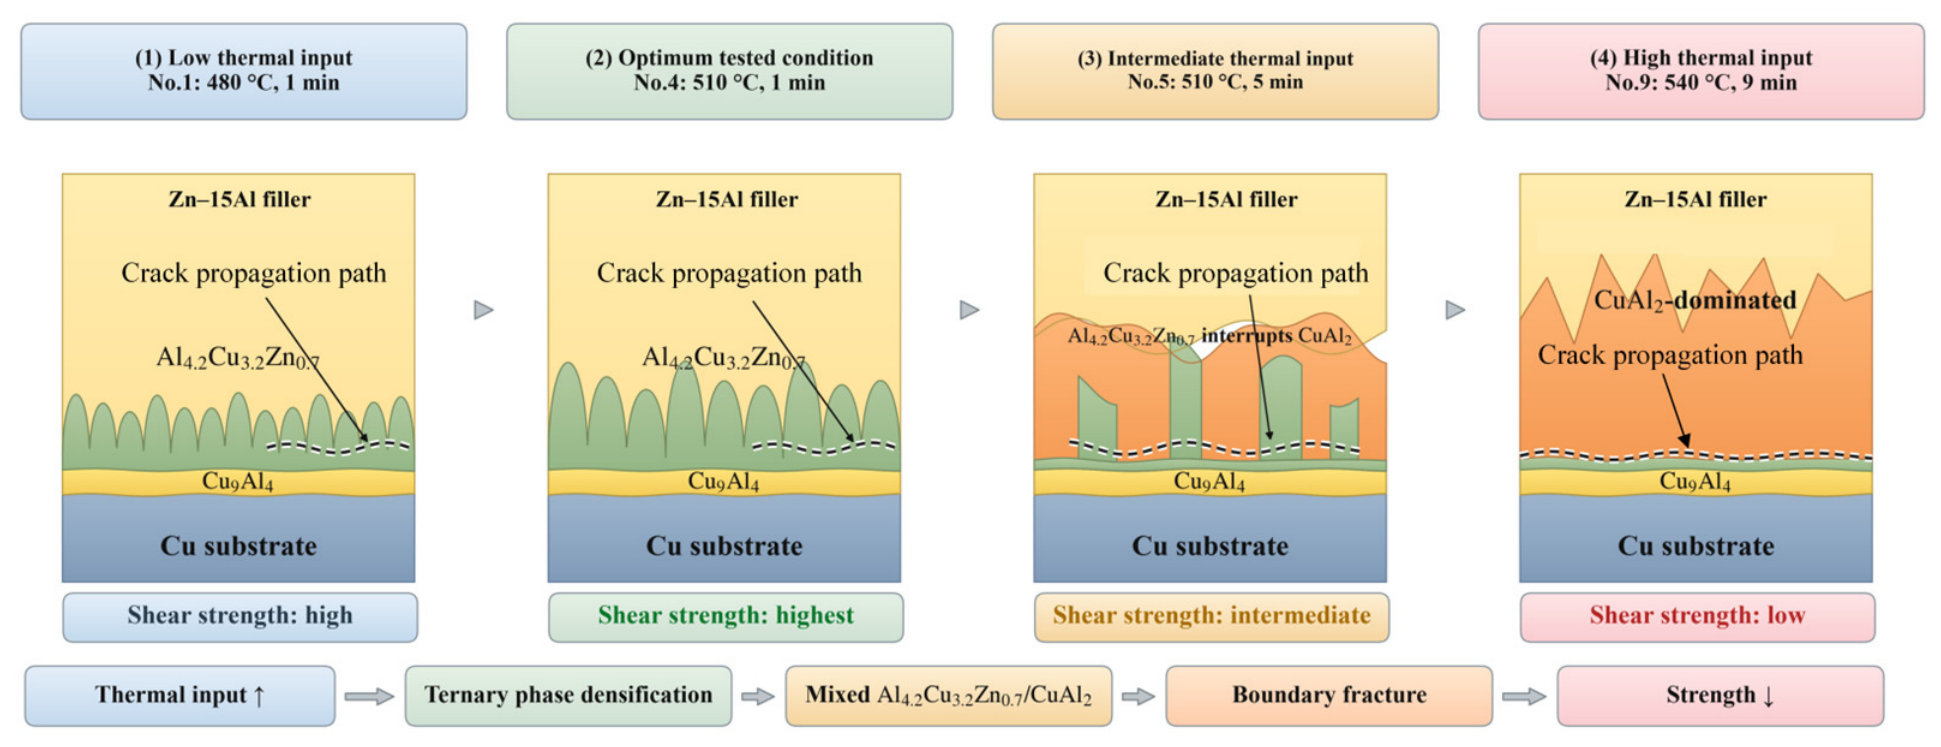
The combined evidence from Figure 9, Figure 10 and Figure 11 demonstrates that the mechanical response of the joints was governed not only by the total thickness of the interfacial reaction layer, but also by the phase constitution, morphology and spatial arrangement of the reaction products. When the interface was dominated by a continuous Al4.2Cu3.2Zn0.7-rich structure, fracture occurred within the reaction region while the joint retained relatively high strength and failure strain. At the intermediate condition represented by No. 5, a continuous CuAl2-containing upper structure was locally interrupted by Al4.2Cu3.2Zn0.7-rich regions, producing a heterogeneous multiphase interface and a boundary-assisted fracture path. Under the highest thermal input, CuAl2 became coarse and dominant, while only a very thin Al4.2Cu3.2Zn0.7 layer remained between Cu9Al4 and CuAl2. This structure promoted premature fracture and resulted in the lowest shear strength.
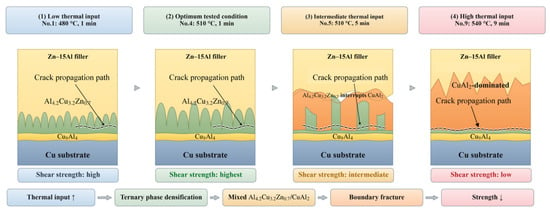
Accordingly, the fracture mechanism can be described as a transition from fracture within a continuous Al4.2Cu3.2Zn0.7-rich structure, to boundary-assisted fracture in the mixed CuAl2/Al4.2Cu3.2Zn0.7 region, and finally to brittle fracture along or close to the CuAl2/Al4.2Cu3.2Zn0.7 boundary in the CuAl2-dominated structure. The thermal-input-dependent phase evolution and corresponding failure transition are schematically summarized in Figure 12.
Figure 12.
Schematic illustration of the thermal-input-dependent interfacial phase evolution and fracture mechanism of the Cu/Zn-15Al/Al brazed joints: (1) a relatively fine, continuous Al4.2Cu3.2Zn0.7 structure growing on the Cu9Al4 base layer at low thermal input; (2) a denser and slightly coarser Al4.2Cu3.2Zn0.7 structure at the optimum No. 4 condition; (3) a mixed structure in No. 5 consisting of a continuous CuAl2-containing upper region locally interrupted by Al4.2Cu3.2Zn0.7; and (4) a CuAl2-dominated structure in No. 9 with a very thin Al4.2Cu3.2Zn0.7 layer retained between Cu9Al4 and CuAl2. The dashed lines indicate the proposed crack paths.
At low thermal input, the Cu-side interface consisted mainly of a continuous Al4.2Cu3.2Zn0.7-rich structure growing on the Cu9Al4 base layer. The limited dissolution of Cu and Al resulted in a relatively thin reaction region, and fracture mainly occurred within the ternary-phase structure. At the optimum condition represented by No. 4, the Al4.2Cu3.2Zn0.7 structure became denser and slightly coarser while remaining continuous, which produced the highest shear strength.
With further thermal-input increase, CuAl2 developed as a continuous upper reaction phase, while the Al4.2Cu3.2Zn0.7-rich phase locally interrupted the CuAl2 structure from the Cu9Al4 side. This mixed configuration introduced heterogeneous phase boundaries and promoted boundary-assisted crack propagation. At the highest thermal input, the interface evolved into a CuAl2-dominated structure. Although a very thin Al4.2Cu3.2Zn0.7 layer remained between Cu9Al4 and CuAl2, the coarse CuAl2 region and its phase boundary provided a preferential path for crack propagation, thereby reducing the shear strength.
3.5. Mechanism-Informed Process Optimization and Experimental Validation
3.5.1. Second-Order Response-Surface Modeling and Prediction of the Optimum Condition
The nine measured shear-strength responses were further analyzed using a second-order response-surface model to calculate the optimum brazing condition within the investigated experimental domain. The two independent variables were brazing temperature (T) and holding time (t). The experimental levels were 480, 510 and 540 °C and 1, 5 and 9 min, respectively. The measured shear strengths of No. 1–No. 9 were 58, 52, 37, 63, 43, 37, 39, 29 and 26 MPa, respectively.
The process variables were coded around the central experimental condition of 510 °C and 5 min:
x1 = (T − 510)/30,
x2 = (t − 5)/4,
Thus, the three temperature levels correspond to x1 = −1, 0 and +1, and the three holding-time levels correspond to x2 = −1, 0 and +1. A complete second-order model was then fitted as:
where is the predicted shear strength. The coefficient vector was defined as . The coefficients were obtained by ordinary least squares according to:
where X is the 9 × 6 design matrix containing the terms 1, x1, x2, x1x2, and , and Y is the vector of the nine measured shear-strength values.
Therefore, b0–b22 are calculated from the experimental response values and the coded design matrix; they are not arbitrarily selected parameters. For this complete 3 × 3 design, the calculated coefficients were shown in Table 1.
Table 1.
Coefficients and statistical meanings of the fitted second-order response-surface model.
Substitution of the calculated coefficients gives the fitted response equation:
The fitted model gave an R2 of 0.9426, an adjusted R2 of 0.8470, an SSE of 73.3333 MPa2 and an RMSE of 4.9441 MPa.
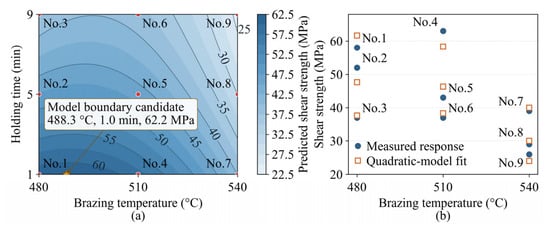
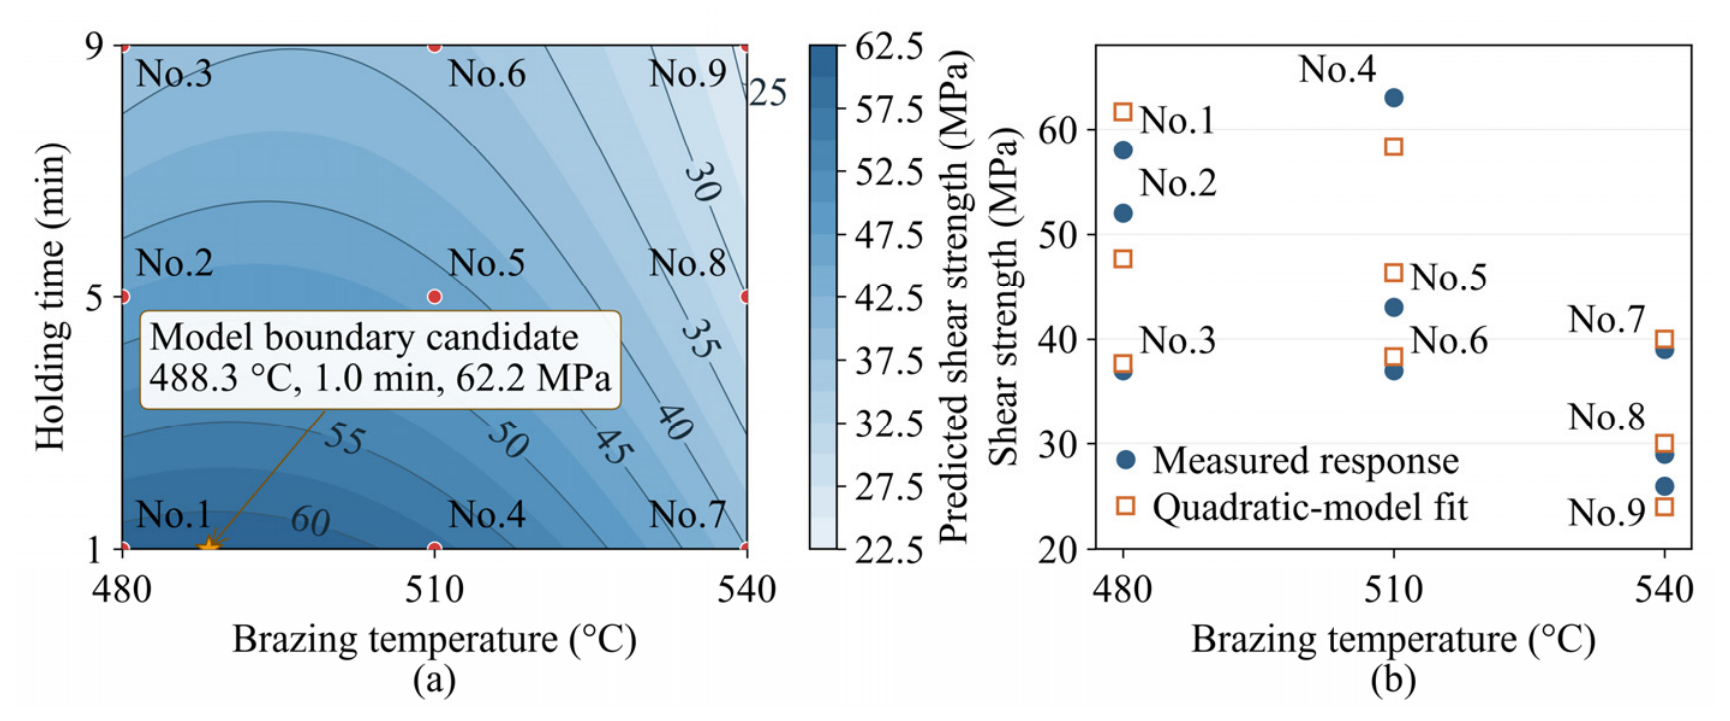
The fitted response-surface equation was used to analyze the combined effects of brazing temperature and holding time on the shear strength. The predicted response surface and the comparison between the measured and fitted values are shown in Figure 13.
Figure 13.
Second-order response-surface analysis of the shear strength of Cu/Zn-15Al/Al brazed joints: (a) predicted shear-strength contour as a function of brazing temperature and holding time, and (b) comparison between the measured responses and the quadratic-model-fitted values for the nine experimental conditions.
As shown in Figure 13a, the predicted shear strength was higher at short holding times and decreased progressively with increasing holding time. The decrease was more pronounced at higher brazing temperatures, indicating that excessive thermal input was unfavorable to the joint strength. The contour distribution also shows that the high-strength region was concentrated near the short-time boundary of the investigated process window.
Figure 13b compares the measured shear strengths of the nine joints with the corresponding fitted values calculated from Equation (7). The fitted results followed the same overall trend as the measured data. The strength was relatively high for the short-time conditions and decreased after prolonged holding. The differences between the measured and fitted values represent the residual error of the response-surface model.
A constrained search of the fitted response surface within the investigated temperature and holding-time ranges identified approximately 488.3 °C and 1.0 min as a favorable boundary candidate condition, with a predicted shear strength of 62.2 MPa. This condition was subsequently selected for independent experimental validation.
3.5.2. Experimental Validation of the Response-Surface-Predicted Condition
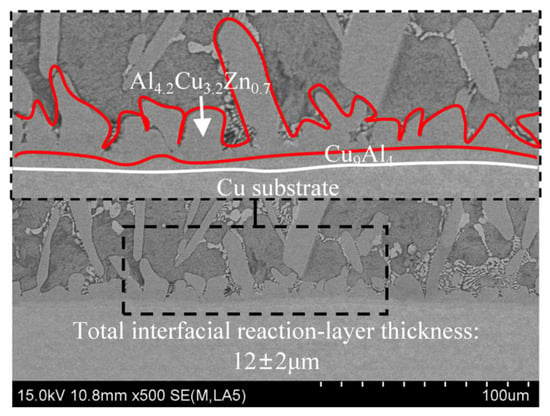
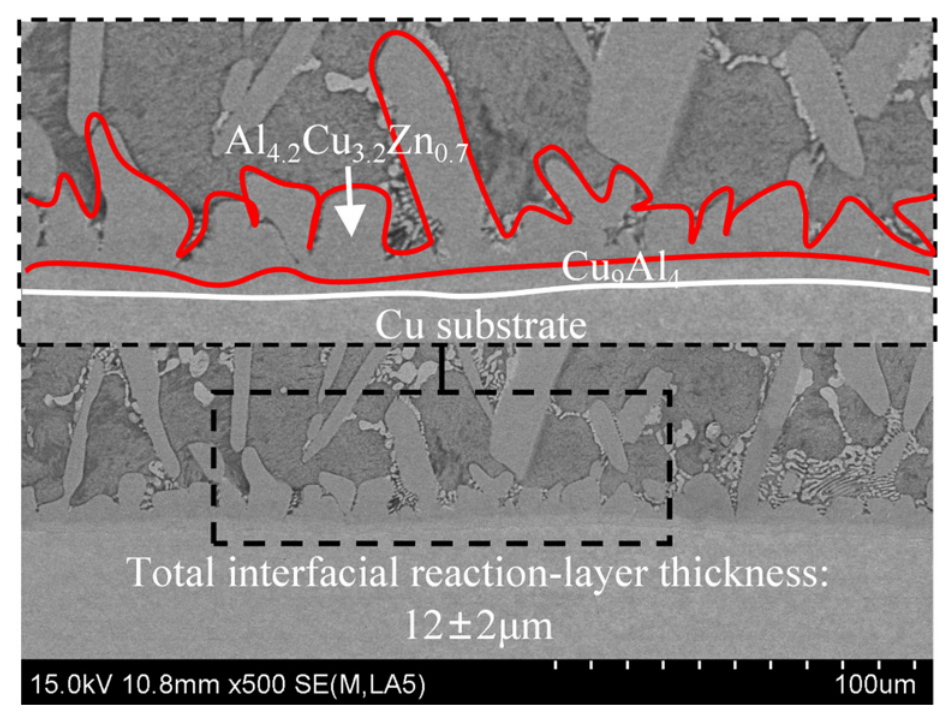
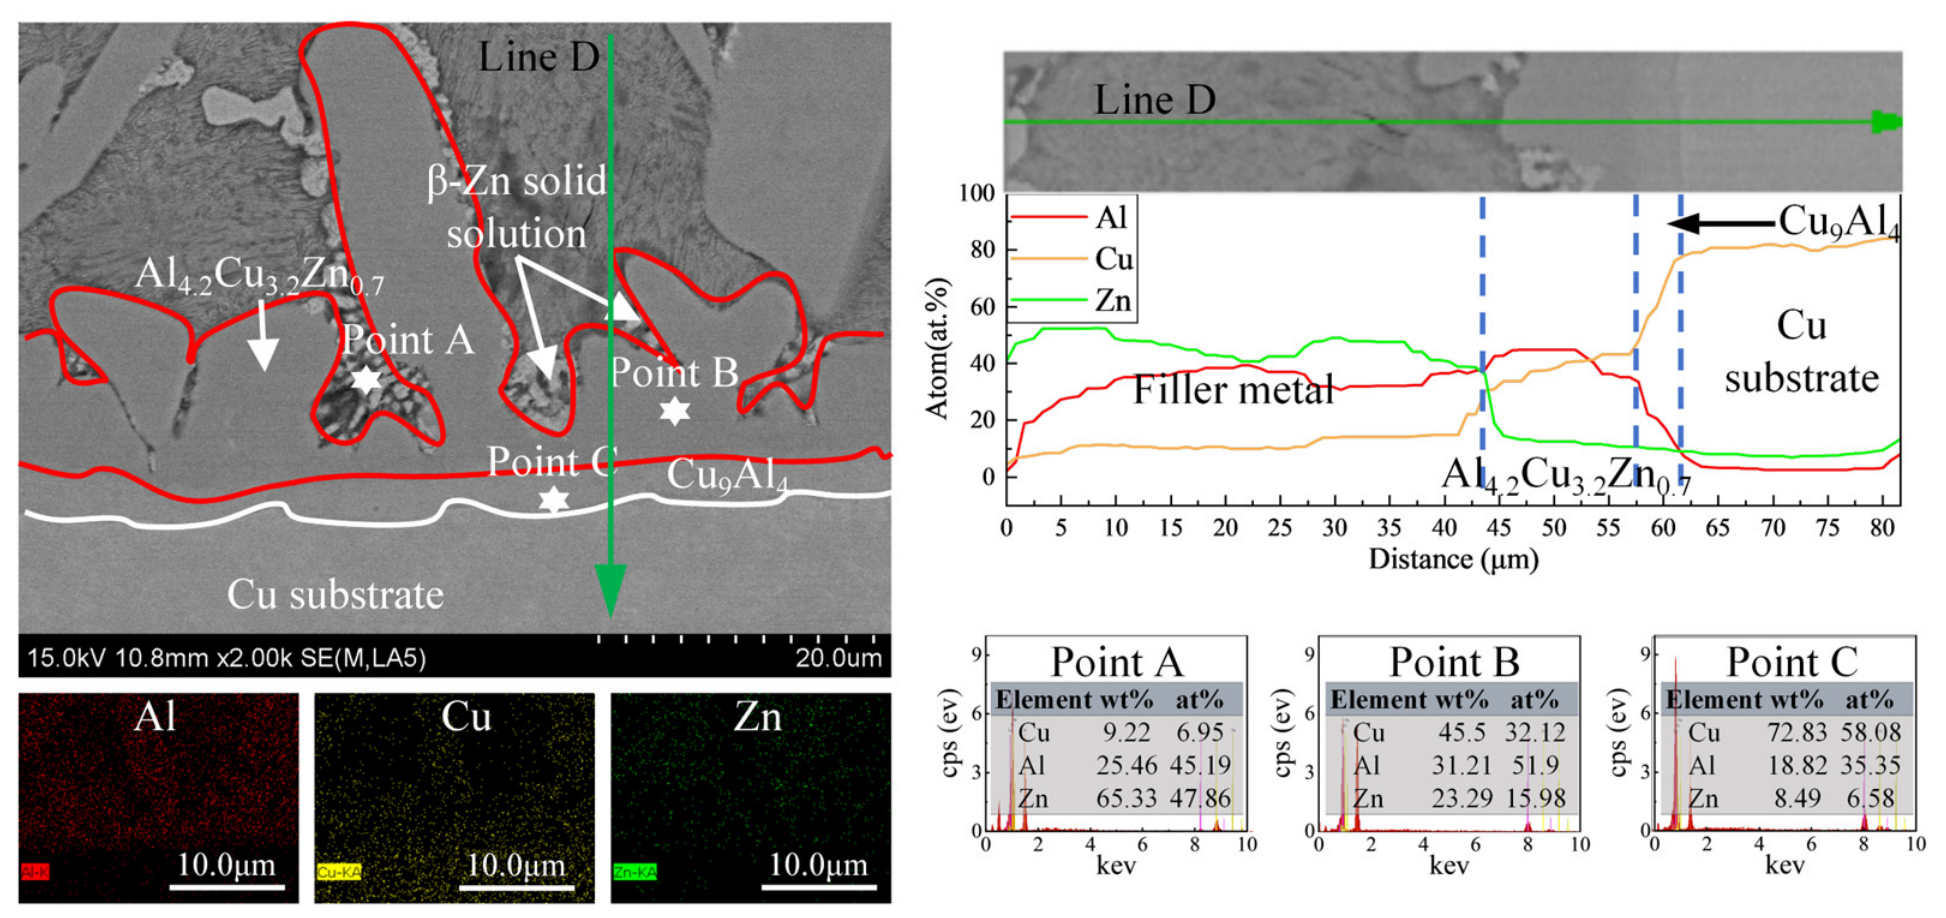
Three additional Cu/Zn-15Al/Al joint specimens were prepared at 488.3 °C for 1.0 min. The mean shear strength was 65.4 ± 2.6 MPa, compared with the predicted value of 62.2 MPa. The prediction error was 5.1%. The interfacial microstructure of the validation joint is shown in Figure 14. A continuous interfacial reaction region was formed between the Cu substrate and the filler metal. A Cu9Al4-based transition layer was observed adjacent to the Cu substrate, while a dense Al4.2Cu3.2Zn0.7-rich structure developed on its surface. The ternary phase exhibited a continuous semi-elliptical morphology and was distributed relatively densely along the interface. The total interfacial reaction-layer thickness was approximately 12 ± 2 μm. No thick and continuous CuAl2-dominated layer was observed under the predicted condition.
Figure 14.
Cross-sectional interfacial microstructure of the Cu/Zn-15Al/Al brazed joint prepared at the response-surface-predicted condition of 488.3 °C for 1.0 min, showing the Cu9Al4-based layer, the Al4.2Cu3.2Zn0.7-rich structure and the total interfacial reaction-layer thickness.
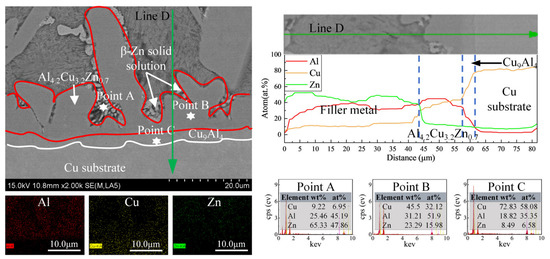
The EDS results are presented in Figure 15. Point A was located in the filler-metal-side mixed region and contained 45.19 at.% Al, 6.95 at.% Cu and 47.86 at.% Zn. Point B, located in the Al–Cu–Zn-rich reaction region, contained 51.90 at.% Al, 32.12 at.% Cu and 15.98 at.% Zn. Point C, near the Cu substrate, contained 35.35 at.% Al, 58.08 at.% Cu and 6.58 at.% Zn, consistent with a Cu-rich transition region. These compositions are consistent with the formation of an Al-Cu-Zn-rich region and a Cu-rich interfacial reaction layer.
Figure 15.
SEM-EDS characterization of the Cu-side interface of the validation joint prepared at 488.3 °C for 1.0 min.
The line-scan profile further shows that Zn was relatively enriched in the filler-metal and Al4.2Cu3.2Zn0.7-rich regions but decreased toward the Cu-side reaction layer. In contrast, the Cu content increased significantly toward the Cu substrate. This result indicates that Cu and Al from the substrate participated in the interfacial reaction, whereas Zn was partially excluded from the Cu-Al-rich reaction region.
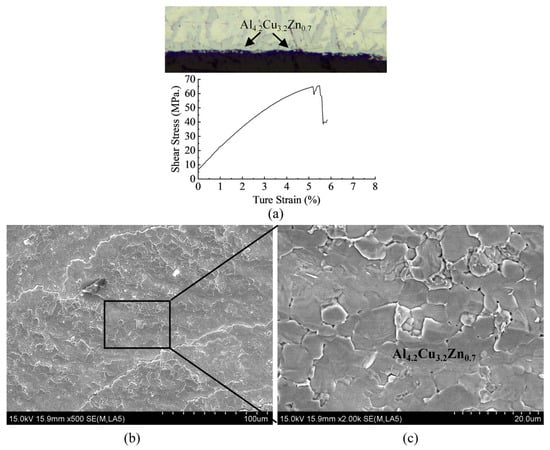
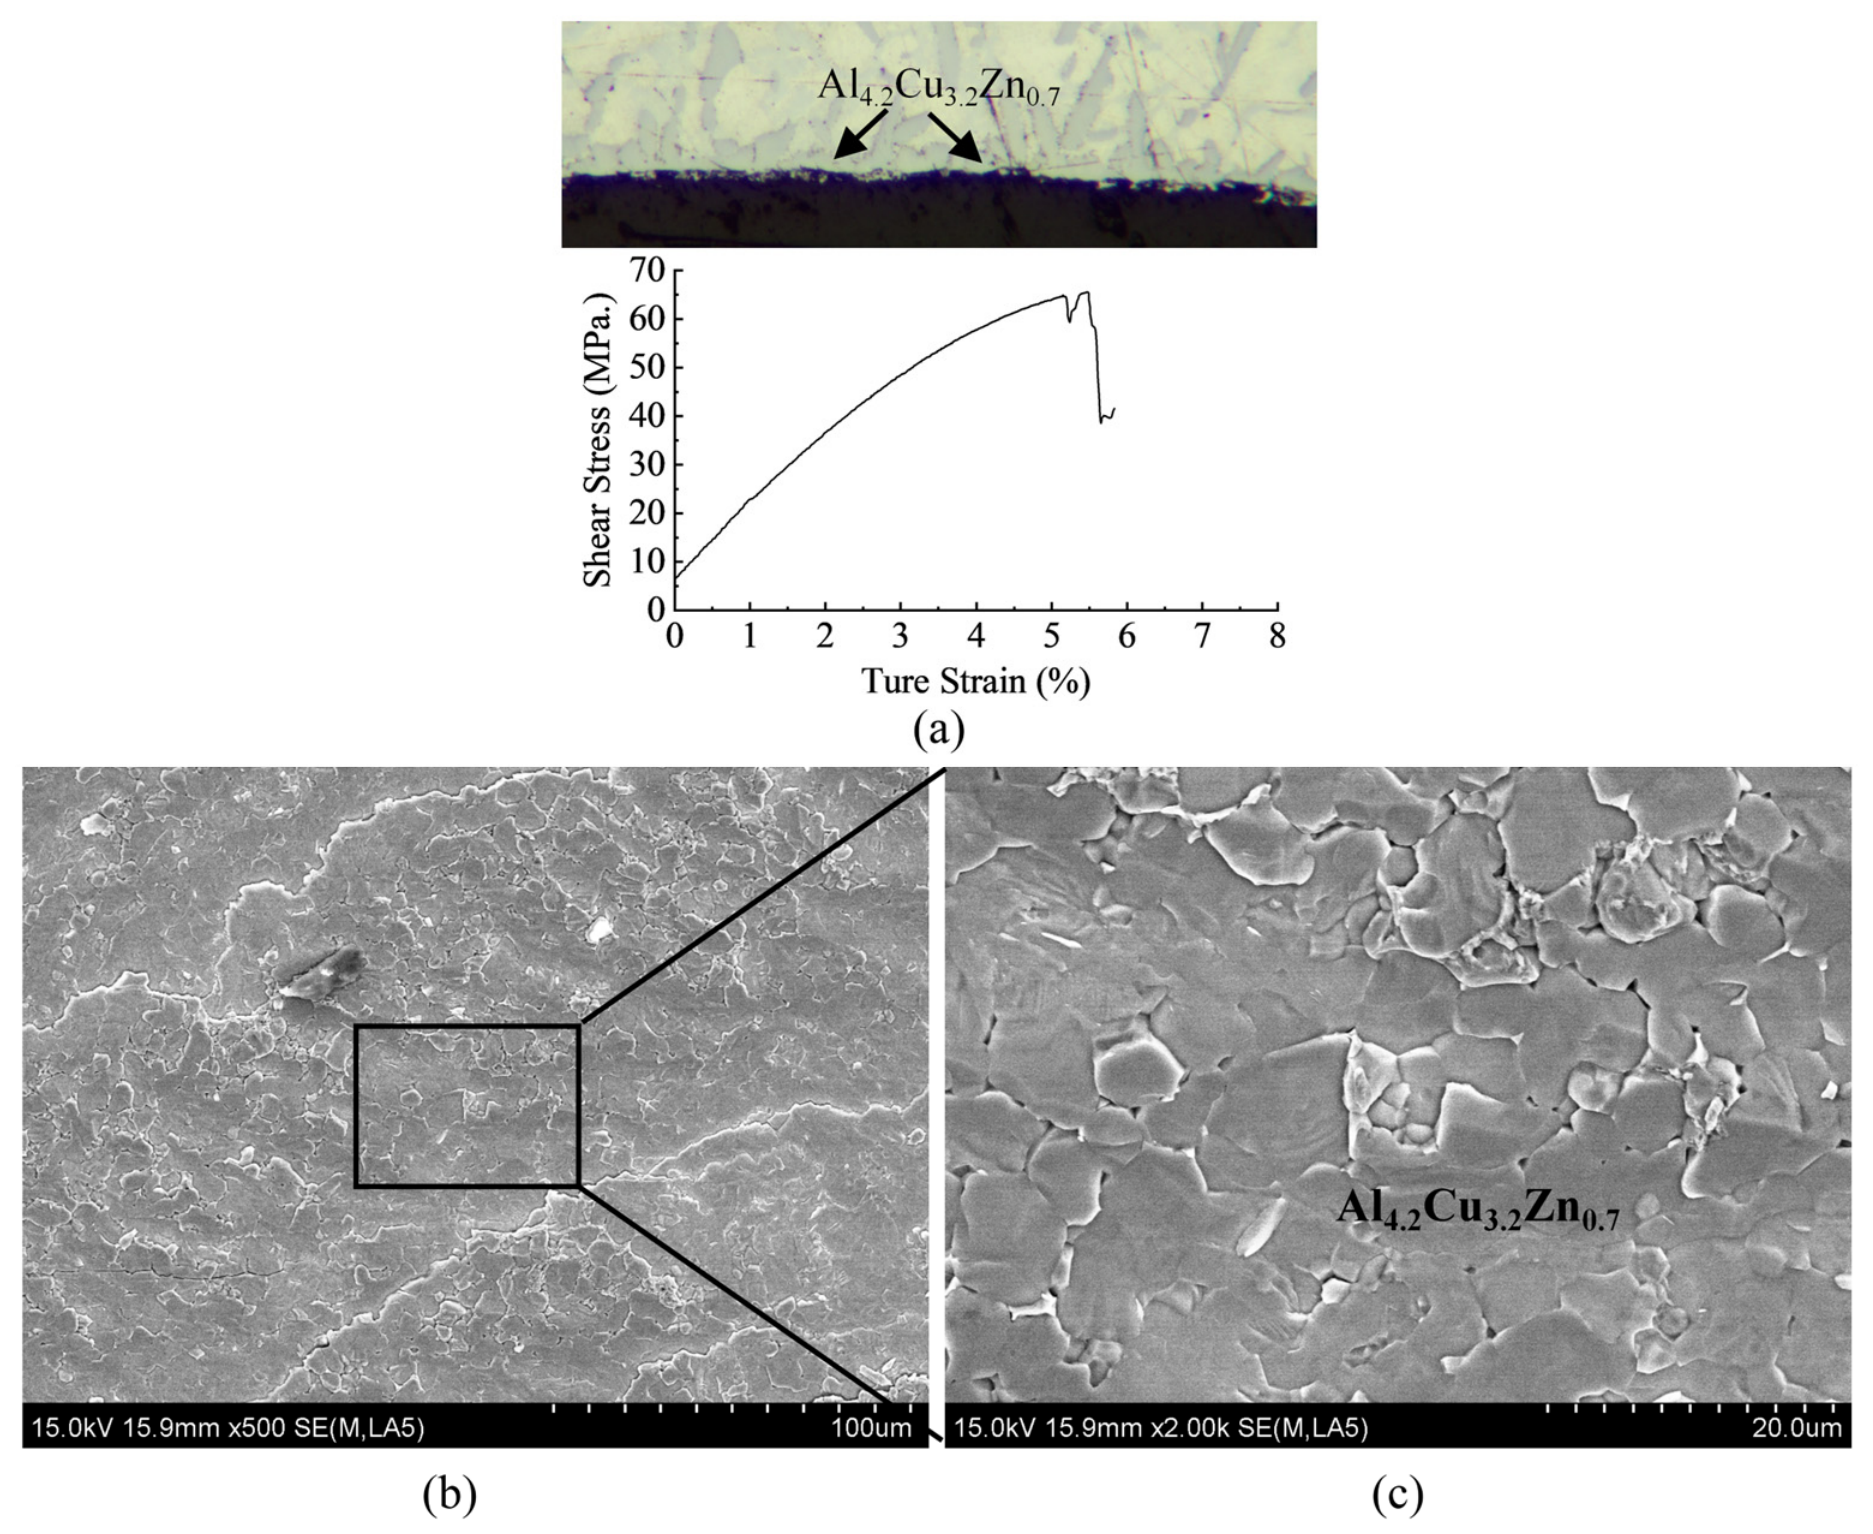
The mechanical response and fracture morphology of the validation joint are shown in Figure 16. The shear stress–true strain curve reached a maximum stress of approximately 65.4 MPa before failure. The fracture surface mainly exhibited polygonal and granular features associated with the Al4.2Cu3.2Zn0.7-rich region. Local cracks and irregular fracture facets were also observed. However, the fracture surface did not exhibit a large and flat morphology associated with separation along a thick continuous CuAl2 layer.
Figure 16.
Shear stress–true strain curve and fracture-surface morphology of the validation joint prepared at the response-surface-predicted condition of 488.3 °C for 1.0 min. (a) Side-view metallographic images of the fracture regions and corresponding shear stress–true strain curves; SEM image of the fracture surface: (b) low-magnification; (c) enlarged view of the boxed region in (b).
The validation results agree well with the response-surface prediction. The difference between the predicted strength and the measured strength was small, with a prediction error of only 5.1%. The relatively thin reaction layer and the dense Al4.2Cu3.2Zn0.7-rich structure indicate that the predicted condition provided sufficient interfacial reaction while limiting excessive CuAl2 growth. Therefore, the independent experiment confirms that 488.3 °C for 1.0 min is a suitable process condition for the Cu/Zn-15Al/Al brazed joints.
Increasing brazing temperature or holding time generally accelerates interfacial reactions and can promote excessive reaction-layer growth and CuAl2 coarsening, thereby reducing joint strength. Therefore, process selection should balance sufficient metallurgical bonding against excessive interfacial reaction. This principle can guide similar Cu/Al brazing systems, although the fitted model coefficients and predicted optimum remain specific to the present filler composition, joint geometry and thermal cycle.
4. Conclusions
- The interfacial phase constitution of the Cu/Zn-15Al/Al joints was strongly dependent on brazing temperature and holding time. At low thermal input, a relatively continuous Al4.2Cu3.2Zn0.7-rich structure formed on the Cu9Al4-based layer. With increasing thermal input, CuAl2 progressively formed and coarsened, resulting in a mixed structure and finally a CuAl2-dominated reaction layer.
- The shear strength decreased with increasing thermal input, particularly with prolonged holding. Among the nine original experimental conditions, the No. 4 joint prepared at 510 °C for 1 min exhibited the highest shear strength of 63 MPa. The decrease in strength was associated with the growth of coarse CuAl2 and the formation of preferential crack paths within the interfacial reaction region.
- A second-order response-surface model was established from the nine measured shear-strength responses, yielding an R2 of 0.9426, an adjusted R2 of 0.8470 and an RMSE of 4.9441 MPa. The model identified 488.3 °C for 1.0 min as a favorable boundary condition, with a predicted shear strength of 62.2 MPa, while independent validation produced 65.4 MPa with a prediction error of 5.1%. The response-surface framework provides a transferable approach for process optimization and can potentially be extended to Zn-Al-based filler metals with different compositions after recalibration.
Author Contributions
Conceptualization, T.C. and P.H.; methodology, T.C.; software, T.C.; validation, T.C., P.H. and J.L. (Jingyi Luo); formal analysis, T.C. and Y.L.; investigation, T.C. and L.D.; resources, T.C. and J.Z.; data curation, T.C.; writing—original draft preparation, T.C.; writing—review and editing, T.C., P.H. and T.X.; visualization, T.C. and J.L. (Jingyi Luo); supervision, T.C. and J.L. (Jiaxin Li); project administration, T.C.; funding acquisition, T.C. All authors have read and agreed to the published version of the manuscript.
Funding
This research was funded by the Qinglan Project of Jiangsu Higher Education Institutions of China.
Data Availability Statement
The original contributions presented in this study are included in the article. Further inquiries can be directed to the corresponding author.
Conflicts of Interest
Author Jingyi Luo is employed by the company Jinhua Jinzhong Welding Materials Co., Ltd. The authors declare no conflicts of interest.
References
- Niu, Z.; Ye, Z.; Huang, J.; Yang, H.; Yang, J.; Chen, S. Interfacial structure and properties of Cu/Al joints brazed with Zn-Al filler metals. Mater. Charact. 2018, 138, 78–88. [Google Scholar] [CrossRef] [Scilit]
- Zhang, M. Effects of interfacial reactions on microstructures and mechanical properties of 3003 Al/T2 Cu and 1035 Al/T2 Cu brazed joints. Crystals 2020, 10, 248. [Google Scholar] [CrossRef] [Scilit]
- Xiao, Y.; Ji, H.; Li, M.; Kim, J. Ultrasound-assisted brazing of Cu/Al dissimilar metals using a Zn-3Al filler metal. Mater. Des. 2013, 52, 740–747. [Google Scholar] [CrossRef] [Scilit]
- Zhao, D.; Li, D.; Xiao, Y.; Li, M.; Chen, W. Acoustic cavitation-induced microstructure evolution in ultrasonically brazed Al/Cu joints using Zn-Al alloy fillers. Ultrason. Sonochem. 2024, 107, 107001. [Google Scholar] [CrossRef] [Scilit] [PubMed]
- Ji, F.; Xue, S.; Dai, W. Reliability studies of Cu/Al joints brazed with Zn-Al-Ce filler metals. Mater. Des. 2012, 42, 156–163. [Google Scholar] [CrossRef] [Scilit]
- Bakoglidis, K.D.; Palisaitis, J.; dos Santos, R.B.; Rivelino, R.; Persson, P.O.; Gueorguiev, G.K.; Hultman, L. Self-Healing in Carbon Nitride Evidenced as Material Inflation and Superlubric Behavior. ACS Appl. Mater. Interfaces 2018, 10, 16238–16243. [Google Scholar] [CrossRef] [Scilit] [PubMed]
- Ji, F.; Xue, S. Growth behaviors of intermetallic compound layers in Cu/Al joints brazed with Zn–22Al and Zn–22Al–0.05Ce filler metals. Mater. Des. 2013, 51, 907–915. [Google Scholar] [CrossRef] [Scilit]
- Ganczar, T.; Pstruś, J.; Berent, K. Interfacial reactions of Zn-Al alloys with Na addition on Cu substrate during spreading test and after aging treatments. J. Mater. Eng. Perform. 2016, 25, 2439–2449. [Google Scholar] [CrossRef] [Scilit][Green Version]
- Berent, K.; Pstruś, J.; Ganczar, T. Thermal and microstructure characterization of Zn-Al-Si alloys and chemical reaction with Cu substrate during spreading. J. Mater. Eng. Perform. 2016, 25, 3375–3383. [Google Scholar] [CrossRef] [Scilit][Green Version]
- Yu, G.; Sun, H.; Teng, F.; Chen, S.; Huang, J.; Yang, J.; Zhao, Z. Influence of Si addition on microstructure, mechanical properties, and corrosion resistance of Al/steel brazing joint using Zn-15Al-xSi filler metals. J. Mater. Eng. Perform. 2024, 33, 1874–1884. [Google Scholar] [CrossRef] [Scilit]
- Ji, F.; Xue, S.; Dai, W. Effects of Ti on the brazability of Zn-22Al-xTi filler metals as well as properties of Cu/Al brazing joints. Rare Met. Mater. Eng. 2013, 42, 2453–2457. [Google Scholar] [CrossRef] [Scilit]
- Li, X.; Zhai, Y.; Liu, M.; Wang, X.; Wang, T. Development of Zn–22Al–xAg filler metals for brazing 6061 aluminum alloy to T2 copper. Weld. World 2025, 69, 2907–2920. [Google Scholar] [CrossRef] [Scilit]
- Zhai, Y.; Wang, T.; Liu, M.; Zhou, N.; Li, X. Effect of Al content on the microstructure and properties of Zn-Al solder alloys. Metals 2024, 14, 689. [Google Scholar] [CrossRef] [Scilit]
- Rautiainen, A.; Vuorinen, V.; Paulasto-Kröckel, M. Interfacial reactions between Zn-Al(Ge) solders on Cu and Ni substrates. J. Electron. Mater. 2017, 46, 2323–2333. [Google Scholar] [CrossRef] [Scilit]
- Chen, T.; He, P.; Xu, T. Investigation of wetting behavior and brazing reliability of Zn-15Al-xGa filler metals in Cu/Al joints. J. Alloys Compd. 2025, 1010, 177252. [Google Scholar] [CrossRef] [Scilit]
- Chen, T.; Xu, T.; Luo, J.; He, P. Influence of Ga on phase transformation and failure mechanism of Cu/Al brazed joint interface during thermal aging. Crystals 2026, 16, 97. [Google Scholar] [CrossRef] [Scilit]
- Kiefel, A.; Gimmler, S.; Broeckmann, C.; Vroomen, U. Zn-Based Alloys for Plain Bearings—Influence of Al and Cu Content on Mechanical Properties. Materials 2024, 17, 1062. [Google Scholar] [CrossRef] [Scilit] [PubMed]
- Bernhard, M.; Presoly, P.; Bernhard, C.; Hahn, S.; Ilie, S. An Assessment of Analytical Liquidus Equations for Fe-C-Si-Mn-Al-P-Alloyed Steels Using DSC/DTA Techniques. Metall. Mater. Trans. B 2021, 52, 2821–2830. [Google Scholar] [CrossRef] [Scilit]

Disclaimer/Publisher’s Note: The statements, opinions and data contained in all publications are solely those of the individual author(s) and contributor(s) and not of MDPI and/or the editor(s). MDPI and/or the editor(s) disclaim responsibility for any injury to people or property resulting from any ideas, methods, instructions or products referred to in the content. |
© 2026 by the authors. Licensee MDPI, Basel, Switzerland. This article is an open access article distributed under the terms and conditions of the Creative Commons Attribution (CC BY) license.