


Abstract
In our study, density functional theory (DFT) is used to investigate how the metal–metal (M–M) spacing in bimetallic M2–Phen2 (M=Ti, Fe; Phen = 1,10-phenanthroline) regulates N2 activation and Nitrogen Reduction Reaction (NRR) activity. The results indicate that M–M distance significantly influences catalytic efficiency. N2 adsorbs on M2–Phen2 in a side-on:side-on configuration. Increasing the M–M spacing initially enhances N2 activation, but excessive separation weakens this effect. In comparison, Ti2–Phen2 activates N2 more effectively than Fe2–Phen2. The NRR pathway calculations identify *NH2 → *NH3 as the rate-determining step (RDS), where the electronic energy difference between the two states exhibits a parabolic relationship with M–M distance. By scanning Ti–Ti (dTi–Ti) spacing from 2.6 Å to 3.4 Å and Fe–Fe spacing (dFe–Fe) from 2.1 Å to 2.7 Å, the lowest RDS electronic energy differences were observed at 2.9 Å (1.01 eV) for Ti2–Phen2 and 2.2 Å (1.13 eV) for Fe2–Phen2. Conversely, the highest electronic energy differences within the scanned ranges were found at a Ti–Ti spacing of 3.4 Å (1.33 eV) and a Fe–Fe spacing of 2.7 Å (1.34 eV). This study reveals that interatomic distance is a key factor influencing catalytic activity, providing theoretical guidance for optimizing bimetallic catalysts through precise structural design.
1. Introduction
The increasing scarcity of global energy resources, coupled with worsening environmental pollution and climate change, has led to frequent extreme weather events. Transitioning toward energy-efficient and eco-friendly processes is now a primary goal of modern industry. As one of the pillars of the modern chemical industry, the ammonia synthesis process urgently needs improvement. Electrocatalytic nitrogen reduction (eNRR) is one of the most promising methods to replace the existing high-energy consumption, high–pollution Haber–Bosch process. Compared with the Haber–Bosch process, the electrocatalytic method is more sustainable, more environmentally friendly, and efficient. It can reduce the NRR electronic energy difference through catalysts; therefore, it has rapidly developed in the field of nitrogen reduction in recent years. However, excessively high overpotentials and relatively low Faradaic efficiencies limit the development of eNRR. Furthermore, the bond energy of N2 reaches as high as 938.48 kJ/mol, making it difficult to activate and thus posing additional challenges for the advancement of electrocatalysis.
The d-band center theory [1] suggests that the partially filled d orbitals of transition metals enable effective interactions with reactant molecules, while their electronic structures remain adjustable. These features account for their broad application in heterogeneous catalysis. Single-atom catalysts (SACs) were proposed in 2011 [2]. Compared with other metal catalysts, SACs have higher catalytic activity, tunable electronic properties, and strong metal–support interactions. SACs maximize metal utilization and offer structurally uniform active sites, but N2 adsorption on an isolated metal atom gives relatively low N2–AD values, suggesting insufficient activation of the molecule [3]. In contrast, double-atom catalysts (DACs) can achieve higher metal loading and offer more diverse active site structures. DACs also exhibit synergistic effects, which can improve catalytic performance. For example, Wang et al. reported that, due to the synergistic effect of bimetallic sites, the V/Fe structure (VFe/NC) anchored on N-doped carbon showed higher NH3 yield and Faradaic efficiency among the M/Fe (M=Sc, Ti, V, Cr, Mn, Co, Ni) series [4]. Crucially, the extent of this synergy is highly dependent on the interatomic distance. Variations in the spacing between the two metal atoms can significantly alter the overall catalytic performance. Such geometric tunability is particularly vital for homonuclear metal pairs, where optimized electronic and structural configurations can drastically enhance both activity and selectivity [5]. Zhang et al. found that a shorter Ir–Ir bond length leads to a higher transition-state barrier. As a result, Co atom migration on the crystal surface becomes more difficult, which improves stability and favors catalytic performance in acidic media [6]. Consequently, optimizing the interatomic spacing is critical. For example, a properly spaced Pd–Cu diatomic catalyst supported on N-doped hollow carbon achieved a significantly higher NH3 yield (94%) compared to widely dispersed Pd and Cu single atoms (79%), underscoring the importance of spatial proximity between active centers. In addition, the catalyst shows high selectivity and an ultralow Pd loading (2 ppm) [7]. The effect of double-atom distance on catalytic performance has attracted attention, and the distance enhancement effect is widely discussed; Zhang et al. suggested that an optimal distance can enhance electron transfer between metal atoms. It can also stabilize reaction intermediates by providing favorable interaction geometry and reduce the activation energy barrier [5]. However, in the reviewed literature, the so-called “closely positioned” double atoms are often separated by carbon atoms when the distance increases. Therefore, they are not strictly adjacent and are usually heteronuclear metal pairs [8]. Such instances are not confined to the literature cited in this review; similar findings have been reported in numerous other studies [8,9,10,11,12,13,14,15]. At present, systematic computational data evaluating the effect of homonuclear double-metal distance on nitrogen reduction reaction performance are still lacking. Therefore, this study systematically investigates the influence of interatomic distance between two transition metal atoms on N2 activation.
Isolated metal atoms lack stability, so choosing an appropriate substrate is critical. 1,10-Phenanthroline is a planar and rigid molecule composed of three fused six-membered aromatic rings, which provide high structural stability. In addition, it contains two adjacent nitrogen atoms with coordination ability [16]. These two N atoms can coordinate with a metal atom to form two bonds. Therefore, 1,10-phenanthroline acts as a bidentate ligand and can form stable complexes with metals. FeII(dmp)2(NCS)2(dmp = 2,9–dimethyl–1,10-phenanthroline), which contains two 1,10-phenanthroline ligands, shows excellent catalytic performance in the CO2 reduction reaction [17]. Moreover, studies have shown that 1,10-phenanthroline as a support enables iron–based catalysts to exhibit surprised reactivity and selectivity in the hydrosilylation of alkenes [18]. Therefore, in this study, 1,10-phenanthroline was selected as the substrate.
2. Results and Discussion
2.1. Geometric Structure and Stability of M2–Phen2
First, the system of a single phenanthroline molecule chelating a metal atom, namely Ti–Phen and Fe–Phen, was calculated. The stable configuration obtained after structural optimization is shown in Figure 1a. Furthermore, the energy results for spin multiplicities MS = 1, 3, 5, and 7 in both systems (Table S1) indicate that the lowest energy is attained in the pentastable (MS = 5) state.
Figure 1.
(a) Ti–Phen and Fe–Phen; (b) Ti2–Phen2 (dTi–Ti = 2.63 Å); (c) Fe2–Phen2 (dFe–Fe = 2.26 Å).
According to Formula (3) (presented later in Section 3), the binding energies between M and Phen were calculated to be –2.84 and –1.82 eV, respectively. This indicates that Phen can stably chelate a Ti or Fe atom.
In our study, we constructed the dimer M2–Phen2 using two M–Phen units to investigate N2 adsorption and the NRR on metallic diatomic active sites. The optimized stable configurations of this structure are shown in Figure 1b,c. Both the Ti2–Phen2 and Fe2–Phen2 complexes exhibit a “bridged” spatial configuration. In these frameworks, adjacent phenanthroline molecules act as ligands, coordinating with the central bimetallic atom to form a stable bridging structure.
Although our computational model focuses purely on the M2–Phen2 core to highlight the intrinsic catalytic activity, such binuclear frameworks genuinely exist in experimental coordination chemistry, typically stabilized by bridging ligands (e.g., hydroxo). For example, X-ray crystallographic studies have confirmed that similar bimetallic frameworks exhibit M–M distances in the range of 2.7–2.9 Å, such as the binuclear manganese complex (~2.73 Å) [19] and a copper complex (~2.86 Å) [20]. These experimental distances align well with the structural parameters of our constructed M2–Phen2 models (e.g., dTi−Ti = 2.63 Å and the optimal scanned distance of 2.9 Å), validating the physical feasibility of the selected bimetallic distances in this work.
The ground-state spin multiplicities for Ti2–Phen2 and Fe2–Phen2 are determined to be 3 and 7, respectively. That is, each Ti atom has one unpaired electron, while each Fe atom has three unpaired electrons. By using Formula (3), the binding energies of the two M–Phen monomers were determined to be −1.47 eV and −2.04 eV, respectively. These negative values demonstrate that the two monomers can stably assemble into a diatomic active center. Alternatively, M2 can be treated as the catalytically active center, with the two Phen molecules serving as supporting substrates. On this basis, the binding energies between M2 and the corresponding substrates were calculated to be −4.52 eV and −3.83 eV, respectively. These results further confirm that M2 can be stably anchored onto the substrates.
In Ti2–Phen2, the Ti–Ti bond length is 2.63 Å, which is approximately 0.7 Å longer than that of the free Ti2 molecule (1.90 Å). However, the Fe–Fe bond length in Fe2–Phen2 (2.26 Å) increases by less than 0.3 Å compared to the free Fe2 molecule (2.01 Å). The bond lengths of the aforementioned molecules were all calculated using the TPSS functional and Def2–TZVP basis set, and the computed results for the free Ti2 and Fe2 molecules are in close agreement with experimental values [21,22,23,24,25]. These results indicate that the bonding interaction between M and phenanthroline weakens the M–M interaction, thereby leading to an increase in the M–M interatomic distance. Based on the calculated binding energy values Eb(M–Phen), the strength of the Ti–phenanthroline bond is significantly higher than that of the Fe–containing system (approximately 1 eV stronger than Fe), resulting in a more pronounced weakening of the Ti–Ti bond in Ti2–Phen2 and thus a more remarkable increase in the dTi–Ti distance. The optimal spin states of the free M2 species in this study were determined from the calculated energy results, where the optimal spin multiplicity of Ti2 was 3 and that of Fe2 was 7, both corresponding to the most stable configurations with the lowest energy (Table S3).
This work mainly focuses on the effect of different M–M interatomic distances in the active center on N2 adsorption and NRR activity. Therefore, starting from the optimized M2–Phen2 configuration, we performed rigid scans of the total energy at different M–M interatomic distances (Figure 2). To achieve single-variable control and reduce other factors’ influence, when increasing or decreasing the M–M distance, the two Phen molecules were horizontally translated together with the metal atoms. Meanwhile, the angle between the two Phen molecules was kept constant. In this way, other effects caused by substrate structural changes were avoided. In the subsequent studies of N2 adsorption and NRR catalysis, the spatial configuration of M2–Phen2 was fixed. This ensures that the comparison among systems with different M–M interatomic distances is carried out under a relatively consistent ligand environment. Thus, the study can focus on the key factor, namely the M–M interatomic distance.
Figure 2.
The relative single-point energy of the M2–Phen2 system at different M–M interatomic distances.
The Ti2–Phen2 system exhibits the lowest energy in the s = 3 spin state. Taking this global minimum as the reference, the relative energy (Erel) was plotted as a function of the Ti–Ti distance for different spin multiplicities. At MS = 3, the scanning curve was divided into two segments (labeled 3 and 3′ in the Figure 2), which correspond to two different electronic states. These two electronic states cross at around 2.5 Å. As the M–M interatomic distance changes, it can not only alter the relative energies of different electronic states within the same multiplicity, but also lead to an inversion of energies between different spin multiplicities. Therefore, we also performed structural scans for MS = 1 (closed-shell) and MS = 5. At MS = 1, the system energy was generally high (Erel > 0.5 eV). At MS = 5, the energy is only slightly higher than that of MS = 3, typically within about 0.2 eV at the same interatomic distance. Notably, when dTi–Ti > 3.4 Å, a spin-state inversion occurs, and MS = 5 becomes the lowest-energy state. For the Fe2–Phen2 system, the most stable configuration has MS = 7. Using this state as the reference, similar scanning calculations were performed as in the Ti system (Figure 2). Within the scanned Fe–Fe interatomic distance range (1.7–4.0 Å), MS = 7 includes two different electronic states, and the transition between them occurs near 2.7 Å. Structural scans were also performed for other spin multiplicities (MS = 3, 5, and 9). Within the calculated interatomic distance range, MS = 7 always had the lowest energy.
2.2. Adsorption and Activation of N2
2.2.1. The Configuration of N2@M2–Phen2
In M2–Phen2, N2 can be adsorbed in multiple possible configurations. In our work, we performed structural optimizations for four possible adsorption configurations (Figure 3) under different M–M interatomic distances. According to the calculated energy data (Tables S4 and S5 and Figure S1 in the Supplementary Materials), Configuration 1 (side-on:side-on) is the most stable over a wide range of Ti–Ti interatomic distances from 2.3 to 3.5 Å in Ti2–Phen2. At 2.1 and 2.2 Å (below 2.3 Å), configuration 2 (end-on:side-on) is the most stable. Configurations 3 and 4 either optimize to other unstable structures or exhibit relatively high energies in all tests. The most stable configuration of Fe2–Phen2 is configuration 1 in the Fe–Fe interatomic distance range of 2.1–3.3 Å. Only when the interatomic distance is further elongated to 3.4 and 3.5 Å does configuration 2 become more stable (Figure S1). We found that configuration 1, which exhibits C2v symmetry, is generally the most stable for both Ti and Fe systems studied here. To facilitate a comparative study of the effect of different M–M interatomic distances on N2 activation and the NRR, only configuration 1 will be considered for N2 adsorption in subsequent calculations.
Figure 3.
Four possible adsorption configurations of N2 on M2–Phen2, taking Ti2–Phen2 as an example.
2.2.2. N2@Ti2–Phen2
Figure 4 displays the energy variation of the N2@Ti2–Phen2 system at different Ti–Ti bond lengths, with energy values reflecting the relative stability of the system. In the calculations, three cases with spin multiplicities (MS) of 1, 3, and 5 were considered. The computational results indicate that the system achieves its lowest energy state at MS = 3 and a Ti–Ti bond length of 2.7 Å, denoted as d2,Ti. All relative energy values shown in the figure are calculated relative to this state.
Figure 4.
The relative energy of N2@Ti2–Phen2 at different Ti–Ti interatomic distances.
Figure 4 also shows that the energy corresponding to spin multiplicity MS = 5 is generally higher, while MS = 1 and MS = 3 exhibit lower energies with a small overall difference (<0.2 eV). As the Ti–Ti interatomic distance varies, the energy curves for MS = 1 and MS = 3 intersect, with each becoming the lower-energy state in different interatomic distance regions. This indicates that the system’s spin multiplicity undergoes a transition with changes in Ti–Ti distance. Notably, the MS = 1 energy curve is composed of two continuous segments near distinct minima (dTi–Ti ≈ 2.6 Å and 3.0 Å), with a pronounced inflection point near dTi–Ti ≈ 2.75 Å. This suggests the curve may correspond to two distinct electronic potential energy surfaces, with electronic state crossing occurring near this interatomic distance.
The N–N bond length (dN–N) is an important parameter for assessing the activation level of nitrogen. Figure 5 shows the N–N bond lengths of N2 molecules adsorbed on Ti2–Phen2 at different Ti–Ti bond lengths, considering two spin multiplicities in the calculations: MS = 1 and MS = 3.
Figure 5.
The N–N bond length of N2@Ti2–Phen2 at different Ti–Ti interatomic distances. Notes: The dashed line represents the reference value for the N–N single bond length [26].
The N–N bond lengths in the N2@Ti2–Phen2 system range from 1.41 to 1.55 Å, close to the experimental value for N–N single bonds (1.45 Å). This range is significantly higher than the typical N=N and N≡N bond lengths (1.24 Å and 1.13 Å [26]), indicating that nitrogen is effectively activated after adsorption on Ti2–Phen2. The activation is most significant at dTi–Ti = 2.8 Å when MS = 1, with dN–N reaching 1.55 Å, while at MS = 3, the maximum dN–N value of 1.47 Å is obtained at dTi–Ti = 3.1 Å.
The overall difference between dN–N under the two spin multiplicity conditions is small. When dTi–Ti < 2.75 Å, the triplet state (MS = 3) has a larger dN–N than the singlet state (MS = 1); when dTi–Ti > 2.75 Å, the singlet state has a larger dN–N. Furthermore, the curve corresponding to MS = 3 is smoother, while the curve for MS = 1 shows an abrupt change near dTi–Ti ≈ 2.75 Å, further indicating that an electronic state transition occurs at this point.
2.2.3. Calculation of Adsorption Energy for N2@Ti2–Phen2
The adsorption strength of N2 on the active site of the catalyst determines the stability of N2 on the surface, which is a prerequisite for NRR. First, the total adsorption energy and the pure electron adsorption energy of nitrogen adsorption are calculated:
Among them, is the total energy of the N2 adsorption system when dTi–Ti = R, E(N2) is the energy of the free N2 molecule, and the energy of M2–Phen2 is taken as the energy at its equilibrium bond length R0 before N2 adsorption, or the energy when the M–M atom spacing is fixed to the scanning distance R.
The total adsorption energy is the sum of the pure electronic adsorption energy and the distortion energy. The distortion energy is defined as the relative energy of the substrate at dTi–Ti = R compared to that at dTi–Ti = R0. In short, the distortion energy is the structural deformation energy of the substrate. For simplicity, the total adsorption energy and the pure electronic adsorption energy are denoted as Ead_R0 and Ead_R, respectively, in the following text. Ead_R0 reflects the relative energy of the adsorption system at different dTi–Ti values. In contrast, Ead_R can reflect the effect of changes in dTi–Ti on Ti2–Phen2 nitrogen activation at the electronic level, while ignoring the influence of substrate structural deformation. The calculation results are as follows:
Figure 6a shows that as the Ti–Ti distance increases from 2.3 Å, the total energy of the N2@Ti2–Phen2 system gradually decreases, accompanied by a decrease in Ead_R0. Meanwhile, Ead_R decreases synchronously. When dTi–Ti < 2.7 Å, Ead_R0 and Ead_R are very close (difference < 0.1 eV). This indicates that the distortion energy of the substrate is small, and Ead_R0 is dominated by Ead_R. Combined with Figure 1 and Figure 2, this is attributed to the equilibrium bond length R0 = 2.63 Å of the Ti2–Phen2 system. Furthermore, an electronic state transition occurs when dTi–Ti < 2.5 Å, resulting in relatively low energy within this range. The N2 activation ability of Ti2–Phen2 enhances with increasing Ti–Ti distance, as evidenced by the concurrent increase in N–N bond length shown in Figure 6b. As the Ti–Ti distance continues to increase, the elongation of the N–N bond and the decrease in Ead_R suggest that the N2 activation ability of Ti2–Phen2 keeps increasing. However, a turning point is observed at dTi–Ti = 2.9 Å. At this point, the distortion energy of Ti2–Phen2 increases rapidly, causing Ead_R0 to rise and the N2 adsorption to weaken. Additionally, due to the excessive elongation of the Ti–Ti distance, the adsorption configuration of N2@Ti2–Phen2 changes slightly, with the adsorbed N2 moving closer to Ti–Ti. Consequently, the N–N bond length in Figure 6b begins to decrease when dTi–Ti > 2.9 Å.
Figure 6.
(a) Two types of adsorption energies (eV) and (b) N–N bond lengths (Å) of the N2@Ti2–Phen2 system as a function of the Ti–Ti distance.
Overall, Ead_R0 in Figure 6a reflects the thermodynamic stability of the N2@Ti2–Phen2 system, incorporating the distortion energy associated with Ti–Ti interatomic distance variations. The Ead_R0 curve initially decreases and then increases, indicating that the most stable adsorption state corresponds to a specific interatomic distance of 2.7 Å. Furthermore, a comparison between Figure 6a,b reveals a correlation between the total adsorption energy and dN–N. Generally, a larger absolute value of Ead_R0 corresponds to a longer dN–N and a higher degree of N–N activation. For instance, at dTi–Ti = 2.3 Å, the absolute value of the total adsorption energy is minimal, corresponding to the shortest dN–N. At dTi–Ti = 2.7 Å, the absolute value of the total adsorption energy reaches its maximum, corresponding to a significantly elongated dN–N. When dTi–Ti = 2.9 Å, dN–N reaches its maximum value of 1.54 Å, and the absolute value of the total adsorption energy is also at a local maximum. Although they show an overall positive trend, their variations are not entirely consistent (e.g., the maximum adsorption energy does not correspond to the maximum interatomic distance). Therefore, it is difficult to fit the data well with a simple linear or quadratic function. Notably, as the Ti–Ti distance continues to elongate, the total adsorption energy increases (i.e., becomes less stable), while the N–N bond length decreases.
Unlike the trend of total adsorption energy, the pure electronic adsorption energy (Ead_R) gradually decreases as the Ti–Ti distance increases. This means that the adsorption ability of Ti2–Phen2 for N2 enhances with Ti–Ti elongation. In Ti2–Phen2, increasing the Ti–Ti distance is intrinsically favorable for N2 activation at the electronic level. The reason why increasing the Ti–Ti distance favors N2 activation can be explained by the d-band center theory. Increasing the Ti–Ti distance reduces titanium atoms’ orbital overlap, resulting in narrower d bands and a shift in the d band center upwards relative to the Fermi level. It brings the titanium’s electron levels closer to the π orbitals of N2, enhancing the back–donation of electrons from the metal to the N2 π orbitals. Consequently, this weakens the N≡N bond and promotes nitrogen activation.
The Sabatier principle states that the strength of interaction between the catalyst and the reactants must be moderate [27]. If the interaction is too strong, product desorption becomes difficult. If it is too weak, the reactants cannot effectively bind to the catalyst. Figure 6a indicates that although electron–based analysis indicates that stretching the Ti–Ti bond distance enhances N2 activation, the total adsorption energy reveals that when the Ti–Ti distance is excessively stretched, the distortion energy becomes predominant. Consequently, the N2@Ti2–Phen2 system becomes unstable, a result consistent with the Sabatier principle. Based on the above analysis, it is evident that the activation of N2 by Ti2–Phen2 is influenced by the Ti–Ti spacing, with an optimal Ti–Ti spacing existing. Furthermore, analysis of the total adsorption energy and pure electronic adsorption energy at the optimal Ti–Ti spacing reveals that, under the influence of distortion energy, the optimal Ti–Ti spacing decreases for the same adsorption configuration. The results reveal that if the distortion energy of the substrate can be effectively eliminated at a Ti–Ti spacing of 3.3 Å under experimental conditions, while maintaining the side-on:side-on adsorption configuration, the activation of N2 molecules by the dual–Ti atoms on the substrate could be maximized.
2.2.4. N2@Fe2–Phen2
As shown in Figure 7, the energy curve of N2@Fe2–Phen2 with regard to the Fe–Fe distance exhibits a shape similar to that of a quadratic function curve. However, the steepness of the energy curve on either side of Figure 7 differs, with the left side being markedly steeper. This is because as the Fe–Fe spacing decreases, molecular repulsion within the system becomes dominant, leading to reduced stability and increased total energy for N2@Fe2–Phen2. The reason for the upward shift on the right side of the curve in Figure 7 is that the excessive Fe–Fe spacing weakens the adsorption capacity of N2, thereby reducing the stability of the N2@Fe2–Phen2 system and increasing its total energy. It is noteworthy that when the Fe–Fe distance is extended to 3.4 Å, the end-on:side-on adsorption configuration exhibits a lower system energy than side-on:side-on configuration (Table S5).
Figure 7.
The relative energy of N2@Fe2–Phen2 at different Fe–Fe interatomic distances.
Figure 7 displays the energy–interatomic distance curves calculated under different spin multiplicity conditions. It is observed that the optimal spin multiplicity for the N2@Fe2–Phen2 system is 5. Due to differences in the electron configurations of the outermost and penultimate shells of Fe and Ti atoms, the optimal spin multiplicities for the corresponding M2–Phen2 systems vary. For N2@Fe2–Phen2, the system with an Fe–Fe interatomic distance of 2.3 Å is thermodynamically the most stable within the energy curve of the optimal spin multiplicity of 5. Notably, the shape of the total energy curve for the N2@Fe2–Phen2 system with a spin multiplicity of 3 is altered due to a change in the electronic state near 2.6 Å. Furthermore, calculations indicate a transition in the optimal configuration near an Fe–Fe spacing of 3.4 Å (Figure S1). However, since Configuration 1 is the primary focus of this study and to ensure analytical consistency, all adsorption energy calculations in this paper are based on Configuration 1.
2.2.5. Calculation of Adsorption Energy for N2@Fe2–Phen2
To systematically investigate the effect of the Fe–Fe spatial separation on N2 activation, a series of constrained optimizations were performed. Specifically, the two individual Fe–Phen units were treated as rigid bodies and translated along the Fe–Fe axis to achieve different Fe–Fe distances. At each designated distance, the entire Fe2–Phen2 framework was fixed, while only the adsorbed N2 molecule was allowed to fully relax. Based on the analysis of the adsorption energy curves in Figure 8a, the total adsorption energy initially decreases and then increases as the Fe–Fe interatomic distance expands. Notably, the pure electronic adsorption energy continuously decreases with the elongation of the Fe–Fe bond when the length is below 3.3 Å. This suggests that, under the theoretical assumption where structural deformation of the bis (1,10-phenanthroline) framework is ignored, increasing the spacing between dual-metal Fe atoms promotes N2 activation. However, this promotional effect is not infinite and an optimal interatomic distance range exists. Specifically, when the Fe–Fe interatomic distance exceeds 3.3 Å, the N2 activation ability of the Fe2–Phen2 system declines, and the optimal N2 adsorption configuration shifts from side-on:side-on to end-on:side-on (Figure S1). Furthermore, the pure electronic adsorption energy curve reveals that if the distortion energy of the substrate can be effectively eliminated at an Fe–Fe atomic distance of 3.3 Å under experimental conditions—while maintaining the side-on:side-on configuration—the activation of N2 molecules by the dual-metal Fe atoms on the substrate would be maximized. This provides key theoretical guidance for designing efficient dual-metal Fe-based catalysts for N2 activation: by regulating substrate geometric parameters (such as the distance between dual-metal atoms), active sites can be precisely optimized to achieve efficient N2 activation and conversion.
Figure 8.
(a) Curves of total (Ead_R0) and pure electronic (Ead_R) adsorption energies for N2@Fe2–Phen2 and N–N bond lengths (Å) of the N2@Fe2–Phen2 system as a function of the Fe–Fe distance. (b) Correlation between N–N bond length and total adsorption energy. (c) Correlation between pure electronic adsorption energy and N–N bond length. Note: At each specified Fe–Fe distance, the data were obtained by fixing the Fe2–Phen2 fragment while allowing the N2 molecule to fully relax.
Figure 8a displays that the activation of the N–N bond is highest when the Fe–Fe distance is 2.8 Å in the N2@Fe2–Phen2 system. When the Fe–Fe distance exceeds 2.8 Å, the N–N bond length decreases with increasing Fe–Fe distance. The absolute value of the total adsorption energy, the pure electronic adsorption energy, and the N–N bond length show similar trends. The trends in the above three variables exhibit a clear correlation, which is why Figure 8b and c are drawn for further analysis. Figure 8b displays that the total adsorption energy of the N2@Fe2–Phen2 system is significantly negatively correlated with the N–N bond length. When the Fe–Fe distance exceeds 2.8 Å, the orbital overlap between the Fe sites and the N2 molecule slowly decreases. This is consistent with the d-band center theory. At the same time, excessive stretching causes distortion energy to increase significantly. Together, these factors make the total adsorption energy rise. In this Fe–Fe distance range, the N–N bond of the N2 molecule is excessively stretched, and the energy dissipation induced by its severe deformation leads to a decrease in activation efficiency, making it impossible to achieve efficient cleavage and conversion of the N≡N bond.
Figure 8c clearly demonstrates that as the degree of N2 activation in N2@Fe2–Phen2 decreases—specifically, as the N–N bond length shortens—the pure electronic adsorption energy gradually decreases. This is because the shortening of the N–N bond raises the energy of the antibonding π* orbital, increasing the energy gap between the d-orbitals of the catalyst metal and the N2 antibonding π* orbital. Consequently, it becomes difficult for electrons to fill the antibonding orbitals, resulting in a decrease in pure electronic adsorption energy. Furthermore, the shortening of the N–N bond stabilizes the N2 molecule and increases its ionization energy, further hindering electron transfer from N2 to the catalyst, which also contributes to the decrease in pure electronic adsorption energy.
2.2.6. Analysis of the N–N Bond Length in N2@M2–Phen2
The figure illustrates the N–N bond lengths of N2 adsorbed on the Fe2–Phen2 and Ti2–Phen2 systems. Notably, the bond length curves for both systems significantly exceed that of the isolated N2 molecule (1.13 Å), indicating that M2–Phen2 possesses effective N2 activation capability. From Figure 9, it is observed that the N–N bond length in the Ti2–Phen2 system is closer to the value of an N–N single bond (1.45 Å), whereas the N–N bond length in the Fe2–Phen2 system aligns more closely with the value of an N=N double bond (1.24 Å). Therefore, Ti2–Phen2 exhibits a stronger capability for N2 activation.
Figure 9.
The N–N bond length of N2@M2–Phen2 at different M–M interatomic distances.
2.3. NRR Mechanism and Energetics
2.3.1. The Effect of M–M Atomic Spacing on the NRR Path
While catalyst activation of nitrogen molecules is crucial, the actual difficulty of nitrogen reduction reactions is governed by the energy difference in the rate-determining step (RDS) [28]. For the side-on:side-on adsorption configuration of nitrogen molecules in the N2@M2–Phen2 system, this study draws inspiration from the non–dissociative mechanism of biological nitrogenase enzymes [29,30] to conduct parallel investigations into two reaction pathways: the Consecutive Path and the Enzymatic Path (Figure 10 and Figure 11).
Figure 10.
Schematic illustration of the possible NRR pathways. Notes: The asterisk (*) denotes adsorbed species on the catalyst surface (e.g., *N2, *NNH, *NNH2).
Figure 11.
Energy diagrams for NRR on M2–Phen2 (M=Ti, Fe) via consecutive and enzymatic pathways with varying M–M interatomic distances. Notes: The asterisk (*) denotes adsorbed species on the catalyst surface (e.g., *N2, *NNH, *NNH2).
To accurately evaluate the energy evolution during the reaction, the Computational Hydrogen Electrode (CHE) model [31] was employed. In calculating the relative energy for each reaction step, gaseous H2, N2 and NH3 molecules were introduced with appropriate stoichiometric ratios as computational references, ensuring strict mass balance (atom conservation) throughout the entire reaction coordinate (detailed elementary equations for each step are provided in Equation (S1) of the Supplementary Materials).
This study investigates the effect of M–M interatomic distances (M=Ti, Fe) in bimetallic centers on the nitrogen reduction reaction (NRR). The Ti2–Phen2 system was first analyzed. The NRR pathway was calculated at a Ti–Ti interatomic distance of 2.6 Å, derived from the rounded Ti–Ti bond length in the free–optimized structure of Ti2–Phen2. Additionally, to establish a significantly different control system, subsequent NRR pathway calculations employed a Ti–Ti distance of 3.0 Å, differing by 0.4 Å from the previous value.
In Figure 11, calculations of the NRR pathway reveal that the Ti2–Phen2 system spontaneously adsorbs N2 at both Ti–Ti interatomic distances (2.6 Å and 3.0 Å). Furthermore, N2 adsorption occurs more readily and yields a more stable system when the Ti–Ti interatomic distance is 3.0 Å. Additionally, the reaction energy values for the adsorption of the first H atom on N2@Ti2–Phen2 are negative in both cases, indicating that the attack of the first H+ + e− on the N atom proceeds spontaneously; notably, this process is more favorable at a Ti–Ti bond length of 2.6 Å. By observing the Consecutive Path of the Ti2–Phen2 system, it can be found that when the Ti–Ti interatomic distance is 3.0 Å, the electronic energy difference in the elementary reaction *NNH3 → *N + NH3(g) is the highest. However, when considering the NRR rate-determining step, only the electrochemical step is considered. For the ammonia desorption step, it does not involve the electrochemical process, so it is not considered. In addition, the *NNH3 → *N + NH3(g) step will be affected by the solvent and interface environment in the actual experiment. For example, the solvation effect will significantly reduce the energy barrier of *NNH3 → *N + NH3(g) calculated in a vacuum environment [32,33,34]. Therefore, the energy barrier is significantly lower under actual electrochemical conditions, so this step is not considered as the rate-determining step. In addition, to ensure the stability of the molecular systems and the reliability of the rate-determining step selection for the nitrogen reduction reaction (NRR), this paper selected several key systems for frequency calculations. The calculation results confirm that the systems are stable (Table S7).
In summary, for both the Consecutive and Enzymatic pathways in the Ti2–Phen2 system, the rate-determining step (RDS) is the final step (*NH2 → *NH3) at both Ti–Ti distances (2.6 Å and 3.0 Å). Notably, the energy difference of the RDS for the 3.0 Å interatomic distance is approximately 0.3 eV lower than that of the 2.6 Å system. Regarding the Fe2–Phen2 system, the freely optimized Fe–Fe interatomic distance is approximately 2.3 Å. To ensure consistency in variable control, the same modulation strategy used for the Ti system was applied: The Fe–Fe distance was extended by 0.4 Å to construct a comparative system with an interatomic distance of 2.7 Å for NRR pathway calculations. The results indicate that the RDS for the Fe system remains the final step (*NH2 → *NH3), with the energy difference increasing as the Fe–Fe interatomic distance expands. However, in contrast to the significant energy difference shifts observed in the Ti system, the variation in the RDS difference for the Fe system is considerably smaller; specifically, the electronic energy difference for the 2.7 Å interatomic distance is 0.17 eV higher than that of the 2.3 Å system.
Furthermore, Table S6 compares the electronic energy differences of the rate-determining step (RDS), along with the second and third highest differences, for the Consecutive and Enzymatic pathways of the M2–Phen2 system, excluding NH3 desorption steps. Although the RDS differences—and thus the theoretical rates constrained by the RDS—are identical for both pathways, a comparison of the secondary and tertiary electronic energy differences reveals that those of the Consecutive Path are lower than those of the Enzymatic Path. This indicates that the Consecutive Path is kinetically more favorable overall, facilitating smoother intermediate transitions and potentially leading to a faster actual reaction rate.
In this study, comprehensive NRR pathway calculations were performed for Ti and Fe dual-metal M2–Phen2 systems (each with two distinct M–M atomic spacings). The results demonstrate that the RDS for all these systems consistently corresponds to the final elementary reaction step *NH2 → *NH3. Therefore, based on this consistent pattern, to simplify the computational workflow and enhance efficiency without compromising accuracy, subsequent electronic energy difference comparisons for M2–Phen2 systems with other interatomic distances will focus exclusively on calculating the final reaction step corresponding to the RDS (Table 1 and Table 2).
Table 1.
Calculated rate-determining steps (RDS) and corresponding electronic energy differences between the two states for the nitrogen reduction reaction on Ti2–Phen2 at various Ti–Ti interatomic distances (dTi–Ti in Å). Notes: The asterisk (*) denotes adsorbed species on the catalyst surface.
Table 2.
Calculated rate-determining steps (RDS) and corresponding electronic energy differences for the nitrogen reduction reaction on Fe2–Phen2 at various Fe–Fe interatomic distances (dFe–Fe in Å). Notes: The asterisk (*) denotes adsorbed species on the catalyst surface.
The magnitude of the rate-determining step (RDS) energy difference for the nitrogen reduction reaction (NRR) reflects the capability of the M2–Phen2 catalyst to activate N2 molecules and stabilize key intermediates. Previous calculations indicated that the RDS electronic energy difference is influenced by the M–M atomic spacing; however, the relationship could not be fully determined using only two distinct interatomic distances. Therefore, supplementary calculations were performed. Table 1 results indicate that the Ti2–Phen2 system exhibits the lowest RDS energy difference at a Ti–Ti interatomic distance of 2.9 Å, suggesting optimal NRR kinetic performance. Notably, Table 2 shows that the Fe2–Phen2 system achieves the lowest RDS energy difference at an Fe–Fe interatomic distance of 2.2 Å, corresponding to optimal kinetic performance.
2.3.2. Influence of Ti–Ti Interatomic Distance on Kinetics: Adsorption Analysis of *NH2 and *NH3
In order to further clarify the influence of Ti–Ti interatomic distance on the electronic reaction energy of the rate-determining step (*NH2 → *NH3), the adsorption energies of *NH2 and *NH3 under different Ti–Ti interatomic distances were calculated in this paper, to determine the bonding strength of *NH2 and *NH3 and their changing trend with the structural parameter of Ti–Ti interatomic distance, confirming the relationship between structure–adsorption–kinetics.
In Ti2–Phen2, the *NH2 of this system is relatively complex, as shown in Figure S2. At first, the energy of the system with s = 2 is lower. As the Ti–Ti interatomic distance increases, the optimal spin multiplicity of the system changes from 2 to 4, and finally to 6.
Figure 12 illustrates the variation in adsorption energies of *NH2 and *NH3 on Ti2–Phen2 as a function of the Ti–Ti interatomic distance. Notably, the fitted adsorption energy curve for the *NH3 system yields a minimal slope of –0.18, indicating that the Ti–Ti interatomic distance has a negligible impact on the adsorption energy of *NH3. However, the *NH2 system exhibits a contrasting trend, characterized by significant fluctuations in its adsorption energy curve. Therefore, the variation in the electronic reaction energy with respect to the Ti–Ti interatomic distance is primarily controlled by the NRR intermediate *NH2. This indicates that the *NH2 intermediate exerts a more significant influence on the Rate-determining step (RDS) within the Ti2–Phen2 system. Furthermore, the mechanism regarding the effect of the Ti–Ti interatomic distance on the RDS energy difference belongs to the *NH3 over-binding type.
Figure 12.
Adsorption energy of NH2@Ti2–Phen2, NH3@Ti2–Phen2. Notes: The asterisk (*) denotes adsorbed species on the catalyst surface.
Figure 13 illustrates the variation in adsorption energies of *NH2 and *NH3 on the Fe2–Phen2 system as a function of the Fe–Fe interatomic distance. Notably, the adsorption energy of the *NH3 system exhibits a linear relationship with the Fe–Fe interatomic distance, with a slope of –0.54. However, the correlation between adsorption energy and interatomic distance for the *NH2 system is closer to an inverse quadratic curve. Previous calculations indicated that the electronic energy difference in the Rate-determining step (RDS) first decreases and then increases with the variation of the Fe–Fe interatomic distance. Therefore, combining these results with the figure, it is evident that the variation in the energy difference is jointly influenced by the NRR intermediates *NH2 and *NH3. Consequently, the mechanism regarding the effect of the Fe–Fe interatomic distance on the RDS (*NH2 → *NH3) energy difference belongs to the “optimal difference type”.
Figure 13.
Adsorption energy of NH2@Fe2–Phen2, NH3@Fe2–Phen2. Notes: The asterisk (*) denotes adsorbed species on the catalyst surface.
2.4. Summary
As shown in Figure 14, the Ti–Ti interatomic distance corresponding to the lowest total energy of the Ti2–Phen2 system is 2.6 Å, whereas the optimal interatomic distance shifts to 2.7 Å upon N2 adsorption. This is because, in the pristine system with a Ti–Ti interatomic distance of 2.6 Å, the Ti–Ti bonding is strongest with optimal d–d orbital overlap, indicating that structural stability is dominant. However, to facilitate N2 adsorption, Ti2–Phen2 requires a weakening of the Ti–Ti bond to provide d-electrons for π-backdonation. Therefore, the optimal Ti–Ti distance changes from 2.6 Å for the catalyst to 2.7 Å during nitrogen adsorption.
Figure 14.
Relative single-point energies (Ti2–Phen2) and total energies (N2@Ti2–Phen2) are shown on the left axis, with rate-determining electronic energy differences between the two states on the right axis, plotted as a function of the Ti–Ti interatomic distance in the Ti2–Phen2 catalysts. Notes: The asterisk (*) denotes adsorbed species on the catalyst surface (e.g., *NH2, *NH3).
Regarding the Rate-determining step (RDS) of the NRR (*NH2 → *NH3), *NH2 is already highly reduced and only requires suitable electron–donating capacity from Ti2–Phen2. Consequently, a weaker Ti–Ti bond facilitates the adsorption of H atoms onto *NH2. In this state, the two Ti atoms in Ti2–Phen2 resemble two synergistic single-atom sites, resulting in *NH3 ultimately adsorbing on one of the Ti atoms. This indicates that for the Ti2–Phen2 catalyst, the optimal metal–metal distance for reaction kinetics is longer than that for adsorption thermodynamics.
In summary, a shorter Ti–Ti distance (2.6 Å) favors structural stability but limits electronic flexibility for nitrogen activation. Moderate elongation (2.7 Å) optimizes nitrogen adsorption via enhanced π–backdonation, while further elongation (2.9 Å) lowers the energy difference of the RDS (*NH2 → *NH3). Notably, the elongation of the Ti–Ti distance gradually transforms the structurally stable catalyst into one that is more favorable for nitrogen activation and the NRR.
As shown in Figure 15, the thermodynamically stable configuration of the Fe2–Phen2 dual-metal system corresponds to a Fe–Fe interatomic distance of 2.3 Å, where the isolated catalyst exhibits the lowest single-point energy. Upon N2 adsorption, the total energy remains minimal at the Fe–Fe interatomic distance of 2.3 Å. Notably, this indicates that this interatomic distance is not only the thermodynamically optimal distance for the intrinsic catalyst structure but also the most stable configuration for the N2@Fe2–Phen2 adsorption system. Distinct from the regulation pattern in the Ti2–Phen2 system, Fe2–Phen2 does not require elongation of the metal interatomic distance to achieve effective N2 activation. However, moderately shortening the Fe–Fe interatomic distance to 2.2 Å significantly lowers the energy difference of the nitrogen reduction reaction (NRR), thereby optimizing catalytic performance. In Figure 14 and Figure 15, the minimum energy difference for the rate-determining step (RDS, *NH2 → *NH3) is (2.9 Å, 1.01 eV) for Ti2–Phen2 and (2.2 Å, 1.13 eV) for Fe2–Phen2. The Fe–Fe distance associated with the lowest RDS barrier is very close to the intrinsic minimum-energy Fe–Fe separation in the optimized catalyst. By contrast, the optimal catalytic Ti–Ti distance differs substantially from the optimized Ti–Ti separation.
Figure 15.
Relative single-point energies (Fe2–Phen2) and total energies (N2@Fe2–Phen2) are shown on the left axis, with the electronic reaction energy of rate-determining step on the right axis, plotted as a function of the Fe–Fe interatomic distance in the Fe2–Phen2 catalysts. Notes: The asterisk (*) denotes adsorbed species on the catalyst surface.
This observation highlights the importance of metal–substrate geometric matching for NRR activity, which arises from the degree of alignment between the catalyst’s intrinsic M–M separation and the optimum distance for catalysis [35]. The rigid phenanthroline framework naturally holds the Fe dimer at a distance favorable for synergistic N2 activation and intermediate transformation, leading to excellent geometric matching. For the Ti–Ti pair, however, its intrinsic optimum catalytic distance is incompatible with the structural restriction imposed by Phen, meaning phenanthroline is not an appropriate support for Ti–Ti dual-atom catalysts toward NRR.
These results suggest that the optimal M–M distance for NRR is governed mainly by the intrinsic nature of the bimetallic site, and can be further tuned by the substrate [36]. In practice, substrates with engineered cavities can be chosen to anchor metal pairs at their catalytically optimum distances, thus maximizing catalytic performance and connecting theoretical calculations with experimental catalyst design.
2.5. Electronic Structure Analysis
Previous research has confirmed that variations in the M–M interatomic distance significantly impact the electronic energy difference of the Rate-determining step (RDS) for the NRR. Therefore, to further elucidate the underlying mechanism of this structure–performance relationship at the electronic level, this section conducts a comparative analysis of HOMO–LUMO orbitals and electron clouds for two catalyst systems with distinct M–M interatomic distances.
As indicated in Table 3, with a Ti–Ti separation of 2.9 Å, the adsorption of *NH2 drastically reduces the HOMO–LUMO gap of the Ti2–Phen2 system from 0.40 eV to 0.12 eV—a clear sign of substantial catalyst activation. In contrast, when the Ti–Ti distance is extended to 3.4 Å, the system’s energy gap stays persistently below 0.1 eV and hardly responds to changes in the adsorbed species. Another key finding concerns the hydrogenation step from *NH2 to *NH3: the reaction energy for the 2.9 Å configuration (1.01 eV) is considerably lower than that for the 3.4 Å case (1.33 eV), implying that a shorter Ti–Ti spacing facilitates this transformation. Together, these observations highlight the superior electronic tunability and higher reactivity of the 2.9 Å arrangement during catalysis, underscoring the strong sensitivity of the Ti2–Phen2 catalyst’s electronic structure and reaction energetics to the Ti–Ti distance.
Table 3.
Calculated electronic properties and energetics of intermediates on Ti2–Phen2 at different Ti–Ti distances. The energy values ΔE correspond to the electronic reaction energy for the rate-determining step (*NH2 → *NH3) of NRR. “*” corresponds to Ti2–Phen2.
Based on Frontier Molecular Orbital (FMO) theory [37], the orbital contribution of adsorbed species in the HOMO directly reflects the interaction strength with the catalyst surface and electronic activity. For the Rate-determining step (RDS) of the NRR (*NH2 → *NH3), the electronic state of the N atom is crucial. As shown in Figure 16, as the Ti–Ti interatomic distance elongates from 2.9 Å to 3.4 Å, the charge distribution of the system undergoes significant rearrangement. Notably, the contribution of the N atom to the HOMO surges from 0.359% to 1.282%. This evolution of the electronic structure is attributed to the weakening of the metal–metal bonding; specifically, as the Ti–Ti bond elongates, electrons originally localized on the Ti–Ti bond are redistributed to populate the frontier orbitals of *NH2. However, although the increased contribution of the N atom in the HOMO implies higher electron density, it thermodynamically leads to “over-binding” of the *NH2 intermediate to the substrate, which significantly increases the energy difference required for its conversion to *NH3. Furthermore, the distinct localization of the HOMO in Figure 16b) confirms this excessive local interaction, which is unfavorable for the progression of the catalytic RDS.
Figure 16.
Comparison of frontier molecular orbitals and N–atom contributions of *NH2 under Ti–Ti distances of (a) 2.9 Å and (b) 3.4 Å (Isovalue = 0.02). Notes: The asterisk (*) denotes adsorbed species on the catalyst Ti2–Phen2 surface.
As shown in Figure 16, with the stretching of the Ti–Ti distance, the LUMO localized on the N atom shifts from a higher energy level to a lower one. This phenomenon indicates that electrons are more prone to transfer from the HOMO to the LUMO, resulting in the almost complete depletion of the previously enriched electrons on the N atom. This electron loss causes the system to fall into an over-stabilized state, which in turn hinders the subsequent hydrogenation step. In addition, it can be observed from Table 3 that as the Ti–Ti distance increases, the HOMO–LUMO gap of the *NH3 system decreases, which means that the stability of the system deteriorates. Combining electronic energy difference calculations with HOMO–LUMO gap analysis, we identified a dual kinetic disadvantage of Ti–Ti bond stretching on the *NH2 → *NH3 reaction: First, excessive activation of *NH2, evidenced by the extremely narrow energy gap (0.05 eV) and significant HOMO contribution at 3.4 Å. Furthermore, Sabatier’s principle indicates that NH2@Ti2–Phen2 requires overcoming a higher electronic energy difference upon hydrogen addition. More critically, the electronic instability of NH3@Ti2–Phen2 manifests as an abnormal contraction of the HOMO–LUMO gap to 0.09 eV at dTi–Ti = 3.4 Å (significantly lower than 0.40 eV at dTi–Ti = 2.9 Å). This minuscule energy gap indicates that NH3@Ti2–Phen2 exhibits extreme electronic instability at a Ti–Ti interatomic distance of 3.4 Å. In summary, interatomic distance stretching within the 2.9–3.4 Å range of dTi–Ti not only traps NH2@Ti2–Phen2 in a deep potential well but also drastically reduces the electronic stability of NH3@Ti2–Phen2. This thermodynamic and electronic structural dilemma—characterized by “difficulty in escaping the starting point and instability at the endpoint”—collectively leads to a significant increase in the electronic reaction energy for the *NH2 → *NH3 hydrogenation step.
As shown in Table 4, when the Fe–Fe spacing is 2.2 Å, the HOMO–LUMO gap of NH2@Fe2–Phen2 (0.25 eV) is significantly smaller than that of Fe2–Phen2 itself (0.47 eV), indicating that the electronic structure of NH2@Fe2–Phen2 is effectively activated. In contrast, when the Fe–Fe spacing increases to 2.7 Å, the HOMO–LUMO gap of NH2@Fe2–Phen2 is significantly larger than that of Fe2–Phen2, which exhibits the opposite electronic response characteristics and suggests that its activity may be suppressed. More importantly, the electronic reaction energy of the rate-determining step *NH2 → *NH3 in the NRR shows that the electronic reaction energy at dFe–Fe = 2.2 Å (1.13 eV) is significantly lower than that at 2.7 Å (1.34 eV), indicating that a shorter Fe–Fe spacing within this range is favorable for this hydrogenation step. These results collectively demonstrate that the 2.2 Å configuration exhibits superior electronic activation and reaction kinetics advantages during the adsorption of catalytically active species, and that the electronic structure and reaction energy of the Fe2–Phen2 catalyst are sensitive to the Fe–Fe spacing.
Table 4.
Calculated electronic properties and energetics of intermediates on Fe2–Phen2 at different Fe–Fe distances. The energy values ΔE correspond to the electronic reaction energy for the rate-determining step (*NH2 → *NH3) of NRR. “*” corresponds to Fe2–Phen2.
A longitudinal comparison of Fe2–Phen2 revealed that the HOMO–LUMO gap of the catalyst Fe2–Phen2 decreased as the Fe–Fe interatomic distance increased from 2.2 Å to 2.7 Å. Furthermore, it is noteworthy that the HOMO–LUMO gap changes for * → *NH2 → *NH3 exhibited different trends at the two interatomic distances: at 2.2 Å, the gap first decreased and then increased, while at 2.7 Å, the gap first increased and then decreased. The catalyst is a highly conductive material. All in all, it effectively binds to and activates reaction intermediates (such as *NH2), promoting electron transfer.
Figure 17 indicates that the Fe–Fe interatomic distance in Fe2–Phen2 significantly influences the RDS (*NH2 → *NH3) electronic energy difference, with the minimum difference observed at dFe–Fe = 2.2 Å. Consequently, to elucidate the mechanism by which the Fe–Fe interatomic distance influences the RDS energy difference, this study conducted a comparative analysis of the electronic structure of NH2@Fe2–Phen2 under different Fe–Fe distances. The reactivity of NH2@Fe2–Phen2 is the decisive factor governing the feasibility of the *NH2 → *NH3 step. To clearly reveal the differences in electronic configuration at different interatomic distances, two representative Fe–Fe distances were selected: 2.2 Å, corresponding to the lowest RDS energy difference, and 2.7 Å, which exhibits the largest electronic reaction energy difference relative to 2.2 Å within the calculated range. By comparing the electron cloud density of the N atom in the HOMO at these two interatomic distances, the contribution of the N atom to the HOMO in the *NH2 system was analyzed. It is found that as the Fe–Fe interatomic distance increases from 2.2 Å to 2.7 Å, the contribution of the N atom to the frontier orbitals (from HOMO to HOMO-5) decreases overall. Therefore, elongation of the Fe–Fe bond within this range reduces the contribution of the N atom to the frontier orbitals, leading to a lower degree of N activation and consequently increasing the difficulty of the *NH2 → *NH3 transformation. In addition, the LUMO, LUMO + 1, and LUMO + 2 orbitals at two interatomic distances were plotted. For the Fe–Fe distance of 2.2 Å, although the LUMO and LUMO + 1 are mainly distributed on the Fe atoms and phenanthroline, the LUMO + 2 (0.28 eV above LUMO) shows highly localized electron density around the N atom. At the distance of 2.7 Å, it is the LUMO + 1 (only 0.12 eV above LUMO) that exhibits a concentrated distribution on the N atom. It can be observed that these near-frontier vacant orbitals are intensely distributed around the *NH2 at both distances, with the localization being more pronounced in the 2.2 Å system. This indicates that electrons can easily occupy these vacant orbitals, which is consistent with the small HOMO–LUMO gaps discussed earlier.
Figure 17.
Comparison of frontier molecular orbitals (HOMO and LUMO) and N–atom contributions of *NH2 under Fe–Fe distances of (a) 2.2 Å and (b) 2.7 Å (Isovalue = 0.02). Notes: The asterisk (*) denotes adsorbed species on the catalyst Fe2–Phen2 surface.
In short, comparing NH2@Ti2–Phen2 and NH2@Fe2–Phen2, it is observed that although the M–M interatomic distances in both systems originate from the M–M distances in the NRR rate-determining step (RDS) energy differences, the trends in nitrogen atom contributions to the highest occupied molecular orbital (HOMO) are opposite. In the NH2@Ti2–Phen2 system, the contribution of N atoms to the HOMO generally increases with the elongation of the Ti–Ti bond. Conversely, in the NH2@Fe2–Phen2 system, this contribution generally decreases with the elongation of the Fe–Fe bond. Furthermore, considering the electronic configurations (Ti: 3d24s2 and Fe: 3d64s2) and corresponding HOMO diagrams, the d electron count in the Ti–Ti bond is lower than that in the Fe–Fe bond. Consequently, when the Ti–Ti bond begins elongating beyond 2.9 Å, bond cleavage occurs, forcing electrons to flow toward the N atom and causing electron enrichment at that site. Meanwhile, Figure 12 above shows a decrease in adsorption energy, indicating enhanced NH2 adsorption. This suggests an increase in the electronic energy difference for the *NH2 → *NH3 reaction, implying that this excessively strong adsorption hinders subsequent hydrogenation reactions. In contrast, the Fe–Fe bond possesses more d electrons. At short distances, the repulsive forces between N atoms are strong. As the interatomic distance stretches from 2.2 Å, the electronic states of the N atoms adjust and stabilize at lower energy levels, reflecting the electronic rearrangement in NH2@Fe2–Phen2. As the Fe–Fe distance increases, the repulsion between the two Fe atoms weakens, stabilizing the NH2@Fe2–Phen2 system. Notably, this stabilization reduces the contribution of the nitrogen atom’s highest occupied molecular orbital (HOMO), making subsequent hydrogenation reactions more difficult and raising the electronic energy difference for the *NH2 → *NH3 transition.
Based on the above data, it is evident that for early transition metals like titanium, shorter intermetallic distances may favor N2 adsorption. Conversely, for late transition metals such as iron, moderately increasing the intermetallic distance may help modulate electron repulsion and optimize the electronic structure of active sites. This study precisely elucidates this intricate electronic rearrangement mechanism through frontier molecular orbital (FMO) analysis. Therefore, the fundamental reason for the opposite trends observed in nitrogen activation and reduction reactions between titanium and iron systems lies in the difference in d-electron distribution: titanium, with fewer d electrons, tends to direct electrons toward the adsorbed species during bond elongation; iron, with more d electrons, alleviates electron repulsion and stabilizes the system during bond elongation.
3. Materials and Methods
In this work, Gaussian 09 [38] and Multiwfn were used to study the effect of bimetallic (Ti, Fe) atomic spacing on nitrogen activation and nitrogen reduction reaction (NRR) in M2–Phen2 [39,40,41]. The Def2–TZVP basis set [42] and the TPSS functional [43] were used in the study. The TPSS functional was selected owing to its demonstrated excellence in prior studies, such as the activation of N2 by small metal clusters supported on summanene [44,45] and nitrogen reduction reactions involving C60 doped with one or two metal atoms [46].
First, the structure of two transition metal atoms supported on two phenanthroline ligands was optimized to obtain the optimal atomic distances and coordinates. The M–M (Ti, Fe) interatomic distances were adjusted in 0.1 Å increments (both shortened and elongated). Then, the single-point energy was calculated by using different spin multiplicities, and the corresponding energies and optimal spin multiplicities of different interatomic distances were obtained. Next, according to the structure obtained by setting the interatomic distance, the structure was fixed. Based on the fixed structure, nitrogen was adsorbed for restrictive optimization. Four adsorption configurations were evaluated. By comparing the energies, the most stable N2 adsorption structures at different M–M distances were determined. The energy of the gas-phase NH3 molecule was included in the final states to maintain mass balance throughout the NRR process. Additionally, the nitrogen reduction reaction pathways were calculated for these stable structures using the following formula:
In Formula (3), Eb represents the binding energy between A and B. In Formula (4), ΔE stands for the binding energy between M2–Phen2 and other molecular species. Etotal denotes the total energy of the M2–Phen2-adsorbed molecular species system, E(M2–Phen2) is the total energy of the metal atom system supported by double phenanthroline ligands, and Emole is the energy of the molecular species. When M2–Phen2 adsorbs nitrogen, Emole corresponds to the total energy of the nitrogen molecule. During the subsequent hydrogenation reaction, E(M2–Phen2) becomes E(NxHy−1@M2–Phen2), Etotal becomes E(NxHy@M2–Phen2), and Emole becomes 1/2 E(H2), namely half the energy of an H2 molecule.
4. Conclusions
This study employs density functional theory (DFT) to systematically investigate how variations in the M–M interatomic distance within M2–Phen2 (M=Ti, Fe) catalysts influence N2 activation and nitrogen reduction reaction (NRR) catalytic performance. Furthermore, since titanium and iron belong to the pre–transition and post–transition metals, respectively, differences in their electronic configurations and atomic radii mean that the effect of M–M interatomic spacing on the catalytic performance of M2–Phen2 will manifest differently in the corresponding systems of these two metals.
In our study, we investigate the relationship between the M–M interatomic distance and the single-point energy of M2–Phen2. In the Ti2–Phen2 system, as the Ti–Ti bond length increases, the single-point energy curve of Ti2–Phen2 undergoes transitions between different electronic states with the same spin multiplicity. After reaching the lowest single-point energy, the Ti–Ti bond continues to elongate, and the single-point energy begins to increase. Near dTi–Ti = 3.4 Å, an optimal spin multiplicity transition occurs, shifting from spin multiplicity 3 (corresponding to the preceding bond length) to spin multiplicity 5. In the Fe2–Phen2 system, as the Fe–Fe bond lengthens, the Fe2–Phen2 single-point energy first decreases and then increases. An electronic state transition occurs near dFe–Fe = 2.7 Å. Within the currently investigated range of Fe–Fe bond lengths, the optimal spin multiplicity of Fe2–Phen2 remains unchanged at 7.
Subsequent to analyzing the single-point energy of M2–Phen2, the effect of the change in M–M atomic spacing on the activation of nitrogen by M2–Phen2 was investigated. Firstly, the adsorption configuration of N2 was explored. It was found that the most stable configuration of N2@Ti2–Phen2 was the side-on:side-on configuration in the range of Ti–Ti bond lengths of 2.3–3.5 Å. The optimal configuration of N2@Fe2–Phen2 in the range of Fe–Fe bond lengths of 2.1–3.3 Å was the side-on:side-on configuration, and the optimal configuration changed to the end-on:side-on configuration near dFe–Fe = 3.4 Å. It can be seen that the side-on:side-on configuration appears as the best configuration in a considerable part of the bond length range. Therefore, in this paper, the adsorption of N2 by M2–Phen2 only considers the side-on:side-on configuration.
In the N2@Ti2–Phen2 system, with the increase in Ti–Ti bond length, the overall trend of the total adsorption energy appears to decrease first and then increase, and the minimum value is at dTi–Ti = 2.7 Å. Since the effect of distortion energy is not considered, the pure electron adsorption energy reaches a minimum until dTi–Ti = 3.3 Å. The length of the N–N bond in N2@Ti2–Phen2 increases first and then decreases with the elongation of the Ti–Ti bond, indicating that the degree of N2 activation in N2@Ti2–Phen2 increases first and then decreases. As for the N2@Fe2–Phen2 system, with the increase in Fe–Fe bond length, the total adsorption energy decreases first and then increases, and the minimum value is at dFe–Fe = 2.3 Å. Since the effect of distortion energy is not considered, the pure electron adsorption energy in the side-on:side-on configuration reaches a minimum until dFe–Fe = 3.3 Å. When the Fe–Fe bond continues to elongate beyond 2.8 Å, the total adsorption energy is significantly correlated with the N–N bond length. Both Ti2–Phen2 and Fe2–Phen2 have been well activated after nitrogen adsorption. The N–N bond after adsorption is longer than the N≡N bond length (1.13 Å) in N2, and the N–N bond length shows that Ti2–Phen2 has a better activation effect on N2 than Fe2–Phen2.
Last but not least, the effect of M–M interatomic spacing on the NRR catalyzed by M2–Phen2 was investigated. It was found that the NRR rate-determining step of M2–Phen2 was the last step, *NH2 → *NH3, and that the change in M–M atomic spacing would significantly affect the electronic reaction energy of the NRR rate-determining step. Based on the above investigations, other M–M bond lengths were selected and used to calculate and compare the energy differences in the last step of the NRR. It was found that when dTi–Ti = 2.9 Å and dFe–Fe = 2.2 Å, the NRR rate-determining step energy differences of M2–Phen2 (M=Ti, Fe) reached the minimum values, respectively.
All in all, the change in M–M atomic length will affect the nitrogen activation and nitrogen reduction reaction processes of M2–Phen2. Therefore, in future research on the catalytic process of bimetallic catalysts, the spacing between bimetallic atoms should also be considered as an influencing factor.
Supplementary Materials
The following supporting information can be downloaded at: https://www.mdpi.com/article/10.3390/catal16040292/s1, Table S1: Spin Multiplicity’s test of M–Phen; Table S2: Spin Multiplicity’s test of Ti2–Phen2 and Fe2–Phen2; Table S3: Spin Multiplicity’s test of M2; Table S4: Configuration Test of Ti2–Phen2; Table S5: Configuration Test of Fe2–Phen2; Figure S1: Total energy vs. Fe–Fe interatomic distance of N2@Fe2–Phen2 adsorption systems for side-on:side-on and end-on:side-on configurations; Equation (S1): The nitrogen reduction reaction equation; Table S6: The first, second, and third highest energy differences in the NRR path over M2–Phen2 catalysts; Figure S2: Total energy vs. Ti–Ti interatomic distance of NH2@Ti2–Phen2 for various spin states; Table S7: Calculated frequencies data (ΔG = Gibbs energy).
Author Contributions
Conceptualization, S.W. and X.D.; methodology, S.W. and X.D.; software, S.X.; validation, S.W. and H.Z.; formal analysis, S.W.; investigation, S.W. and S.M.; resources, S.X.; data curation, S.W.; writing—original draft preparation, S.W.; writing—review and editing, S.W., Y.C. and X.D.; visualization, S.W.; supervision, X.D.; project administration, X.D.; funding acquisition, X.D. All authors have read and agreed to the published version of the manuscript.
Funding
This research work did not receive any external funding.
Data Availability Statement
All data used in this study are true and complete and can be used to verify the research conclusions. If you need to obtain the relevant research data of this paper, you can submit reasonable inquiries to the corresponding author or the first author, and we will provide relevant data support within a reasonable scope.
Acknowledgments
The smooth completion of this paper is inseparable from the careful help and support of teachers and fellow students. Here, we sincerely thank the corresponding author Xunlei Ding for his careful guidance and overall supervision; his professional suggestions and selfless support have laid an important foundation for the completion of this paper. At the same time, we would like to thank all personnel who provided support and help for the research of this paper.
Conflicts of Interest
The authors declare no conflicts of interest.
References
- Hammer, B.; Nørskov, J.K. Theoretical surface science and catalysis—calculations and concepts. Adv. Catal. 2000, 45, 71–129. [Google Scholar] [CrossRef] [Scilit]
- Qiao, B.; Wang, A.; Yang, X.; Allard, L.F.; Jiang, Z.; Cui, Y.; Liu, J.; Li, J.; Zhang, T. Single-atom catalysis of CO oxidation using Pt1/FeOx. Nat. Chem. 2011, 3, 634–641. [Google Scholar] [CrossRef] [Scilit] [PubMed]
- Wang, Y.Y.; Ding, X.L.; Israel Gurti, J.; Chen, Y.; Li, W.; Wang, X.; Wang, W.J.; Deng, J.J. Non-Dissociative Activation of Chemisorbed Dinitrogen on One or Two Vanadium Atoms Supported by a Mo6S8 Cluster. ChemPhysChem 2021, 22, 1645–1654. [Google Scholar] [CrossRef] [Scilit] [PubMed]
- Wang, Y.; Wang, J.; Li, H.; Li, Y.; Li, J.; Wei, K.; Peng, F.; Gao, F. Nitrogen Reduction Reaction: Heteronuclear Double-Atom Electrocatalysts. Small Struct. 2023, 4, 2200306. [Google Scholar] [CrossRef] [Scilit]
- Zhang, M.; Cao, X.; Dong, J.; Zhu, X.; Zhu, Y.; Wang, L. Unveiling the Mystery of Precision Catalysis: Dual-Atom Catalysts Stealing the Spotlight. Small 2024, 21, e2409560. [Google Scholar] [CrossRef] [Scilit]
- Zhang, Z.; Jia, C.; Ma, P.; Feng, C.; Yang, J.; Huang, J.; Zheng, J.; Zuo, M.; Liu, M.; Zhou, S. Distance effect of single atoms on stability of cobalt oxide catalysts for acidic oxygen evolution. Nat. Commun. 2024, 15, 1767. [Google Scholar] [CrossRef] [Scilit]
- Sun, W.; Tang, Y.; Dong, H.; Sheng, T.; Xiao, Z.; Yin, Z.; Chen, Y.; Wang, L. Inter-Site Distance Engineering of Heteronuclear Pd─Cu Atomic Sites Enables High-Efficiency Cross-Coupling Reactions Through Atomic-Scale Locking Pockets. Adv. Funct. Mater. 2025, 35, e08858. [Google Scholar] [CrossRef] [Scilit]
- Liu, T.; Chen, Y.; Xu, A.; Liu, X.; Liu, D.; Li, S.; Huang, H.; Xu, L.; Jiang, S.; Luo, Q.; et al. Regulating atomic Fe-Rh site distance for efficient oxygen reduction reaction. Sci. China Chem. 2024, 67, 1352–1359. [Google Scholar] [CrossRef] [Scilit]
- Lee, C.H.; Pahari, S.; Sitapure, N.; Barteau, M.A.; Kwon, J.S.-I. DFT–kMC analysis for identifying novel bimetallic electrocatalysts for enhanced NRR performance by suppressing HER at ambient conditions via active-site separation. ACS Catal. 2022, 12, 15609–15617. [Google Scholar] [CrossRef] [Scilit]
- Fang, B.; Zhao, L.; Li, Y.; Yin, N.; Wang, X.; Jin, J.; Wang, W. Interfacial Engineering to Fabricate Nanoporous FeMo Bimetallic Nitride for Enhanced Electrochemical Ammonia Synthesis. Adv. Sci. 2025, 12, e2410805. [Google Scholar] [CrossRef] [Scilit]
- Barlocco, I.; Spotti, M.; Liberto, G.D.; Pacchioni, G. Electrochemical Nitrogen Reduction Reaction from Ab Initio Thermodynamics: Single versus Dual Atom Catalysts. Adv. Theory Simul. 2024, 7, 2400536. [Google Scholar] [CrossRef] [Scilit]
- Cao, R.; Xia, J.-Z.; Wu, Q. Computational Insight into Defective Boron Nitride Supported Double-Atom Catalysts for Electrochemical Nitrogen Reduction. Catalysts 2022, 12, 1404. [Google Scholar] [CrossRef] [Scilit]
- Wang, B.; Cheng, C.; Jin, M.; He, J.; Zhang, H.; Ren, W.; Li, J.; Wang, D.; Li, Y. A Site Distance Effect Induced by Reactant Molecule Matchup in Single-Atom Catalysts for Fenton-Like Reactions. Angew. Chem. Int. Ed. 2022, 134, e202207268. [Google Scholar] [CrossRef] [Scilit]
- Meng, X.; Ma, C.; Jiang, L.; Si, R.; Meng, X.; Tu, Y.; Yu, L.; Bao, X.; Deng, D. Distance synergy of MoS2-confined rhodium atoms for highly efficient hydrogen evolution. Angew. Chem. Int. Ed. 2020, 59, 10502–10507. [Google Scholar] [CrossRef] [Scilit]
- Zhang, H.; Wang, P.; Zhang, J.; Sun, Q.; He, Q.; He, X.; Chen, H.; Ji, H. Boosting the Catalase-Like Activity of SAzymes via Facile Tuning of the Distances between Neighboring Atoms in Single-Iron Sites. Angew. Chem. Int. Ed. 2024, 136, e202316779. [Google Scholar] [CrossRef] [Scilit]
- Qu, S.; Sun, C.; Yang, F.; Huang, H.; Du, S.; Jiang, T.; Zhang, Q.; Yan, L.; Lan, Z.; Yang, Y. Contextualized synthesis of phenanthroline-based isomeric linkers at heterointerfaces enables stable inverted perovskite solar cells. Matter 2026, 9, 102525. [Google Scholar] [CrossRef] [Scilit]
- Takeda, H.; Ohashi, K.; Sekine, A.; Ishitani, O. Photocatalytic CO2 reduction using Cu(I) photosensitizers with a Fe(II) catalyst. J. Am. Chem. Soc. 2016, 138, 4354–4357. [Google Scholar] [CrossRef] [Scilit]
- Hu, M.-Y.; He, Q.; Fan, S.-J.; Wang, Z.-C.; Liu, L.-Y.; Mu, Y.-J.; Peng, Q.; Zhu, S.-F. Ligands with 1,10-phenanthroline scaffold for highly regioselective iron-catalyzed alkene hydrosilylation. Nat. Commun. 2018, 9, 221. [Google Scholar] [CrossRef] [Scilit]
- Setifi, F.; Konieczny, P.; Glidewell, C.; Arefian, M.; Pelka, R.; Setifi, Z.; Mirzaei, M. Synthesis, structure, and magnetic properties of a dinuclear antiferromagnetically coupled iron(II) complex. J. Mol. Struct. 2017, 1149, 149–154. [Google Scholar] [CrossRef] [Scilit]
- Bol, J.E.; Driessen, W.L.; Reedijk, J. Synthesis and crystal structure of a dinuclear copper(II) complex with a novel tetrapyrazolyl macrocycle. J. Chem. Soc. Chem. Commun. 1995, 1365–1366. [Google Scholar] [CrossRef] [Scilit]
- Kalemos, A.; Mavridis, A. The electronic structure of Ti2 and Ti2+. J. Chem. Phys. 2011, 135, 134302. [Google Scholar] [CrossRef] [Scilit] [PubMed]
- Hoyer, C.E.; Manni, G.L.; Truhlar, D.G.; Gagliardi, L. Controversial electronic structures and energies of Fe2, Fe2+, and Fe2− resolved by RASPT2 calculations. J. Chem. Phys. 2014, 141, 204309. [Google Scholar] [CrossRef] [Scilit] [PubMed]
- Purdum, H.; Montano, P.A.; Shenoy, G.K.; Morrison, T. Extended-X-ray-absorption-fine-structure study of small Fe molecules isolated in solid neon. Phys. Rev. B 1982, 25, 4412–4417. [Google Scholar] [CrossRef] [Scilit]
- Schultz, N.E.; Zhao, Y.; Truhlar, D.G. Databases for Transition Element Bonding: Metal−Metal Bond Energies and Bond Lengths and Their Use To Test Hybrid, Hybrid Meta, and Meta Density Functionals and Generalized Gradient Approximations. J. Phys. Chem. A 2005, 109, 4388–4403. [Google Scholar] [CrossRef] [Scilit]
- Kalemos, A. Fe2: As simple as a Herculean labour. Neutral (Fe2), cationic (Fe2+), and anionic (Fe2−) species. J. Chem. Phys. 2015, 142, 244304. [Google Scholar] [CrossRef] [Scilit]
- Characteristic bond lengths in free molecules. In CRC Handbook of Chemistry and Physics, 90th ed.; Lide, D.R., Haynes, W.M., Eds.; CRC Press: Boca Raton, FL, USA, 2010; pp. 9–46. [Google Scholar]
- Sabatier, P. La Catalyse En Chimie Organique; Librairie Polytechnique: Paris, France, 1920. [Google Scholar]
- He, H.B.; Ding, X.L.; Wang, Y.Y.; Chen, Y.; Wang, M.M.; Chen, J.J.; Li, W. Catalysts with Trimetallic Sites on Graphene-like C2N for Electrocatalytic Nitrogen Reduction Reaction: A Theoretical Investigation. ChemPhysChem 2024, 25, e202400143. [Google Scholar] [CrossRef] [Scilit]
- Skulason, E.; Bligaard, T.; Gudmundsdóttir, S.; Studt, F.; Rossmeisl, J.; Abild-Pedersen, F.; Vegge, T.; Jónsson, H.; Nørskov, J.K. A theoretical evaluation of possible transition metal electro-catalysts for N2 reduction. Phys. Chem. Chem. Phys. 2012, 14, 1235–1245. [Google Scholar] [CrossRef] [Scilit] [PubMed]
- Su, Y.; Cheng, X.; Zhang, H. Theoretical screening of bis (iminothiolato) metal monolayers as single-atom electrocatalysts for nitrogen reduction. J. Mater. Chem. A 2025, 13, 36660–36667. [Google Scholar] [CrossRef] [Scilit]
- Nørskov, J.K.; Rossmeisl, J.; Logadottir, A.; Lindqvist, L.; Kitchin, J.R.; Bligaard, T.; Jónsson, H. Origin of the Overpotential for Oxygen Reduction at a Fuel-Cell Cathode. J. Phys. Chem. B 2004, 108, 17886–17892. [Google Scholar] [CrossRef] [Scilit]
- Shipman, M.A.; Symes, M.D. Recent progress towards the electrosynthesis of ammonia from sustainable resources. Catal. Today 2017, 286, 57–68. [Google Scholar] [CrossRef] [Scilit]
- Seefeldt, L.C.; Hoffman, B.M.; Dean, D.R. Mechanism of Mo-dependent nitrogenase. Annu. Rev. Biochem. 2009, 78, 701–722. [Google Scholar] [CrossRef] [Scilit]
- Li, L.; Xu, S.; Yan, Y.; Wang, M.; Chen, Y.; Chen, J.; Li, W.; Ding, X. Unique coordination of four-metal-atom clusters on C5N2H2 boosts nitrogen reduction reaction performance: A DFT study. Fuel 2026, 419, 138798. [Google Scholar] [CrossRef] [Scilit]
- Sharma, B.; Striegler, S. Nonionic Surfactant Blends to Control the Size of Microgels and Their Catalytic Performance during Glycoside Hydrolyses. ACS Catal. 2020, 10, 9458–9463. [Google Scholar] [CrossRef] [Scilit]
- Chen, Y.; Zhao, J.; Pan, X.; Li, L.; Yu, Z.; Wang, X.; Ma, T.; Lin, S.; Lin, J. Tuning the Inter-Metal Interaction between Ni and Fe Atoms in Dual-Atom Catalysts to Boost CO2 Electroreduction. Angew. Chem. Int. Ed. 2024, 63, e202411543. [Google Scholar] [CrossRef] [Scilit]
- Fukui, K.; Yonezawa, T.; Shingu, H. A molecular orbital theory of reactivity in aromatic hydrocarbons. J. Chem. Phys. 1952, 20, 722–725. [Google Scholar] [CrossRef] [Scilit]
- Frisch, M.J.; Trucks, G.W.; Schlegel, H.B.; Scuseria, G.E.; Robb, M.A.; Cheeseman, J.R.; Scalmani, G.; Barone, V.; Petersson, G.A.; Nakatsuji, H.; et al. Gaussian 09, Revision E.01; Gaussian, Inc.: Wallingford, CT, USA, 2013. [Google Scholar]
- Lu, T.; Chen, F. Multiwfn: A multifunctional wavefunction analyzer. J. Comput. Chem. 2012, 33, 580–592. [Google Scholar] [CrossRef] [Scilit]
- Lu, T. A comprehensive electron wavefunction analysis toolbox for chemists. Multiwfn. J. Chem. Phys. 2024, 161, 082503. [Google Scholar] [CrossRef] [Scilit]
- Lu, T. Section 3.10 of Multiwfn Manual Version [2026.1.12]. Available online: http://sobereva.com/multiwfn (accessed on 27 January 2026).
- Weigend, F.; Ahlrichs, R. Balanced basis sets of split valence, triple zeta valence and quadruple zeta valence quality for H to Rn: Design and assessment of accuracy. Phys. Chem. Chem. Phys. 2005, 7, 3297–3305. [Google Scholar] [CrossRef] [Scilit] [PubMed]
- Tao, J.; Perdew, J.P.; Staroverov, V.N.; Scuseria, G.E. Climbing the density functional ladder: Nonempirical meta–generalized gradient approximation designed for molecules and solids. Phys. Rev. Lett. 2003, 91, 146401. [Google Scholar] [CrossRef] [Scilit] [PubMed]
- Wang, Y.-Y.; Ding, X.-L.; Chen, Y.; Wang, M.-M.; Li, W.; Wang, X. Trimetallic clusters in the sumanene bowl for dinitrogen activation. Phys. Chem. Chem. Phys. 2022, 24, 23265–23278. [Google Scholar] [CrossRef] [Scilit] [PubMed]
- Huang, X.-M.; Ji, Z.-W.; Ding, X.-L.; Chen, Y.; Li, W.; Chen, J.-J.; Xu, S.-P.; Li, L.-L. Theoretical study of ammonia synthesis catalysed by trimetallic clusters with or without a sumanene support. Phys. Chem. Chem. Phys. 2025, 27, 10259–10274. [Google Scholar] [CrossRef] [Scilit] [PubMed]
- Ji, Z.-W.; Huang, X.-M.; Ding, X.-L.; Chen, Y.; Li, W.; Chen, J.-J.; Xu, S.-P.; Li, L.-L. Doping C60 with single or dual Fe atoms for nitrogen reduction reaction: A DFT study. Phys. Scr. 2025, 100, 055949. [Google Scholar] [CrossRef] [Scilit]
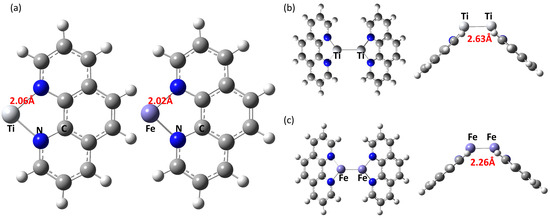
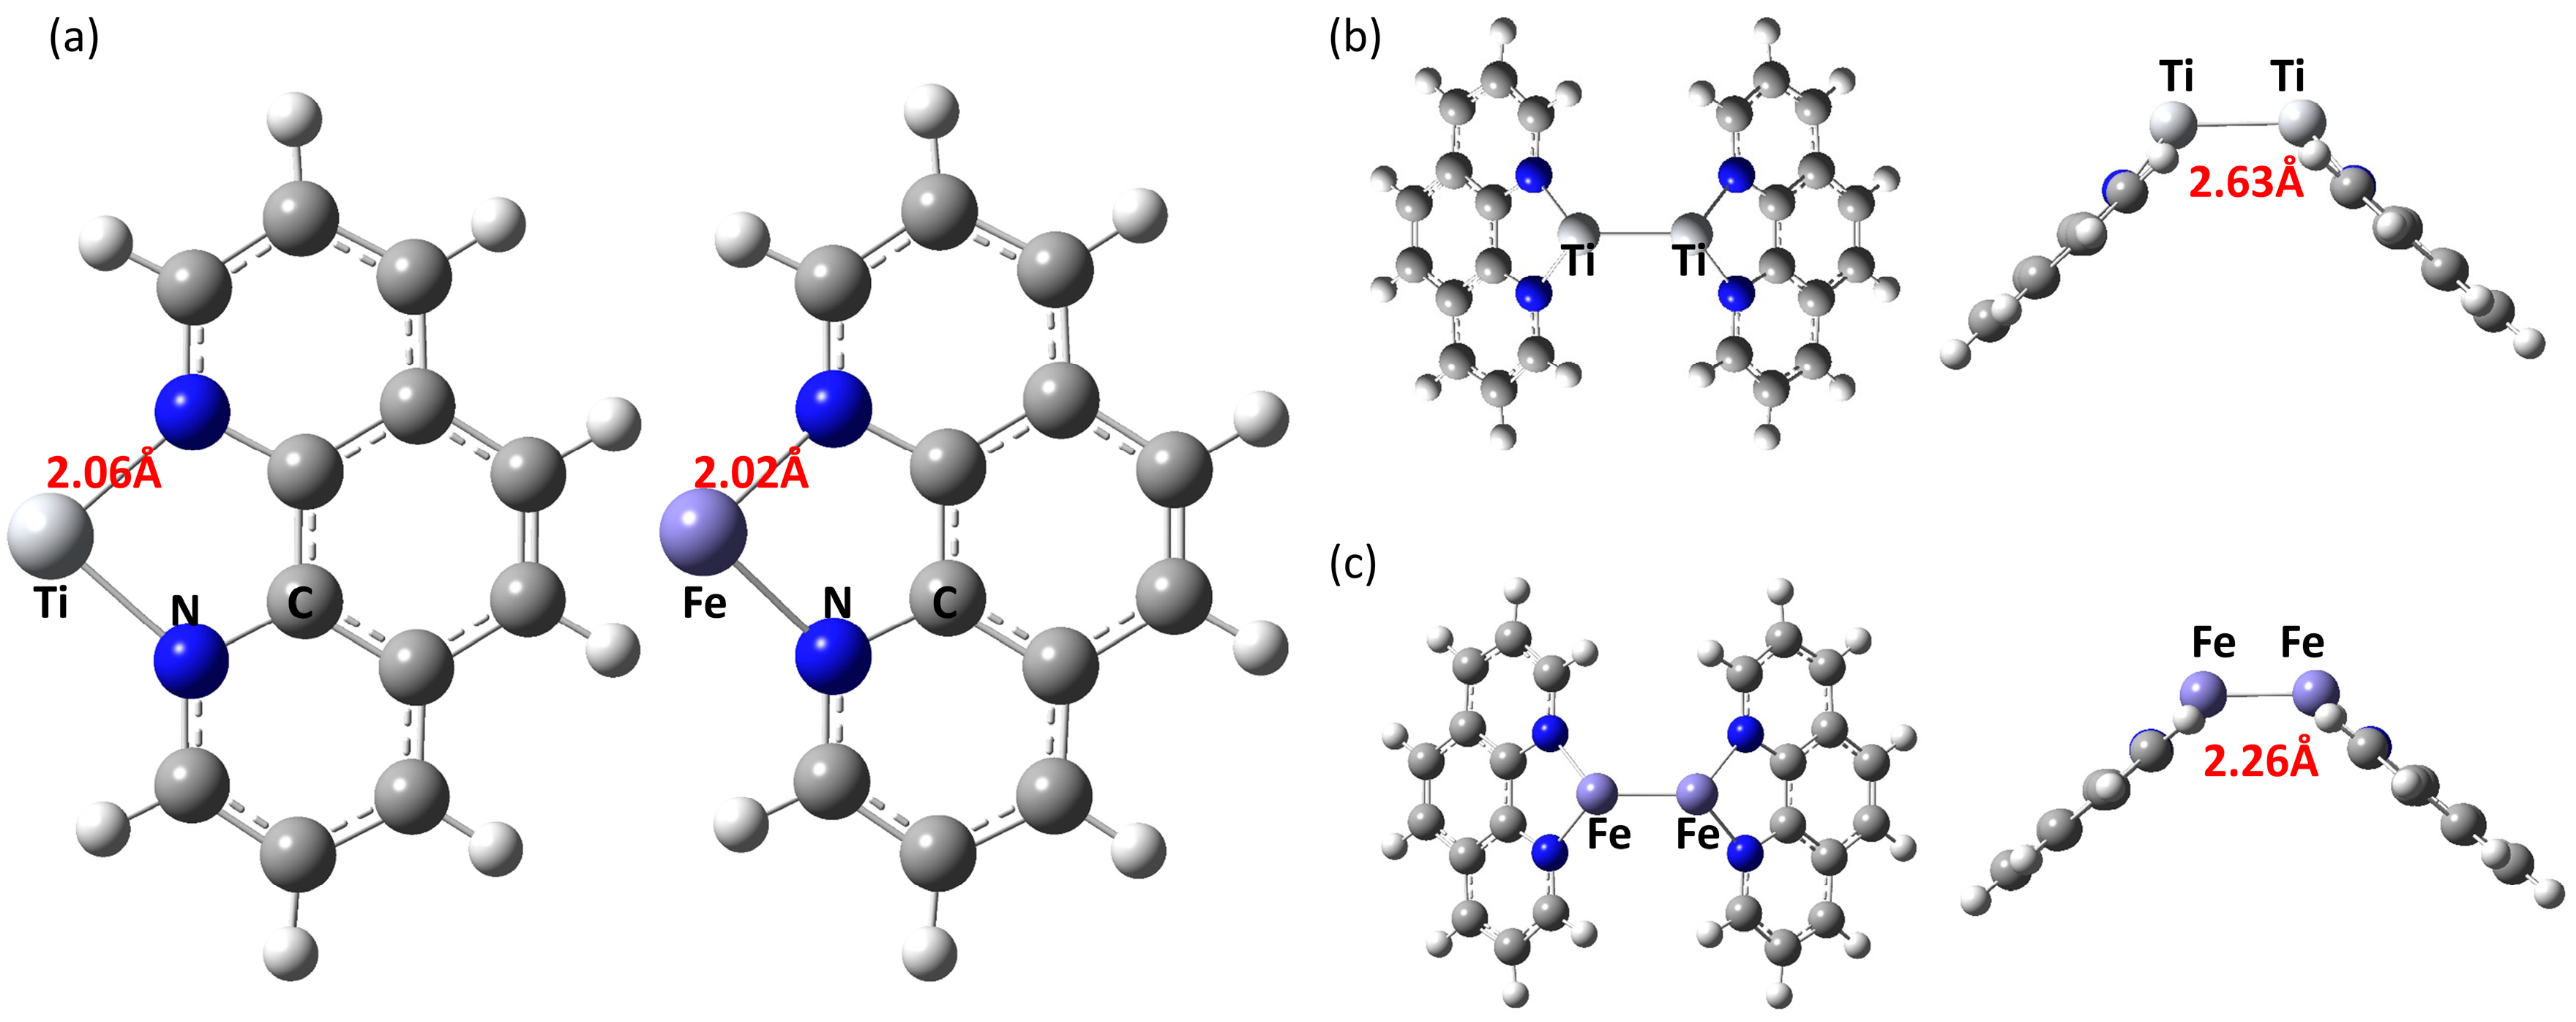
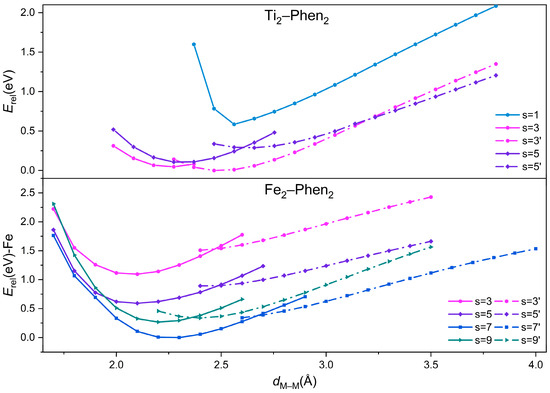
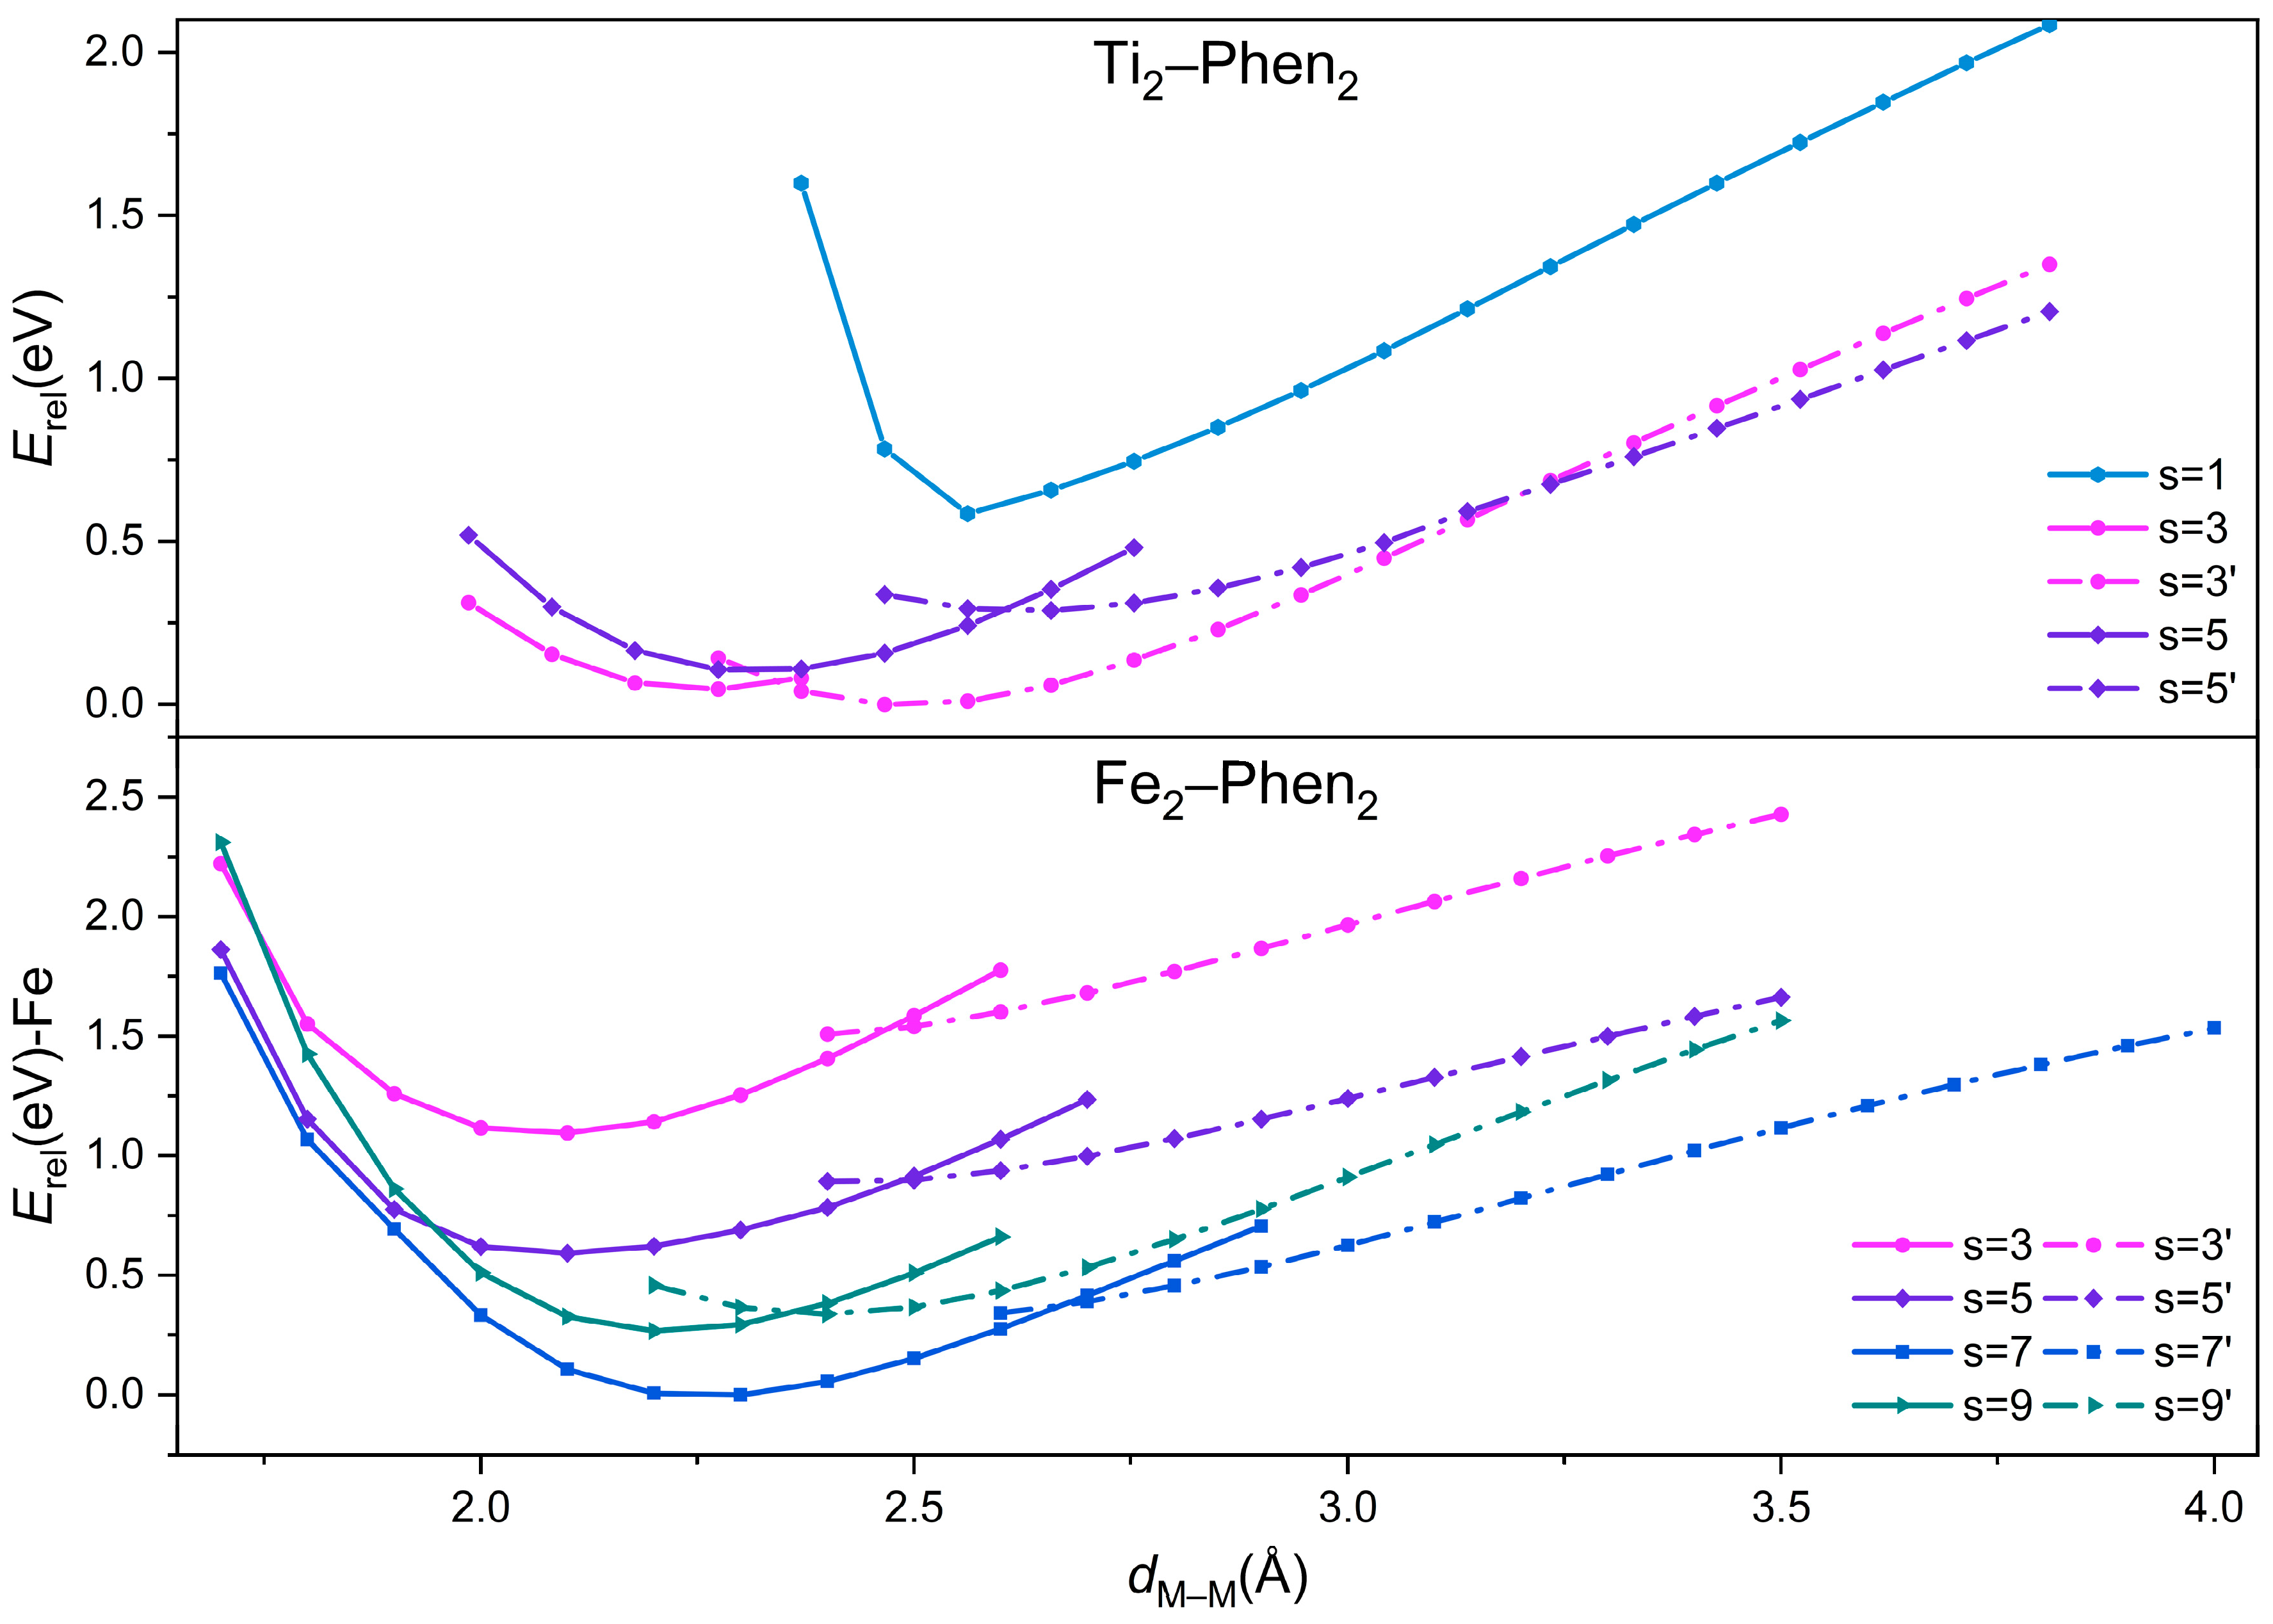
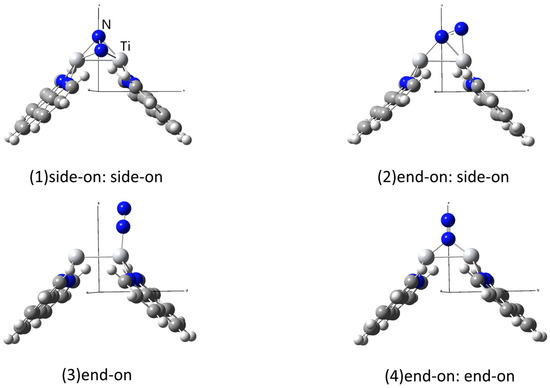
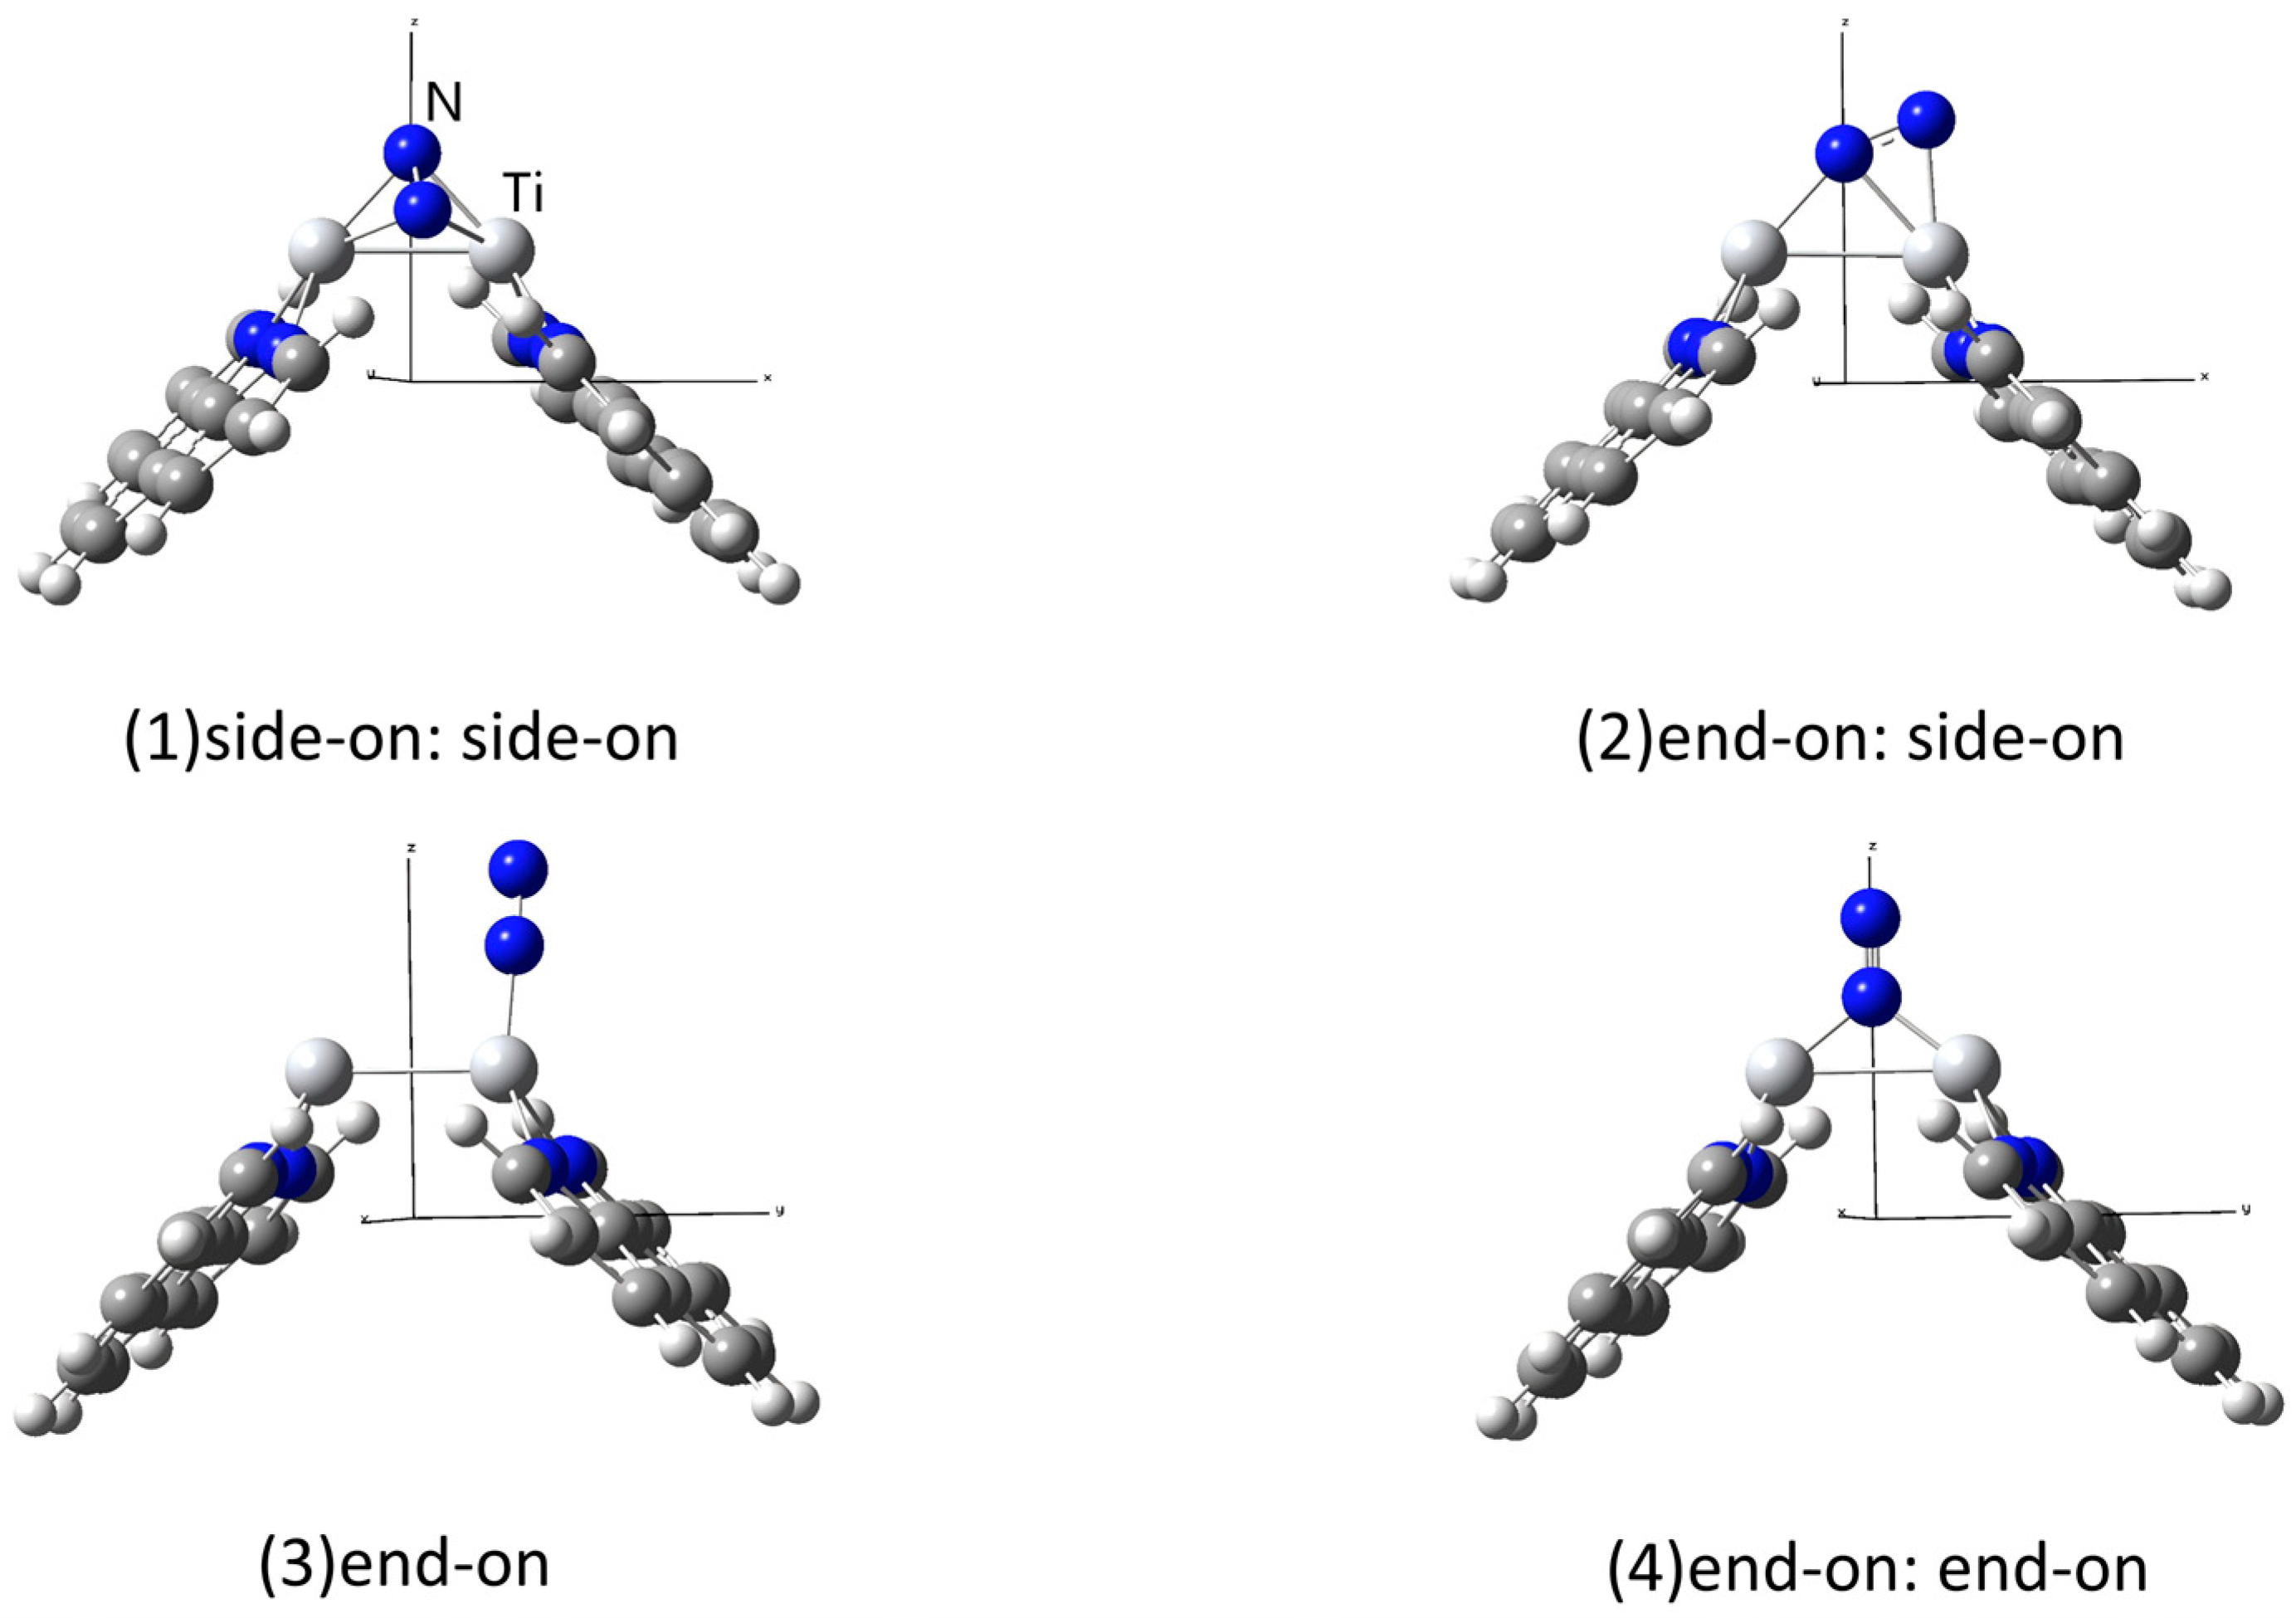
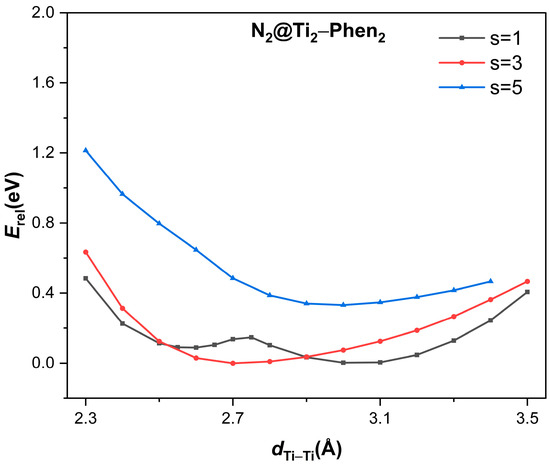
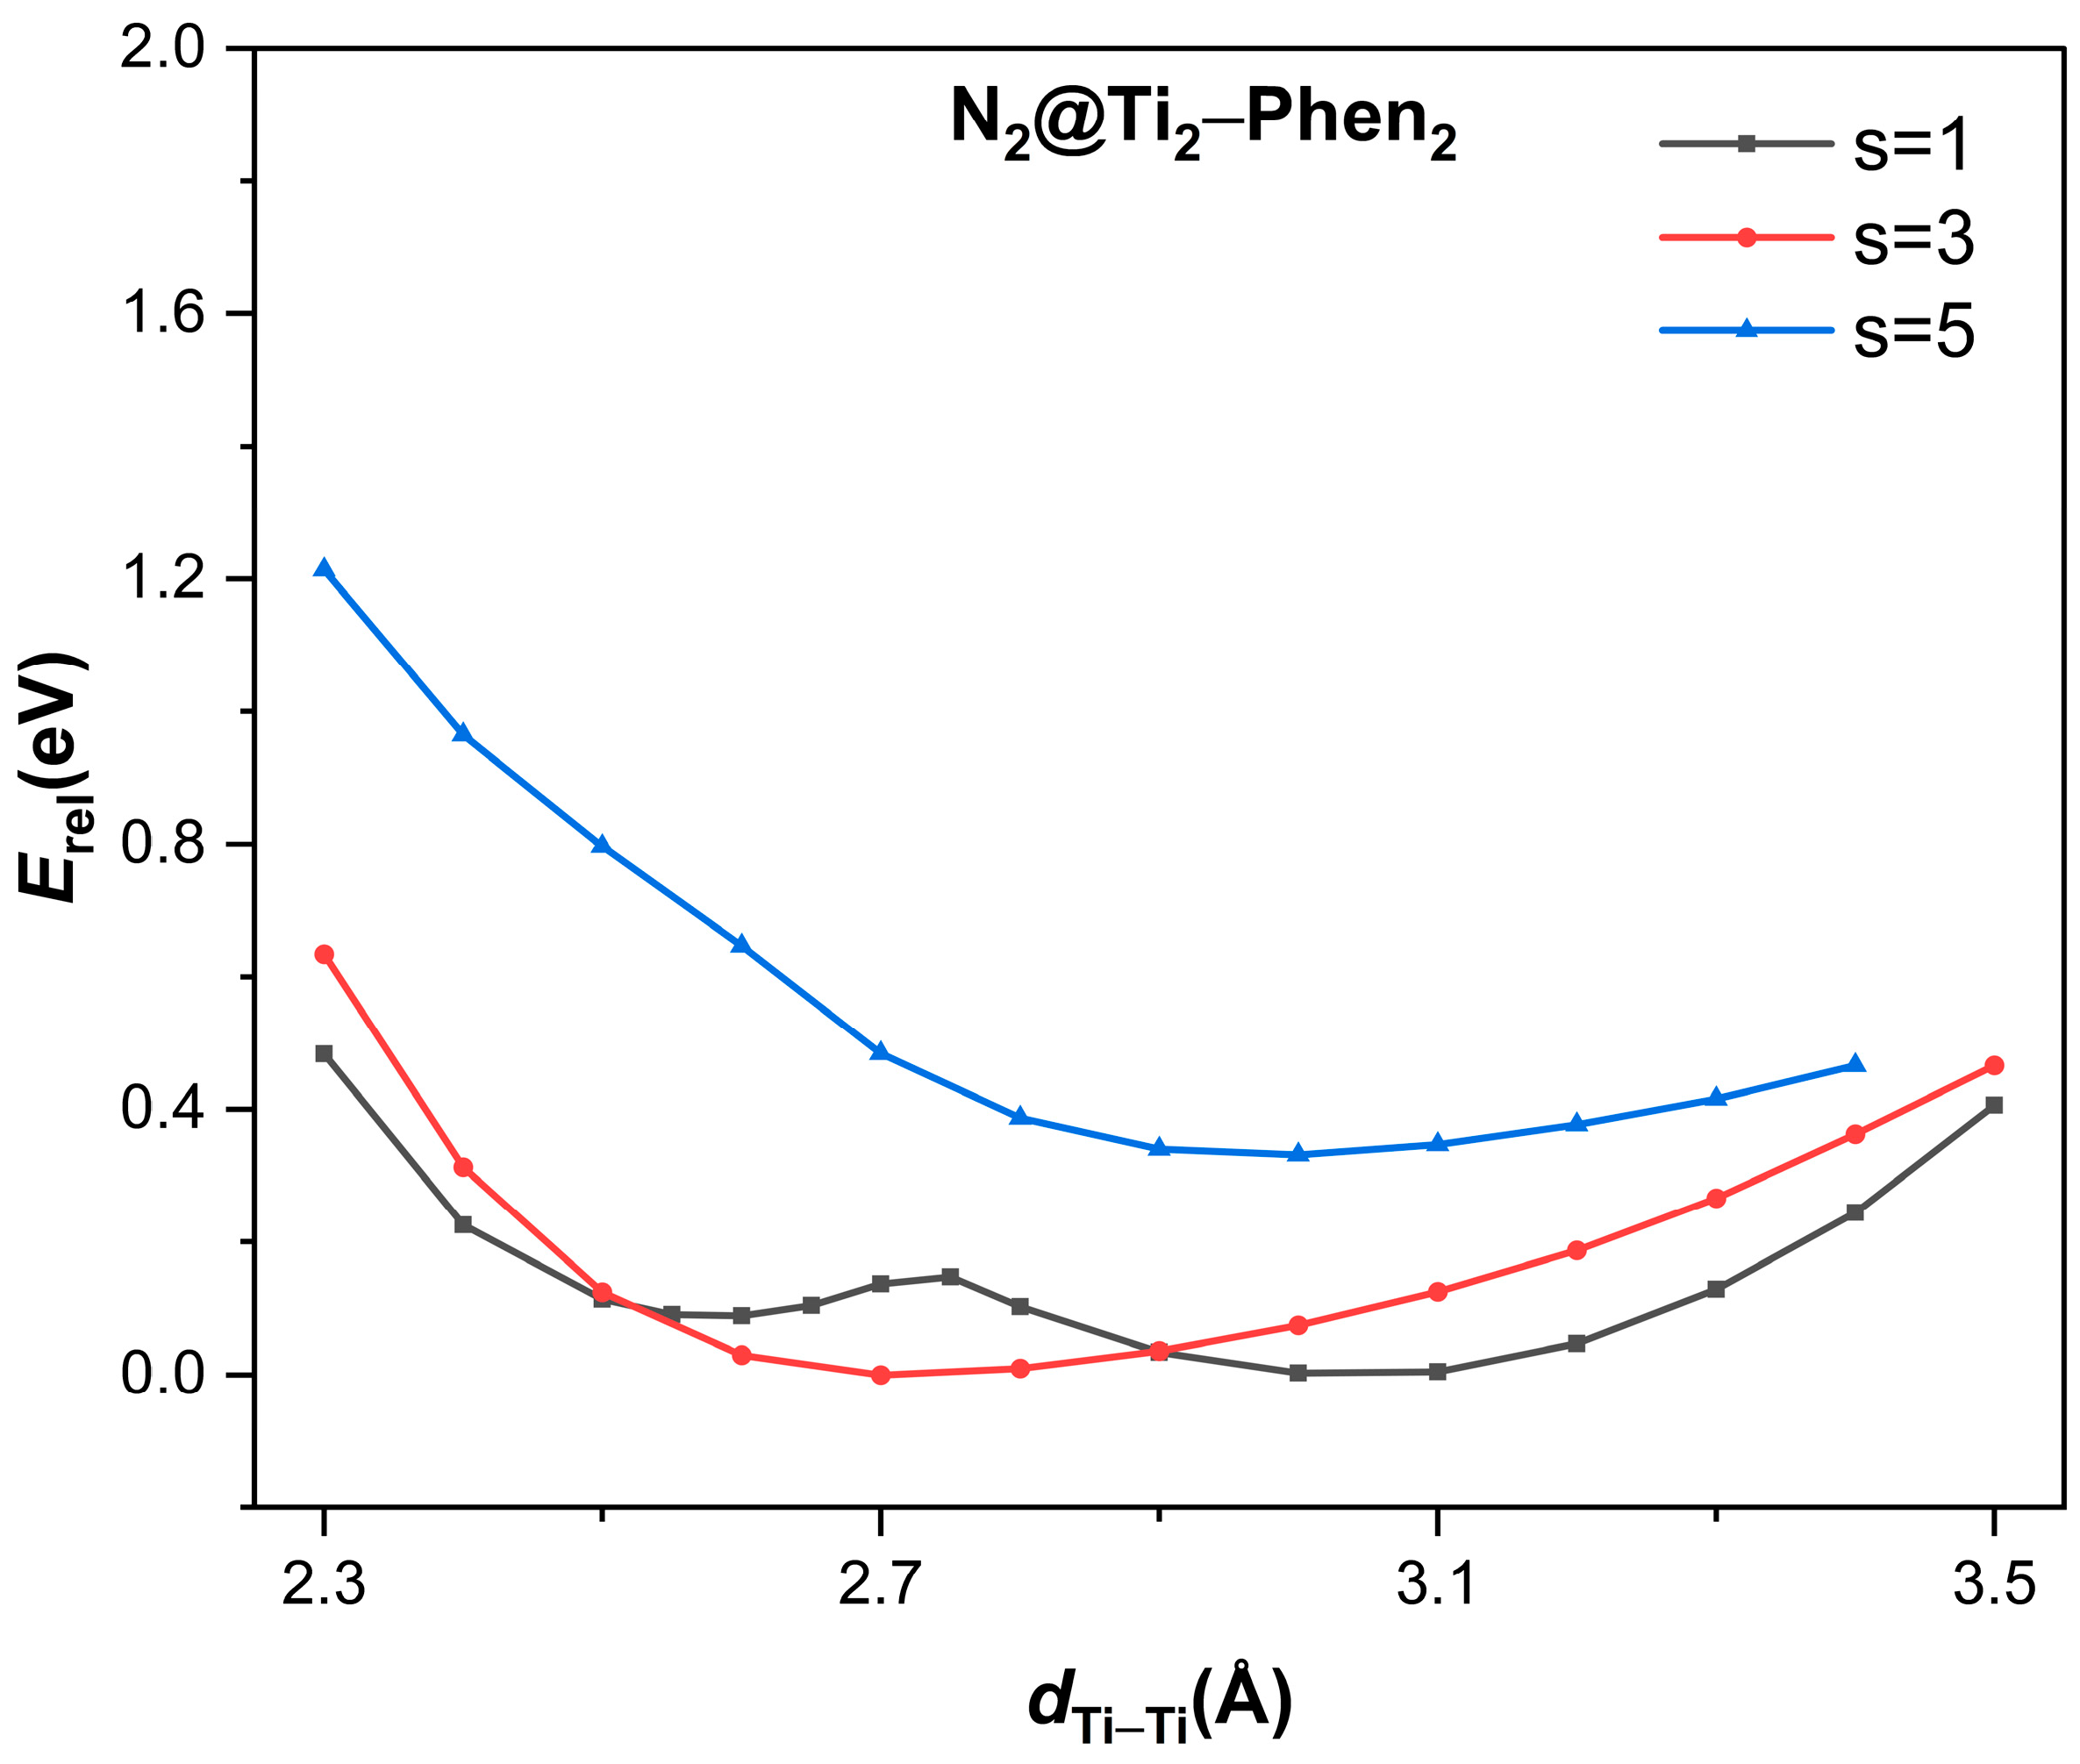
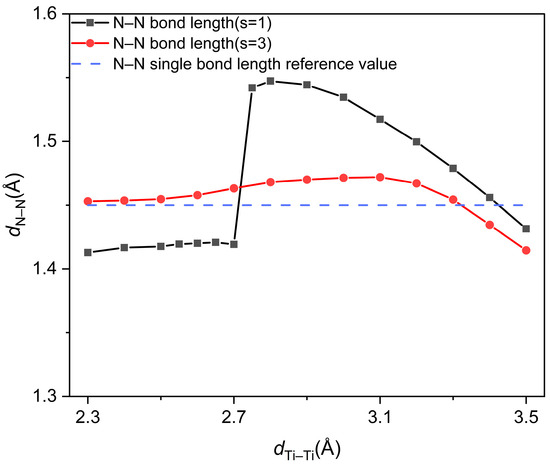
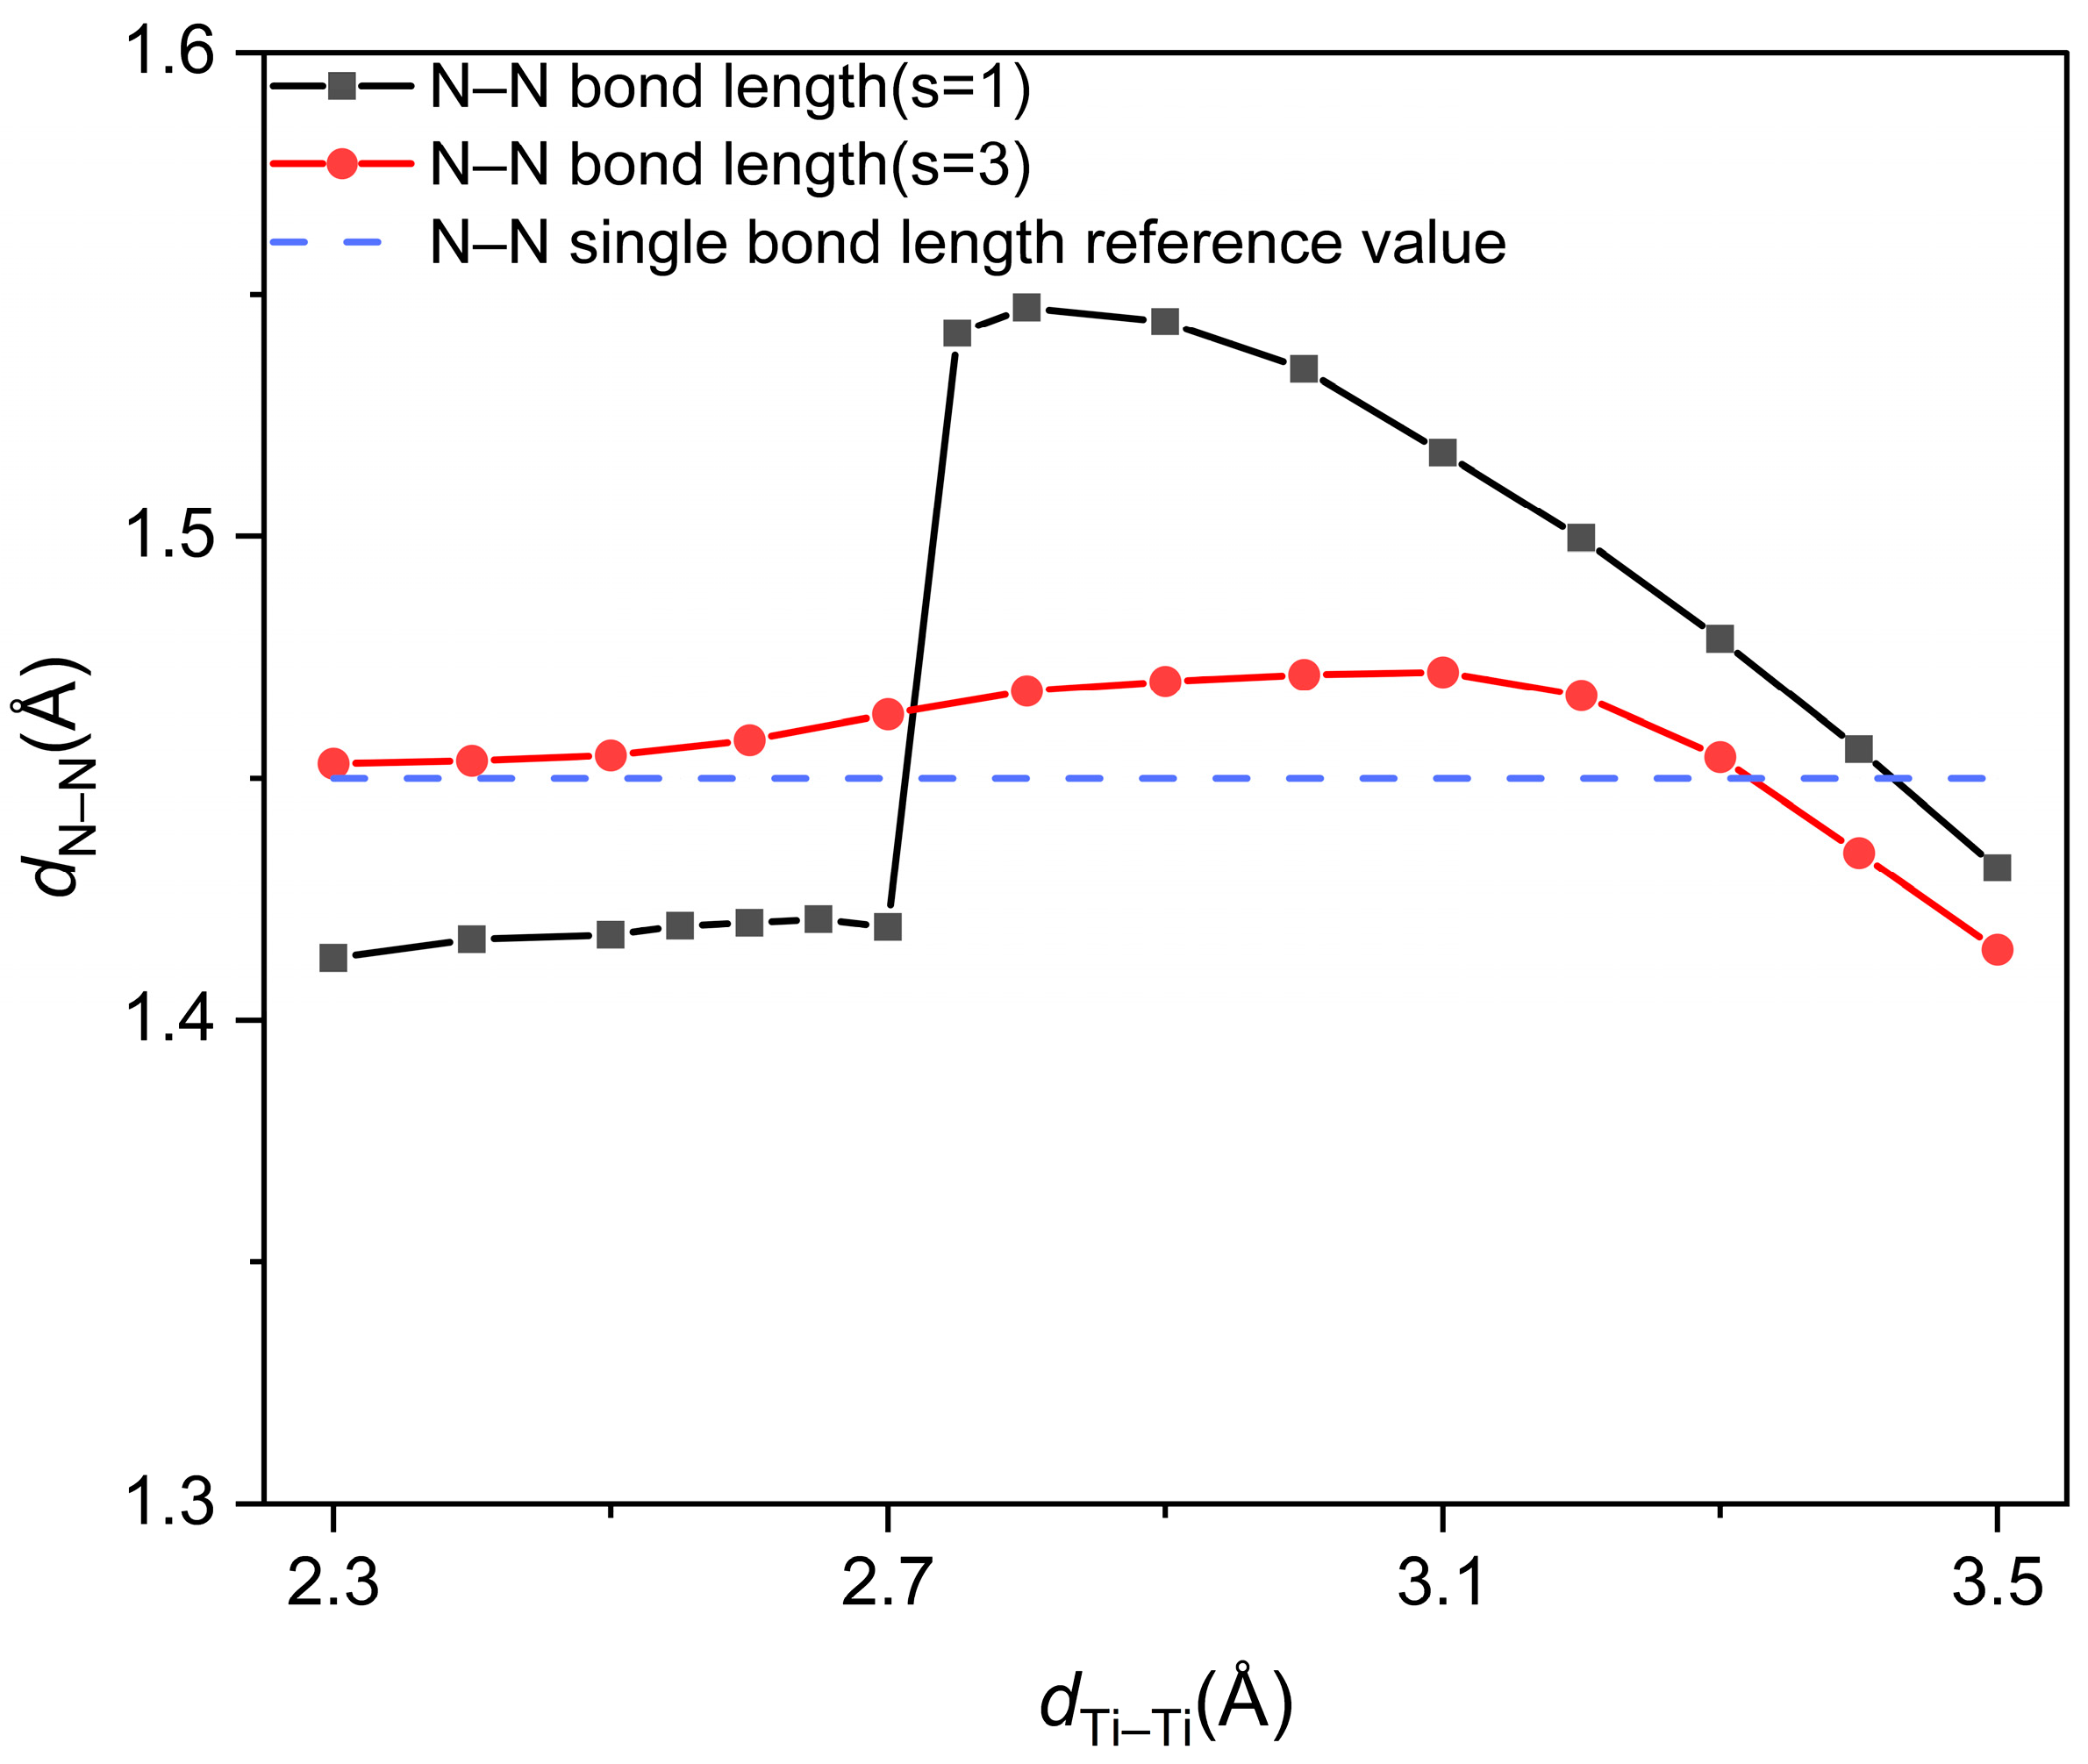
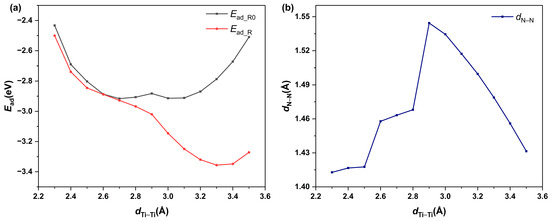
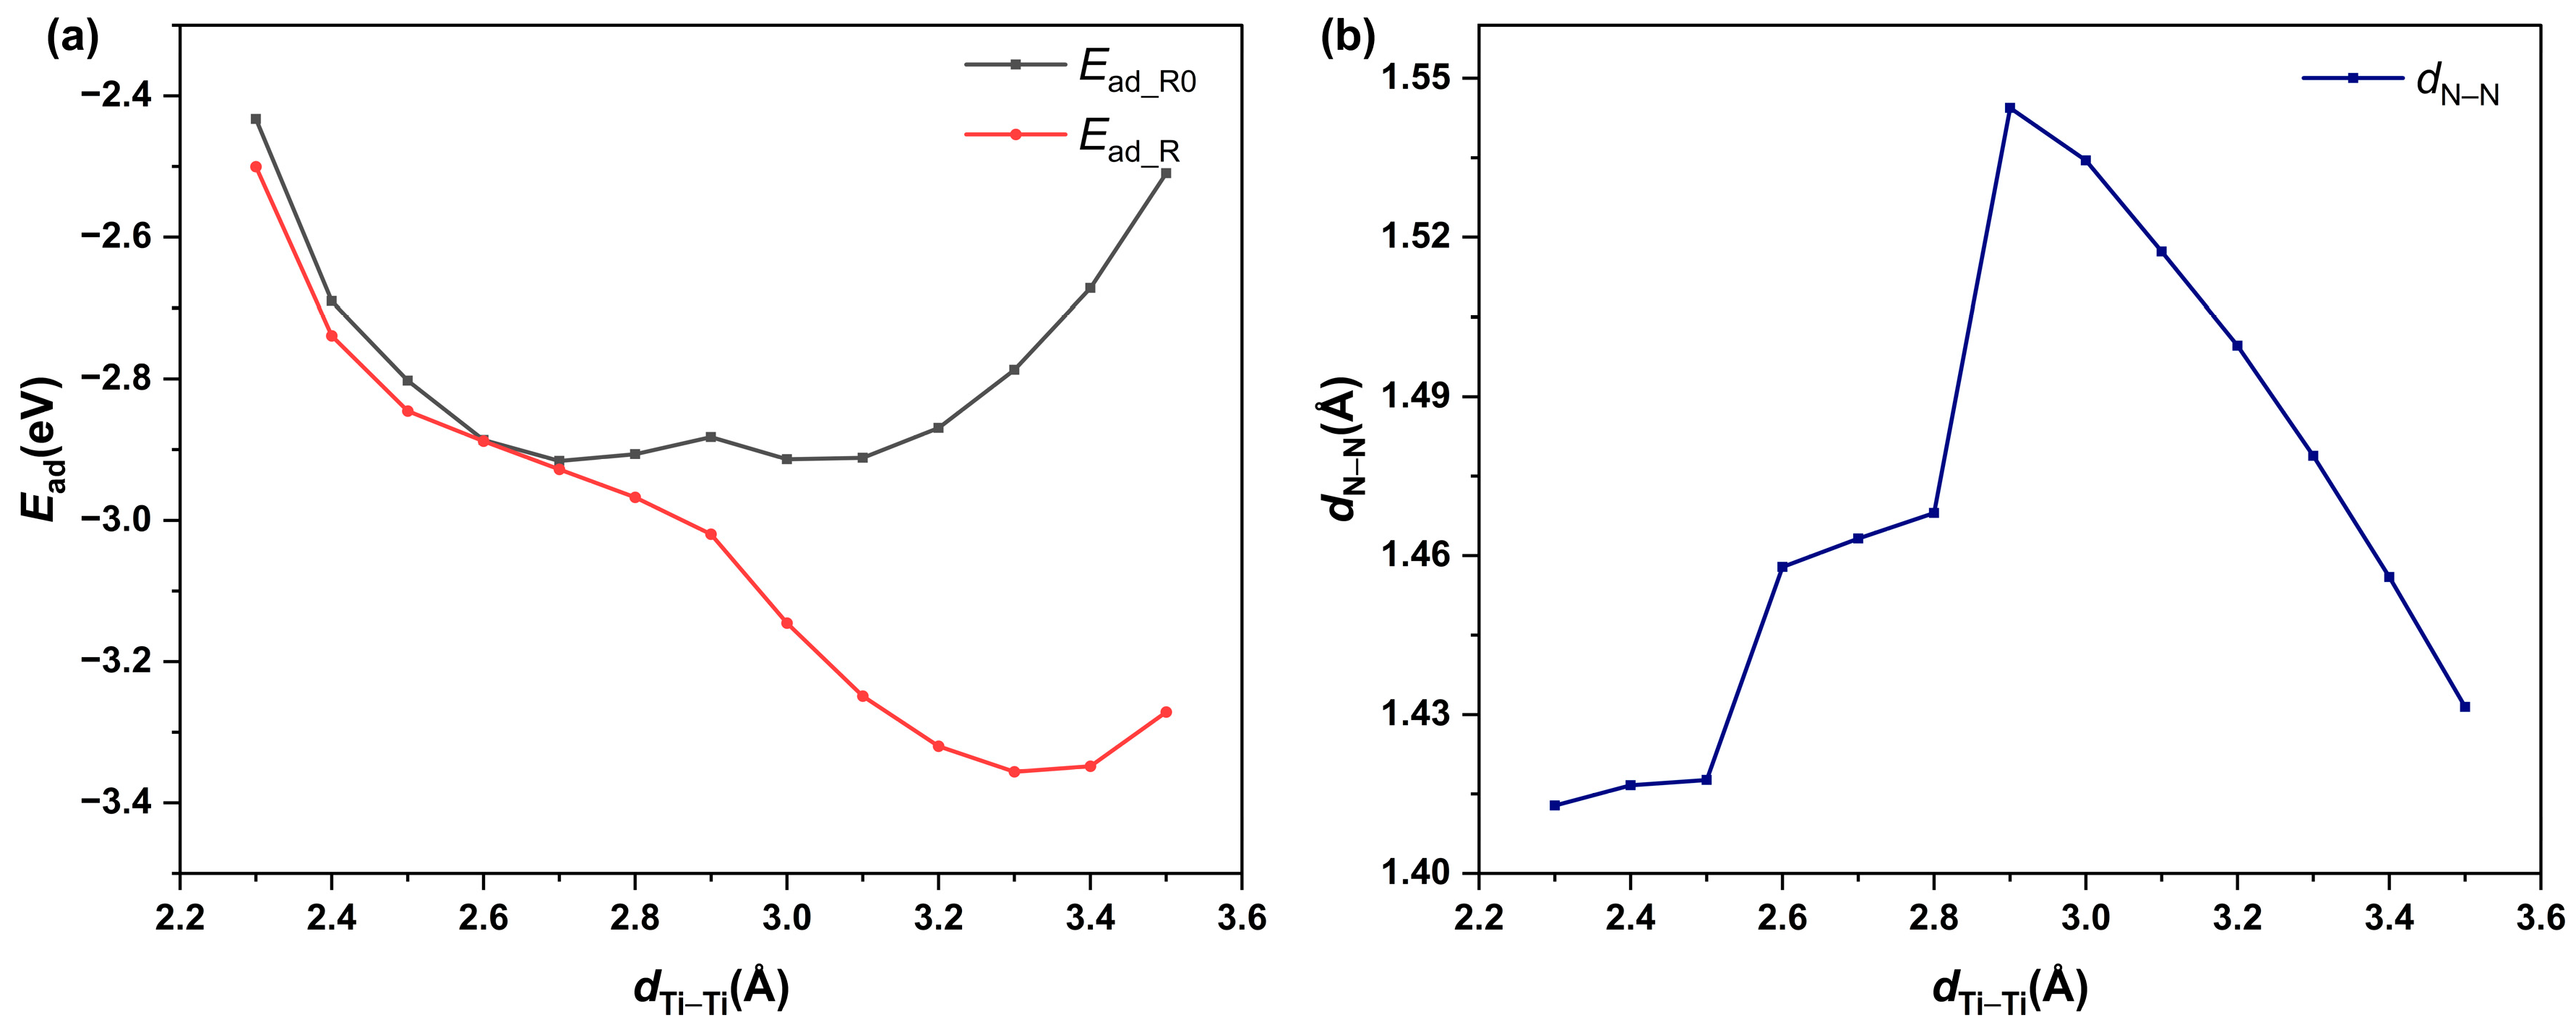
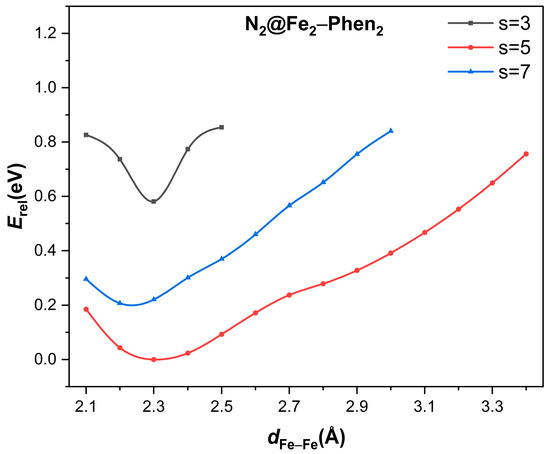
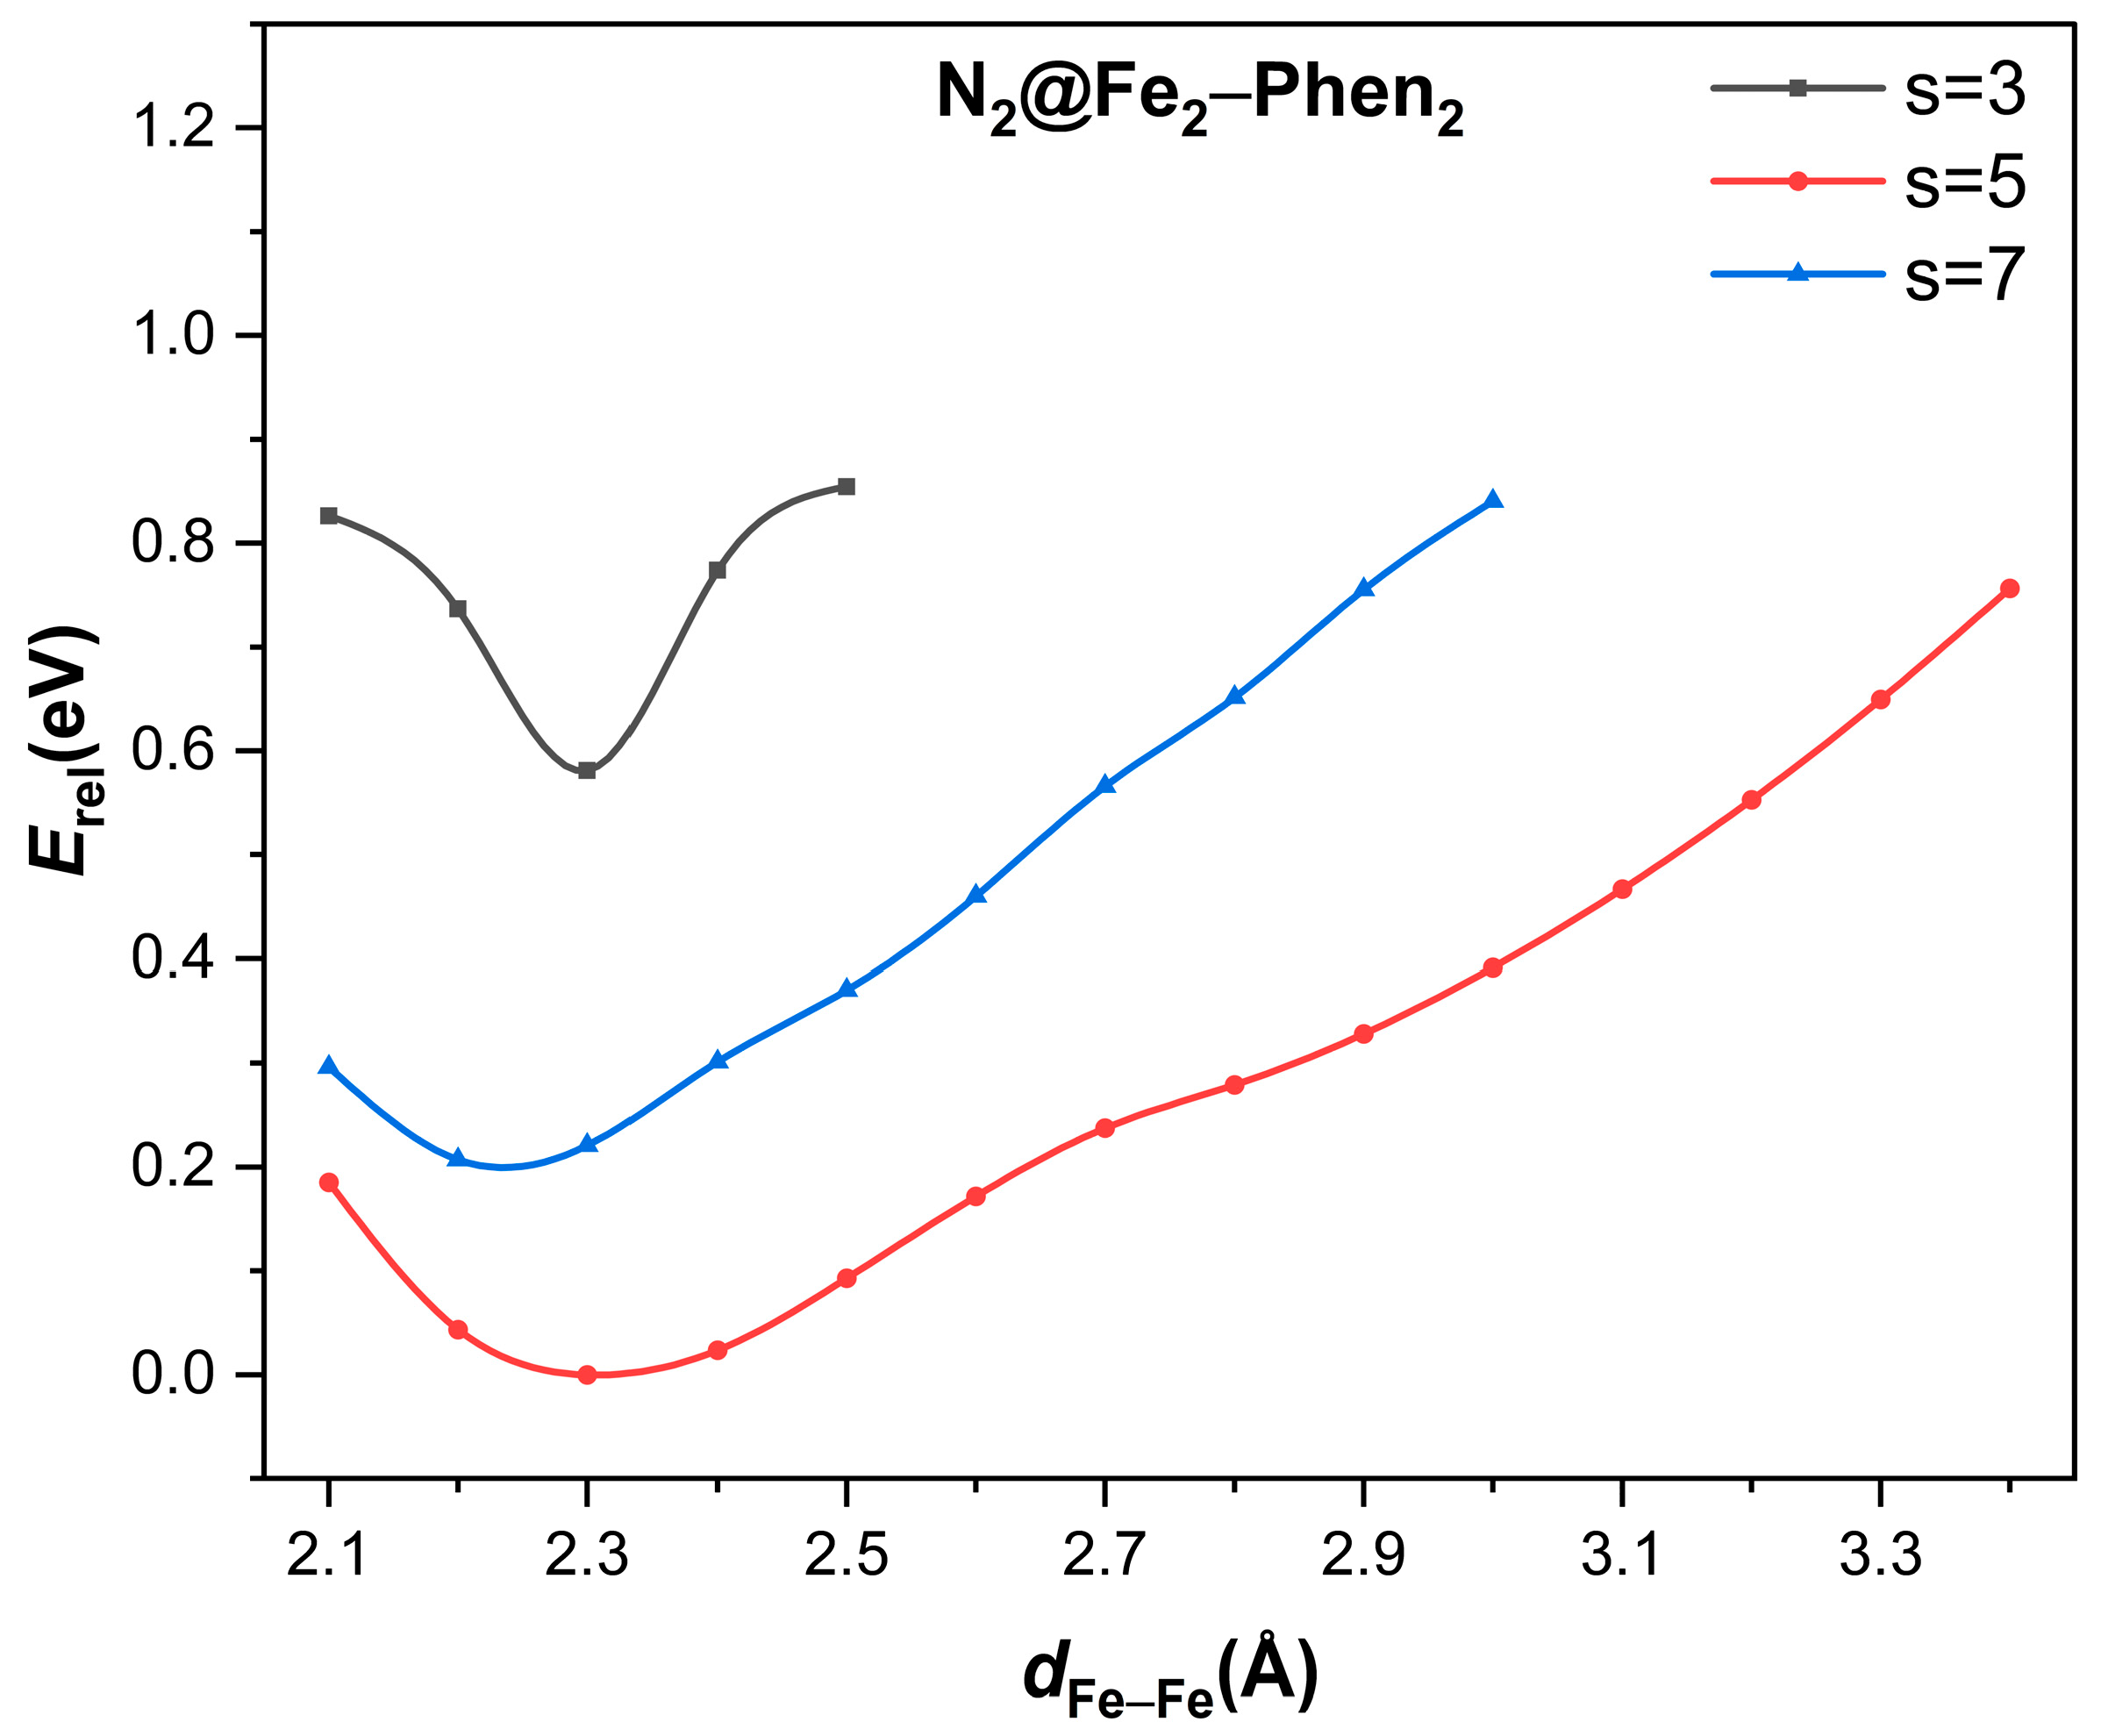
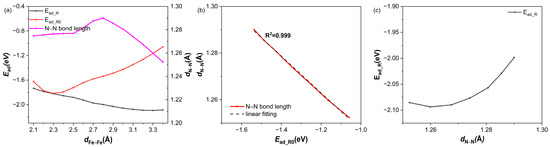
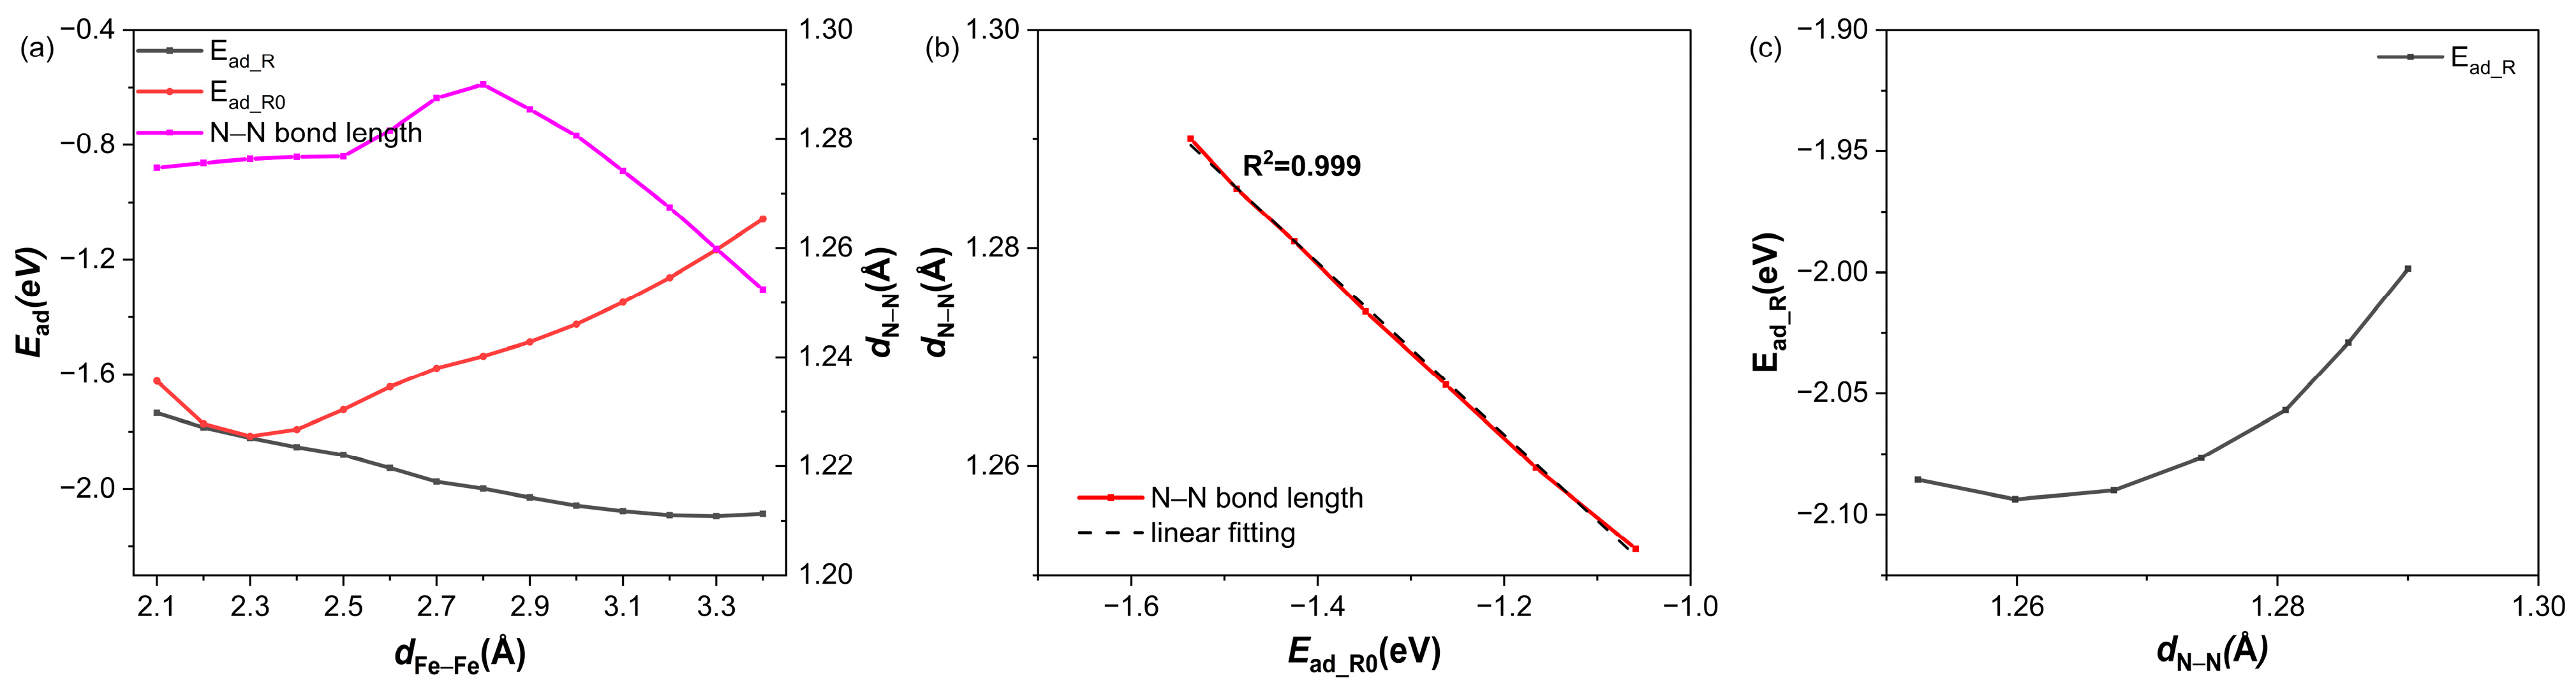
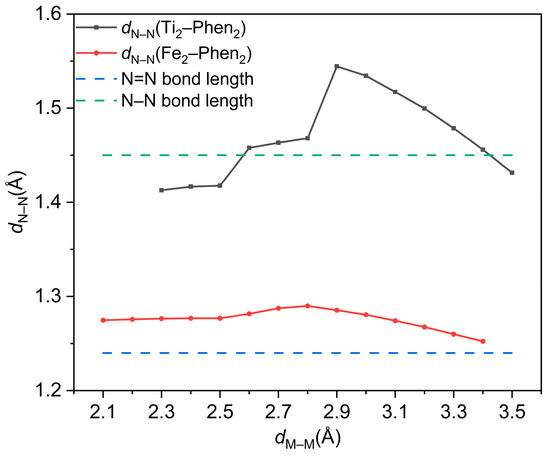
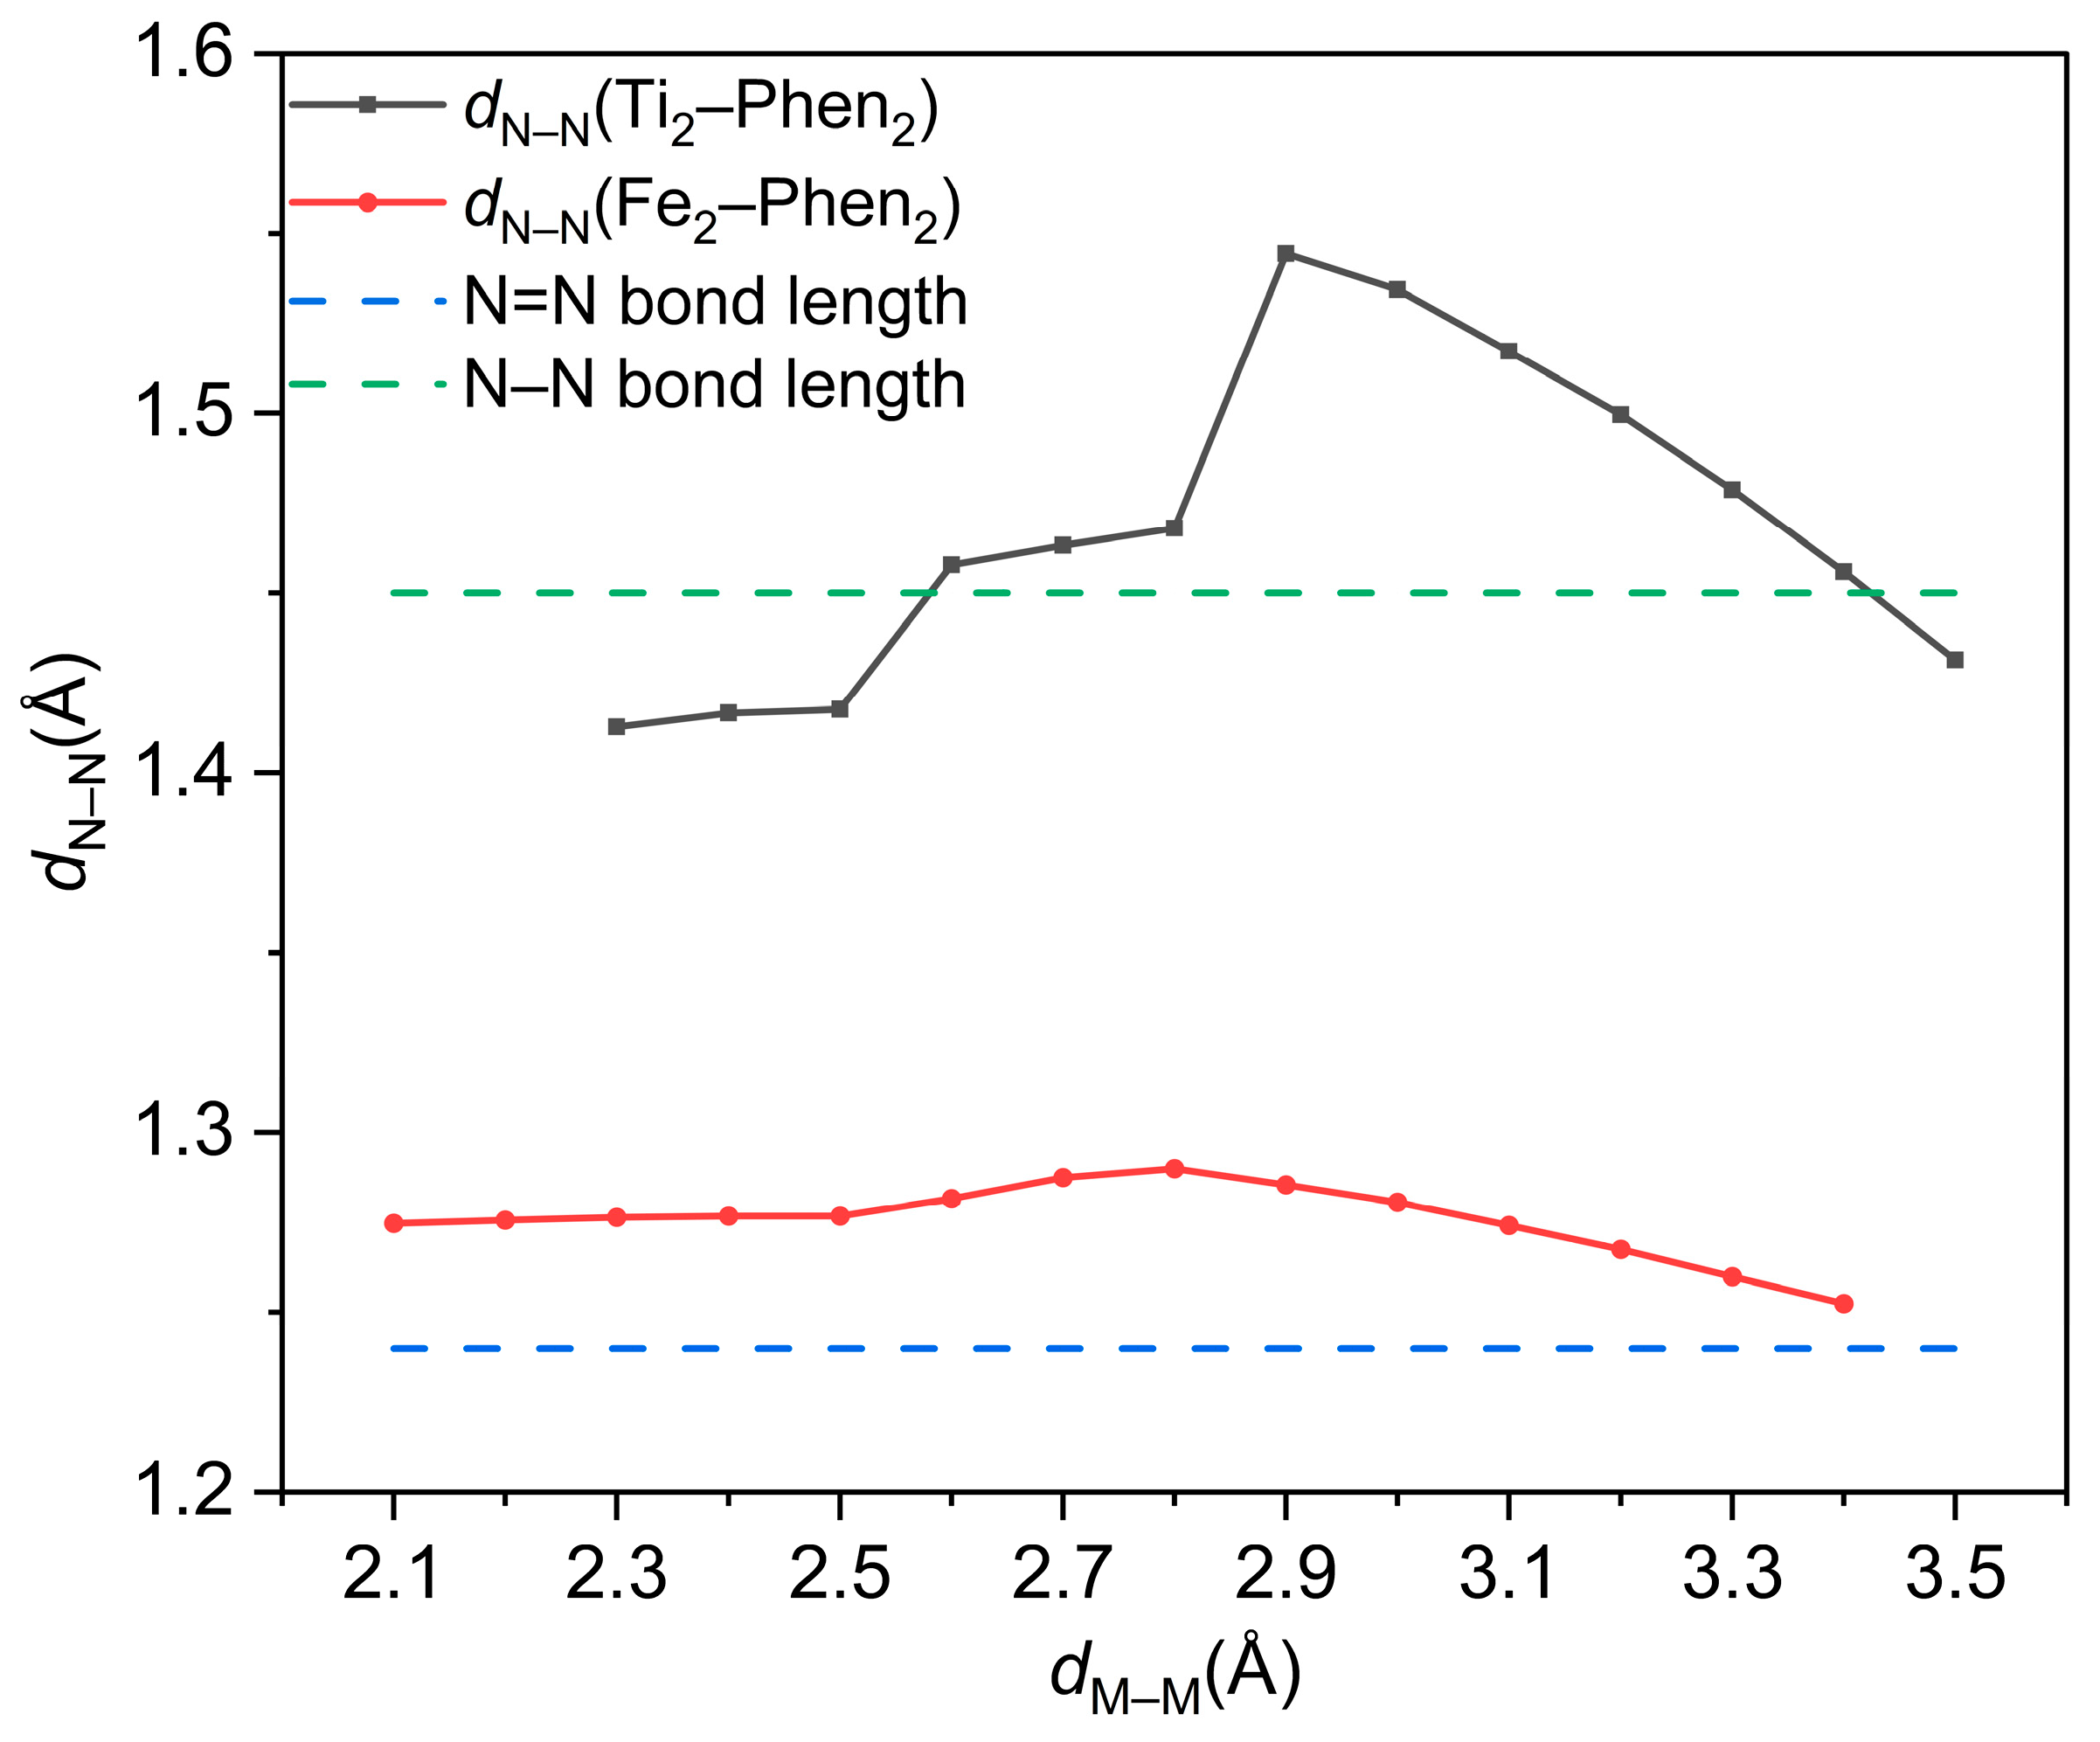
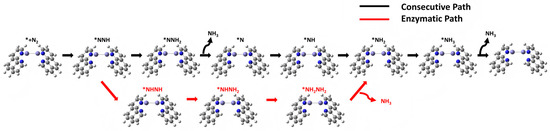
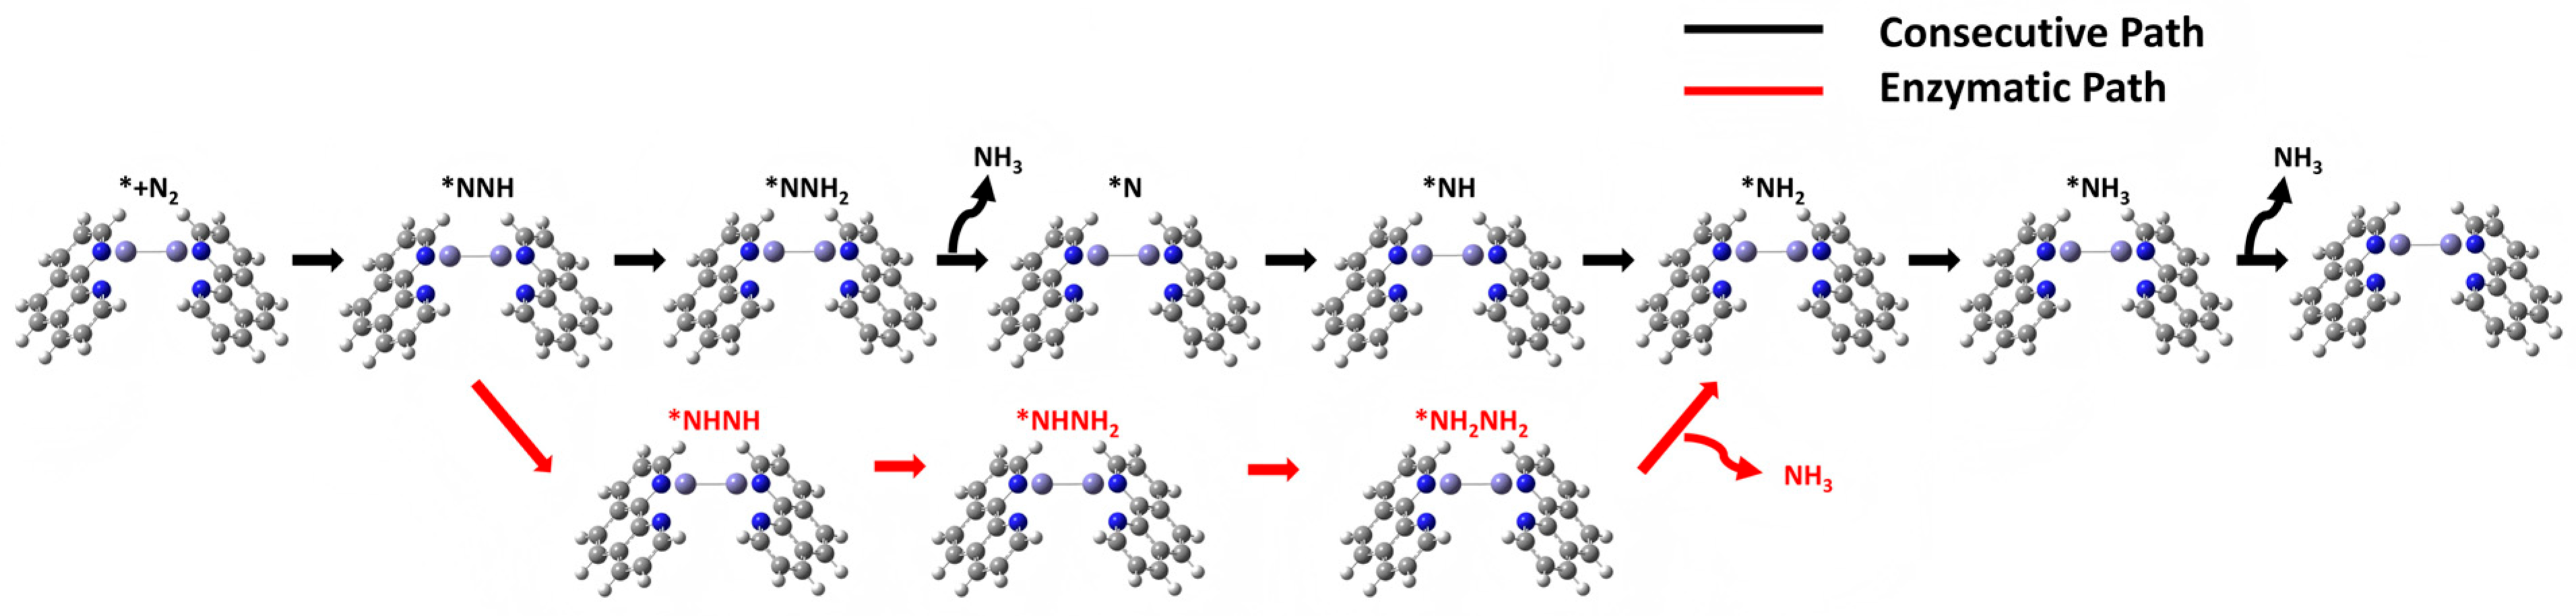
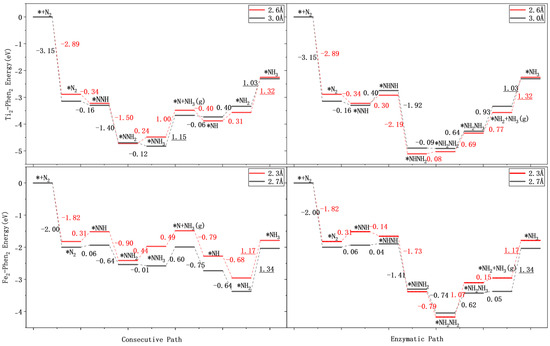
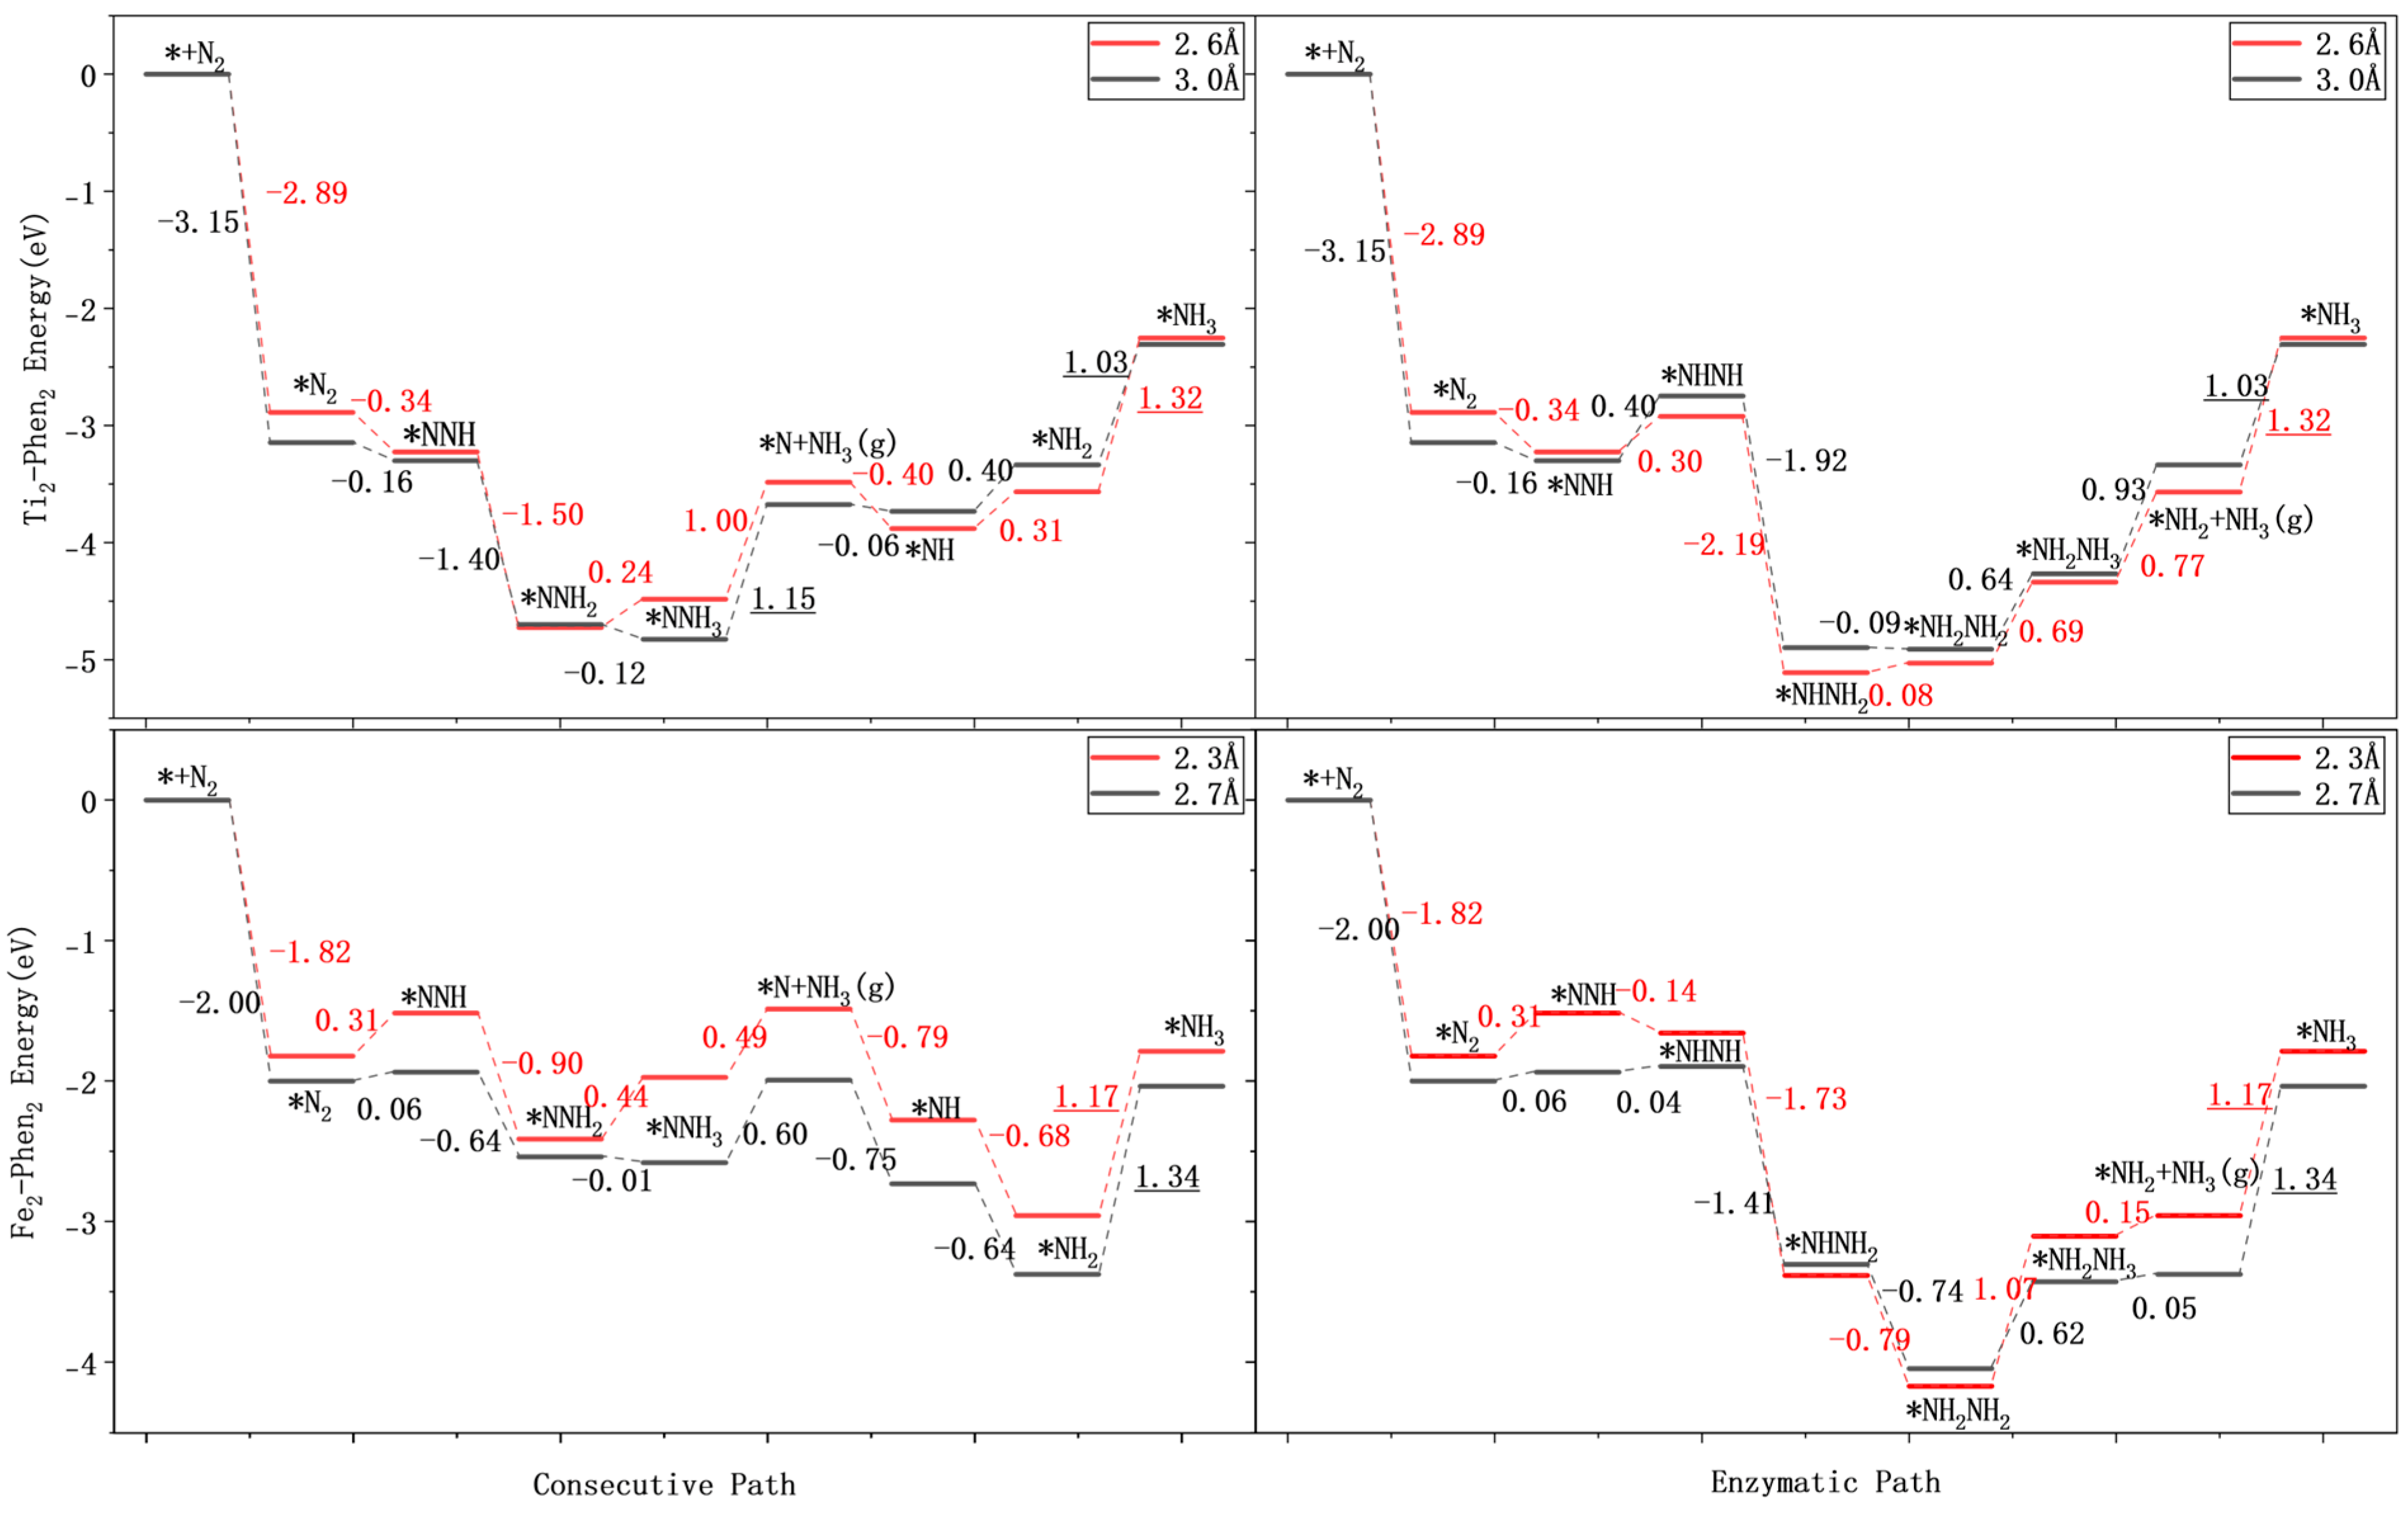
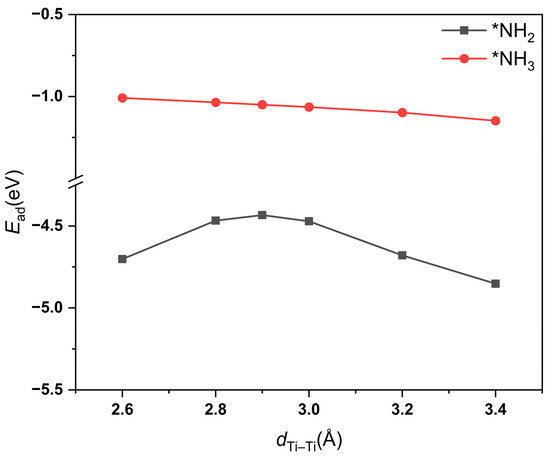
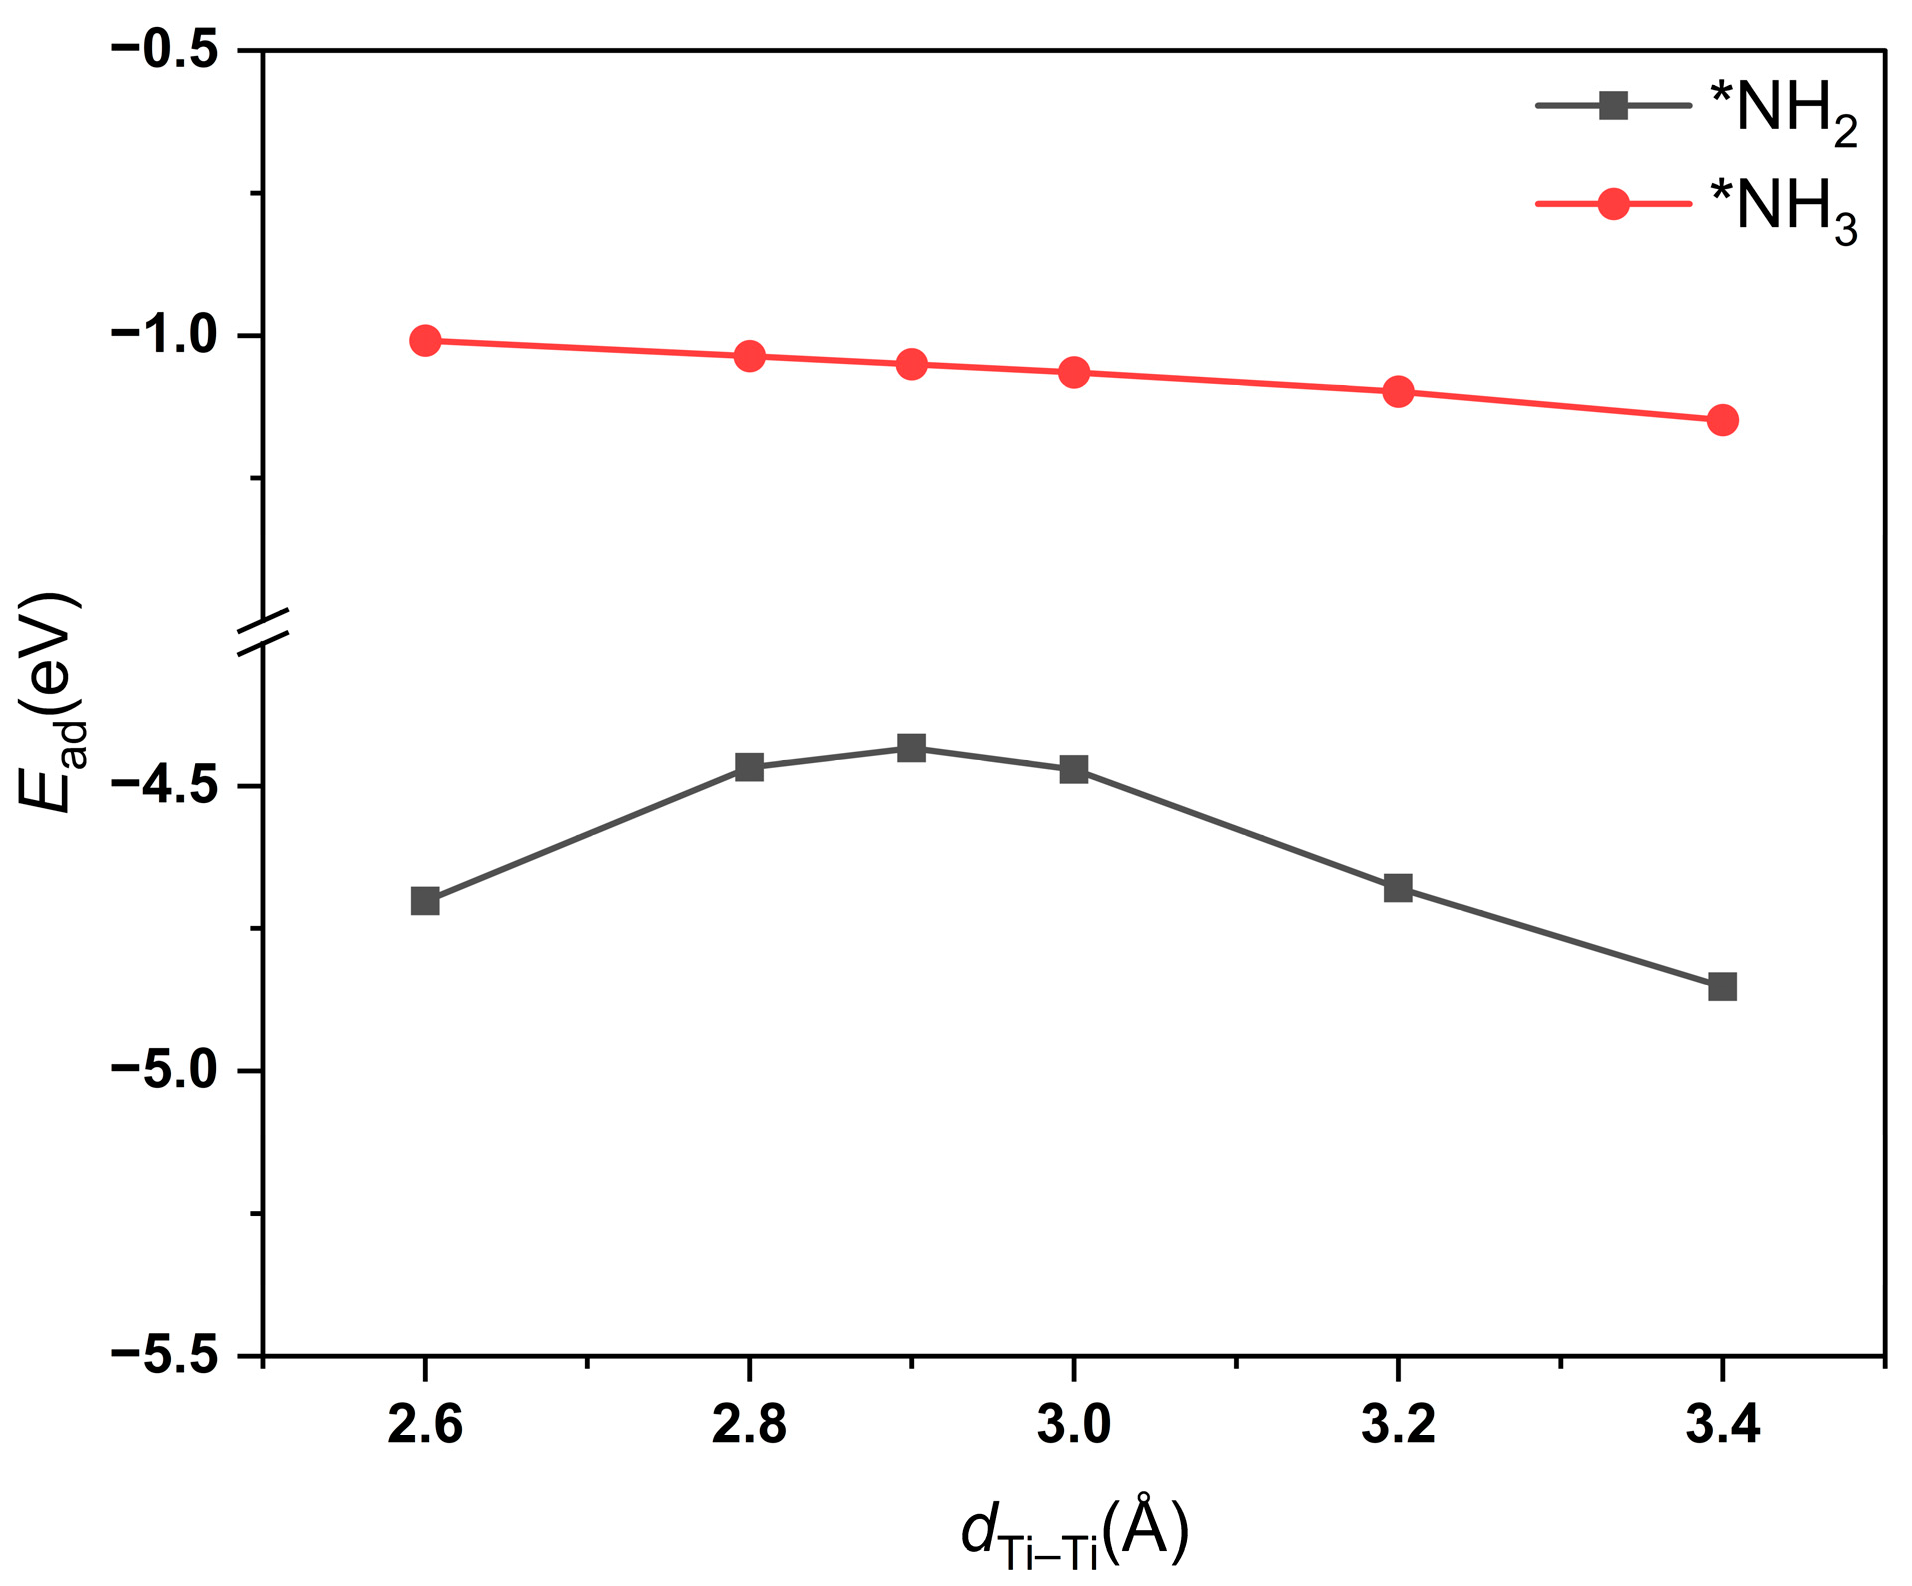
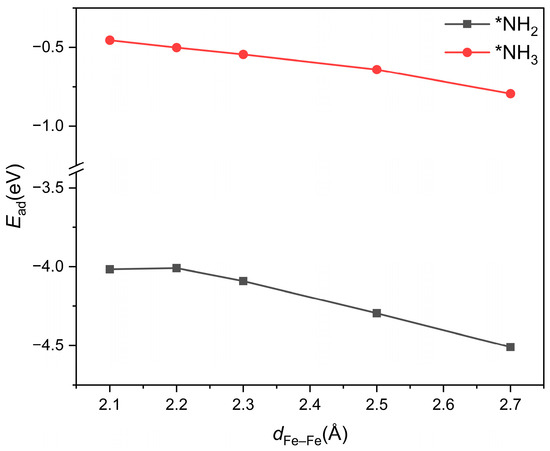
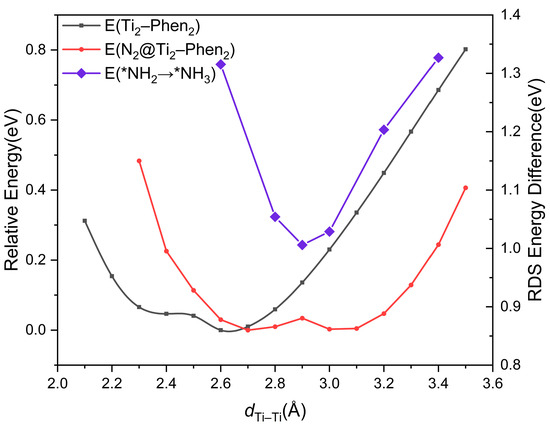
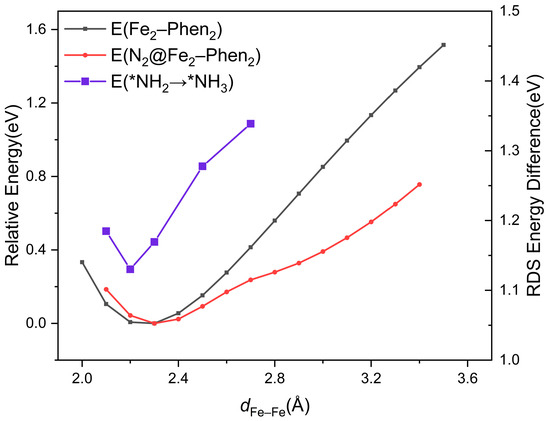
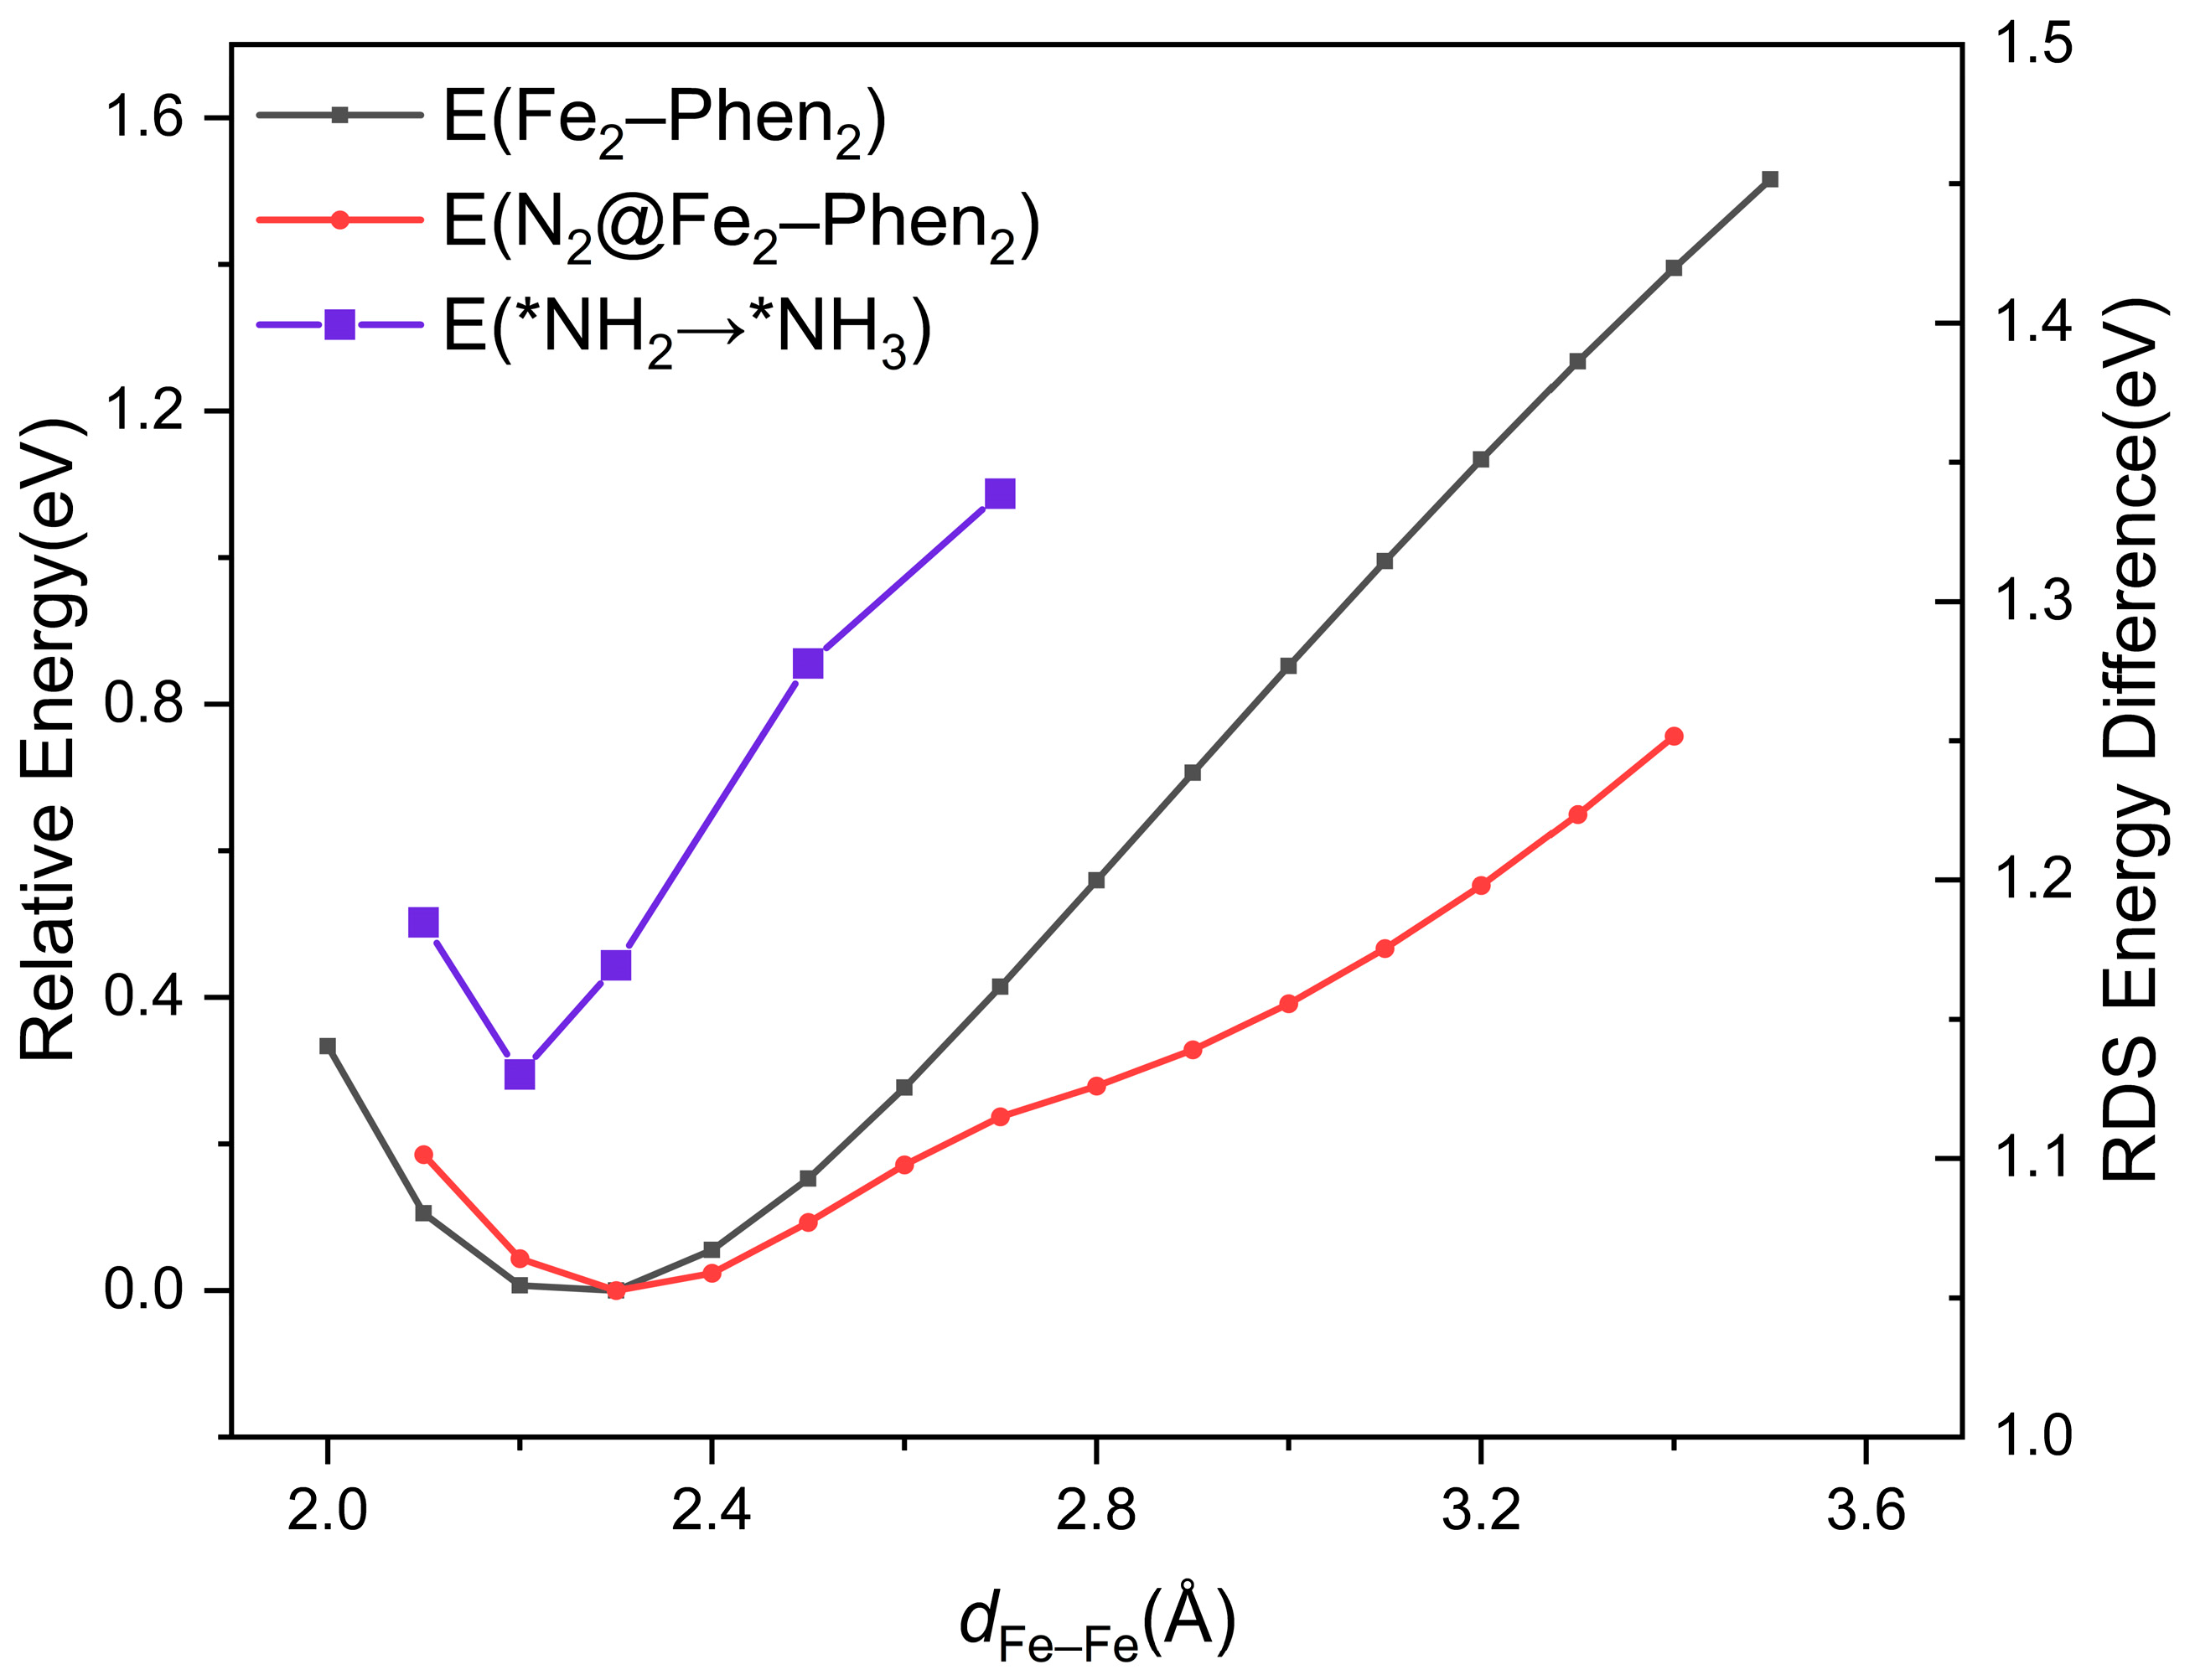
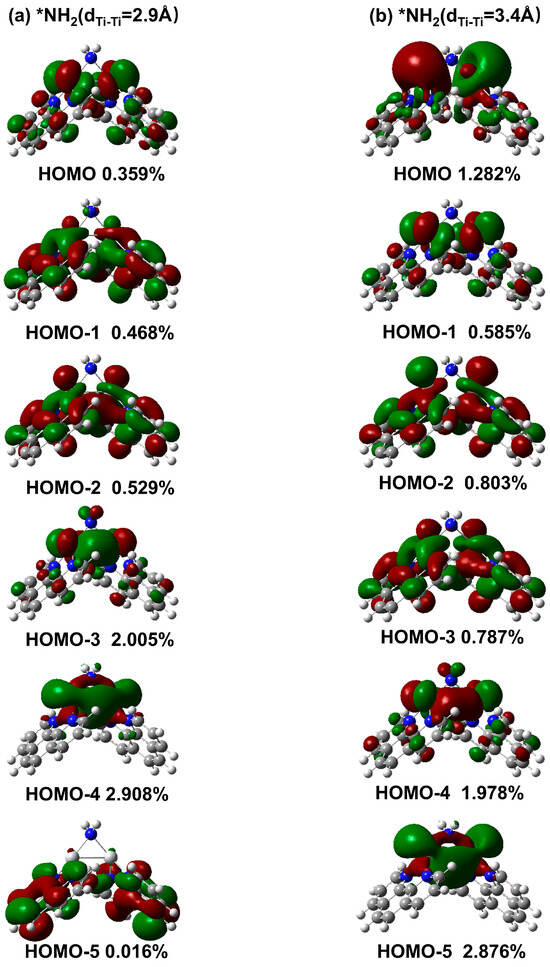
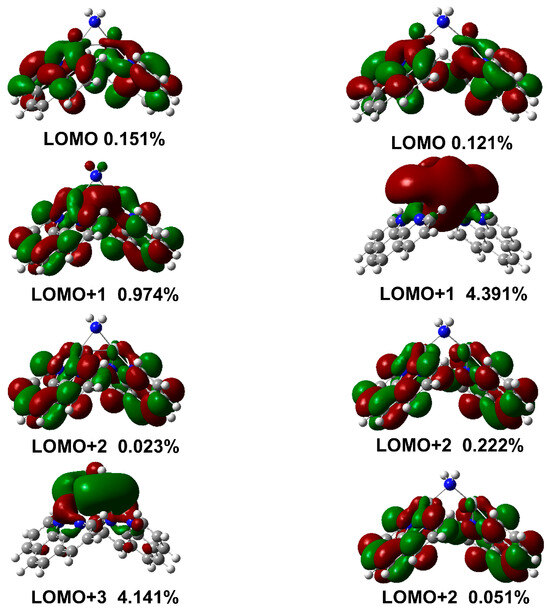
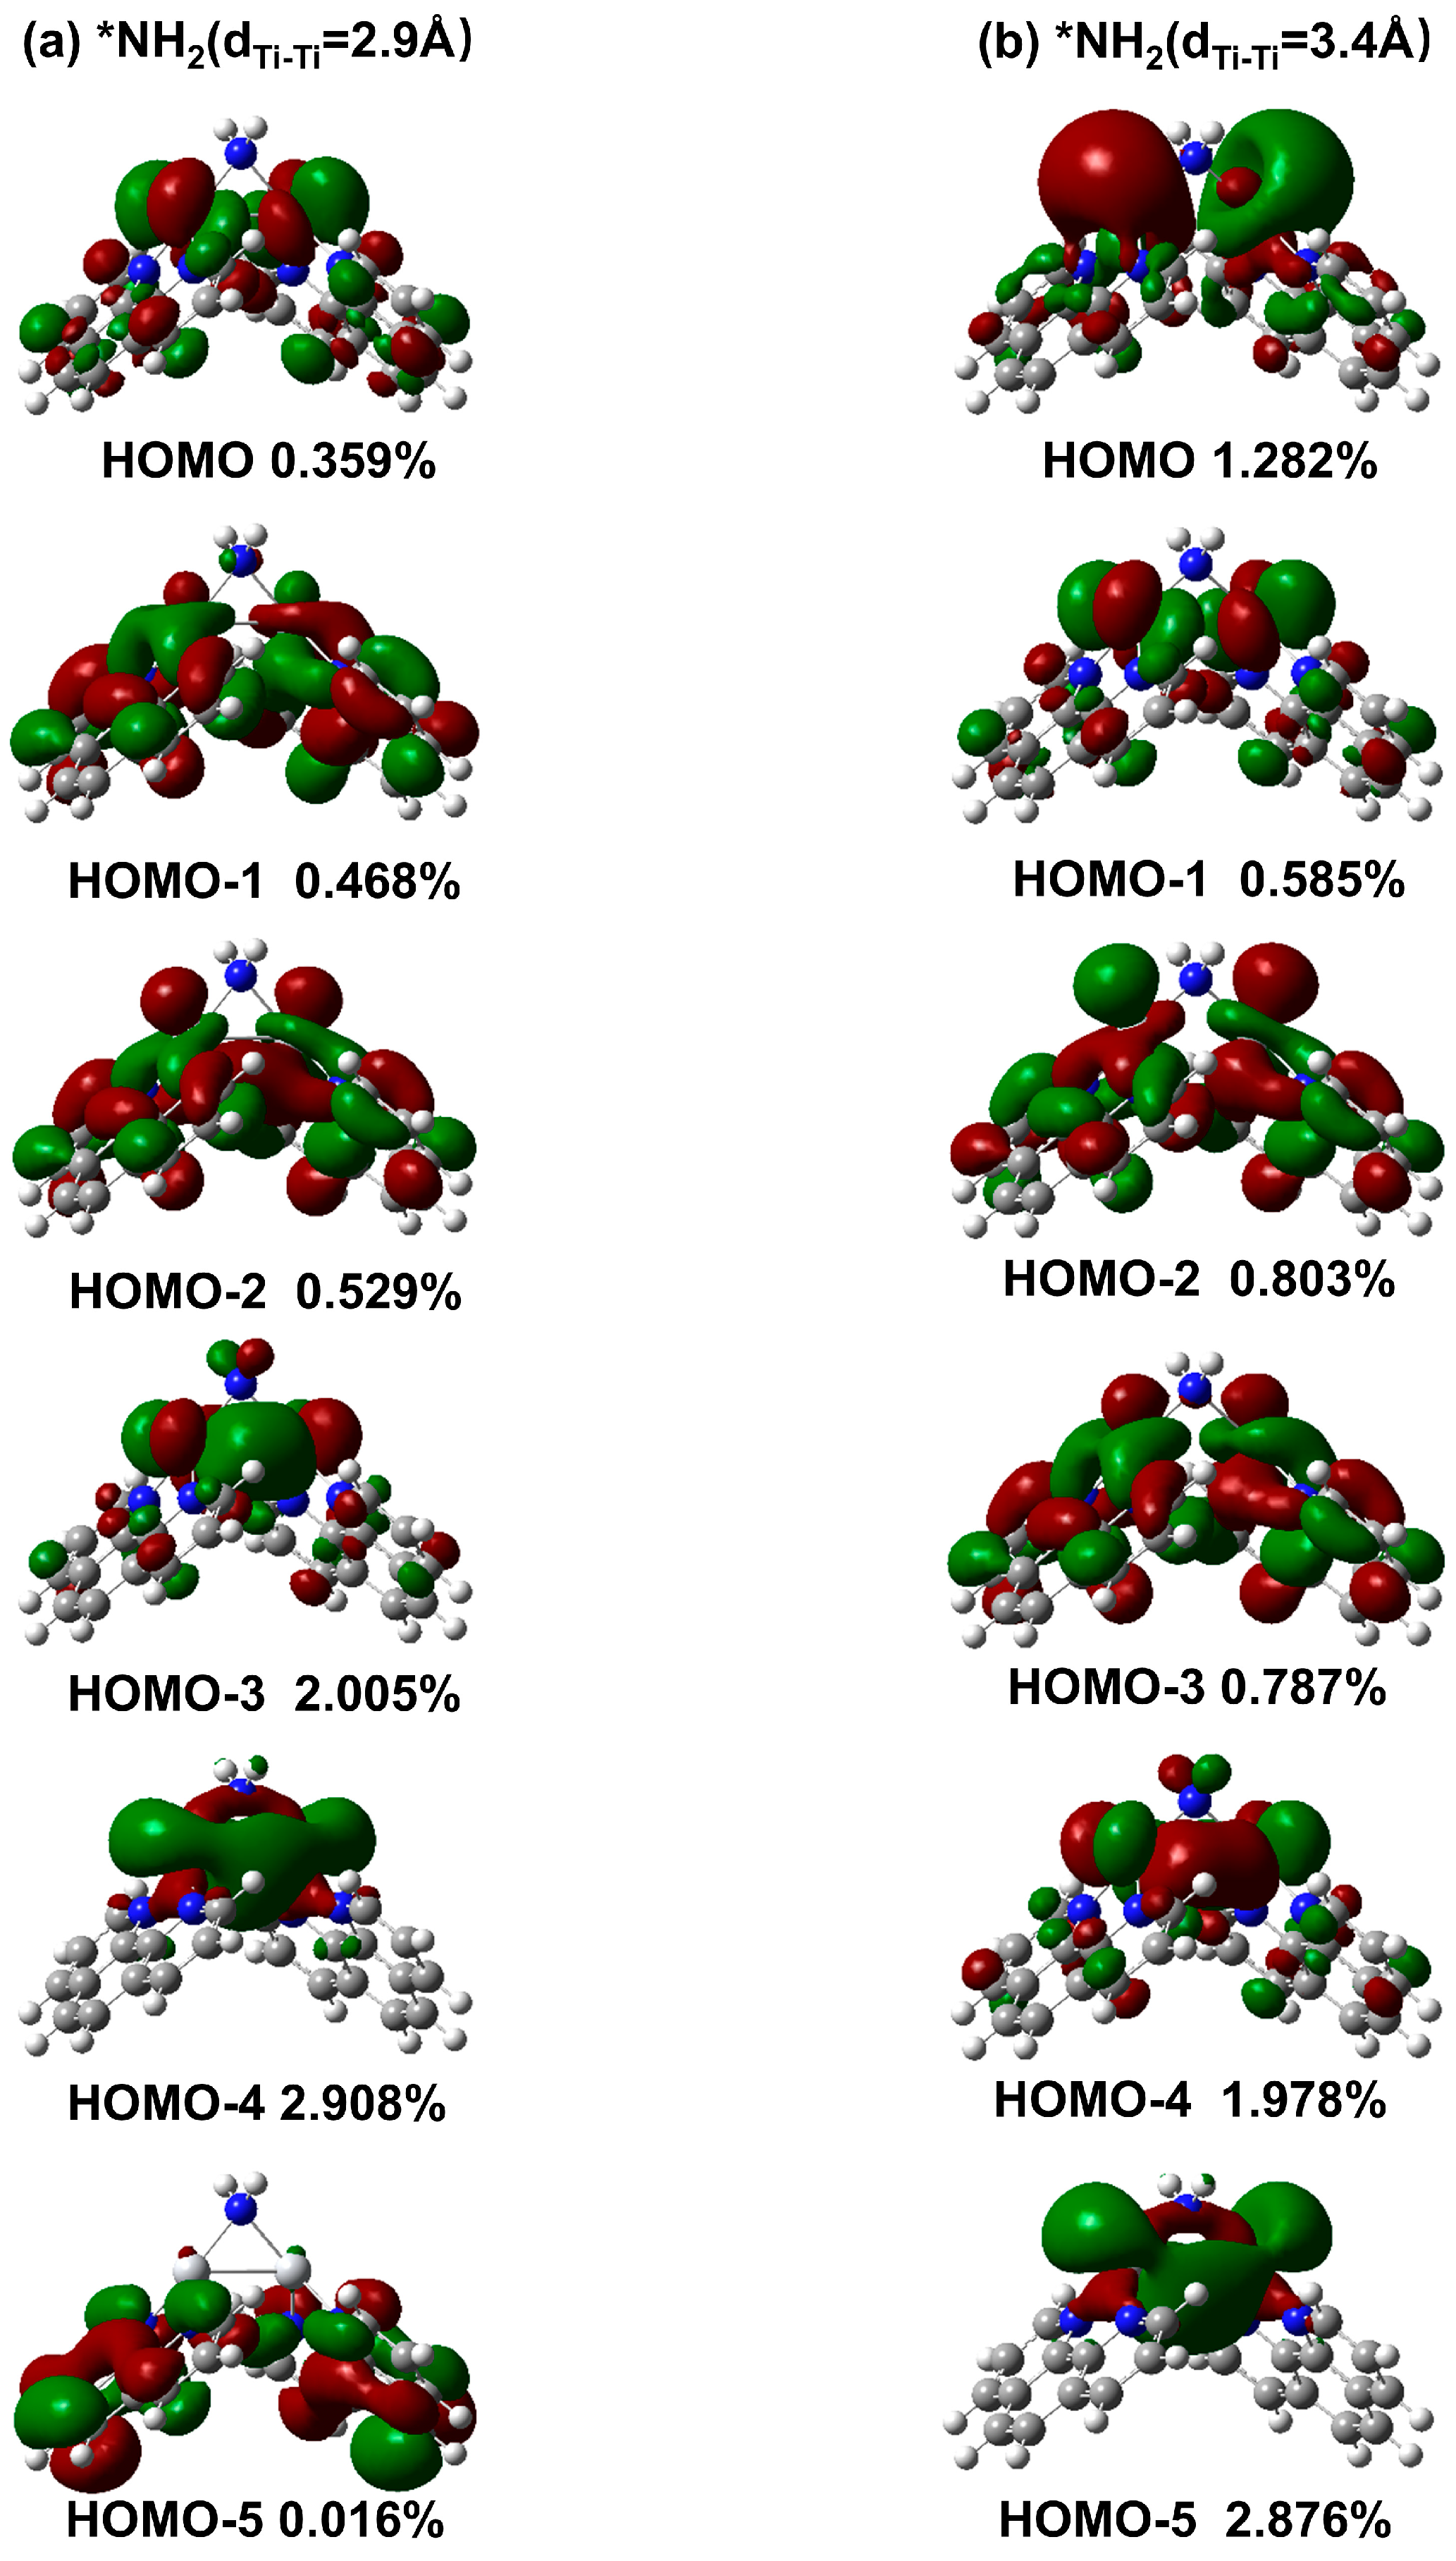
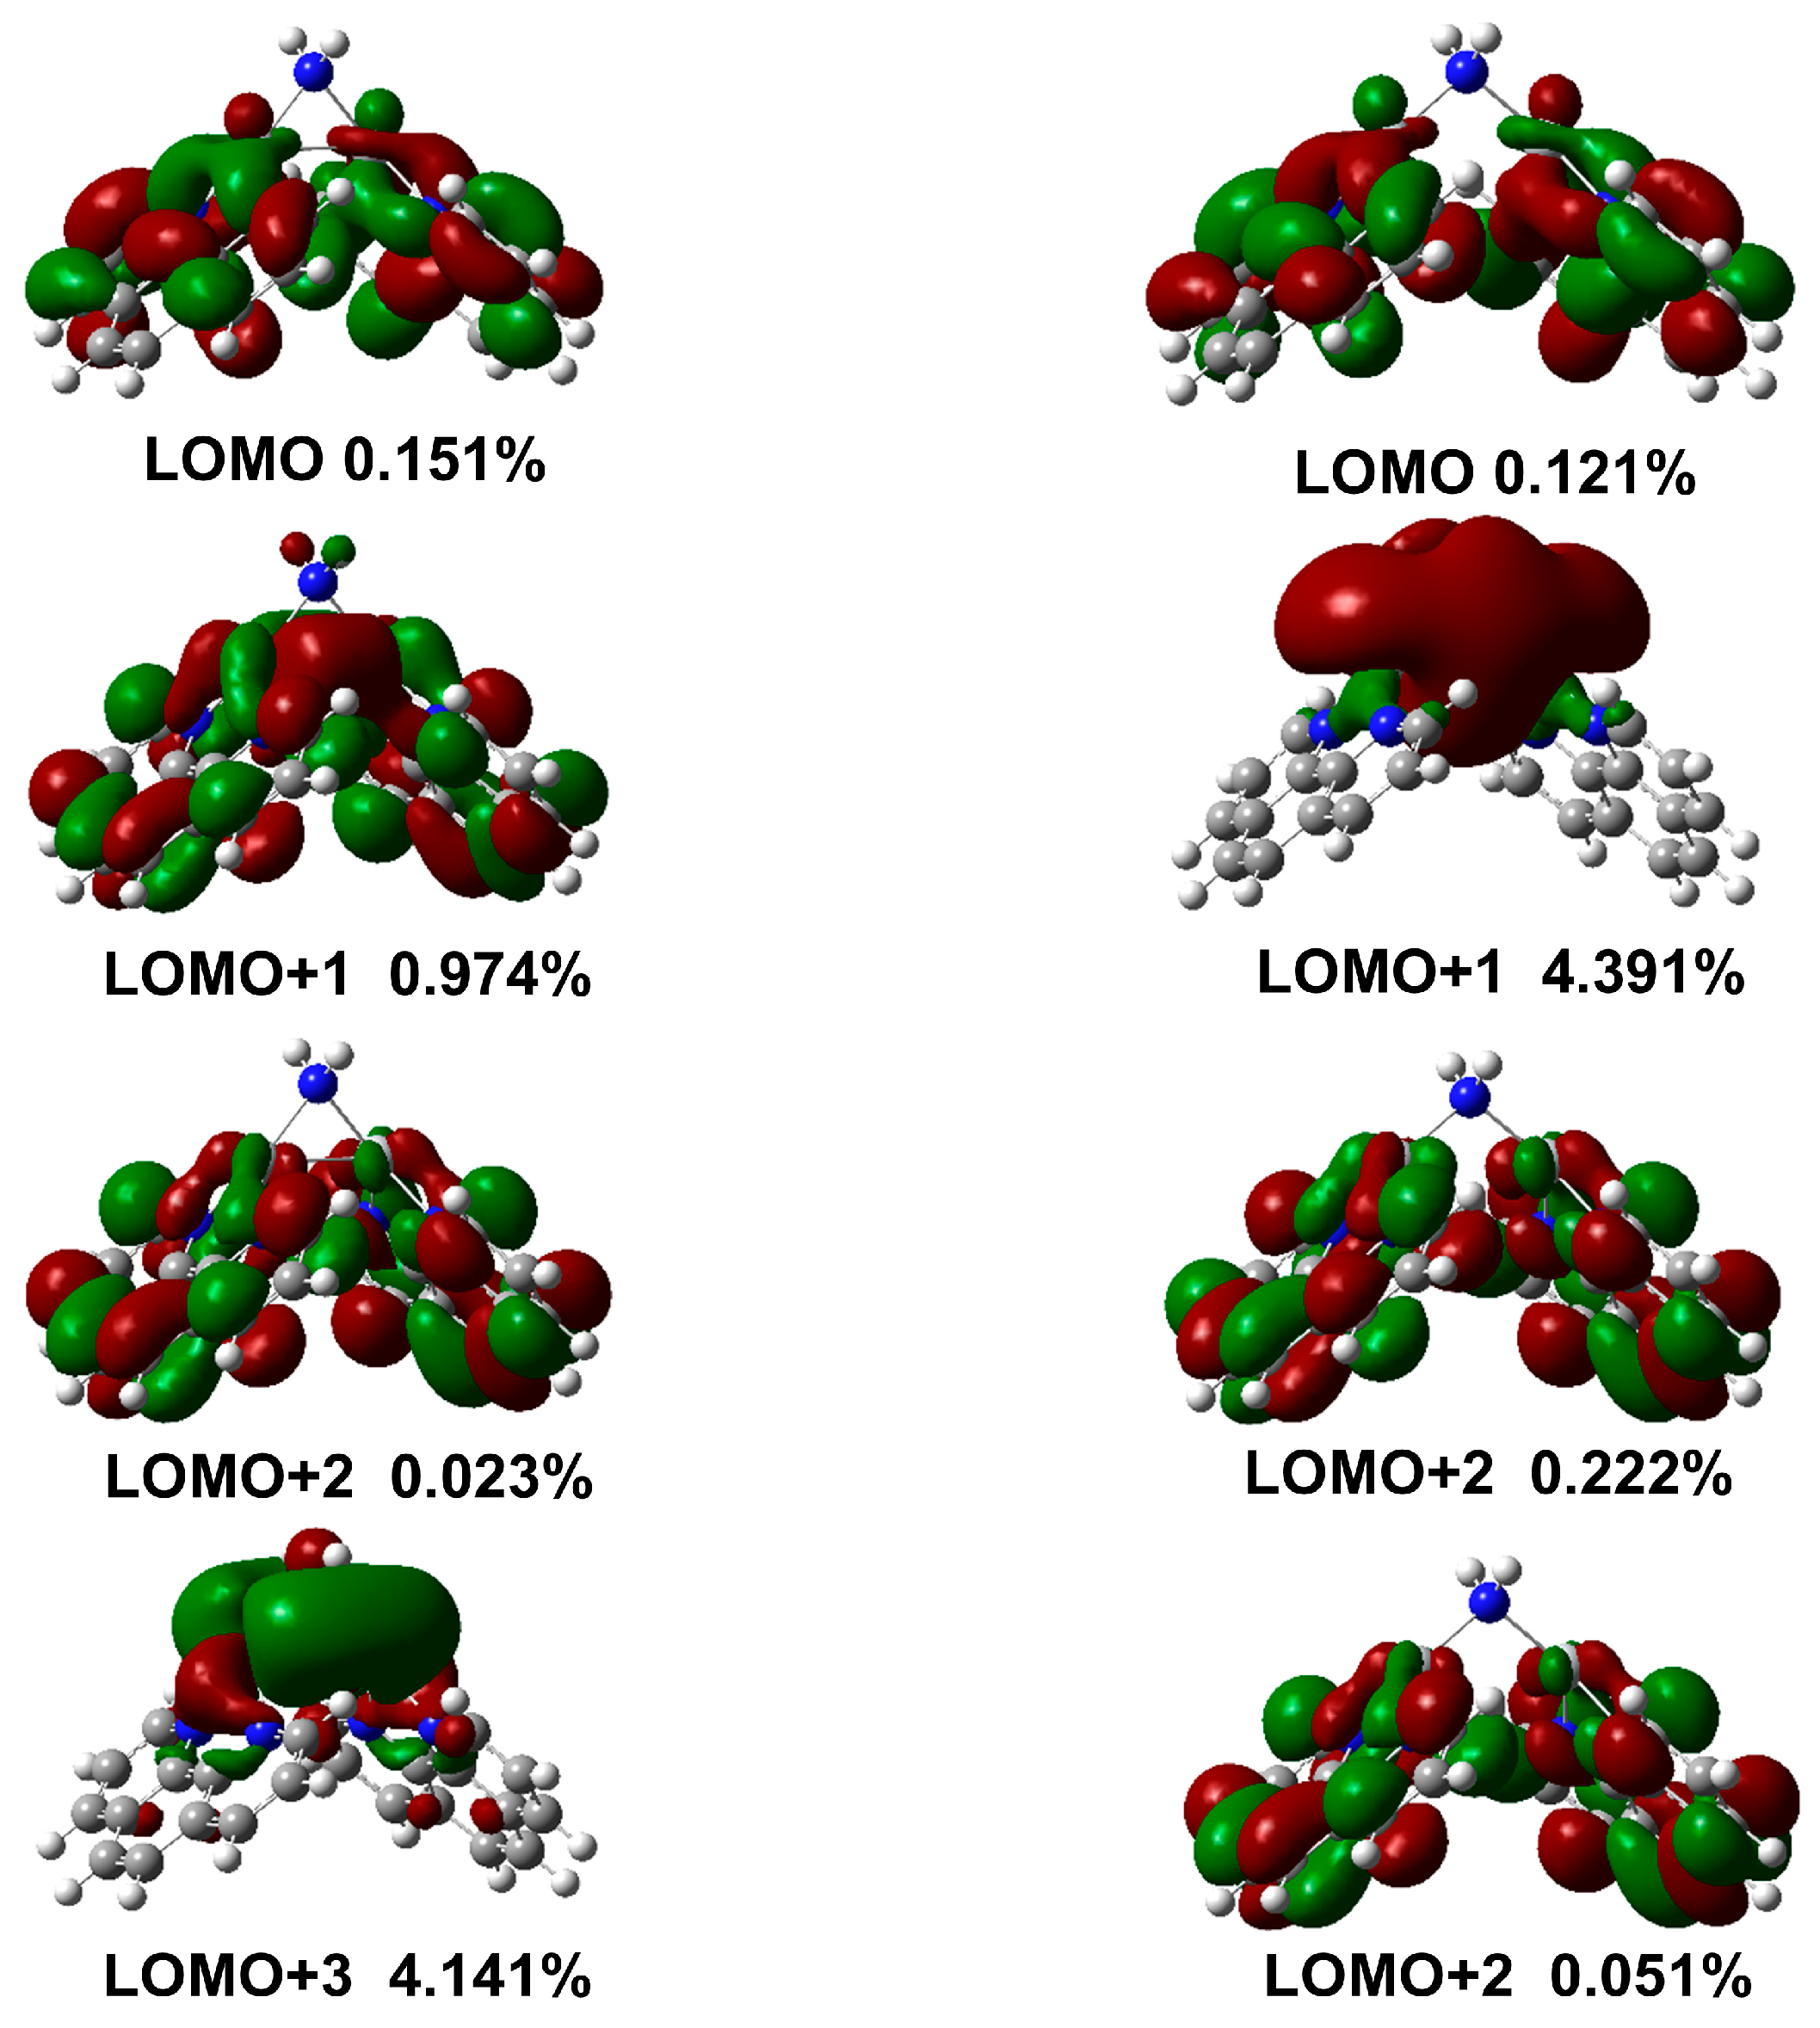
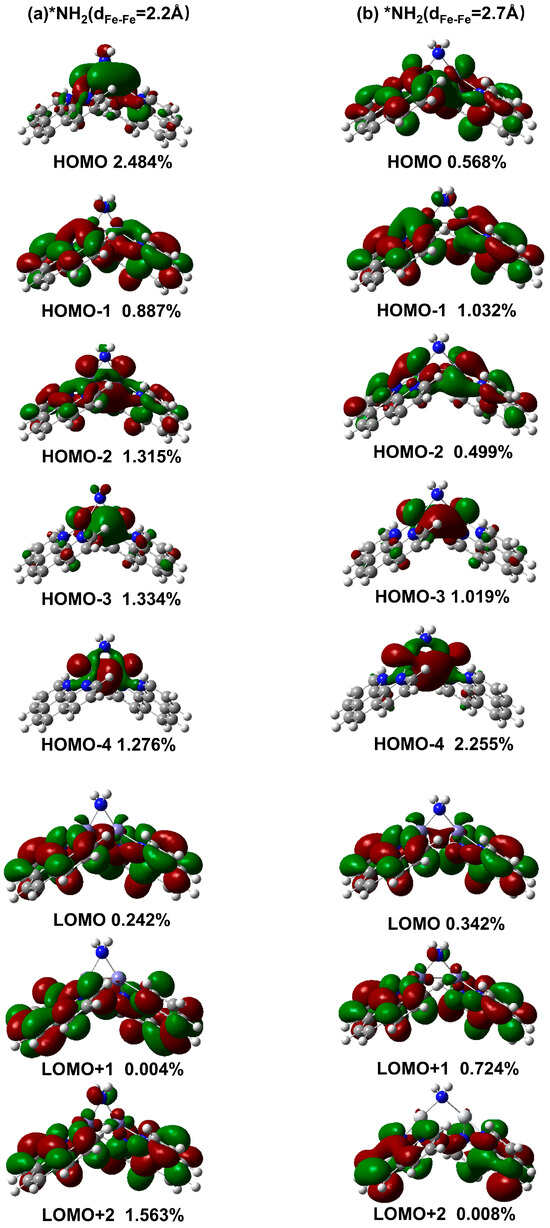
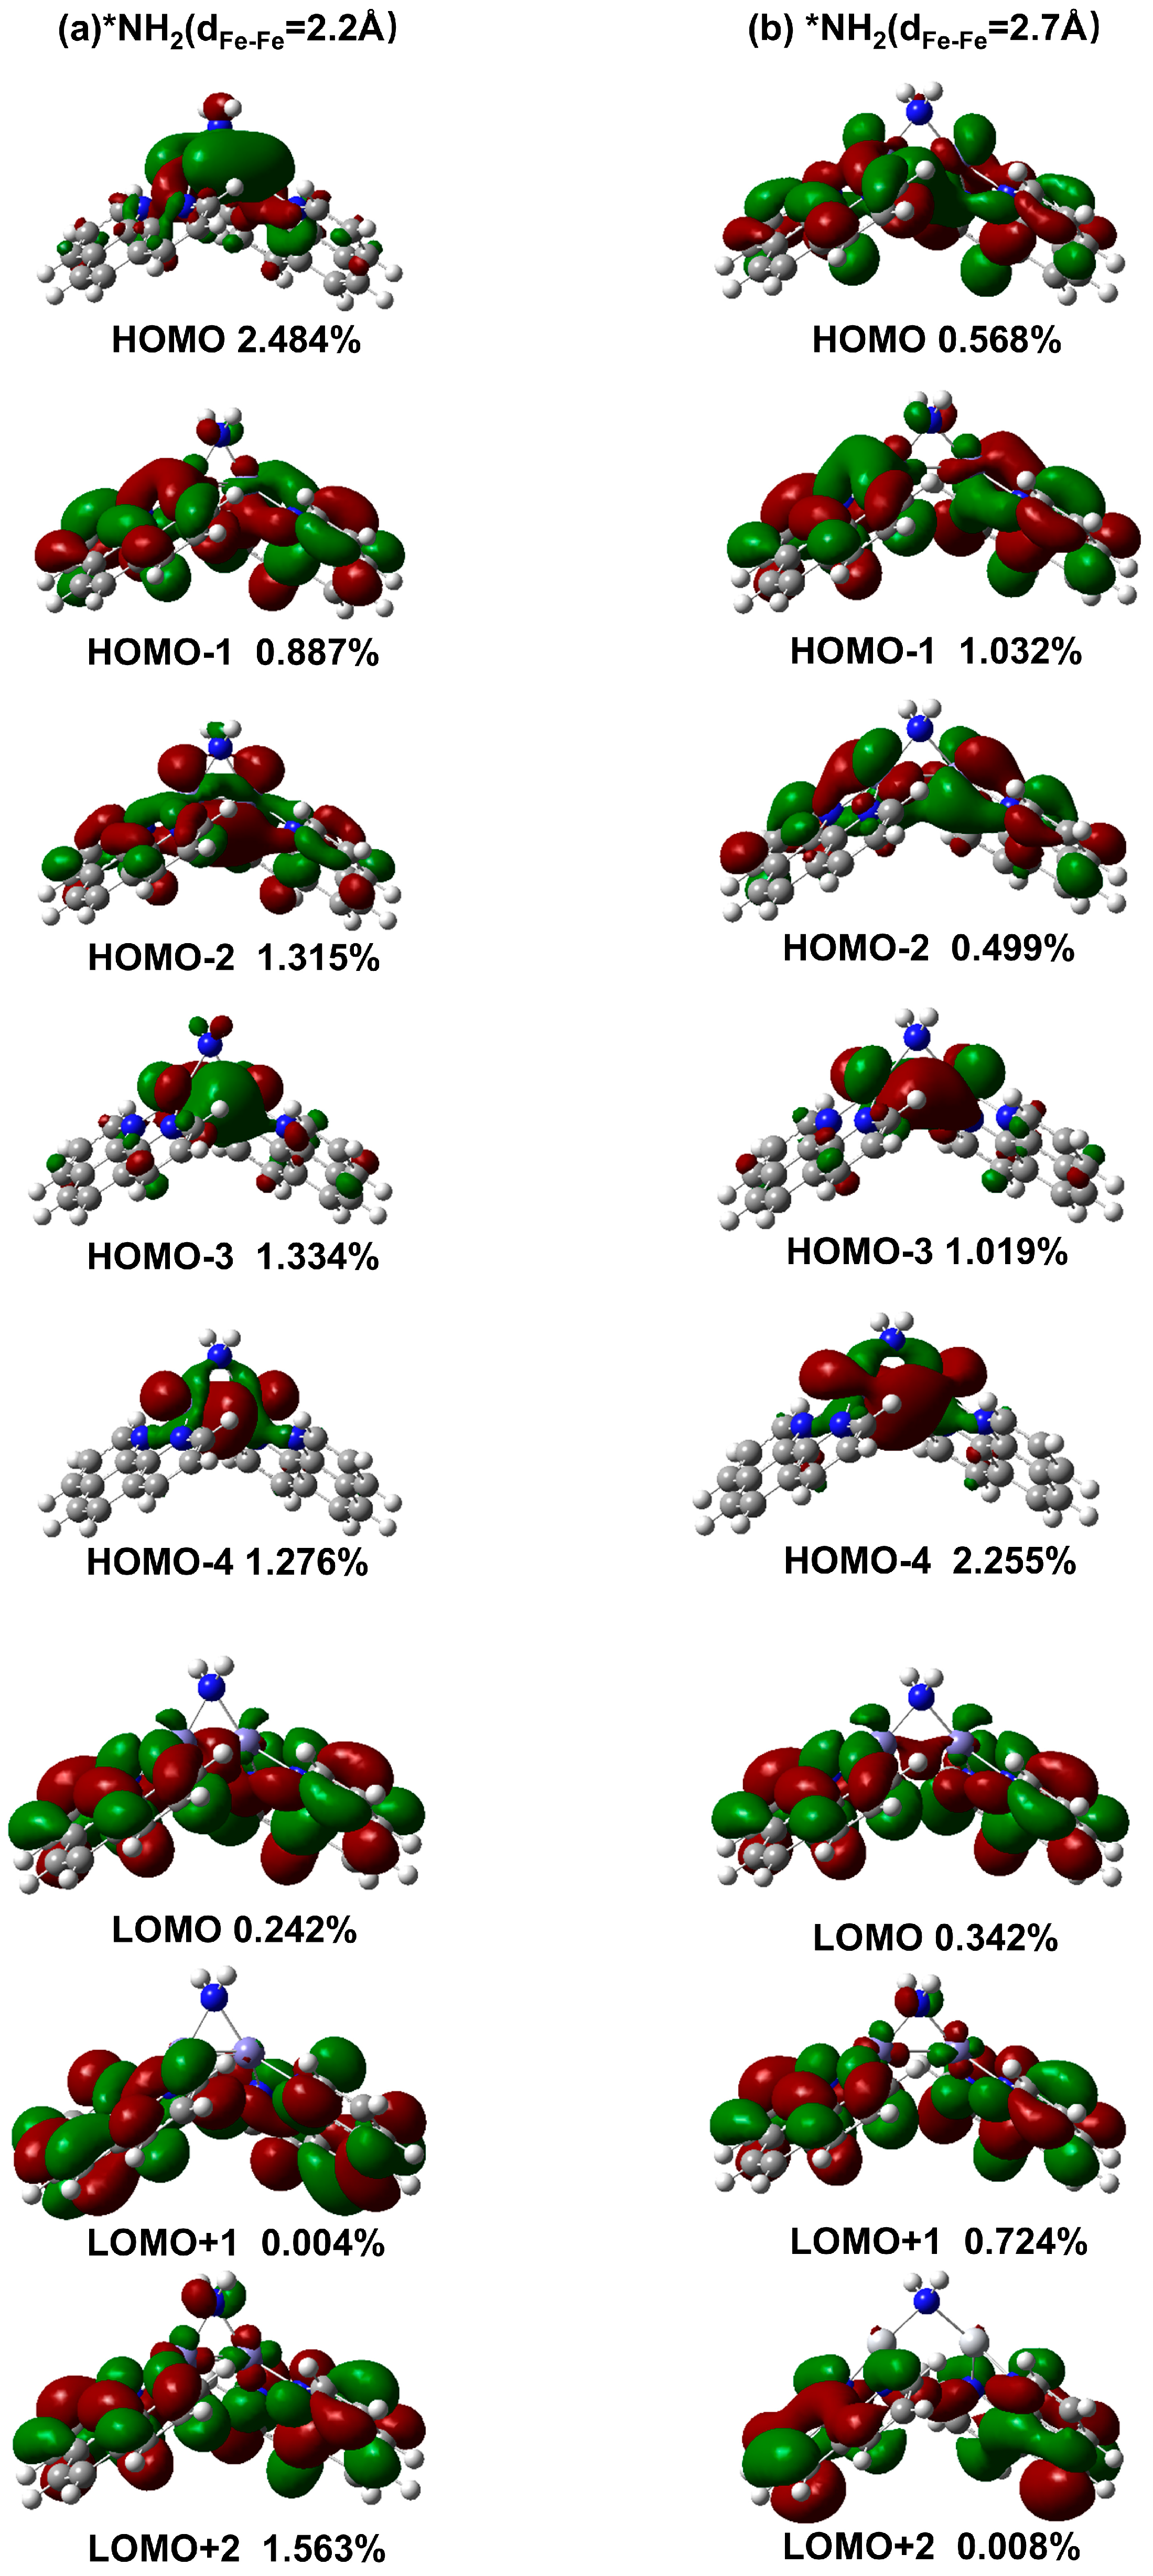

Disclaimer/Publisher’s Note: The statements, opinions and data contained in all publications are solely those of the individual author(s) and contributor(s) and not of MDPI and/or the editor(s). MDPI and/or the editor(s) disclaim responsibility for any injury to people or property resulting from any ideas, methods, instructions or products referred to in the content. |
© 2026 by the authors. Licensee MDPI, Basel, Switzerland. This article is an open access article distributed under the terms and conditions of the Creative Commons Attribution (CC BY) license.